Hayden, ID Map & Demographics
Hayden Map
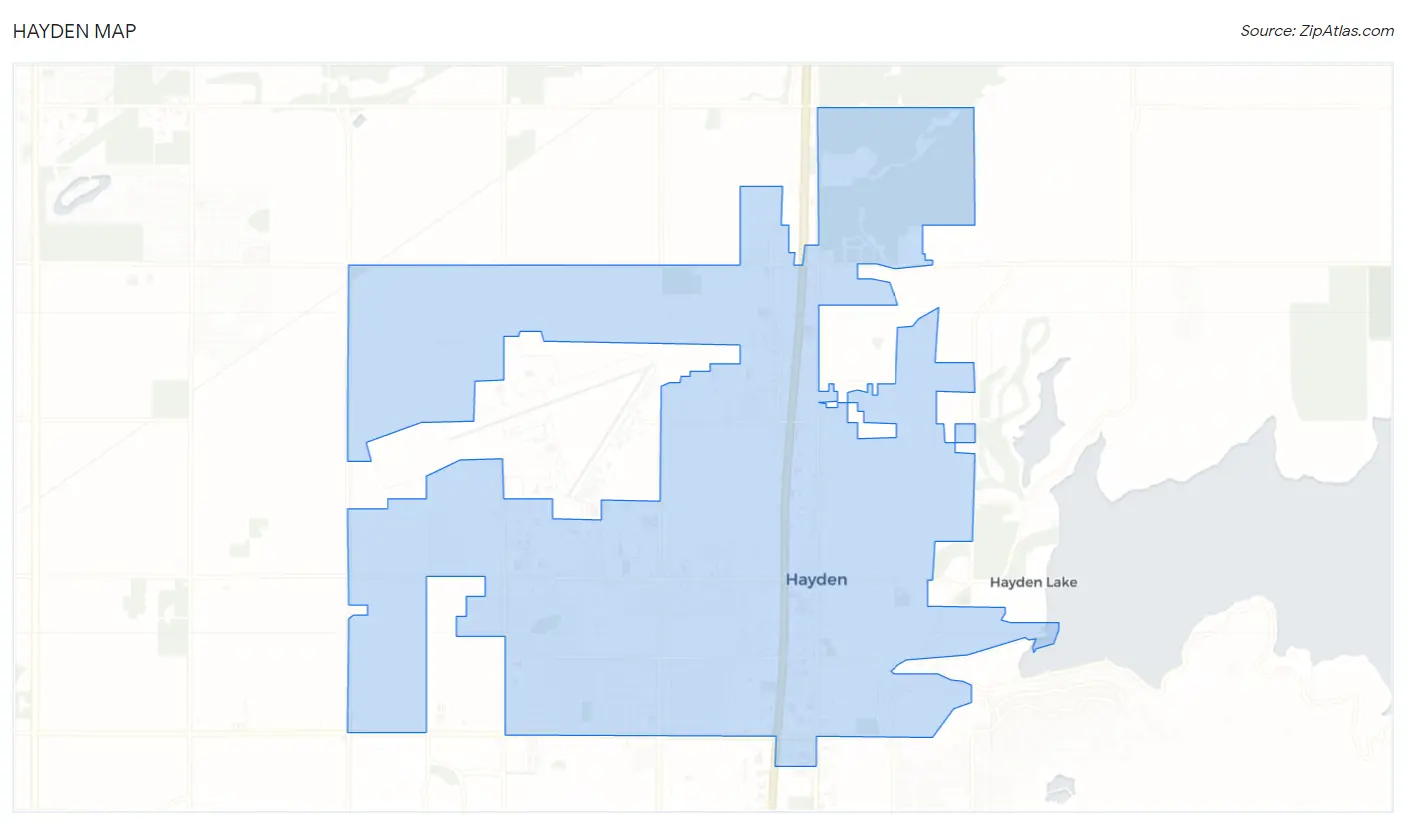
Hayden Overview
$35,646
PER CAPITA INCOME
$86,931
AVG FAMILY INCOME
$72,227
AVG HOUSEHOLD INCOME
43.6%
WAGE / INCOME GAP [ % ]
56.4¢/ $1
WAGE / INCOME GAP [ $ ]
0.39
INEQUALITY / GINI INDEX
15,703
TOTAL POPULATION
7,507
MALE POPULATION
8,196
FEMALE POPULATION
91.59
MALES / 100 FEMALES
109.18
FEMALES / 100 MALES
42.4
MEDIAN AGE
3.0
AVG FAMILY SIZE
2.5
AVG HOUSEHOLD SIZE
7,621
LABOR FORCE [ PEOPLE ]
60.0%
PERCENT IN LABOR FORCE
3.7%
UNEMPLOYMENT RATE
Hayden Zip Codes
Hayden Area Codes
Income in Hayden
Income Overview in Hayden
Per Capita Income in Hayden is $35,646, while median incomes of families and households are $86,931 and $72,227 respectively.
| Characteristic | Number | Measure |
| Per Capita Income | 15,703 | $35,646 |
| Median Family Income | 4,305 | $86,931 |
| Mean Family Income | 4,305 | $103,358 |
| Median Household Income | 6,115 | $72,227 |
| Mean Household Income | 6,115 | $89,563 |
| Income Deficit | 4,305 | $0 |
| Wage / Income Gap (%) | 15,703 | 43.65% |
| Wage / Income Gap ($) | 15,703 | 56.35¢ per $1 |
| Gini / Inequality Index | 15,703 | 0.39 |
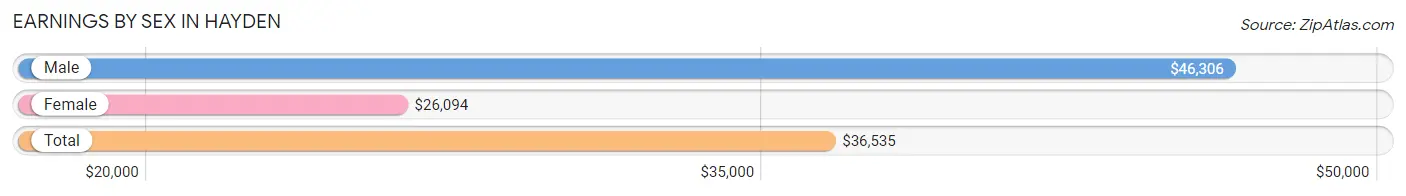
Earnings by Sex in Hayden
Average Earnings in Hayden are $36,535, $46,306 for men and $26,094 for women, a difference of 43.6%.
| Sex | Number | Average Earnings |
| Male | 3,921 (49.9%) | $46,306 |
| Female | 3,942 (50.1%) | $26,094 |
| Total | 7,863 (100.0%) | $36,535 |
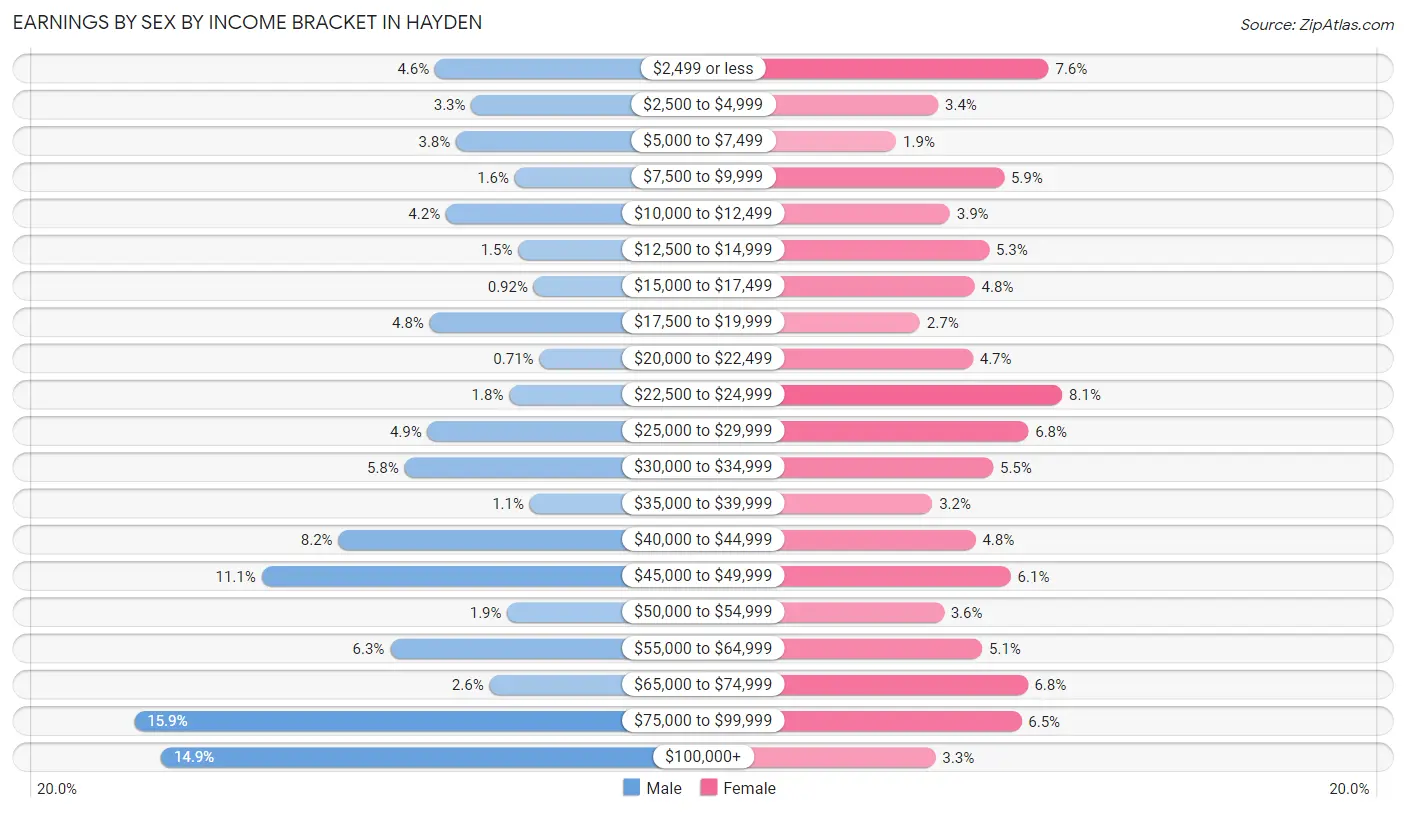
Earnings by Sex by Income Bracket in Hayden
The most common earnings brackets in Hayden are $75,000 to $99,999 for men (623 | 15.9%) and $22,500 to $24,999 for women (318 | 8.1%).
| Income | Male | Female |
| $2,499 or less | 181 (4.6%) | 298 (7.6%) |
| $2,500 to $4,999 | 128 (3.3%) | 135 (3.4%) |
| $5,000 to $7,499 | 150 (3.8%) | 73 (1.8%) |
| $7,500 to $9,999 | 64 (1.6%) | 232 (5.9%) |
| $10,000 to $12,499 | 165 (4.2%) | 152 (3.9%) |
| $12,500 to $14,999 | 59 (1.5%) | 210 (5.3%) |
| $15,000 to $17,499 | 36 (0.9%) | 189 (4.8%) |
| $17,500 to $19,999 | 189 (4.8%) | 108 (2.7%) |
| $20,000 to $22,499 | 28 (0.7%) | 186 (4.7%) |
| $22,500 to $24,999 | 72 (1.8%) | 318 (8.1%) |
| $25,000 to $29,999 | 192 (4.9%) | 268 (6.8%) |
| $30,000 to $34,999 | 226 (5.8%) | 216 (5.5%) |
| $35,000 to $39,999 | 42 (1.1%) | 126 (3.2%) |
| $40,000 to $44,999 | 323 (8.2%) | 190 (4.8%) |
| $45,000 to $49,999 | 436 (11.1%) | 242 (6.1%) |
| $50,000 to $54,999 | 75 (1.9%) | 143 (3.6%) |
| $55,000 to $64,999 | 247 (6.3%) | 200 (5.1%) |
| $65,000 to $74,999 | 101 (2.6%) | 267 (6.8%) |
| $75,000 to $99,999 | 623 (15.9%) | 258 (6.5%) |
| $100,000+ | 584 (14.9%) | 131 (3.3%) |
| Total | 3,921 (100.0%) | 3,942 (100.0%) |
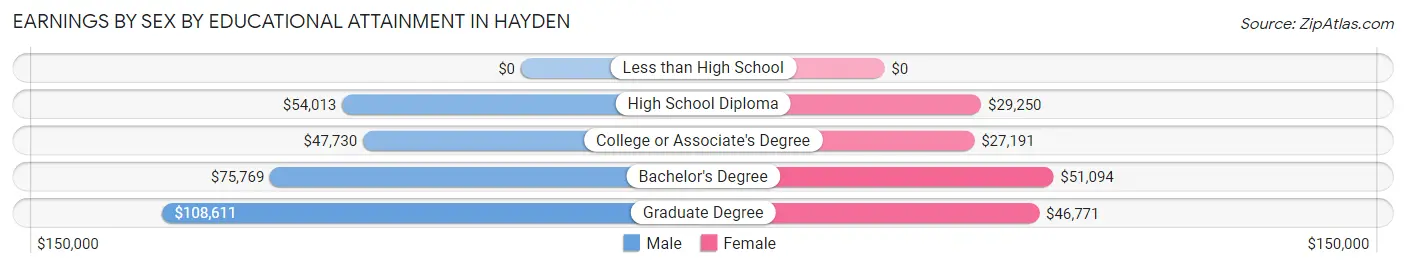
Earnings by Sex by Educational Attainment in Hayden
Average earnings in Hayden are $52,031 for men and $31,910 for women, a difference of 38.7%. Men with an educational attainment of graduate degree enjoy the highest average annual earnings of $108,611, while those with college or associate's degree education earn the least with $47,730. Women with an educational attainment of bachelor's degree earn the most with the average annual earnings of $51,094, while those with college or associate's degree education have the smallest earnings of $27,191.
| Educational Attainment | Male Income | Female Income |
| Less than High School | - | - |
| High School Diploma | $54,013 | $29,250 |
| College or Associate's Degree | $47,730 | $27,191 |
| Bachelor's Degree | $75,769 | $51,094 |
| Graduate Degree | $108,611 | $46,771 |
| Total | $52,031 | $31,910 |
Family Income in Hayden
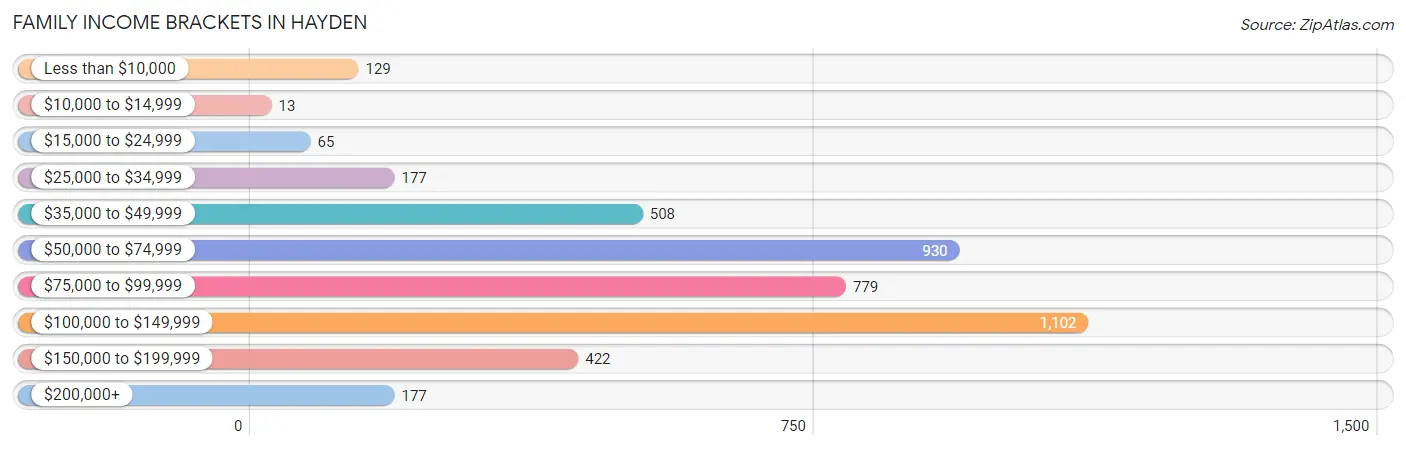
Family Income Brackets in Hayden
According to the Hayden family income data, there are 1,102 families falling into the $100,000 to $149,999 income range, which is the most common income bracket and makes up 25.6% of all families. Conversely, the $10,000 to $14,999 income bracket is the least frequent group with only 13 families (0.3%) belonging to this category.
| Income Bracket | # Families | % Families |
| Less than $10,000 | 129 | 3.0% |
| $10,000 to $14,999 | 13 | 0.3% |
| $15,000 to $24,999 | 65 | 1.5% |
| $25,000 to $34,999 | 177 | 4.1% |
| $35,000 to $49,999 | 508 | 11.8% |
| $50,000 to $74,999 | 930 | 21.6% |
| $75,000 to $99,999 | 779 | 18.1% |
| $100,000 to $149,999 | 1,102 | 25.6% |
| $150,000 to $199,999 | 422 | 9.8% |
| $200,000+ | 177 | 4.1% |
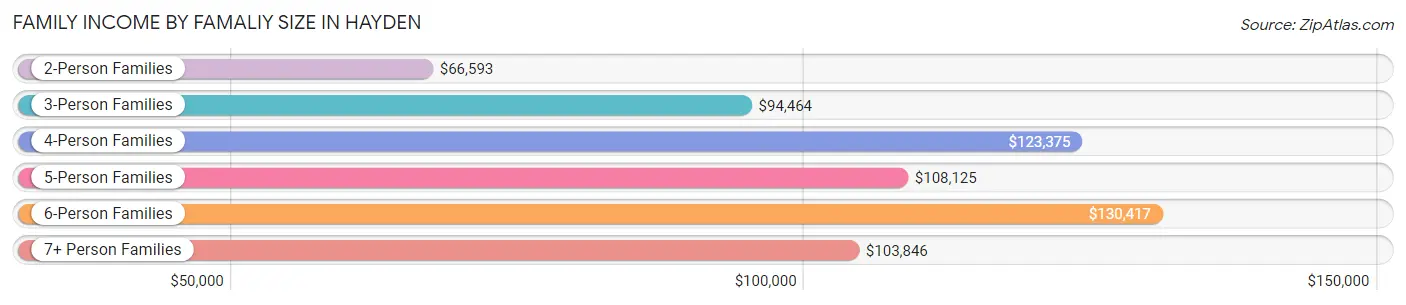
Family Income by Famaliy Size in Hayden
6-person families (269 | 6.2%) account for the highest median family income in Hayden with $130,417 per family, while 2-person families (2,465 | 57.3%) have the highest median income of $33,296 per family member.
| Income Bracket | # Families | Median Income |
| 2-Person Families | 2,465 (57.3%) | $66,593 |
| 3-Person Families | 615 (14.3%) | $94,464 |
| 4-Person Families | 596 (13.8%) | $123,375 |
| 5-Person Families | 312 (7.2%) | $108,125 |
| 6-Person Families | 269 (6.2%) | $130,417 |
| 7+ Person Families | 48 (1.1%) | $103,846 |
| Total | 4,305 (100.0%) | $86,931 |
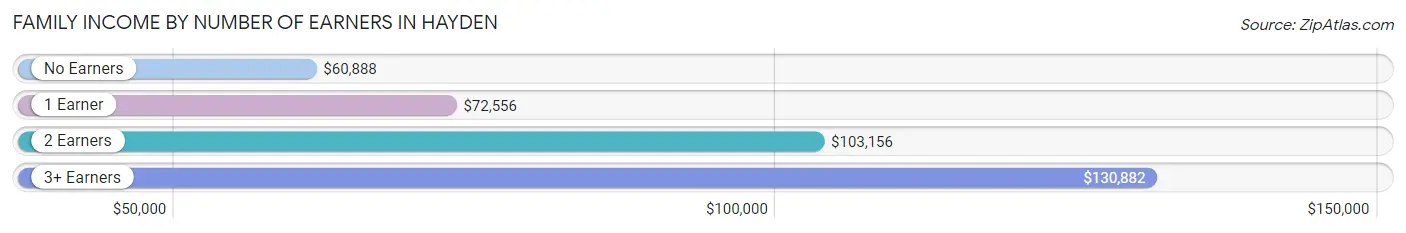
Family Income by Number of Earners in Hayden
The median family income in Hayden is $86,931, with families comprising 3+ earners (412) having the highest median family income of $130,882, while families with no earners (1,028) have the lowest median family income of $60,888, accounting for 9.6% and 23.9% of families, respectively.
| Number of Earners | # Families | Median Income |
| No Earners | 1,028 (23.9%) | $60,888 |
| 1 Earner | 1,072 (24.9%) | $72,556 |
| 2 Earners | 1,793 (41.6%) | $103,156 |
| 3+ Earners | 412 (9.6%) | $130,882 |
| Total | 4,305 (100.0%) | $86,931 |
Household Income in Hayden
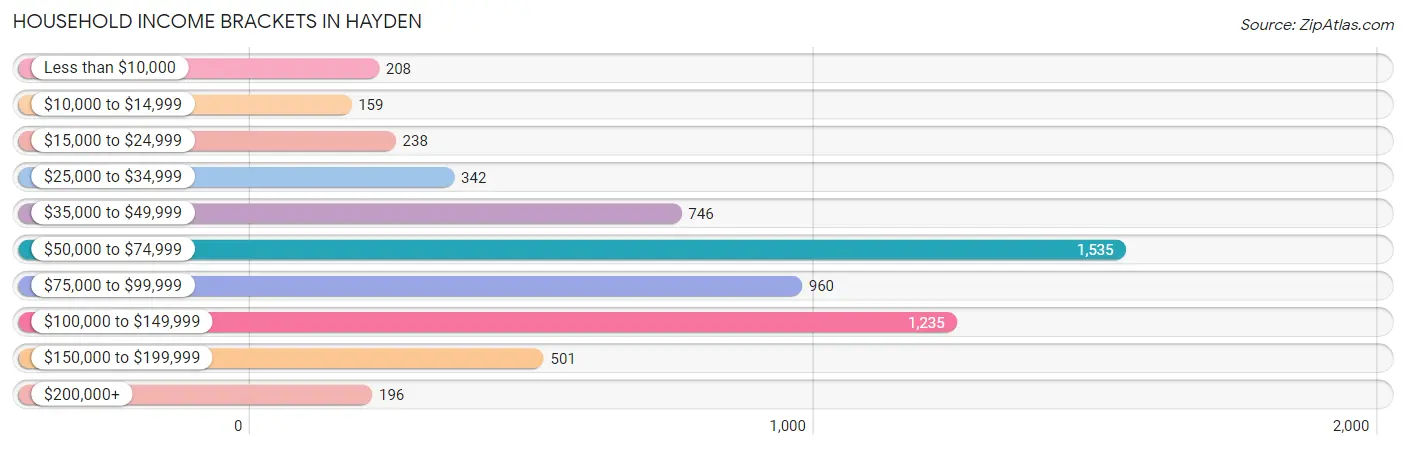
Household Income Brackets in Hayden
With 1,535 households falling in the category, the $50,000 to $74,999 income range is the most frequent in Hayden, accounting for 25.1% of all households. In contrast, only 159 households (2.6%) fall into the $10,000 to $14,999 income bracket, making it the least populous group.
| Income Bracket | # Households | % Households |
| Less than $10,000 | 208 | 3.4% |
| $10,000 to $14,999 | 159 | 2.6% |
| $15,000 to $24,999 | 238 | 3.9% |
| $25,000 to $34,999 | 342 | 5.6% |
| $35,000 to $49,999 | 746 | 12.2% |
| $50,000 to $74,999 | 1,535 | 25.1% |
| $75,000 to $99,999 | 960 | 15.7% |
| $100,000 to $149,999 | 1,235 | 20.2% |
| $150,000 to $199,999 | 501 | 8.2% |
| $200,000+ | 196 | 3.2% |
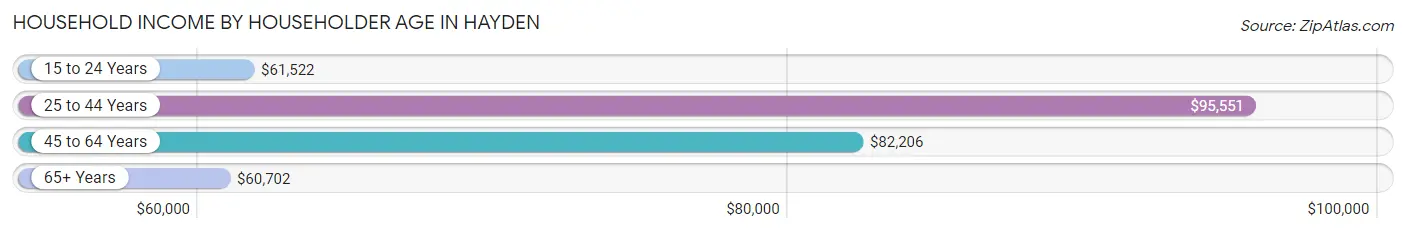
Household Income by Householder Age in Hayden
The median household income in Hayden is $72,227, with the highest median household income of $95,551 found in the 25 to 44 years age bracket for the primary householder. A total of 1,642 households (26.9%) fall into this category. Meanwhile, the 65+ years age bracket for the primary householder has the lowest median household income of $60,702, with 2,318 households (37.9%) in this group.
| Income Bracket | # Households | Median Income |
| 15 to 24 Years | 205 (3.4%) | $61,522 |
| 25 to 44 Years | 1,642 (26.9%) | $95,551 |
| 45 to 64 Years | 1,950 (31.9%) | $82,206 |
| 65+ Years | 2,318 (37.9%) | $60,702 |
| Total | 6,115 (100.0%) | $72,227 |
Poverty in Hayden
Income Below Poverty by Sex and Age in Hayden
With 5.3% poverty level for males and 7.3% for females among the residents of Hayden, 45 to 54 year old males and 18 to 24 year old females are the most vulnerable to poverty, with 104 males (11.6%) and 119 females (18.3%) in their respective age groups living below the poverty level.
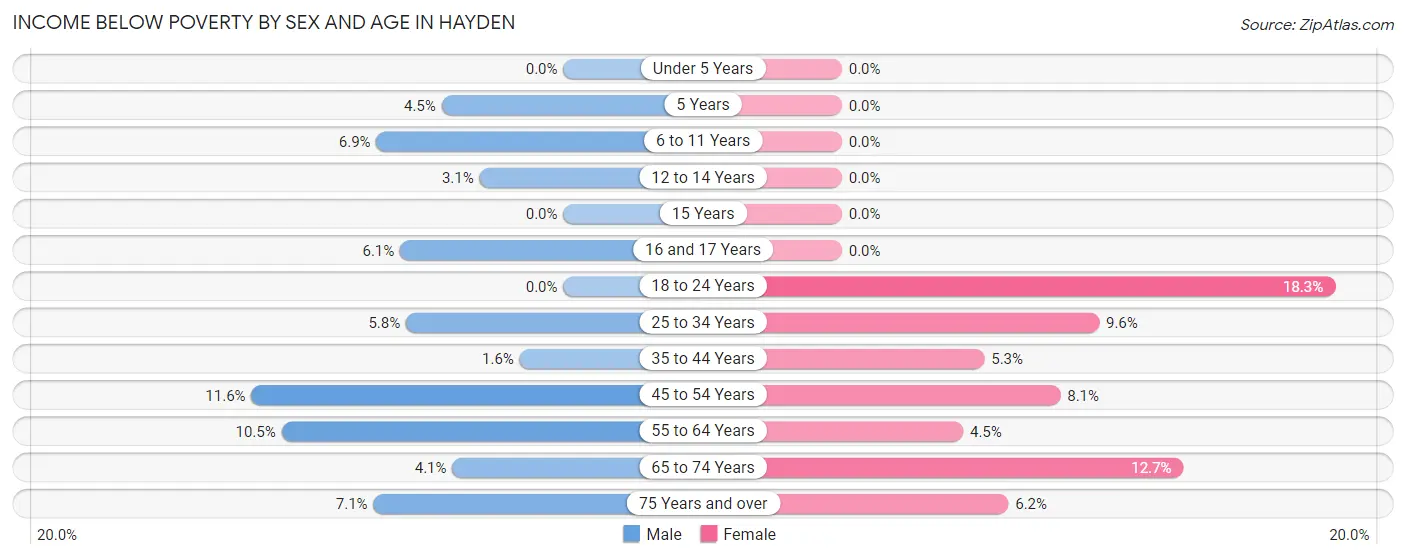
| Age Bracket | Male | Female |
| Under 5 Years | 0 (0.0%) | 0 (0.0%) |
| 5 Years | 10 (4.5%) | 0 (0.0%) |
| 6 to 11 Years | 40 (6.9%) | 0 (0.0%) |
| 12 to 14 Years | 10 (3.1%) | 0 (0.0%) |
| 15 Years | 0 (0.0%) | 0 (0.0%) |
| 16 and 17 Years | 14 (6.1%) | 0 (0.0%) |
| 18 to 24 Years | 0 (0.0%) | 119 (18.3%) |
| 25 to 34 Years | 38 (5.8%) | 93 (9.6%) |
| 35 to 44 Years | 16 (1.6%) | 51 (5.3%) |
| 45 to 54 Years | 104 (11.6%) | 71 (8.1%) |
| 55 to 64 Years | 77 (10.5%) | 48 (4.5%) |
| 65 to 74 Years | 39 (4.1%) | 155 (12.7%) |
| 75 Years and over | 45 (7.0%) | 54 (6.2%) |
| Total | 393 (5.3%) | 591 (7.3%) |
Income Above Poverty by Sex and Age in Hayden
According to the poverty statistics in Hayden, males aged under 5 years and females aged under 5 years are the age groups that are most secure financially, with 100.0% of males and 100.0% of females in these age groups living above the poverty line.
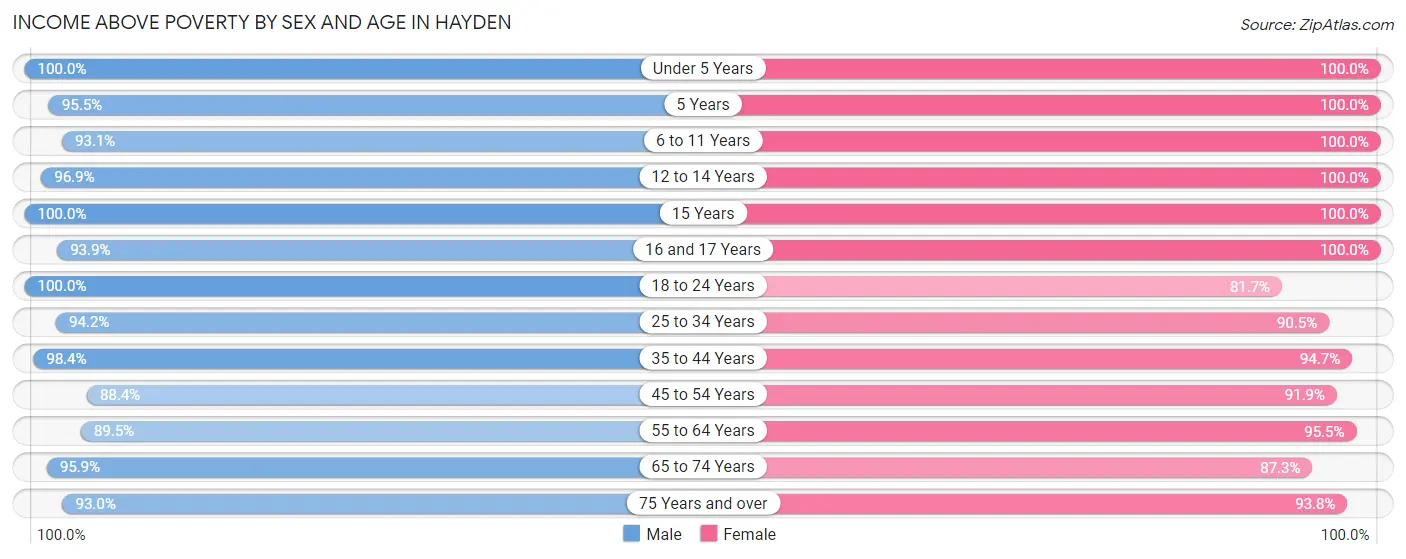
| Age Bracket | Male | Female |
| Under 5 Years | 477 (100.0%) | 405 (100.0%) |
| 5 Years | 211 (95.5%) | 104 (100.0%) |
| 6 to 11 Years | 536 (93.1%) | 496 (100.0%) |
| 12 to 14 Years | 312 (96.9%) | 283 (100.0%) |
| 15 Years | 59 (100.0%) | 51 (100.0%) |
| 16 and 17 Years | 217 (93.9%) | 172 (100.0%) |
| 18 to 24 Years | 718 (100.0%) | 531 (81.7%) |
| 25 to 34 Years | 613 (94.2%) | 881 (90.4%) |
| 35 to 44 Years | 973 (98.4%) | 913 (94.7%) |
| 45 to 54 Years | 794 (88.4%) | 805 (91.9%) |
| 55 to 64 Years | 659 (89.5%) | 1,018 (95.5%) |
| 65 to 74 Years | 907 (95.9%) | 1,067 (87.3%) |
| 75 Years and over | 593 (92.9%) | 820 (93.8%) |
| Total | 7,069 (94.7%) | 7,546 (92.7%) |
Income Below Poverty Among Married-Couple Families in Hayden
The poverty statistics for married-couple families in Hayden show that 2.7% or 96 of the total 3,604 families live below the poverty line. Families with 1 or 2 children have the highest poverty rate of 4.1%, comprising of 46 families. On the other hand, families with 3 or 4 children have the lowest poverty rate of 0.0%, which includes 0 families.
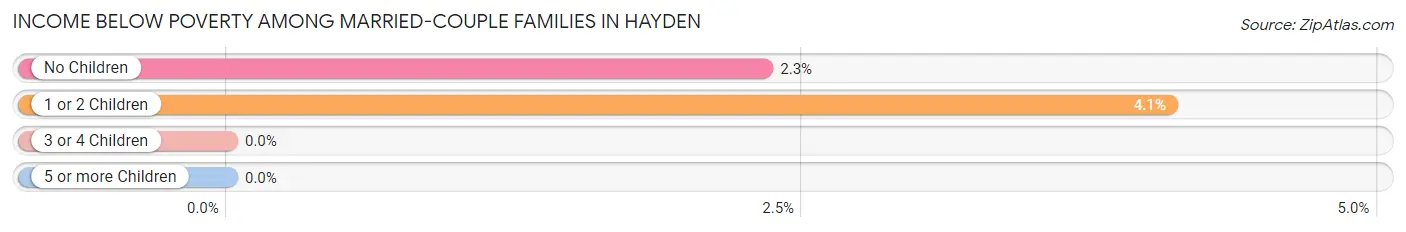
| Children | Above Poverty | Below Poverty |
| No Children | 2,099 (97.7%) | 50 (2.3%) |
| 1 or 2 Children | 1,079 (95.9%) | 46 (4.1%) |
| 3 or 4 Children | 312 (100.0%) | 0 (0.0%) |
| 5 or more Children | 18 (100.0%) | 0 (0.0%) |
| Total | 3,508 (97.3%) | 96 (2.7%) |
Income Below Poverty Among Single-Parent Households in Hayden
According to the poverty data in Hayden, 18.1% or 56 single-father households and 3.8% or 15 single-mother households are living below the poverty line. Among single-father households, those with no children have the highest poverty rate, with 56 households (73.7%) experiencing poverty. Likewise, among single-mother households, those with 1 or 2 children have the highest poverty rate, with 15 households (9.7%) falling below the poverty line.
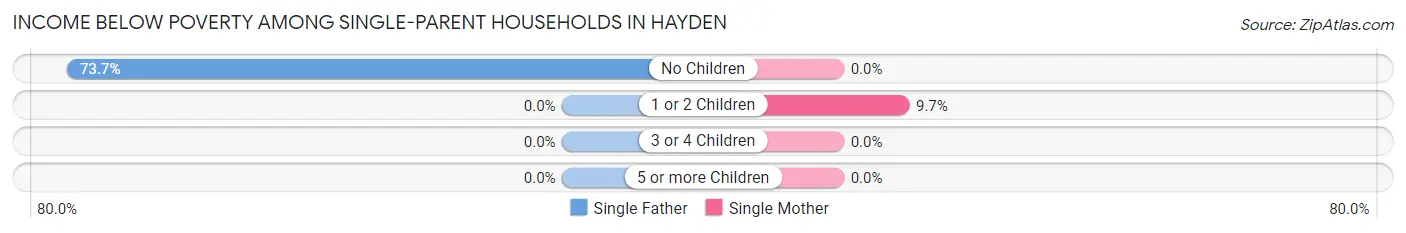
| Children | Single Father | Single Mother |
| No Children | 56 (73.7%) | 0 (0.0%) |
| 1 or 2 Children | 0 (0.0%) | 15 (9.7%) |
| 3 or 4 Children | 0 (0.0%) | 0 (0.0%) |
| 5 or more Children | 0 (0.0%) | 0 (0.0%) |
| Total | 56 (18.1%) | 15 (3.8%) |
Income Below Poverty Among Married-Couple vs Single-Parent Households in Hayden
The poverty data for Hayden shows that 96 of the married-couple family households (2.7%) and 71 of the single-parent households (10.1%) are living below the poverty level. Within the married-couple family households, those with 1 or 2 children have the highest poverty rate, with 46 households (4.1%) falling below the poverty line. Among the single-parent households, those with no children have the highest poverty rate, with 56 household (20.5%) living below poverty.
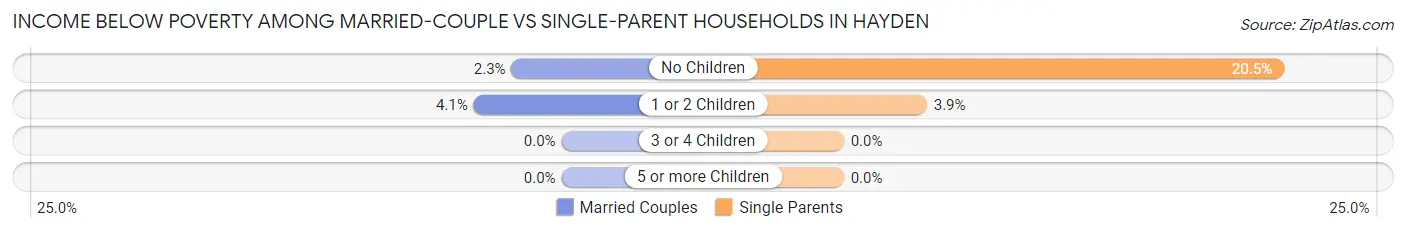
| Children | Married-Couple Families | Single-Parent Households |
| No Children | 50 (2.3%) | 56 (20.5%) |
| 1 or 2 Children | 46 (4.1%) | 15 (3.9%) |
| 3 or 4 Children | 0 (0.0%) | 0 (0.0%) |
| 5 or more Children | 0 (0.0%) | 0 (0.0%) |
| Total | 96 (2.7%) | 71 (10.1%) |
Race in Hayden
The most populous races in Hayden are White / Caucasian (14,696 | 93.6%), Two or more Races (805 | 5.1%), and Hispanic or Latino (608 | 3.9%).
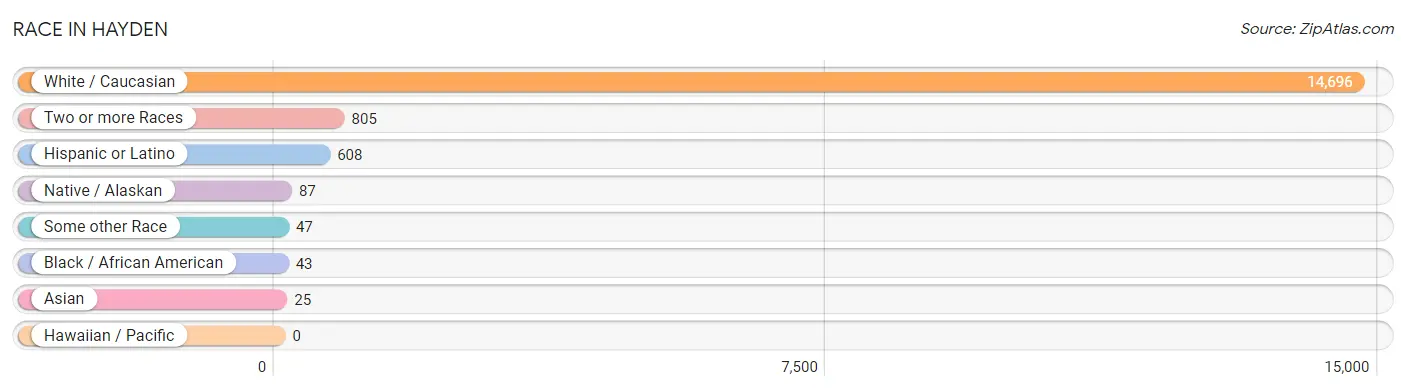
| Race | # Population | % Population |
| Asian | 25 | 0.2% |
| Black / African American | 43 | 0.3% |
| Hawaiian / Pacific | 0 | 0.0% |
| Hispanic or Latino | 608 | 3.9% |
| Native / Alaskan | 87 | 0.5% |
| White / Caucasian | 14,696 | 93.6% |
| Two or more Races | 805 | 5.1% |
| Some other Race | 47 | 0.3% |
| Total | 15,703 | 100.0% |
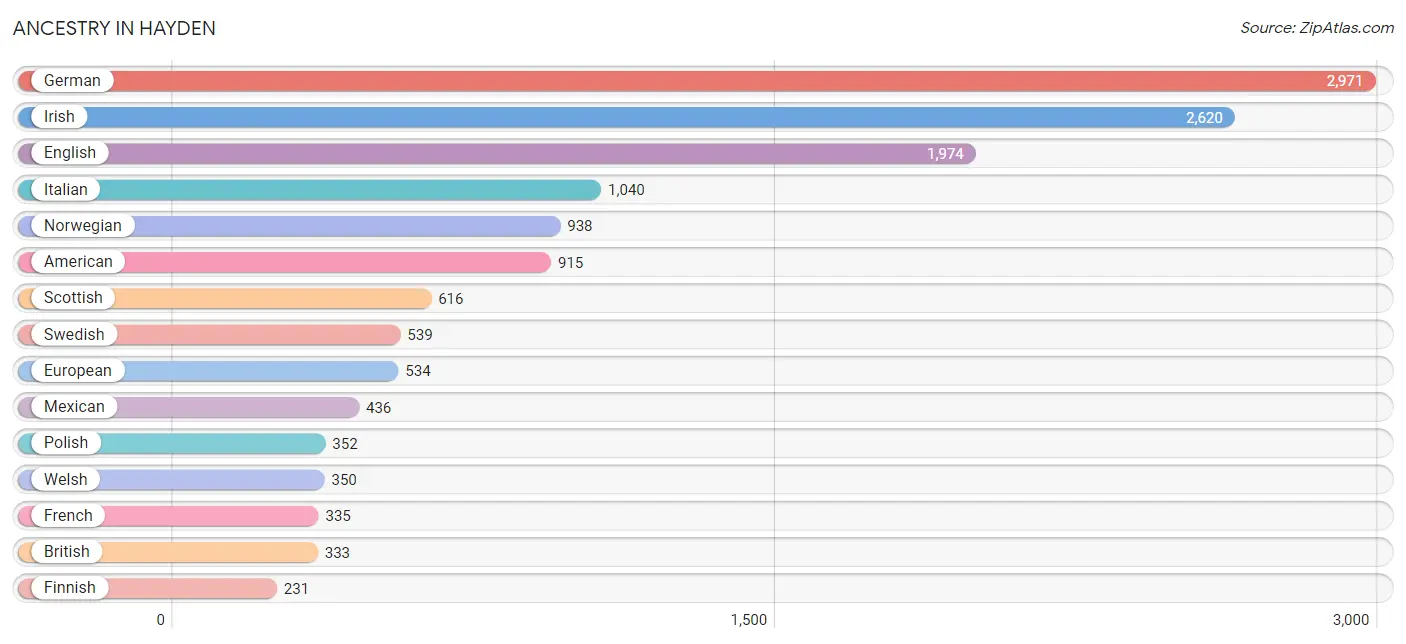
Ancestry in Hayden
The most populous ancestries reported in Hayden are German (2,971 | 18.9%), Irish (2,620 | 16.7%), English (1,974 | 12.6%), Italian (1,040 | 6.6%), and Norwegian (938 | 6.0%), together accounting for 60.8% of all Hayden residents.
| Ancestry | # Population | % Population |
| African | 8 | 0.1% |
| Aleut | 39 | 0.3% |
| American | 915 | 5.8% |
| Apache | 114 | 0.7% |
| Basque | 66 | 0.4% |
| Belgian | 7 | 0.0% |
| Bhutanese | 21 | 0.1% |
| British | 333 | 2.1% |
| Canadian | 83 | 0.5% |
| Central American | 46 | 0.3% |
| Cherokee | 106 | 0.7% |
| Choctaw | 62 | 0.4% |
| Croatian | 22 | 0.1% |
| Czech | 35 | 0.2% |
| Czechoslovakian | 8 | 0.1% |
| Danish | 92 | 0.6% |
| Dutch | 143 | 0.9% |
| Eastern European | 18 | 0.1% |
| English | 1,974 | 12.6% |
| European | 534 | 3.4% |
| Finnish | 231 | 1.5% |
| French | 335 | 2.1% |
| French Canadian | 91 | 0.6% |
| German | 2,971 | 18.9% |
| Greek | 127 | 0.8% |
| Honduran | 46 | 0.3% |
| Hungarian | 18 | 0.1% |
| Indian (Asian) | 9 | 0.1% |
| Iranian | 23 | 0.2% |
| Irish | 2,620 | 16.7% |
| Italian | 1,040 | 6.6% |
| Korean | 40 | 0.3% |
| Mexican | 436 | 2.8% |
| Native Hawaiian | 34 | 0.2% |
| Nigerian | 31 | 0.2% |
| Northern European | 27 | 0.2% |
| Norwegian | 938 | 6.0% |
| Pennsylvania German | 20 | 0.1% |
| Polish | 352 | 2.2% |
| Portuguese | 6 | 0.0% |
| Puerto Rican | 13 | 0.1% |
| Romanian | 101 | 0.6% |
| Russian | 152 | 1.0% |
| Scandinavian | 102 | 0.6% |
| Scotch-Irish | 168 | 1.1% |
| Scottish | 616 | 3.9% |
| Slavic | 9 | 0.1% |
| Slovak | 11 | 0.1% |
| Slovene | 12 | 0.1% |
| Spaniard | 17 | 0.1% |
| Spanish | 96 | 0.6% |
| Sri Lankan | 16 | 0.1% |
| Subsaharan African | 39 | 0.3% |
| Swedish | 539 | 3.4% |
| Swiss | 110 | 0.7% |
| Tsimshian | 24 | 0.2% |
| Welsh | 350 | 2.2% | View All 57 Rows |
Immigrants in Hayden
The most numerous immigrant groups reported in Hayden came from Canada (133 | 0.9%), Europe (126 | 0.8%), Northern Europe (89 | 0.6%), Central America (65 | 0.4%), and Latin America (65 | 0.4%), together accounting for 3.0% of all Hayden residents.
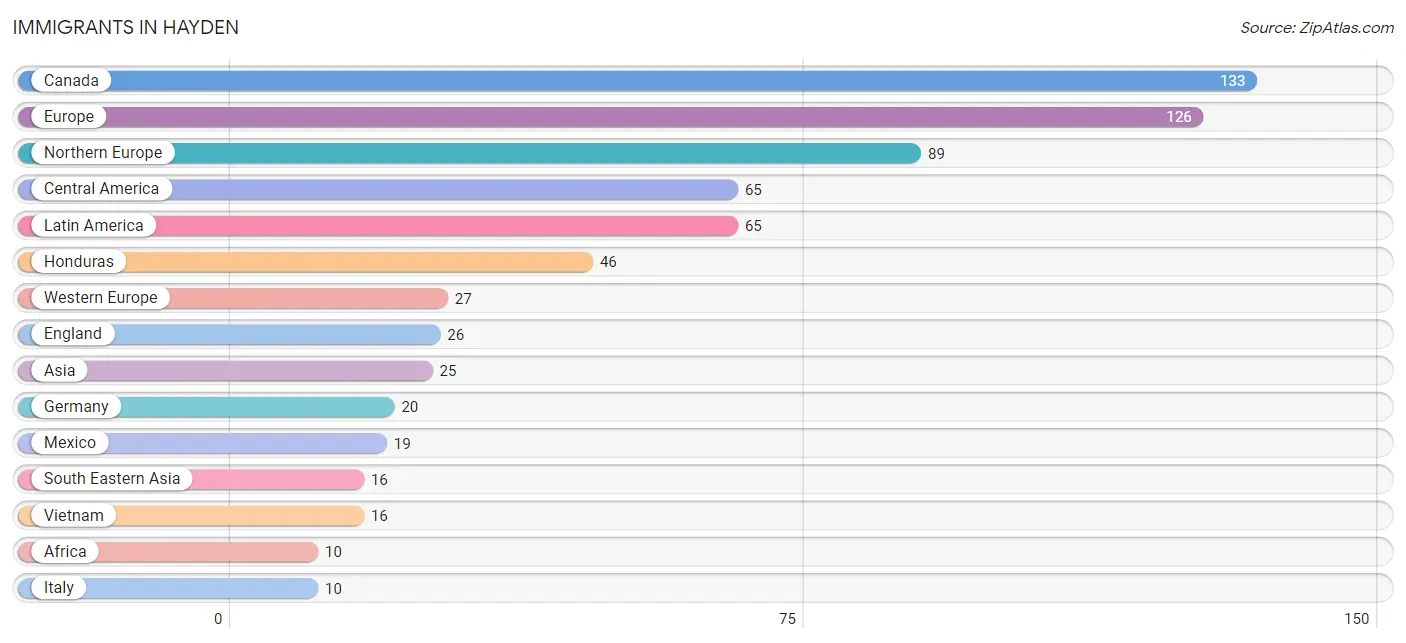
| Immigration Origin | # Population | % Population |
| Africa | 10 | 0.1% |
| Asia | 25 | 0.2% |
| Belgium | 7 | 0.0% |
| Canada | 133 | 0.9% |
| Central America | 65 | 0.4% |
| China | 9 | 0.1% |
| Eastern Asia | 9 | 0.1% |
| England | 26 | 0.2% |
| Europe | 126 | 0.8% |
| Germany | 20 | 0.1% |
| Honduras | 46 | 0.3% |
| Italy | 10 | 0.1% |
| Latin America | 65 | 0.4% |
| Mexico | 19 | 0.1% |
| Nigeria | 10 | 0.1% |
| Northern Europe | 89 | 0.6% |
| South Eastern Asia | 16 | 0.1% |
| Southern Europe | 10 | 0.1% |
| Vietnam | 16 | 0.1% |
| Western Africa | 10 | 0.1% |
| Western Europe | 27 | 0.2% | View All 21 Rows |
Sex and Age in Hayden
Sex and Age in Hayden
The most populous age groups in Hayden are 20 to 24 Years (581 | 7.7%) for men and 65 to 69 Years (739 | 9.0%) for women.
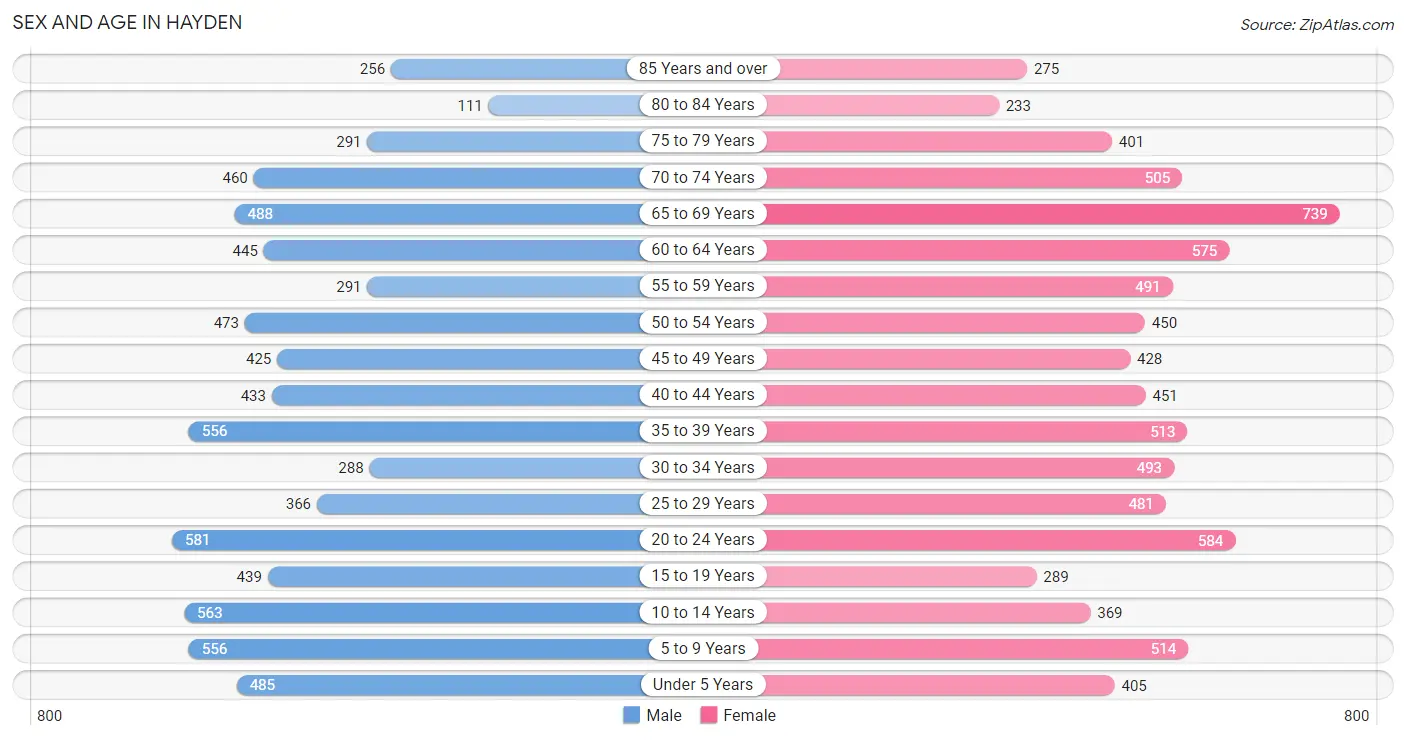
| Age Bracket | Male | Female |
| Under 5 Years | 485 (6.5%) | 405 (4.9%) |
| 5 to 9 Years | 556 (7.4%) | 514 (6.3%) |
| 10 to 14 Years | 563 (7.5%) | 369 (4.5%) |
| 15 to 19 Years | 439 (5.9%) | 289 (3.5%) |
| 20 to 24 Years | 581 (7.7%) | 584 (7.1%) |
| 25 to 29 Years | 366 (4.9%) | 481 (5.9%) |
| 30 to 34 Years | 288 (3.8%) | 493 (6.0%) |
| 35 to 39 Years | 556 (7.4%) | 513 (6.3%) |
| 40 to 44 Years | 433 (5.8%) | 451 (5.5%) |
| 45 to 49 Years | 425 (5.7%) | 428 (5.2%) |
| 50 to 54 Years | 473 (6.3%) | 450 (5.5%) |
| 55 to 59 Years | 291 (3.9%) | 491 (6.0%) |
| 60 to 64 Years | 445 (5.9%) | 575 (7.0%) |
| 65 to 69 Years | 488 (6.5%) | 739 (9.0%) |
| 70 to 74 Years | 460 (6.1%) | 505 (6.2%) |
| 75 to 79 Years | 291 (3.9%) | 401 (4.9%) |
| 80 to 84 Years | 111 (1.5%) | 233 (2.8%) |
| 85 Years and over | 256 (3.4%) | 275 (3.4%) |
| Total | 7,507 (100.0%) | 8,196 (100.0%) |
Families and Households in Hayden
Median Family Size in Hayden
The median family size in Hayden is 3.00 persons per family, with single female/mother families (391 | 9.1%) accounting for the largest median family size of 3.14 persons per family. On the other hand, single male/father families (310 | 7.2%) represent the smallest median family size with 1.95 persons per family.
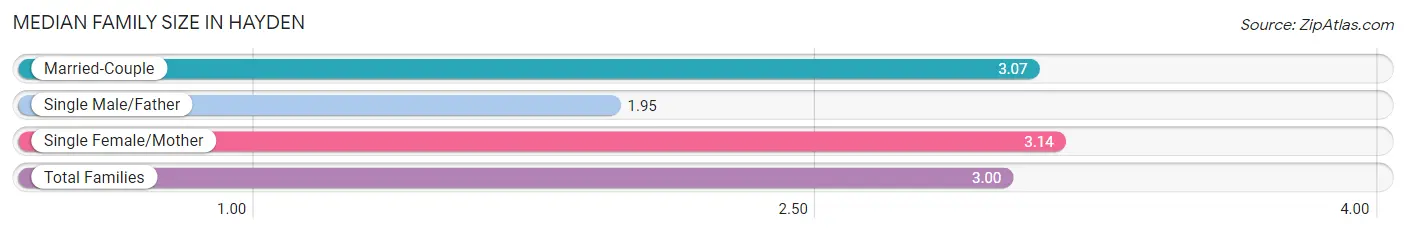
| Family Type | # Families | Family Size |
| Married-Couple | 3,604 (83.7%) | 3.07 |
| Single Male/Father | 310 (7.2%) | 1.95 |
| Single Female/Mother | 391 (9.1%) | 3.14 |
| Total Families | 4,305 (100.0%) | 3.00 |
Median Household Size in Hayden
The median household size in Hayden is 2.54 persons per household, with single female/mother households (391 | 6.4%) accounting for the largest median household size of 3.35 persons per household. non-family households (1,810 | 29.6%) represent the smallest median household size with 1.23 persons per household.
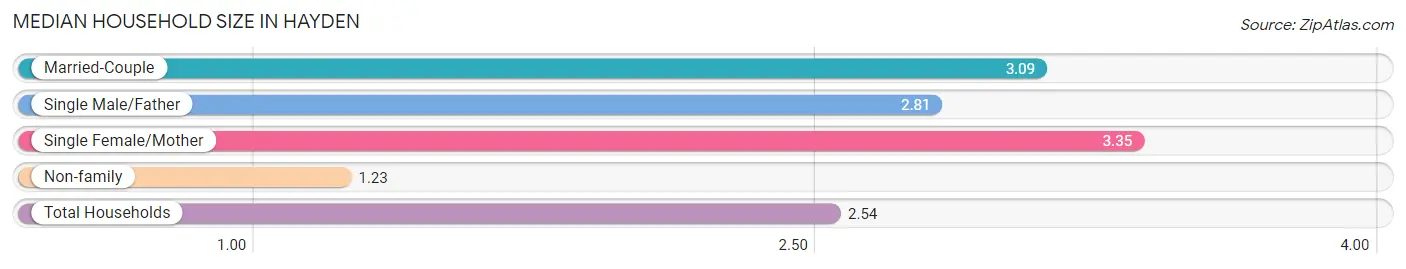
| Household Type | # Households | Household Size |
| Married-Couple | 3,604 (58.9%) | 3.09 |
| Single Male/Father | 310 (5.1%) | 2.81 |
| Single Female/Mother | 391 (6.4%) | 3.35 |
| Non-family | 1,810 (29.6%) | 1.23 |
| Total Households | 6,115 (100.0%) | 2.54 |
Household Size by Marriage Status in Hayden
Out of a total of 6,115 households in Hayden, 4,305 (70.4%) are family households, while 1,810 (29.6%) are nonfamily households. The most numerous type of family households are 2-person households, comprising 2,213, and the most common type of nonfamily households are 1-person households, comprising 1,501.
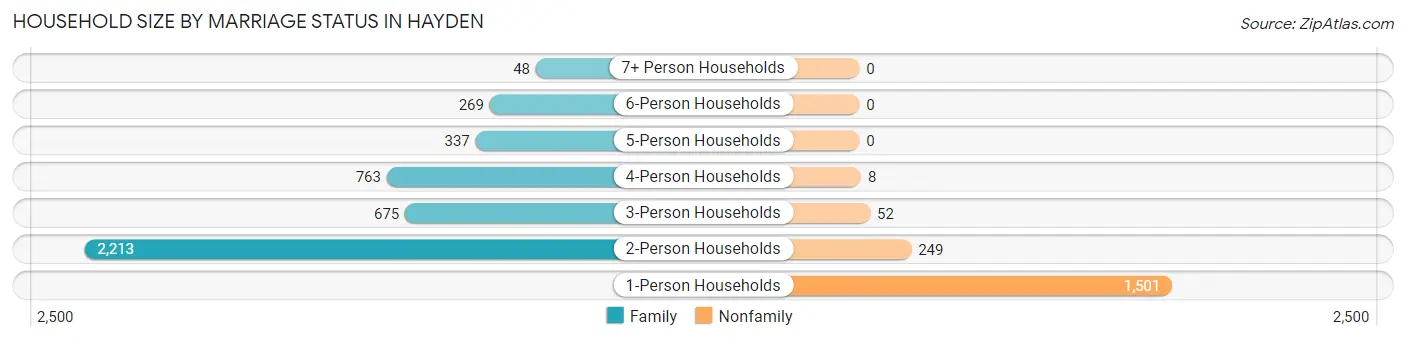
| Household Size | Family Households | Nonfamily Households |
| 1-Person Households | - | 1,501 (24.5%) |
| 2-Person Households | 2,213 (36.2%) | 249 (4.1%) |
| 3-Person Households | 675 (11.0%) | 52 (0.9%) |
| 4-Person Households | 763 (12.5%) | 8 (0.1%) |
| 5-Person Households | 337 (5.5%) | 0 (0.0%) |
| 6-Person Households | 269 (4.4%) | 0 (0.0%) |
| 7+ Person Households | 48 (0.8%) | 0 (0.0%) |
| Total | 4,305 (70.4%) | 1,810 (29.6%) |
Female Fertility in Hayden
Fertility by Age in Hayden
Average fertility rate in Hayden is 41.0 births per 1,000 women. Women in the age bracket of 20 to 34 years have the highest fertility rate with 78.0 births per 1,000 women. Women in the age bracket of 20 to 34 years acount for 89.0% of all women with births.
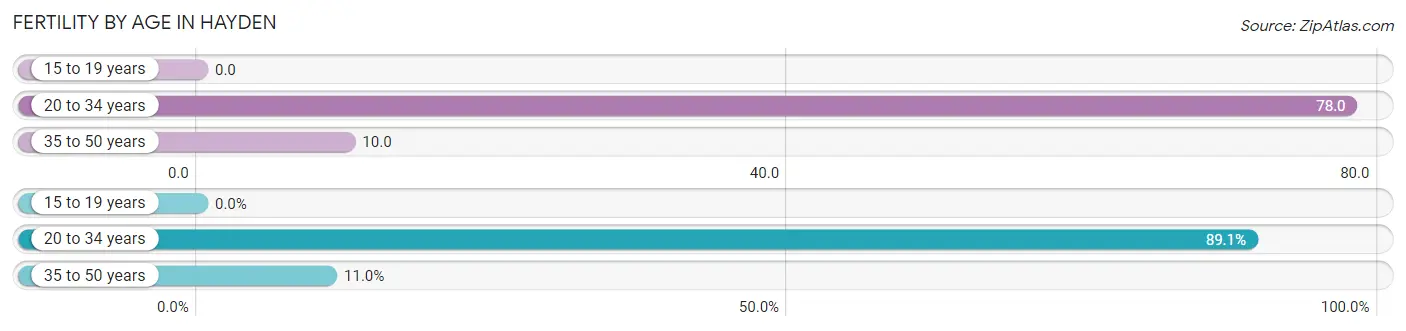
| Age Bracket | Women with Births | Births / 1,000 Women |
| 15 to 19 years | 0 (0.0%) | 0.0 |
| 20 to 34 years | 122 (89.0%) | 78.0 |
| 35 to 50 years | 15 (11.0%) | 10.0 |
| Total | 137 (100.0%) | 41.0 |
Fertility by Age by Marriage Status in Hayden
42.3% of women with births (137) in Hayden are married. The highest percentage of unmarried women with births falls into 20 to 34 years age bracket with 64.7% of them unmarried at the time of birth, while the lowest percentage of unmarried women with births belong to 35 to 50 years age bracket with 0.0% of them unmarried.
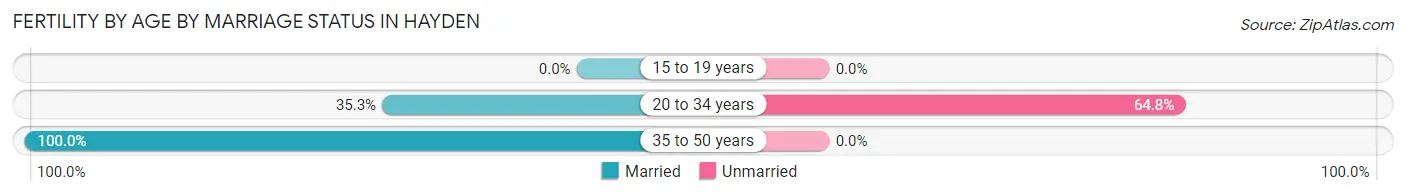
| Age Bracket | Married | Unmarried |
| 15 to 19 years | 0 (0.0%) | 0 (0.0%) |
| 20 to 34 years | 43 (35.2%) | 79 (64.7%) |
| 35 to 50 years | 15 (100.0%) | 0 (0.0%) |
| Total | 58 (42.3%) | 79 (57.7%) |
Fertility by Education in Hayden
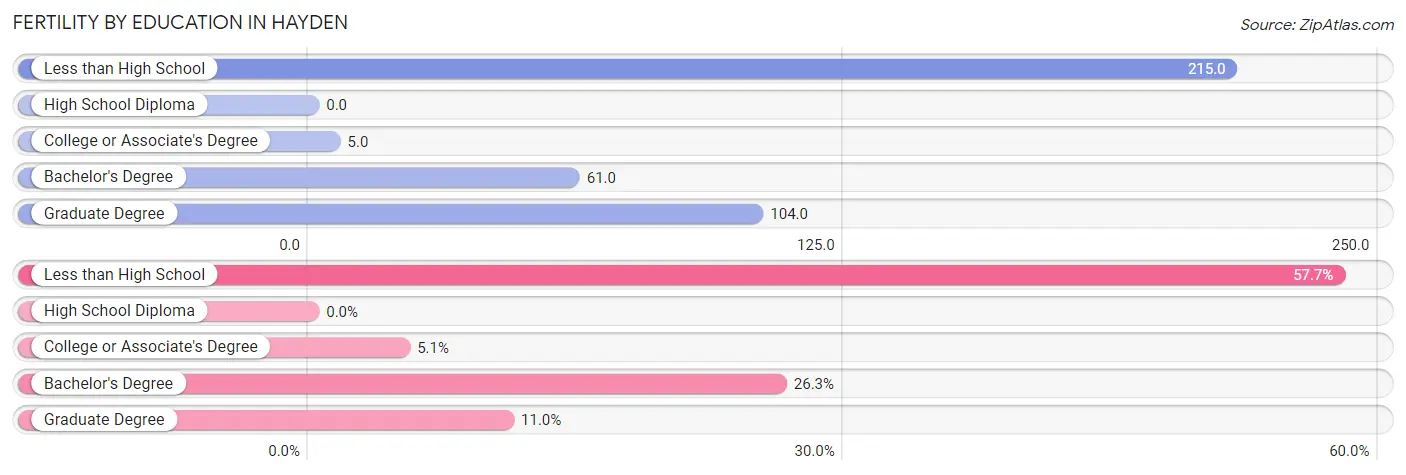
| Educational Attainment | Women with Births | Births / 1,000 Women |
| Less than High School | 79 (57.7%) | 215.0 |
| High School Diploma | 0 (0.0%) | 0.0 |
| College or Associate's Degree | 7 (5.1%) | 5.0 |
| Bachelor's Degree | 36 (26.3%) | 61.0 |
| Graduate Degree | 15 (11.0%) | 104.0 |
| Total | 137 (100.0%) | 41.0 |
Fertility by Education by Marriage Status in Hayden
57.7% of women with births in Hayden are unmarried. Women with the educational attainment of college or associate's degree are most likely to be married with 100.0% of them married at childbirth, while women with the educational attainment of less than high school are least likely to be married with 100.0% of them unmarried at childbirth.
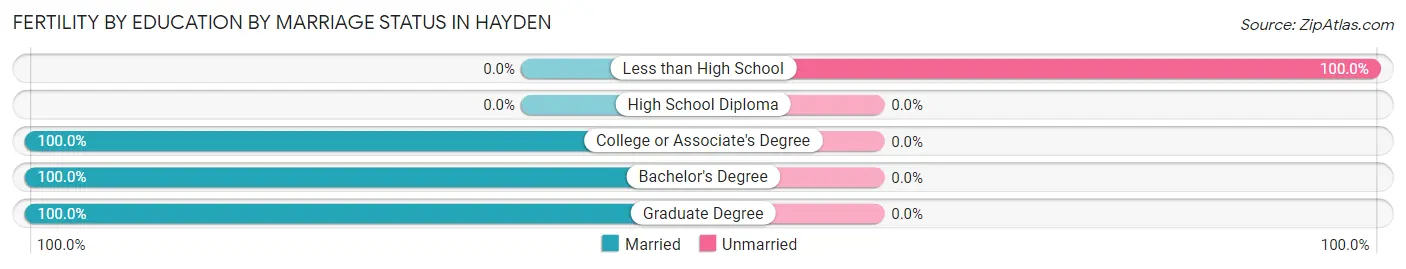
| Educational Attainment | Married | Unmarried |
| Less than High School | 0 (0.0%) | 79 (100.0%) |
| High School Diploma | 0 (0.0%) | 0 (0.0%) |
| College or Associate's Degree | 7 (100.0%) | 0 (0.0%) |
| Bachelor's Degree | 36 (100.0%) | 0 (0.0%) |
| Graduate Degree | 15 (100.0%) | 0 (0.0%) |
| Total | 58 (42.3%) | 79 (57.7%) |
Employment Characteristics in Hayden
Employment by Class of Employer in Hayden
Among the 7,219 employed individuals in Hayden, private company employees (4,792 | 66.4%), self-employed (not incorporated) (833 | 11.5%), and not-for-profit organizations (535 | 7.4%) make up the most common classes of employment.
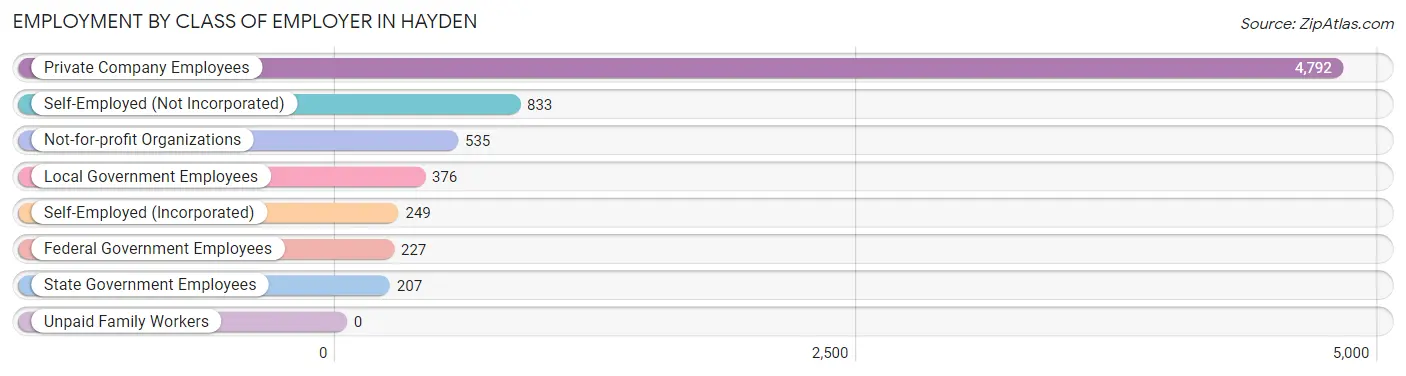
| Employer Class | # Employees | % Employees |
| Private Company Employees | 4,792 | 66.4% |
| Self-Employed (Incorporated) | 249 | 3.5% |
| Self-Employed (Not Incorporated) | 833 | 11.5% |
| Not-for-profit Organizations | 535 | 7.4% |
| Local Government Employees | 376 | 5.2% |
| State Government Employees | 207 | 2.9% |
| Federal Government Employees | 227 | 3.1% |
| Unpaid Family Workers | 0 | 0.0% |
| Total | 7,219 | 100.0% |
Employment Status by Age in Hayden
According to the labor force statistics for Hayden, out of the total population over 16 years of age (12,701), 60.0% or 7,621 individuals are in the labor force, with 3.7% or 282 of them unemployed. The age group with the highest labor force participation rate is 25 to 29 years, with 94.8% or 803 individuals in the labor force. Within the labor force, the 75 years and over age range has the highest percentage of unemployed individuals, with 31.3% or 26 of them being unemployed.
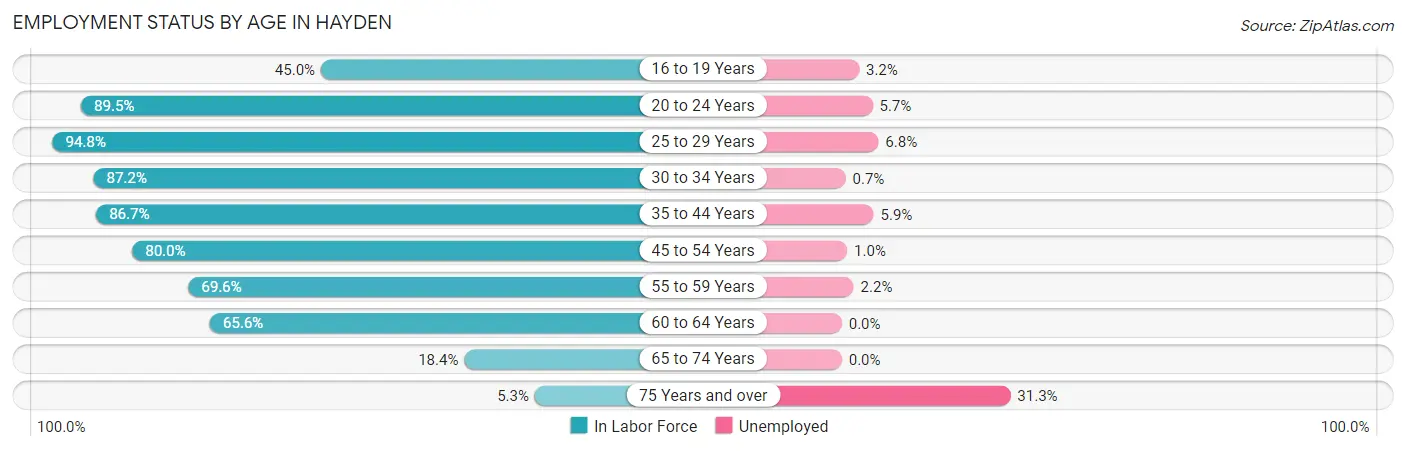
| Age Bracket | In Labor Force | Unemployed |
| 16 to 19 Years | 278 (45.0%) | 9 (3.2%) |
| 20 to 24 Years | 1,043 (89.5%) | 59 (5.7%) |
| 25 to 29 Years | 803 (94.8%) | 55 (6.8%) |
| 30 to 34 Years | 681 (87.2%) | 5 (0.7%) |
| 35 to 44 Years | 1,693 (86.7%) | 100 (5.9%) |
| 45 to 54 Years | 1,421 (80.0%) | 14 (1.0%) |
| 55 to 59 Years | 544 (69.6%) | 12 (2.2%) |
| 60 to 64 Years | 669 (65.6%) | 0 (0.0%) |
| 65 to 74 Years | 403 (18.4%) | 0 (0.0%) |
| 75 Years and over | 83 (5.3%) | 26 (31.3%) |
| Total | 7,621 (60.0%) | 282 (3.7%) |
Employment Status by Educational Attainment in Hayden
According to labor force statistics for Hayden, 81.2% of individuals (5,813) out of the total population between 25 and 64 years of age (7,159) are in the labor force, with 3.2% or 186 of them being unemployed. The group with the highest labor force participation rate are those with the educational attainment of bachelor's degree or higher, with 84.8% or 1,692 individuals in the labor force. Within the labor force, individuals with college / associate degree education have the highest percentage of unemployment, with 4.9% or 118 of them being unemployed.
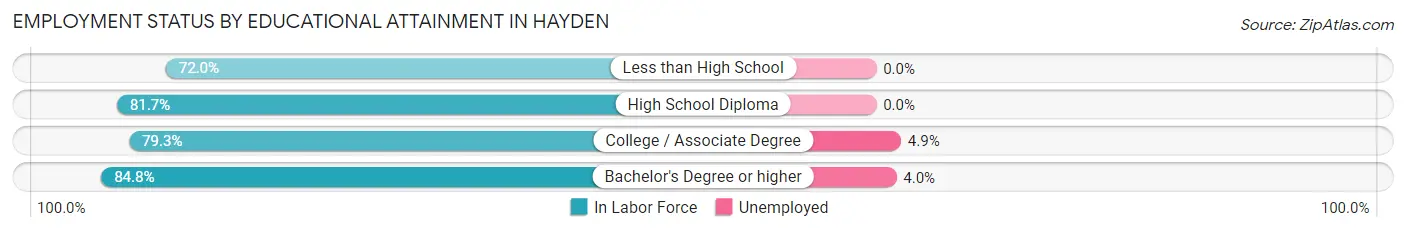
| Educational Attainment | In Labor Force | Unemployed |
| Less than High School | 203 (72.0%) | 0 (0.0%) |
| High School Diploma | 1,508 (81.7%) | 0 (0.0%) |
| College / Associate Degree | 2,408 (79.3%) | 149 (4.9%) |
| Bachelor's Degree or higher | 1,692 (84.8%) | 80 (4.0%) |
| Total | 5,813 (81.2%) | 229 (3.2%) |
Employment Occupations by Sex in Hayden
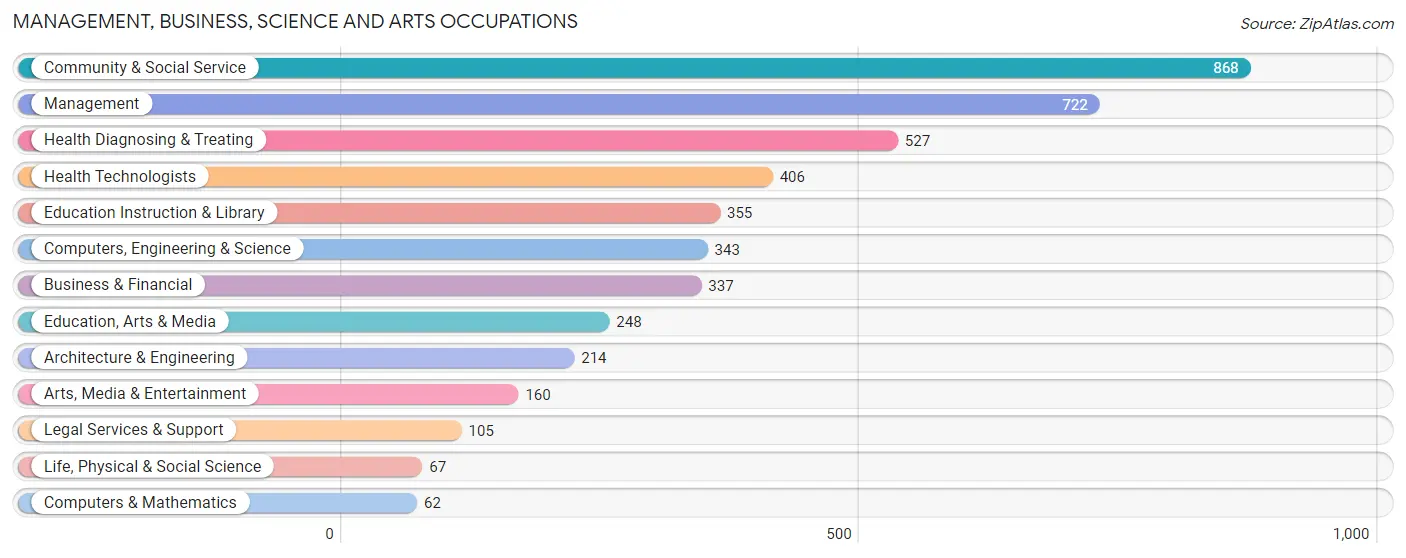
Management, Business, Science and Arts Occupations
The most common Management, Business, Science and Arts occupations in Hayden are Community & Social Service (868 | 11.9%), Management (722 | 9.9%), Health Diagnosing & Treating (527 | 7.2%), Health Technologists (406 | 5.6%), and Education Instruction & Library (355 | 4.9%).
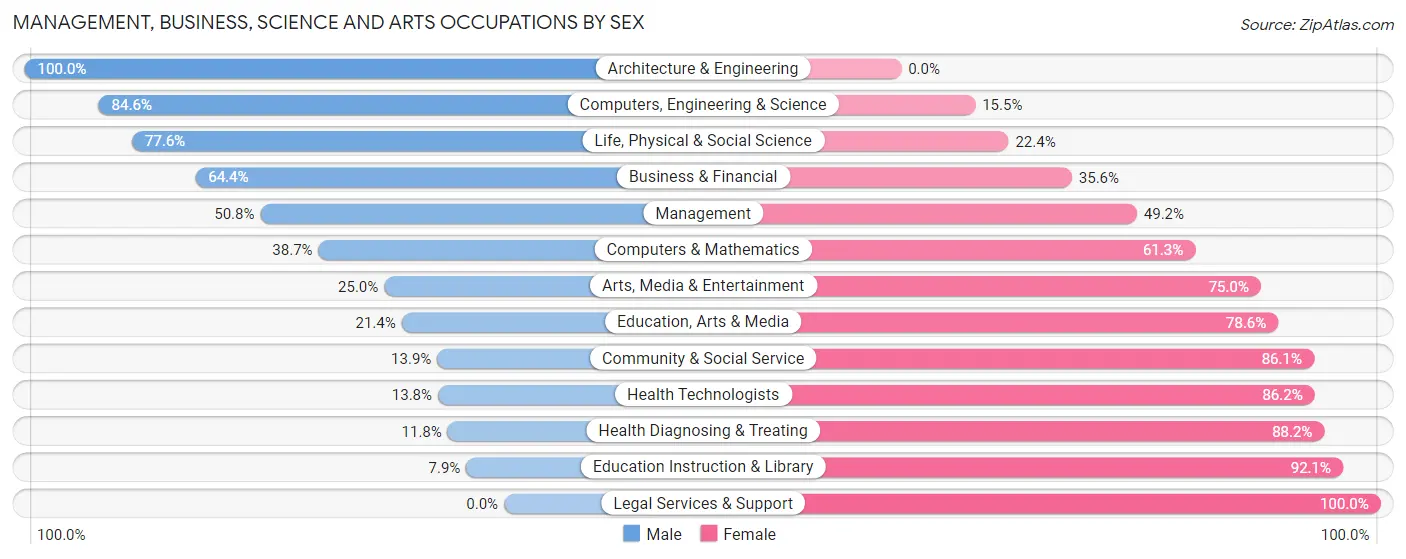
Management, Business, Science and Arts Occupations by Sex
Within the Management, Business, Science and Arts occupations in Hayden, the most male-oriented occupations are Architecture & Engineering (100.0%), Computers, Engineering & Science (84.6%), and Life, Physical & Social Science (77.6%), while the most female-oriented occupations are Legal Services & Support (100.0%), Education Instruction & Library (92.1%), and Health Diagnosing & Treating (88.2%).
| Occupation | Male | Female |
| Management | 367 (50.8%) | 355 (49.2%) |
| Business & Financial | 217 (64.4%) | 120 (35.6%) |
| Computers, Engineering & Science | 290 (84.6%) | 53 (15.4%) |
| Computers & Mathematics | 24 (38.7%) | 38 (61.3%) |
| Architecture & Engineering | 214 (100.0%) | 0 (0.0%) |
| Life, Physical & Social Science | 52 (77.6%) | 15 (22.4%) |
| Community & Social Service | 121 (13.9%) | 747 (86.1%) |
| Education, Arts & Media | 53 (21.4%) | 195 (78.6%) |
| Legal Services & Support | 0 (0.0%) | 105 (100.0%) |
| Education Instruction & Library | 28 (7.9%) | 327 (92.1%) |
| Arts, Media & Entertainment | 40 (25.0%) | 120 (75.0%) |
| Health Diagnosing & Treating | 62 (11.8%) | 465 (88.2%) |
| Health Technologists | 56 (13.8%) | 350 (86.2%) |
| Total (Category) | 1,057 (37.8%) | 1,740 (62.2%) |
| Total (Overall) | 3,502 (47.8%) | 3,816 (52.1%) |
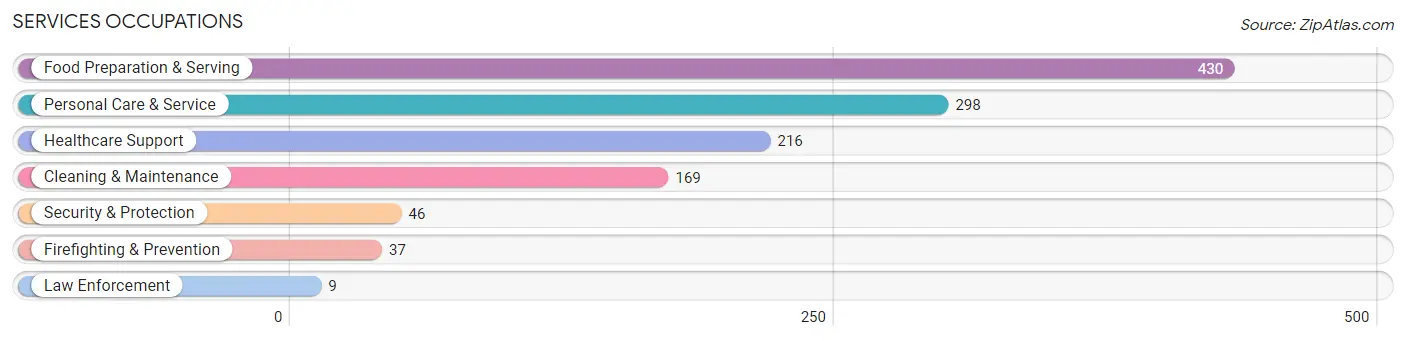
Services Occupations
The most common Services occupations in Hayden are Food Preparation & Serving (430 | 5.9%), Personal Care & Service (298 | 4.1%), Healthcare Support (216 | 2.9%), Cleaning & Maintenance (169 | 2.3%), and Security & Protection (46 | 0.6%).
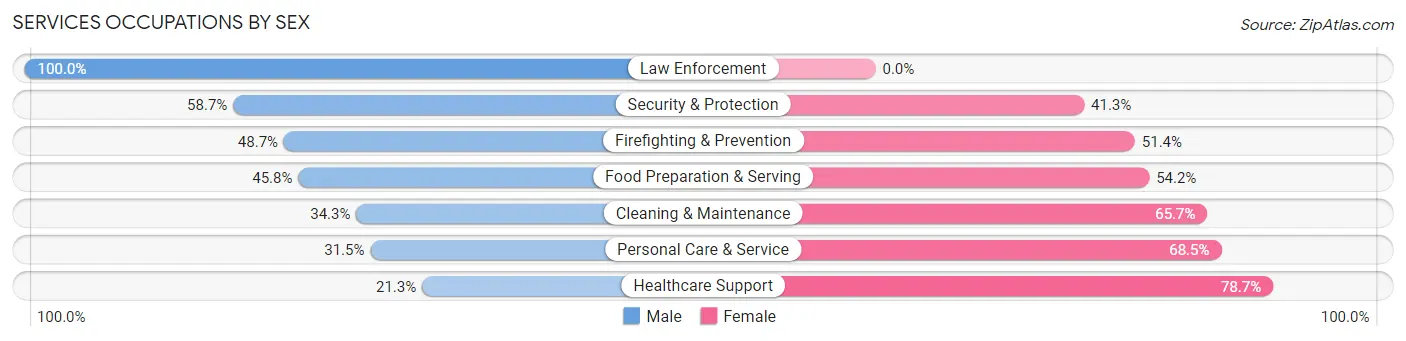
Services Occupations by Sex
Within the Services occupations in Hayden, the most male-oriented occupations are Law Enforcement (100.0%), Security & Protection (58.7%), and Firefighting & Prevention (48.6%), while the most female-oriented occupations are Healthcare Support (78.7%), Personal Care & Service (68.5%), and Cleaning & Maintenance (65.7%).
| Occupation | Male | Female |
| Healthcare Support | 46 (21.3%) | 170 (78.7%) |
| Security & Protection | 27 (58.7%) | 19 (41.3%) |
| Firefighting & Prevention | 18 (48.6%) | 19 (51.3%) |
| Law Enforcement | 9 (100.0%) | 0 (0.0%) |
| Food Preparation & Serving | 197 (45.8%) | 233 (54.2%) |
| Cleaning & Maintenance | 58 (34.3%) | 111 (65.7%) |
| Personal Care & Service | 94 (31.5%) | 204 (68.5%) |
| Total (Category) | 422 (36.4%) | 737 (63.6%) |
| Total (Overall) | 3,502 (47.8%) | 3,816 (52.1%) |
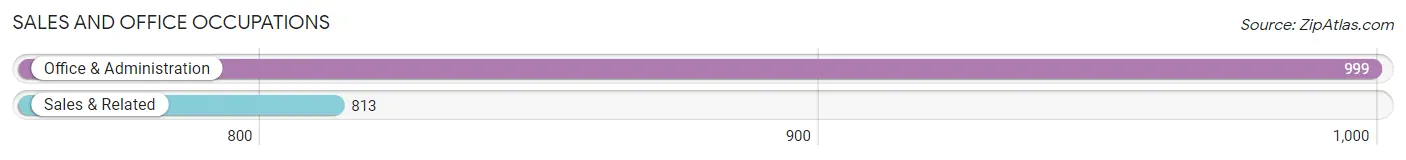
Sales and Office Occupations
The most common Sales and Office occupations in Hayden are Office & Administration (999 | 13.7%), and Sales & Related (813 | 11.1%).
Sales and Office Occupations by Sex
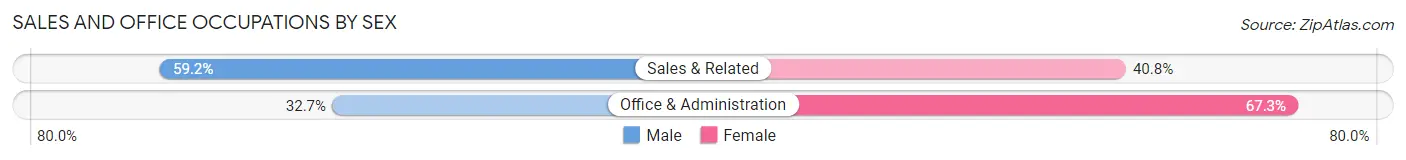
| Occupation | Male | Female |
| Sales & Related | 481 (59.2%) | 332 (40.8%) |
| Office & Administration | 327 (32.7%) | 672 (67.3%) |
| Total (Category) | 808 (44.6%) | 1,004 (55.4%) |
| Total (Overall) | 3,502 (47.8%) | 3,816 (52.1%) |
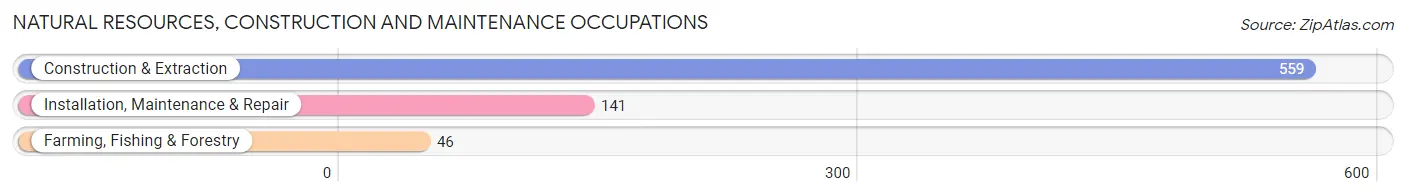
Natural Resources, Construction and Maintenance Occupations
The most common Natural Resources, Construction and Maintenance occupations in Hayden are Construction & Extraction (559 | 7.6%), Installation, Maintenance & Repair (141 | 1.9%), and Farming, Fishing & Forestry (46 | 0.6%).
Natural Resources, Construction and Maintenance Occupations by Sex
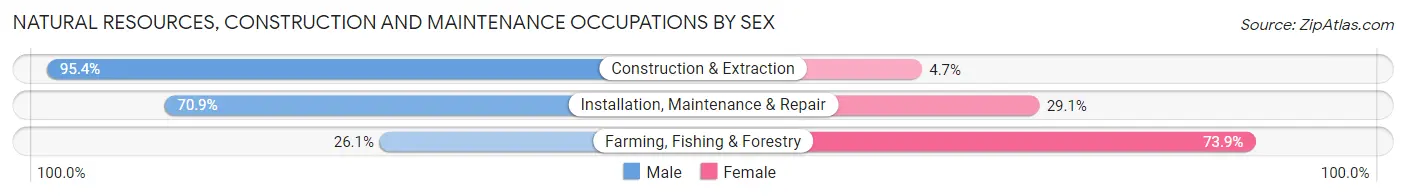
| Occupation | Male | Female |
| Farming, Fishing & Forestry | 12 (26.1%) | 34 (73.9%) |
| Construction & Extraction | 533 (95.4%) | 26 (4.6%) |
| Installation, Maintenance & Repair | 100 (70.9%) | 41 (29.1%) |
| Total (Category) | 645 (86.5%) | 101 (13.5%) |
| Total (Overall) | 3,502 (47.8%) | 3,816 (52.1%) |
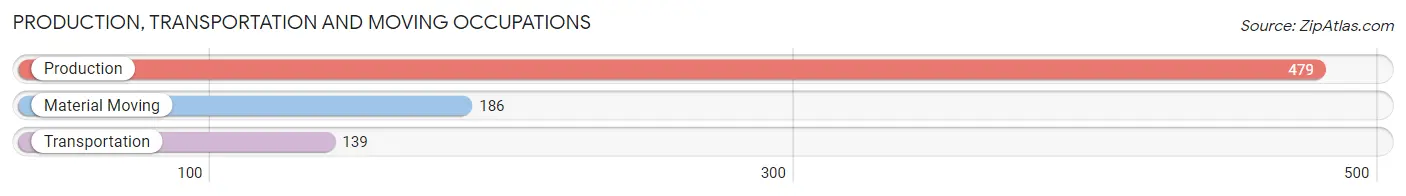
Production, Transportation and Moving Occupations
The most common Production, Transportation and Moving occupations in Hayden are Production (479 | 6.6%), Material Moving (186 | 2.5%), and Transportation (139 | 1.9%).
Production, Transportation and Moving Occupations by Sex
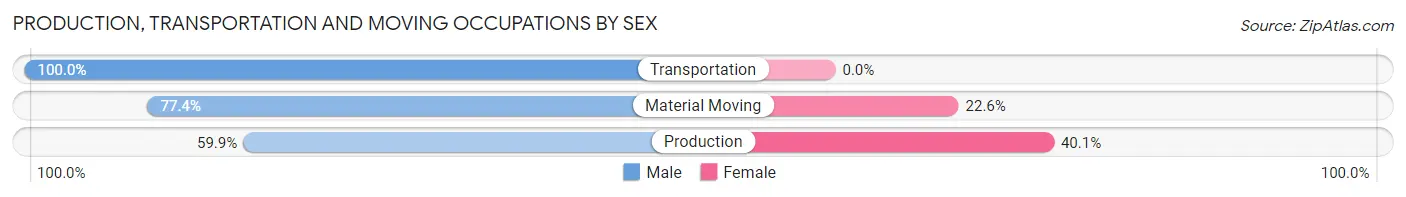
| Occupation | Male | Female |
| Production | 287 (59.9%) | 192 (40.1%) |
| Transportation | 139 (100.0%) | 0 (0.0%) |
| Material Moving | 144 (77.4%) | 42 (22.6%) |
| Total (Category) | 570 (70.9%) | 234 (29.1%) |
| Total (Overall) | 3,502 (47.8%) | 3,816 (52.1%) |
Employment Industries by Sex in Hayden
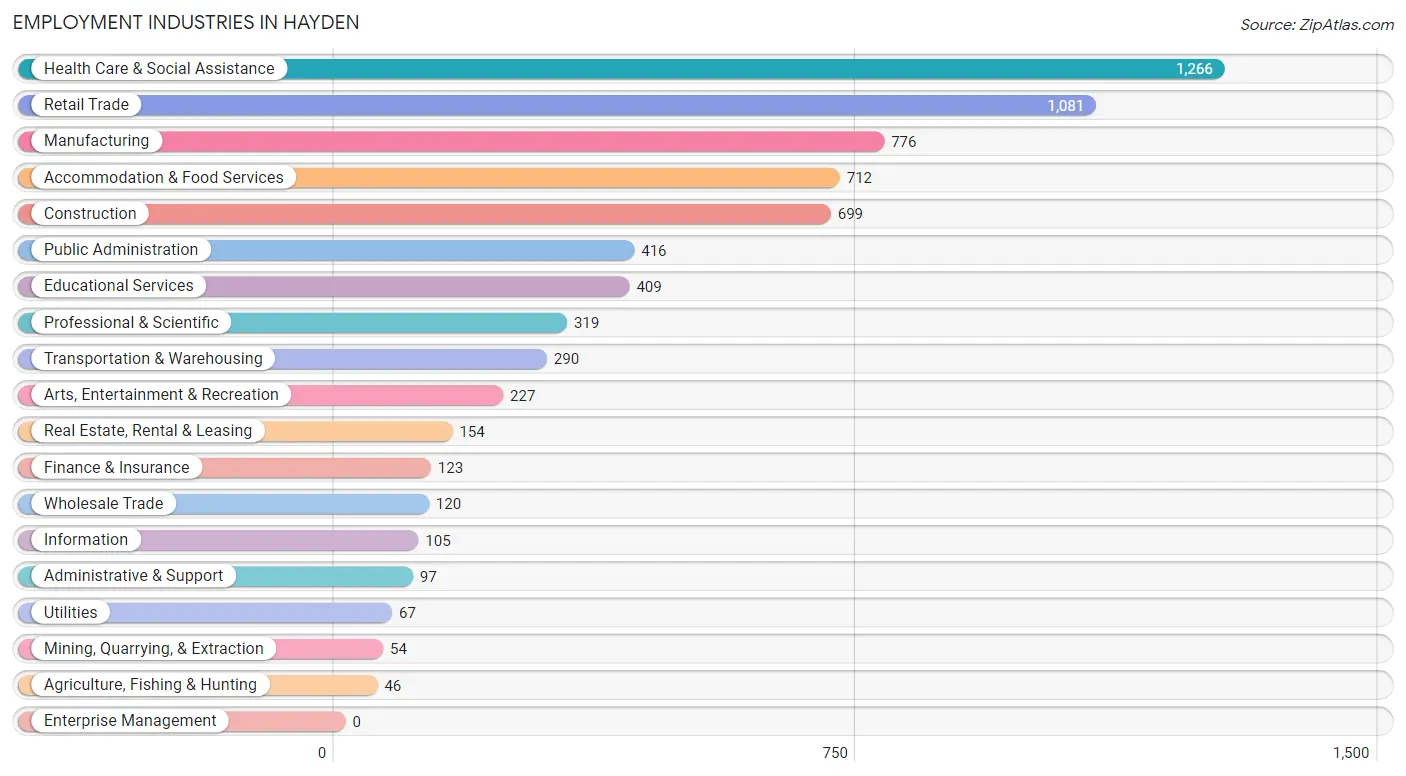
Employment Industries in Hayden
The major employment industries in Hayden include Health Care & Social Assistance (1,266 | 17.3%), Retail Trade (1,081 | 14.8%), Manufacturing (776 | 10.6%), Accommodation & Food Services (712 | 9.7%), and Construction (699 | 9.6%).
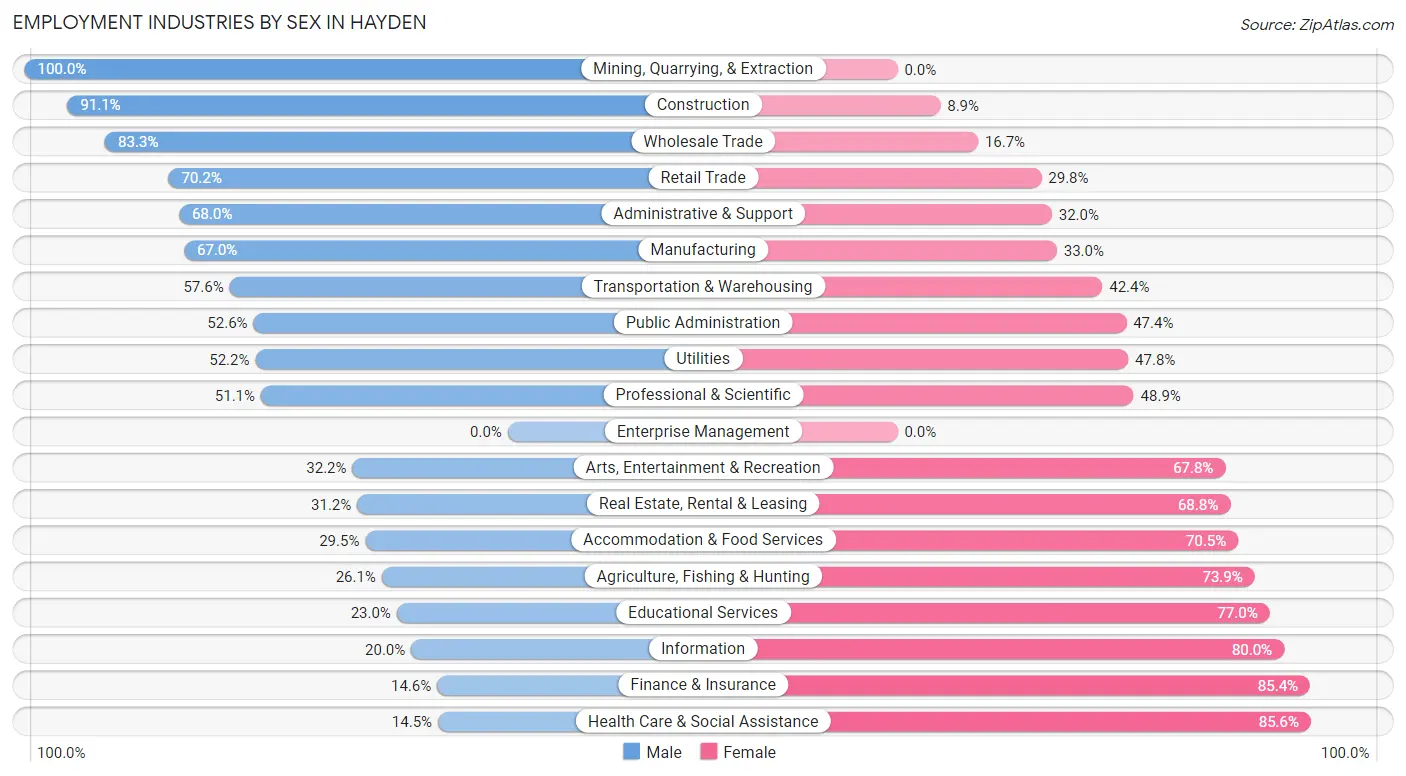
Employment Industries by Sex in Hayden
The Hayden industries that see more men than women are Mining, Quarrying, & Extraction (100.0%), Construction (91.1%), and Wholesale Trade (83.3%), whereas the industries that tend to have a higher number of women are Health Care & Social Assistance (85.6%), Finance & Insurance (85.4%), and Information (80.0%).
| Industry | Male | Female |
| Agriculture, Fishing & Hunting | 12 (26.1%) | 34 (73.9%) |
| Mining, Quarrying, & Extraction | 54 (100.0%) | 0 (0.0%) |
| Construction | 637 (91.1%) | 62 (8.9%) |
| Manufacturing | 520 (67.0%) | 256 (33.0%) |
| Wholesale Trade | 100 (83.3%) | 20 (16.7%) |
| Retail Trade | 759 (70.2%) | 322 (29.8%) |
| Transportation & Warehousing | 167 (57.6%) | 123 (42.4%) |
| Utilities | 35 (52.2%) | 32 (47.8%) |
| Information | 21 (20.0%) | 84 (80.0%) |
| Finance & Insurance | 18 (14.6%) | 105 (85.4%) |
| Real Estate, Rental & Leasing | 48 (31.2%) | 106 (68.8%) |
| Professional & Scientific | 163 (51.1%) | 156 (48.9%) |
| Enterprise Management | 0 (0.0%) | 0 (0.0%) |
| Administrative & Support | 66 (68.0%) | 31 (32.0%) |
| Educational Services | 94 (23.0%) | 315 (77.0%) |
| Health Care & Social Assistance | 183 (14.4%) | 1,083 (85.6%) |
| Arts, Entertainment & Recreation | 73 (32.2%) | 154 (67.8%) |
| Accommodation & Food Services | 210 (29.5%) | 502 (70.5%) |
| Public Administration | 219 (52.6%) | 197 (47.4%) |
| Total | 3,502 (47.8%) | 3,816 (52.1%) |
Education in Hayden
School Enrollment in Hayden
The most common levels of schooling among the 2,902 students in Hayden are middle school (825 | 28.4%), elementary school (768 | 26.5%), and high school (534 | 18.4%).
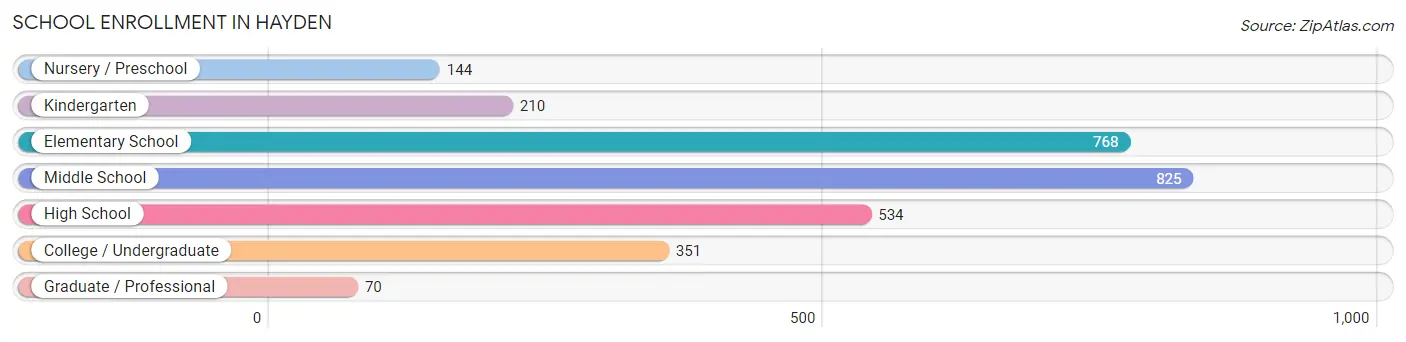
| School Level | # Students | % Students |
| Nursery / Preschool | 144 | 5.0% |
| Kindergarten | 210 | 7.2% |
| Elementary School | 768 | 26.5% |
| Middle School | 825 | 28.4% |
| High School | 534 | 18.4% |
| College / Undergraduate | 351 | 12.1% |
| Graduate / Professional | 70 | 2.4% |
| Total | 2,902 | 100.0% |
School Enrollment by Age by Funding Source in Hayden
Out of a total of 2,902 students who are enrolled in schools in Hayden, 583 (20.1%) attend a private institution, while the remaining 2,319 (79.9%) are enrolled in public schools. The age group of 3 to 4 year olds has the highest likelihood of being enrolled in private schools, with 98 (92.4% in the age bracket) enrolled. Conversely, the age group of 18 to 19 year olds has the lowest likelihood of being enrolled in a private school, with 78 (100.0% in the age bracket) attending a public institution.
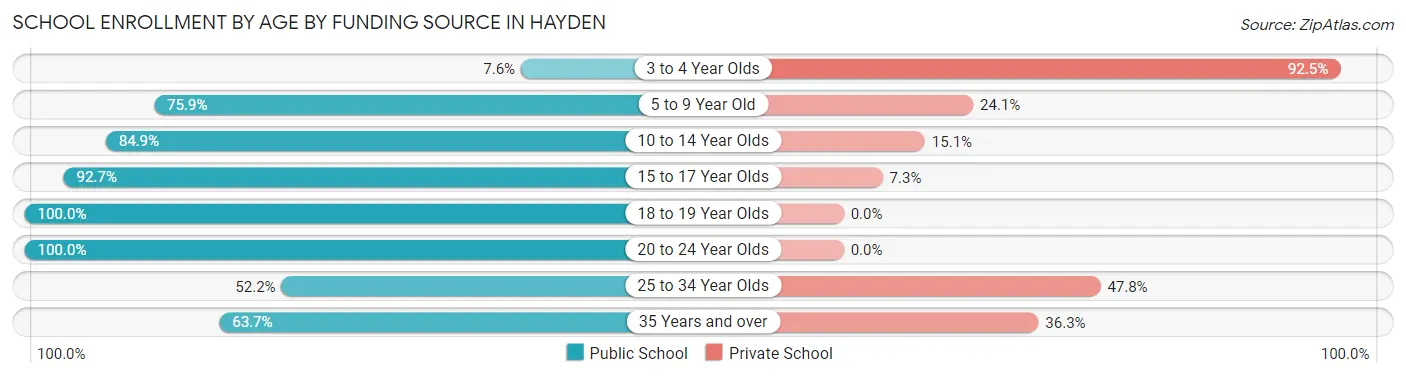
| Age Bracket | Public School | Private School |
| 3 to 4 Year Olds | 8 (7.5%) | 98 (92.4%) |
| 5 to 9 Year Old | 711 (75.9%) | 226 (24.1%) |
| 10 to 14 Year Olds | 791 (84.9%) | 141 (15.1%) |
| 15 to 17 Year Olds | 460 (92.7%) | 36 (7.3%) |
| 18 to 19 Year Olds | 78 (100.0%) | 0 (0.0%) |
| 20 to 24 Year Olds | 159 (100.0%) | 0 (0.0%) |
| 25 to 34 Year Olds | 48 (52.2%) | 44 (47.8%) |
| 35 Years and over | 65 (63.7%) | 37 (36.3%) |
| Total | 2,319 (79.9%) | 583 (20.1%) |
Educational Attainment by Field of Study in Hayden
Business (661 | 21.1%), education (469 | 15.0%), science & technology (424 | 13.6%), psychology (290 | 9.3%), and bio, nature & agricultural (241 | 7.7%) are the most common fields of study among 3,127 individuals in Hayden who have obtained a bachelor's degree or higher.
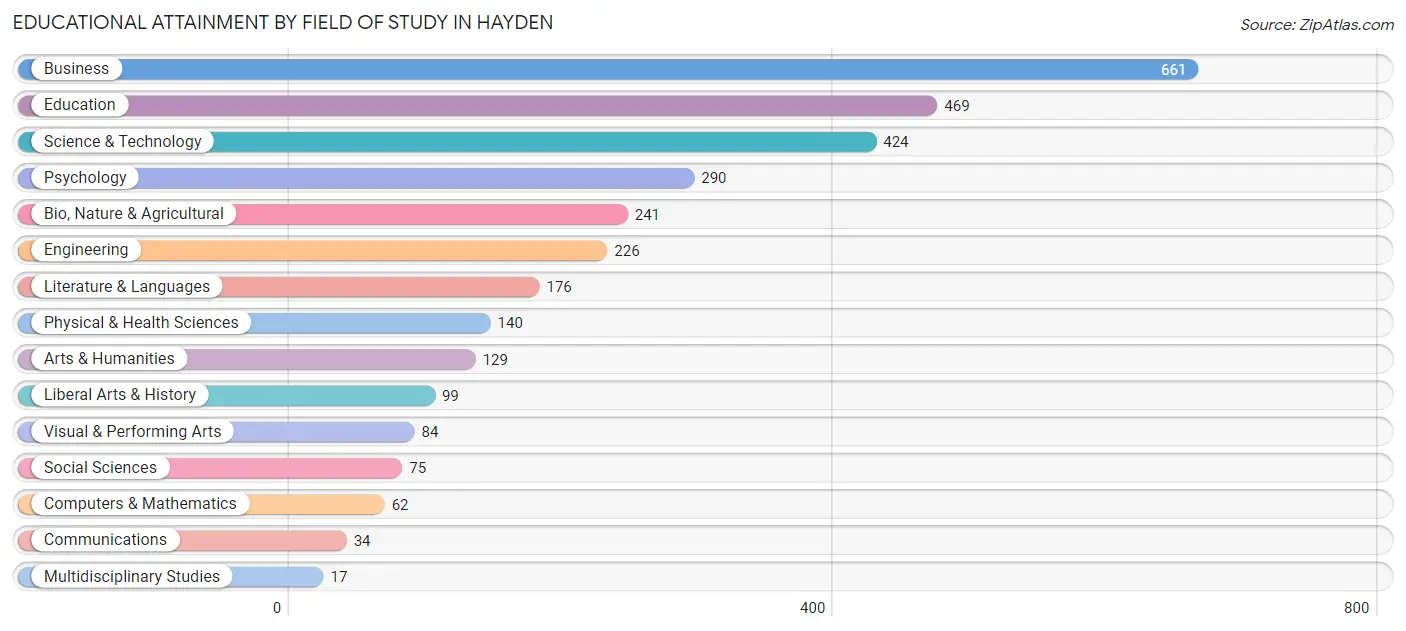
| Field of Study | # Graduates | % Graduates |
| Computers & Mathematics | 62 | 2.0% |
| Bio, Nature & Agricultural | 241 | 7.7% |
| Physical & Health Sciences | 140 | 4.5% |
| Psychology | 290 | 9.3% |
| Social Sciences | 75 | 2.4% |
| Engineering | 226 | 7.2% |
| Multidisciplinary Studies | 17 | 0.5% |
| Science & Technology | 424 | 13.6% |
| Business | 661 | 21.1% |
| Education | 469 | 15.0% |
| Literature & Languages | 176 | 5.6% |
| Liberal Arts & History | 99 | 3.2% |
| Visual & Performing Arts | 84 | 2.7% |
| Communications | 34 | 1.1% |
| Arts & Humanities | 129 | 4.1% |
| Total | 3,127 | 100.0% |
Transportation & Commute in Hayden
Vehicle Availability by Sex in Hayden
The most prevalent vehicle ownership categories in Hayden are males with 2 vehicles (1,415, accounting for 40.9%) and females with 2 vehicles (1,566, making up 37.8%).
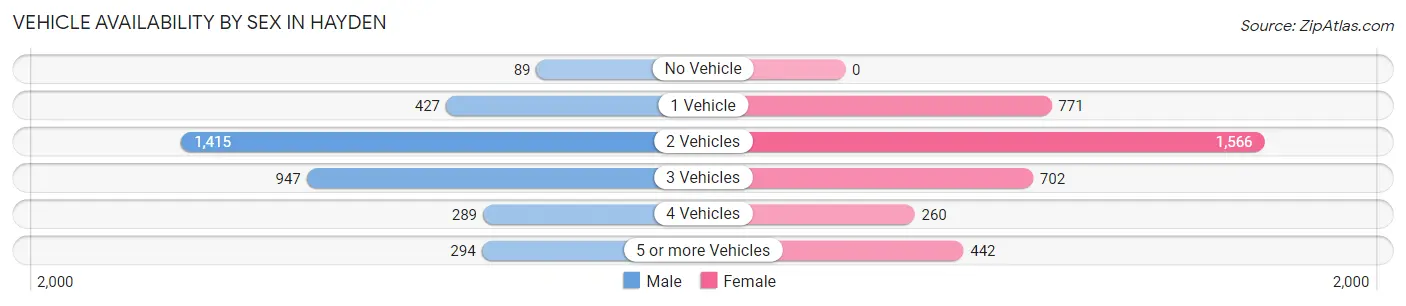
| Vehicles Available | Male | Female |
| No Vehicle | 89 (2.6%) | 0 (0.0%) |
| 1 Vehicle | 427 (12.3%) | 771 (20.6%) |
| 2 Vehicles | 1,415 (40.9%) | 1,566 (41.9%) |
| 3 Vehicles | 947 (27.4%) | 702 (18.8%) |
| 4 Vehicles | 289 (8.4%) | 260 (7.0%) |
| 5 or more Vehicles | 294 (8.5%) | 442 (11.8%) |
| Total | 3,461 (100.0%) | 3,741 (100.0%) |
Commute Time in Hayden
The most frequently occuring commute durations in Hayden are 15 to 19 minutes (1,316 commuters, 21.9%), 10 to 14 minutes (1,281 commuters, 21.3%), and 20 to 24 minutes (978 commuters, 16.3%).
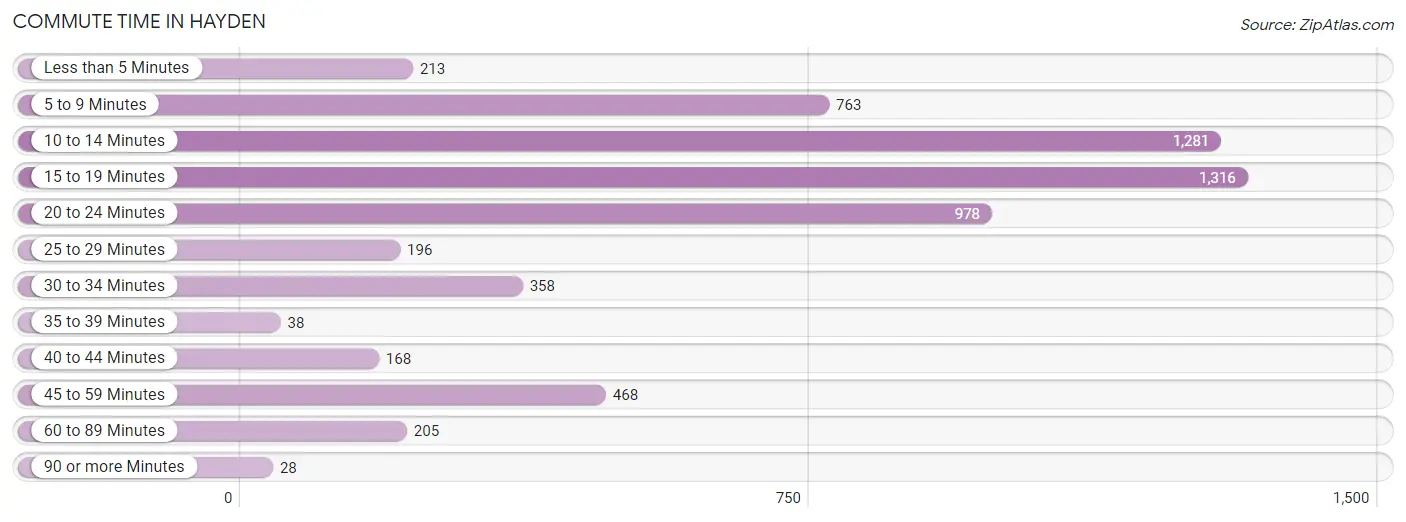
| Commute Time | # Commuters | % Commuters |
| Less than 5 Minutes | 213 | 3.5% |
| 5 to 9 Minutes | 763 | 12.7% |
| 10 to 14 Minutes | 1,281 | 21.3% |
| 15 to 19 Minutes | 1,316 | 21.9% |
| 20 to 24 Minutes | 978 | 16.3% |
| 25 to 29 Minutes | 196 | 3.3% |
| 30 to 34 Minutes | 358 | 5.9% |
| 35 to 39 Minutes | 38 | 0.6% |
| 40 to 44 Minutes | 168 | 2.8% |
| 45 to 59 Minutes | 468 | 7.8% |
| 60 to 89 Minutes | 205 | 3.4% |
| 90 or more Minutes | 28 | 0.5% |
Commute Time by Sex in Hayden
The most common commute times in Hayden are 15 to 19 minutes (675 commuters, 24.4%) for males and 10 to 14 minutes (698 commuters, 21.5%) for females.
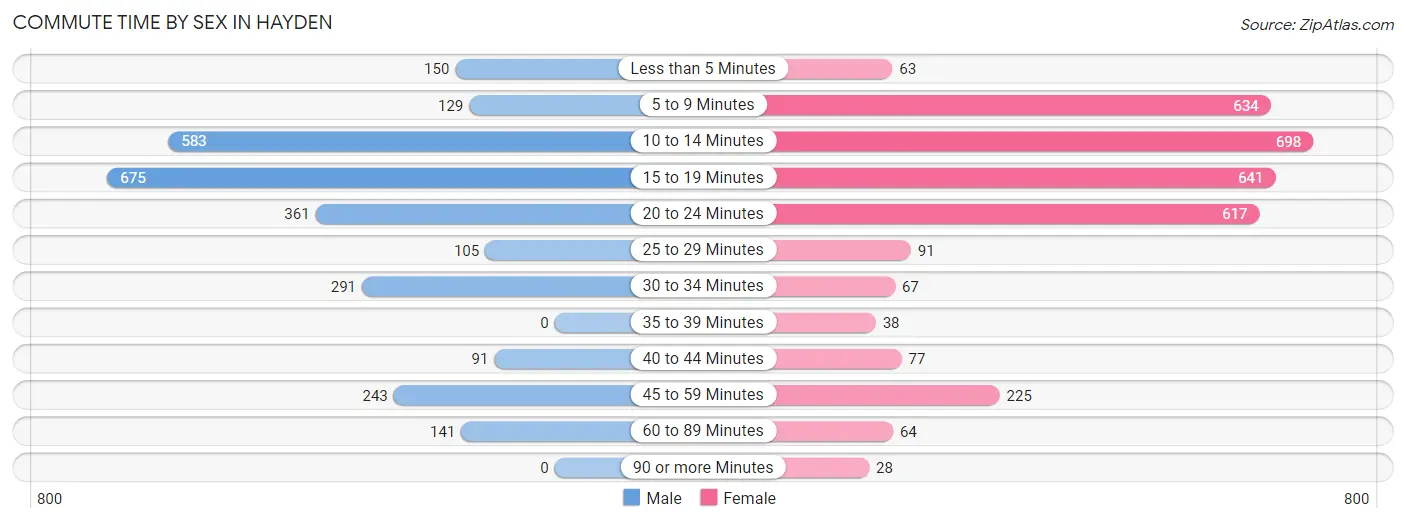
| Commute Time | Male | Female |
| Less than 5 Minutes | 150 (5.4%) | 63 (1.9%) |
| 5 to 9 Minutes | 129 (4.7%) | 634 (19.6%) |
| 10 to 14 Minutes | 583 (21.0%) | 698 (21.5%) |
| 15 to 19 Minutes | 675 (24.4%) | 641 (19.8%) |
| 20 to 24 Minutes | 361 (13.0%) | 617 (19.0%) |
| 25 to 29 Minutes | 105 (3.8%) | 91 (2.8%) |
| 30 to 34 Minutes | 291 (10.5%) | 67 (2.1%) |
| 35 to 39 Minutes | 0 (0.0%) | 38 (1.2%) |
| 40 to 44 Minutes | 91 (3.3%) | 77 (2.4%) |
| 45 to 59 Minutes | 243 (8.8%) | 225 (6.9%) |
| 60 to 89 Minutes | 141 (5.1%) | 64 (2.0%) |
| 90 or more Minutes | 0 (0.0%) | 28 (0.9%) |
Time of Departure to Work by Sex in Hayden
The most frequent times of departure to work in Hayden are 7:00 AM to 7:29 AM (545, 19.7%) for males and 7:00 AM to 7:29 AM (573, 17.7%) for females.
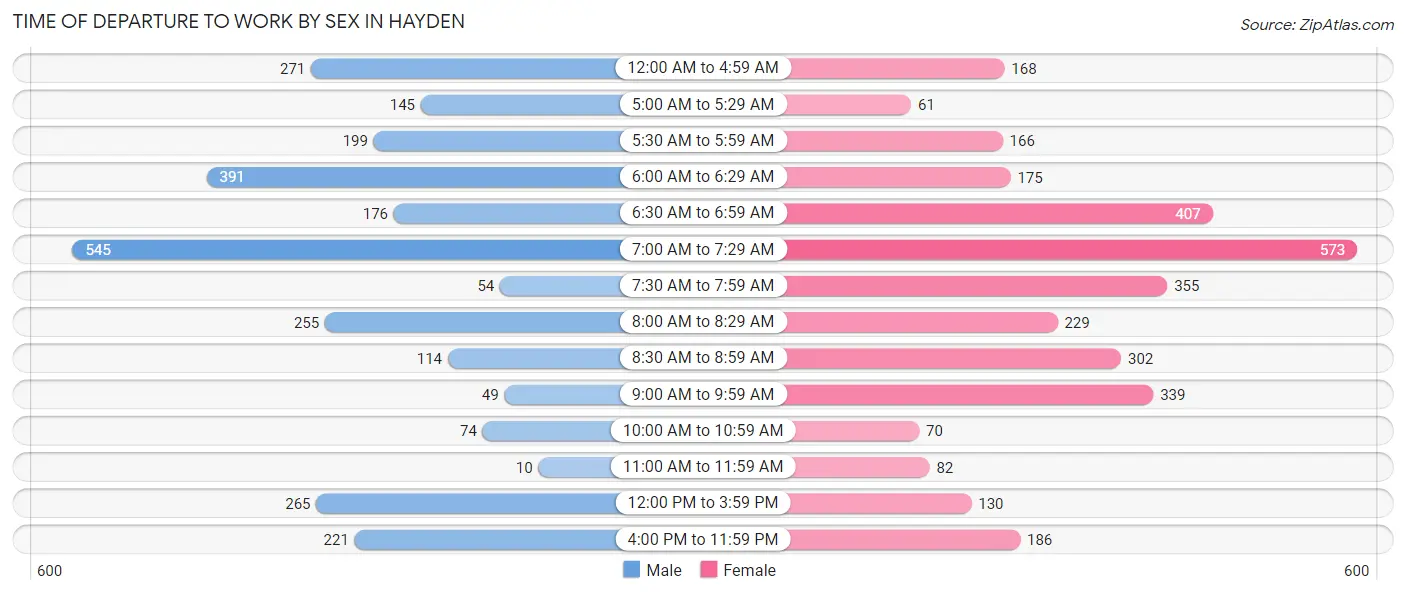
| Time of Departure | Male | Female |
| 12:00 AM to 4:59 AM | 271 (9.8%) | 168 (5.2%) |
| 5:00 AM to 5:29 AM | 145 (5.2%) | 61 (1.9%) |
| 5:30 AM to 5:59 AM | 199 (7.2%) | 166 (5.1%) |
| 6:00 AM to 6:29 AM | 391 (14.1%) | 175 (5.4%) |
| 6:30 AM to 6:59 AM | 176 (6.4%) | 407 (12.6%) |
| 7:00 AM to 7:29 AM | 545 (19.7%) | 573 (17.7%) |
| 7:30 AM to 7:59 AM | 54 (1.9%) | 355 (11.0%) |
| 8:00 AM to 8:29 AM | 255 (9.2%) | 229 (7.1%) |
| 8:30 AM to 8:59 AM | 114 (4.1%) | 302 (9.3%) |
| 9:00 AM to 9:59 AM | 49 (1.8%) | 339 (10.4%) |
| 10:00 AM to 10:59 AM | 74 (2.7%) | 70 (2.2%) |
| 11:00 AM to 11:59 AM | 10 (0.4%) | 82 (2.5%) |
| 12:00 PM to 3:59 PM | 265 (9.6%) | 130 (4.0%) |
| 4:00 PM to 11:59 PM | 221 (8.0%) | 186 (5.7%) |
| Total | 2,769 (100.0%) | 3,243 (100.0%) |
Housing Occupancy in Hayden
Occupancy by Ownership in Hayden
Of the total 6,115 dwellings in Hayden, owner-occupied units account for 4,914 (80.4%), while renter-occupied units make up 1,201 (19.6%).
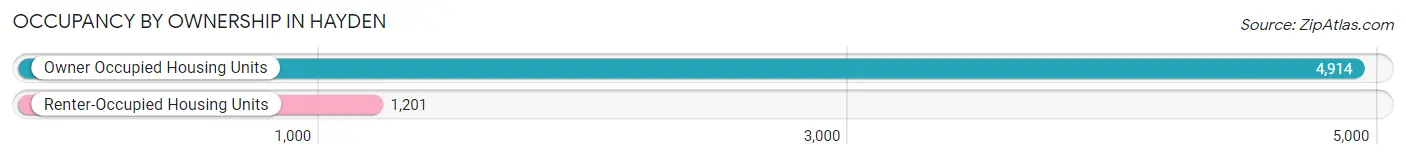
| Occupancy | # Housing Units | % Housing Units |
| Owner Occupied Housing Units | 4,914 | 80.4% |
| Renter-Occupied Housing Units | 1,201 | 19.6% |
| Total Occupied Housing Units | 6,115 | 100.0% |
Occupancy by Household Size in Hayden
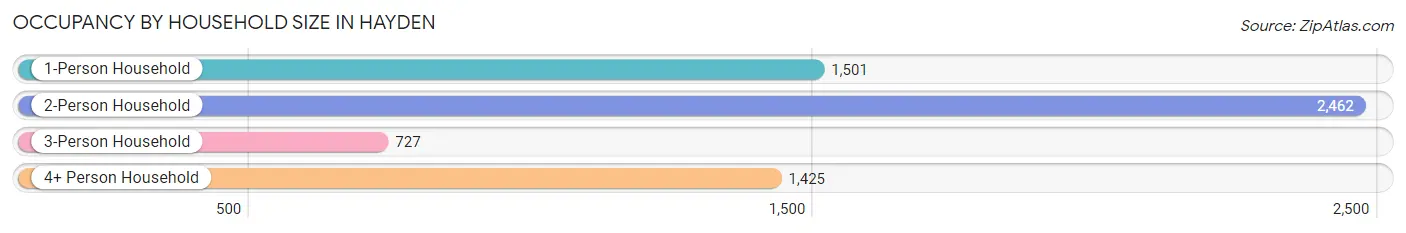
| Household Size | # Housing Units | % Housing Units |
| 1-Person Household | 1,501 | 24.5% |
| 2-Person Household | 2,462 | 40.3% |
| 3-Person Household | 727 | 11.9% |
| 4+ Person Household | 1,425 | 23.3% |
| Total Housing Units | 6,115 | 100.0% |
Occupancy by Ownership by Household Size in Hayden
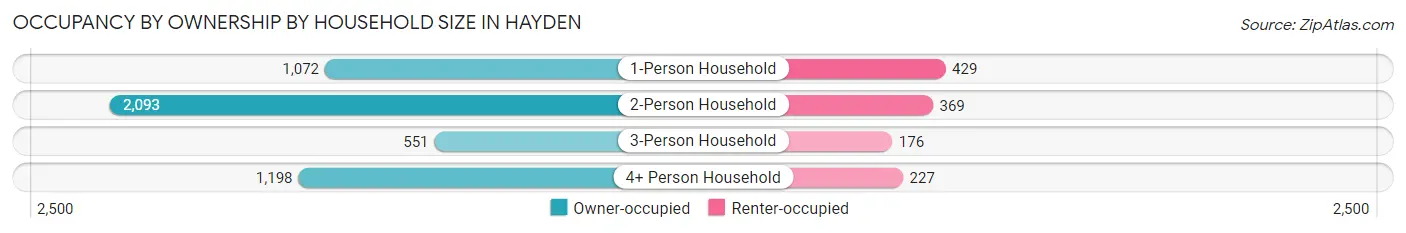
| Household Size | Owner-occupied | Renter-occupied |
| 1-Person Household | 1,072 (71.4%) | 429 (28.6%) |
| 2-Person Household | 2,093 (85.0%) | 369 (15.0%) |
| 3-Person Household | 551 (75.8%) | 176 (24.2%) |
| 4+ Person Household | 1,198 (84.1%) | 227 (15.9%) |
| Total Housing Units | 4,914 (80.4%) | 1,201 (19.6%) |
Occupancy by Educational Attainment in Hayden
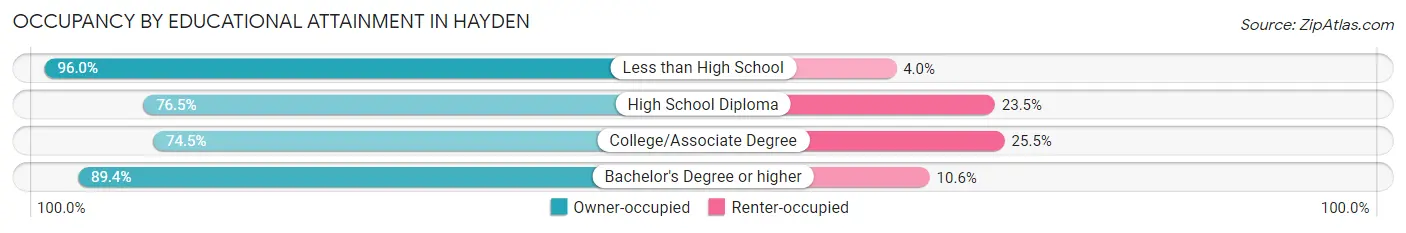
| Household Size | Owner-occupied | Renter-occupied |
| Less than High School | 290 (96.0%) | 12 (4.0%) |
| High School Diploma | 1,232 (76.5%) | 379 (23.5%) |
| College/Associate Degree | 1,825 (74.5%) | 624 (25.5%) |
| Bachelor's Degree or higher | 1,567 (89.4%) | 186 (10.6%) |
Occupancy by Age of Householder in Hayden
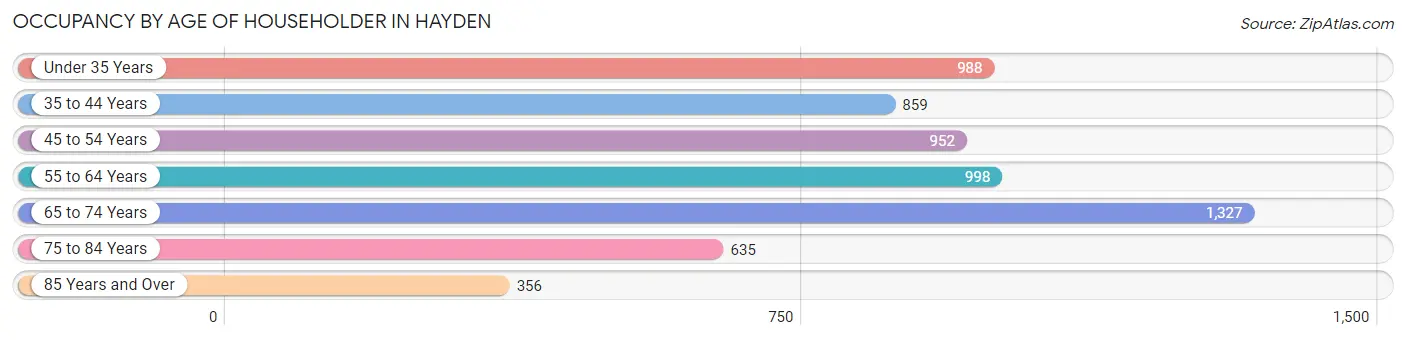
| Age Bracket | # Households | % Households |
| Under 35 Years | 988 | 16.2% |
| 35 to 44 Years | 859 | 14.1% |
| 45 to 54 Years | 952 | 15.6% |
| 55 to 64 Years | 998 | 16.3% |
| 65 to 74 Years | 1,327 | 21.7% |
| 75 to 84 Years | 635 | 10.4% |
| 85 Years and Over | 356 | 5.8% |
| Total | 6,115 | 100.0% |
Housing Finances in Hayden
Median Income by Occupancy in Hayden
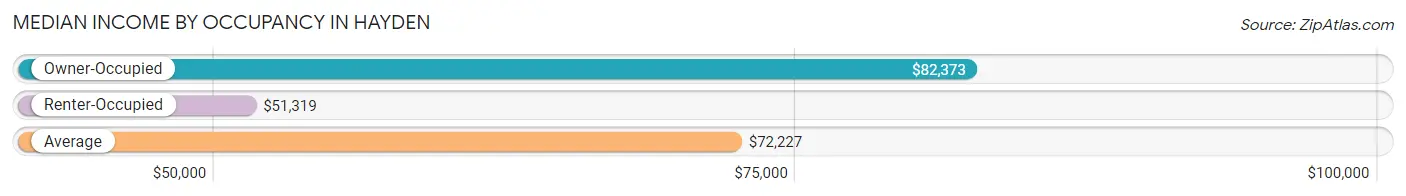
| Occupancy Type | # Households | Median Income |
| Owner-Occupied | 4,914 (80.4%) | $82,373 |
| Renter-Occupied | 1,201 (19.6%) | $51,319 |
| Average | 6,115 (100.0%) | $72,227 |
Occupancy by Householder Income Bracket in Hayden
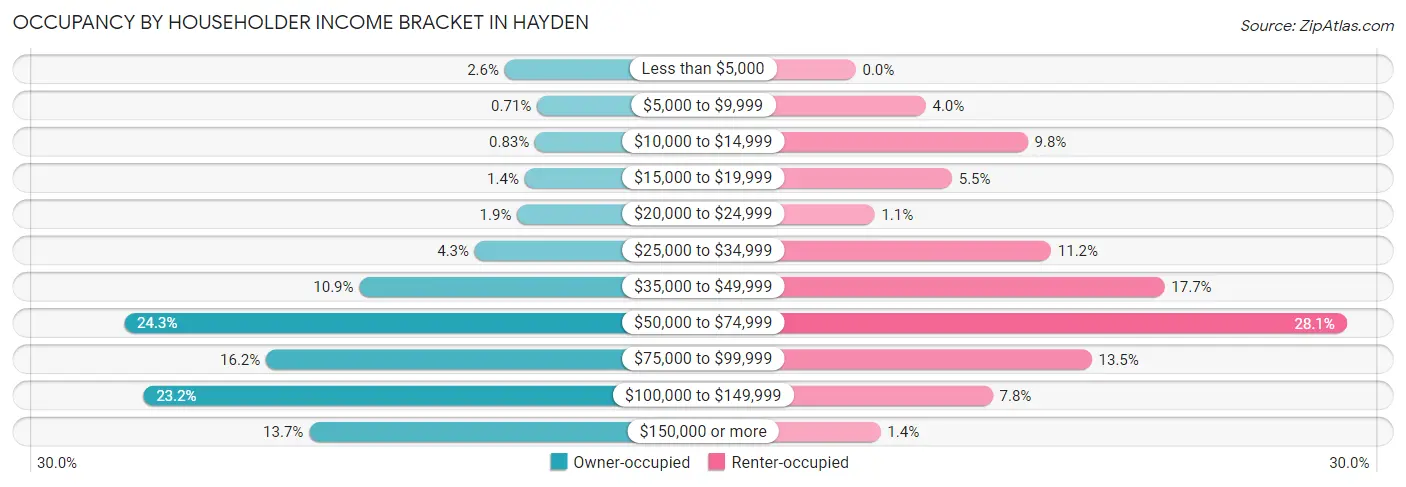
| Income Bracket | Owner-occupied | Renter-occupied |
| Less than $5,000 | 126 (2.6%) | 0 (0.0%) |
| $5,000 to $9,999 | 35 (0.7%) | 48 (4.0%) |
| $10,000 to $14,999 | 41 (0.8%) | 118 (9.8%) |
| $15,000 to $19,999 | 70 (1.4%) | 66 (5.5%) |
| $20,000 to $24,999 | 91 (1.8%) | 13 (1.1%) |
| $25,000 to $34,999 | 210 (4.3%) | 134 (11.2%) |
| $35,000 to $49,999 | 534 (10.9%) | 212 (17.6%) |
| $50,000 to $74,999 | 1,195 (24.3%) | 337 (28.1%) |
| $75,000 to $99,999 | 796 (16.2%) | 162 (13.5%) |
| $100,000 to $149,999 | 1,141 (23.2%) | 94 (7.8%) |
| $150,000 or more | 675 (13.7%) | 17 (1.4%) |
| Total | 4,914 (100.0%) | 1,201 (100.0%) |
Monthly Housing Cost Tiers in Hayden
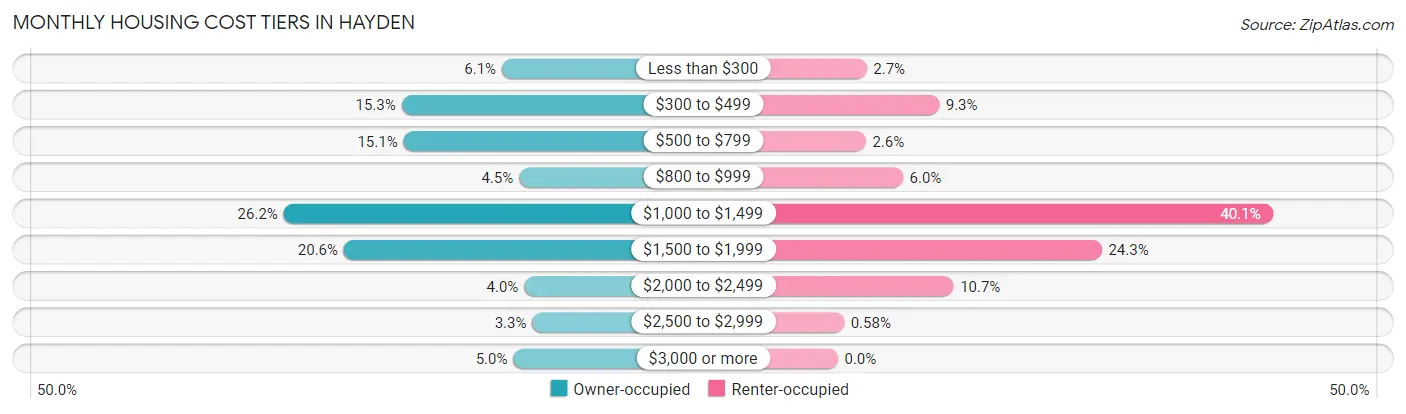
| Monthly Cost | Owner-occupied | Renter-occupied |
| Less than $300 | 298 (6.1%) | 32 (2.7%) |
| $300 to $499 | 752 (15.3%) | 112 (9.3%) |
| $500 to $799 | 743 (15.1%) | 31 (2.6%) |
| $800 to $999 | 220 (4.5%) | 72 (6.0%) |
| $1,000 to $1,499 | 1,285 (26.2%) | 481 (40.1%) |
| $1,500 to $1,999 | 1,013 (20.6%) | 292 (24.3%) |
| $2,000 to $2,499 | 197 (4.0%) | 128 (10.7%) |
| $2,500 to $2,999 | 160 (3.3%) | 7 (0.6%) |
| $3,000 or more | 246 (5.0%) | 0 (0.0%) |
| Total | 4,914 (100.0%) | 1,201 (100.0%) |
Physical Housing Characteristics in Hayden
Housing Structures in Hayden
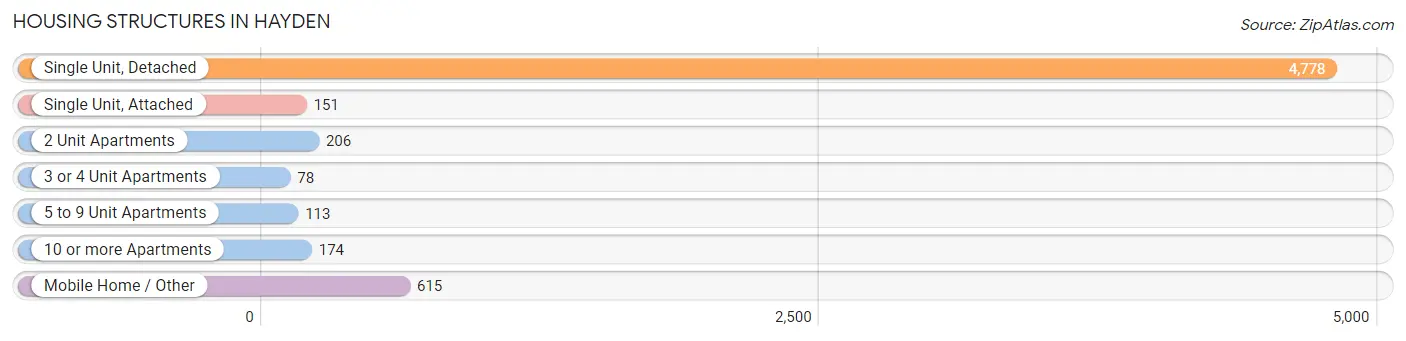
| Structure Type | # Housing Units | % Housing Units |
| Single Unit, Detached | 4,778 | 78.1% |
| Single Unit, Attached | 151 | 2.5% |
| 2 Unit Apartments | 206 | 3.4% |
| 3 or 4 Unit Apartments | 78 | 1.3% |
| 5 to 9 Unit Apartments | 113 | 1.8% |
| 10 or more Apartments | 174 | 2.9% |
| Mobile Home / Other | 615 | 10.1% |
| Total | 6,115 | 100.0% |
Housing Structures by Occupancy in Hayden
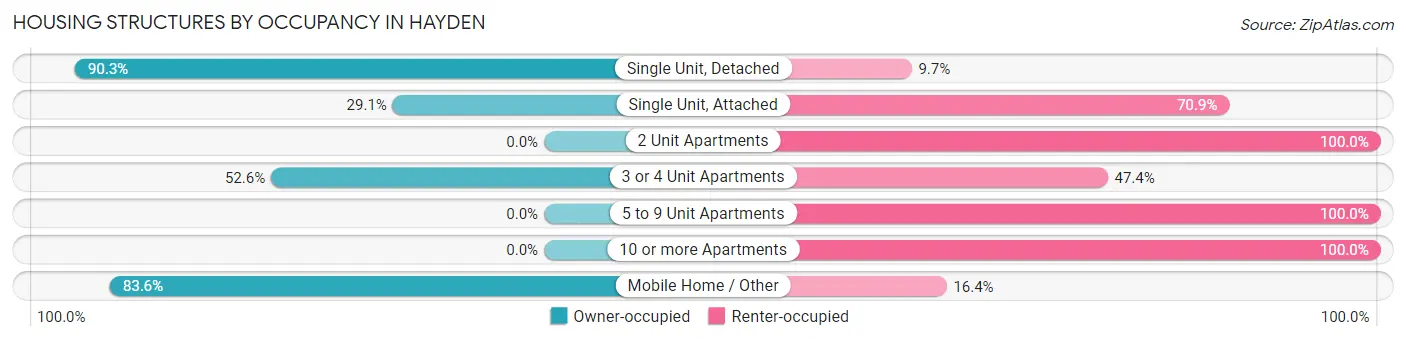
| Structure Type | Owner-occupied | Renter-occupied |
| Single Unit, Detached | 4,315 (90.3%) | 463 (9.7%) |
| Single Unit, Attached | 44 (29.1%) | 107 (70.9%) |
| 2 Unit Apartments | 0 (0.0%) | 206 (100.0%) |
| 3 or 4 Unit Apartments | 41 (52.6%) | 37 (47.4%) |
| 5 to 9 Unit Apartments | 0 (0.0%) | 113 (100.0%) |
| 10 or more Apartments | 0 (0.0%) | 174 (100.0%) |
| Mobile Home / Other | 514 (83.6%) | 101 (16.4%) |
| Total | 4,914 (80.4%) | 1,201 (19.6%) |
Housing Structures by Number of Rooms in Hayden
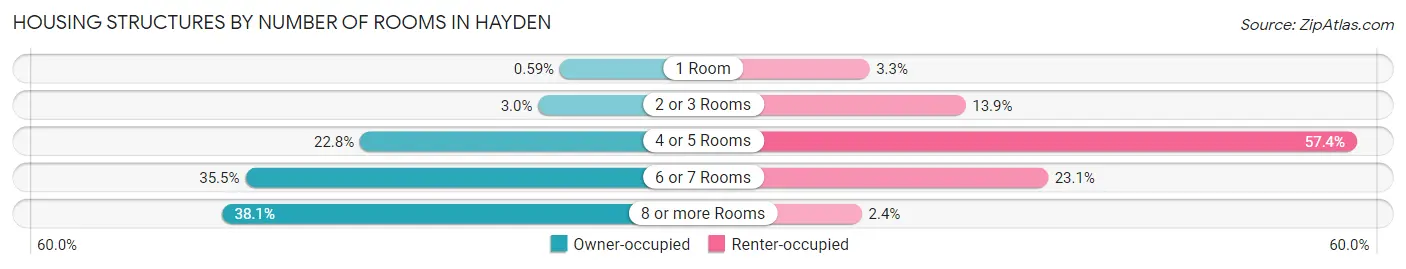
| Number of Rooms | Owner-occupied | Renter-occupied |
| 1 Room | 29 (0.6%) | 39 (3.3%) |
| 2 or 3 Rooms | 147 (3.0%) | 167 (13.9%) |
| 4 or 5 Rooms | 1,119 (22.8%) | 689 (57.4%) |
| 6 or 7 Rooms | 1,745 (35.5%) | 277 (23.1%) |
| 8 or more Rooms | 1,874 (38.1%) | 29 (2.4%) |
| Total | 4,914 (100.0%) | 1,201 (100.0%) |
Housing Structure by Heating Type in Hayden
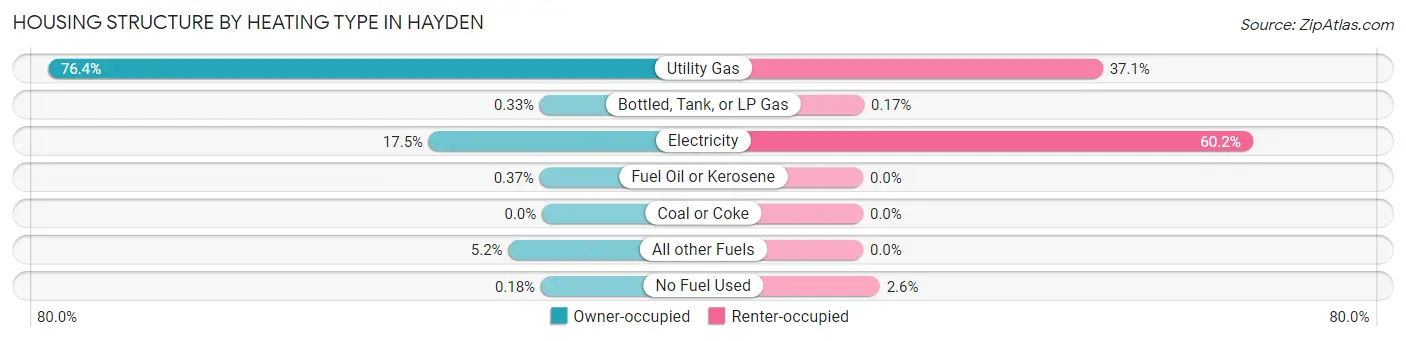
| Heating Type | Owner-occupied | Renter-occupied |
| Utility Gas | 3,755 (76.4%) | 445 (37.0%) |
| Bottled, Tank, or LP Gas | 16 (0.3%) | 2 (0.2%) |
| Electricity | 860 (17.5%) | 723 (60.2%) |
| Fuel Oil or Kerosene | 18 (0.4%) | 0 (0.0%) |
| Coal or Coke | 0 (0.0%) | 0 (0.0%) |
| All other Fuels | 256 (5.2%) | 0 (0.0%) |
| No Fuel Used | 9 (0.2%) | 31 (2.6%) |
| Total | 4,914 (100.0%) | 1,201 (100.0%) |
Household Vehicle Usage in Hayden
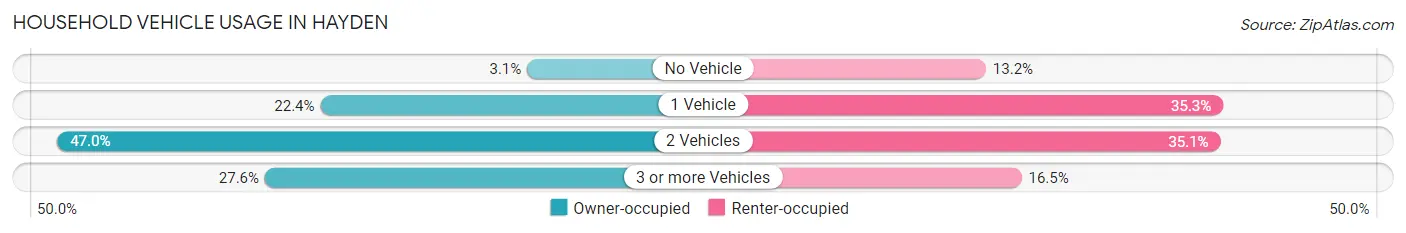
| Vehicles per Household | Owner-occupied | Renter-occupied |
| No Vehicle | 152 (3.1%) | 158 (13.2%) |
| 1 Vehicle | 1,100 (22.4%) | 424 (35.3%) |
| 2 Vehicles | 2,307 (46.9%) | 421 (35.0%) |
| 3 or more Vehicles | 1,355 (27.6%) | 198 (16.5%) |
| Total | 4,914 (100.0%) | 1,201 (100.0%) |
Real Estate & Mortgages in Hayden
Real Estate and Mortgage Overview in Hayden
| Characteristic | Without Mortgage | With Mortgage |
| Housing Units | 1,753 | 3,161 |
| Median Property Value | $366,800 | $385,900 |
| Median Household Income | $68,411 | $415 |
| Monthly Housing Costs | $474 | $246 |
| Real Estate Taxes | $1,496 | $210 |
Property Value by Mortgage Status in Hayden
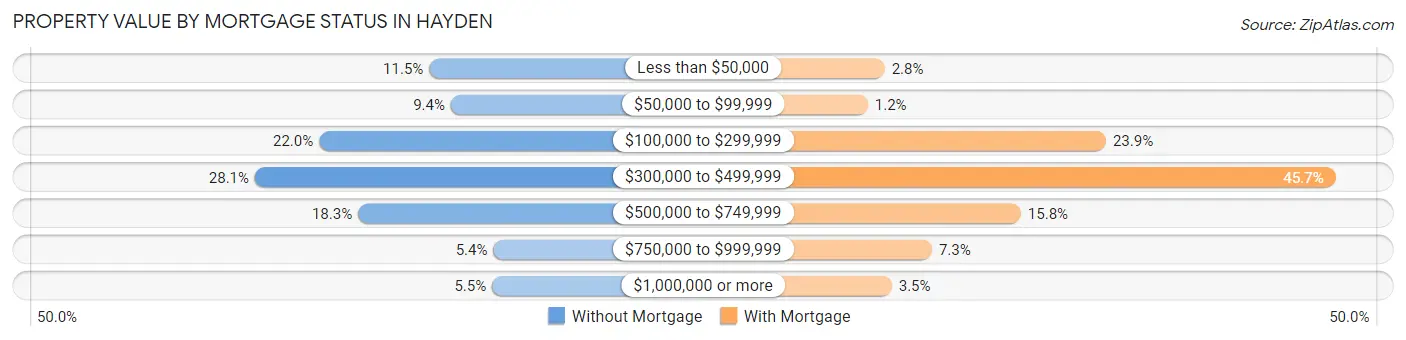
| Property Value | Without Mortgage | With Mortgage |
| Less than $50,000 | 201 (11.5%) | 88 (2.8%) |
| $50,000 to $99,999 | 165 (9.4%) | 37 (1.2%) |
| $100,000 to $299,999 | 385 (22.0%) | 754 (23.8%) |
| $300,000 to $499,999 | 492 (28.1%) | 1,445 (45.7%) |
| $500,000 to $749,999 | 320 (18.2%) | 498 (15.8%) |
| $750,000 to $999,999 | 94 (5.4%) | 230 (7.3%) |
| $1,000,000 or more | 96 (5.5%) | 109 (3.5%) |
| Total | 1,753 (100.0%) | 3,161 (100.0%) |
Household Income by Mortgage Status in Hayden
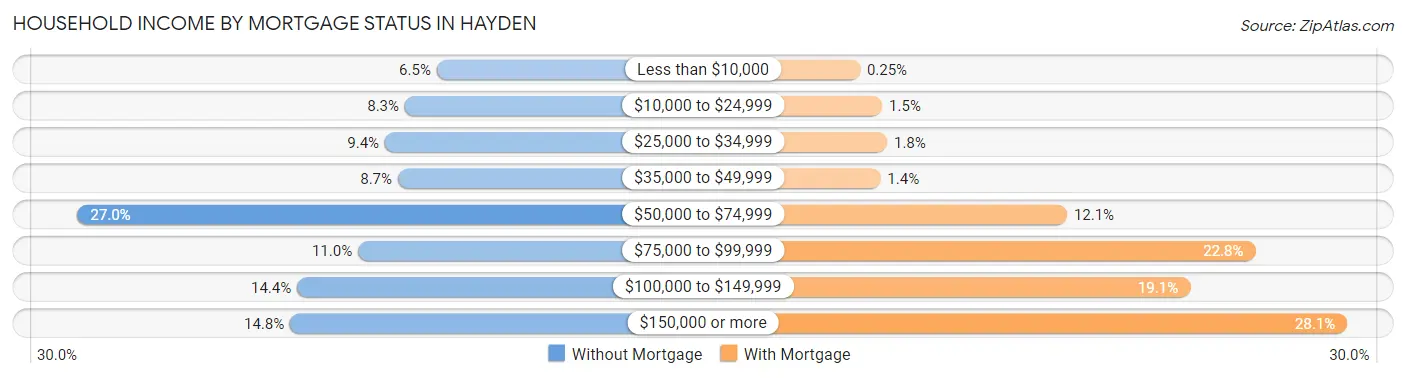
| Household Income | Without Mortgage | With Mortgage |
| Less than $10,000 | 113 (6.5%) | 8 (0.3%) |
| $10,000 to $24,999 | 145 (8.3%) | 48 (1.5%) |
| $25,000 to $34,999 | 165 (9.4%) | 57 (1.8%) |
| $35,000 to $49,999 | 152 (8.7%) | 45 (1.4%) |
| $50,000 to $74,999 | 473 (27.0%) | 382 (12.1%) |
| $75,000 to $99,999 | 192 (11.0%) | 722 (22.8%) |
| $100,000 to $149,999 | 253 (14.4%) | 604 (19.1%) |
| $150,000 or more | 260 (14.8%) | 888 (28.1%) |
| Total | 1,753 (100.0%) | 3,161 (100.0%) |
Property Value to Household Income Ratio in Hayden
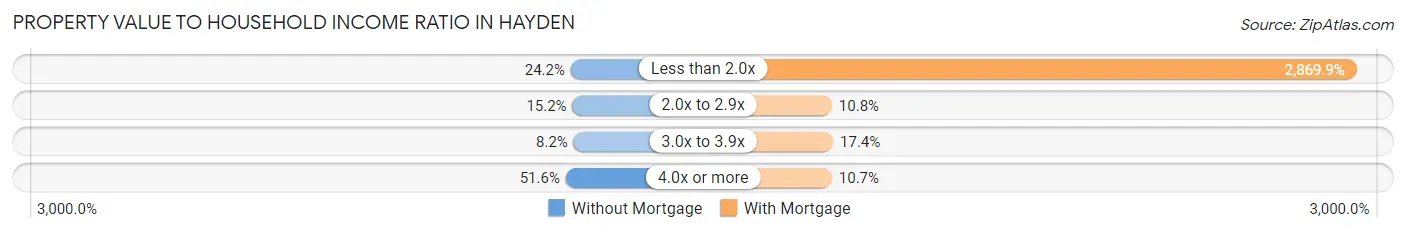
| Value-to-Income Ratio | Without Mortgage | With Mortgage |
| Less than 2.0x | 424 (24.2%) | 90,716 (2,869.8%) |
| 2.0x to 2.9x | 266 (15.2%) | 342 (10.8%) |
| 3.0x to 3.9x | 144 (8.2%) | 549 (17.4%) |
| 4.0x or more | 905 (51.6%) | 338 (10.7%) |
| Total | 1,753 (100.0%) | 3,161 (100.0%) |
Real Estate Taxes by Mortgage Status in Hayden
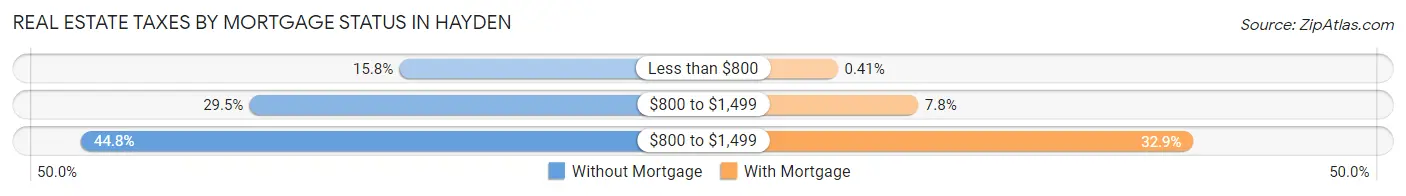
| Property Taxes | Without Mortgage | With Mortgage |
| Less than $800 | 277 (15.8%) | 13 (0.4%) |
| $800 to $1,499 | 517 (29.5%) | 245 (7.7%) |
| $800 to $1,499 | 786 (44.8%) | 1,040 (32.9%) |
| Total | 1,753 (100.0%) | 3,161 (100.0%) |
Health & Disability in Hayden
Health Insurance Coverage by Age in Hayden
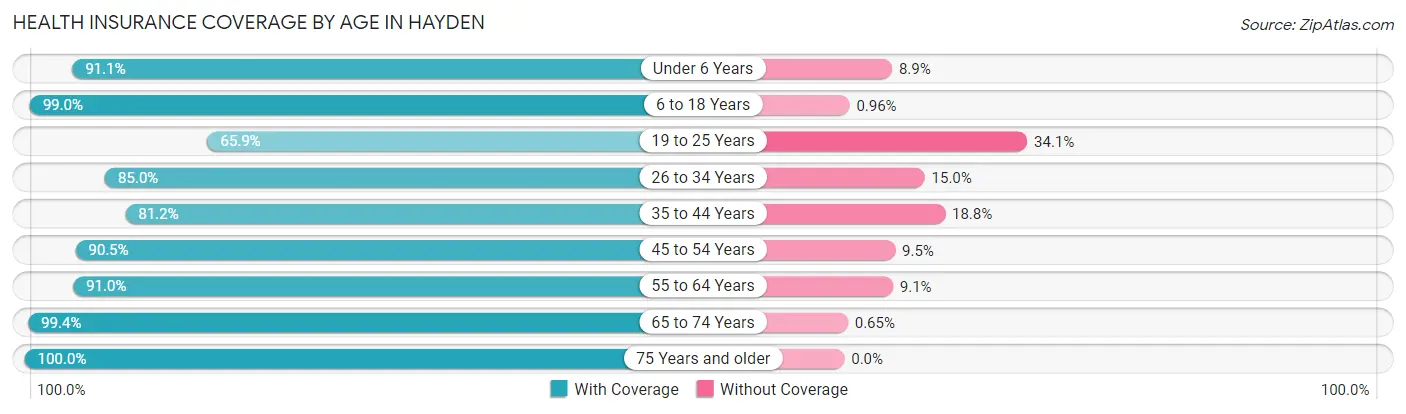
| Age Bracket | With Coverage | Without Coverage |
| Under 6 Years | 1,107 (91.1%) | 108 (8.9%) |
| 6 to 18 Years | 2,261 (99.0%) | 22 (1.0%) |
| 19 to 25 Years | 941 (65.9%) | 487 (34.1%) |
| 26 to 34 Years | 1,232 (85.0%) | 217 (15.0%) |
| 35 to 44 Years | 1,586 (81.2%) | 367 (18.8%) |
| 45 to 54 Years | 1,606 (90.5%) | 168 (9.5%) |
| 55 to 64 Years | 1,639 (90.9%) | 163 (9.0%) |
| 65 to 74 Years | 2,154 (99.4%) | 14 (0.6%) |
| 75 Years and older | 1,512 (100.0%) | 0 (0.0%) |
| Total | 14,038 (90.1%) | 1,546 (9.9%) |
Health Insurance Coverage by Citizenship Status in Hayden
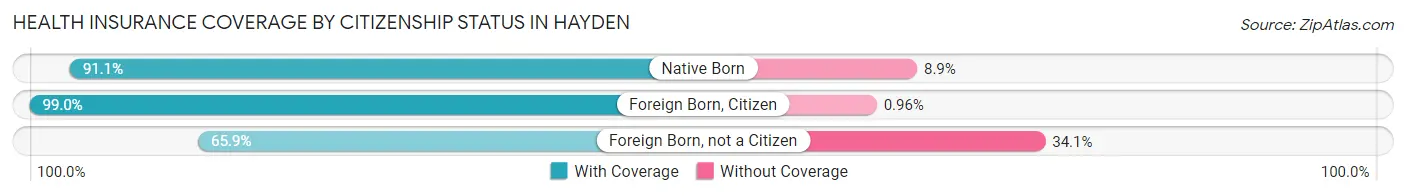
| Citizenship Status | With Coverage | Without Coverage |
| Native Born | 1,107 (91.1%) | 108 (8.9%) |
| Foreign Born, Citizen | 2,261 (99.0%) | 22 (1.0%) |
| Foreign Born, not a Citizen | 941 (65.9%) | 487 (34.1%) |
Health Insurance Coverage by Household Income in Hayden
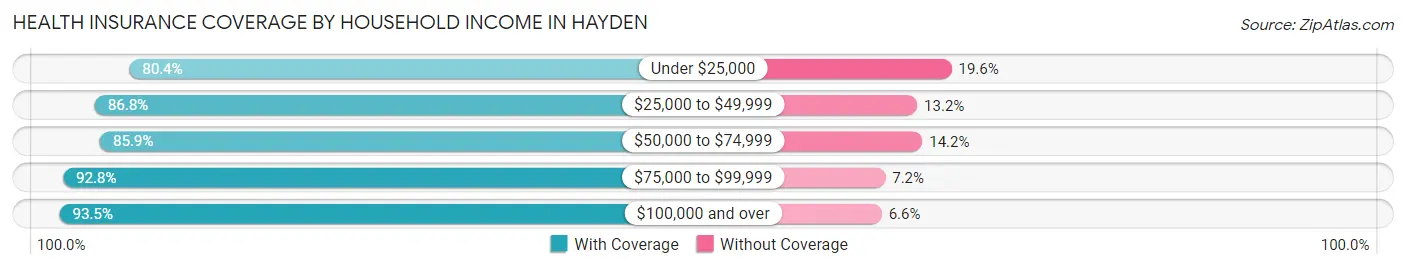
| Household Income | With Coverage | Without Coverage |
| Under $25,000 | 700 (80.4%) | 171 (19.6%) |
| $25,000 to $49,999 | 1,693 (86.8%) | 257 (13.2%) |
| $50,000 to $74,999 | 2,893 (85.9%) | 477 (14.1%) |
| $75,000 to $99,999 | 2,510 (92.8%) | 195 (7.2%) |
| $100,000 and over | 6,175 (93.4%) | 433 (6.6%) |
Public vs Private Health Insurance Coverage by Age in Hayden
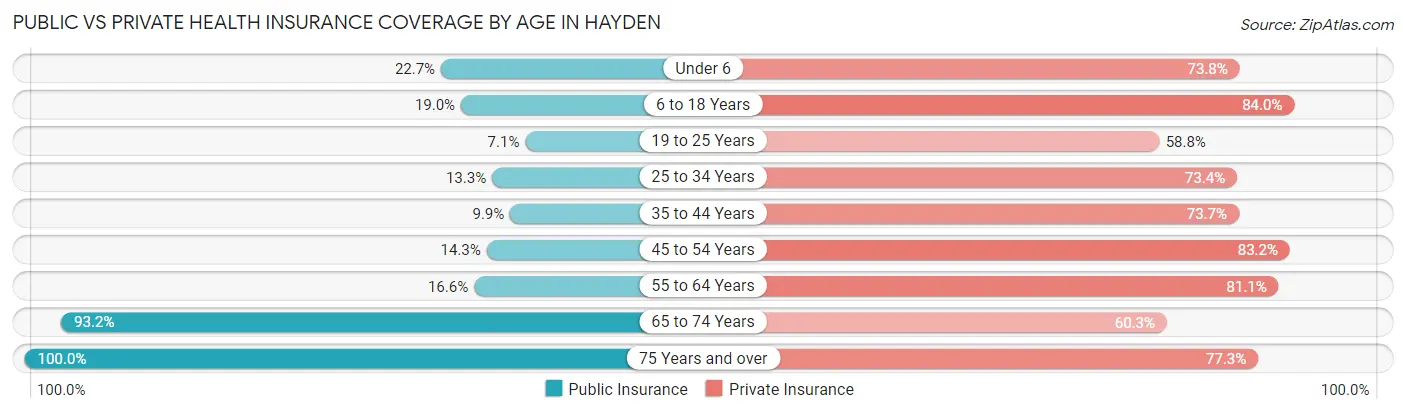
| Age Bracket | Public Insurance | Private Insurance |
| Under 6 | 276 (22.7%) | 897 (73.8%) |
| 6 to 18 Years | 434 (19.0%) | 1,917 (84.0%) |
| 19 to 25 Years | 101 (7.1%) | 840 (58.8%) |
| 25 to 34 Years | 192 (13.3%) | 1,063 (73.4%) |
| 35 to 44 Years | 193 (9.9%) | 1,439 (73.7%) |
| 45 to 54 Years | 253 (14.3%) | 1,475 (83.2%) |
| 55 to 64 Years | 299 (16.6%) | 1,461 (81.1%) |
| 65 to 74 Years | 2,021 (93.2%) | 1,308 (60.3%) |
| 75 Years and over | 1,512 (100.0%) | 1,168 (77.2%) |
| Total | 5,281 (33.9%) | 11,568 (74.2%) |
Disability Status by Sex by Age in Hayden
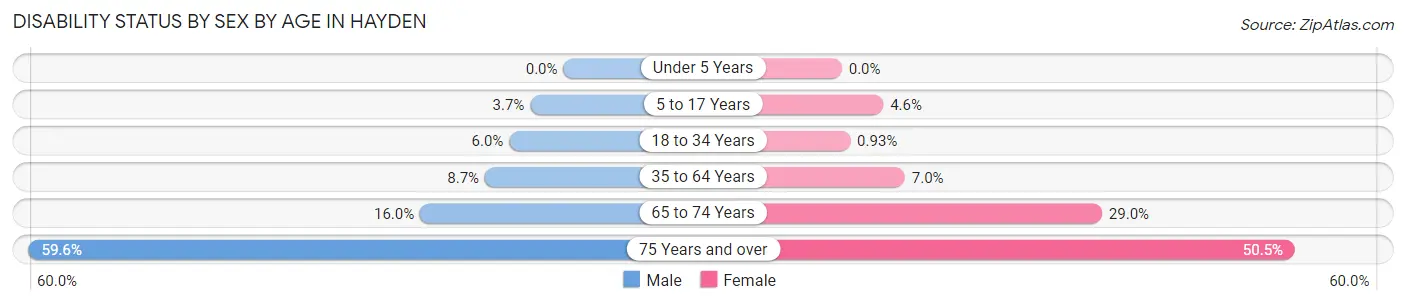
| Age Bracket | Male | Female |
| Under 5 Years | 0 (0.0%) | 0 (0.0%) |
| 5 to 17 Years | 52 (3.7%) | 51 (4.6%) |
| 18 to 34 Years | 82 (6.0%) | 15 (0.9%) |
| 35 to 64 Years | 229 (8.7%) | 204 (7.0%) |
| 65 to 74 Years | 151 (16.0%) | 354 (29.0%) |
| 75 Years and over | 380 (59.6%) | 441 (50.5%) |
Disability Class by Sex by Age in Hayden
Disability Class: Hearing Difficulty
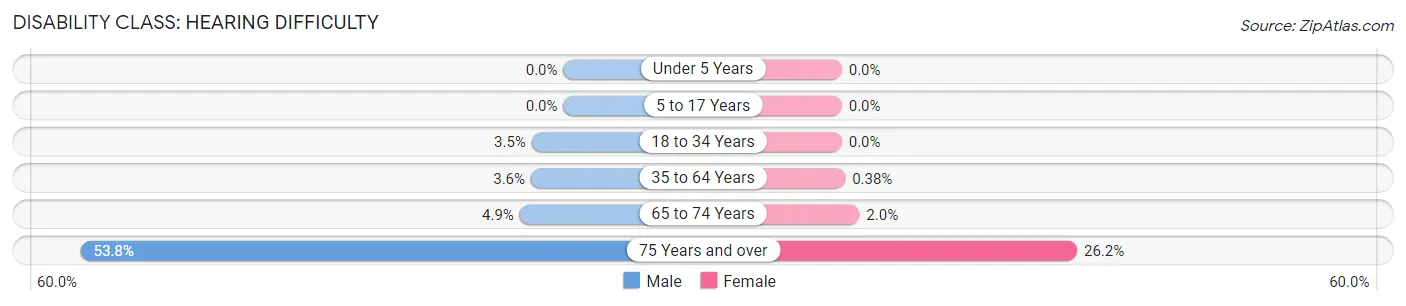
| Age Bracket | Male | Female |
| Under 5 Years | 0 (0.0%) | 0 (0.0%) |
| 5 to 17 Years | 0 (0.0%) | 0 (0.0%) |
| 18 to 34 Years | 48 (3.5%) | 0 (0.0%) |
| 35 to 64 Years | 95 (3.6%) | 11 (0.4%) |
| 65 to 74 Years | 46 (4.9%) | 24 (2.0%) |
| 75 Years and over | 343 (53.8%) | 229 (26.2%) |
Disability Class: Vision Difficulty
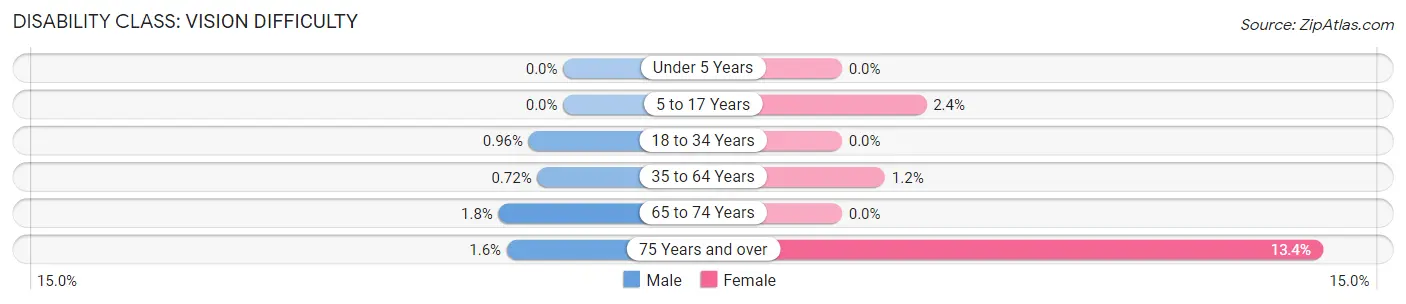
| Age Bracket | Male | Female |
| Under 5 Years | 0 (0.0%) | 0 (0.0%) |
| 5 to 17 Years | 0 (0.0%) | 26 (2.4%) |
| 18 to 34 Years | 13 (1.0%) | 0 (0.0%) |
| 35 to 64 Years | 19 (0.7%) | 35 (1.2%) |
| 65 to 74 Years | 17 (1.8%) | 0 (0.0%) |
| 75 Years and over | 10 (1.6%) | 117 (13.4%) |
Disability Class: Cognitive Difficulty
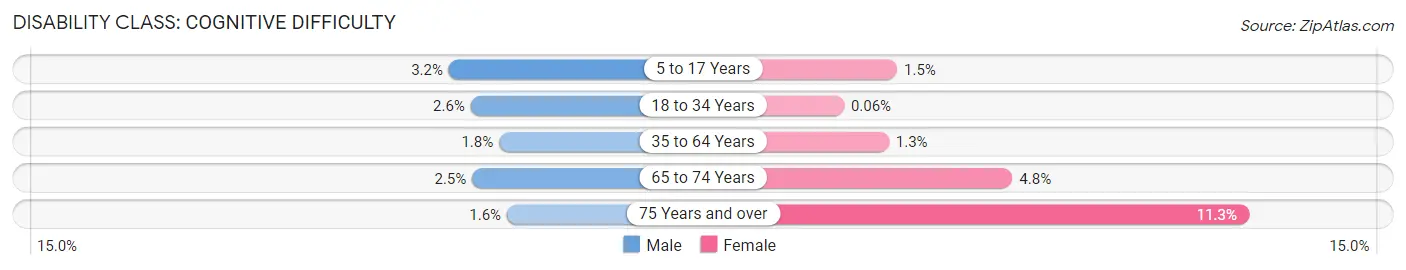
| Age Bracket | Male | Female |
| 5 to 17 Years | 45 (3.2%) | 17 (1.5%) |
| 18 to 34 Years | 35 (2.6%) | 1 (0.1%) |
| 35 to 64 Years | 47 (1.8%) | 38 (1.3%) |
| 65 to 74 Years | 24 (2.5%) | 58 (4.8%) |
| 75 Years and over | 10 (1.6%) | 99 (11.3%) |
Disability Class: Ambulatory Difficulty
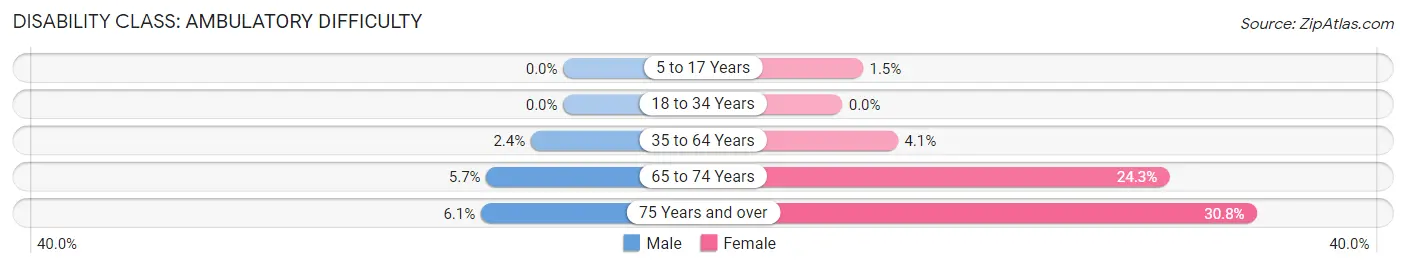
| Age Bracket | Male | Female |
| 5 to 17 Years | 0 (0.0%) | 17 (1.5%) |
| 18 to 34 Years | 0 (0.0%) | 0 (0.0%) |
| 35 to 64 Years | 63 (2.4%) | 120 (4.1%) |
| 65 to 74 Years | 54 (5.7%) | 297 (24.3%) |
| 75 Years and over | 39 (6.1%) | 269 (30.8%) |
Disability Class: Self-Care Difficulty
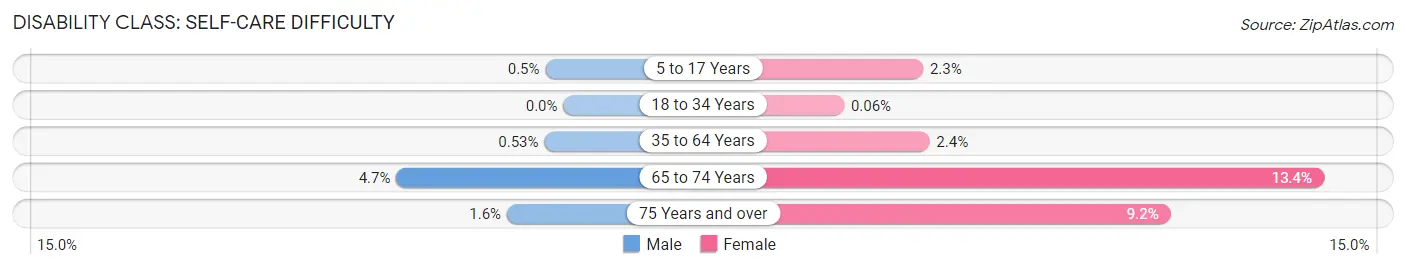
| Age Bracket | Male | Female |
| 5 to 17 Years | 7 (0.5%) | 25 (2.3%) |
| 18 to 34 Years | 0 (0.0%) | 1 (0.1%) |
| 35 to 64 Years | 14 (0.5%) | 71 (2.4%) |
| 65 to 74 Years | 44 (4.6%) | 164 (13.4%) |
| 75 Years and over | 10 (1.6%) | 80 (9.1%) |
Technology Access in Hayden
Computing Device Access in Hayden
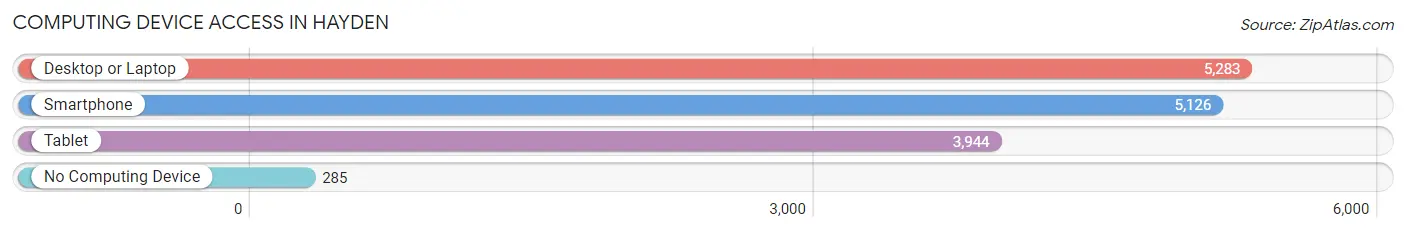
| Device Type | # Households | % Households |
| Desktop or Laptop | 5,283 | 86.4% |
| Smartphone | 5,126 | 83.8% |
| Tablet | 3,944 | 64.5% |
| No Computing Device | 285 | 4.7% |
| Total | 6,115 | 100.0% |
Internet Access in Hayden
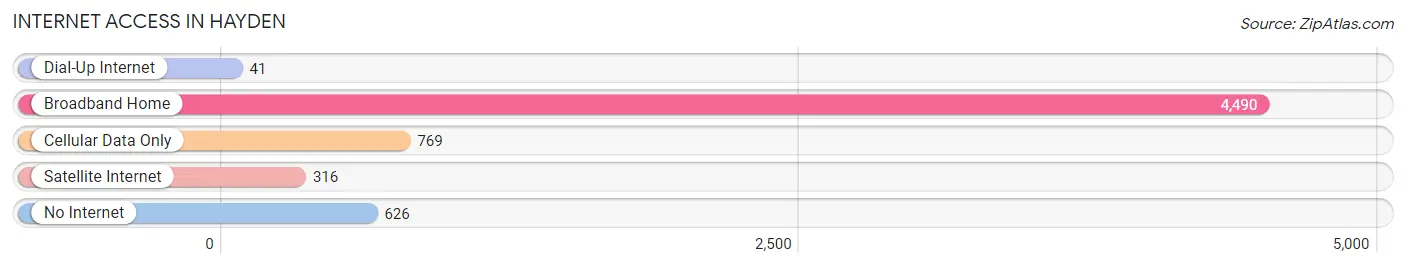
| Internet Type | # Households | % Households |
| Dial-Up Internet | 41 | 0.7% |
| Broadband Home | 4,490 | 73.4% |
| Cellular Data Only | 769 | 12.6% |
| Satellite Internet | 316 | 5.2% |
| No Internet | 626 | 10.2% |
| Total | 6,115 | 100.0% |
Hayden Summary
Hayden, Idaho is a small city located in Kootenai County, in the northern part of the state. It is situated on the Spokane River, near the Washington border. The city was founded in 1883 and incorporated in 1941. As of the 2010 census, the population of Hayden was 13,294.
Geography
Hayden is located in the northern part of Idaho, in Kootenai County. It is situated on the Spokane River, near the Washington border. The city is bordered by Coeur d'Alene to the east, Post Falls to the south, and Rathdrum to the west. The city covers an area of 8.3 square miles, with a population density of 1,611 people per square mile.
The terrain of Hayden is mostly flat, with some rolling hills. The city is located in a temperate climate zone, with hot summers and cold winters. The average annual temperature is around 50 degrees Fahrenheit.
Economy
The economy of Hayden is largely based on agriculture and tourism. The city is home to several large farms, which produce a variety of crops, including potatoes, wheat, and hay. The city is also home to several tourist attractions, including the Coeur d'Alene Resort and Casino, Silverwood Theme Park, and the Hayden Lake Country Club.
The city is also home to several manufacturing companies, including the Hayden Manufacturing Company, which produces a variety of products, including furniture, cabinets, and doors. The city is also home to several technology companies, including the software company, Intuit.
Demographics
As of the 2010 census, the population of Hayden was 13,294. The racial makeup of the city was 94.3% White, 0.7% African American, 0.7% Native American, 0.7% Asian, 0.2% Pacific Islander, 1.2% from other races, and 2.1% from two or more races. Hispanic or Latino of any race were 4.2% of the population.
The median income for a household in the city was $45,945, and the median income for a family was $51,945. The per capita income for the city was $21,945. About 8.3% of families and 10.2% of the population were below the poverty line, including 14.2% of those under age 18 and 6.2% of those age 65 or over.
The largest employers in the city are the Coeur d'Alene Resort and Casino, the Hayden Manufacturing Company, and the Intuit software company. The city is also home to several schools, including the Hayden Lake Country Club, the Hayden High School, and the Hayden Middle School.
Common Questions
What is Per Capita Income in Hayden?
Per Capita income in Hayden is $35,646.
What is the Median Family Income in Hayden?
Median Family Income in Hayden is $86,931.
What is the Median Household income in Hayden?
Median Household Income in Hayden is $72,227.
What is Income or Wage Gap in Hayden?
Income or Wage Gap in Hayden is 43.6%.
Women in Hayden earn 56.4 cents for every dollar earned by a man.
What is Inequality or Gini Index in Hayden?
Inequality or Gini Index in Hayden is 0.39.
What is the Total Population of Hayden?
Total Population of Hayden is 15,703.
What is the Total Male Population of Hayden?
Total Male Population of Hayden is 7,507.
What is the Total Female Population of Hayden?
Total Female Population of Hayden is 8,196.
What is the Ratio of Males per 100 Females in Hayden?
There are 91.59 Males per 100 Females in Hayden.
What is the Ratio of Females per 100 Males in Hayden?
There are 109.18 Females per 100 Males in Hayden.
What is the Median Population Age in Hayden?
Median Population Age in Hayden is 42.4 Years.
What is the Average Family Size in Hayden
Average Family Size in Hayden is 3.0 People.
What is the Average Household Size in Hayden
Average Household Size in Hayden is 2.5 People.
How Large is the Labor Force in Hayden?
There are 7,621 People in the Labor Forcein in Hayden.
What is the Percentage of People in the Labor Force in Hayden?
60.0% of People are in the Labor Force in Hayden.
What is the Unemployment Rate in Hayden?
Unemployment Rate in Hayden is 3.7%.