Nanwalek, AK Map & Demographics
Nanwalek Map
Nanwalek Overview
$19,328
PER CAPITA INCOME
$58,750
AVG FAMILY INCOME
$58,000
AVG HOUSEHOLD INCOME
0.28
INEQUALITY / GINI INDEX
172
TOTAL POPULATION
58
MALE POPULATION
114
FEMALE POPULATION
50.88
MALES / 100 FEMALES
196.55
FEMALES / 100 MALES
39.3
MEDIAN AGE
4.7
AVG FAMILY SIZE
4.5
AVG HOUSEHOLD SIZE
71
LABOR FORCE [ PEOPLE ]
52.2%
PERCENT IN LABOR FORCE
Nanwalek Area Codes
Income in Nanwalek
Income Overview in Nanwalek
Per Capita Income in Nanwalek is $19,328, while median incomes of families and households are $58,750 and $58,000 respectively.
| Characteristic | Number | Measure |
| Per Capita Income | 172 | $19,328 |
| Median Family Income | 35 | $58,750 |
| Mean Family Income | 35 | $62,614 |
| Median Household Income | 38 | $58,000 |
| Mean Household Income | 38 | $59,416 |
| Income Deficit | 35 | $0 |
| Wage / Income Gap (%) | 172 | 0.00% |
| Wage / Income Gap ($) | 172 | 100.00¢ per $1 |
| Gini / Inequality Index | 172 | 0.28 |
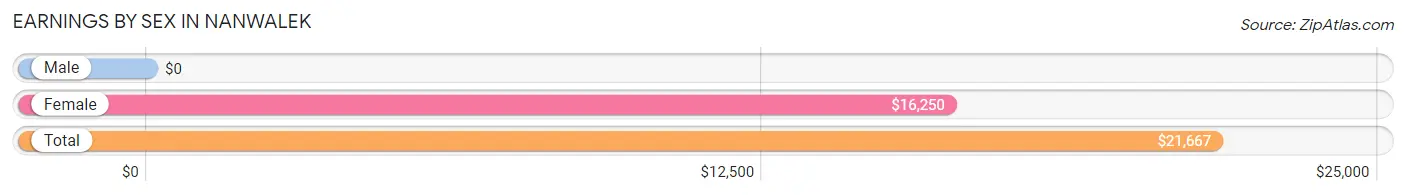
Earnings by Sex in Nanwalek
| Sex | Number | Average Earnings |
| Male | 33 (42.3%) | $0 |
| Female | 45 (57.7%) | $16,250 |
| Total | 78 (100.0%) | $21,667 |
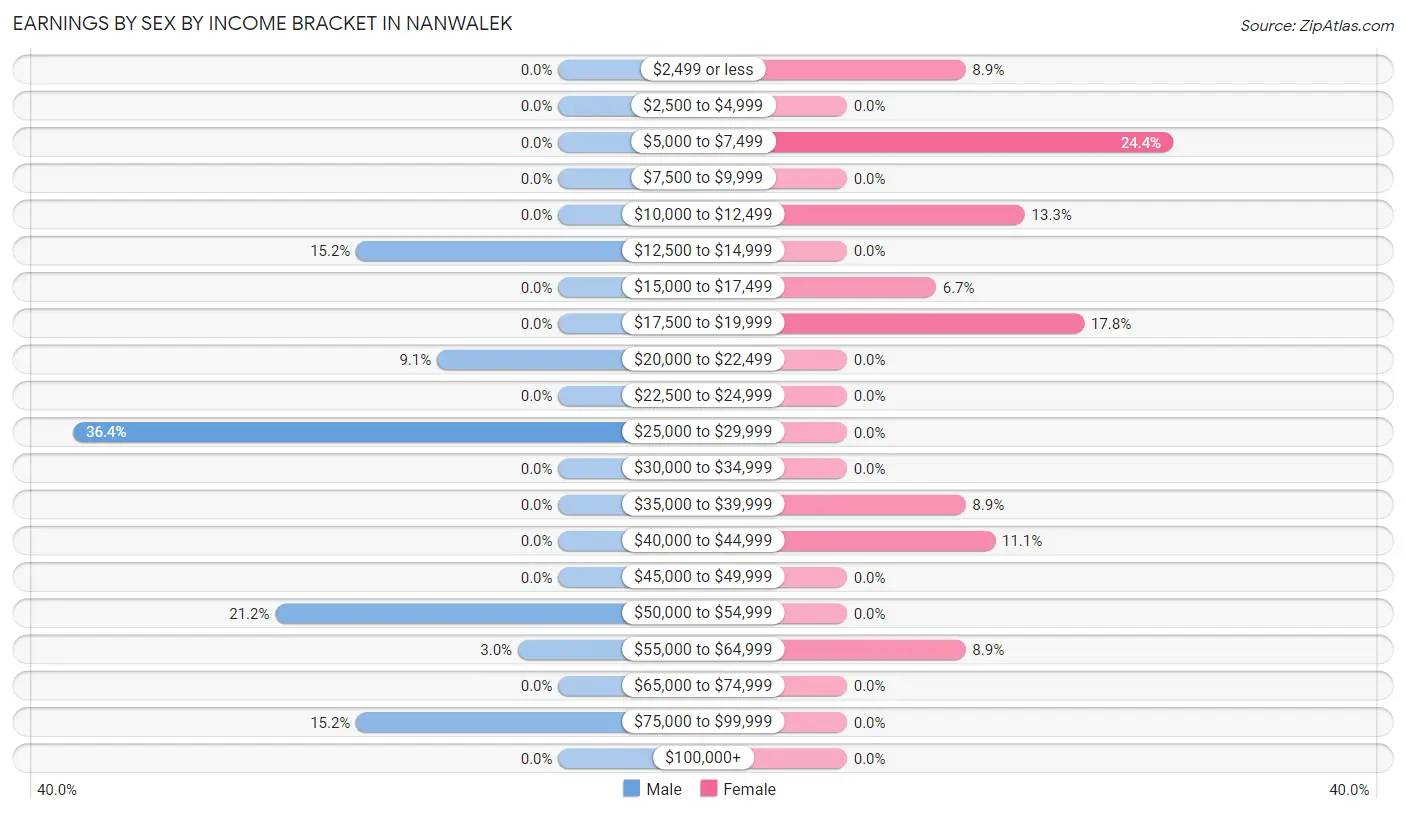
Earnings by Sex by Income Bracket in Nanwalek
The most common earnings brackets in Nanwalek are $25,000 to $29,999 for men (12 | 36.4%) and $5,000 to $7,499 for women (11 | 24.4%).
| Income | Male | Female |
| $2,499 or less | 0 (0.0%) | 4 (8.9%) |
| $2,500 to $4,999 | 0 (0.0%) | 0 (0.0%) |
| $5,000 to $7,499 | 0 (0.0%) | 11 (24.4%) |
| $7,500 to $9,999 | 0 (0.0%) | 0 (0.0%) |
| $10,000 to $12,499 | 0 (0.0%) | 6 (13.3%) |
| $12,500 to $14,999 | 5 (15.1%) | 0 (0.0%) |
| $15,000 to $17,499 | 0 (0.0%) | 3 (6.7%) |
| $17,500 to $19,999 | 0 (0.0%) | 8 (17.8%) |
| $20,000 to $22,499 | 3 (9.1%) | 0 (0.0%) |
| $22,500 to $24,999 | 0 (0.0%) | 0 (0.0%) |
| $25,000 to $29,999 | 12 (36.4%) | 0 (0.0%) |
| $30,000 to $34,999 | 0 (0.0%) | 0 (0.0%) |
| $35,000 to $39,999 | 0 (0.0%) | 4 (8.9%) |
| $40,000 to $44,999 | 0 (0.0%) | 5 (11.1%) |
| $45,000 to $49,999 | 0 (0.0%) | 0 (0.0%) |
| $50,000 to $54,999 | 7 (21.2%) | 0 (0.0%) |
| $55,000 to $64,999 | 1 (3.0%) | 4 (8.9%) |
| $65,000 to $74,999 | 0 (0.0%) | 0 (0.0%) |
| $75,000 to $99,999 | 5 (15.1%) | 0 (0.0%) |
| $100,000+ | 0 (0.0%) | 0 (0.0%) |
| Total | 33 (100.0%) | 45 (100.0%) |
Earnings by Sex by Educational Attainment in Nanwalek
| Educational Attainment | Male Income | Female Income |
| Less than High School | - | - |
| High School Diploma | - | - |
| College or Associate's Degree | - | - |
| Bachelor's Degree | - | - |
| Graduate Degree | - | - |
| Total | $51,563 | $0 |
Family Income in Nanwalek
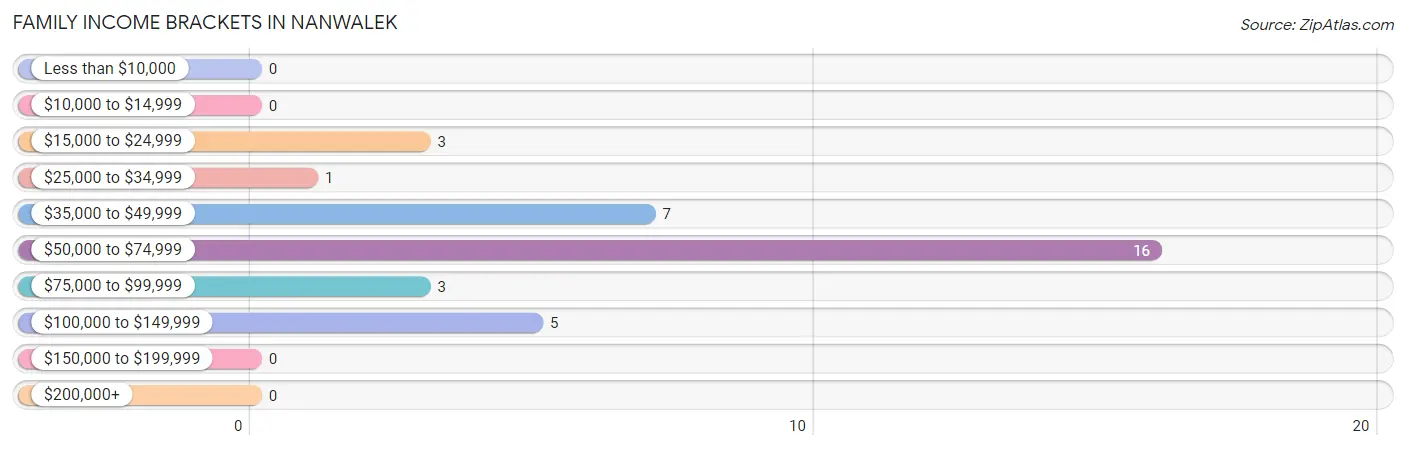
Family Income Brackets in Nanwalek
According to the Nanwalek family income data, there are 16 families falling into the $50,000 to $74,999 income range, which is the most common income bracket and makes up 45.7% of all families.
| Income Bracket | # Families | % Families |
| Less than $10,000 | 0 | 0.0% |
| $10,000 to $14,999 | 0 | 0.0% |
| $15,000 to $24,999 | 3 | 8.6% |
| $25,000 to $34,999 | 1 | 2.9% |
| $35,000 to $49,999 | 7 | 20.0% |
| $50,000 to $74,999 | 16 | 45.7% |
| $75,000 to $99,999 | 3 | 8.6% |
| $100,000 to $149,999 | 5 | 14.3% |
| $150,000 to $199,999 | 0 | 0.0% |
| $200,000+ | 0 | 0.0% |
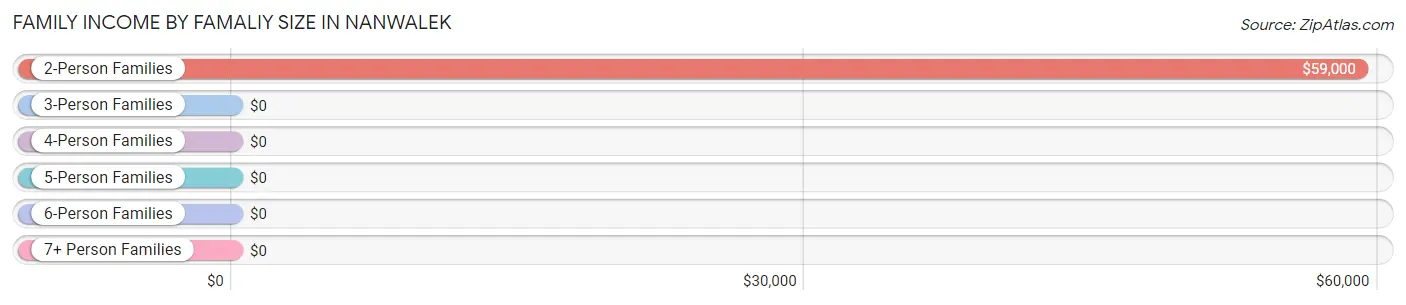
Family Income by Famaliy Size in Nanwalek
2-person families (22 | 62.9%) account for the highest median family income in Nanwalek with $59,000 per family, while 2-person families (22 | 62.9%) have the highest median income of $29,500 per family member.
| Income Bracket | # Families | Median Income |
| 2-Person Families | 22 (62.9%) | $59,000 |
| 3-Person Families | 2 (5.7%) | $0 |
| 4-Person Families | 3 (8.6%) | $0 |
| 5-Person Families | 4 (11.4%) | $0 |
| 6-Person Families | 0 (0.0%) | $0 |
| 7+ Person Families | 4 (11.4%) | $0 |
| Total | 35 (100.0%) | $58,750 |
Family Income by Number of Earners in Nanwalek
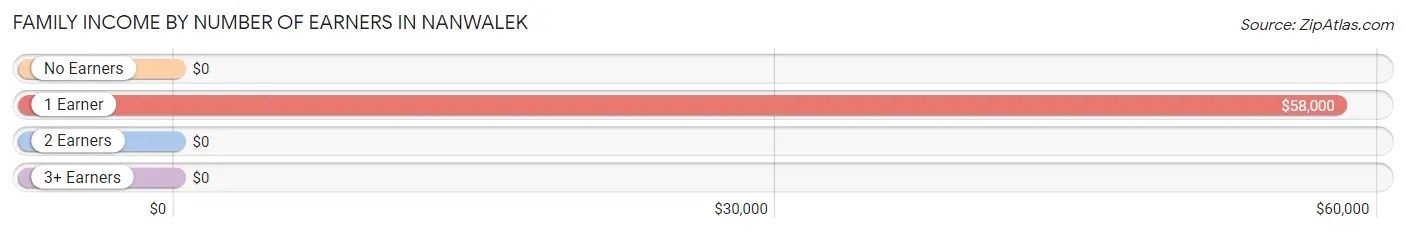
| Number of Earners | # Families | Median Income |
| No Earners | 5 (14.3%) | $0 |
| 1 Earner | 22 (62.9%) | $58,000 |
| 2 Earners | 6 (17.1%) | $0 |
| 3+ Earners | 2 (5.7%) | $0 |
| Total | 35 (100.0%) | $58,750 |
Household Income in Nanwalek
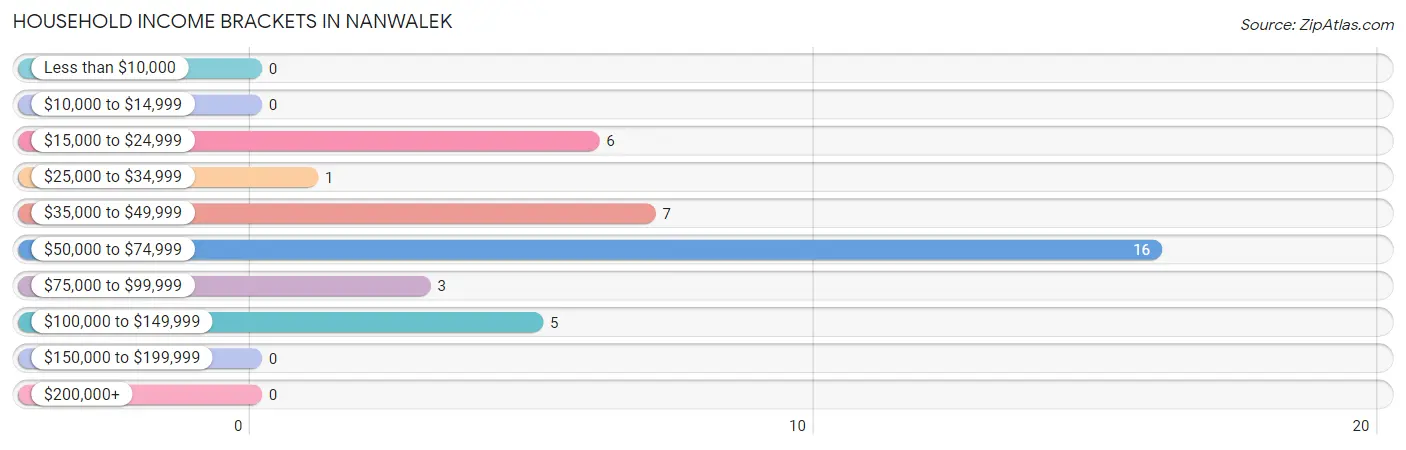
Household Income Brackets in Nanwalek
With 16 households falling in the category, the $50,000 to $74,999 income range is the most frequent in Nanwalek, accounting for 42.1% of all households.
| Income Bracket | # Households | % Households |
| Less than $10,000 | 0 | 0.0% |
| $10,000 to $14,999 | 0 | 0.0% |
| $15,000 to $24,999 | 6 | 15.8% |
| $25,000 to $34,999 | 1 | 2.6% |
| $35,000 to $49,999 | 7 | 18.4% |
| $50,000 to $74,999 | 16 | 42.1% |
| $75,000 to $99,999 | 3 | 7.9% |
| $100,000 to $149,999 | 5 | 13.2% |
| $150,000 to $199,999 | 0 | 0.0% |
| $200,000+ | 0 | 0.0% |
Household Income by Householder Age in Nanwalek
The median household income in Nanwalek is $58,000, with the highest median household income of $59,750 found in the 45 to 64 years age bracket for the primary householder. A total of 17 households (44.7%) fall into this category.
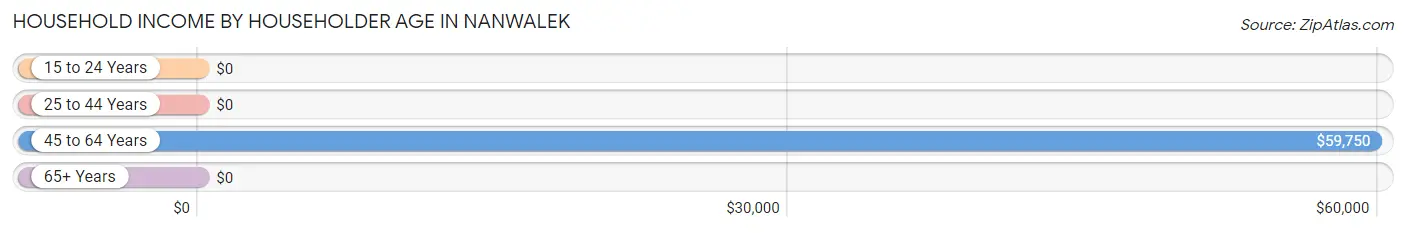
| Income Bracket | # Households | Median Income |
| 15 to 24 Years | 0 (0.0%) | $0 |
| 25 to 44 Years | 8 (21.0%) | $0 |
| 45 to 64 Years | 17 (44.7%) | $59,750 |
| 65+ Years | 13 (34.2%) | $0 |
| Total | 38 (100.0%) | $58,000 |
Poverty in Nanwalek
Income Below Poverty by Sex and Age in Nanwalek
With 5.2% poverty level for males and 8.8% for females among the residents of Nanwalek, 35 to 44 year old males and 6 to 11 year old females are the most vulnerable to poverty, with 3 males (100.0%) and 5 females (45.5%) in their respective age groups living below the poverty level.
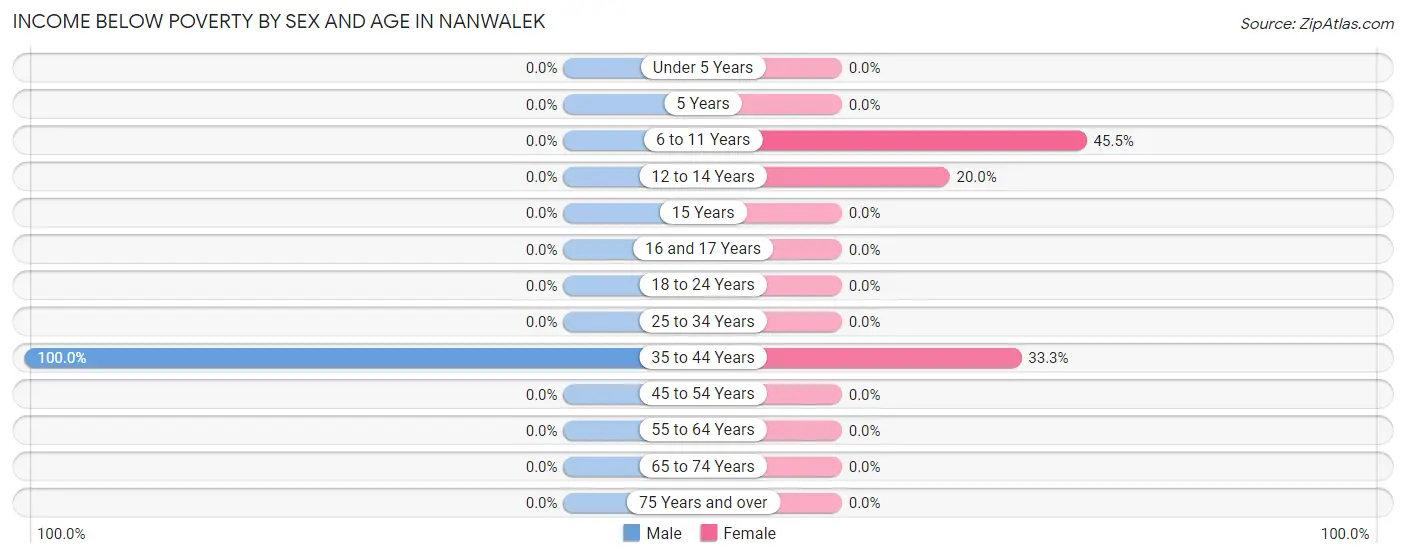
| Age Bracket | Male | Female |
| Under 5 Years | 0 (0.0%) | 0 (0.0%) |
| 5 Years | 0 (0.0%) | 0 (0.0%) |
| 6 to 11 Years | 0 (0.0%) | 5 (45.5%) |
| 12 to 14 Years | 0 (0.0%) | 2 (20.0%) |
| 15 Years | 0 (0.0%) | 0 (0.0%) |
| 16 and 17 Years | 0 (0.0%) | 0 (0.0%) |
| 18 to 24 Years | 0 (0.0%) | 0 (0.0%) |
| 25 to 34 Years | 0 (0.0%) | 0 (0.0%) |
| 35 to 44 Years | 3 (100.0%) | 3 (33.3%) |
| 45 to 54 Years | 0 (0.0%) | 0 (0.0%) |
| 55 to 64 Years | 0 (0.0%) | 0 (0.0%) |
| 65 to 74 Years | 0 (0.0%) | 0 (0.0%) |
| 75 Years and over | 0 (0.0%) | 0 (0.0%) |
| Total | 3 (5.2%) | 10 (8.8%) |
Income Above Poverty by Sex and Age in Nanwalek
According to the poverty statistics in Nanwalek, males aged 12 to 14 years and females aged 15 years are the age groups that are most secure financially, with 100.0% of males and 100.0% of females in these age groups living above the poverty line.
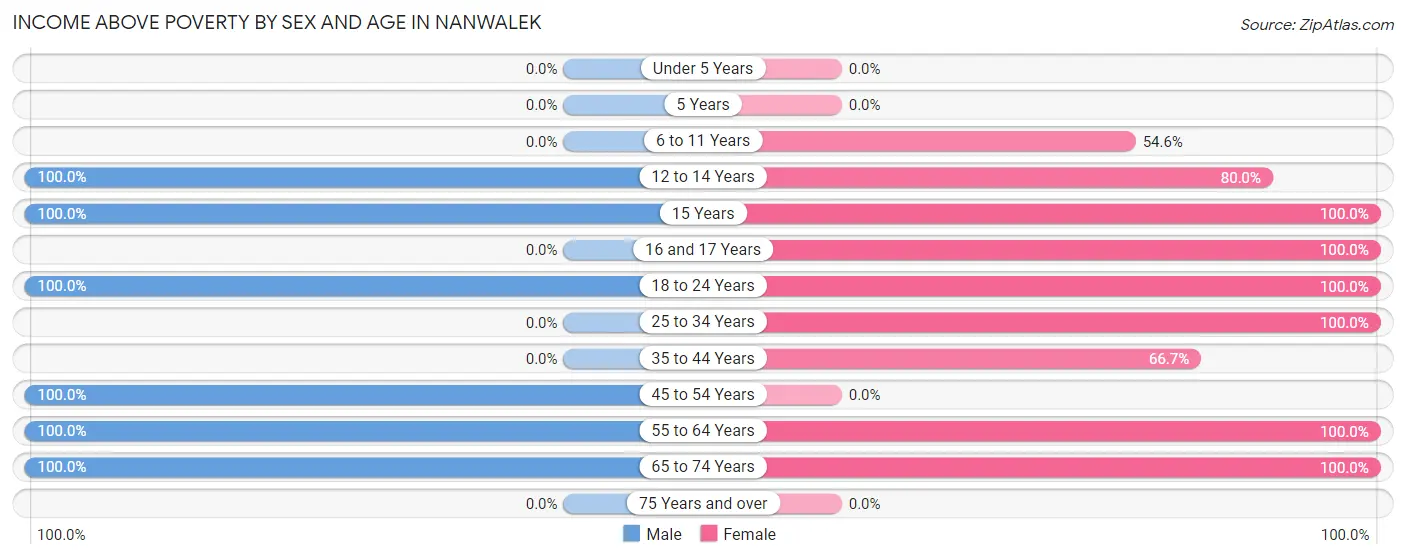
| Age Bracket | Male | Female |
| Under 5 Years | 0 (0.0%) | 0 (0.0%) |
| 5 Years | 0 (0.0%) | 0 (0.0%) |
| 6 to 11 Years | 0 (0.0%) | 6 (54.5%) |
| 12 to 14 Years | 4 (100.0%) | 8 (80.0%) |
| 15 Years | 3 (100.0%) | 8 (100.0%) |
| 16 and 17 Years | 0 (0.0%) | 8 (100.0%) |
| 18 to 24 Years | 12 (100.0%) | 19 (100.0%) |
| 25 to 34 Years | 0 (0.0%) | 7 (100.0%) |
| 35 to 44 Years | 0 (0.0%) | 6 (66.7%) |
| 45 to 54 Years | 9 (100.0%) | 0 (0.0%) |
| 55 to 64 Years | 17 (100.0%) | 31 (100.0%) |
| 65 to 74 Years | 10 (100.0%) | 11 (100.0%) |
| 75 Years and over | 0 (0.0%) | 0 (0.0%) |
| Total | 55 (94.8%) | 104 (91.2%) |
Income Below Poverty Among Married-Couple Families in Nanwalek
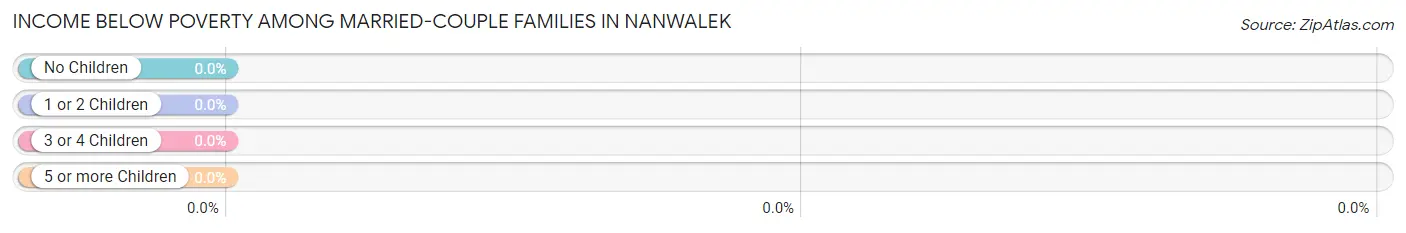
| Children | Above Poverty | Below Poverty |
| No Children | 17 (100.0%) | 0 (0.0%) |
| 1 or 2 Children | 5 (100.0%) | 0 (0.0%) |
| 3 or 4 Children | 4 (100.0%) | 0 (0.0%) |
| 5 or more Children | 0 (0.0%) | 0 (0.0%) |
| Total | 26 (100.0%) | 0 (0.0%) |
Income Below Poverty Among Single-Parent Households in Nanwalek
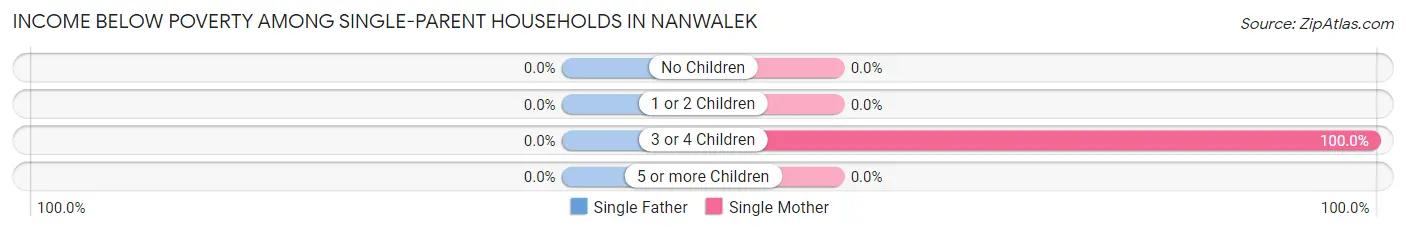
| Children | Single Father | Single Mother |
| No Children | 0 (0.0%) | 0 (0.0%) |
| 1 or 2 Children | 0 (0.0%) | 0 (0.0%) |
| 3 or 4 Children | 0 (0.0%) | 3 (100.0%) |
| 5 or more Children | 0 (0.0%) | 0 (0.0%) |
| Total | 0 (0.0%) | 3 (33.3%) |
Income Below Poverty Among Married-Couple vs Single-Parent Households in Nanwalek
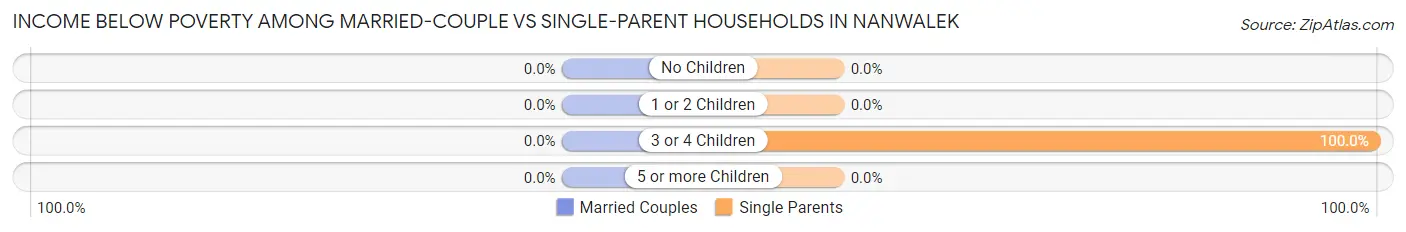
| Children | Married-Couple Families | Single-Parent Households |
| No Children | 0 (0.0%) | 0 (0.0%) |
| 1 or 2 Children | 0 (0.0%) | 0 (0.0%) |
| 3 or 4 Children | 0 (0.0%) | 3 (100.0%) |
| 5 or more Children | 0 (0.0%) | 0 (0.0%) |
| Total | 0 (0.0%) | 3 (33.3%) |
Race in Nanwalek
The most populous races in Nanwalek are Native / Alaskan (123 | 71.5%), Two or more Races (29 | 16.9%), and White / Caucasian (15 | 8.7%).
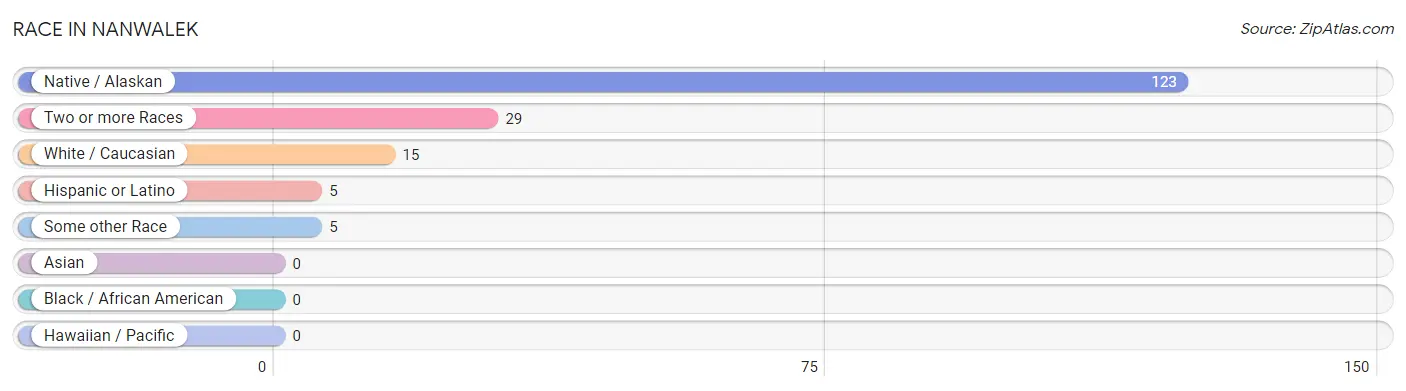
| Race | # Population | % Population |
| Asian | 0 | 0.0% |
| Black / African American | 0 | 0.0% |
| Hawaiian / Pacific | 0 | 0.0% |
| Hispanic or Latino | 5 | 2.9% |
| Native / Alaskan | 123 | 71.5% |
| White / Caucasian | 15 | 8.7% |
| Two or more Races | 29 | 16.9% |
| Some other Race | 5 | 2.9% |
| Total | 172 | 100.0% |
Ancestry in Nanwalek
The most populous ancestries reported in Nanwalek are Aleut (138 | 80.2%), Russian (31 | 18.0%), Alaska Native (8 | 4.6%), English (7 | 4.1%), and Puerto Rican (5 | 2.9%), together accounting for 109.9% of all Nanwalek residents.
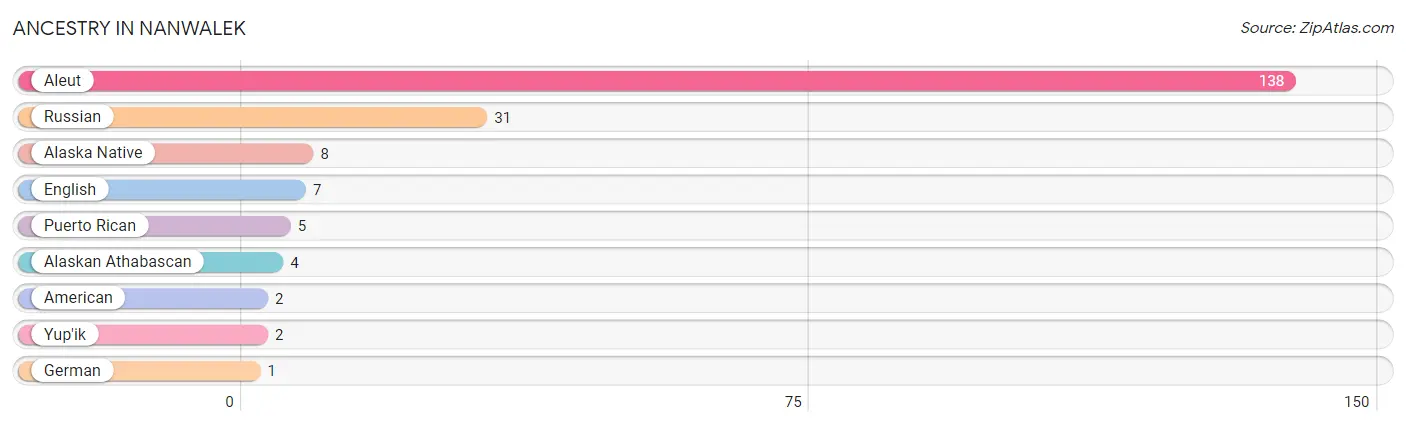
| Ancestry | # Population | % Population |
| Alaska Native | 8 | 4.6% |
| Alaskan Athabascan | 4 | 2.3% |
| Aleut | 138 | 80.2% |
| American | 2 | 1.2% |
| English | 7 | 4.1% |
| German | 1 | 0.6% |
| Puerto Rican | 5 | 2.9% |
| Russian | 31 | 18.0% |
| Yup'ik | 2 | 1.2% | View All 9 Rows |
Immigrants in Nanwalek

| Immigration Origin | # Population | % Population | View All 0 Rows |
Sex and Age in Nanwalek
Sex and Age in Nanwalek
The most populous age groups in Nanwalek are 15 to 19 Years (15 | 25.9%) for men and 15 to 19 Years (24 | 21.0%) for women.
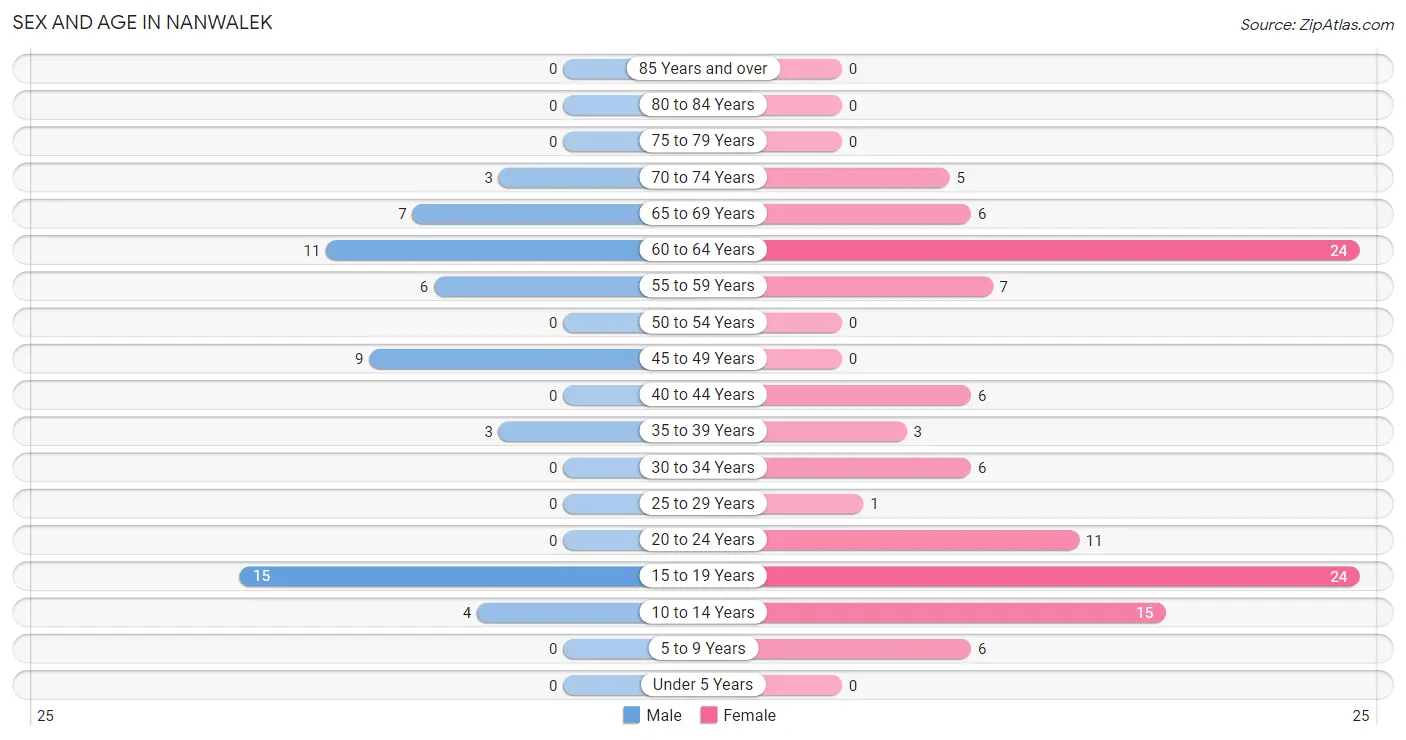
| Age Bracket | Male | Female |
| Under 5 Years | 0 (0.0%) | 0 (0.0%) |
| 5 to 9 Years | 0 (0.0%) | 6 (5.3%) |
| 10 to 14 Years | 4 (6.9%) | 15 (13.2%) |
| 15 to 19 Years | 15 (25.9%) | 24 (21.0%) |
| 20 to 24 Years | 0 (0.0%) | 11 (9.7%) |
| 25 to 29 Years | 0 (0.0%) | 1 (0.9%) |
| 30 to 34 Years | 0 (0.0%) | 6 (5.3%) |
| 35 to 39 Years | 3 (5.2%) | 3 (2.6%) |
| 40 to 44 Years | 0 (0.0%) | 6 (5.3%) |
| 45 to 49 Years | 9 (15.5%) | 0 (0.0%) |
| 50 to 54 Years | 0 (0.0%) | 0 (0.0%) |
| 55 to 59 Years | 6 (10.3%) | 7 (6.1%) |
| 60 to 64 Years | 11 (19.0%) | 24 (21.0%) |
| 65 to 69 Years | 7 (12.1%) | 6 (5.3%) |
| 70 to 74 Years | 3 (5.2%) | 5 (4.4%) |
| 75 to 79 Years | 0 (0.0%) | 0 (0.0%) |
| 80 to 84 Years | 0 (0.0%) | 0 (0.0%) |
| 85 Years and over | 0 (0.0%) | 0 (0.0%) |
| Total | 58 (100.0%) | 114 (100.0%) |
Families and Households in Nanwalek
Median Family Size in Nanwalek
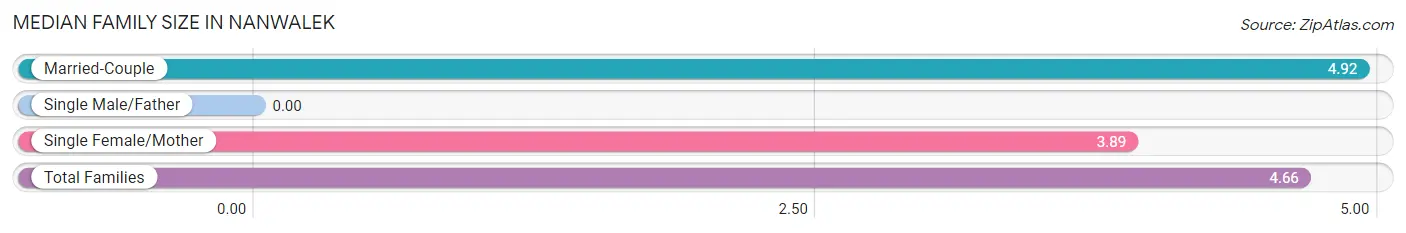
| Family Type | # Families | Family Size |
| Married-Couple | 26 (74.3%) | 4.92 |
| Single Male/Father | 0 (0.0%) | - |
| Single Female/Mother | 9 (25.7%) | 3.89 |
| Total Families | 35 (100.0%) | 4.66 |
Median Household Size in Nanwalek
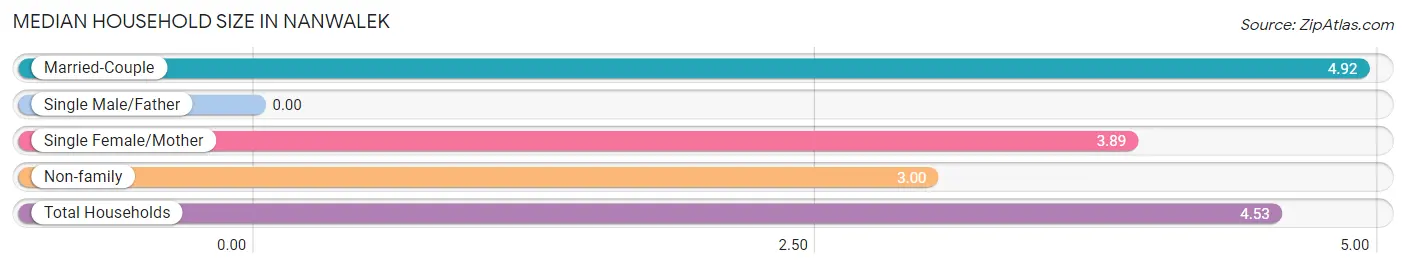
| Household Type | # Households | Household Size |
| Married-Couple | 26 (68.4%) | 4.92 |
| Single Male/Father | 0 (0.0%) | - |
| Single Female/Mother | 9 (23.7%) | 3.89 |
| Non-family | 3 (7.9%) | 3.00 |
| Total Households | 38 (100.0%) | 4.53 |
Household Size by Marriage Status in Nanwalek
Out of a total of 38 households in Nanwalek, 35 (92.1%) are family households, while 3 (7.9%) are nonfamily households. The most numerous type of family households are 2-person households, comprising 22, and the most common type of nonfamily households are 2-person households, comprising 3.
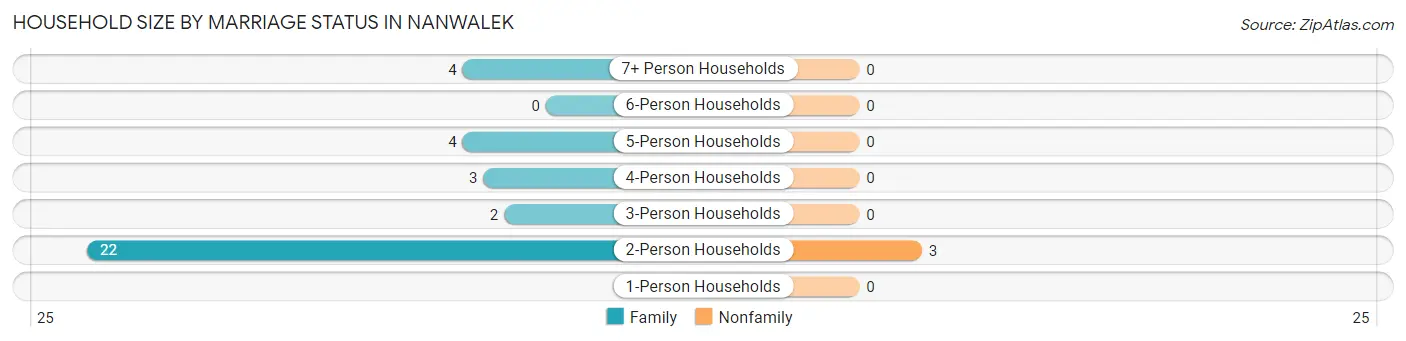
| Household Size | Family Households | Nonfamily Households |
| 1-Person Households | - | 0 (0.0%) |
| 2-Person Households | 22 (57.9%) | 3 (7.9%) |
| 3-Person Households | 2 (5.3%) | 0 (0.0%) |
| 4-Person Households | 3 (7.9%) | 0 (0.0%) |
| 5-Person Households | 4 (10.5%) | 0 (0.0%) |
| 6-Person Households | 0 (0.0%) | 0 (0.0%) |
| 7+ Person Households | 4 (10.5%) | 0 (0.0%) |
| Total | 35 (92.1%) | 3 (7.9%) |
Female Fertility in Nanwalek
Fertility by Age in Nanwalek
| Age Bracket | Women with Births | Births / 1,000 Women |
| 15 to 19 years | 0 (0.0%) | 0.0 |
| 20 to 34 years | 0 (0.0%) | 0.0 |
| 35 to 50 years | 0 (0.0%) | 0.0 |
| Total | 0 (0.0%) | 0.0 |
Fertility by Age by Marriage Status in Nanwalek
| Age Bracket | Married | Unmarried |
| 15 to 19 years | 0 (0.0%) | 0 (0.0%) |
| 20 to 34 years | 0 (0.0%) | 0 (0.0%) |
| 35 to 50 years | 0 (0.0%) | 0 (0.0%) |
| Total | 0 (0.0%) | 0 (0.0%) |
Fertility by Education in Nanwalek
| Educational Attainment | Women with Births | Births / 1,000 Women |
| Less than High School | 0 (0.0%) | 0.0 |
| High School Diploma | 0 (0.0%) | 0.0 |
| College or Associate's Degree | 0 (0.0%) | 0.0 |
| Bachelor's Degree | 0 (0.0%) | 0.0 |
| Graduate Degree | 0 (0.0%) | 0.0 |
| Total | 0 (0.0%) | 0.0 |
Fertility by Education by Marriage Status in Nanwalek
| Educational Attainment | Married | Unmarried |
| Less than High School | 0 (0.0%) | 0 (0.0%) |
| High School Diploma | 0 (0.0%) | 0 (0.0%) |
| College or Associate's Degree | 0 (0.0%) | 0 (0.0%) |
| Bachelor's Degree | 0 (0.0%) | 0 (0.0%) |
| Graduate Degree | 0 (0.0%) | 0 (0.0%) |
| Total | 0 (0.0%) | 0 (0.0%) |
Employment Characteristics in Nanwalek
Employment by Class of Employer in Nanwalek
Among the 71 employed individuals in Nanwalek, private company employees (25 | 35.2%), local government employees (20 | 28.2%), and self-employed (not incorporated) (17 | 23.9%) make up the most common classes of employment.
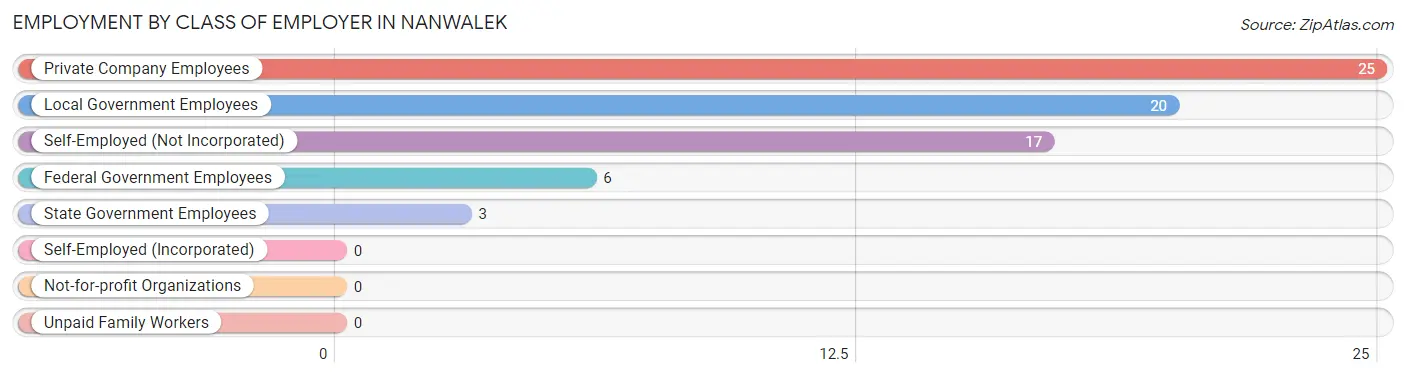
| Employer Class | # Employees | % Employees |
| Private Company Employees | 25 | 35.2% |
| Self-Employed (Incorporated) | 0 | 0.0% |
| Self-Employed (Not Incorporated) | 17 | 23.9% |
| Not-for-profit Organizations | 0 | 0.0% |
| Local Government Employees | 20 | 28.2% |
| State Government Employees | 3 | 4.2% |
| Federal Government Employees | 6 | 8.5% |
| Unpaid Family Workers | 0 | 0.0% |
| Total | 71 | 100.0% |
Employment Status by Age in Nanwalek
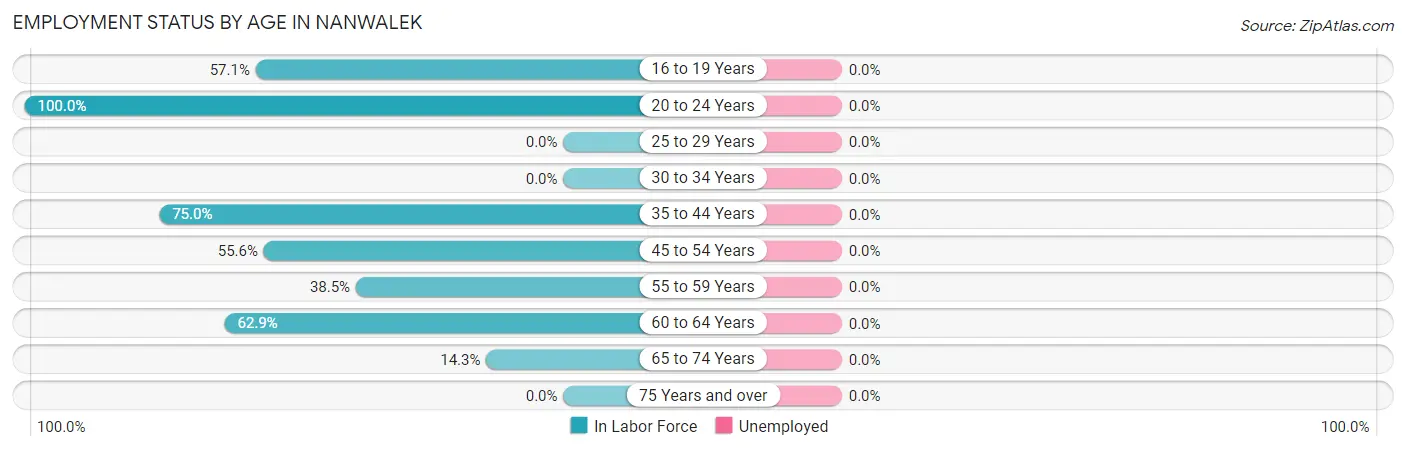
| Age Bracket | In Labor Force | Unemployed |
| 16 to 19 Years | 16 (57.1%) | 0 (0.0%) |
| 20 to 24 Years | 11 (100.0%) | 0 (0.0%) |
| 25 to 29 Years | 0 (0.0%) | 0 (0.0%) |
| 30 to 34 Years | 0 (0.0%) | 0 (0.0%) |
| 35 to 44 Years | 9 (75.0%) | 0 (0.0%) |
| 45 to 54 Years | 5 (55.6%) | 0 (0.0%) |
| 55 to 59 Years | 5 (38.5%) | 0 (0.0%) |
| 60 to 64 Years | 22 (62.9%) | 0 (0.0%) |
| 65 to 74 Years | 3 (14.3%) | 0 (0.0%) |
| 75 Years and over | 0 (0.0%) | 0 (0.0%) |
| Total | 71 (52.2%) | 0 (0.0%) |
Employment Status by Educational Attainment in Nanwalek
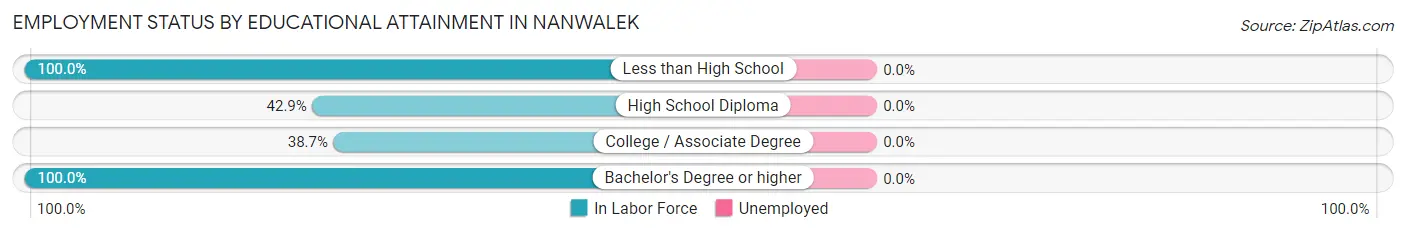
| Educational Attainment | In Labor Force | Unemployed |
| Less than High School | 3 (100.0%) | 0 (0.0%) |
| High School Diploma | 12 (42.9%) | 0 (0.0%) |
| College / Associate Degree | 12 (38.7%) | 0 (0.0%) |
| Bachelor's Degree or higher | 14 (100.0%) | 0 (0.0%) |
| Total | 41 (53.9%) | 0 (0.0%) |
Employment Occupations by Sex in Nanwalek
Management, Business, Science and Arts Occupations
The most common Management, Business, Science and Arts occupations in Nanwalek are Community & Social Service (27 | 38.0%), Education, Arts & Media (17 | 23.9%), Education Instruction & Library (6 | 8.5%), Business & Financial (5 | 7.0%), and Arts, Media & Entertainment (4 | 5.6%).
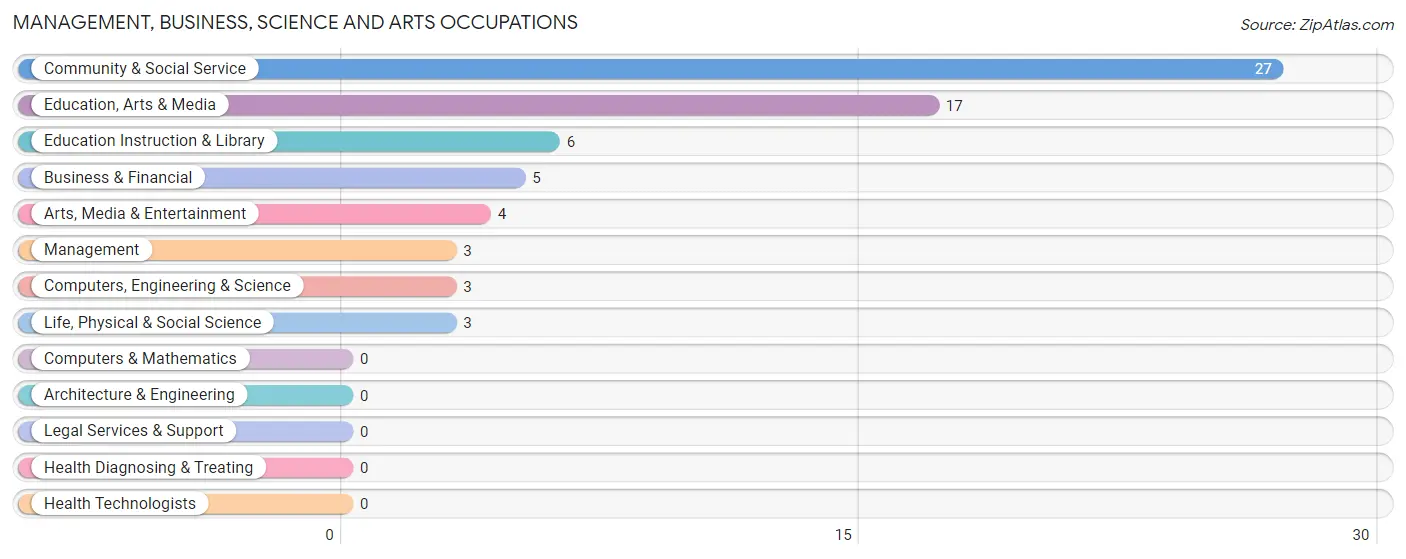
Management, Business, Science and Arts Occupations by Sex
Within the Management, Business, Science and Arts occupations in Nanwalek, the most male-oriented occupations are Management (100.0%), Computers, Engineering & Science (100.0%), and Life, Physical & Social Science (100.0%), while the most female-oriented occupations are Business & Financial (100.0%), Education Instruction & Library (100.0%), and Arts, Media & Entertainment (100.0%).
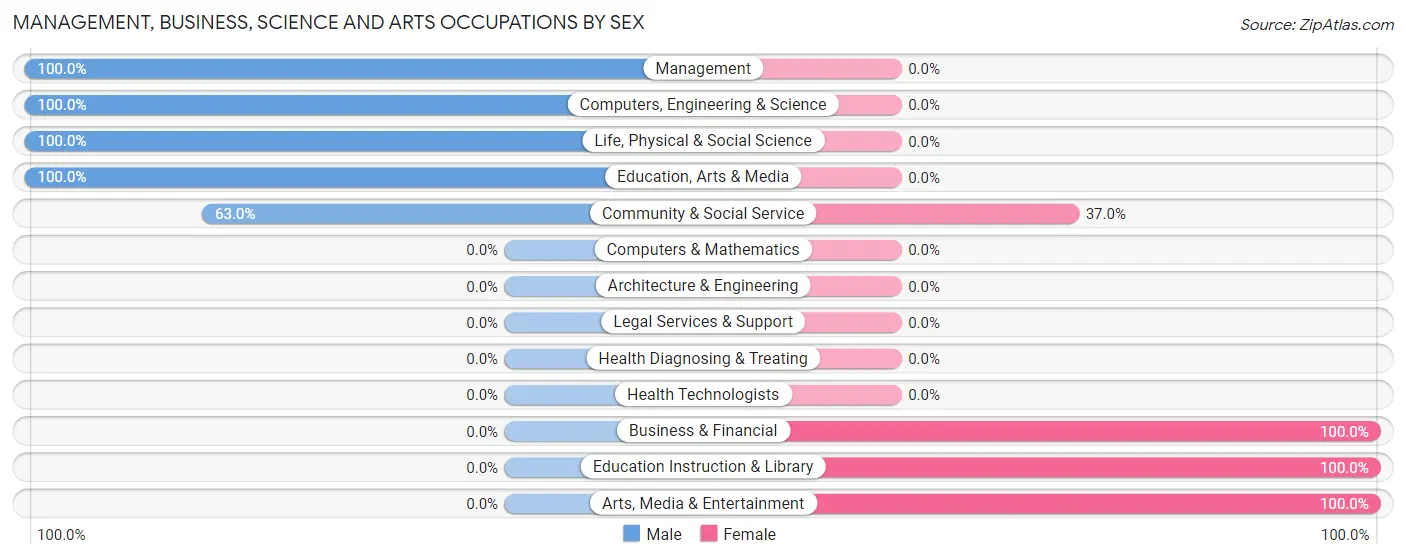
| Occupation | Male | Female |
| Management | 3 (100.0%) | 0 (0.0%) |
| Business & Financial | 0 (0.0%) | 5 (100.0%) |
| Computers, Engineering & Science | 3 (100.0%) | 0 (0.0%) |
| Computers & Mathematics | 0 (0.0%) | 0 (0.0%) |
| Architecture & Engineering | 0 (0.0%) | 0 (0.0%) |
| Life, Physical & Social Science | 3 (100.0%) | 0 (0.0%) |
| Community & Social Service | 17 (63.0%) | 10 (37.0%) |
| Education, Arts & Media | 17 (100.0%) | 0 (0.0%) |
| Legal Services & Support | 0 (0.0%) | 0 (0.0%) |
| Education Instruction & Library | 0 (0.0%) | 6 (100.0%) |
| Arts, Media & Entertainment | 0 (0.0%) | 4 (100.0%) |
| Health Diagnosing & Treating | 0 (0.0%) | 0 (0.0%) |
| Health Technologists | 0 (0.0%) | 0 (0.0%) |
| Total (Category) | 23 (60.5%) | 15 (39.5%) |
| Total (Overall) | 32 (45.1%) | 39 (54.9%) |
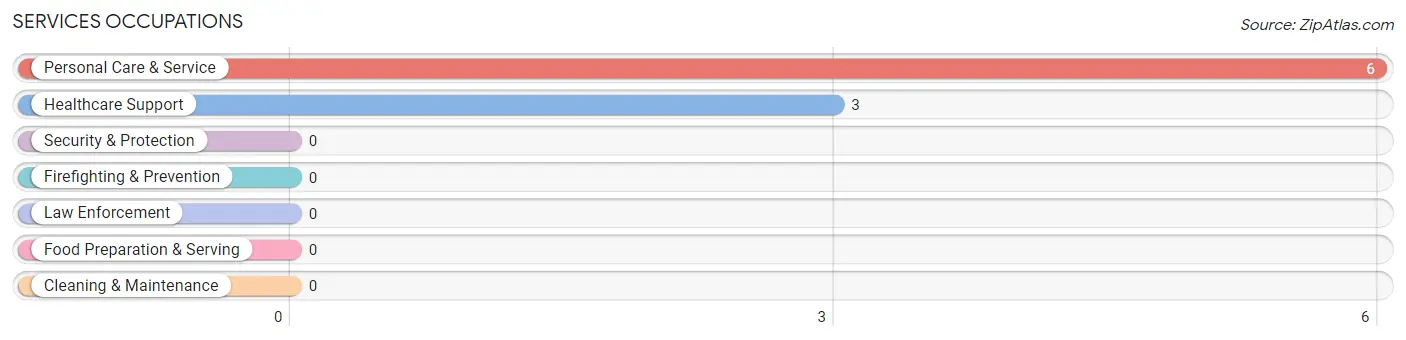
Services Occupations
The most common Services occupations in Nanwalek are Personal Care & Service (6 | 8.5%), and Healthcare Support (3 | 4.2%).
Services Occupations by Sex
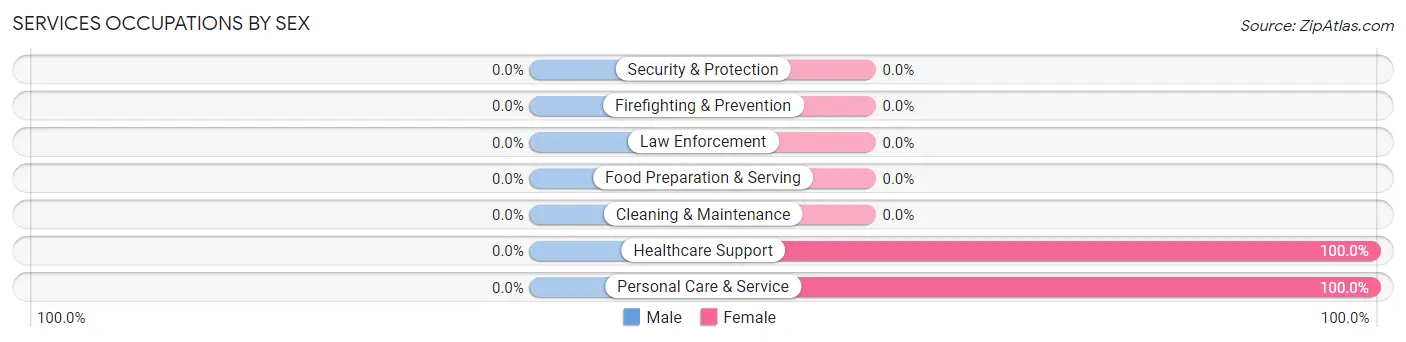
| Occupation | Male | Female |
| Healthcare Support | 0 (0.0%) | 3 (100.0%) |
| Security & Protection | 0 (0.0%) | 0 (0.0%) |
| Firefighting & Prevention | 0 (0.0%) | 0 (0.0%) |
| Law Enforcement | 0 (0.0%) | 0 (0.0%) |
| Food Preparation & Serving | 0 (0.0%) | 0 (0.0%) |
| Cleaning & Maintenance | 0 (0.0%) | 0 (0.0%) |
| Personal Care & Service | 0 (0.0%) | 6 (100.0%) |
| Total (Category) | 0 (0.0%) | 9 (100.0%) |
| Total (Overall) | 32 (45.1%) | 39 (54.9%) |
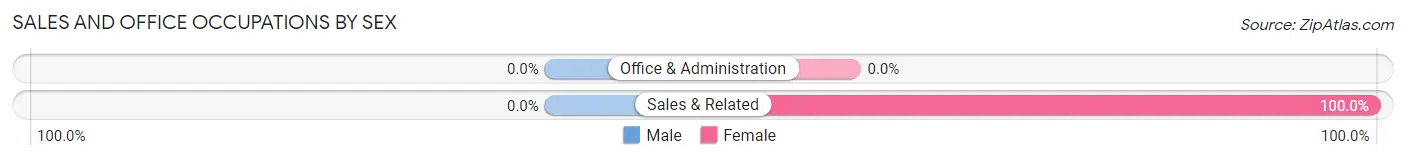
Sales and Office Occupations
The most common Sales and Office occupations in Nanwalek are , and Sales & Related (11 | 15.5%).
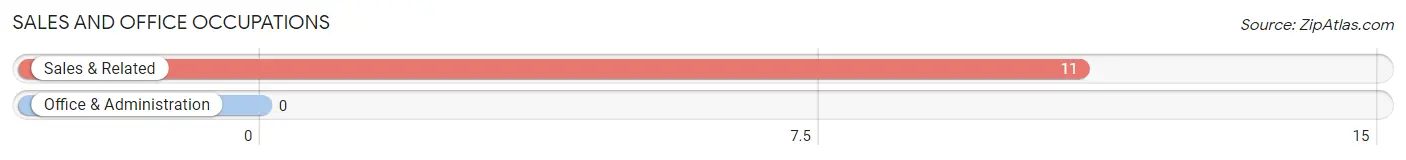
Sales and Office Occupations by Sex
| Occupation | Male | Female |
| Sales & Related | 0 (0.0%) | 11 (100.0%) |
| Office & Administration | 0 (0.0%) | 0 (0.0%) |
| Total (Category) | 0 (0.0%) | 11 (100.0%) |
| Total (Overall) | 32 (45.1%) | 39 (54.9%) |
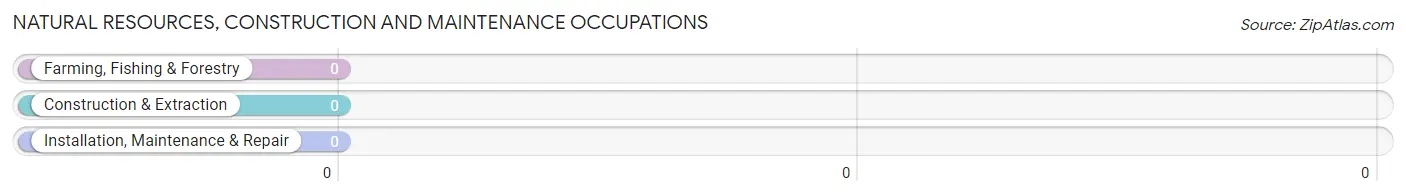
Natural Resources, Construction and Maintenance Occupations
Natural Resources, Construction and Maintenance Occupations by Sex
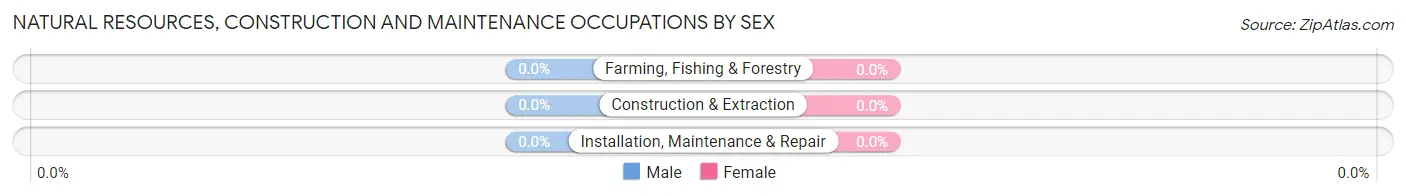
| Occupation | Male | Female |
| Farming, Fishing & Forestry | 0 (0.0%) | 0 (0.0%) |
| Construction & Extraction | 0 (0.0%) | 0 (0.0%) |
| Installation, Maintenance & Repair | 0 (0.0%) | 0 (0.0%) |
| Total (Category) | 0 (0.0%) | 0 (0.0%) |
| Total (Overall) | 32 (45.1%) | 39 (54.9%) |
Production, Transportation and Moving Occupations
The most common Production, Transportation and Moving occupations in Nanwalek are Production (5 | 7.0%), Transportation (4 | 5.6%), and Material Moving (4 | 5.6%).
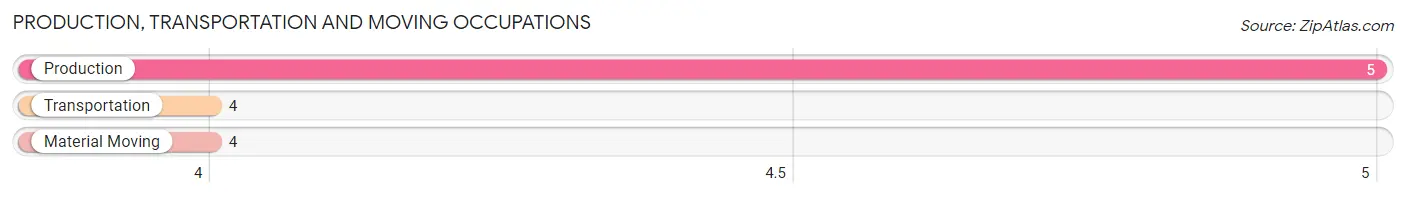
Production, Transportation and Moving Occupations by Sex
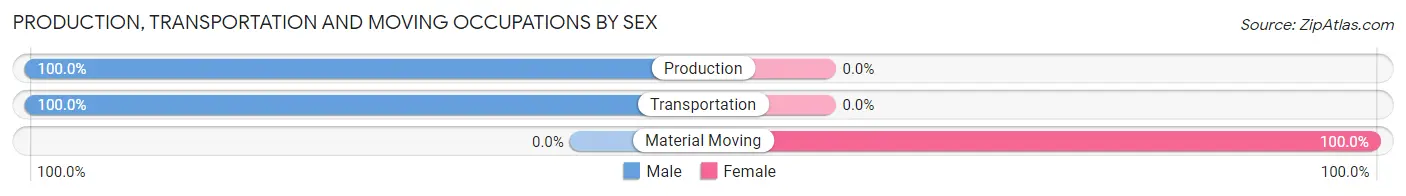
| Occupation | Male | Female |
| Production | 5 (100.0%) | 0 (0.0%) |
| Transportation | 4 (100.0%) | 0 (0.0%) |
| Material Moving | 0 (0.0%) | 4 (100.0%) |
| Total (Category) | 9 (69.2%) | 4 (30.8%) |
| Total (Overall) | 32 (45.1%) | 39 (54.9%) |
Employment Industries by Sex in Nanwalek
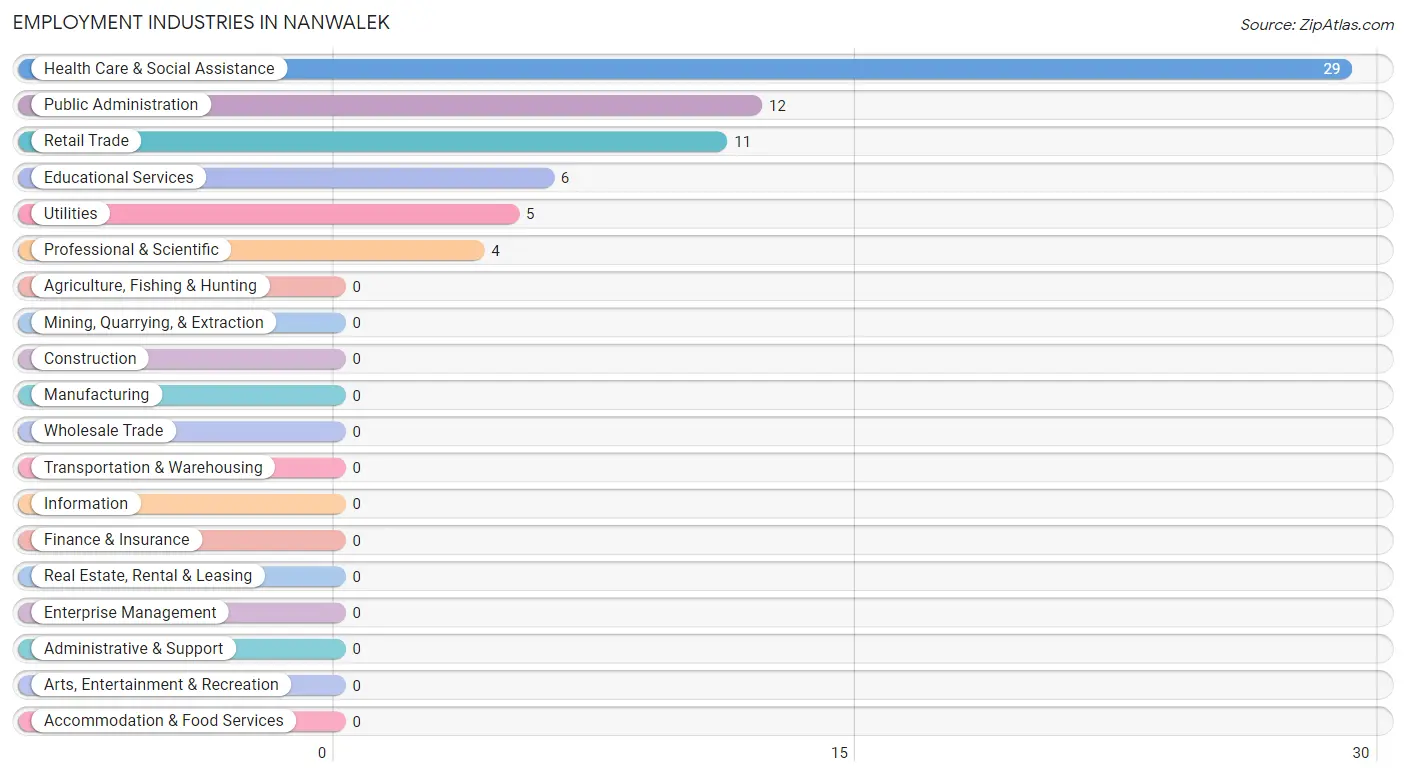
Employment Industries in Nanwalek
The major employment industries in Nanwalek include Health Care & Social Assistance (29 | 40.8%), Public Administration (12 | 16.9%), Retail Trade (11 | 15.5%), Educational Services (6 | 8.5%), and Utilities (5 | 7.0%).
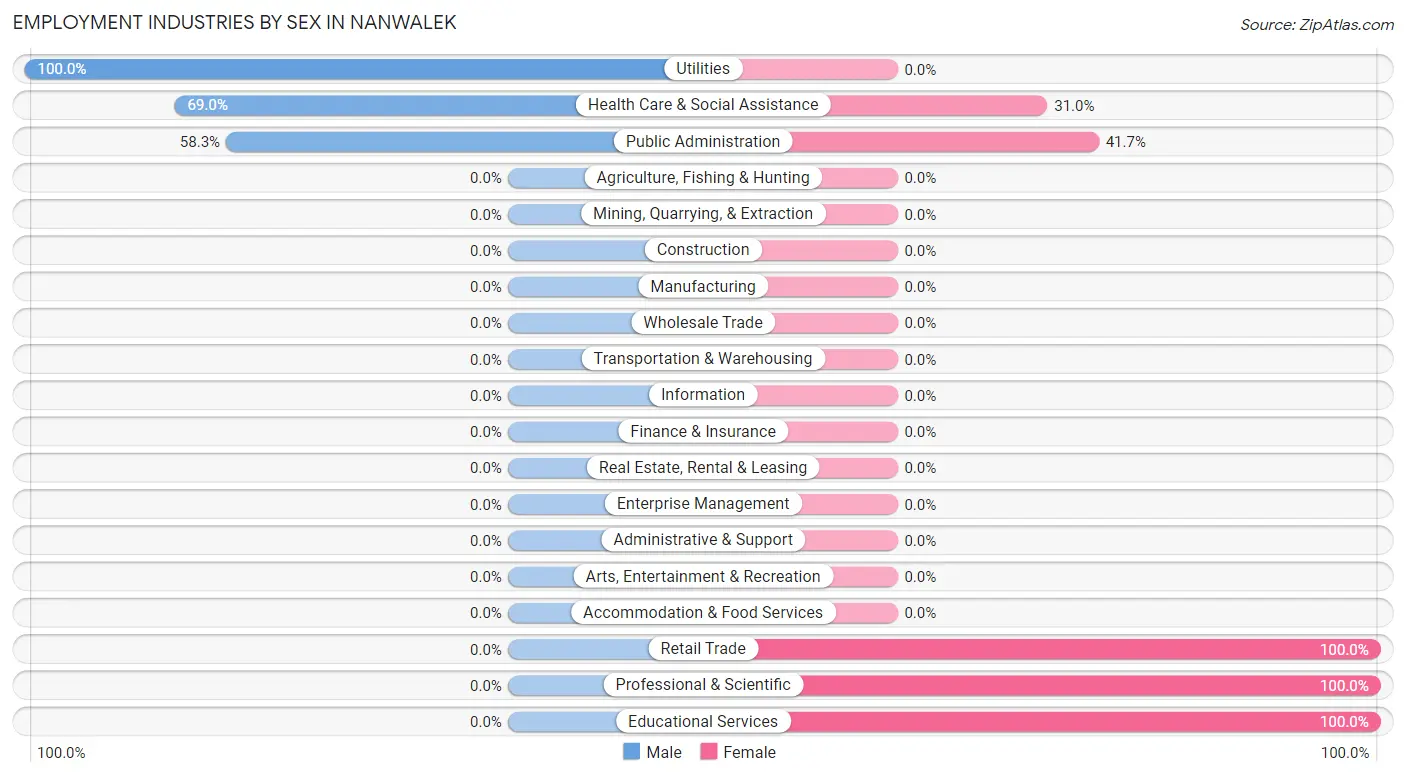
Employment Industries by Sex in Nanwalek
The Nanwalek industries that see more men than women are Utilities (100.0%), Health Care & Social Assistance (69.0%), and Public Administration (58.3%), whereas the industries that tend to have a higher number of women are Retail Trade (100.0%), Professional & Scientific (100.0%), and Educational Services (100.0%).
| Industry | Male | Female |
| Agriculture, Fishing & Hunting | 0 (0.0%) | 0 (0.0%) |
| Mining, Quarrying, & Extraction | 0 (0.0%) | 0 (0.0%) |
| Construction | 0 (0.0%) | 0 (0.0%) |
| Manufacturing | 0 (0.0%) | 0 (0.0%) |
| Wholesale Trade | 0 (0.0%) | 0 (0.0%) |
| Retail Trade | 0 (0.0%) | 11 (100.0%) |
| Transportation & Warehousing | 0 (0.0%) | 0 (0.0%) |
| Utilities | 5 (100.0%) | 0 (0.0%) |
| Information | 0 (0.0%) | 0 (0.0%) |
| Finance & Insurance | 0 (0.0%) | 0 (0.0%) |
| Real Estate, Rental & Leasing | 0 (0.0%) | 0 (0.0%) |
| Professional & Scientific | 0 (0.0%) | 4 (100.0%) |
| Enterprise Management | 0 (0.0%) | 0 (0.0%) |
| Administrative & Support | 0 (0.0%) | 0 (0.0%) |
| Educational Services | 0 (0.0%) | 6 (100.0%) |
| Health Care & Social Assistance | 20 (69.0%) | 9 (31.0%) |
| Arts, Entertainment & Recreation | 0 (0.0%) | 0 (0.0%) |
| Accommodation & Food Services | 0 (0.0%) | 0 (0.0%) |
| Public Administration | 7 (58.3%) | 5 (41.7%) |
| Total | 32 (45.1%) | 39 (54.9%) |
Education in Nanwalek
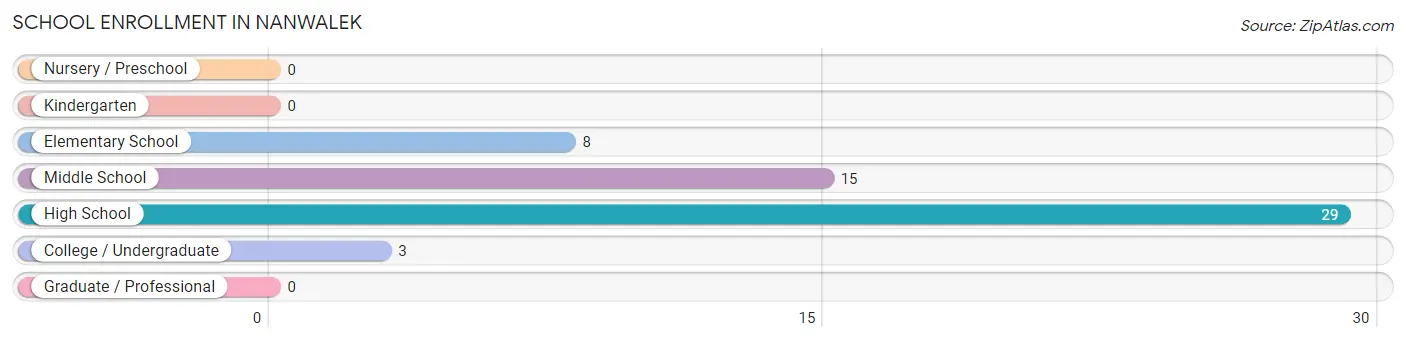
School Enrollment in Nanwalek
The most common levels of schooling among the 55 students in Nanwalek are high school (29 | 52.7%), middle school (15 | 27.3%), and elementary school (8 | 14.5%).
| School Level | # Students | % Students |
| Nursery / Preschool | 0 | 0.0% |
| Kindergarten | 0 | 0.0% |
| Elementary School | 8 | 14.5% |
| Middle School | 15 | 27.3% |
| High School | 29 | 52.7% |
| College / Undergraduate | 3 | 5.4% |
| Graduate / Professional | 0 | 0.0% |
| Total | 55 | 100.0% |
School Enrollment by Age by Funding Source in Nanwalek
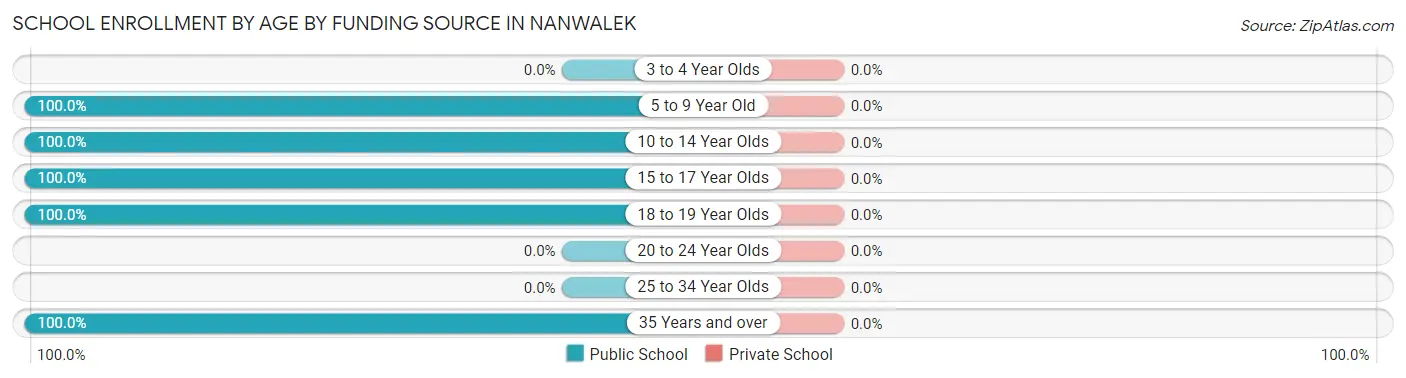
| Age Bracket | Public School | Private School |
| 3 to 4 Year Olds | 0 (0.0%) | 0 (0.0%) |
| 5 to 9 Year Old | 6 (100.0%) | 0 (0.0%) |
| 10 to 14 Year Olds | 19 (100.0%) | 0 (0.0%) |
| 15 to 17 Year Olds | 19 (100.0%) | 0 (0.0%) |
| 18 to 19 Year Olds | 8 (100.0%) | 0 (0.0%) |
| 20 to 24 Year Olds | 0 (0.0%) | 0 (0.0%) |
| 25 to 34 Year Olds | 0 (0.0%) | 0 (0.0%) |
| 35 Years and over | 3 (100.0%) | 0 (0.0%) |
| Total | 55 (100.0%) | 0 (0.0%) |
Educational Attainment by Field of Study in Nanwalek
Education (15 | 60.0%), business (6 | 24.0%), and physical & health sciences (4 | 16.0%) are the most common fields of study among 25 individuals in Nanwalek who have obtained a bachelor's degree or higher.
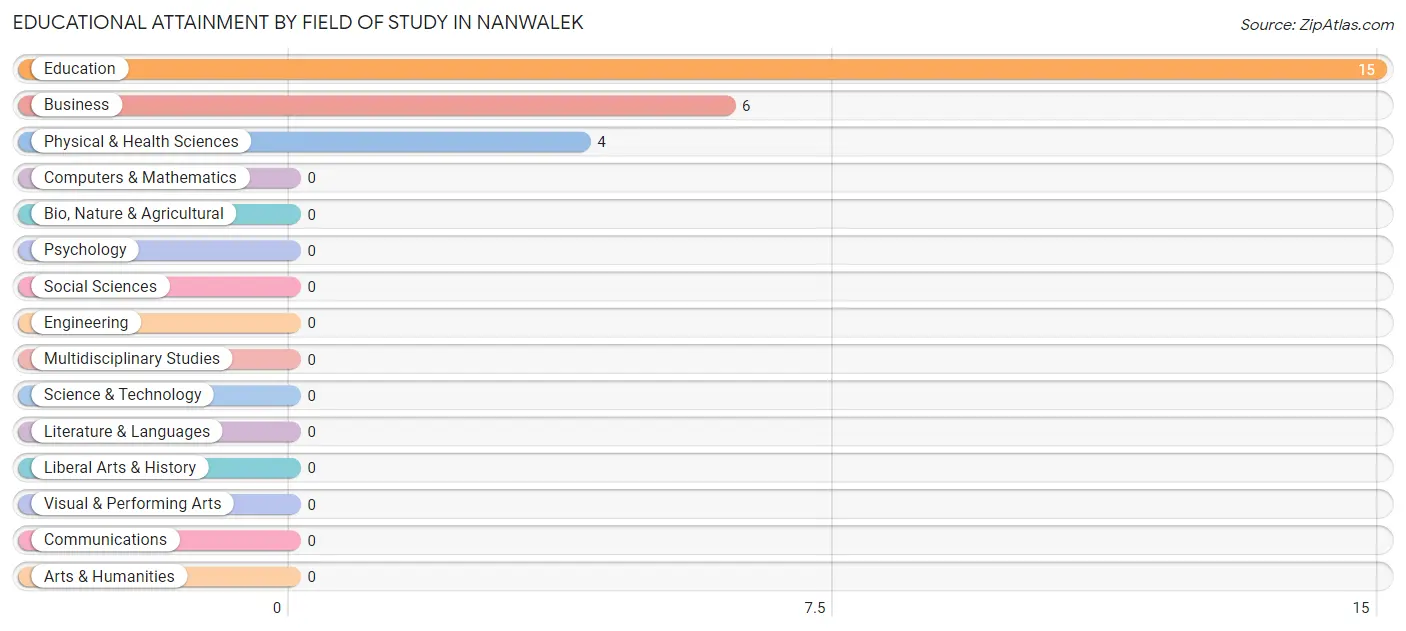
| Field of Study | # Graduates | % Graduates |
| Computers & Mathematics | 0 | 0.0% |
| Bio, Nature & Agricultural | 0 | 0.0% |
| Physical & Health Sciences | 4 | 16.0% |
| Psychology | 0 | 0.0% |
| Social Sciences | 0 | 0.0% |
| Engineering | 0 | 0.0% |
| Multidisciplinary Studies | 0 | 0.0% |
| Science & Technology | 0 | 0.0% |
| Business | 6 | 24.0% |
| Education | 15 | 60.0% |
| Literature & Languages | 0 | 0.0% |
| Liberal Arts & History | 0 | 0.0% |
| Visual & Performing Arts | 0 | 0.0% |
| Communications | 0 | 0.0% |
| Arts & Humanities | 0 | 0.0% |
| Total | 25 | 100.0% |
Transportation & Commute in Nanwalek
Vehicle Availability by Sex in Nanwalek
The most prevalent vehicle ownership categories in Nanwalek are males with no vehicle (27, accounting for 84.4%) and females with no vehicle (35, making up 69.2%).
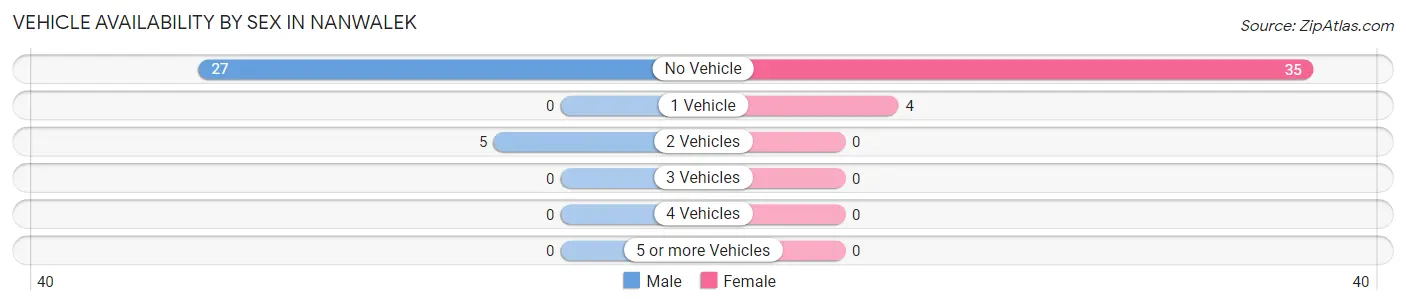
| Vehicles Available | Male | Female |
| No Vehicle | 27 (84.4%) | 35 (89.7%) |
| 1 Vehicle | 0 (0.0%) | 4 (10.3%) |
| 2 Vehicles | 5 (15.6%) | 0 (0.0%) |
| 3 Vehicles | 0 (0.0%) | 0 (0.0%) |
| 4 Vehicles | 0 (0.0%) | 0 (0.0%) |
| 5 or more Vehicles | 0 (0.0%) | 0 (0.0%) |
| Total | 32 (100.0%) | 39 (100.0%) |
Commute Time in Nanwalek
The most frequently occuring commute durations in Nanwalek are 5 to 9 minutes (46 commuters, 90.2%), less than 5 minutes (5 commuters, 9.8%), and 10 to 14 minutes (0 commuters, 0.0%).
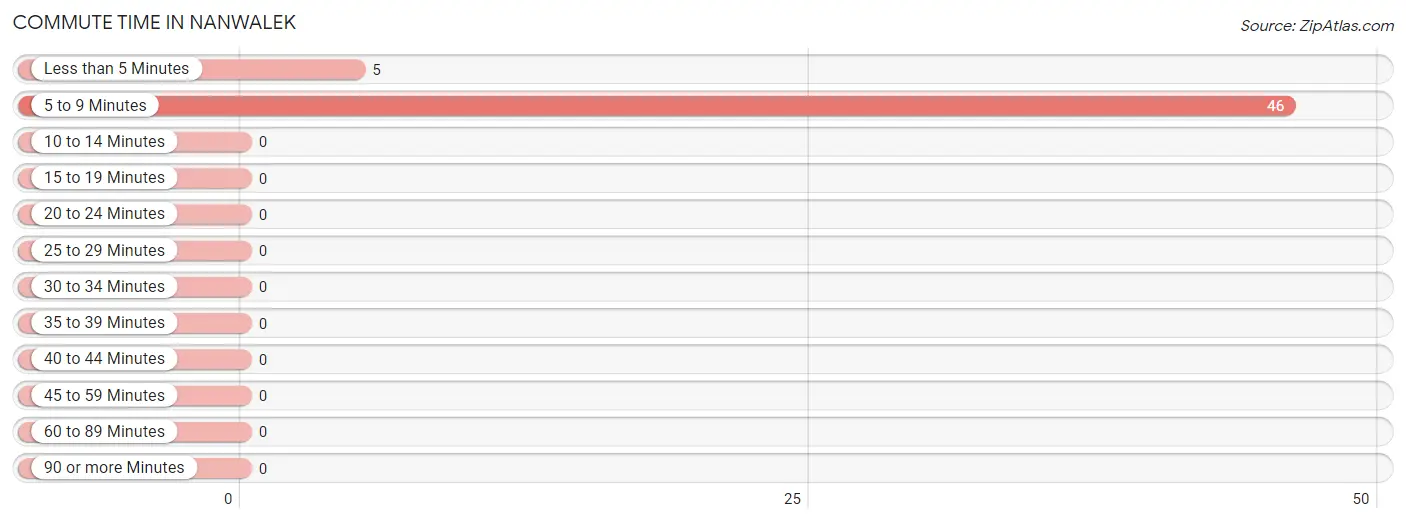
| Commute Time | # Commuters | % Commuters |
| Less than 5 Minutes | 5 | 9.8% |
| 5 to 9 Minutes | 46 | 90.2% |
| 10 to 14 Minutes | 0 | 0.0% |
| 15 to 19 Minutes | 0 | 0.0% |
| 20 to 24 Minutes | 0 | 0.0% |
| 25 to 29 Minutes | 0 | 0.0% |
| 30 to 34 Minutes | 0 | 0.0% |
| 35 to 39 Minutes | 0 | 0.0% |
| 40 to 44 Minutes | 0 | 0.0% |
| 45 to 59 Minutes | 0 | 0.0% |
| 60 to 89 Minutes | 0 | 0.0% |
| 90 or more Minutes | 0 | 0.0% |
Commute Time by Sex in Nanwalek
The most common commute times in Nanwalek are 5 to 9 minutes (7 commuters, 58.3%) for males and 5 to 9 minutes (39 commuters, 100.0%) for females.
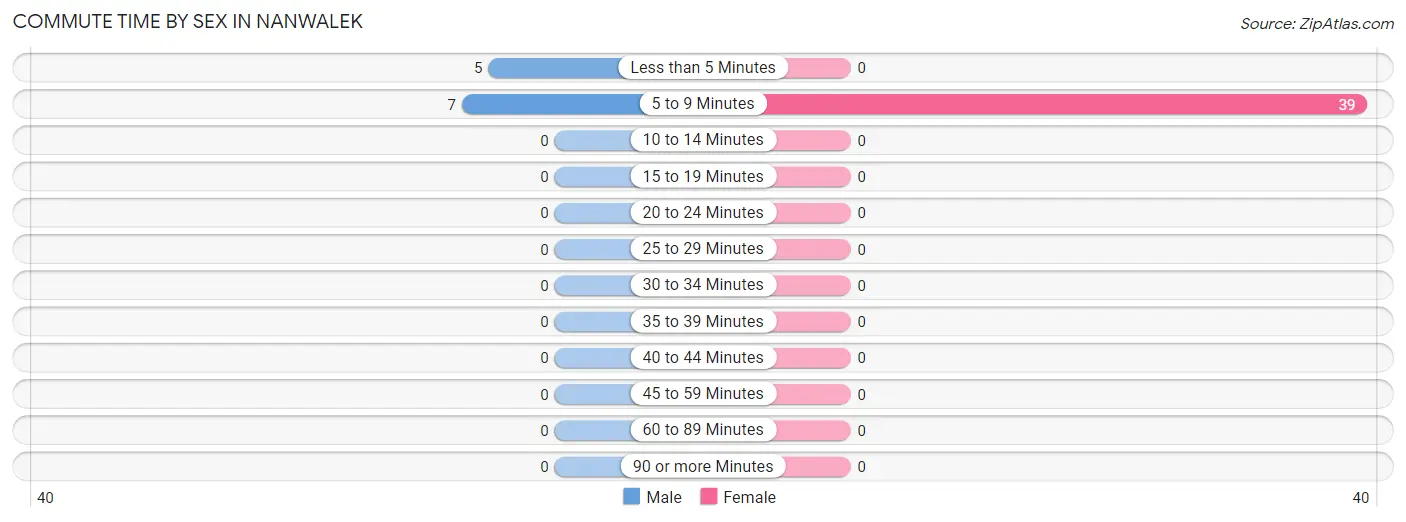
| Commute Time | Male | Female |
| Less than 5 Minutes | 5 (41.7%) | 0 (0.0%) |
| 5 to 9 Minutes | 7 (58.3%) | 39 (100.0%) |
| 10 to 14 Minutes | 0 (0.0%) | 0 (0.0%) |
| 15 to 19 Minutes | 0 (0.0%) | 0 (0.0%) |
| 20 to 24 Minutes | 0 (0.0%) | 0 (0.0%) |
| 25 to 29 Minutes | 0 (0.0%) | 0 (0.0%) |
| 30 to 34 Minutes | 0 (0.0%) | 0 (0.0%) |
| 35 to 39 Minutes | 0 (0.0%) | 0 (0.0%) |
| 40 to 44 Minutes | 0 (0.0%) | 0 (0.0%) |
| 45 to 59 Minutes | 0 (0.0%) | 0 (0.0%) |
| 60 to 89 Minutes | 0 (0.0%) | 0 (0.0%) |
| 90 or more Minutes | 0 (0.0%) | 0 (0.0%) |
Time of Departure to Work by Sex in Nanwalek
The most frequent times of departure to work in Nanwalek are 7:00 AM to 7:29 AM (7, 58.3%) for males and 10:00 AM to 10:59 AM (11, 28.2%) for females.
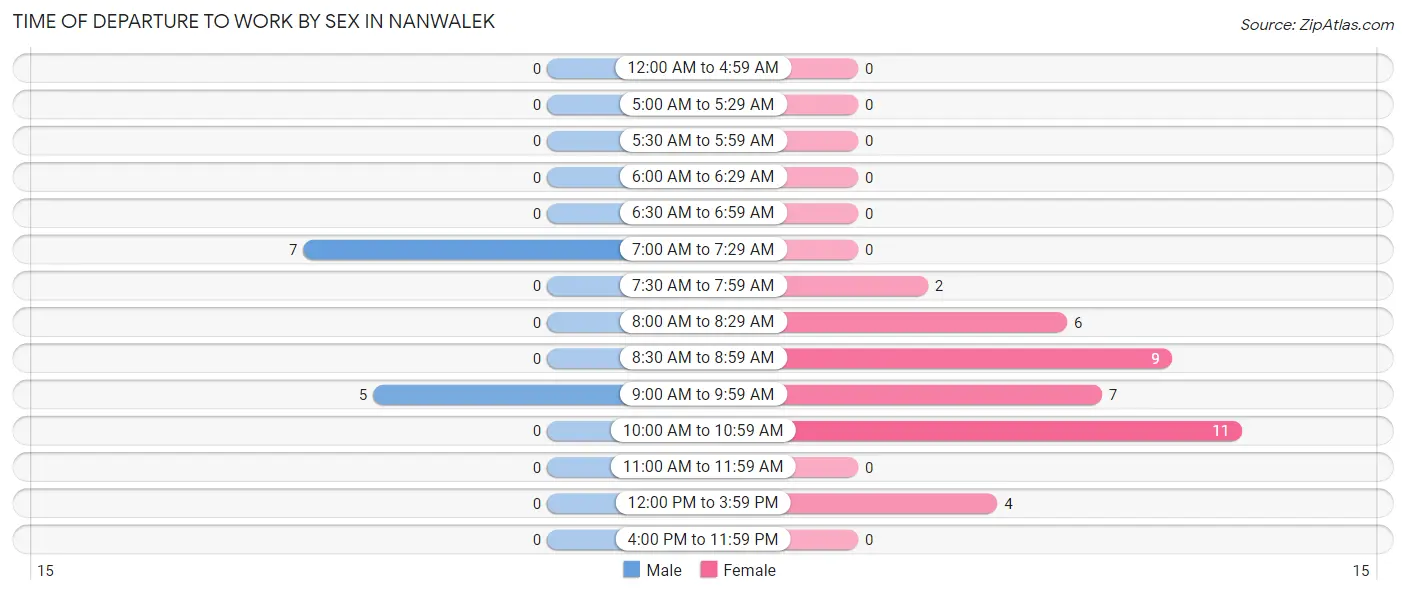
| Time of Departure | Male | Female |
| 12:00 AM to 4:59 AM | 0 (0.0%) | 0 (0.0%) |
| 5:00 AM to 5:29 AM | 0 (0.0%) | 0 (0.0%) |
| 5:30 AM to 5:59 AM | 0 (0.0%) | 0 (0.0%) |
| 6:00 AM to 6:29 AM | 0 (0.0%) | 0 (0.0%) |
| 6:30 AM to 6:59 AM | 0 (0.0%) | 0 (0.0%) |
| 7:00 AM to 7:29 AM | 7 (58.3%) | 0 (0.0%) |
| 7:30 AM to 7:59 AM | 0 (0.0%) | 2 (5.1%) |
| 8:00 AM to 8:29 AM | 0 (0.0%) | 6 (15.4%) |
| 8:30 AM to 8:59 AM | 0 (0.0%) | 9 (23.1%) |
| 9:00 AM to 9:59 AM | 5 (41.7%) | 7 (17.9%) |
| 10:00 AM to 10:59 AM | 0 (0.0%) | 11 (28.2%) |
| 11:00 AM to 11:59 AM | 0 (0.0%) | 0 (0.0%) |
| 12:00 PM to 3:59 PM | 0 (0.0%) | 4 (10.3%) |
| 4:00 PM to 11:59 PM | 0 (0.0%) | 0 (0.0%) |
| Total | 12 (100.0%) | 39 (100.0%) |
Housing Occupancy in Nanwalek
Occupancy by Ownership in Nanwalek
Of the total 38 dwellings in Nanwalek, owner-occupied units account for 27 (71.1%), while renter-occupied units make up 11 (28.9%).
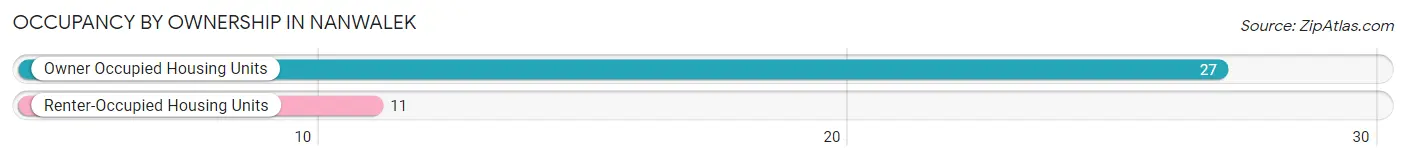
| Occupancy | # Housing Units | % Housing Units |
| Owner Occupied Housing Units | 27 | 71.1% |
| Renter-Occupied Housing Units | 11 | 28.9% |
| Total Occupied Housing Units | 38 | 100.0% |
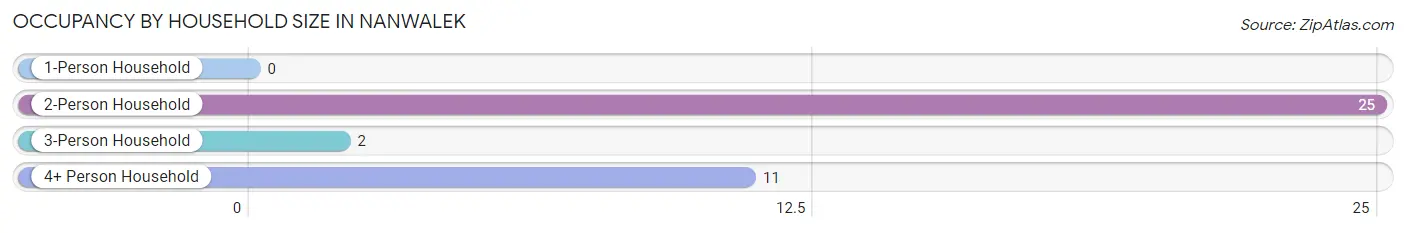
Occupancy by Household Size in Nanwalek
| Household Size | # Housing Units | % Housing Units |
| 1-Person Household | 0 | 0.0% |
| 2-Person Household | 25 | 65.8% |
| 3-Person Household | 2 | 5.3% |
| 4+ Person Household | 11 | 28.9% |
| Total Housing Units | 38 | 100.0% |
Occupancy by Ownership by Household Size in Nanwalek
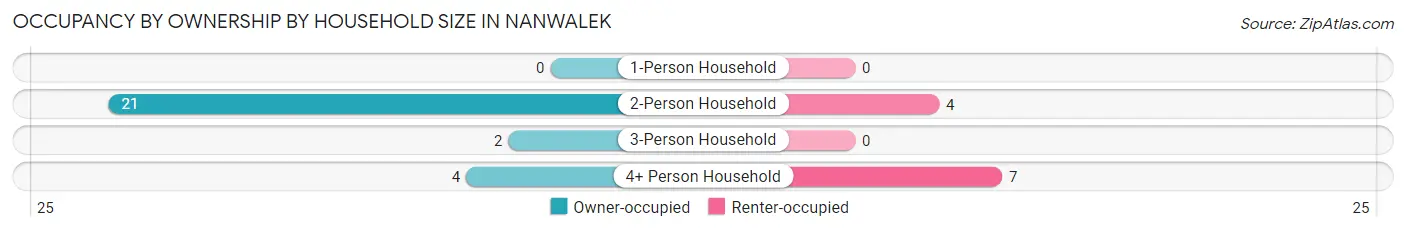
| Household Size | Owner-occupied | Renter-occupied |
| 1-Person Household | 0 (0.0%) | 0 (0.0%) |
| 2-Person Household | 21 (84.0%) | 4 (16.0%) |
| 3-Person Household | 2 (100.0%) | 0 (0.0%) |
| 4+ Person Household | 4 (36.4%) | 7 (63.6%) |
| Total Housing Units | 27 (71.1%) | 11 (28.9%) |
Occupancy by Educational Attainment in Nanwalek
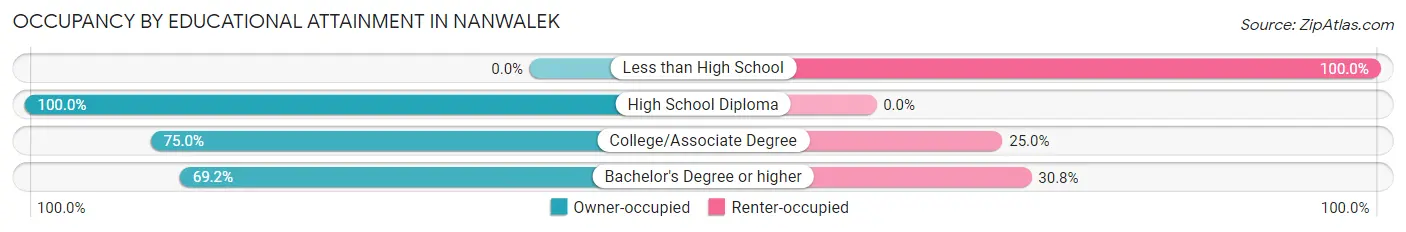
| Household Size | Owner-occupied | Renter-occupied |
| Less than High School | 0 (0.0%) | 3 (100.0%) |
| High School Diploma | 6 (100.0%) | 0 (0.0%) |
| College/Associate Degree | 12 (75.0%) | 4 (25.0%) |
| Bachelor's Degree or higher | 9 (69.2%) | 4 (30.8%) |
Occupancy by Age of Householder in Nanwalek
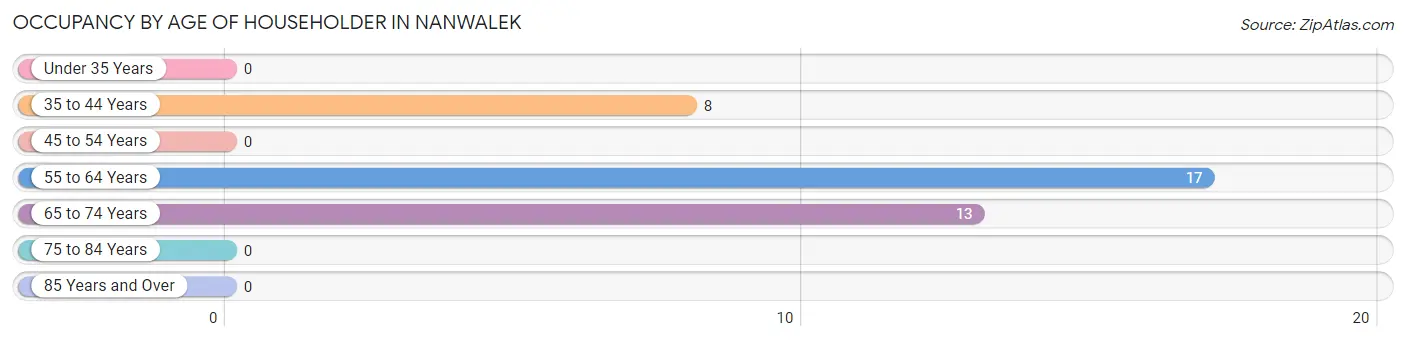
| Age Bracket | # Households | % Households |
| Under 35 Years | 0 | 0.0% |
| 35 to 44 Years | 8 | 21.0% |
| 45 to 54 Years | 0 | 0.0% |
| 55 to 64 Years | 17 | 44.7% |
| 65 to 74 Years | 13 | 34.2% |
| 75 to 84 Years | 0 | 0.0% |
| 85 Years and Over | 0 | 0.0% |
| Total | 38 | 100.0% |
Housing Finances in Nanwalek
Median Income by Occupancy in Nanwalek
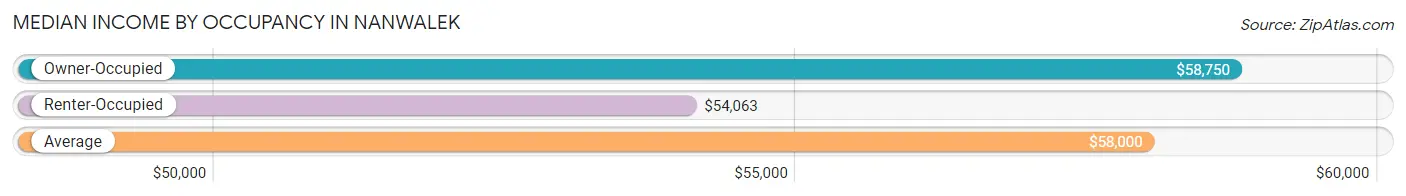
| Occupancy Type | # Households | Median Income |
| Owner-Occupied | 27 (71.1%) | $58,750 |
| Renter-Occupied | 11 (28.9%) | $54,063 |
| Average | 38 (100.0%) | $58,000 |
Occupancy by Householder Income Bracket in Nanwalek
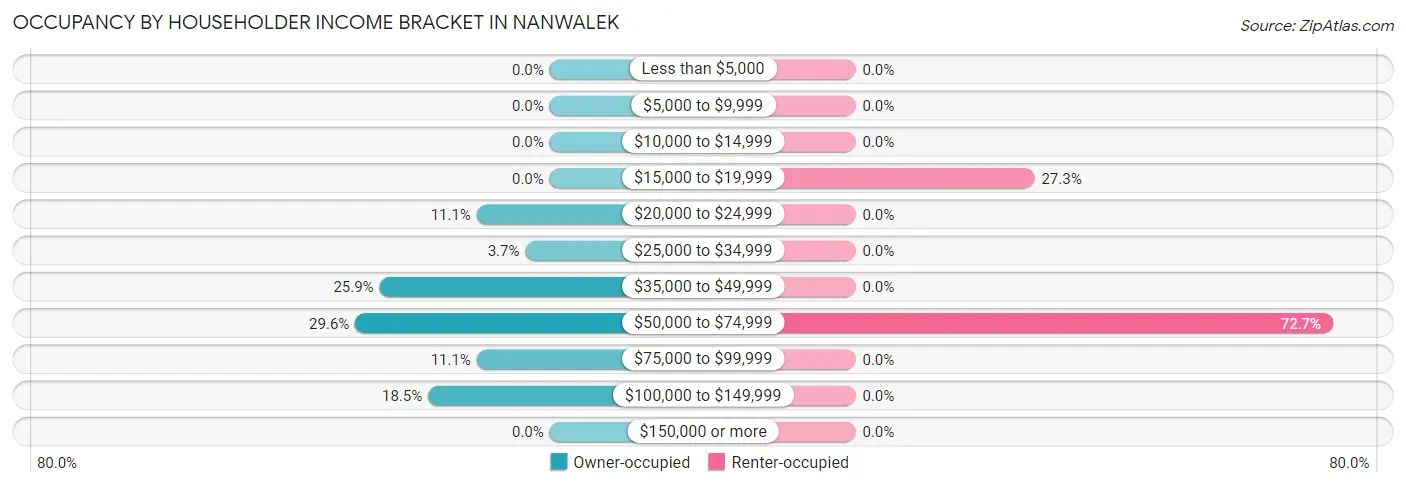
| Income Bracket | Owner-occupied | Renter-occupied |
| Less than $5,000 | 0 (0.0%) | 0 (0.0%) |
| $5,000 to $9,999 | 0 (0.0%) | 0 (0.0%) |
| $10,000 to $14,999 | 0 (0.0%) | 0 (0.0%) |
| $15,000 to $19,999 | 0 (0.0%) | 3 (27.3%) |
| $20,000 to $24,999 | 3 (11.1%) | 0 (0.0%) |
| $25,000 to $34,999 | 1 (3.7%) | 0 (0.0%) |
| $35,000 to $49,999 | 7 (25.9%) | 0 (0.0%) |
| $50,000 to $74,999 | 8 (29.6%) | 8 (72.7%) |
| $75,000 to $99,999 | 3 (11.1%) | 0 (0.0%) |
| $100,000 to $149,999 | 5 (18.5%) | 0 (0.0%) |
| $150,000 or more | 0 (0.0%) | 0 (0.0%) |
| Total | 27 (100.0%) | 11 (100.0%) |
Monthly Housing Cost Tiers in Nanwalek
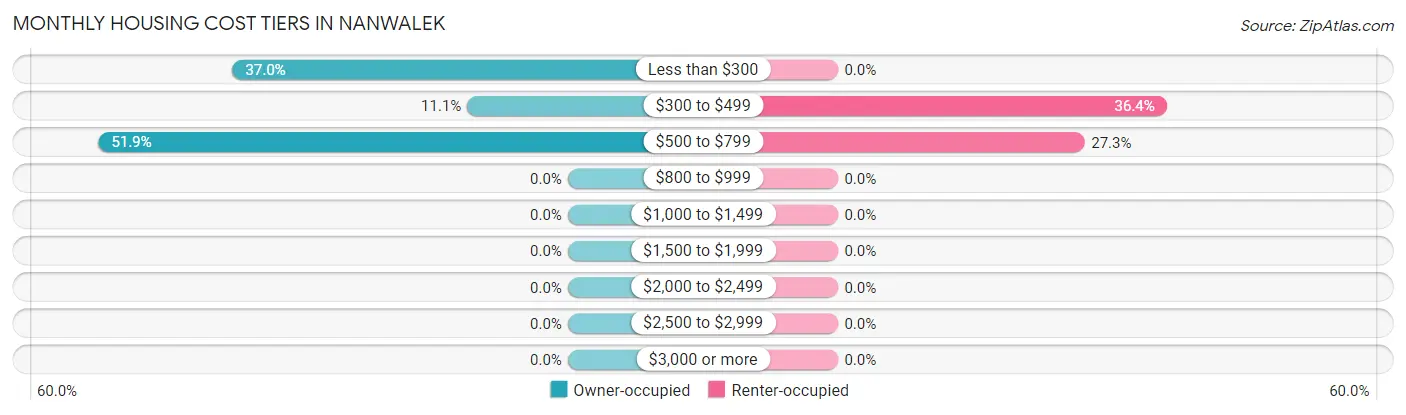
| Monthly Cost | Owner-occupied | Renter-occupied |
| Less than $300 | 10 (37.0%) | 0 (0.0%) |
| $300 to $499 | 3 (11.1%) | 4 (36.4%) |
| $500 to $799 | 14 (51.8%) | 3 (27.3%) |
| $800 to $999 | 0 (0.0%) | 0 (0.0%) |
| $1,000 to $1,499 | 0 (0.0%) | 0 (0.0%) |
| $1,500 to $1,999 | 0 (0.0%) | 0 (0.0%) |
| $2,000 to $2,499 | 0 (0.0%) | 0 (0.0%) |
| $2,500 to $2,999 | 0 (0.0%) | 0 (0.0%) |
| $3,000 or more | 0 (0.0%) | 0 (0.0%) |
| Total | 27 (100.0%) | 11 (100.0%) |
Physical Housing Characteristics in Nanwalek
Housing Structures in Nanwalek
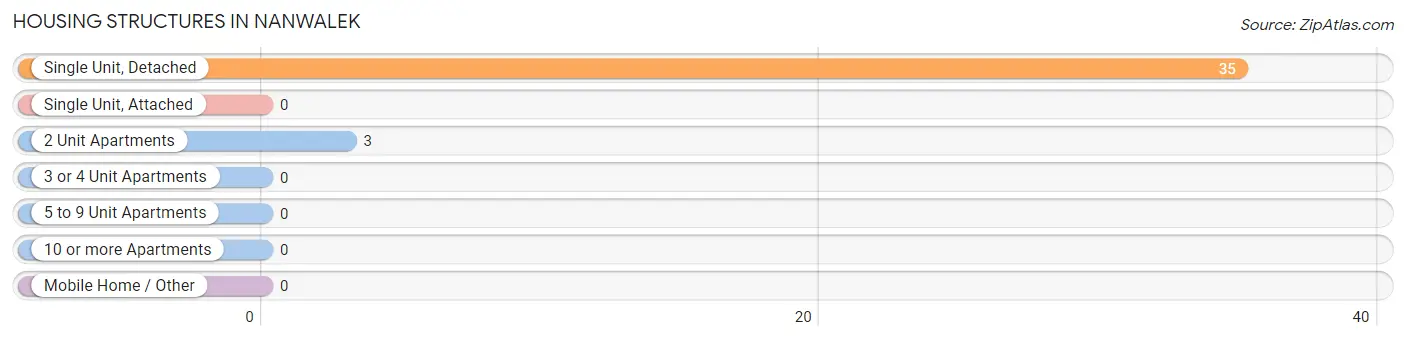
| Structure Type | # Housing Units | % Housing Units |
| Single Unit, Detached | 35 | 92.1% |
| Single Unit, Attached | 0 | 0.0% |
| 2 Unit Apartments | 3 | 7.9% |
| 3 or 4 Unit Apartments | 0 | 0.0% |
| 5 to 9 Unit Apartments | 0 | 0.0% |
| 10 or more Apartments | 0 | 0.0% |
| Mobile Home / Other | 0 | 0.0% |
| Total | 38 | 100.0% |
Housing Structures by Occupancy in Nanwalek
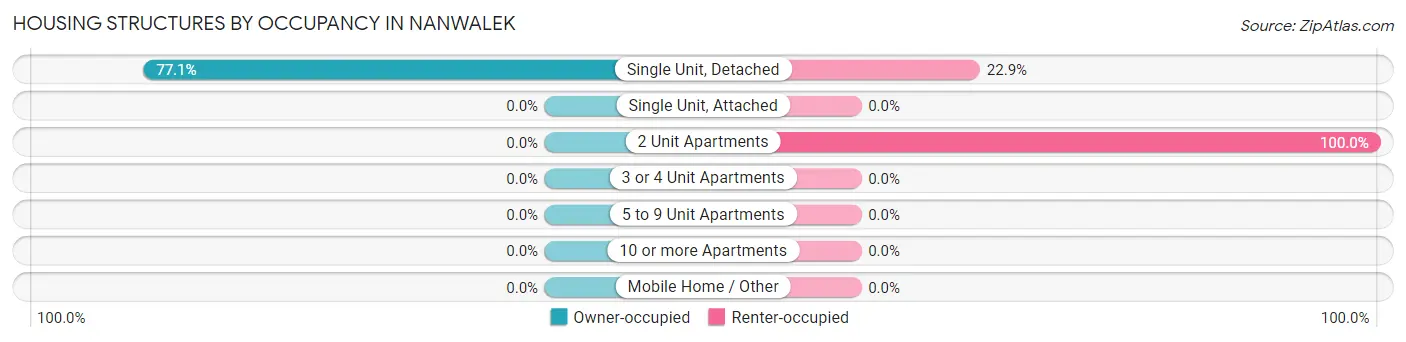
| Structure Type | Owner-occupied | Renter-occupied |
| Single Unit, Detached | 27 (77.1%) | 8 (22.9%) |
| Single Unit, Attached | 0 (0.0%) | 0 (0.0%) |
| 2 Unit Apartments | 0 (0.0%) | 3 (100.0%) |
| 3 or 4 Unit Apartments | 0 (0.0%) | 0 (0.0%) |
| 5 to 9 Unit Apartments | 0 (0.0%) | 0 (0.0%) |
| 10 or more Apartments | 0 (0.0%) | 0 (0.0%) |
| Mobile Home / Other | 0 (0.0%) | 0 (0.0%) |
| Total | 27 (71.1%) | 11 (28.9%) |
Housing Structures by Number of Rooms in Nanwalek
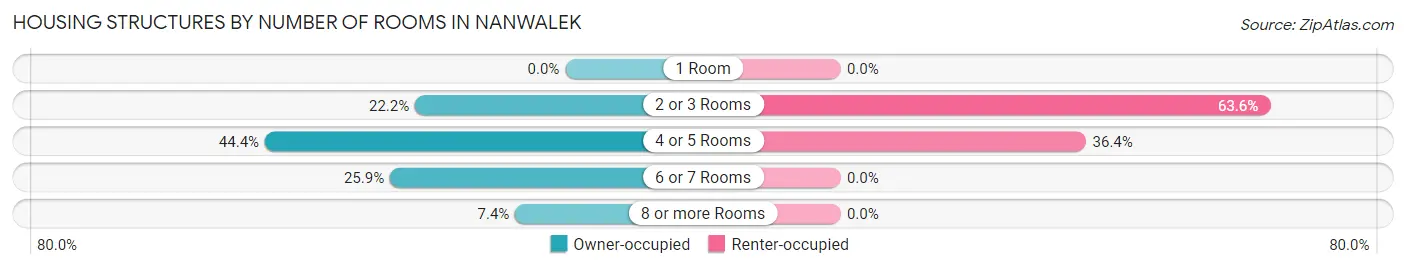
| Number of Rooms | Owner-occupied | Renter-occupied |
| 1 Room | 0 (0.0%) | 0 (0.0%) |
| 2 or 3 Rooms | 6 (22.2%) | 7 (63.6%) |
| 4 or 5 Rooms | 12 (44.4%) | 4 (36.4%) |
| 6 or 7 Rooms | 7 (25.9%) | 0 (0.0%) |
| 8 or more Rooms | 2 (7.4%) | 0 (0.0%) |
| Total | 27 (100.0%) | 11 (100.0%) |
Housing Structure by Heating Type in Nanwalek
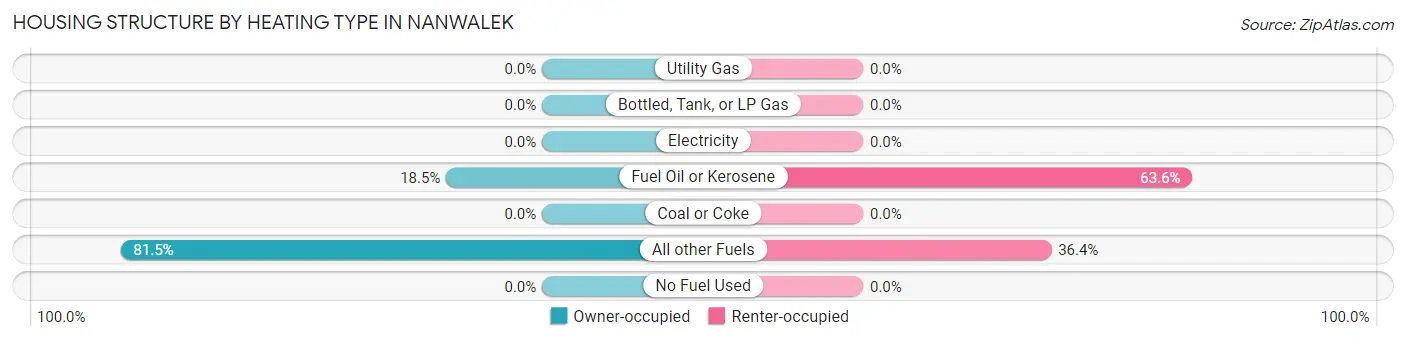
| Heating Type | Owner-occupied | Renter-occupied |
| Utility Gas | 0 (0.0%) | 0 (0.0%) |
| Bottled, Tank, or LP Gas | 0 (0.0%) | 0 (0.0%) |
| Electricity | 0 (0.0%) | 0 (0.0%) |
| Fuel Oil or Kerosene | 5 (18.5%) | 7 (63.6%) |
| Coal or Coke | 0 (0.0%) | 0 (0.0%) |
| All other Fuels | 22 (81.5%) | 4 (36.4%) |
| No Fuel Used | 0 (0.0%) | 0 (0.0%) |
| Total | 27 (100.0%) | 11 (100.0%) |
Household Vehicle Usage in Nanwalek
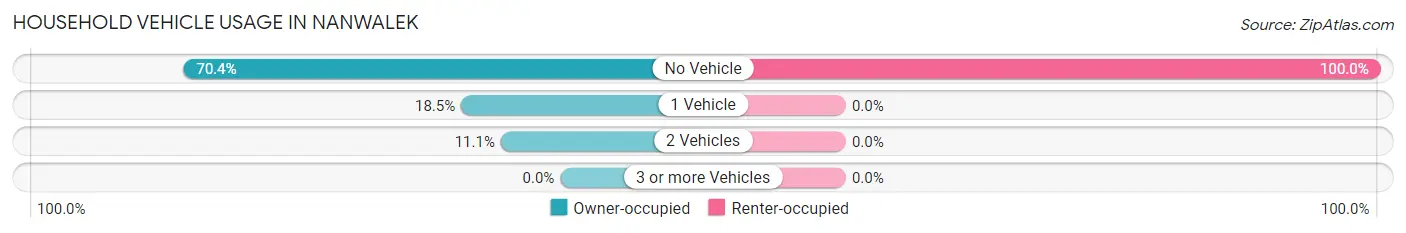
| Vehicles per Household | Owner-occupied | Renter-occupied |
| No Vehicle | 19 (70.4%) | 11 (100.0%) |
| 1 Vehicle | 5 (18.5%) | 0 (0.0%) |
| 2 Vehicles | 3 (11.1%) | 0 (0.0%) |
| 3 or more Vehicles | 0 (0.0%) | 0 (0.0%) |
| Total | 27 (100.0%) | 11 (100.0%) |
Real Estate & Mortgages in Nanwalek
Real Estate and Mortgage Overview in Nanwalek
| Characteristic | Without Mortgage | With Mortgage |
| Housing Units | 25 | 2 |
| Median Property Value | $218,800 | $0 |
| Median Household Income | $58,250 | $0 |
| Monthly Housing Costs | $550 | $0 |
| Real Estate Taxes | - | - |
Property Value by Mortgage Status in Nanwalek
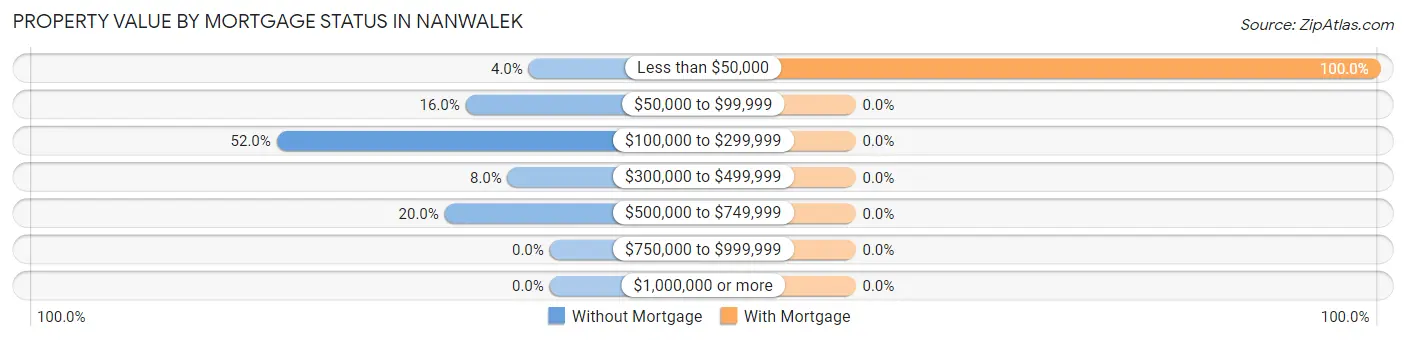
| Property Value | Without Mortgage | With Mortgage |
| Less than $50,000 | 1 (4.0%) | 2 (100.0%) |
| $50,000 to $99,999 | 4 (16.0%) | 0 (0.0%) |
| $100,000 to $299,999 | 13 (52.0%) | 0 (0.0%) |
| $300,000 to $499,999 | 2 (8.0%) | 0 (0.0%) |
| $500,000 to $749,999 | 5 (20.0%) | 0 (0.0%) |
| $750,000 to $999,999 | 0 (0.0%) | 0 (0.0%) |
| $1,000,000 or more | 0 (0.0%) | 0 (0.0%) |
| Total | 25 (100.0%) | 2 (100.0%) |
Household Income by Mortgage Status in Nanwalek
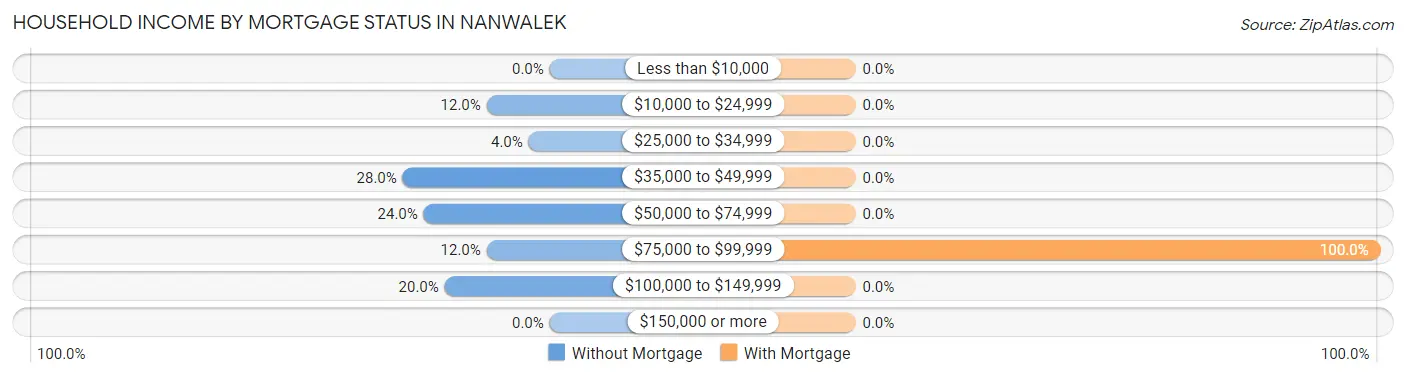
| Household Income | Without Mortgage | With Mortgage |
| Less than $10,000 | 0 (0.0%) | 0 (0.0%) |
| $10,000 to $24,999 | 3 (12.0%) | 0 (0.0%) |
| $25,000 to $34,999 | 1 (4.0%) | 0 (0.0%) |
| $35,000 to $49,999 | 7 (28.0%) | 0 (0.0%) |
| $50,000 to $74,999 | 6 (24.0%) | 0 (0.0%) |
| $75,000 to $99,999 | 3 (12.0%) | 2 (100.0%) |
| $100,000 to $149,999 | 5 (20.0%) | 0 (0.0%) |
| $150,000 or more | 0 (0.0%) | 0 (0.0%) |
| Total | 25 (100.0%) | 2 (100.0%) |
Property Value to Household Income Ratio in Nanwalek
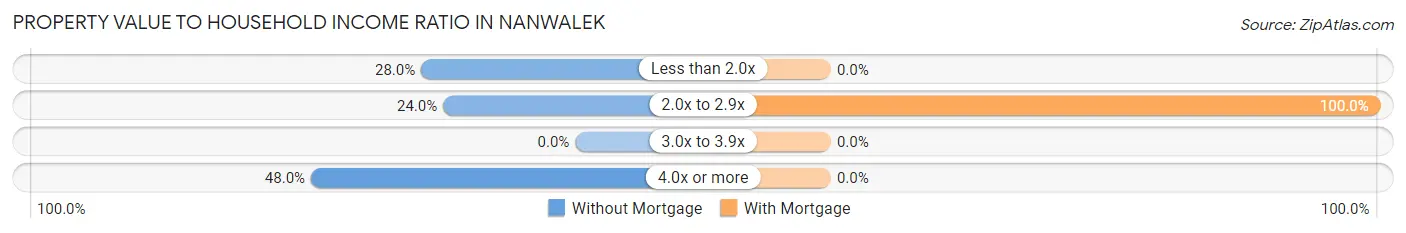
| Value-to-Income Ratio | Without Mortgage | With Mortgage |
| Less than 2.0x | 7 (28.0%) | 0 (0.0%) |
| 2.0x to 2.9x | 6 (24.0%) | 2 (100.0%) |
| 3.0x to 3.9x | 0 (0.0%) | 0 (0.0%) |
| 4.0x or more | 12 (48.0%) | 0 (0.0%) |
| Total | 25 (100.0%) | 2 (100.0%) |
Real Estate Taxes by Mortgage Status in Nanwalek
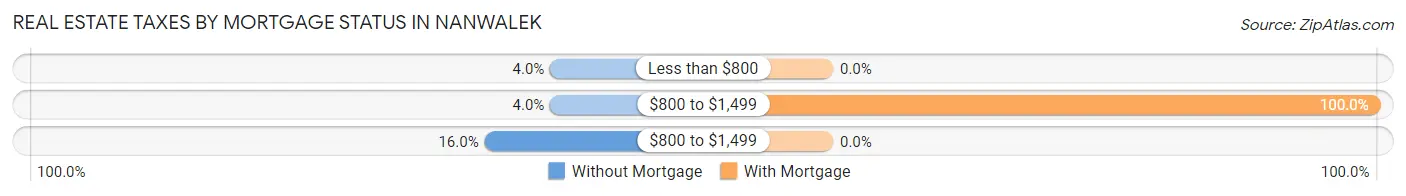
| Property Taxes | Without Mortgage | With Mortgage |
| Less than $800 | 1 (4.0%) | 0 (0.0%) |
| $800 to $1,499 | 1 (4.0%) | 2 (100.0%) |
| $800 to $1,499 | 4 (16.0%) | 0 (0.0%) |
| Total | 25 (100.0%) | 2 (100.0%) |
Health & Disability in Nanwalek
Health Insurance Coverage by Age in Nanwalek
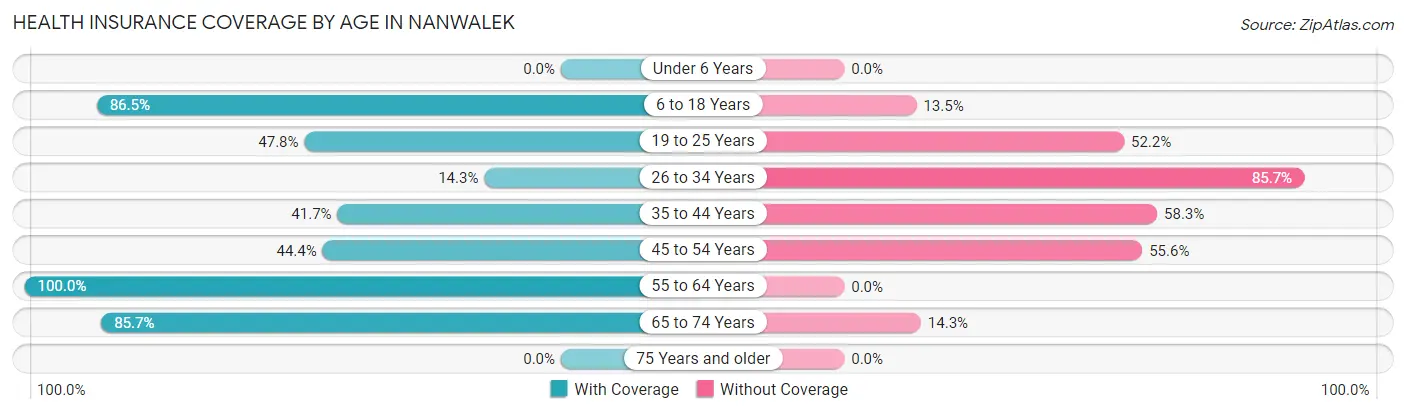
| Age Bracket | With Coverage | Without Coverage |
| Under 6 Years | 0 (0.0%) | 0 (0.0%) |
| 6 to 18 Years | 45 (86.5%) | 7 (13.5%) |
| 19 to 25 Years | 11 (47.8%) | 12 (52.2%) |
| 26 to 34 Years | 1 (14.3%) | 6 (85.7%) |
| 35 to 44 Years | 5 (41.7%) | 7 (58.3%) |
| 45 to 54 Years | 4 (44.4%) | 5 (55.6%) |
| 55 to 64 Years | 48 (100.0%) | 0 (0.0%) |
| 65 to 74 Years | 18 (85.7%) | 3 (14.3%) |
| 75 Years and older | 0 (0.0%) | 0 (0.0%) |
| Total | 132 (76.7%) | 40 (23.3%) |
Health Insurance Coverage by Citizenship Status in Nanwalek
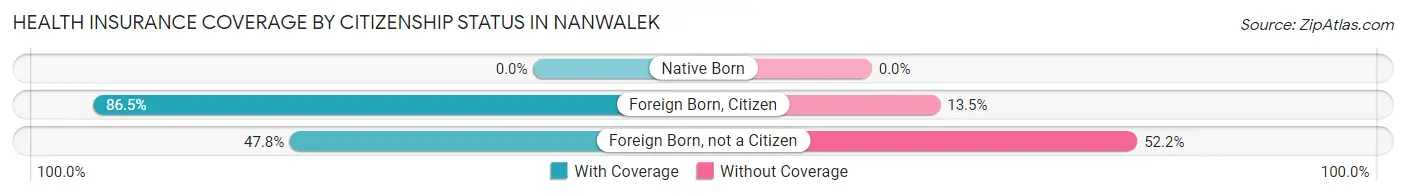
| Citizenship Status | With Coverage | Without Coverage |
| Native Born | 0 (0.0%) | 0 (0.0%) |
| Foreign Born, Citizen | 45 (86.5%) | 7 (13.5%) |
| Foreign Born, not a Citizen | 11 (47.8%) | 12 (52.2%) |
Health Insurance Coverage by Household Income in Nanwalek
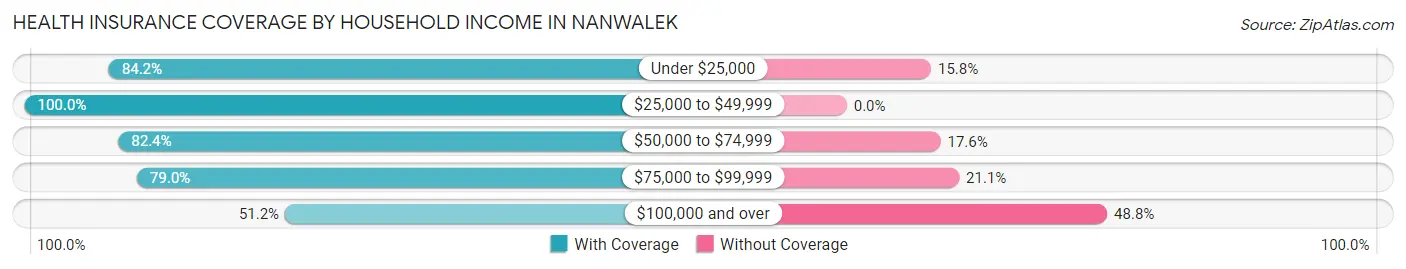
| Household Income | With Coverage | Without Coverage |
| Under $25,000 | 16 (84.2%) | 3 (15.8%) |
| $25,000 to $49,999 | 19 (100.0%) | 0 (0.0%) |
| $50,000 to $74,999 | 61 (82.4%) | 13 (17.6%) |
| $75,000 to $99,999 | 15 (78.9%) | 4 (21.0%) |
| $100,000 and over | 21 (51.2%) | 20 (48.8%) |
Public vs Private Health Insurance Coverage by Age in Nanwalek
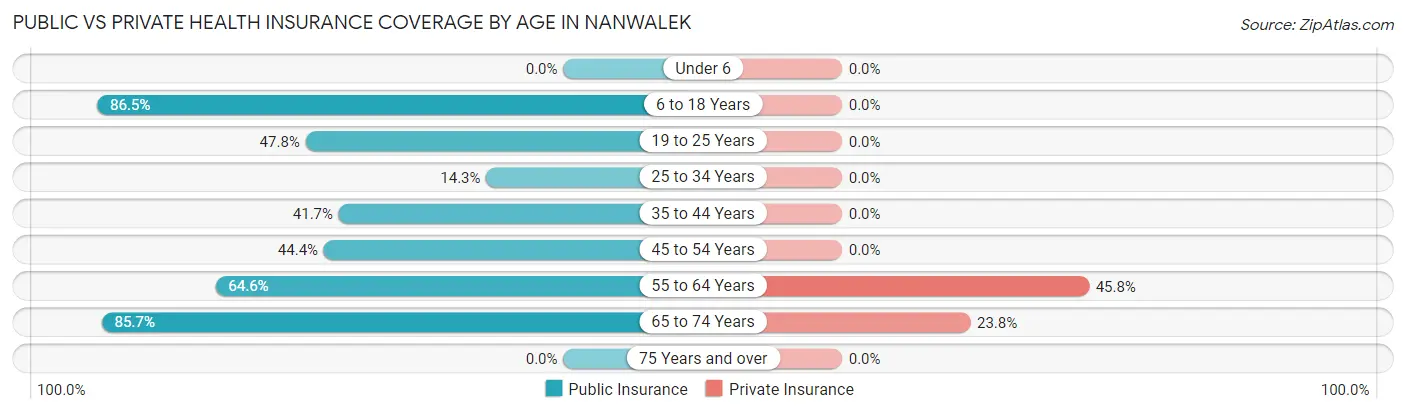
| Age Bracket | Public Insurance | Private Insurance |
| Under 6 | 0 (0.0%) | 0 (0.0%) |
| 6 to 18 Years | 45 (86.5%) | 0 (0.0%) |
| 19 to 25 Years | 11 (47.8%) | 0 (0.0%) |
| 25 to 34 Years | 1 (14.3%) | 0 (0.0%) |
| 35 to 44 Years | 5 (41.7%) | 0 (0.0%) |
| 45 to 54 Years | 4 (44.4%) | 0 (0.0%) |
| 55 to 64 Years | 31 (64.6%) | 22 (45.8%) |
| 65 to 74 Years | 18 (85.7%) | 5 (23.8%) |
| 75 Years and over | 0 (0.0%) | 0 (0.0%) |
| Total | 115 (66.9%) | 27 (15.7%) |
Disability Status by Sex by Age in Nanwalek
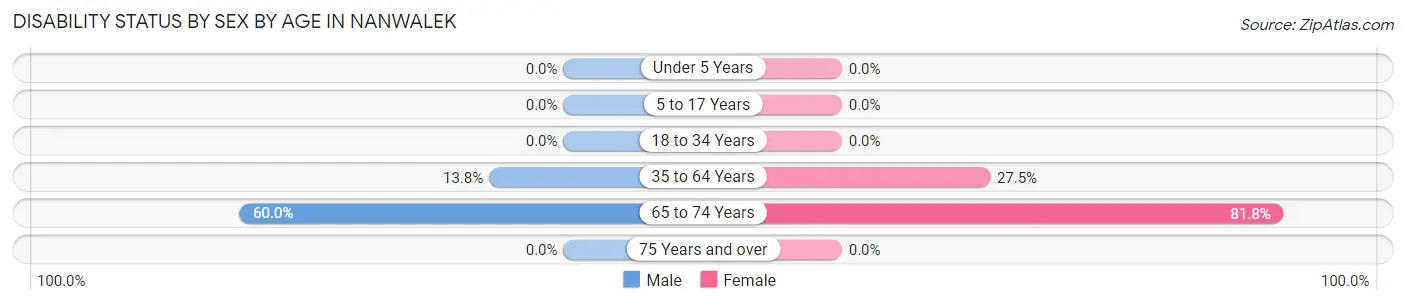
| Age Bracket | Male | Female |
| Under 5 Years | 0 (0.0%) | 0 (0.0%) |
| 5 to 17 Years | 0 (0.0%) | 0 (0.0%) |
| 18 to 34 Years | 0 (0.0%) | 0 (0.0%) |
| 35 to 64 Years | 4 (13.8%) | 11 (27.5%) |
| 65 to 74 Years | 6 (60.0%) | 9 (81.8%) |
| 75 Years and over | 0 (0.0%) | 0 (0.0%) |
Disability Class by Sex by Age in Nanwalek
Disability Class: Hearing Difficulty
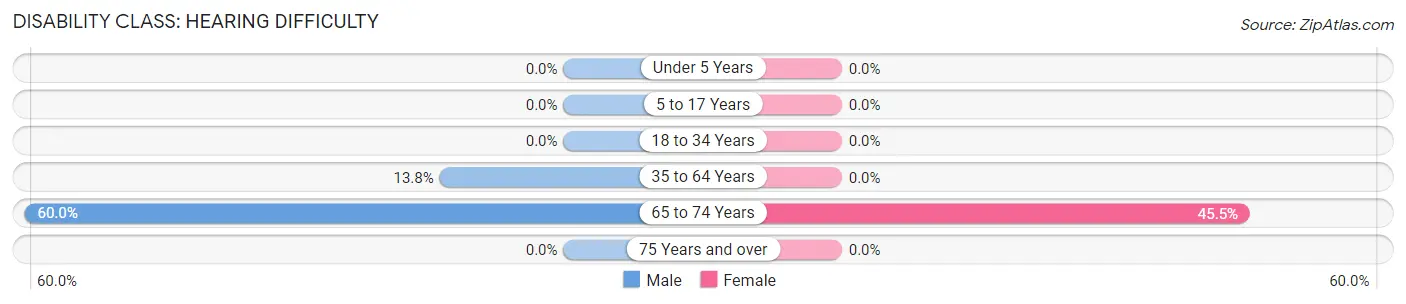
| Age Bracket | Male | Female |
| Under 5 Years | 0 (0.0%) | 0 (0.0%) |
| 5 to 17 Years | 0 (0.0%) | 0 (0.0%) |
| 18 to 34 Years | 0 (0.0%) | 0 (0.0%) |
| 35 to 64 Years | 4 (13.8%) | 0 (0.0%) |
| 65 to 74 Years | 6 (60.0%) | 5 (45.5%) |
| 75 Years and over | 0 (0.0%) | 0 (0.0%) |
Disability Class: Vision Difficulty
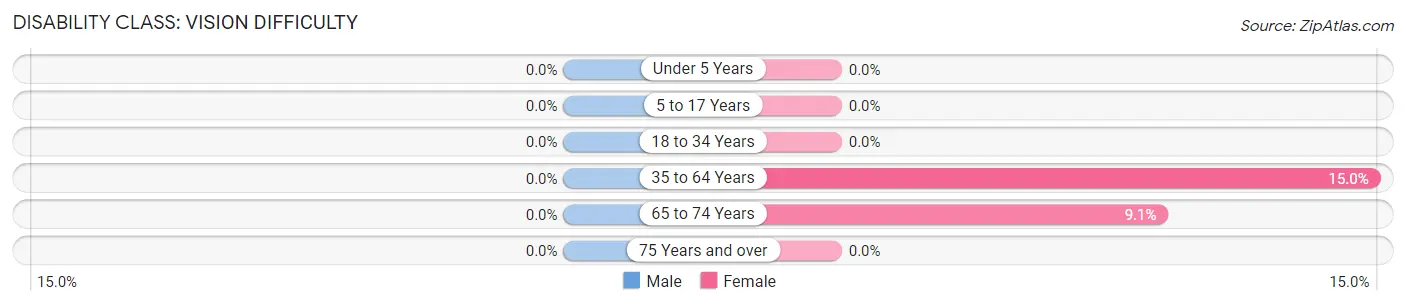
| Age Bracket | Male | Female |
| Under 5 Years | 0 (0.0%) | 0 (0.0%) |
| 5 to 17 Years | 0 (0.0%) | 0 (0.0%) |
| 18 to 34 Years | 0 (0.0%) | 0 (0.0%) |
| 35 to 64 Years | 0 (0.0%) | 6 (15.0%) |
| 65 to 74 Years | 0 (0.0%) | 1 (9.1%) |
| 75 Years and over | 0 (0.0%) | 0 (0.0%) |
Disability Class: Cognitive Difficulty
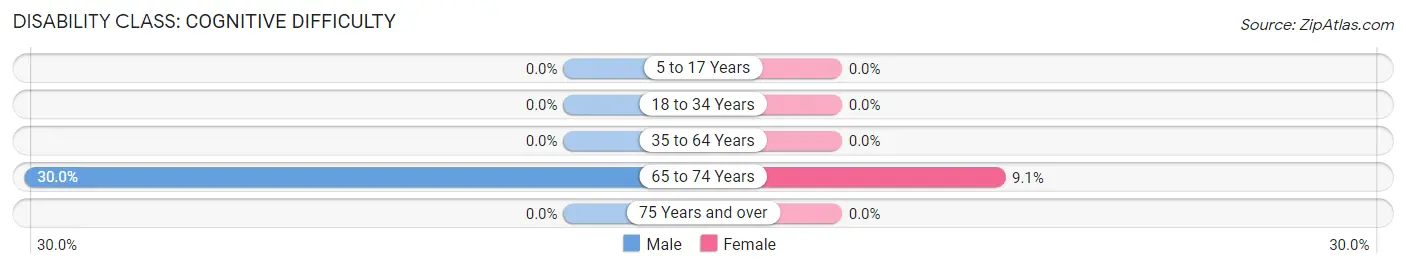
| Age Bracket | Male | Female |
| 5 to 17 Years | 0 (0.0%) | 0 (0.0%) |
| 18 to 34 Years | 0 (0.0%) | 0 (0.0%) |
| 35 to 64 Years | 0 (0.0%) | 0 (0.0%) |
| 65 to 74 Years | 3 (30.0%) | 1 (9.1%) |
| 75 Years and over | 0 (0.0%) | 0 (0.0%) |
Disability Class: Ambulatory Difficulty
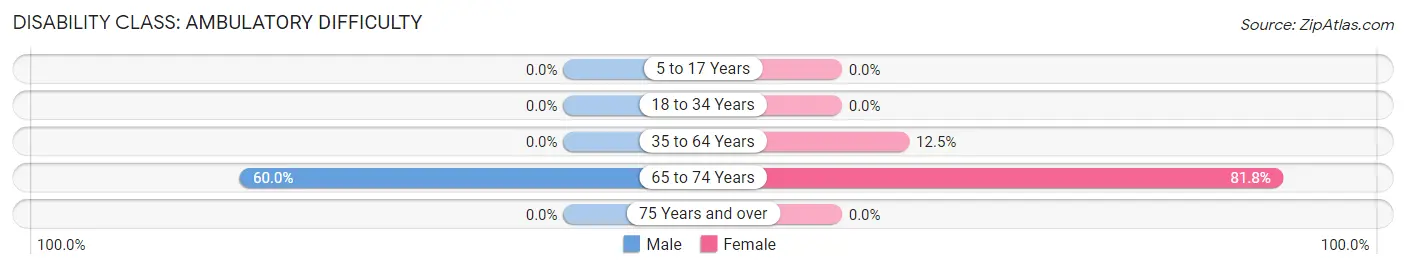
| Age Bracket | Male | Female |
| 5 to 17 Years | 0 (0.0%) | 0 (0.0%) |
| 18 to 34 Years | 0 (0.0%) | 0 (0.0%) |
| 35 to 64 Years | 0 (0.0%) | 5 (12.5%) |
| 65 to 74 Years | 6 (60.0%) | 9 (81.8%) |
| 75 Years and over | 0 (0.0%) | 0 (0.0%) |
Disability Class: Self-Care Difficulty
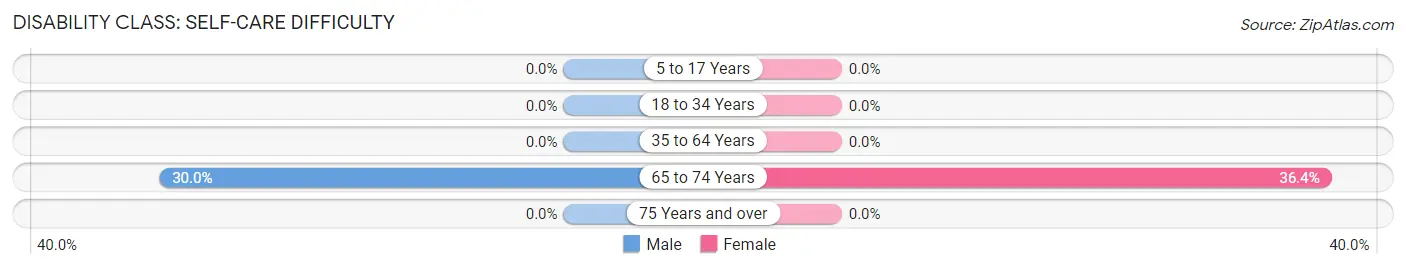
| Age Bracket | Male | Female |
| 5 to 17 Years | 0 (0.0%) | 0 (0.0%) |
| 18 to 34 Years | 0 (0.0%) | 0 (0.0%) |
| 35 to 64 Years | 0 (0.0%) | 0 (0.0%) |
| 65 to 74 Years | 3 (30.0%) | 4 (36.4%) |
| 75 Years and over | 0 (0.0%) | 0 (0.0%) |
Technology Access in Nanwalek
Computing Device Access in Nanwalek
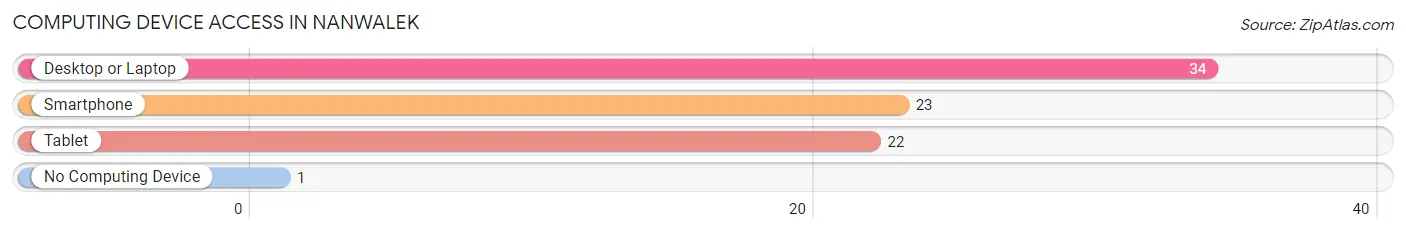
| Device Type | # Households | % Households |
| Desktop or Laptop | 34 | 89.5% |
| Smartphone | 23 | 60.5% |
| Tablet | 22 | 57.9% |
| No Computing Device | 1 | 2.6% |
| Total | 38 | 100.0% |
Internet Access in Nanwalek
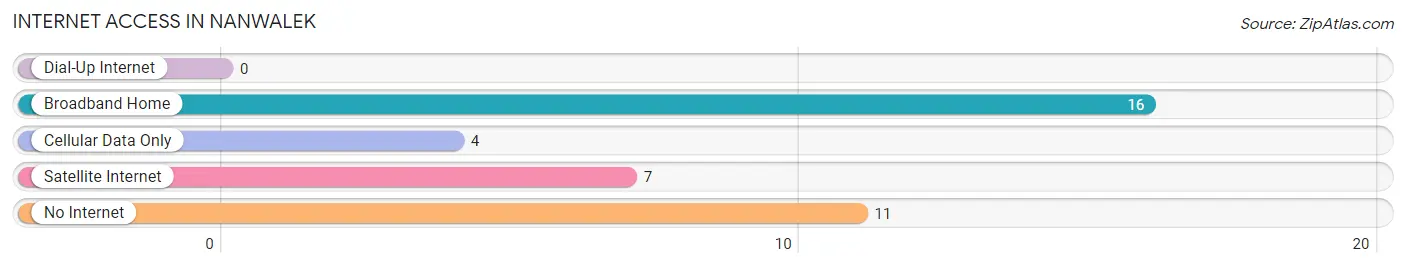
| Internet Type | # Households | % Households |
| Dial-Up Internet | 0 | 0.0% |
| Broadband Home | 16 | 42.1% |
| Cellular Data Only | 4 | 10.5% |
| Satellite Internet | 7 | 18.4% |
| No Internet | 11 | 28.9% |
| Total | 38 | 100.0% |
Nanwalek Summary
Nanwalek, Alaska is a small, unincorporated community located on the southern tip of the Kenai Peninsula in the state of Alaska. It is situated on the shores of Kachemak Bay, approximately 40 miles southwest of the city of Homer. The community is home to approximately 200 people, most of whom are of Alutiiq descent.
History
Nanwalek has a long and rich history that dates back to the early 1800s. The area was first inhabited by the Alutiiq people, who were the original inhabitants of the Kenai Peninsula. The Alutiiq people were semi-nomadic, living off the land and sea. They hunted, fished, and gathered food from the surrounding area.
In 1847, the Russian-American Company established a trading post in Nanwalek, which was the first permanent settlement in the area. The trading post was used to trade goods with the Alutiiq people, such as furs, fish, and other items.
In 1867, the United States purchased Alaska from Russia, and the area became part of the United States. In 1891, the United States government established a school in Nanwalek, which was the first school in the area.
In the early 1900s, the area began to experience an influx of settlers from the lower 48 states. These settlers were primarily of Scandinavian descent, and they established a fishing industry in the area. This industry was the primary source of income for the community for many years.
In the 1950s, the Alaska Native Claims Settlement Act was passed, which allowed the Alutiiq people to reclaim their ancestral lands. This allowed the Alutiiq people to reestablish their traditional way of life in the area.
Geography
Nanwalek is located on the southern tip of the Kenai Peninsula in the state of Alaska. It is situated on the shores of Kachemak Bay, approximately 40 miles southwest of the city of Homer. The area is surrounded by mountains and is home to numerous glaciers.
The climate in Nanwalek is mild and temperate. The average temperature in the summer is around 60 degrees Fahrenheit, and the average temperature in the winter is around 20 degrees Fahrenheit. The area receives an average of 40 inches of precipitation per year.
Economy
The economy of Nanwalek is primarily based on fishing and tourism. The fishing industry is the primary source of income for the community, and it is responsible for providing jobs for many of the residents. The area is also home to numerous tourist attractions, such as the Alaska Wildlife Conservation Center and the Alaska SeaLife Center.
The area is also home to several small businesses, such as restaurants, gift shops, and lodging. These businesses provide additional employment opportunities for the residents of Nanwalek.
Demographics
As of the 2010 census, the population of Nanwalek was approximately 200 people. The majority of the population is of Alutiiq descent, and the primary language spoken is English.
The median household income in Nanwalek is approximately $50,000 per year. The median age of the population is approximately 40 years old. The majority of the population is employed in the fishing industry or in tourism-related businesses.
Conclusion
Nanwalek, Alaska is a small, unincorporated community located on the southern tip of the Kenai Peninsula in the state of Alaska. It is home to approximately 200 people, most of whom are of Alutiiq descent. The economy of Nanwalek is primarily based on fishing and tourism, and the majority of the population is employed in these industries. The area is also home to numerous tourist attractions, such as the Alaska Wildlife Conservation Center and the Alaska SeaLife Center.
Common Questions
What is Per Capita Income in Nanwalek?
Per Capita income in Nanwalek is $19,328.
What is the Median Family Income in Nanwalek?
Median Family Income in Nanwalek is $58,750.
What is the Median Household income in Nanwalek?
Median Household Income in Nanwalek is $58,000.
What is Inequality or Gini Index in Nanwalek?
Inequality or Gini Index in Nanwalek is 0.28.
What is the Total Population of Nanwalek?
Total Population of Nanwalek is 172.
What is the Total Male Population of Nanwalek?
Total Male Population of Nanwalek is 58.
What is the Total Female Population of Nanwalek?
Total Female Population of Nanwalek is 114.
What is the Ratio of Males per 100 Females in Nanwalek?
There are 50.88 Males per 100 Females in Nanwalek.
What is the Ratio of Females per 100 Males in Nanwalek?
There are 196.55 Females per 100 Males in Nanwalek.
What is the Median Population Age in Nanwalek?
Median Population Age in Nanwalek is 39.3 Years.
What is the Average Family Size in Nanwalek
Average Family Size in Nanwalek is 4.7 People.
What is the Average Household Size in Nanwalek
Average Household Size in Nanwalek is 4.5 People.
How Large is the Labor Force in Nanwalek?
There are 71 People in the Labor Forcein in Nanwalek.
What is the Percentage of People in the Labor Force in Nanwalek?
52.2% of People are in the Labor Force in Nanwalek.