Pueblo, CO Map & Demographics
Pueblo Map
Pueblo Overview
$28,968
PER CAPITA INCOME
$64,594
AVG FAMILY INCOME
$52,794
AVG HOUSEHOLD INCOME
19.1%
WAGE / INCOME GAP [ % ]
80.9¢/ $1
WAGE / INCOME GAP [ $ ]
$10,090
FAMILY INCOME DEFICIT
0.47
INEQUALITY / GINI INDEX
111,430
TOTAL POPULATION
55,420
MALE POPULATION
56,010
FEMALE POPULATION
98.95
MALES / 100 FEMALES
101.06
FEMALES / 100 MALES
37.8
MEDIAN AGE
3.1
AVG FAMILY SIZE
2.3
AVG HOUSEHOLD SIZE
48,550
LABOR FORCE [ PEOPLE ]
54.6%
PERCENT IN LABOR FORCE
6.6%
UNEMPLOYMENT RATE
Pueblo Area Codes
Income in Pueblo
Income Overview in Pueblo
Per Capita Income in Pueblo is $28,968, while median incomes of families and households are $64,594 and $52,794 respectively.
| Characteristic | Number | Measure |
| Per Capita Income | 111,430 | $28,968 |
| Median Family Income | 26,152 | $64,594 |
| Mean Family Income | 26,152 | $83,100 |
| Median Household Income | 45,782 | $52,794 |
| Mean Household Income | 45,782 | $68,258 |
| Income Deficit | 26,152 | $10,090 |
| Wage / Income Gap (%) | 111,430 | 19.07% |
| Wage / Income Gap ($) | 111,430 | 80.93¢ per $1 |
| Gini / Inequality Index | 111,430 | 0.47 |
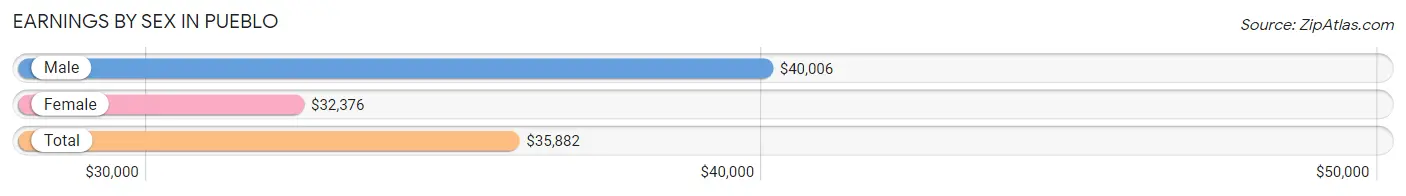
Earnings by Sex in Pueblo
Average Earnings in Pueblo are $35,882, $40,006 for men and $32,376 for women, a difference of 19.1%.
| Sex | Number | Average Earnings |
| Male | 26,624 (52.6%) | $40,006 |
| Female | 23,960 (47.4%) | $32,376 |
| Total | 50,584 (100.0%) | $35,882 |
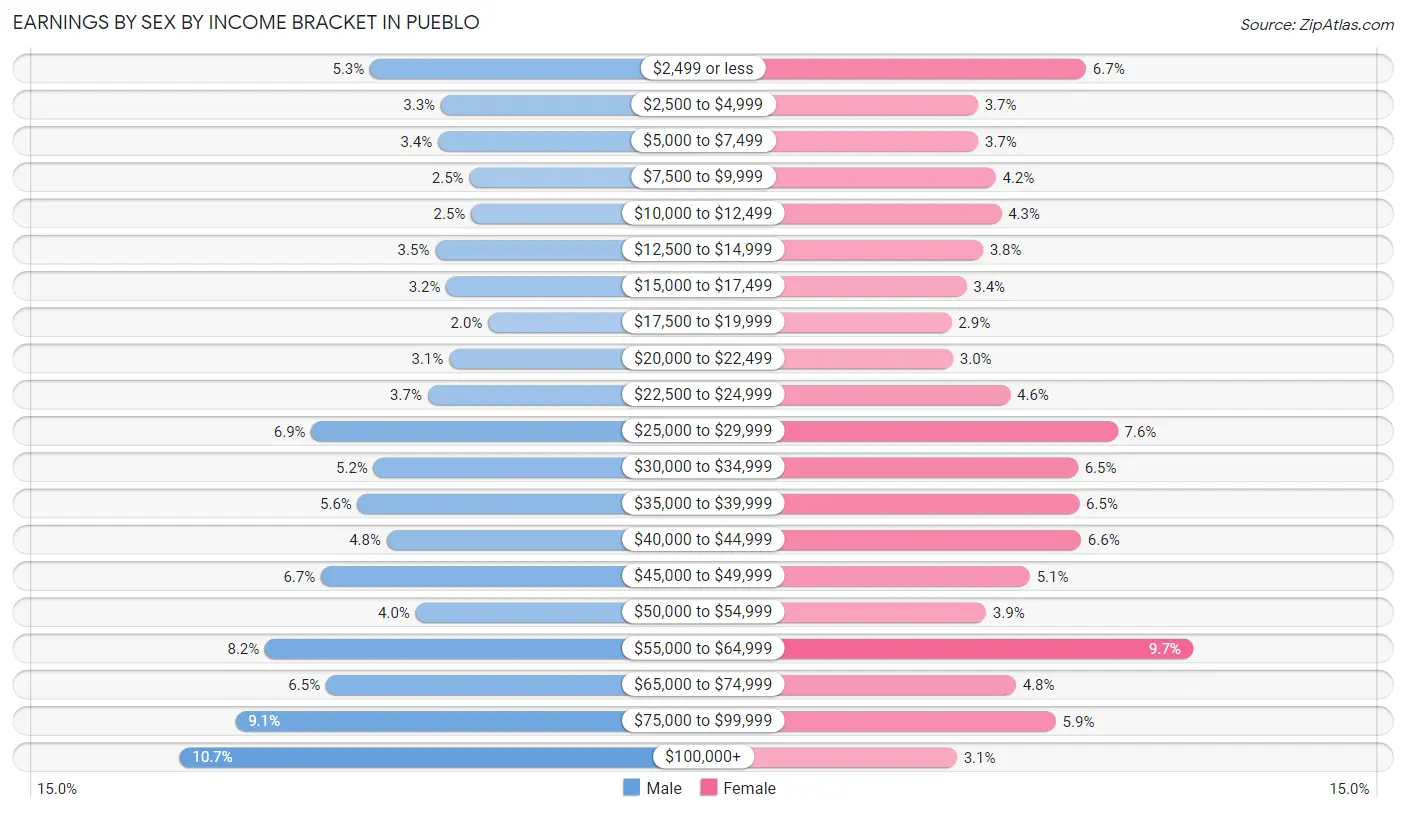
Earnings by Sex by Income Bracket in Pueblo
The most common earnings brackets in Pueblo are $100,000+ for men (2,835 | 10.6%) and $55,000 to $64,999 for women (2,330 | 9.7%).
| Income | Male | Female |
| $2,499 or less | 1,409 (5.3%) | 1,611 (6.7%) |
| $2,500 to $4,999 | 878 (3.3%) | 881 (3.7%) |
| $5,000 to $7,499 | 900 (3.4%) | 884 (3.7%) |
| $7,500 to $9,999 | 665 (2.5%) | 1,002 (4.2%) |
| $10,000 to $12,499 | 652 (2.5%) | 1,041 (4.3%) |
| $12,500 to $14,999 | 920 (3.5%) | 915 (3.8%) |
| $15,000 to $17,499 | 838 (3.2%) | 805 (3.4%) |
| $17,500 to $19,999 | 525 (2.0%) | 705 (2.9%) |
| $20,000 to $22,499 | 817 (3.1%) | 713 (3.0%) |
| $22,500 to $24,999 | 976 (3.7%) | 1,099 (4.6%) |
| $25,000 to $29,999 | 1,847 (6.9%) | 1,824 (7.6%) |
| $30,000 to $34,999 | 1,381 (5.2%) | 1,555 (6.5%) |
| $35,000 to $39,999 | 1,502 (5.6%) | 1,565 (6.5%) |
| $40,000 to $44,999 | 1,284 (4.8%) | 1,577 (6.6%) |
| $45,000 to $49,999 | 1,775 (6.7%) | 1,231 (5.1%) |
| $50,000 to $54,999 | 1,068 (4.0%) | 937 (3.9%) |
| $55,000 to $64,999 | 2,195 (8.2%) | 2,330 (9.7%) |
| $65,000 to $74,999 | 1,739 (6.5%) | 1,138 (4.8%) |
| $75,000 to $99,999 | 2,418 (9.1%) | 1,406 (5.9%) |
| $100,000+ | 2,835 (10.6%) | 741 (3.1%) |
| Total | 26,624 (100.0%) | 23,960 (100.0%) |
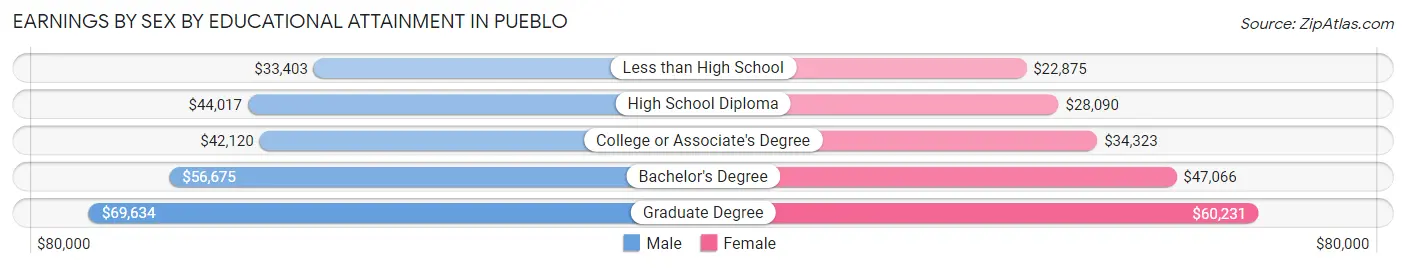
Earnings by Sex by Educational Attainment in Pueblo
Average earnings in Pueblo are $45,628 for men and $36,537 for women, a difference of 19.9%. Men with an educational attainment of graduate degree enjoy the highest average annual earnings of $69,634, while those with less than high school education earn the least with $33,403. Women with an educational attainment of graduate degree earn the most with the average annual earnings of $60,231, while those with less than high school education have the smallest earnings of $22,875.
| Educational Attainment | Male Income | Female Income |
| Less than High School | $33,403 | $22,875 |
| High School Diploma | $44,017 | $28,090 |
| College or Associate's Degree | $42,120 | $34,323 |
| Bachelor's Degree | $56,675 | $47,066 |
| Graduate Degree | $69,634 | $60,231 |
| Total | $45,628 | $36,537 |
Family Income in Pueblo
Family Income Brackets in Pueblo
According to the Pueblo family income data, there are 5,440 families falling into the $50,000 to $74,999 income range, which is the most common income bracket and makes up 20.8% of all families. Conversely, the $10,000 to $14,999 income bracket is the least frequent group with only 994 families (3.8%) belonging to this category.
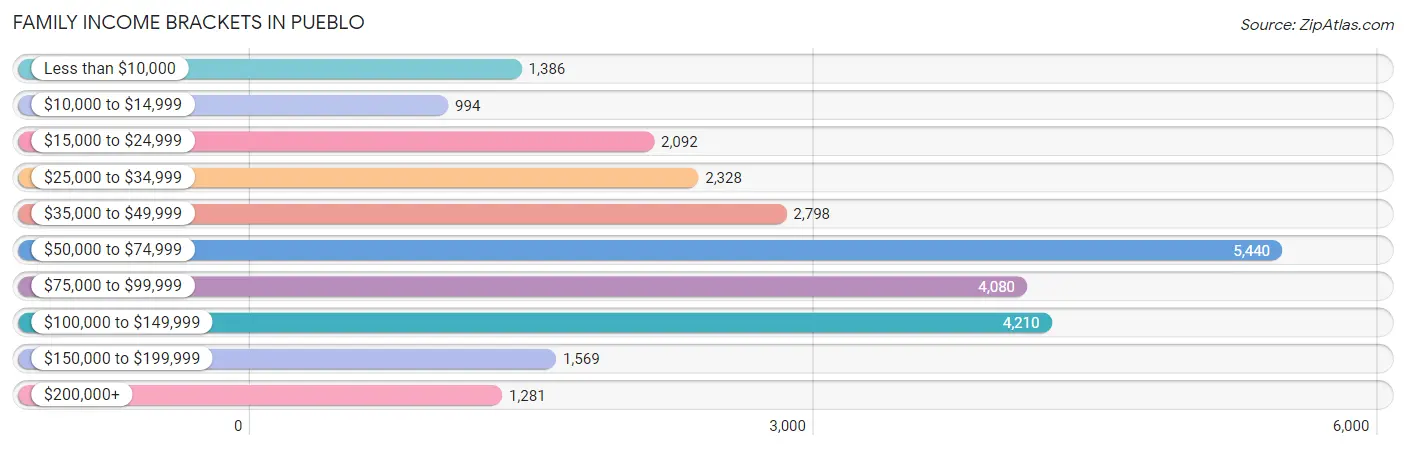
| Income Bracket | # Families | % Families |
| Less than $10,000 | 1,386 | 5.3% |
| $10,000 to $14,999 | 994 | 3.8% |
| $15,000 to $24,999 | 2,092 | 8.0% |
| $25,000 to $34,999 | 2,328 | 8.9% |
| $35,000 to $49,999 | 2,798 | 10.7% |
| $50,000 to $74,999 | 5,440 | 20.8% |
| $75,000 to $99,999 | 4,080 | 15.6% |
| $100,000 to $149,999 | 4,210 | 16.1% |
| $150,000 to $199,999 | 1,569 | 6.0% |
| $200,000+ | 1,281 | 4.9% |
Family Income by Famaliy Size in Pueblo
5-person families (1,694 | 6.5%) account for the highest median family income in Pueblo with $85,579 per family, while 2-person families (12,419 | 47.5%) have the highest median income of $29,828 per family member.
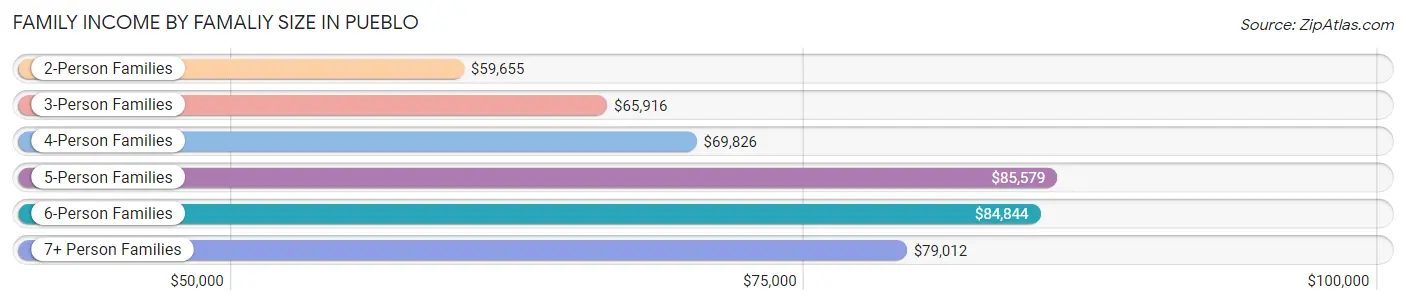
| Income Bracket | # Families | Median Income |
| 2-Person Families | 12,419 (47.5%) | $59,655 |
| 3-Person Families | 6,489 (24.8%) | $65,916 |
| 4-Person Families | 4,520 (17.3%) | $69,826 |
| 5-Person Families | 1,694 (6.5%) | $85,579 |
| 6-Person Families | 644 (2.5%) | $84,844 |
| 7+ Person Families | 386 (1.5%) | $79,012 |
| Total | 26,152 (100.0%) | $64,594 |
Family Income by Number of Earners in Pueblo
The median family income in Pueblo is $64,594, with families comprising 3+ earners (2,159) having the highest median family income of $119,828, while families with no earners (5,036) have the lowest median family income of $36,152, accounting for 8.3% and 19.3% of families, respectively.
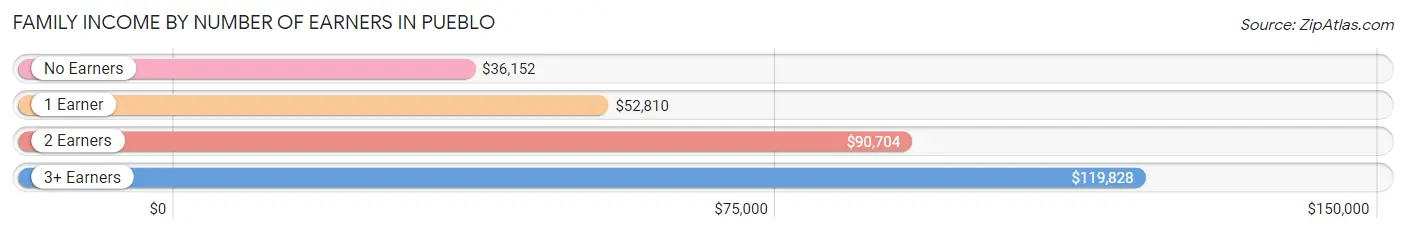
| Number of Earners | # Families | Median Income |
| No Earners | 5,036 (19.3%) | $36,152 |
| 1 Earner | 10,299 (39.4%) | $52,810 |
| 2 Earners | 8,658 (33.1%) | $90,704 |
| 3+ Earners | 2,159 (8.3%) | $119,828 |
| Total | 26,152 (100.0%) | $64,594 |
Household Income in Pueblo
Household Income Brackets in Pueblo
With 9,019 households falling in the category, the $50,000 to $74,999 income range is the most frequent in Pueblo, accounting for 19.7% of all households. In contrast, only 1,602 households (3.5%) fall into the $200,000+ income bracket, making it the least populous group.
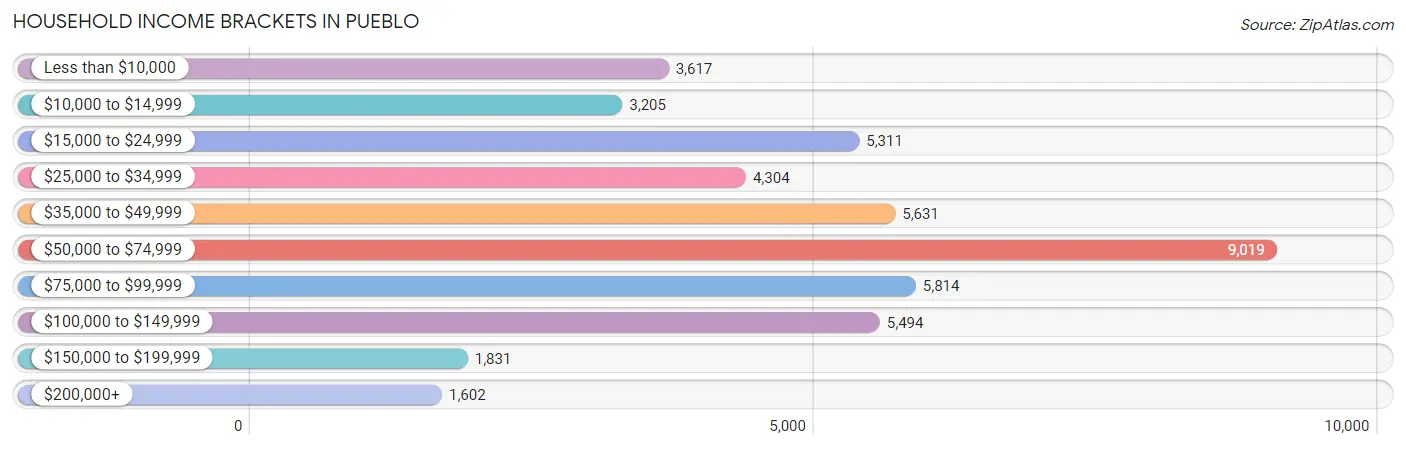
| Income Bracket | # Households | % Households |
| Less than $10,000 | 3,617 | 7.9% |
| $10,000 to $14,999 | 3,205 | 7.0% |
| $15,000 to $24,999 | 5,311 | 11.6% |
| $25,000 to $34,999 | 4,304 | 9.4% |
| $35,000 to $49,999 | 5,631 | 12.3% |
| $50,000 to $74,999 | 9,019 | 19.7% |
| $75,000 to $99,999 | 5,814 | 12.7% |
| $100,000 to $149,999 | 5,494 | 12.0% |
| $150,000 to $199,999 | 1,831 | 4.0% |
| $200,000+ | 1,602 | 3.5% |
Household Income by Householder Age in Pueblo
The median household income in Pueblo is $52,794, with the highest median household income of $59,719 found in the 25 to 44 years age bracket for the primary householder. A total of 14,346 households (31.3%) fall into this category. Meanwhile, the 65+ years age bracket for the primary householder has the lowest median household income of $40,439, with 13,635 households (29.8%) in this group.
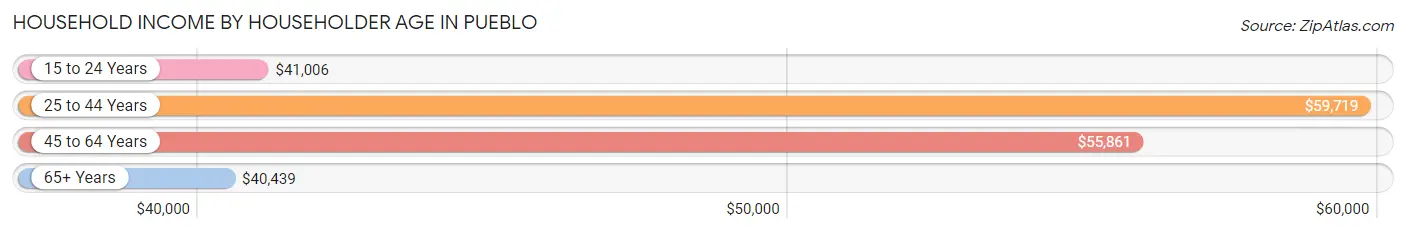
| Income Bracket | # Households | Median Income |
| 15 to 24 Years | 2,326 (5.1%) | $41,006 |
| 25 to 44 Years | 14,346 (31.3%) | $59,719 |
| 45 to 64 Years | 15,475 (33.8%) | $55,861 |
| 65+ Years | 13,635 (29.8%) | $40,439 |
| Total | 45,782 (100.0%) | $52,794 |
Poverty in Pueblo
Income Below Poverty by Sex and Age in Pueblo
With 20.1% poverty level for males and 21.1% for females among the residents of Pueblo, 5 year old males and 15 year old females are the most vulnerable to poverty, with 245 males (37.8%) and 331 females (41.2%) in their respective age groups living below the poverty level.
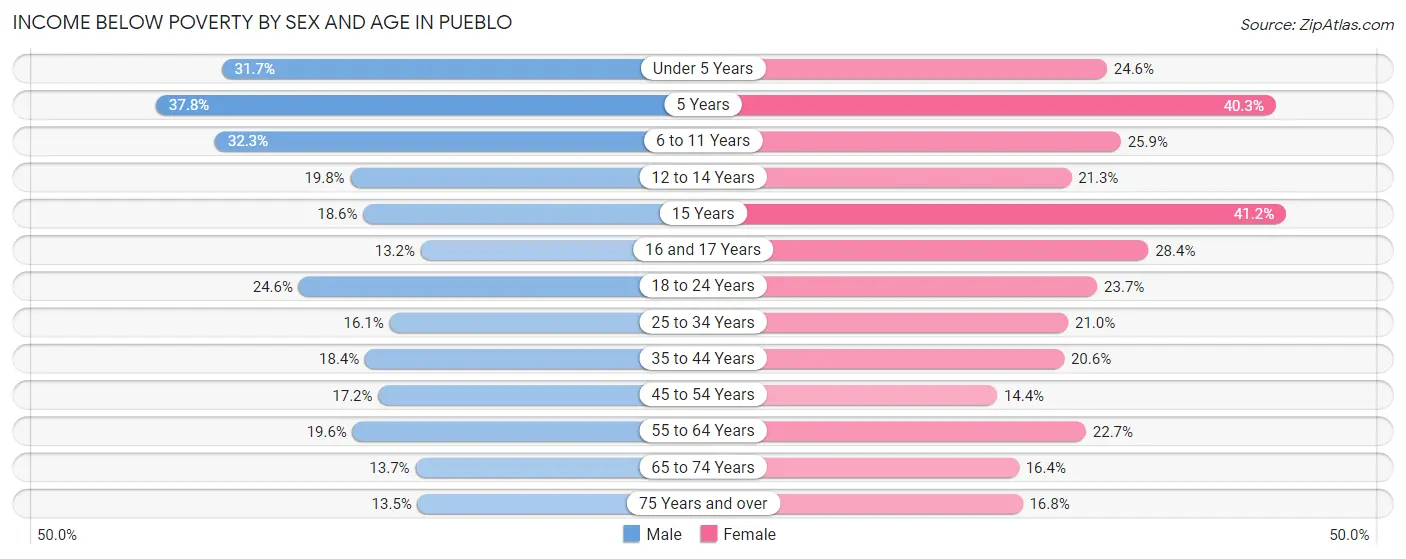
| Age Bracket | Male | Female |
| Under 5 Years | 1,161 (31.7%) | 797 (24.6%) |
| 5 Years | 245 (37.8%) | 358 (40.3%) |
| 6 to 11 Years | 1,305 (32.3%) | 986 (25.9%) |
| 12 to 14 Years | 464 (19.8%) | 380 (21.3%) |
| 15 Years | 177 (18.6%) | 331 (41.2%) |
| 16 and 17 Years | 160 (13.2%) | 374 (28.4%) |
| 18 to 24 Years | 1,224 (24.5%) | 1,114 (23.7%) |
| 25 to 34 Years | 1,308 (16.1%) | 1,527 (21.0%) |
| 35 to 44 Years | 1,243 (18.4%) | 1,379 (20.6%) |
| 45 to 54 Years | 990 (17.2%) | 857 (14.4%) |
| 55 to 64 Years | 1,234 (19.6%) | 1,582 (22.7%) |
| 65 to 74 Years | 708 (13.7%) | 993 (16.4%) |
| 75 Years and over | 431 (13.5%) | 827 (16.8%) |
| Total | 10,650 (20.1%) | 11,505 (21.1%) |
Income Above Poverty by Sex and Age in Pueblo
According to the poverty statistics in Pueblo, males aged 16 and 17 years and females aged 45 to 54 years are the age groups that are most secure financially, with 86.8% of males and 85.6% of females in these age groups living above the poverty line.
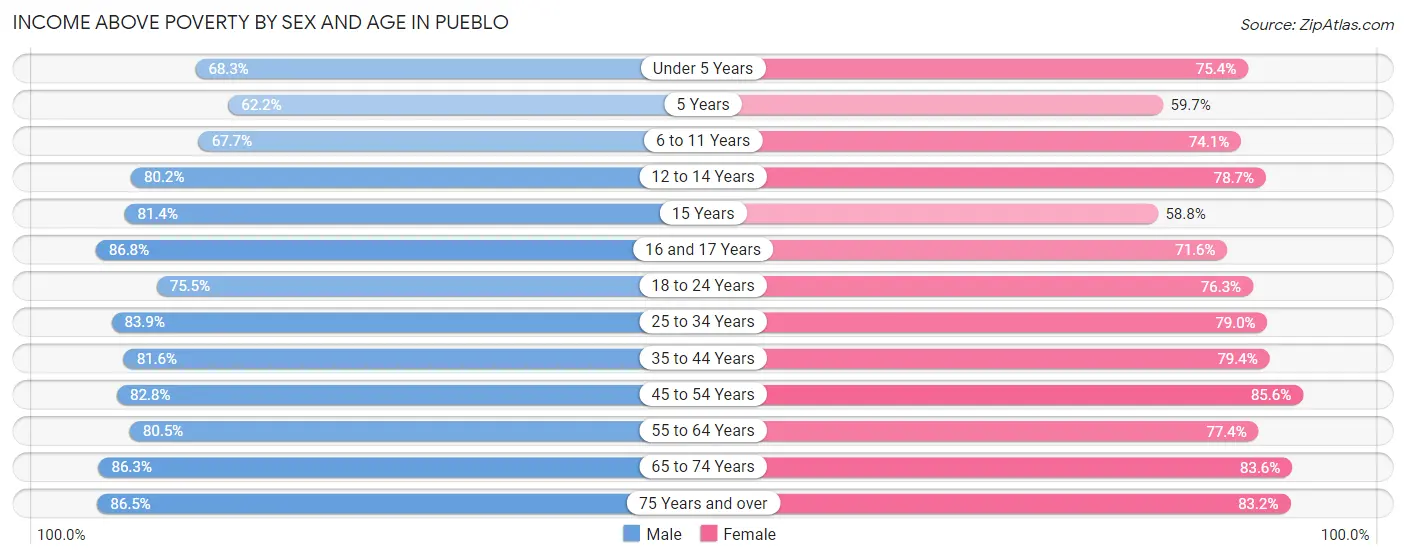
| Age Bracket | Male | Female |
| Under 5 Years | 2,499 (68.3%) | 2,443 (75.4%) |
| 5 Years | 403 (62.2%) | 531 (59.7%) |
| 6 to 11 Years | 2,730 (67.7%) | 2,823 (74.1%) |
| 12 to 14 Years | 1,884 (80.2%) | 1,405 (78.7%) |
| 15 Years | 776 (81.4%) | 472 (58.8%) |
| 16 and 17 Years | 1,049 (86.8%) | 941 (71.6%) |
| 18 to 24 Years | 3,761 (75.4%) | 3,587 (76.3%) |
| 25 to 34 Years | 6,801 (83.9%) | 5,743 (79.0%) |
| 35 to 44 Years | 5,513 (81.6%) | 5,309 (79.4%) |
| 45 to 54 Years | 4,775 (82.8%) | 5,096 (85.6%) |
| 55 to 64 Years | 5,079 (80.4%) | 5,403 (77.3%) |
| 65 to 74 Years | 4,447 (86.3%) | 5,053 (83.6%) |
| 75 Years and over | 2,758 (86.5%) | 4,104 (83.2%) |
| Total | 42,475 (79.9%) | 42,910 (78.9%) |
Income Below Poverty Among Married-Couple Families in Pueblo
The poverty statistics for married-couple families in Pueblo show that 8.1% or 1,309 of the total 16,220 families live below the poverty line. Families with 5 or more children have the highest poverty rate of 30.4%, comprising of 21 families. On the other hand, families with no children have the lowest poverty rate of 5.6%, which includes 535 families.
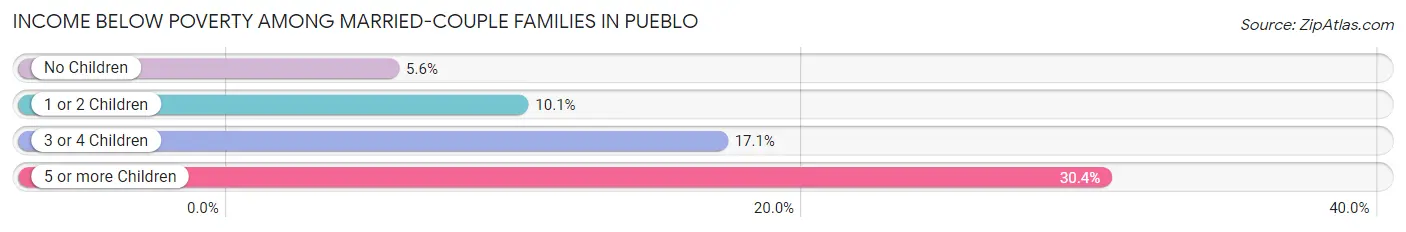
| Children | Above Poverty | Below Poverty |
| No Children | 8,996 (94.4%) | 535 (5.6%) |
| 1 or 2 Children | 4,865 (89.9%) | 547 (10.1%) |
| 3 or 4 Children | 1,002 (83.0%) | 206 (17.1%) |
| 5 or more Children | 48 (69.6%) | 21 (30.4%) |
| Total | 14,911 (91.9%) | 1,309 (8.1%) |
Income Below Poverty Among Single-Parent Households in Pueblo
According to the poverty data in Pueblo, 20.9% or 650 single-father households and 33.1% or 2,258 single-mother households are living below the poverty line. Among single-father households, those with 5 or more children have the highest poverty rate, with 7 households (100.0%) experiencing poverty. Likewise, among single-mother households, those with 3 or 4 children have the highest poverty rate, with 522 households (56.6%) falling below the poverty line.
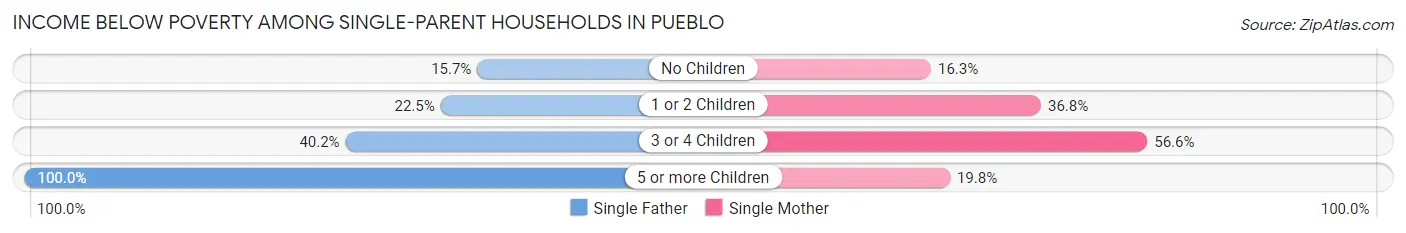
| Children | Single Father | Single Mother |
| No Children | 227 (15.7%) | 332 (16.3%) |
| 1 or 2 Children | 315 (22.5%) | 1,384 (36.8%) |
| 3 or 4 Children | 101 (40.2%) | 522 (56.6%) |
| 5 or more Children | 7 (100.0%) | 20 (19.8%) |
| Total | 650 (20.9%) | 2,258 (33.1%) |
Income Below Poverty Among Married-Couple vs Single-Parent Households in Pueblo
The poverty data for Pueblo shows that 1,309 of the married-couple family households (8.1%) and 2,908 of the single-parent households (29.3%) are living below the poverty level. Within the married-couple family households, those with 5 or more children have the highest poverty rate, with 21 households (30.4%) falling below the poverty line. Among the single-parent households, those with 3 or 4 children have the highest poverty rate, with 623 household (53.1%) living below poverty.
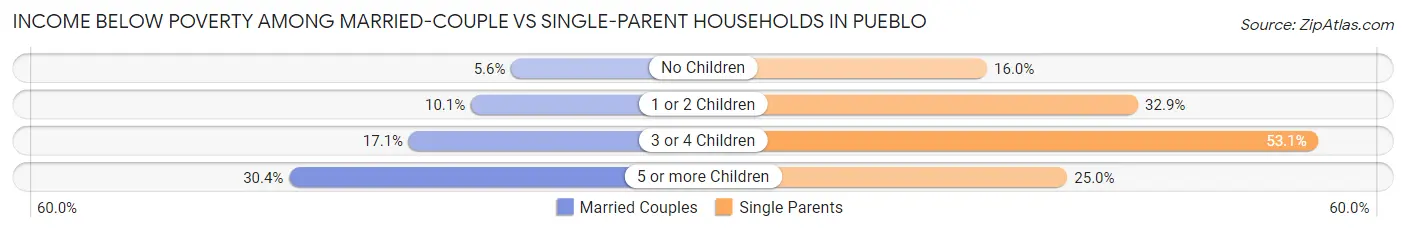
| Children | Married-Couple Families | Single-Parent Households |
| No Children | 535 (5.6%) | 559 (16.0%) |
| 1 or 2 Children | 547 (10.1%) | 1,699 (32.9%) |
| 3 or 4 Children | 206 (17.1%) | 623 (53.1%) |
| 5 or more Children | 21 (30.4%) | 27 (25.0%) |
| Total | 1,309 (8.1%) | 2,908 (29.3%) |
Race in Pueblo
The most populous races in Pueblo are White / Caucasian (79,982 | 71.8%), Hispanic or Latino (55,664 | 49.9%), and Two or more Races (13,769 | 12.4%).
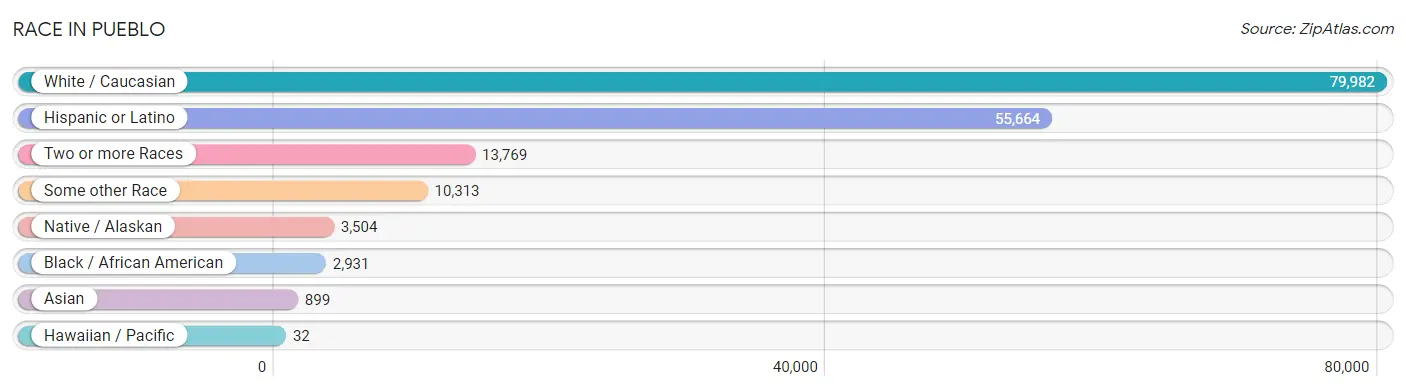
| Race | # Population | % Population |
| Asian | 899 | 0.8% |
| Black / African American | 2,931 | 2.6% |
| Hawaiian / Pacific | 32 | 0.0% |
| Hispanic or Latino | 55,664 | 49.9% |
| Native / Alaskan | 3,504 | 3.1% |
| White / Caucasian | 79,982 | 71.8% |
| Two or more Races | 13,769 | 12.4% |
| Some other Race | 10,313 | 9.3% |
| Total | 111,430 | 100.0% |
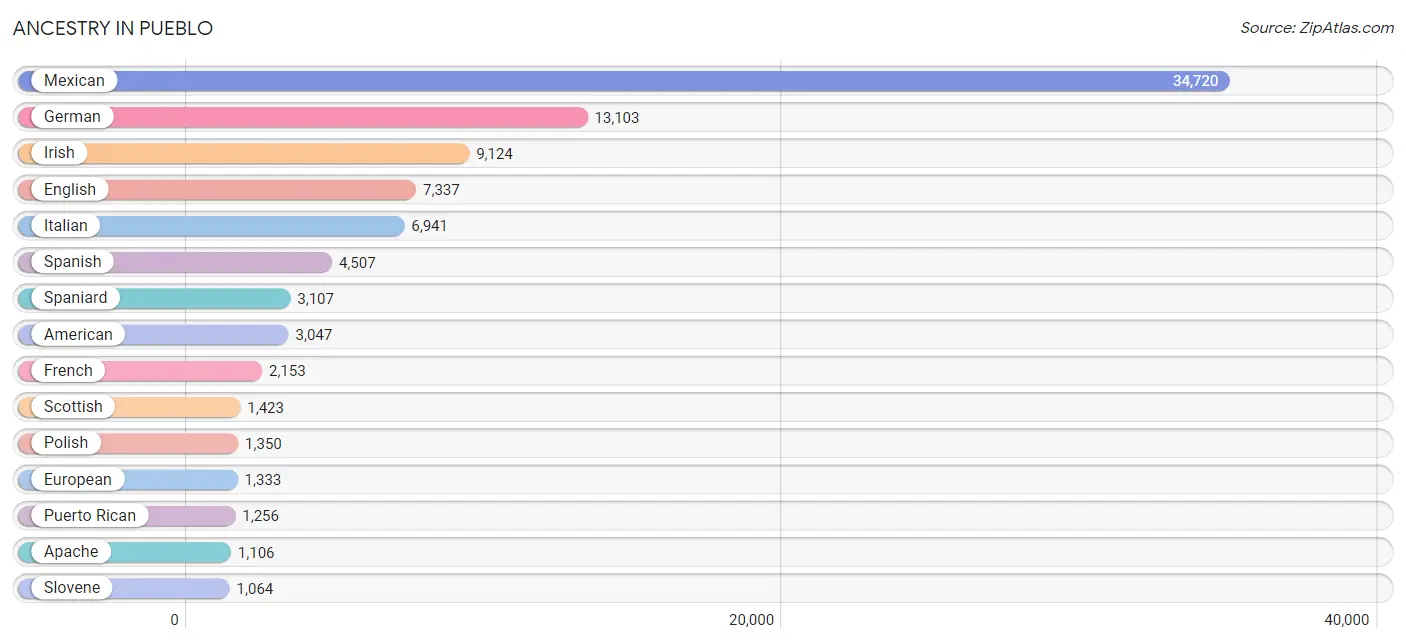
Ancestry in Pueblo
The most populous ancestries reported in Pueblo are Mexican (34,720 | 31.2%), German (13,103 | 11.8%), Irish (9,124 | 8.2%), English (7,337 | 6.6%), and Italian (6,941 | 6.2%), together accounting for 63.9% of all Pueblo residents.
| Ancestry | # Population | % Population |
| African | 74 | 0.1% |
| Aleut | 37 | 0.0% |
| American | 3,047 | 2.7% |
| Apache | 1,106 | 1.0% |
| Arab | 336 | 0.3% |
| Argentinean | 195 | 0.2% |
| Armenian | 6 | 0.0% |
| Austrian | 204 | 0.2% |
| Basque | 38 | 0.0% |
| Belgian | 41 | 0.0% |
| Bhutanese | 334 | 0.3% |
| Blackfeet | 115 | 0.1% |
| Bolivian | 16 | 0.0% |
| Brazilian | 177 | 0.2% |
| British | 419 | 0.4% |
| Burmese | 540 | 0.5% |
| Cajun | 7 | 0.0% |
| Canadian | 44 | 0.0% |
| Celtic | 16 | 0.0% |
| Central American | 547 | 0.5% |
| Central American Indian | 68 | 0.1% |
| Cherokee | 923 | 0.8% |
| Cheyenne | 67 | 0.1% |
| Chickasaw | 189 | 0.2% |
| Chilean | 36 | 0.0% |
| Chippewa | 124 | 0.1% |
| Choctaw | 43 | 0.0% |
| Colombian | 74 | 0.1% |
| Comanche | 200 | 0.2% |
| Croatian | 103 | 0.1% |
| Crow | 3 | 0.0% |
| Cuban | 177 | 0.2% |
| Czech | 379 | 0.3% |
| Czechoslovakian | 34 | 0.0% |
| Danish | 303 | 0.3% |
| Delaware | 19 | 0.0% |
| Dominican | 38 | 0.0% |
| Dutch | 866 | 0.8% |
| Eastern European | 64 | 0.1% |
| Egyptian | 14 | 0.0% |
| English | 7,337 | 6.6% |
| European | 1,333 | 1.2% |
| Finnish | 140 | 0.1% |
| French | 2,153 | 1.9% |
| French Canadian | 210 | 0.2% |
| German | 13,103 | 11.8% |
| Greek | 223 | 0.2% |
| Guamanian / Chamorro | 53 | 0.1% |
| Guatemalan | 106 | 0.1% |
| Honduran | 115 | 0.1% |
| Hopi | 10 | 0.0% |
| Hungarian | 275 | 0.3% |
| Icelander | 85 | 0.1% |
| Indian (Asian) | 189 | 0.2% |
| Iranian | 4 | 0.0% |
| Iraqi | 42 | 0.0% |
| Irish | 9,124 | 8.2% |
| Iroquois | 41 | 0.0% |
| Israeli | 8 | 0.0% |
| Italian | 6,941 | 6.2% |
| Jamaican | 116 | 0.1% |
| Kiowa | 13 | 0.0% |
| Korean | 638 | 0.6% |
| Lebanese | 236 | 0.2% |
| Lithuanian | 23 | 0.0% |
| Luxembourger | 41 | 0.0% |
| Mexican | 34,720 | 31.2% |
| Mexican American Indian | 447 | 0.4% |
| Native Hawaiian | 217 | 0.2% |
| Navajo | 928 | 0.8% |
| Nigerian | 27 | 0.0% |
| Northern European | 83 | 0.1% |
| Norwegian | 1,011 | 0.9% |
| Okinawan | 3 | 0.0% |
| Paiute | 185 | 0.2% |
| Pakistani | 71 | 0.1% |
| Panamanian | 73 | 0.1% |
| Pennsylvania German | 42 | 0.0% |
| Peruvian | 53 | 0.1% |
| Polish | 1,350 | 1.2% |
| Portuguese | 223 | 0.2% |
| Potawatomi | 82 | 0.1% |
| Pueblo | 168 | 0.2% |
| Puerto Rican | 1,256 | 1.1% |
| Romanian | 138 | 0.1% |
| Russian | 431 | 0.4% |
| Salvadoran | 253 | 0.2% |
| Samoan | 66 | 0.1% |
| Scandinavian | 300 | 0.3% |
| Scotch-Irish | 1,024 | 0.9% |
| Scottish | 1,423 | 1.3% |
| Seminole | 55 | 0.1% |
| Serbian | 74 | 0.1% |
| Shoshone | 3 | 0.0% |
| Sioux | 113 | 0.1% |
| Slavic | 132 | 0.1% |
| Slovak | 223 | 0.2% |
| Slovene | 1,064 | 0.9% |
| Somali | 15 | 0.0% |
| South American | 374 | 0.3% |
| Spaniard | 3,107 | 2.8% |
| Spanish | 4,507 | 4.0% |
| Spanish American | 351 | 0.3% |
| Spanish American Indian | 22 | 0.0% |
| Sri Lankan | 97 | 0.1% |
| Subsaharan African | 128 | 0.1% |
| Swedish | 857 | 0.8% |
| Swiss | 312 | 0.3% |
| Syrian | 23 | 0.0% |
| Thai | 68 | 0.1% |
| Tohono O'Odham | 63 | 0.1% |
| Ukrainian | 6 | 0.0% |
| Ute | 140 | 0.1% |
| Vietnamese | 11 | 0.0% |
| Welsh | 294 | 0.3% |
| West Indian | 8 | 0.0% |
| Yaqui | 20 | 0.0% |
| Yugoslavian | 157 | 0.1% | View All 118 Rows |
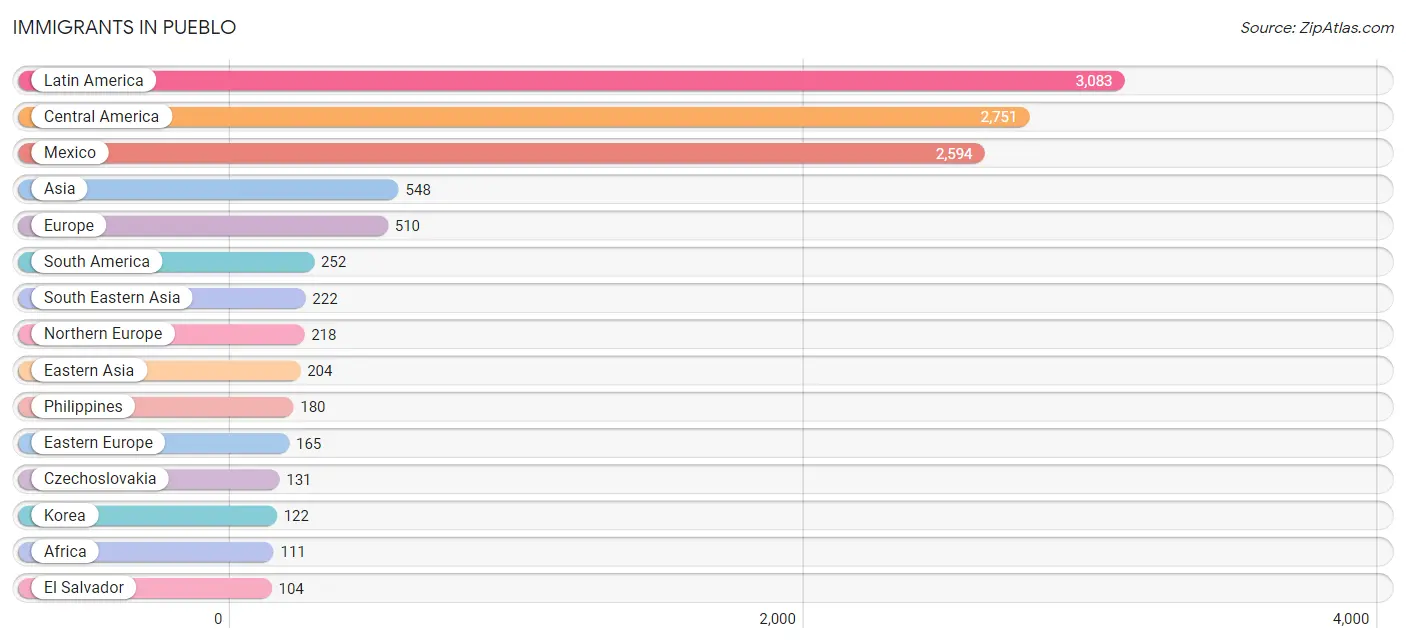
Immigrants in Pueblo
The most numerous immigrant groups reported in Pueblo came from Latin America (3,083 | 2.8%), Central America (2,751 | 2.5%), Mexico (2,594 | 2.3%), Asia (548 | 0.5%), and Europe (510 | 0.5%), together accounting for 8.5% of all Pueblo residents.
| Immigration Origin | # Population | % Population |
| Africa | 111 | 0.1% |
| Argentina | 94 | 0.1% |
| Asia | 548 | 0.5% |
| Belgium | 17 | 0.0% |
| Bolivia | 16 | 0.0% |
| Brazil | 33 | 0.0% |
| Canada | 80 | 0.1% |
| Caribbean | 80 | 0.1% |
| Central America | 2,751 | 2.5% |
| Chile | 36 | 0.0% |
| China | 58 | 0.1% |
| Colombia | 22 | 0.0% |
| Congo | 7 | 0.0% |
| Cuba | 76 | 0.1% |
| Czechoslovakia | 131 | 0.1% |
| Eastern Africa | 23 | 0.0% |
| Eastern Asia | 204 | 0.2% |
| Eastern Europe | 165 | 0.2% |
| El Salvador | 104 | 0.1% |
| England | 81 | 0.1% |
| Europe | 510 | 0.5% |
| Germany | 66 | 0.1% |
| Guyana | 21 | 0.0% |
| Honduras | 9 | 0.0% |
| Hungary | 8 | 0.0% |
| India | 20 | 0.0% |
| Indonesia | 1 | 0.0% |
| Iraq | 42 | 0.0% |
| Israel | 8 | 0.0% |
| Italy | 11 | 0.0% |
| Japan | 24 | 0.0% |
| Kazakhstan | 10 | 0.0% |
| Korea | 122 | 0.1% |
| Latin America | 3,083 | 2.8% |
| Lebanon | 7 | 0.0% |
| Mexico | 2,594 | 2.3% |
| Middle Africa | 44 | 0.0% |
| Nepal | 7 | 0.0% |
| Nigeria | 17 | 0.0% |
| Northern Africa | 10 | 0.0% |
| Northern Europe | 218 | 0.2% |
| Pakistan | 20 | 0.0% |
| Panama | 44 | 0.0% |
| Peru | 30 | 0.0% |
| Philippines | 180 | 0.2% |
| Portugal | 33 | 0.0% |
| Scotland | 80 | 0.1% |
| Serbia | 26 | 0.0% |
| South Africa | 9 | 0.0% |
| South America | 252 | 0.2% |
| South Central Asia | 57 | 0.1% |
| South Eastern Asia | 222 | 0.2% |
| Southern Europe | 44 | 0.0% |
| Sweden | 28 | 0.0% |
| Taiwan | 40 | 0.0% |
| Thailand | 13 | 0.0% |
| Trinidad and Tobago | 4 | 0.0% |
| Turkey | 8 | 0.0% |
| Vietnam | 28 | 0.0% |
| Western Africa | 17 | 0.0% |
| Western Asia | 65 | 0.1% |
| Western Europe | 83 | 0.1% |
| Zaire | 37 | 0.0% | View All 63 Rows |
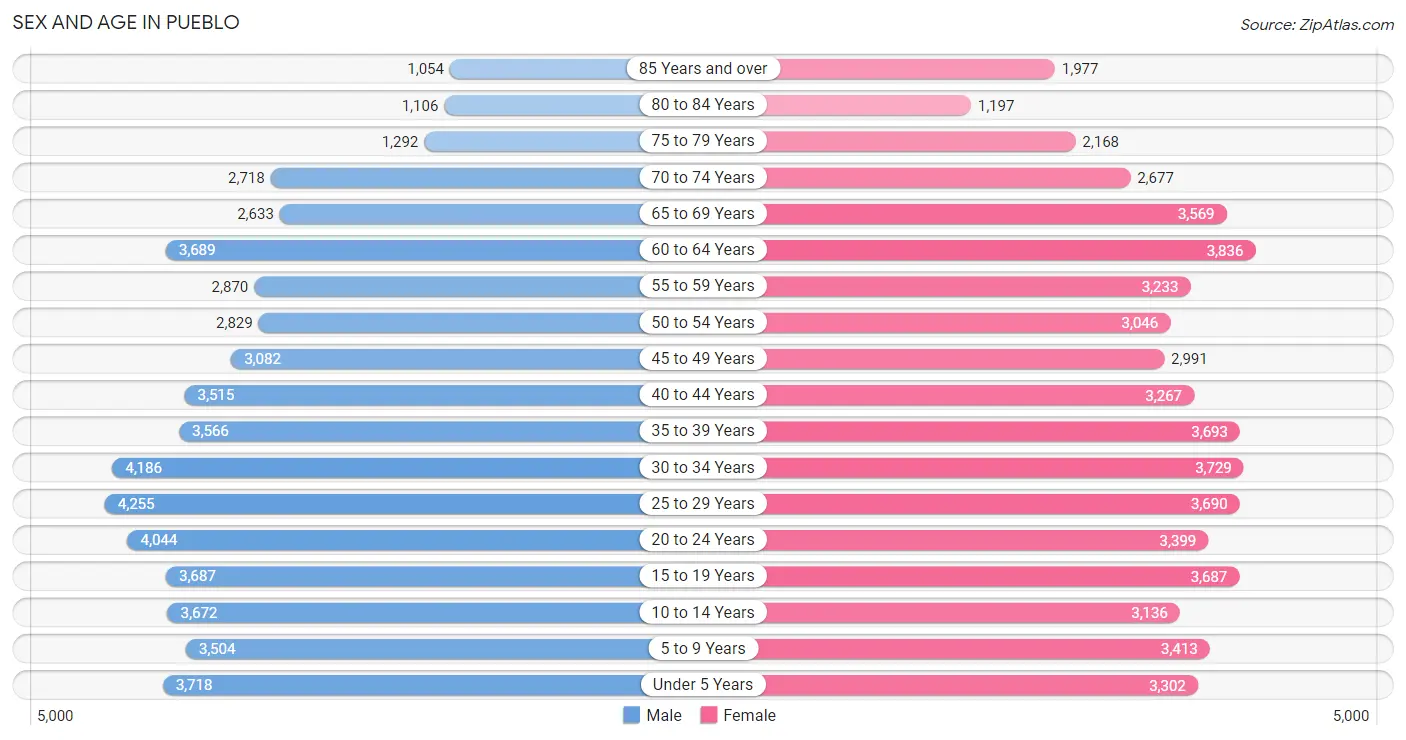
Sex and Age in Pueblo
Sex and Age in Pueblo
The most populous age groups in Pueblo are 25 to 29 Years (4,255 | 7.7%) for men and 60 to 64 Years (3,836 | 6.9%) for women.
| Age Bracket | Male | Female |
| Under 5 Years | 3,718 (6.7%) | 3,302 (5.9%) |
| 5 to 9 Years | 3,504 (6.3%) | 3,413 (6.1%) |
| 10 to 14 Years | 3,672 (6.6%) | 3,136 (5.6%) |
| 15 to 19 Years | 3,687 (6.7%) | 3,687 (6.6%) |
| 20 to 24 Years | 4,044 (7.3%) | 3,399 (6.1%) |
| 25 to 29 Years | 4,255 (7.7%) | 3,690 (6.6%) |
| 30 to 34 Years | 4,186 (7.5%) | 3,729 (6.7%) |
| 35 to 39 Years | 3,566 (6.4%) | 3,693 (6.6%) |
| 40 to 44 Years | 3,515 (6.3%) | 3,267 (5.8%) |
| 45 to 49 Years | 3,082 (5.6%) | 2,991 (5.3%) |
| 50 to 54 Years | 2,829 (5.1%) | 3,046 (5.4%) |
| 55 to 59 Years | 2,870 (5.2%) | 3,233 (5.8%) |
| 60 to 64 Years | 3,689 (6.7%) | 3,836 (6.9%) |
| 65 to 69 Years | 2,633 (4.8%) | 3,569 (6.4%) |
| 70 to 74 Years | 2,718 (4.9%) | 2,677 (4.8%) |
| 75 to 79 Years | 1,292 (2.3%) | 2,168 (3.9%) |
| 80 to 84 Years | 1,106 (2.0%) | 1,197 (2.1%) |
| 85 Years and over | 1,054 (1.9%) | 1,977 (3.5%) |
| Total | 55,420 (100.0%) | 56,010 (100.0%) |
Families and Households in Pueblo
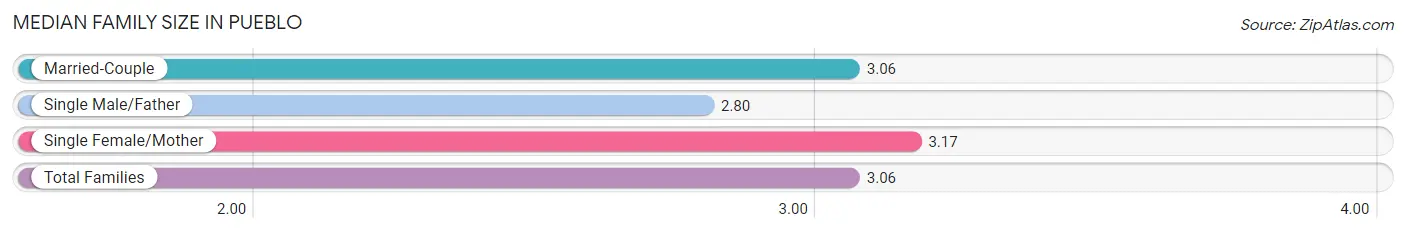
Median Family Size in Pueblo
The median family size in Pueblo is 3.06 persons per family, with single female/mother families (6,829 | 26.1%) accounting for the largest median family size of 3.17 persons per family. On the other hand, single male/father families (3,103 | 11.9%) represent the smallest median family size with 2.80 persons per family.
| Family Type | # Families | Family Size |
| Married-Couple | 16,220 (62.0%) | 3.06 |
| Single Male/Father | 3,103 (11.9%) | 2.80 |
| Single Female/Mother | 6,829 (26.1%) | 3.17 |
| Total Families | 26,152 (100.0%) | 3.06 |
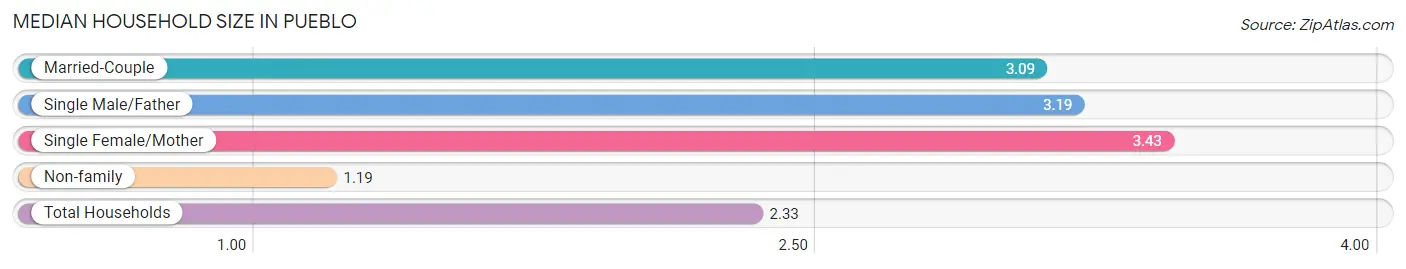
Median Household Size in Pueblo
The median household size in Pueblo is 2.33 persons per household, with single female/mother households (6,829 | 14.9%) accounting for the largest median household size of 3.43 persons per household. non-family households (19,630 | 42.9%) represent the smallest median household size with 1.19 persons per household.
| Household Type | # Households | Household Size |
| Married-Couple | 16,220 (35.4%) | 3.09 |
| Single Male/Father | 3,103 (6.8%) | 3.19 |
| Single Female/Mother | 6,829 (14.9%) | 3.43 |
| Non-family | 19,630 (42.9%) | 1.19 |
| Total Households | 45,782 (100.0%) | 2.33 |
Household Size by Marriage Status in Pueblo
Out of a total of 45,782 households in Pueblo, 26,152 (57.1%) are family households, while 19,630 (42.9%) are nonfamily households. The most numerous type of family households are 2-person households, comprising 11,338, and the most common type of nonfamily households are 1-person households, comprising 16,715.
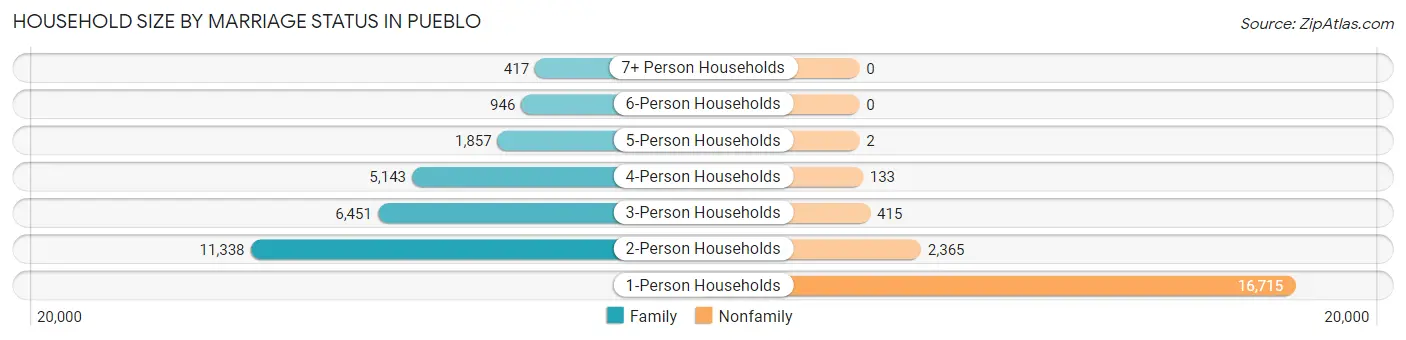
| Household Size | Family Households | Nonfamily Households |
| 1-Person Households | - | 16,715 (36.5%) |
| 2-Person Households | 11,338 (24.8%) | 2,365 (5.2%) |
| 3-Person Households | 6,451 (14.1%) | 415 (0.9%) |
| 4-Person Households | 5,143 (11.2%) | 133 (0.3%) |
| 5-Person Households | 1,857 (4.1%) | 2 (0.0%) |
| 6-Person Households | 946 (2.1%) | 0 (0.0%) |
| 7+ Person Households | 417 (0.9%) | 0 (0.0%) |
| Total | 26,152 (57.1%) | 19,630 (42.9%) |
Female Fertility in Pueblo
Fertility by Age in Pueblo
Average fertility rate in Pueblo is 60.0 births per 1,000 women. Women in the age bracket of 20 to 34 years have the highest fertility rate with 117.0 births per 1,000 women. Women in the age bracket of 20 to 34 years acount for 83.5% of all women with births.
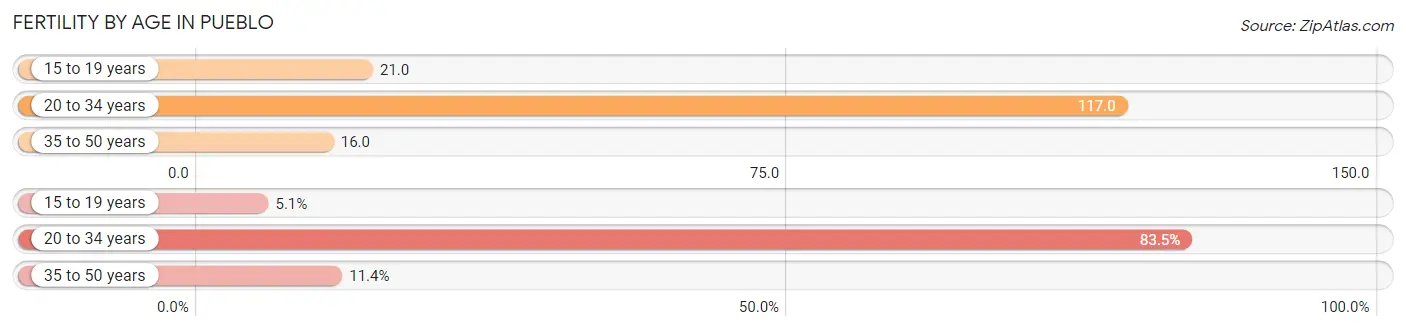
| Age Bracket | Women with Births | Births / 1,000 Women |
| 15 to 19 years | 78 (5.1%) | 21.0 |
| 20 to 34 years | 1,268 (83.5%) | 117.0 |
| 35 to 50 years | 173 (11.4%) | 16.0 |
| Total | 1,519 (100.0%) | 60.0 |
Fertility by Age by Marriage Status in Pueblo
57.9% of women with births (1,519) in Pueblo are married. The highest percentage of unmarried women with births falls into 15 to 19 years age bracket with 100.0% of them unmarried at the time of birth, while the lowest percentage of unmarried women with births belong to 35 to 50 years age bracket with 37.0% of them unmarried.
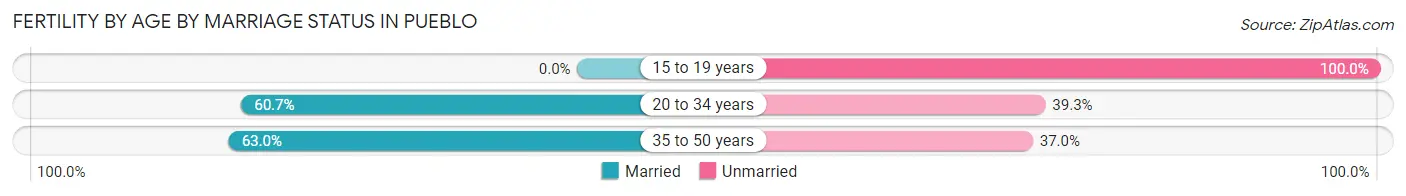
| Age Bracket | Married | Unmarried |
| 15 to 19 years | 0 (0.0%) | 78 (100.0%) |
| 20 to 34 years | 770 (60.7%) | 498 (39.3%) |
| 35 to 50 years | 109 (63.0%) | 64 (37.0%) |
| Total | 880 (57.9%) | 639 (42.1%) |
Fertility by Education in Pueblo
Average fertility rate in Pueblo is 60.0 births per 1,000 women. Women with the education attainment of high school diploma have the highest fertility rate of 80.0 births per 1,000 women, while women with the education attainment of graduate degree have the lowest fertility at 18.0 births per 1,000 women. Women with the education attainment of college or associate's degree represent 36.5% of all women with births.
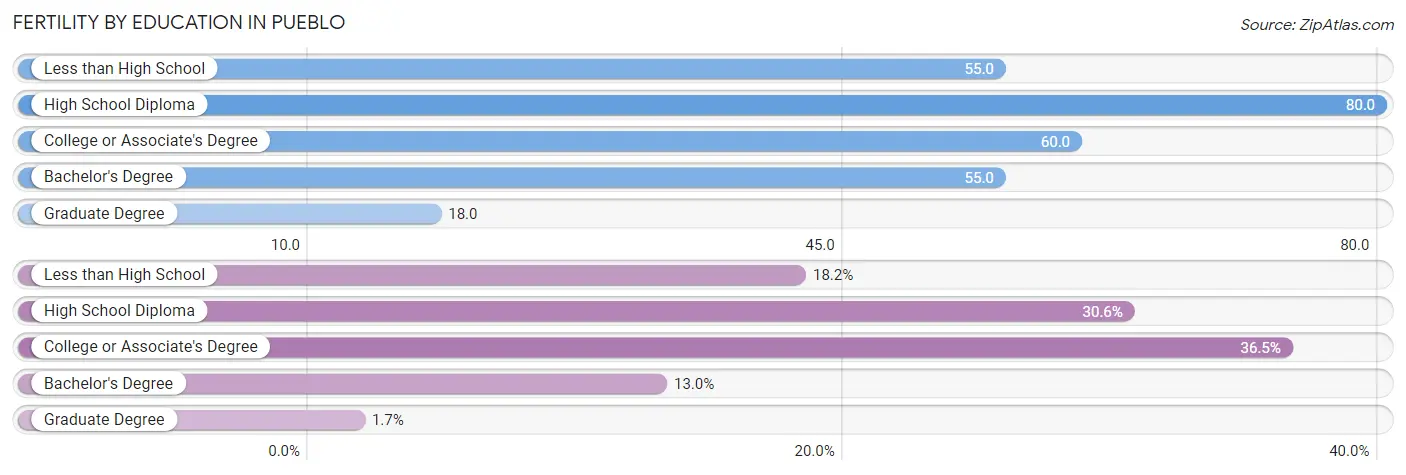
| Educational Attainment | Women with Births | Births / 1,000 Women |
| Less than High School | 277 (18.2%) | 55.0 |
| High School Diploma | 464 (30.5%) | 80.0 |
| College or Associate's Degree | 554 (36.5%) | 60.0 |
| Bachelor's Degree | 198 (13.0%) | 55.0 |
| Graduate Degree | 26 (1.7%) | 18.0 |
| Total | 1,519 (100.0%) | 60.0 |
Fertility by Education by Marriage Status in Pueblo
42.1% of women with births in Pueblo are unmarried. Women with the educational attainment of bachelor's degree are most likely to be married with 100.0% of them married at childbirth, while women with the educational attainment of high school diploma are least likely to be married with 58.0% of them unmarried at childbirth.
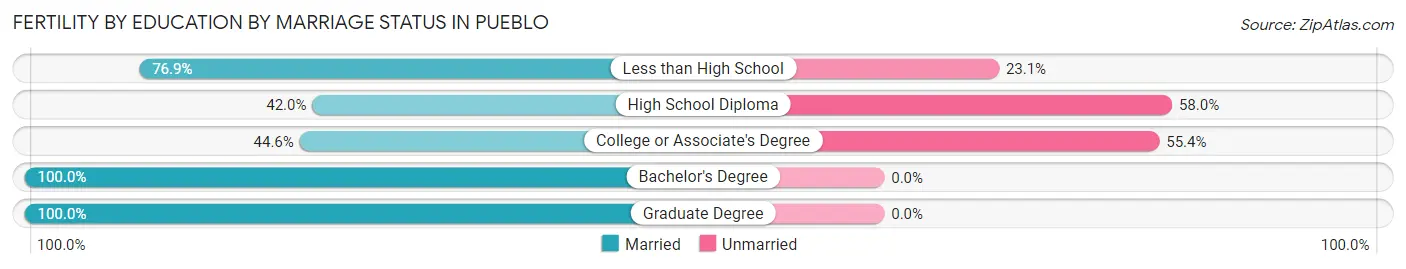
| Educational Attainment | Married | Unmarried |
| Less than High School | 213 (76.9%) | 64 (23.1%) |
| High School Diploma | 195 (42.0%) | 269 (58.0%) |
| College or Associate's Degree | 247 (44.6%) | 307 (55.4%) |
| Bachelor's Degree | 198 (100.0%) | 0 (0.0%) |
| Graduate Degree | 26 (100.0%) | 0 (0.0%) |
| Total | 880 (57.9%) | 639 (42.1%) |
Employment Characteristics in Pueblo
Employment by Class of Employer in Pueblo
Among the 44,696 employed individuals in Pueblo, private company employees (28,735 | 64.3%), local government employees (3,887 | 8.7%), and not-for-profit organizations (3,514 | 7.9%) make up the most common classes of employment.
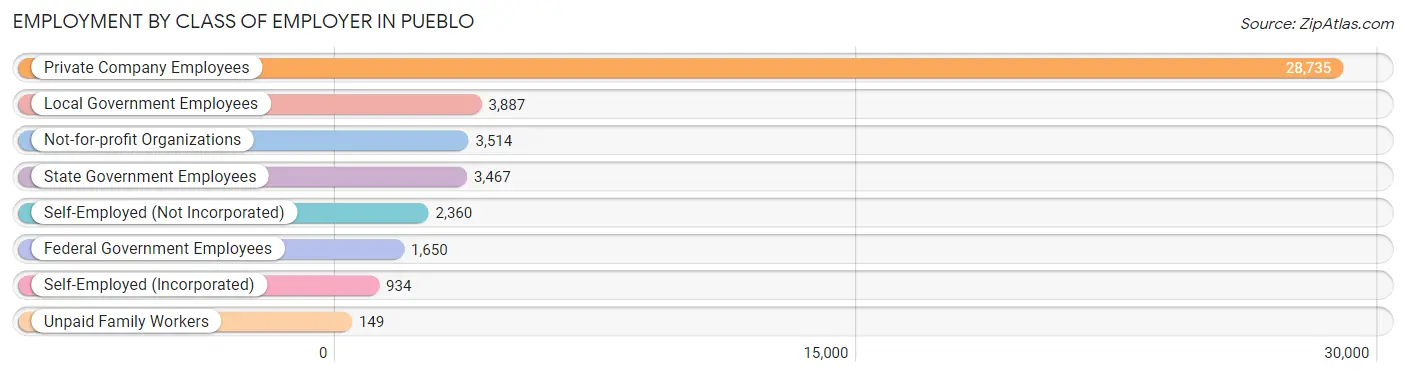
| Employer Class | # Employees | % Employees |
| Private Company Employees | 28,735 | 64.3% |
| Self-Employed (Incorporated) | 934 | 2.1% |
| Self-Employed (Not Incorporated) | 2,360 | 5.3% |
| Not-for-profit Organizations | 3,514 | 7.9% |
| Local Government Employees | 3,887 | 8.7% |
| State Government Employees | 3,467 | 7.8% |
| Federal Government Employees | 1,650 | 3.7% |
| Unpaid Family Workers | 149 | 0.3% |
| Total | 44,696 | 100.0% |
Employment Status by Age in Pueblo
According to the labor force statistics for Pueblo, out of the total population over 16 years of age (88,919), 54.6% or 48,550 individuals are in the labor force, with 6.6% or 3,204 of them unemployed. The age group with the highest labor force participation rate is 25 to 29 years, with 76.8% or 6,102 individuals in the labor force. Within the labor force, the 16 to 19 years age range has the highest percentage of unemployed individuals, with 27.4% or 546 of them being unemployed.
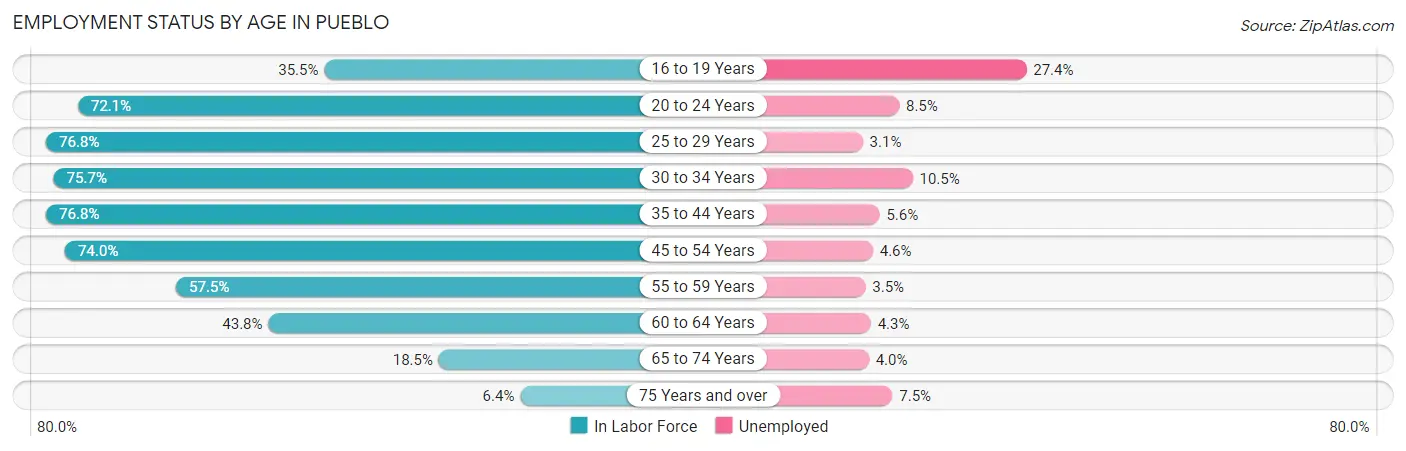
| Age Bracket | In Labor Force | Unemployed |
| 16 to 19 Years | 1,991 (35.5%) | 546 (27.4%) |
| 20 to 24 Years | 5,366 (72.1%) | 456 (8.5%) |
| 25 to 29 Years | 6,102 (76.8%) | 189 (3.1%) |
| 30 to 34 Years | 5,992 (75.7%) | 629 (10.5%) |
| 35 to 44 Years | 10,783 (76.8%) | 604 (5.6%) |
| 45 to 54 Years | 8,842 (74.0%) | 407 (4.6%) |
| 55 to 59 Years | 3,509 (57.5%) | 123 (3.5%) |
| 60 to 64 Years | 3,296 (43.8%) | 142 (4.3%) |
| 65 to 74 Years | 2,145 (18.5%) | 86 (4.0%) |
| 75 Years and over | 563 (6.4%) | 42 (7.5%) |
| Total | 48,550 (54.6%) | 3,204 (6.6%) |
Employment Status by Educational Attainment in Pueblo
According to labor force statistics for Pueblo, 69.4% of individuals (38,501) out of the total population between 25 and 64 years of age (55,477) are in the labor force, with 5.4% or 2,079 of them being unemployed. The group with the highest labor force participation rate are those with the educational attainment of bachelor's degree or higher, with 83.0% or 9,821 individuals in the labor force. Within the labor force, individuals with less than high school education have the highest percentage of unemployment, with 11.3% or 315 of them being unemployed.
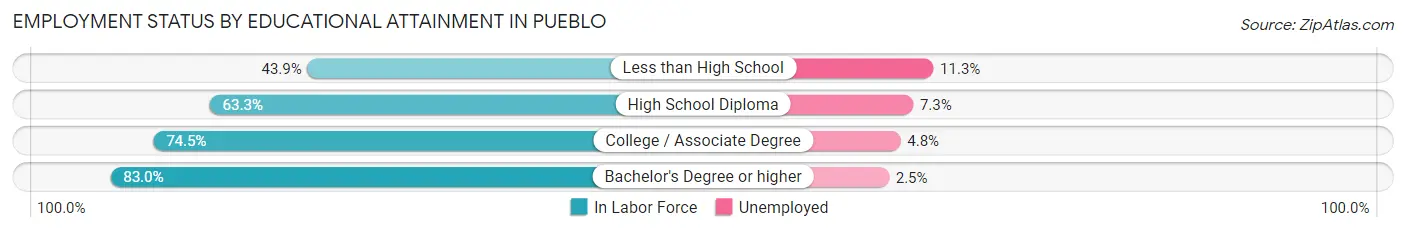
| Educational Attainment | In Labor Force | Unemployed |
| Less than High School | 2,788 (43.9%) | 718 (11.3%) |
| High School Diploma | 10,567 (63.3%) | 1,219 (7.3%) |
| College / Associate Degree | 15,348 (74.5%) | 989 (4.8%) |
| Bachelor's Degree or higher | 9,821 (83.0%) | 296 (2.5%) |
| Total | 38,501 (69.4%) | 2,996 (5.4%) |
Employment Occupations by Sex in Pueblo
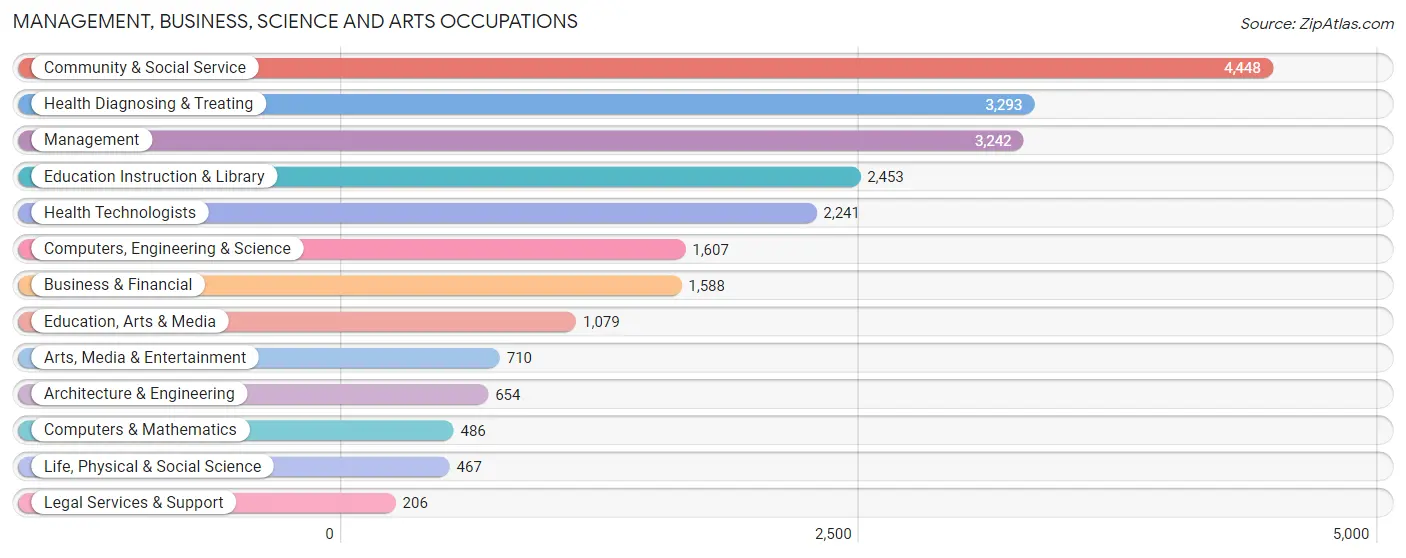
Management, Business, Science and Arts Occupations
The most common Management, Business, Science and Arts occupations in Pueblo are Community & Social Service (4,448 | 9.9%), Health Diagnosing & Treating (3,293 | 7.3%), Management (3,242 | 7.2%), Education Instruction & Library (2,453 | 5.4%), and Health Technologists (2,241 | 5.0%).
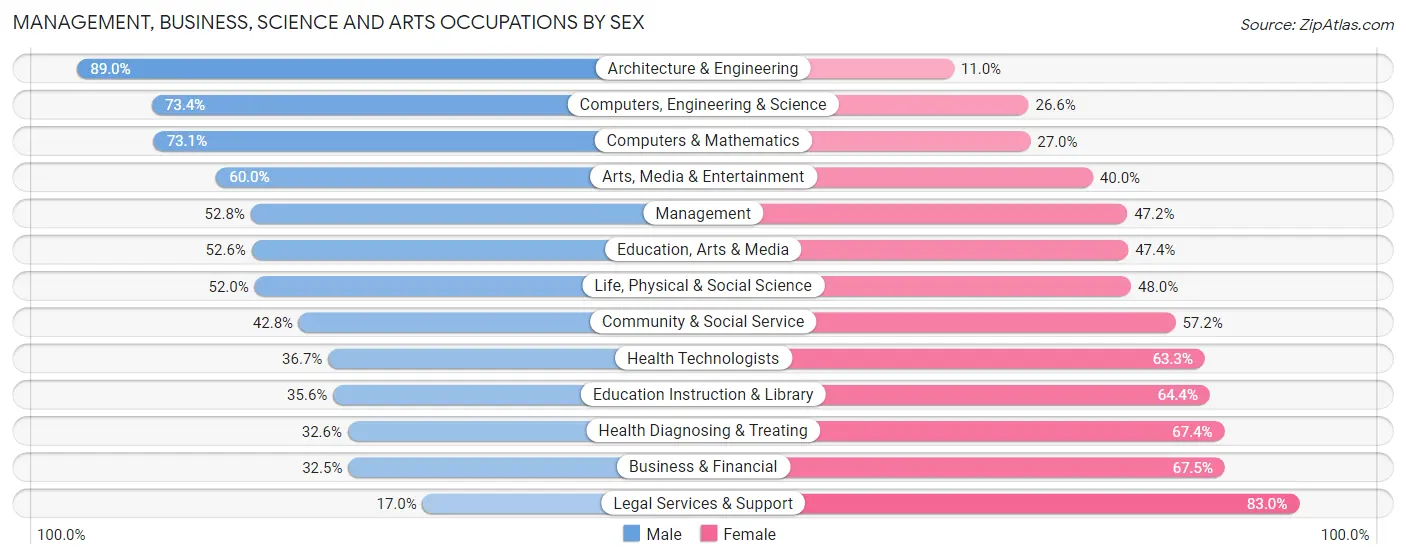
Management, Business, Science and Arts Occupations by Sex
Within the Management, Business, Science and Arts occupations in Pueblo, the most male-oriented occupations are Architecture & Engineering (89.0%), Computers, Engineering & Science (73.4%), and Computers & Mathematics (73.1%), while the most female-oriented occupations are Legal Services & Support (83.0%), Business & Financial (67.5%), and Health Diagnosing & Treating (67.4%).
| Occupation | Male | Female |
| Management | 1,713 (52.8%) | 1,529 (47.2%) |
| Business & Financial | 516 (32.5%) | 1,072 (67.5%) |
| Computers, Engineering & Science | 1,180 (73.4%) | 427 (26.6%) |
| Computers & Mathematics | 355 (73.1%) | 131 (27.0%) |
| Architecture & Engineering | 582 (89.0%) | 72 (11.0%) |
| Life, Physical & Social Science | 243 (52.0%) | 224 (48.0%) |
| Community & Social Service | 1,903 (42.8%) | 2,545 (57.2%) |
| Education, Arts & Media | 568 (52.6%) | 511 (47.4%) |
| Legal Services & Support | 35 (17.0%) | 171 (83.0%) |
| Education Instruction & Library | 874 (35.6%) | 1,579 (64.4%) |
| Arts, Media & Entertainment | 426 (60.0%) | 284 (40.0%) |
| Health Diagnosing & Treating | 1,073 (32.6%) | 2,220 (67.4%) |
| Health Technologists | 822 (36.7%) | 1,419 (63.3%) |
| Total (Category) | 6,385 (45.0%) | 7,793 (55.0%) |
| Total (Overall) | 23,934 (53.1%) | 21,153 (46.9%) |
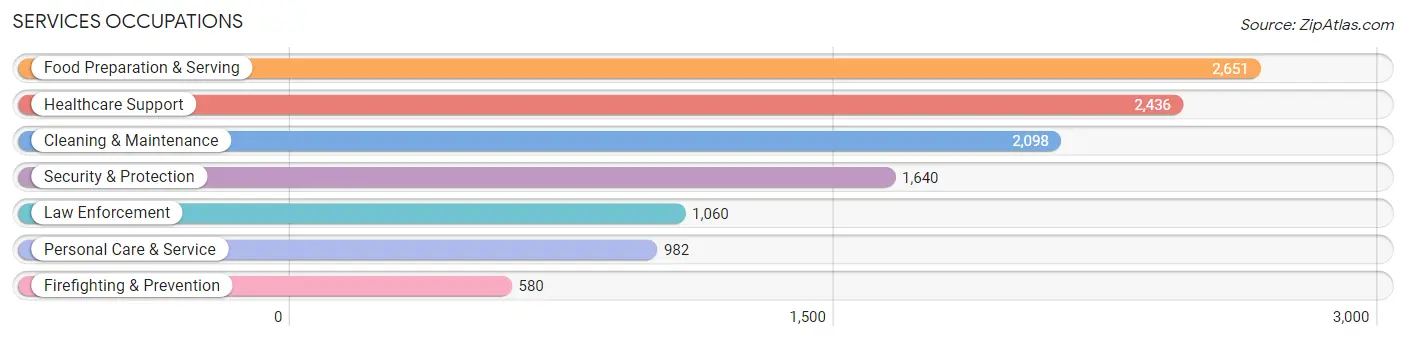
Services Occupations
The most common Services occupations in Pueblo are Food Preparation & Serving (2,651 | 5.9%), Healthcare Support (2,436 | 5.4%), Cleaning & Maintenance (2,098 | 4.6%), Security & Protection (1,640 | 3.6%), and Law Enforcement (1,060 | 2.4%).
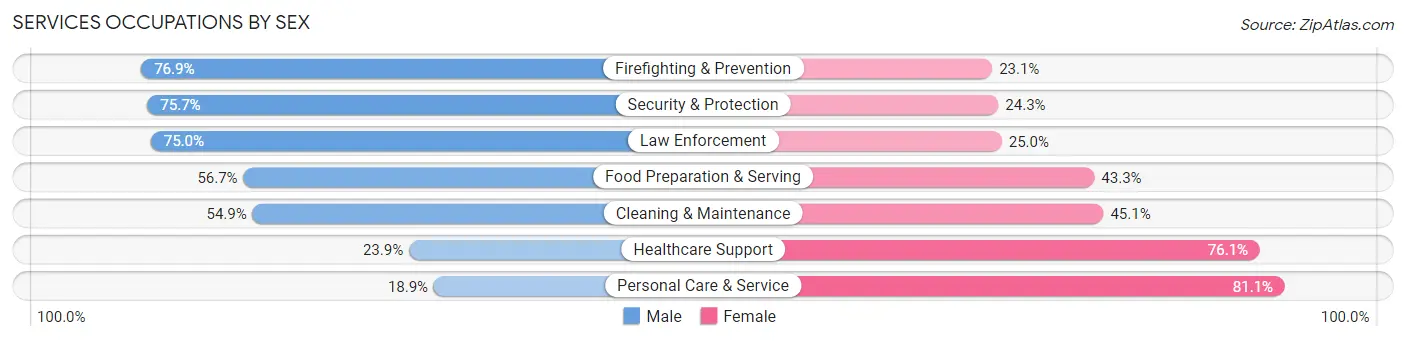
Services Occupations by Sex
Within the Services occupations in Pueblo, the most male-oriented occupations are Firefighting & Prevention (76.9%), Security & Protection (75.7%), and Law Enforcement (75.0%), while the most female-oriented occupations are Personal Care & Service (81.1%), Healthcare Support (76.1%), and Cleaning & Maintenance (45.1%).
| Occupation | Male | Female |
| Healthcare Support | 582 (23.9%) | 1,854 (76.1%) |
| Security & Protection | 1,241 (75.7%) | 399 (24.3%) |
| Firefighting & Prevention | 446 (76.9%) | 134 (23.1%) |
| Law Enforcement | 795 (75.0%) | 265 (25.0%) |
| Food Preparation & Serving | 1,502 (56.7%) | 1,149 (43.3%) |
| Cleaning & Maintenance | 1,151 (54.9%) | 947 (45.1%) |
| Personal Care & Service | 186 (18.9%) | 796 (81.1%) |
| Total (Category) | 4,662 (47.5%) | 5,145 (52.5%) |
| Total (Overall) | 23,934 (53.1%) | 21,153 (46.9%) |
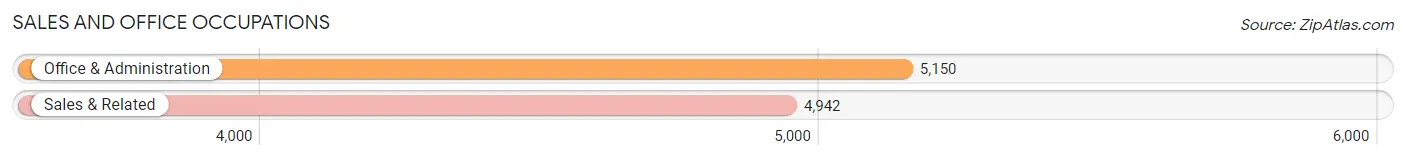
Sales and Office Occupations
The most common Sales and Office occupations in Pueblo are Office & Administration (5,150 | 11.4%), and Sales & Related (4,942 | 11.0%).
Sales and Office Occupations by Sex
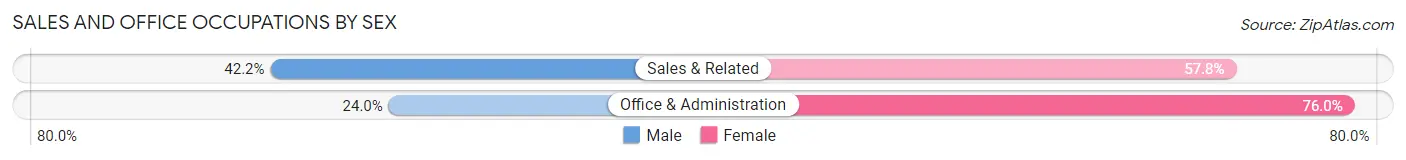
| Occupation | Male | Female |
| Sales & Related | 2,085 (42.2%) | 2,857 (57.8%) |
| Office & Administration | 1,236 (24.0%) | 3,914 (76.0%) |
| Total (Category) | 3,321 (32.9%) | 6,771 (67.1%) |
| Total (Overall) | 23,934 (53.1%) | 21,153 (46.9%) |
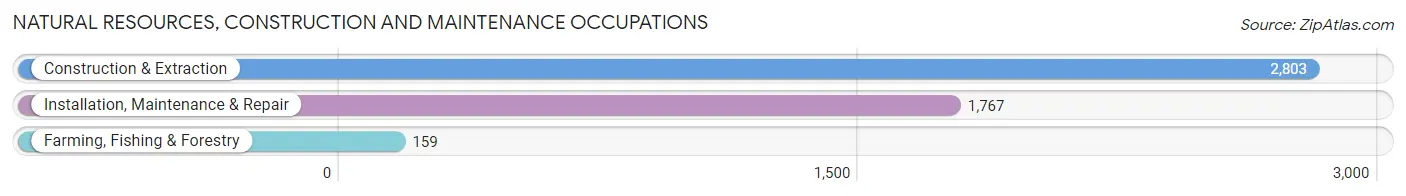
Natural Resources, Construction and Maintenance Occupations
The most common Natural Resources, Construction and Maintenance occupations in Pueblo are Construction & Extraction (2,803 | 6.2%), Installation, Maintenance & Repair (1,767 | 3.9%), and Farming, Fishing & Forestry (159 | 0.4%).
Natural Resources, Construction and Maintenance Occupations by Sex
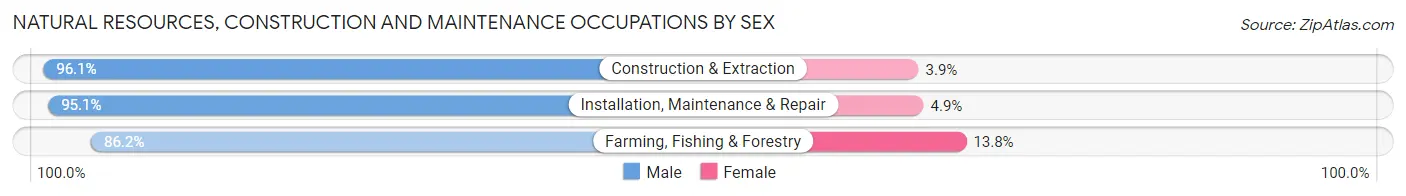
| Occupation | Male | Female |
| Farming, Fishing & Forestry | 137 (86.2%) | 22 (13.8%) |
| Construction & Extraction | 2,694 (96.1%) | 109 (3.9%) |
| Installation, Maintenance & Repair | 1,680 (95.1%) | 87 (4.9%) |
| Total (Category) | 4,511 (95.4%) | 218 (4.6%) |
| Total (Overall) | 23,934 (53.1%) | 21,153 (46.9%) |
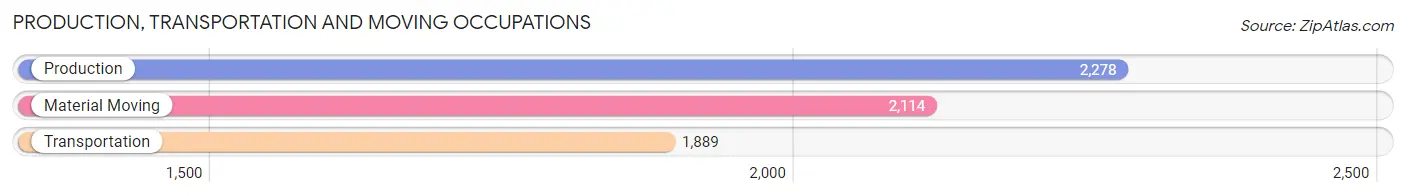
Production, Transportation and Moving Occupations
The most common Production, Transportation and Moving occupations in Pueblo are Production (2,278 | 5.1%), Material Moving (2,114 | 4.7%), and Transportation (1,889 | 4.2%).
Production, Transportation and Moving Occupations by Sex
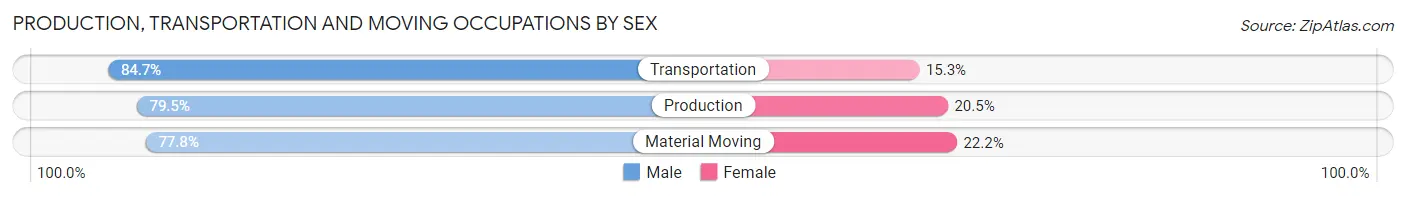
| Occupation | Male | Female |
| Production | 1,810 (79.5%) | 468 (20.5%) |
| Transportation | 1,600 (84.7%) | 289 (15.3%) |
| Material Moving | 1,645 (77.8%) | 469 (22.2%) |
| Total (Category) | 5,055 (80.5%) | 1,226 (19.5%) |
| Total (Overall) | 23,934 (53.1%) | 21,153 (46.9%) |
Employment Industries by Sex in Pueblo
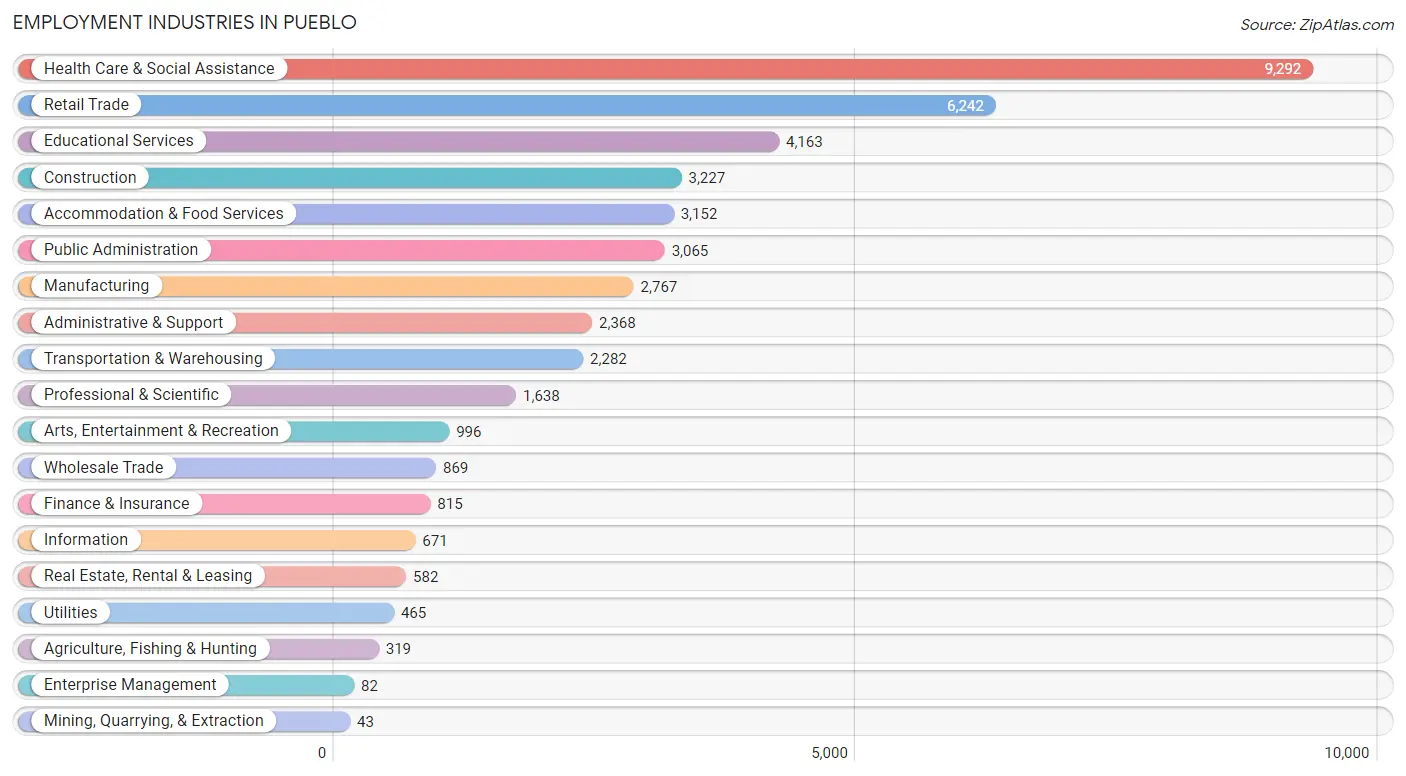
Employment Industries in Pueblo
The major employment industries in Pueblo include Health Care & Social Assistance (9,292 | 20.6%), Retail Trade (6,242 | 13.8%), Educational Services (4,163 | 9.2%), Construction (3,227 | 7.2%), and Accommodation & Food Services (3,152 | 7.0%).
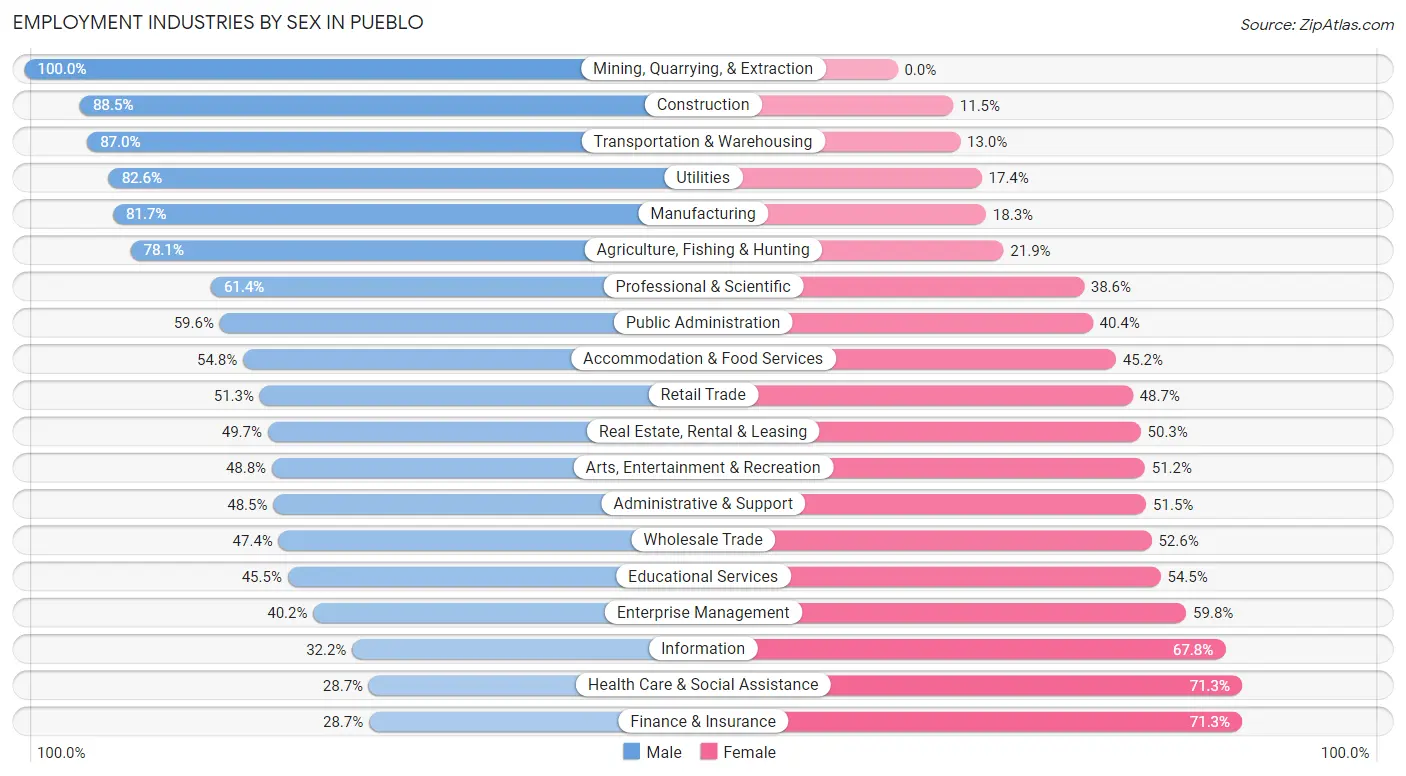
Employment Industries by Sex in Pueblo
The Pueblo industries that see more men than women are Mining, Quarrying, & Extraction (100.0%), Construction (88.5%), and Transportation & Warehousing (87.0%), whereas the industries that tend to have a higher number of women are Finance & Insurance (71.3%), Health Care & Social Assistance (71.3%), and Information (67.8%).
| Industry | Male | Female |
| Agriculture, Fishing & Hunting | 249 (78.1%) | 70 (21.9%) |
| Mining, Quarrying, & Extraction | 43 (100.0%) | 0 (0.0%) |
| Construction | 2,857 (88.5%) | 370 (11.5%) |
| Manufacturing | 2,260 (81.7%) | 507 (18.3%) |
| Wholesale Trade | 412 (47.4%) | 457 (52.6%) |
| Retail Trade | 3,203 (51.3%) | 3,039 (48.7%) |
| Transportation & Warehousing | 1,986 (87.0%) | 296 (13.0%) |
| Utilities | 384 (82.6%) | 81 (17.4%) |
| Information | 216 (32.2%) | 455 (67.8%) |
| Finance & Insurance | 234 (28.7%) | 581 (71.3%) |
| Real Estate, Rental & Leasing | 289 (49.7%) | 293 (50.3%) |
| Professional & Scientific | 1,006 (61.4%) | 632 (38.6%) |
| Enterprise Management | 33 (40.2%) | 49 (59.8%) |
| Administrative & Support | 1,149 (48.5%) | 1,219 (51.5%) |
| Educational Services | 1,896 (45.5%) | 2,267 (54.5%) |
| Health Care & Social Assistance | 2,670 (28.7%) | 6,622 (71.3%) |
| Arts, Entertainment & Recreation | 486 (48.8%) | 510 (51.2%) |
| Accommodation & Food Services | 1,727 (54.8%) | 1,425 (45.2%) |
| Public Administration | 1,827 (59.6%) | 1,238 (40.4%) |
| Total | 23,934 (53.1%) | 21,153 (46.9%) |
Education in Pueblo
School Enrollment in Pueblo
The most common levels of schooling among the 25,867 students in Pueblo are high school (5,790 | 22.4%), elementary school (5,639 | 21.8%), and middle school (5,340 | 20.6%).
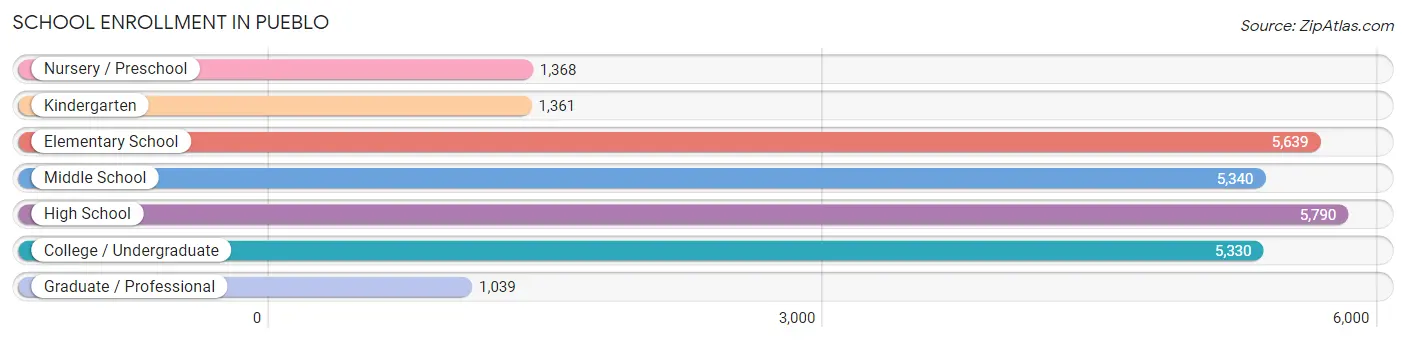
| School Level | # Students | % Students |
| Nursery / Preschool | 1,368 | 5.3% |
| Kindergarten | 1,361 | 5.3% |
| Elementary School | 5,639 | 21.8% |
| Middle School | 5,340 | 20.6% |
| High School | 5,790 | 22.4% |
| College / Undergraduate | 5,330 | 20.6% |
| Graduate / Professional | 1,039 | 4.0% |
| Total | 25,867 | 100.0% |
School Enrollment by Age by Funding Source in Pueblo
Out of a total of 25,867 students who are enrolled in schools in Pueblo, 1,914 (7.4%) attend a private institution, while the remaining 23,953 (92.6%) are enrolled in public schools. The age group of 35 years and over has the highest likelihood of being enrolled in private schools, with 266 (20.3% in the age bracket) enrolled. Conversely, the age group of 15 to 17 year olds has the lowest likelihood of being enrolled in a private school, with 4,048 (96.6% in the age bracket) attending a public institution.
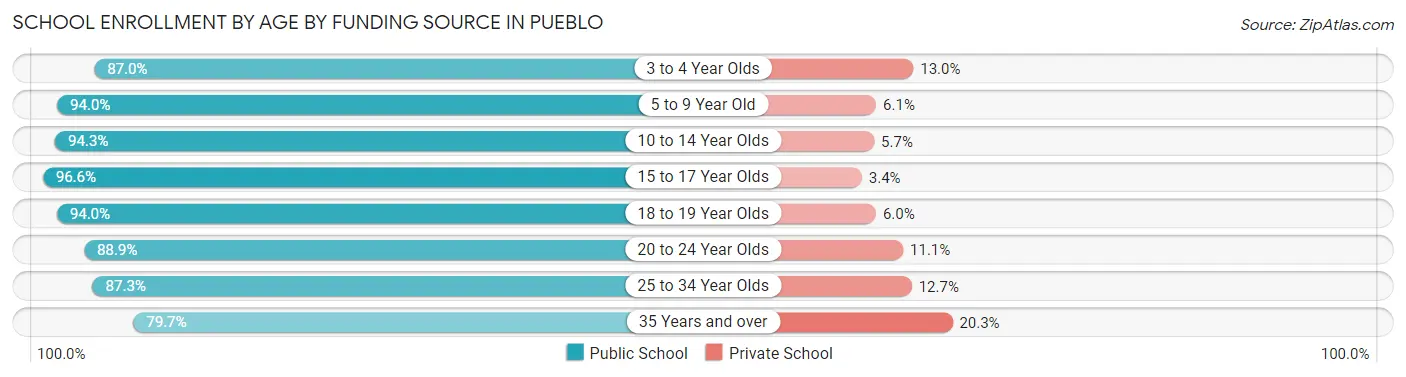
| Age Bracket | Public School | Private School |
| 3 to 4 Year Olds | 859 (87.0%) | 128 (13.0%) |
| 5 to 9 Year Old | 6,121 (94.0%) | 394 (6.0%) |
| 10 to 14 Year Olds | 6,246 (94.3%) | 376 (5.7%) |
| 15 to 17 Year Olds | 4,048 (96.6%) | 142 (3.4%) |
| 18 to 19 Year Olds | 1,857 (94.0%) | 119 (6.0%) |
| 20 to 24 Year Olds | 2,305 (88.9%) | 287 (11.1%) |
| 25 to 34 Year Olds | 1,460 (87.3%) | 212 (12.7%) |
| 35 Years and over | 1,047 (79.7%) | 266 (20.3%) |
| Total | 23,953 (92.6%) | 1,914 (7.4%) |
Educational Attainment by Field of Study in Pueblo
Education (2,471 | 13.6%), business (2,348 | 12.9%), science & technology (2,088 | 11.5%), arts & humanities (1,522 | 8.4%), and social sciences (1,445 | 7.9%) are the most common fields of study among 18,227 individuals in Pueblo who have obtained a bachelor's degree or higher.
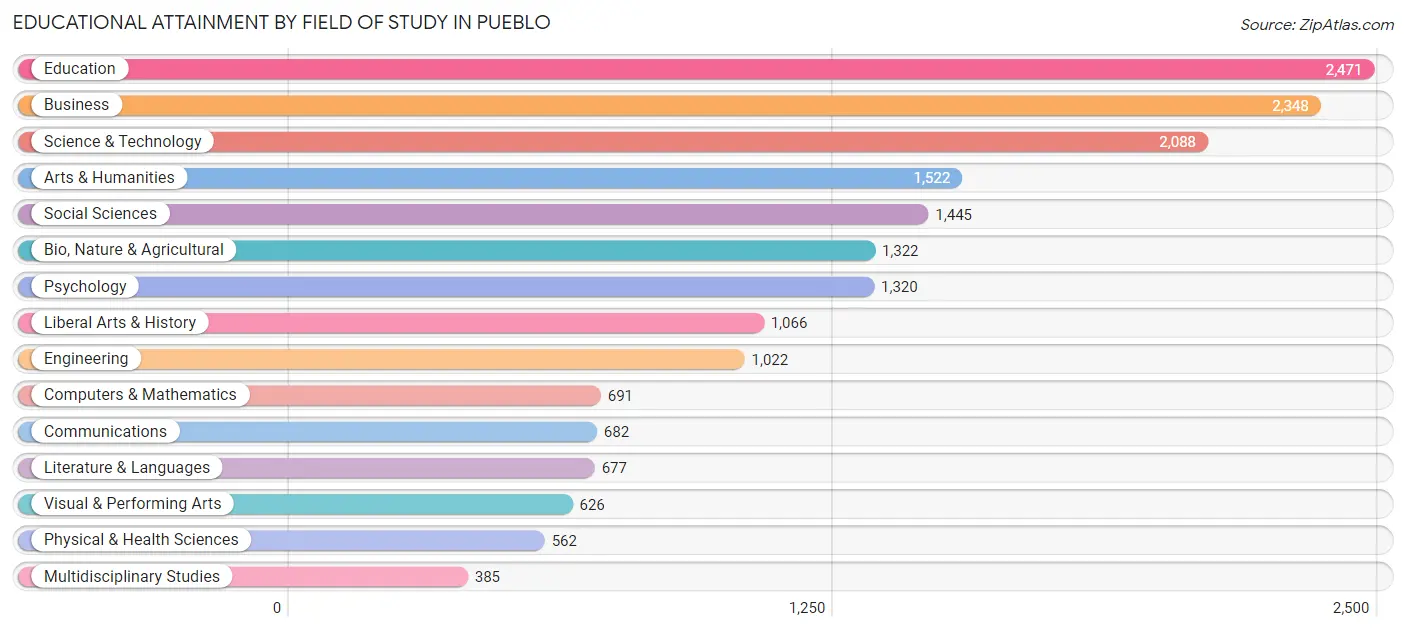
| Field of Study | # Graduates | % Graduates |
| Computers & Mathematics | 691 | 3.8% |
| Bio, Nature & Agricultural | 1,322 | 7.2% |
| Physical & Health Sciences | 562 | 3.1% |
| Psychology | 1,320 | 7.2% |
| Social Sciences | 1,445 | 7.9% |
| Engineering | 1,022 | 5.6% |
| Multidisciplinary Studies | 385 | 2.1% |
| Science & Technology | 2,088 | 11.5% |
| Business | 2,348 | 12.9% |
| Education | 2,471 | 13.6% |
| Literature & Languages | 677 | 3.7% |
| Liberal Arts & History | 1,066 | 5.9% |
| Visual & Performing Arts | 626 | 3.4% |
| Communications | 682 | 3.7% |
| Arts & Humanities | 1,522 | 8.4% |
| Total | 18,227 | 100.0% |
Transportation & Commute in Pueblo
Vehicle Availability by Sex in Pueblo
The most prevalent vehicle ownership categories in Pueblo are males with 2 vehicles (9,464, accounting for 40.1%) and females with 2 vehicles (7,995, making up 45.3%).
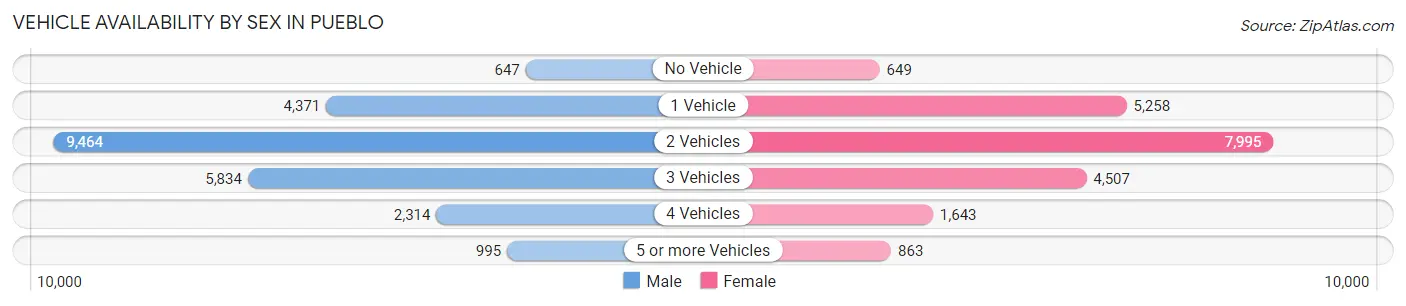
| Vehicles Available | Male | Female |
| No Vehicle | 647 (2.7%) | 649 (3.1%) |
| 1 Vehicle | 4,371 (18.5%) | 5,258 (25.1%) |
| 2 Vehicles | 9,464 (40.1%) | 7,995 (38.2%) |
| 3 Vehicles | 5,834 (24.7%) | 4,507 (21.5%) |
| 4 Vehicles | 2,314 (9.8%) | 1,643 (7.9%) |
| 5 or more Vehicles | 995 (4.2%) | 863 (4.1%) |
| Total | 23,625 (100.0%) | 20,915 (100.0%) |
Commute Time in Pueblo
The most frequently occuring commute durations in Pueblo are 10 to 14 minutes (10,726 commuters, 25.4%), 15 to 19 minutes (10,302 commuters, 24.4%), and 5 to 9 minutes (6,277 commuters, 14.8%).
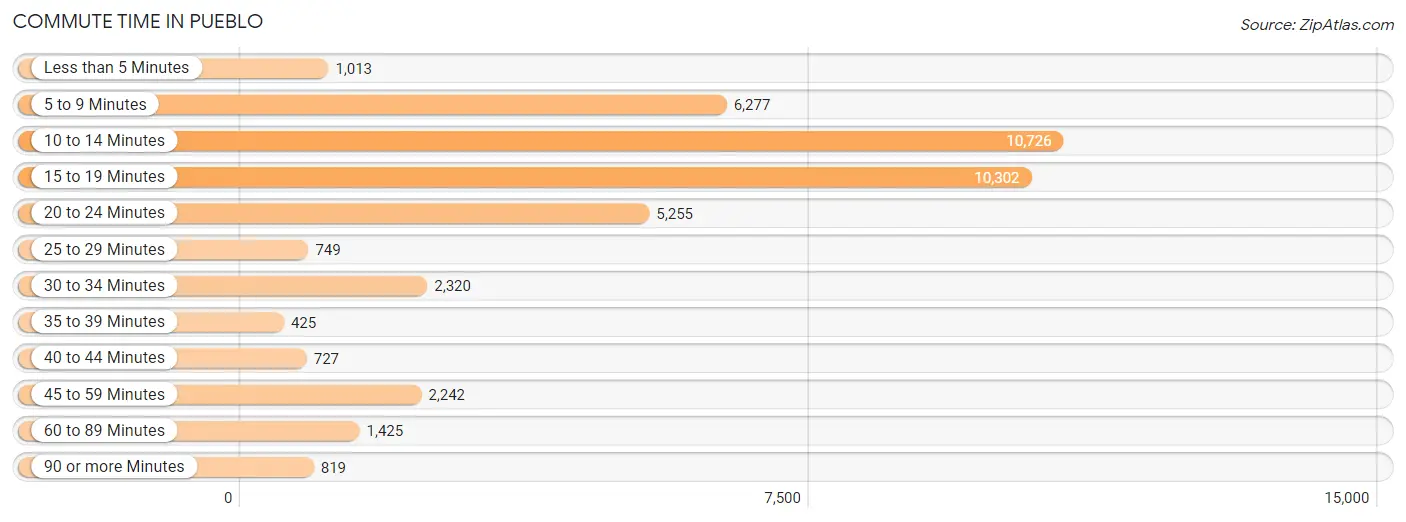
| Commute Time | # Commuters | % Commuters |
| Less than 5 Minutes | 1,013 | 2.4% |
| 5 to 9 Minutes | 6,277 | 14.8% |
| 10 to 14 Minutes | 10,726 | 25.4% |
| 15 to 19 Minutes | 10,302 | 24.4% |
| 20 to 24 Minutes | 5,255 | 12.4% |
| 25 to 29 Minutes | 749 | 1.8% |
| 30 to 34 Minutes | 2,320 | 5.5% |
| 35 to 39 Minutes | 425 | 1.0% |
| 40 to 44 Minutes | 727 | 1.7% |
| 45 to 59 Minutes | 2,242 | 5.3% |
| 60 to 89 Minutes | 1,425 | 3.4% |
| 90 or more Minutes | 819 | 1.9% |
Commute Time by Sex in Pueblo
The most common commute times in Pueblo are 10 to 14 minutes (5,490 commuters, 24.1%) for males and 10 to 14 minutes (5,236 commuters, 26.9%) for females.
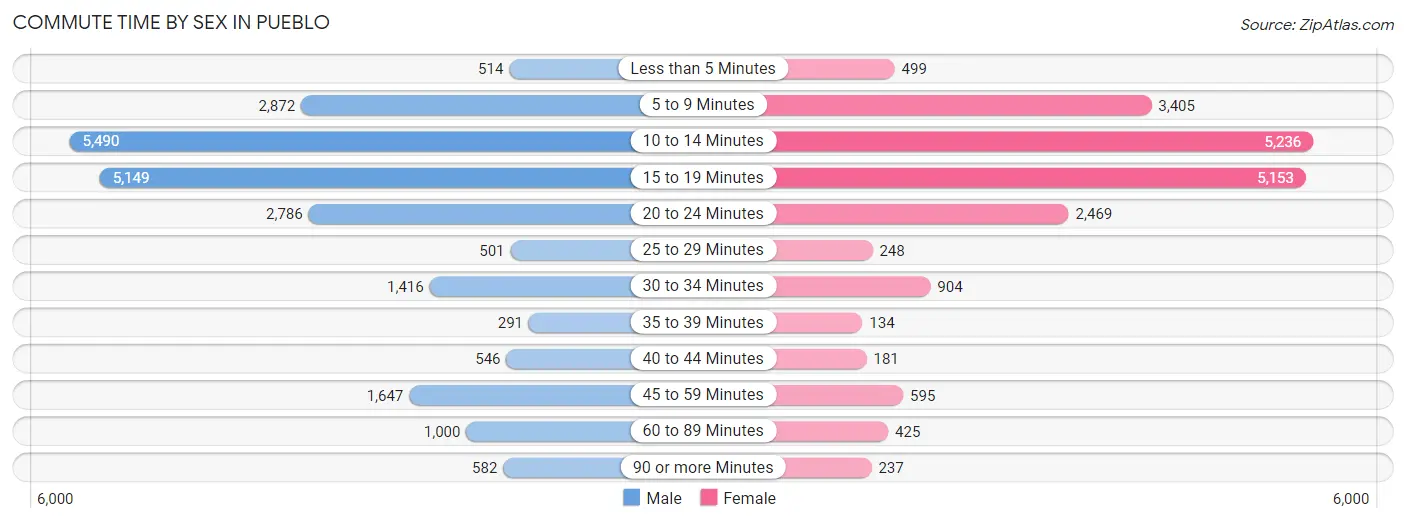
| Commute Time | Male | Female |
| Less than 5 Minutes | 514 (2.2%) | 499 (2.6%) |
| 5 to 9 Minutes | 2,872 (12.6%) | 3,405 (17.5%) |
| 10 to 14 Minutes | 5,490 (24.1%) | 5,236 (26.9%) |
| 15 to 19 Minutes | 5,149 (22.6%) | 5,153 (26.4%) |
| 20 to 24 Minutes | 2,786 (12.2%) | 2,469 (12.7%) |
| 25 to 29 Minutes | 501 (2.2%) | 248 (1.3%) |
| 30 to 34 Minutes | 1,416 (6.2%) | 904 (4.6%) |
| 35 to 39 Minutes | 291 (1.3%) | 134 (0.7%) |
| 40 to 44 Minutes | 546 (2.4%) | 181 (0.9%) |
| 45 to 59 Minutes | 1,647 (7.2%) | 595 (3.0%) |
| 60 to 89 Minutes | 1,000 (4.4%) | 425 (2.2%) |
| 90 or more Minutes | 582 (2.5%) | 237 (1.2%) |
Time of Departure to Work by Sex in Pueblo
The most frequent times of departure to work in Pueblo are 6:30 AM to 6:59 AM (2,979, 13.1%) for males and 7:30 AM to 7:59 AM (3,159, 16.2%) for females.
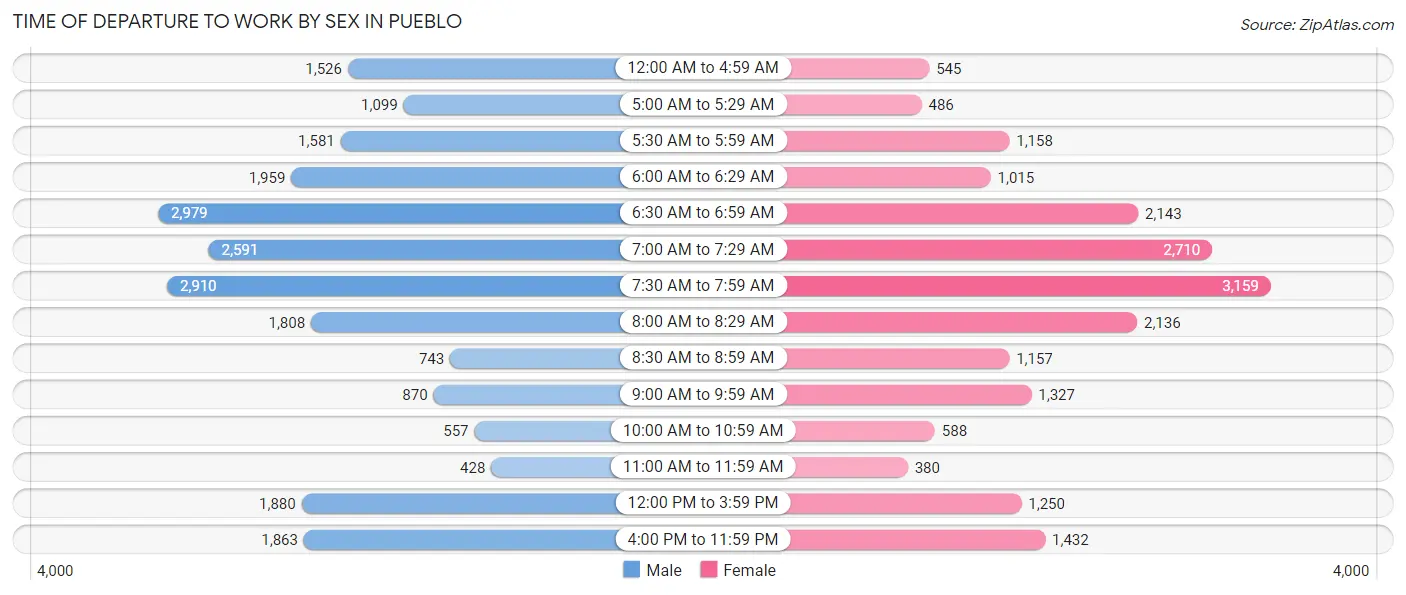
| Time of Departure | Male | Female |
| 12:00 AM to 4:59 AM | 1,526 (6.7%) | 545 (2.8%) |
| 5:00 AM to 5:29 AM | 1,099 (4.8%) | 486 (2.5%) |
| 5:30 AM to 5:59 AM | 1,581 (6.9%) | 1,158 (5.9%) |
| 6:00 AM to 6:29 AM | 1,959 (8.6%) | 1,015 (5.2%) |
| 6:30 AM to 6:59 AM | 2,979 (13.1%) | 2,143 (11.0%) |
| 7:00 AM to 7:29 AM | 2,591 (11.4%) | 2,710 (13.9%) |
| 7:30 AM to 7:59 AM | 2,910 (12.8%) | 3,159 (16.2%) |
| 8:00 AM to 8:29 AM | 1,808 (7.9%) | 2,136 (11.0%) |
| 8:30 AM to 8:59 AM | 743 (3.3%) | 1,157 (5.9%) |
| 9:00 AM to 9:59 AM | 870 (3.8%) | 1,327 (6.8%) |
| 10:00 AM to 10:59 AM | 557 (2.4%) | 588 (3.0%) |
| 11:00 AM to 11:59 AM | 428 (1.9%) | 380 (1.9%) |
| 12:00 PM to 3:59 PM | 1,880 (8.3%) | 1,250 (6.4%) |
| 4:00 PM to 11:59 PM | 1,863 (8.2%) | 1,432 (7.3%) |
| Total | 22,794 (100.0%) | 19,486 (100.0%) |
Housing Occupancy in Pueblo
Occupancy by Ownership in Pueblo
Of the total 45,782 dwellings in Pueblo, owner-occupied units account for 27,009 (59.0%), while renter-occupied units make up 18,773 (41.0%).
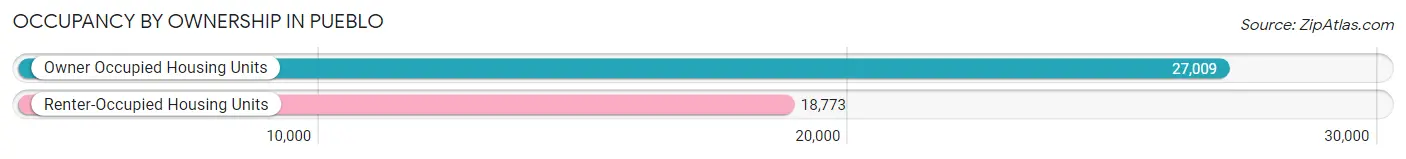
| Occupancy | # Housing Units | % Housing Units |
| Owner Occupied Housing Units | 27,009 | 59.0% |
| Renter-Occupied Housing Units | 18,773 | 41.0% |
| Total Occupied Housing Units | 45,782 | 100.0% |
Occupancy by Household Size in Pueblo
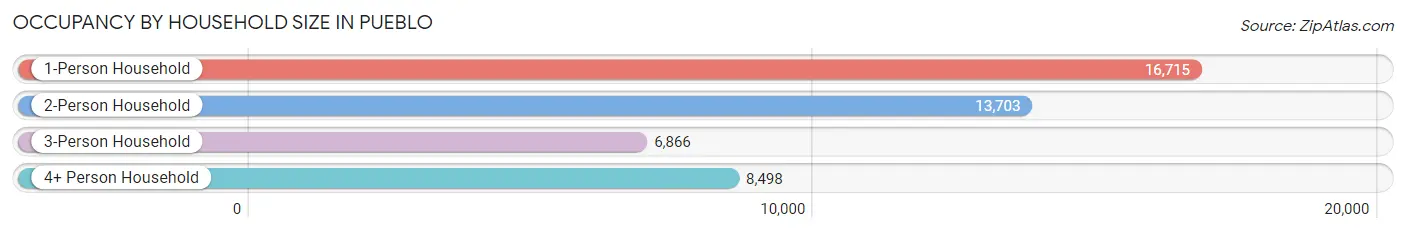
| Household Size | # Housing Units | % Housing Units |
| 1-Person Household | 16,715 | 36.5% |
| 2-Person Household | 13,703 | 29.9% |
| 3-Person Household | 6,866 | 15.0% |
| 4+ Person Household | 8,498 | 18.6% |
| Total Housing Units | 45,782 | 100.0% |
Occupancy by Ownership by Household Size in Pueblo
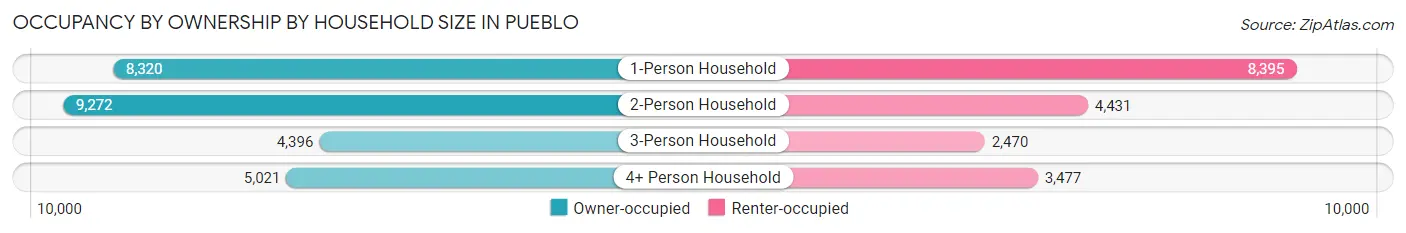
| Household Size | Owner-occupied | Renter-occupied |
| 1-Person Household | 8,320 (49.8%) | 8,395 (50.2%) |
| 2-Person Household | 9,272 (67.7%) | 4,431 (32.3%) |
| 3-Person Household | 4,396 (64.0%) | 2,470 (36.0%) |
| 4+ Person Household | 5,021 (59.1%) | 3,477 (40.9%) |
| Total Housing Units | 27,009 (59.0%) | 18,773 (41.0%) |
Occupancy by Educational Attainment in Pueblo
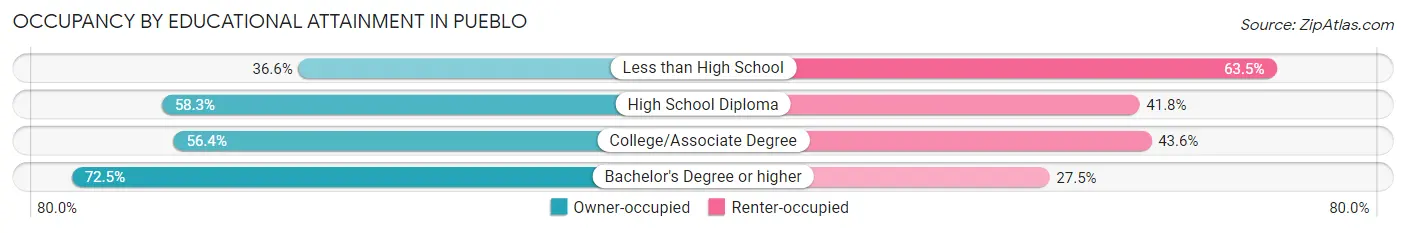
| Household Size | Owner-occupied | Renter-occupied |
| Less than High School | 1,409 (36.5%) | 2,446 (63.4%) |
| High School Diploma | 7,080 (58.3%) | 5,075 (41.7%) |
| College/Associate Degree | 10,725 (56.4%) | 8,298 (43.6%) |
| Bachelor's Degree or higher | 7,795 (72.5%) | 2,954 (27.5%) |
Occupancy by Age of Householder in Pueblo
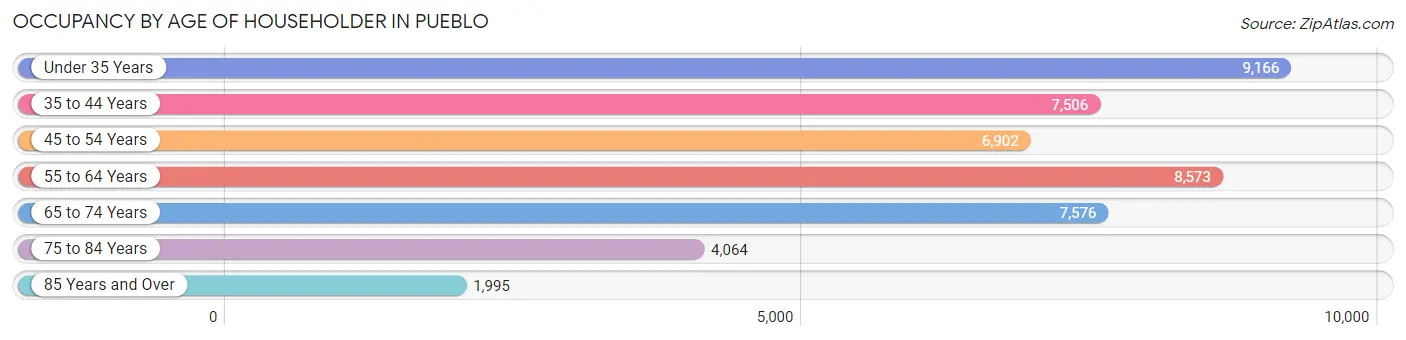
| Age Bracket | # Households | % Households |
| Under 35 Years | 9,166 | 20.0% |
| 35 to 44 Years | 7,506 | 16.4% |
| 45 to 54 Years | 6,902 | 15.1% |
| 55 to 64 Years | 8,573 | 18.7% |
| 65 to 74 Years | 7,576 | 16.6% |
| 75 to 84 Years | 4,064 | 8.9% |
| 85 Years and Over | 1,995 | 4.4% |
| Total | 45,782 | 100.0% |
Housing Finances in Pueblo
Median Income by Occupancy in Pueblo
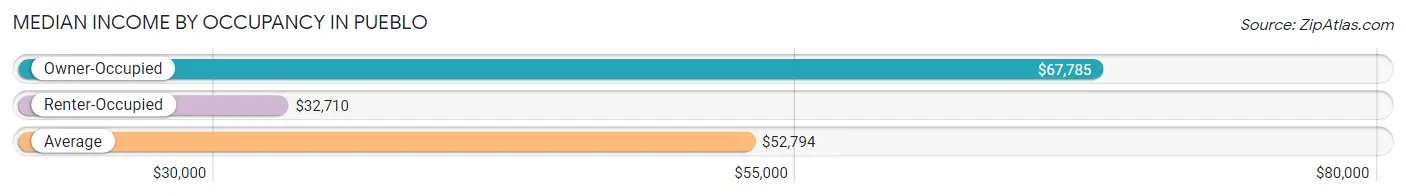
| Occupancy Type | # Households | Median Income |
| Owner-Occupied | 27,009 (59.0%) | $67,785 |
| Renter-Occupied | 18,773 (41.0%) | $32,710 |
| Average | 45,782 (100.0%) | $52,794 |
Occupancy by Householder Income Bracket in Pueblo
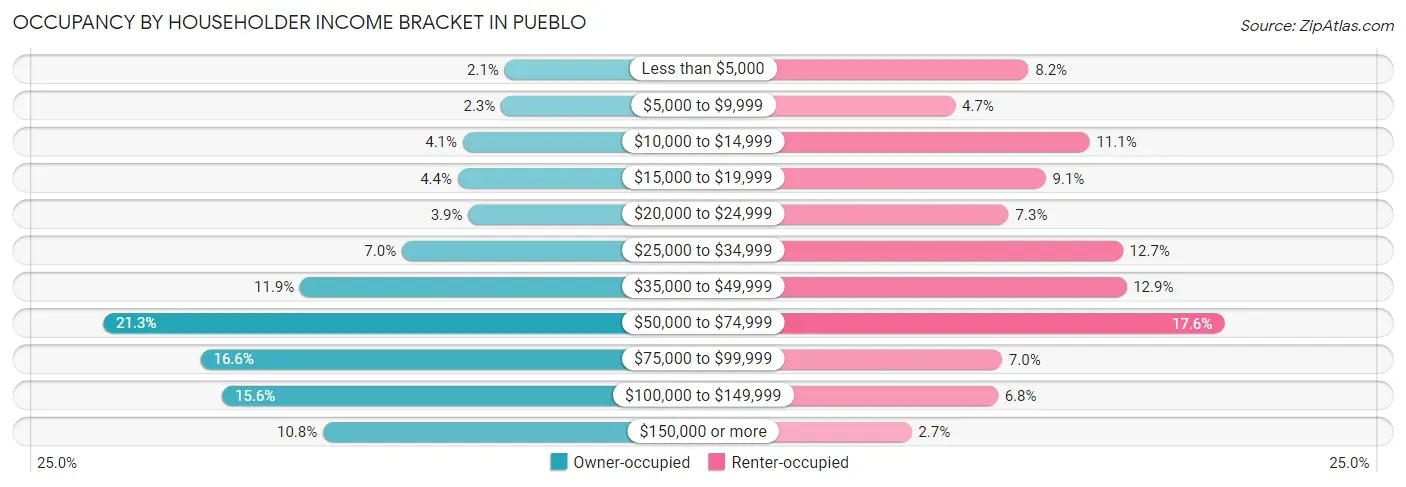
| Income Bracket | Owner-occupied | Renter-occupied |
| Less than $5,000 | 578 (2.1%) | 1,545 (8.2%) |
| $5,000 to $9,999 | 625 (2.3%) | 889 (4.7%) |
| $10,000 to $14,999 | 1,116 (4.1%) | 2,091 (11.1%) |
| $15,000 to $19,999 | 1,181 (4.4%) | 1,699 (9.0%) |
| $20,000 to $24,999 | 1,044 (3.9%) | 1,369 (7.3%) |
| $25,000 to $34,999 | 1,900 (7.0%) | 2,387 (12.7%) |
| $35,000 to $49,999 | 3,208 (11.9%) | 2,419 (12.9%) |
| $50,000 to $74,999 | 5,743 (21.3%) | 3,295 (17.5%) |
| $75,000 to $99,999 | 4,488 (16.6%) | 1,308 (7.0%) |
| $100,000 to $149,999 | 4,213 (15.6%) | 1,271 (6.8%) |
| $150,000 or more | 2,913 (10.8%) | 500 (2.7%) |
| Total | 27,009 (100.0%) | 18,773 (100.0%) |
Monthly Housing Cost Tiers in Pueblo
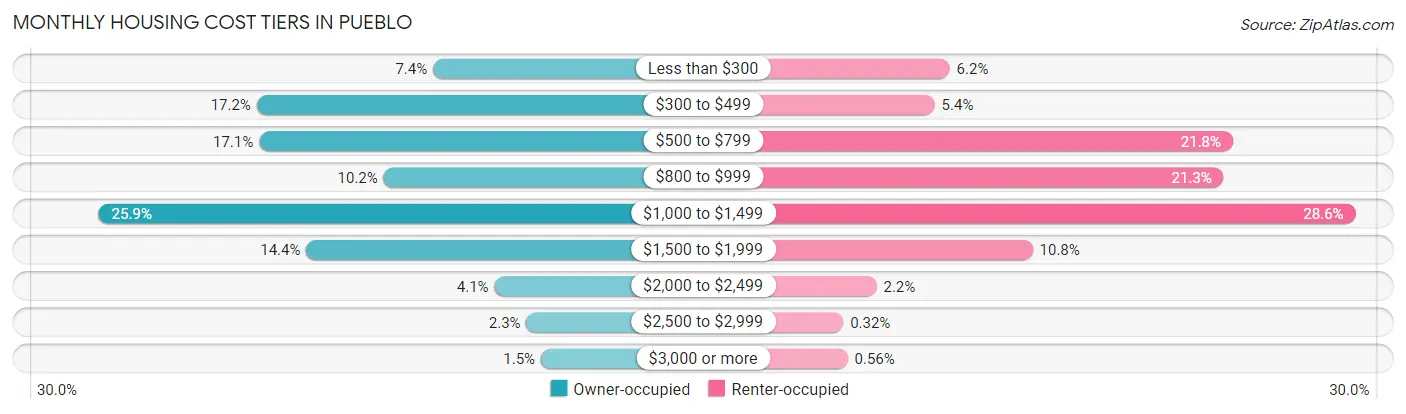
| Monthly Cost | Owner-occupied | Renter-occupied |
| Less than $300 | 2,009 (7.4%) | 1,164 (6.2%) |
| $300 to $499 | 4,640 (17.2%) | 1,008 (5.4%) |
| $500 to $799 | 4,605 (17.1%) | 4,100 (21.8%) |
| $800 to $999 | 2,748 (10.2%) | 4,004 (21.3%) |
| $1,000 to $1,499 | 6,997 (25.9%) | 5,371 (28.6%) |
| $1,500 to $1,999 | 3,901 (14.4%) | 2,023 (10.8%) |
| $2,000 to $2,499 | 1,094 (4.1%) | 405 (2.2%) |
| $2,500 to $2,999 | 615 (2.3%) | 60 (0.3%) |
| $3,000 or more | 400 (1.5%) | 106 (0.6%) |
| Total | 27,009 (100.0%) | 18,773 (100.0%) |
Physical Housing Characteristics in Pueblo
Housing Structures in Pueblo
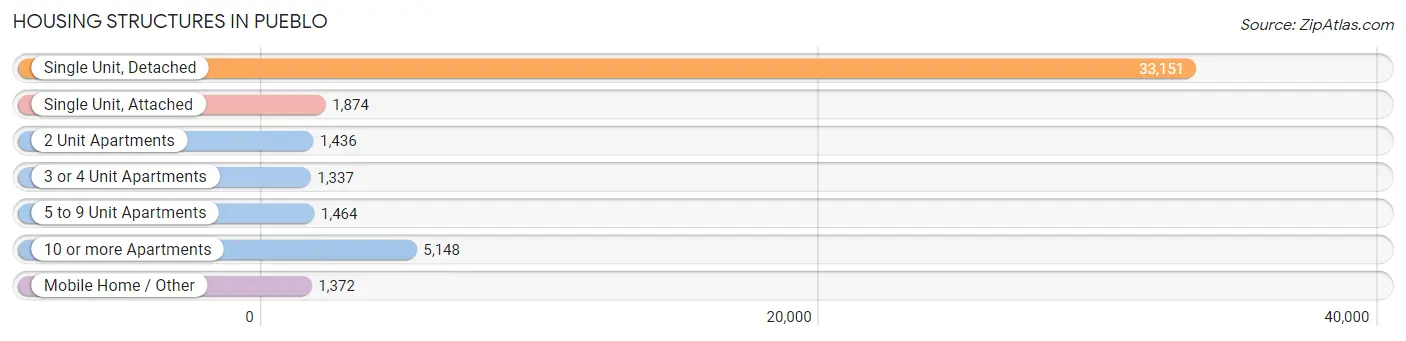
| Structure Type | # Housing Units | % Housing Units |
| Single Unit, Detached | 33,151 | 72.4% |
| Single Unit, Attached | 1,874 | 4.1% |
| 2 Unit Apartments | 1,436 | 3.1% |
| 3 or 4 Unit Apartments | 1,337 | 2.9% |
| 5 to 9 Unit Apartments | 1,464 | 3.2% |
| 10 or more Apartments | 5,148 | 11.2% |
| Mobile Home / Other | 1,372 | 3.0% |
| Total | 45,782 | 100.0% |
Housing Structures by Occupancy in Pueblo
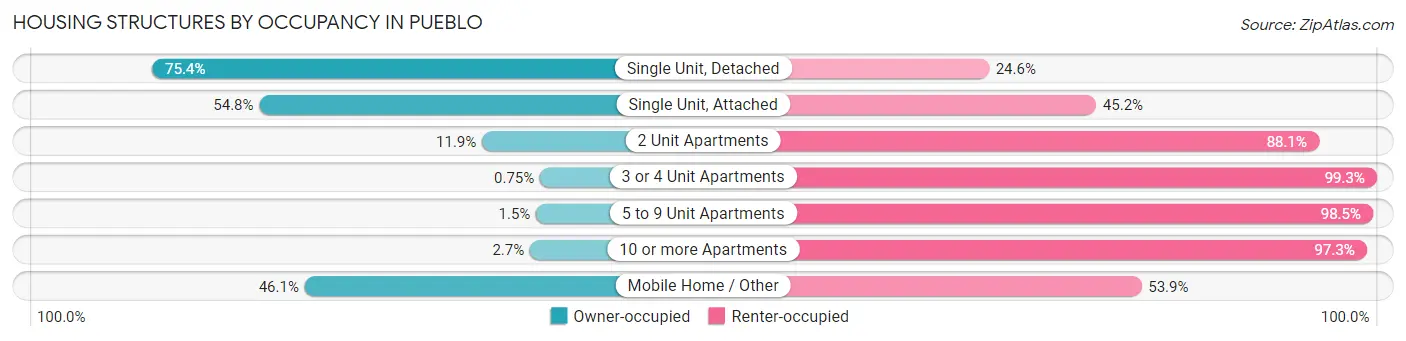
| Structure Type | Owner-occupied | Renter-occupied |
| Single Unit, Detached | 25,009 (75.4%) | 8,142 (24.6%) |
| Single Unit, Attached | 1,027 (54.8%) | 847 (45.2%) |
| 2 Unit Apartments | 171 (11.9%) | 1,265 (88.1%) |
| 3 or 4 Unit Apartments | 10 (0.7%) | 1,327 (99.3%) |
| 5 to 9 Unit Apartments | 22 (1.5%) | 1,442 (98.5%) |
| 10 or more Apartments | 138 (2.7%) | 5,010 (97.3%) |
| Mobile Home / Other | 632 (46.1%) | 740 (53.9%) |
| Total | 27,009 (59.0%) | 18,773 (41.0%) |
Housing Structures by Number of Rooms in Pueblo
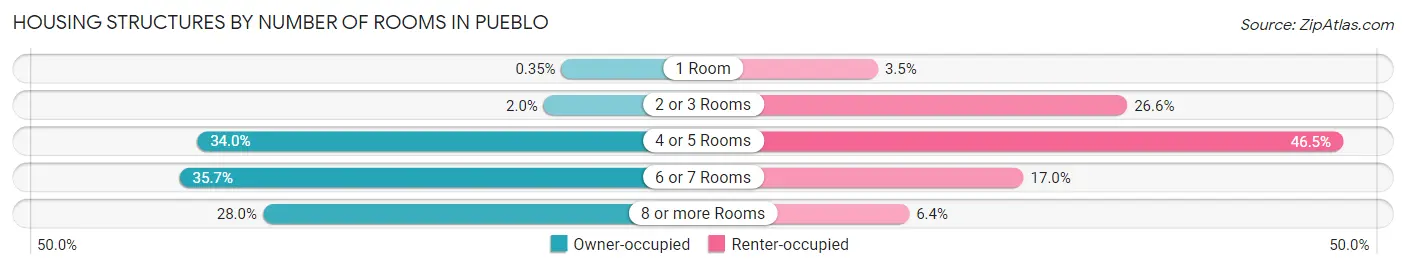
| Number of Rooms | Owner-occupied | Renter-occupied |
| 1 Room | 95 (0.4%) | 661 (3.5%) |
| 2 or 3 Rooms | 538 (2.0%) | 4,988 (26.6%) |
| 4 or 5 Rooms | 9,190 (34.0%) | 8,731 (46.5%) |
| 6 or 7 Rooms | 9,631 (35.7%) | 3,189 (17.0%) |
| 8 or more Rooms | 7,555 (28.0%) | 1,204 (6.4%) |
| Total | 27,009 (100.0%) | 18,773 (100.0%) |
Housing Structure by Heating Type in Pueblo
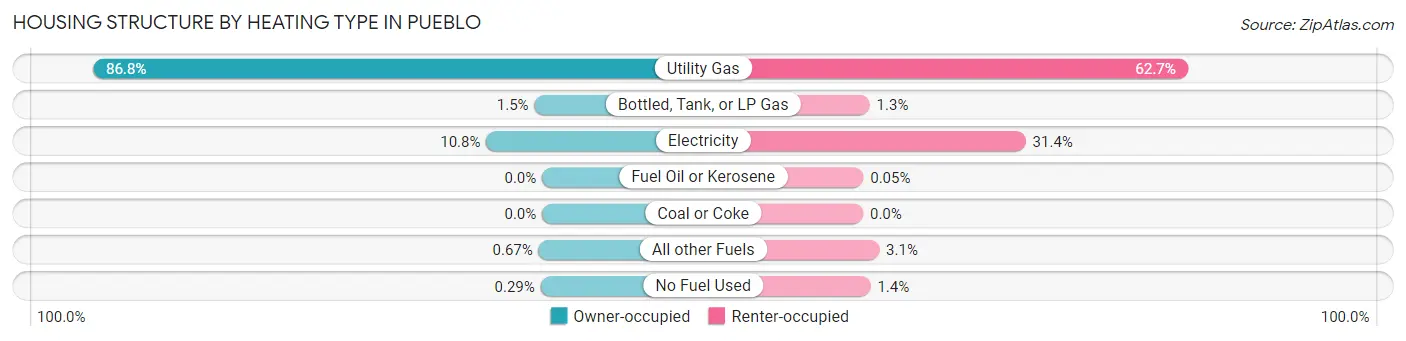
| Heating Type | Owner-occupied | Renter-occupied |
| Utility Gas | 23,435 (86.8%) | 11,773 (62.7%) |
| Bottled, Tank, or LP Gas | 403 (1.5%) | 240 (1.3%) |
| Electricity | 2,913 (10.8%) | 5,898 (31.4%) |
| Fuel Oil or Kerosene | 0 (0.0%) | 9 (0.1%) |
| Coal or Coke | 0 (0.0%) | 0 (0.0%) |
| All other Fuels | 181 (0.7%) | 584 (3.1%) |
| No Fuel Used | 77 (0.3%) | 269 (1.4%) |
| Total | 27,009 (100.0%) | 18,773 (100.0%) |
Household Vehicle Usage in Pueblo
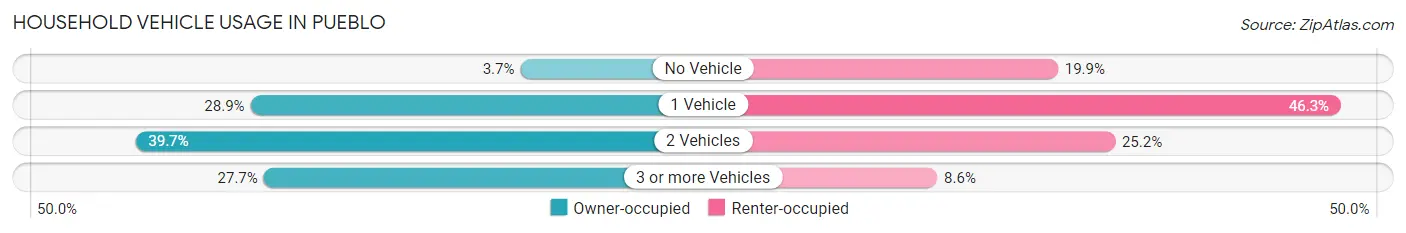
| Vehicles per Household | Owner-occupied | Renter-occupied |
| No Vehicle | 1,008 (3.7%) | 3,731 (19.9%) |
| 1 Vehicle | 7,811 (28.9%) | 8,692 (46.3%) |
| 2 Vehicles | 10,712 (39.7%) | 4,733 (25.2%) |
| 3 or more Vehicles | 7,478 (27.7%) | 1,617 (8.6%) |
| Total | 27,009 (100.0%) | 18,773 (100.0%) |
Real Estate & Mortgages in Pueblo
Real Estate and Mortgage Overview in Pueblo
| Characteristic | Without Mortgage | With Mortgage |
| Housing Units | 10,140 | 16,869 |
| Median Property Value | $183,600 | $205,100 |
| Median Household Income | $50,748 | $2,244 |
| Monthly Housing Costs | $448 | $388 |
| Real Estate Taxes | $912 | $374 |
Property Value by Mortgage Status in Pueblo
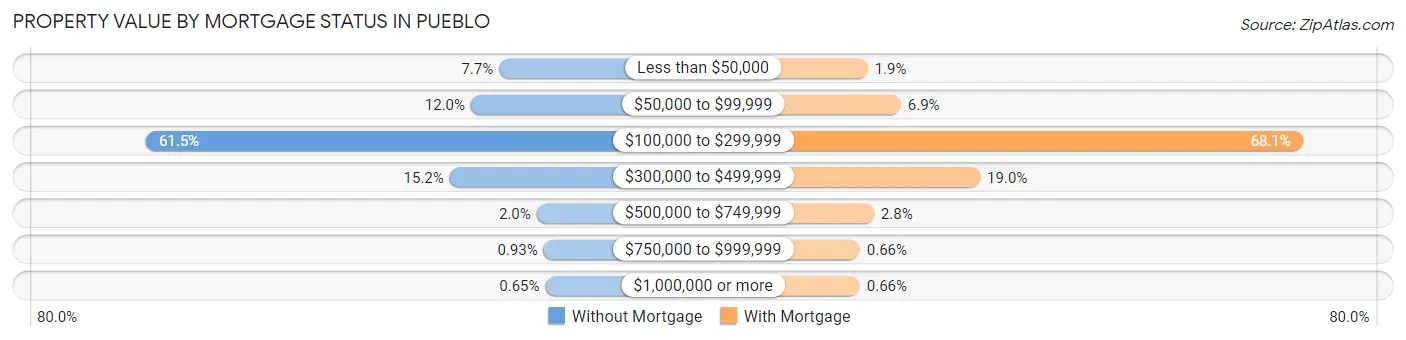
| Property Value | Without Mortgage | With Mortgage |
| Less than $50,000 | 781 (7.7%) | 314 (1.9%) |
| $50,000 to $99,999 | 1,217 (12.0%) | 1,164 (6.9%) |
| $100,000 to $299,999 | 6,236 (61.5%) | 11,493 (68.1%) |
| $300,000 to $499,999 | 1,545 (15.2%) | 3,203 (19.0%) |
| $500,000 to $749,999 | 201 (2.0%) | 473 (2.8%) |
| $750,000 to $999,999 | 94 (0.9%) | 111 (0.7%) |
| $1,000,000 or more | 66 (0.6%) | 111 (0.7%) |
| Total | 10,140 (100.0%) | 16,869 (100.0%) |
Household Income by Mortgage Status in Pueblo
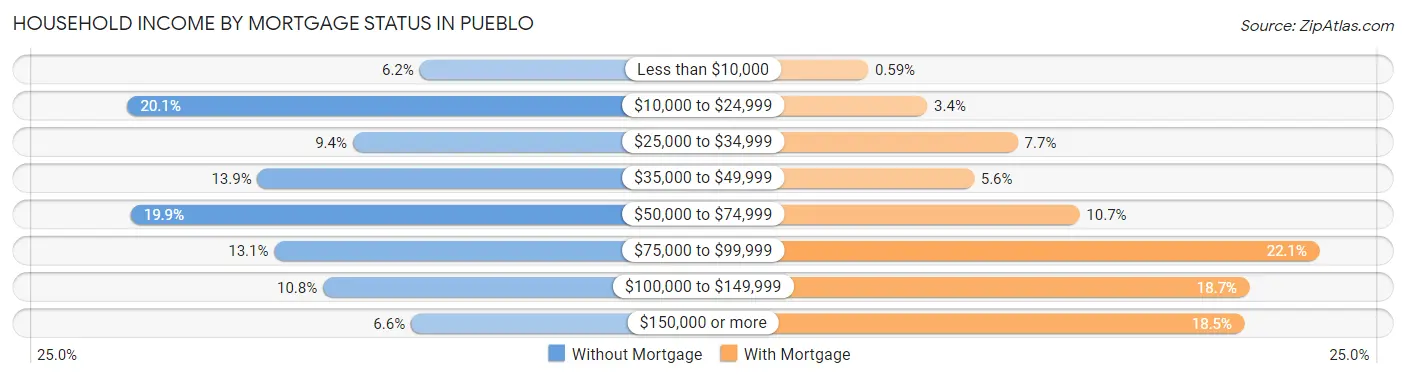
| Household Income | Without Mortgage | With Mortgage |
| Less than $10,000 | 628 (6.2%) | 100 (0.6%) |
| $10,000 to $24,999 | 2,038 (20.1%) | 575 (3.4%) |
| $25,000 to $34,999 | 950 (9.4%) | 1,303 (7.7%) |
| $35,000 to $49,999 | 1,410 (13.9%) | 950 (5.6%) |
| $50,000 to $74,999 | 2,022 (19.9%) | 1,798 (10.7%) |
| $75,000 to $99,999 | 1,329 (13.1%) | 3,721 (22.1%) |
| $100,000 to $149,999 | 1,094 (10.8%) | 3,159 (18.7%) |
| $150,000 or more | 669 (6.6%) | 3,119 (18.5%) |
| Total | 10,140 (100.0%) | 16,869 (100.0%) |
Property Value to Household Income Ratio in Pueblo
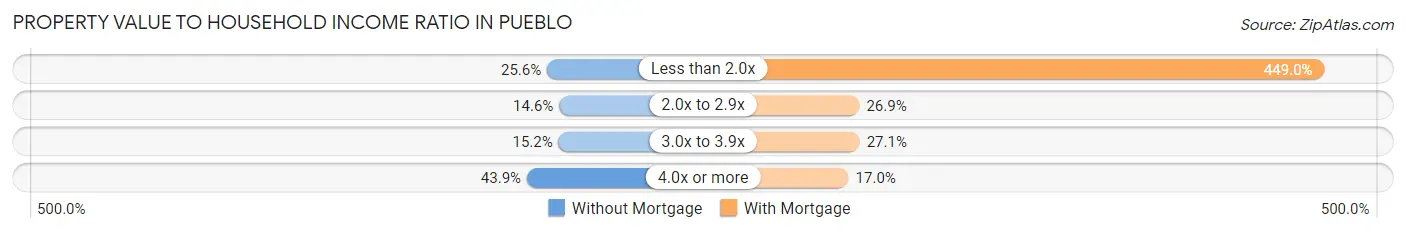
| Value-to-Income Ratio | Without Mortgage | With Mortgage |
| Less than 2.0x | 2,592 (25.6%) | 75,739 (449.0%) |
| 2.0x to 2.9x | 1,480 (14.6%) | 4,531 (26.9%) |
| 3.0x to 3.9x | 1,537 (15.2%) | 4,563 (27.1%) |
| 4.0x or more | 4,447 (43.9%) | 2,867 (17.0%) |
| Total | 10,140 (100.0%) | 16,869 (100.0%) |
Real Estate Taxes by Mortgage Status in Pueblo
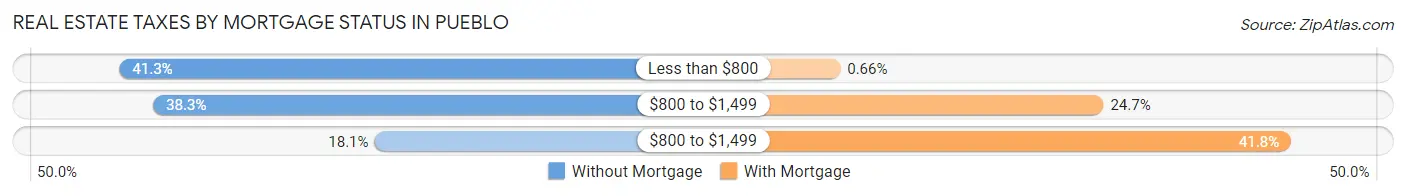
| Property Taxes | Without Mortgage | With Mortgage |
| Less than $800 | 4,192 (41.3%) | 111 (0.7%) |
| $800 to $1,499 | 3,880 (38.3%) | 4,167 (24.7%) |
| $800 to $1,499 | 1,831 (18.1%) | 7,056 (41.8%) |
| Total | 10,140 (100.0%) | 16,869 (100.0%) |
Health & Disability in Pueblo
Health Insurance Coverage by Age in Pueblo
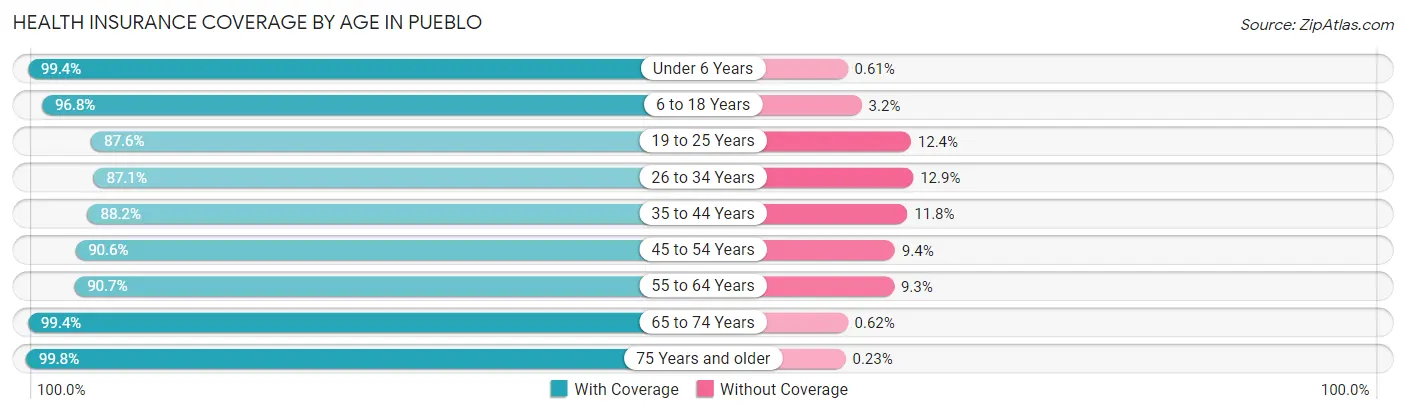
| Age Bracket | With Coverage | Without Coverage |
| Under 6 Years | 8,531 (99.4%) | 52 (0.6%) |
| 6 to 18 Years | 17,055 (96.8%) | 571 (3.2%) |
| 19 to 25 Years | 8,830 (87.6%) | 1,251 (12.4%) |
| 26 to 34 Years | 12,240 (87.1%) | 1,806 (12.9%) |
| 35 to 44 Years | 11,765 (88.2%) | 1,568 (11.8%) |
| 45 to 54 Years | 10,612 (90.6%) | 1,106 (9.4%) |
| 55 to 64 Years | 12,066 (90.7%) | 1,232 (9.3%) |
| 65 to 74 Years | 11,132 (99.4%) | 69 (0.6%) |
| 75 Years and older | 8,101 (99.8%) | 19 (0.2%) |
| Total | 100,332 (92.9%) | 7,674 (7.1%) |
Health Insurance Coverage by Citizenship Status in Pueblo
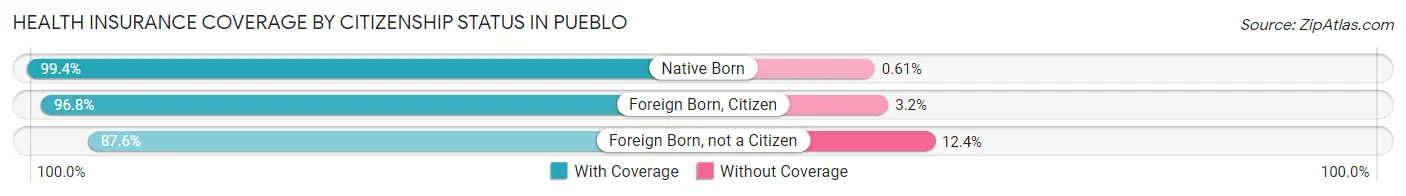
| Citizenship Status | With Coverage | Without Coverage |
| Native Born | 8,531 (99.4%) | 52 (0.6%) |
| Foreign Born, Citizen | 17,055 (96.8%) | 571 (3.2%) |
| Foreign Born, not a Citizen | 8,830 (87.6%) | 1,251 (12.4%) |
Health Insurance Coverage by Household Income in Pueblo
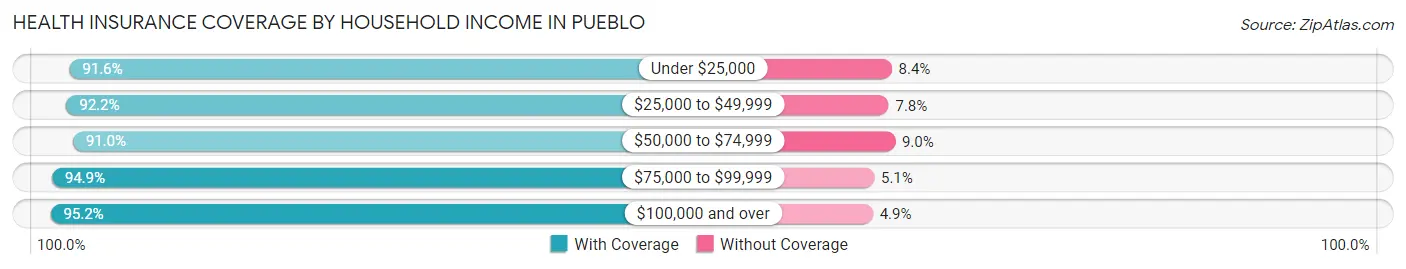
| Household Income | With Coverage | Without Coverage |
| Under $25,000 | 18,591 (91.6%) | 1,703 (8.4%) |
| $25,000 to $49,999 | 19,253 (92.2%) | 1,633 (7.8%) |
| $50,000 to $74,999 | 19,571 (91.0%) | 1,943 (9.0%) |
| $75,000 to $99,999 | 15,763 (94.9%) | 847 (5.1%) |
| $100,000 and over | 25,925 (95.2%) | 1,321 (4.9%) |
Public vs Private Health Insurance Coverage by Age in Pueblo
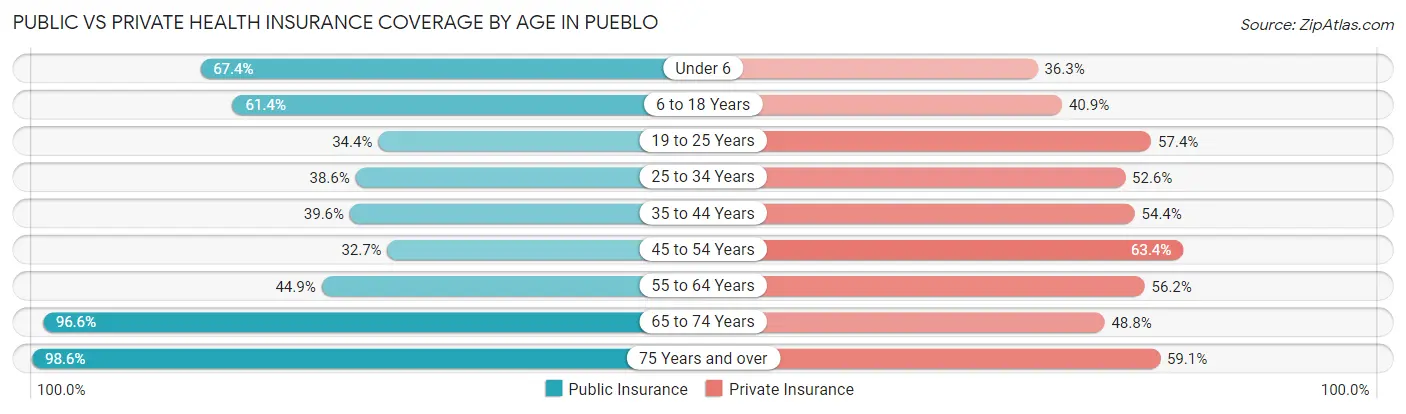
| Age Bracket | Public Insurance | Private Insurance |
| Under 6 | 5,785 (67.4%) | 3,117 (36.3%) |
| 6 to 18 Years | 10,822 (61.4%) | 7,203 (40.9%) |
| 19 to 25 Years | 3,464 (34.4%) | 5,789 (57.4%) |
| 25 to 34 Years | 5,418 (38.6%) | 7,387 (52.6%) |
| 35 to 44 Years | 5,284 (39.6%) | 7,247 (54.3%) |
| 45 to 54 Years | 3,826 (32.7%) | 7,423 (63.3%) |
| 55 to 64 Years | 5,969 (44.9%) | 7,475 (56.2%) |
| 65 to 74 Years | 10,822 (96.6%) | 5,462 (48.8%) |
| 75 Years and over | 8,007 (98.6%) | 4,796 (59.1%) |
| Total | 59,397 (55.0%) | 55,899 (51.8%) |
Disability Status by Sex by Age in Pueblo
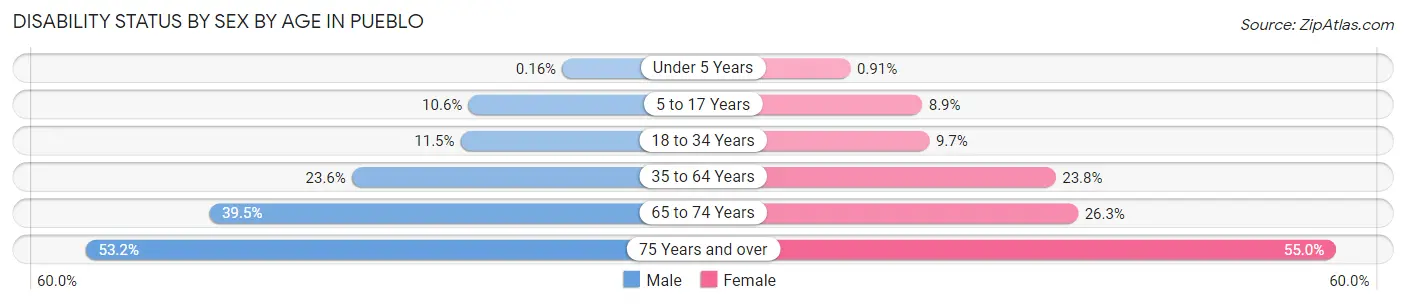
| Age Bracket | Male | Female |
| Under 5 Years | 6 (0.2%) | 30 (0.9%) |
| 5 to 17 Years | 989 (10.6%) | 772 (8.9%) |
| 18 to 34 Years | 1,515 (11.5%) | 1,176 (9.7%) |
| 35 to 64 Years | 4,427 (23.6%) | 4,654 (23.8%) |
| 65 to 74 Years | 2,034 (39.5%) | 1,588 (26.3%) |
| 75 Years and over | 1,697 (53.2%) | 2,714 (55.0%) |
Disability Class by Sex by Age in Pueblo
Disability Class: Hearing Difficulty
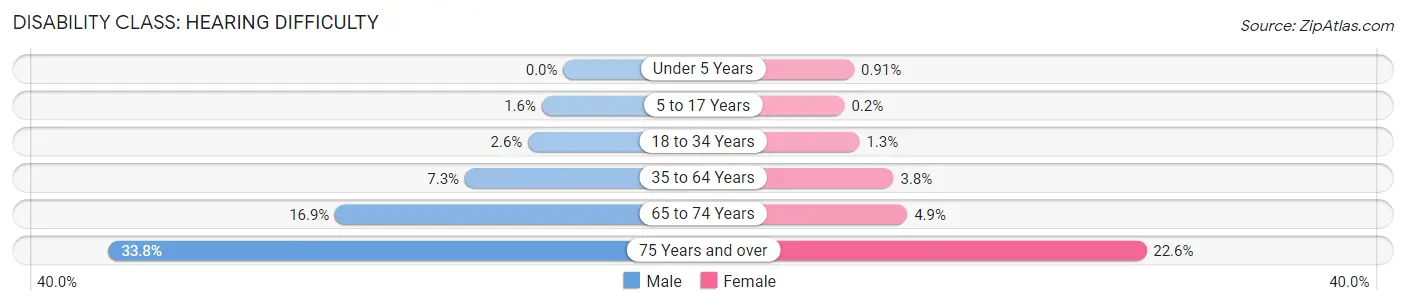
| Age Bracket | Male | Female |
| Under 5 Years | 0 (0.0%) | 30 (0.9%) |
| 5 to 17 Years | 149 (1.6%) | 17 (0.2%) |
| 18 to 34 Years | 345 (2.6%) | 159 (1.3%) |
| 35 to 64 Years | 1,373 (7.3%) | 751 (3.8%) |
| 65 to 74 Years | 873 (16.9%) | 294 (4.9%) |
| 75 Years and over | 1,077 (33.8%) | 1,115 (22.6%) |
Disability Class: Vision Difficulty
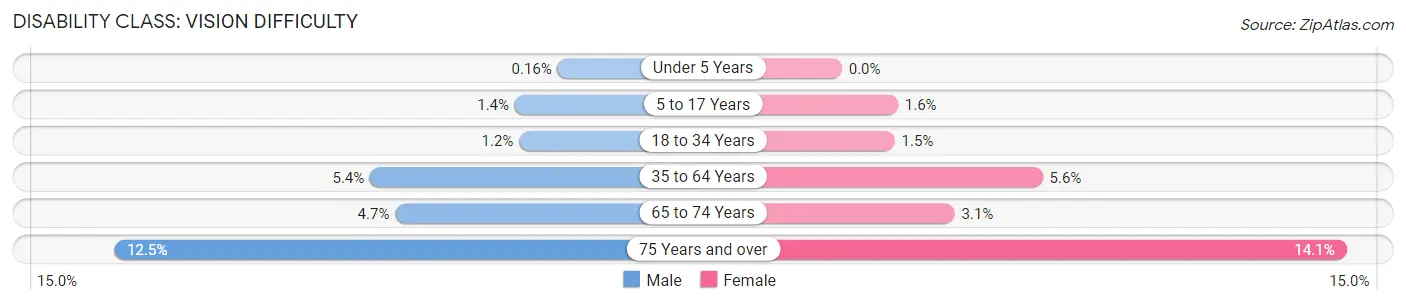
| Age Bracket | Male | Female |
| Under 5 Years | 6 (0.2%) | 0 (0.0%) |
| 5 to 17 Years | 126 (1.3%) | 135 (1.6%) |
| 18 to 34 Years | 163 (1.2%) | 178 (1.5%) |
| 35 to 64 Years | 1,010 (5.4%) | 1,094 (5.6%) |
| 65 to 74 Years | 241 (4.7%) | 190 (3.1%) |
| 75 Years and over | 399 (12.5%) | 693 (14.1%) |
Disability Class: Cognitive Difficulty
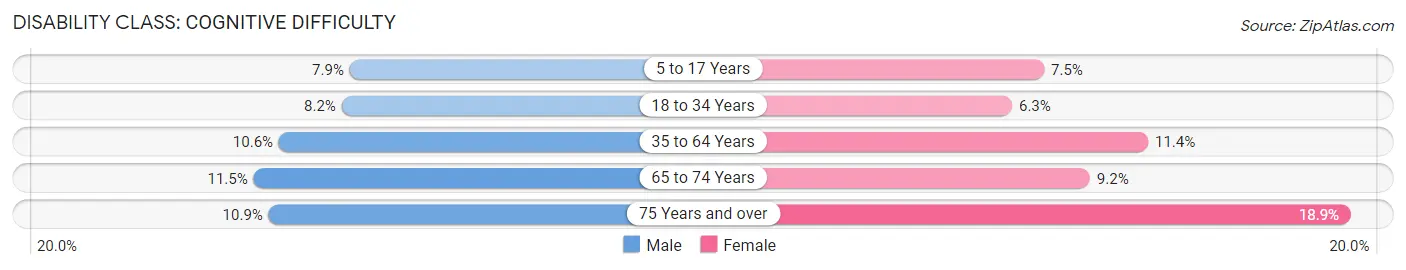
| Age Bracket | Male | Female |
| 5 to 17 Years | 740 (7.9%) | 651 (7.5%) |
| 18 to 34 Years | 1,087 (8.2%) | 765 (6.3%) |
| 35 to 64 Years | 1,982 (10.6%) | 2,226 (11.4%) |
| 65 to 74 Years | 593 (11.5%) | 557 (9.2%) |
| 75 Years and over | 349 (10.9%) | 932 (18.9%) |
Disability Class: Ambulatory Difficulty
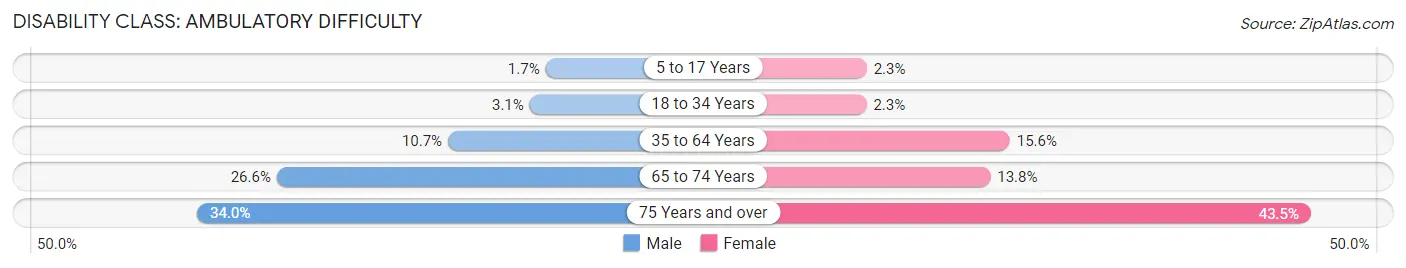
| Age Bracket | Male | Female |
| 5 to 17 Years | 155 (1.7%) | 200 (2.3%) |
| 18 to 34 Years | 413 (3.1%) | 277 (2.3%) |
| 35 to 64 Years | 2,011 (10.7%) | 3,052 (15.6%) |
| 65 to 74 Years | 1,371 (26.6%) | 833 (13.8%) |
| 75 Years and over | 1,084 (34.0%) | 2,146 (43.5%) |
Disability Class: Self-Care Difficulty
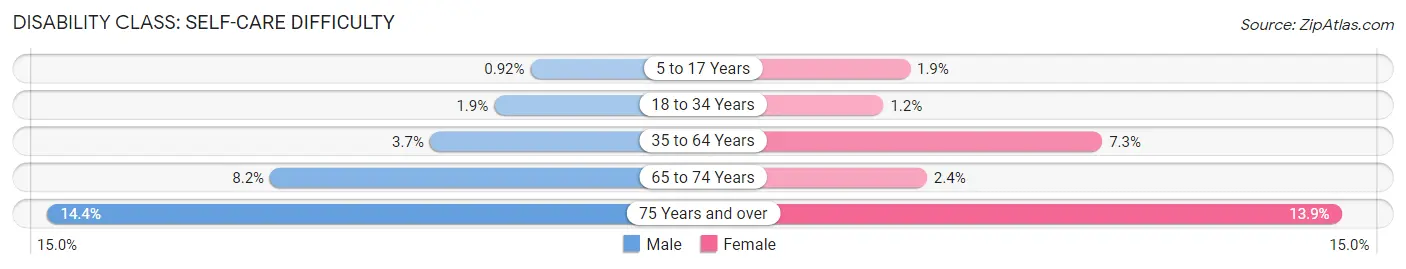
| Age Bracket | Male | Female |
| 5 to 17 Years | 86 (0.9%) | 165 (1.9%) |
| 18 to 34 Years | 255 (1.9%) | 141 (1.2%) |
| 35 to 64 Years | 698 (3.7%) | 1,420 (7.2%) |
| 65 to 74 Years | 421 (8.2%) | 143 (2.4%) |
| 75 Years and over | 458 (14.4%) | 686 (13.9%) |
Technology Access in Pueblo
Computing Device Access in Pueblo
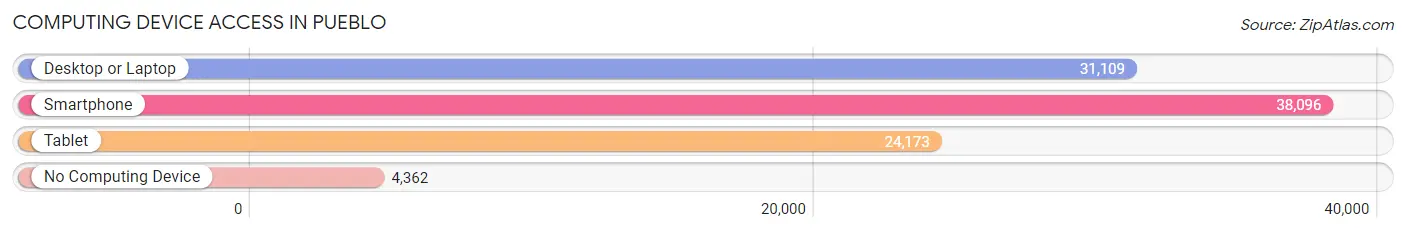
| Device Type | # Households | % Households |
| Desktop or Laptop | 31,109 | 67.9% |
| Smartphone | 38,096 | 83.2% |
| Tablet | 24,173 | 52.8% |
| No Computing Device | 4,362 | 9.5% |
| Total | 45,782 | 100.0% |
Internet Access in Pueblo
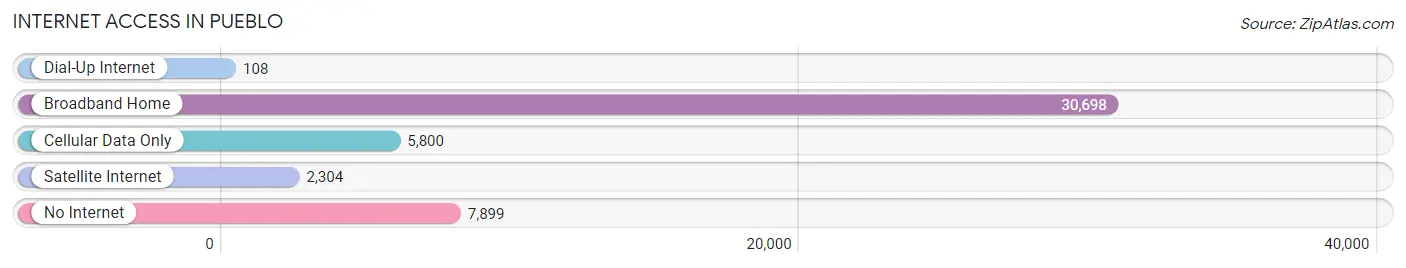
| Internet Type | # Households | % Households |
| Dial-Up Internet | 108 | 0.2% |
| Broadband Home | 30,698 | 67.0% |
| Cellular Data Only | 5,800 | 12.7% |
| Satellite Internet | 2,304 | 5.0% |
| No Internet | 7,899 | 17.2% |
| Total | 45,782 | 100.0% |
Pueblo Summary
Pueblo, Colorado is a city located in the south-central part of the state, approximately 100 miles south of Denver. It is the county seat of Pueblo County and the most populous city in the county. The city is situated at the confluence of the Arkansas River and Fountain Creek, and is located in the foothills of the Rocky Mountains. Pueblo is known for its rich history, diverse geography, vibrant economy, and diverse demographics.
History
Pueblo has a long and rich history that dates back to the early 19th century. The area was first inhabited by the Ute and Apache tribes, who were later displaced by Spanish settlers in the late 1700s. The first permanent settlement in the area was established in 1842, when a group of settlers from New Mexico established a trading post near the confluence of the Arkansas and Fountain Creeks. The settlement was named El Pueblo, which translates to “the town” in Spanish.
In the late 1800s, Pueblo experienced a period of rapid growth and development. The city was incorporated in 1886 and quickly became a major industrial center, with the construction of the Colorado Fuel and Iron Company steel mill in 1892. The steel mill was the largest in the world at the time and helped to make Pueblo one of the most important cities in the state.
Geography
Pueblo is located in the south-central part of Colorado, approximately 100 miles south of Denver. The city is situated at the confluence of the Arkansas River and Fountain Creek, and is located in the foothills of the Rocky Mountains. The city has a total area of 44.2 square miles, of which 43.9 square miles is land and 0.3 square miles is water.
The city is located in a semi-arid climate zone, with hot summers and cold winters. The average annual temperature is 54.2°F, with an average high of 79.2°F in July and an average low of 28.2°F in January. The average annual precipitation is 15.7 inches, with the majority of the precipitation occurring in the spring and summer months.
Economy
Pueblo has a diverse and vibrant economy that is driven by a variety of industries. The city is home to several major employers, including the Colorado Fuel and Iron Company, the Pueblo Chemical Depot, and the Pueblo Army Depot. The city is also home to several major healthcare providers, including Parkview Medical Center and St. Mary-Corwin Medical Center.
The city’s economy is also supported by a variety of small businesses, including retail stores, restaurants, and other service-oriented businesses. The city is also home to several higher education institutions, including the University of Southern Colorado and Pueblo Community College.
Demographics
As of the 2010 census, the population of Pueblo was 106,595. The city has a diverse population, with a majority of the population being of Hispanic or Latino origin. The city also has a significant African American population, as well as a small Asian population. The median household income in the city is $37,845, and the median age is 35.7 years.
Pueblo is a diverse and vibrant city with a rich history, diverse geography, vibrant economy, and diverse demographics. The city is home to a variety of industries, businesses, and educational institutions, and is a great place to live, work, and play.
Common Questions
What is Per Capita Income in Pueblo?
Per Capita income in Pueblo is $28,968.
What is the Median Family Income in Pueblo?
Median Family Income in Pueblo is $64,594.
What is the Median Household income in Pueblo?
Median Household Income in Pueblo is $52,794.
What is Income or Wage Gap in Pueblo?
Income or Wage Gap in Pueblo is 19.1%.
Women in Pueblo earn 80.9 cents for every dollar earned by a man.
What is Family Income Deficit in Pueblo?
Family Income Deficit in Pueblo is $10,090.
Families that are below poverty line in Pueblo earn $10,090 less on average than the poverty threshold level.
What is Inequality or Gini Index in Pueblo?
Inequality or Gini Index in Pueblo is 0.47.
What is the Total Population of Pueblo?
Total Population of Pueblo is 111,430.
What is the Total Male Population of Pueblo?
Total Male Population of Pueblo is 55,420.
What is the Total Female Population of Pueblo?
Total Female Population of Pueblo is 56,010.
What is the Ratio of Males per 100 Females in Pueblo?
There are 98.95 Males per 100 Females in Pueblo.
What is the Ratio of Females per 100 Males in Pueblo?
There are 101.06 Females per 100 Males in Pueblo.
What is the Median Population Age in Pueblo?
Median Population Age in Pueblo is 37.8 Years.
What is the Average Family Size in Pueblo
Average Family Size in Pueblo is 3.1 People.
What is the Average Household Size in Pueblo
Average Household Size in Pueblo is 2.3 People.
How Large is the Labor Force in Pueblo?
There are 48,550 People in the Labor Forcein in Pueblo.
What is the Percentage of People in the Labor Force in Pueblo?
54.6% of People are in the Labor Force in Pueblo.
What is the Unemployment Rate in Pueblo?
Unemployment Rate in Pueblo is 6.6%.