Petersburg, AK Map & Demographics
Petersburg Map
Petersburg Overview
$37,415
PER CAPITA INCOME
$87,750
AVG FAMILY INCOME
$77,670
AVG HOUSEHOLD INCOME
4.4%
WAGE / INCOME GAP [ % ]
95.6¢/ $1
WAGE / INCOME GAP [ $ ]
0.42
INEQUALITY / GINI INDEX
3,317
TOTAL POPULATION
1,641
MALE POPULATION
1,676
FEMALE POPULATION
97.91
MALES / 100 FEMALES
102.13
FEMALES / 100 MALES
49.8
MEDIAN AGE
3.2
AVG FAMILY SIZE
2.6
AVG HOUSEHOLD SIZE
1,748
LABOR FORCE [ PEOPLE ]
62.7%
PERCENT IN LABOR FORCE
3.7%
UNEMPLOYMENT RATE
Petersburg Zip Codes
Petersburg Area Codes
Income in Petersburg
Income Overview in Petersburg
Per Capita Income in Petersburg is $37,415, while median incomes of families and households are $87,750 and $77,670 respectively.
| Characteristic | Number | Measure |
| Per Capita Income | 3,317 | $37,415 |
| Median Family Income | 837 | $87,750 |
| Mean Family Income | 837 | $114,954 |
| Median Household Income | 1,225 | $77,670 |
| Mean Household Income | 1,225 | $95,937 |
| Income Deficit | 837 | $0 |
| Wage / Income Gap (%) | 3,317 | 4.43% |
| Wage / Income Gap ($) | 3,317 | 95.57¢ per $1 |
| Gini / Inequality Index | 3,317 | 0.42 |
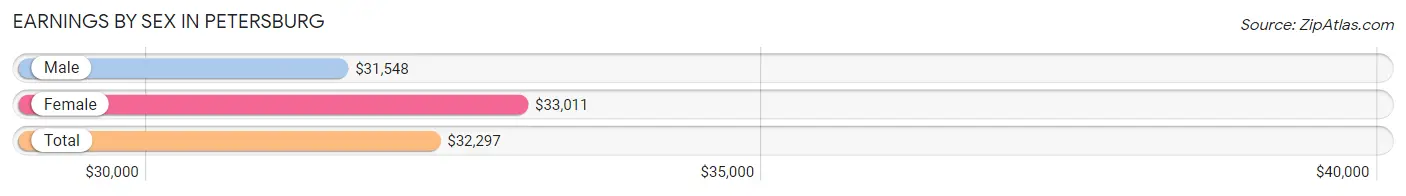
Earnings by Sex in Petersburg
Average Earnings in Petersburg are $32,297, $31,548 for men and $33,011 for women, a difference of 4.4%.
| Sex | Number | Average Earnings |
| Male | 1,008 (52.3%) | $31,548 |
| Female | 921 (47.7%) | $33,011 |
| Total | 1,929 (100.0%) | $32,297 |
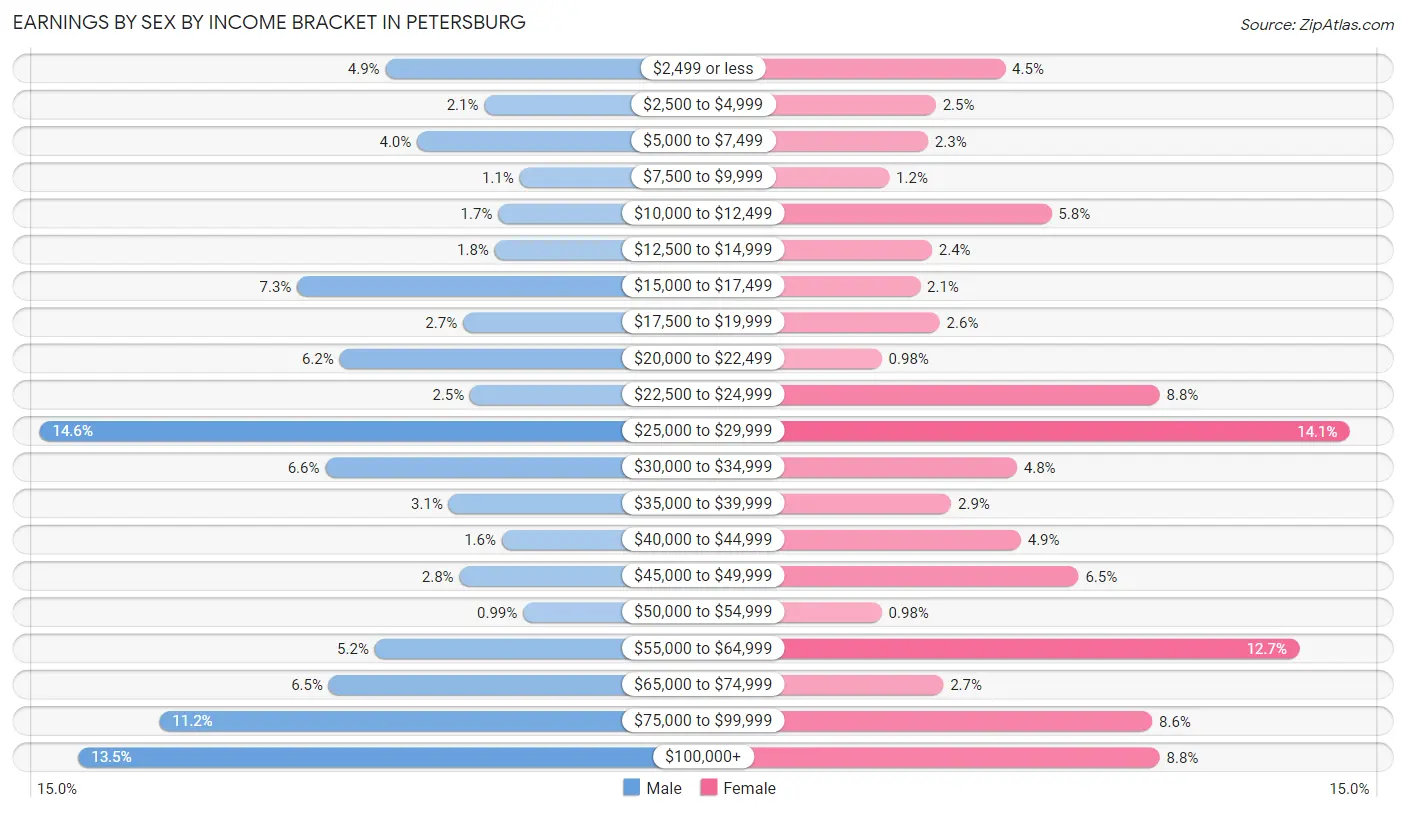
Earnings by Sex by Income Bracket in Petersburg
The most common earnings brackets in Petersburg are $25,000 to $29,999 for men (147 | 14.6%) and $25,000 to $29,999 for women (130 | 14.1%).
| Income | Male | Female |
| $2,499 or less | 49 (4.9%) | 41 (4.4%) |
| $2,500 to $4,999 | 21 (2.1%) | 23 (2.5%) |
| $5,000 to $7,499 | 40 (4.0%) | 21 (2.3%) |
| $7,500 to $9,999 | 11 (1.1%) | 11 (1.2%) |
| $10,000 to $12,499 | 17 (1.7%) | 53 (5.8%) |
| $12,500 to $14,999 | 18 (1.8%) | 22 (2.4%) |
| $15,000 to $17,499 | 74 (7.3%) | 19 (2.1%) |
| $17,500 to $19,999 | 27 (2.7%) | 24 (2.6%) |
| $20,000 to $22,499 | 62 (6.1%) | 9 (1.0%) |
| $22,500 to $24,999 | 25 (2.5%) | 81 (8.8%) |
| $25,000 to $29,999 | 147 (14.6%) | 130 (14.1%) |
| $30,000 to $34,999 | 66 (6.6%) | 44 (4.8%) |
| $35,000 to $39,999 | 31 (3.1%) | 27 (2.9%) |
| $40,000 to $44,999 | 16 (1.6%) | 45 (4.9%) |
| $45,000 to $49,999 | 28 (2.8%) | 60 (6.5%) |
| $50,000 to $54,999 | 10 (1.0%) | 9 (1.0%) |
| $55,000 to $64,999 | 52 (5.2%) | 117 (12.7%) |
| $65,000 to $74,999 | 65 (6.5%) | 25 (2.7%) |
| $75,000 to $99,999 | 113 (11.2%) | 79 (8.6%) |
| $100,000+ | 136 (13.5%) | 81 (8.8%) |
| Total | 1,008 (100.0%) | 921 (100.0%) |
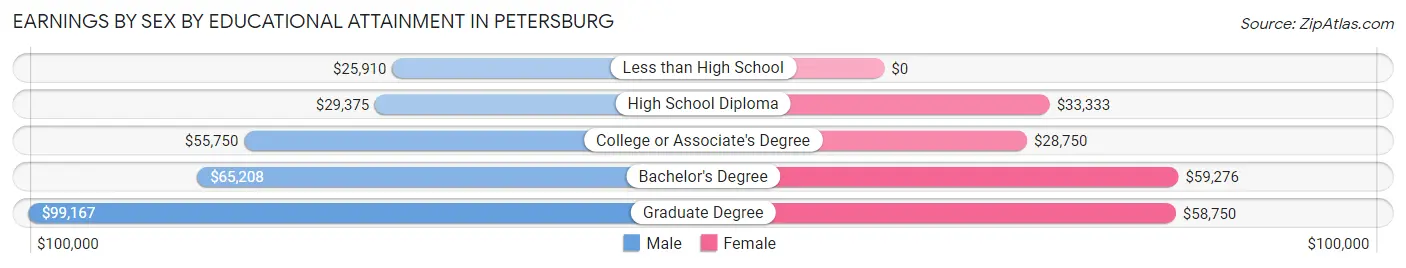
Earnings by Sex by Educational Attainment in Petersburg
Average earnings in Petersburg are $35,489 for men and $36,563 for women, a difference of 2.9%. Men with an educational attainment of graduate degree enjoy the highest average annual earnings of $99,167, while those with less than high school education earn the least with $25,910. Women with an educational attainment of bachelor's degree earn the most with the average annual earnings of $59,276, while those with college or associate's degree education have the smallest earnings of $28,750.
| Educational Attainment | Male Income | Female Income |
| Less than High School | $25,910 | $0 |
| High School Diploma | $29,375 | $33,333 |
| College or Associate's Degree | $55,750 | $28,750 |
| Bachelor's Degree | $65,208 | $59,276 |
| Graduate Degree | $99,167 | $58,750 |
| Total | $35,489 | $36,563 |
Family Income in Petersburg
Family Income Brackets in Petersburg
According to the Petersburg family income data, there are 189 families falling into the $75,000 to $99,999 income range, which is the most common income bracket and makes up 22.6% of all families. Conversely, the $10,000 to $14,999 income bracket is the least frequent group with only 4 families (0.5%) belonging to this category.
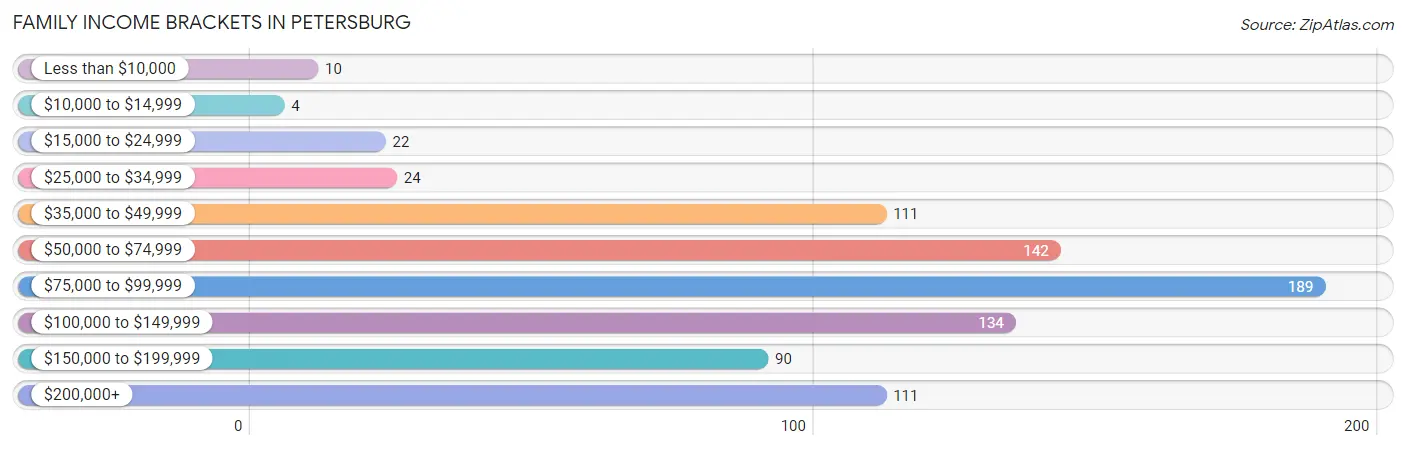
| Income Bracket | # Families | % Families |
| Less than $10,000 | 10 | 1.2% |
| $10,000 to $14,999 | 4 | 0.5% |
| $15,000 to $24,999 | 22 | 2.6% |
| $25,000 to $34,999 | 24 | 2.9% |
| $35,000 to $49,999 | 111 | 13.3% |
| $50,000 to $74,999 | 142 | 17.0% |
| $75,000 to $99,999 | 189 | 22.6% |
| $100,000 to $149,999 | 134 | 16.0% |
| $150,000 to $199,999 | 90 | 10.8% |
| $200,000+ | 111 | 13.3% |
Family Income by Famaliy Size in Petersburg
4-person families (132 | 15.8%) account for the highest median family income in Petersburg with $105,833 per family, while 2-person families (458 | 54.7%) have the highest median income of $41,500 per family member.
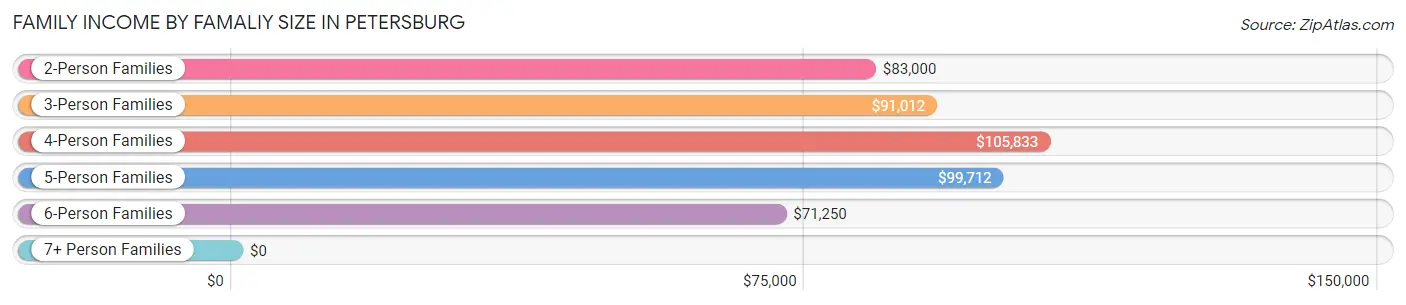
| Income Bracket | # Families | Median Income |
| 2-Person Families | 458 (54.7%) | $83,000 |
| 3-Person Families | 143 (17.1%) | $91,012 |
| 4-Person Families | 132 (15.8%) | $105,833 |
| 5-Person Families | 95 (11.4%) | $99,712 |
| 6-Person Families | 8 (1.0%) | $71,250 |
| 7+ Person Families | 1 (0.1%) | $0 |
| Total | 837 (100.0%) | $87,750 |
Family Income by Number of Earners in Petersburg
The median family income in Petersburg is $87,750, with families comprising 3+ earners (97) having the highest median family income of $154,375, while families with no earners (88) have the lowest median family income of $39,625, accounting for 11.6% and 10.5% of families, respectively.
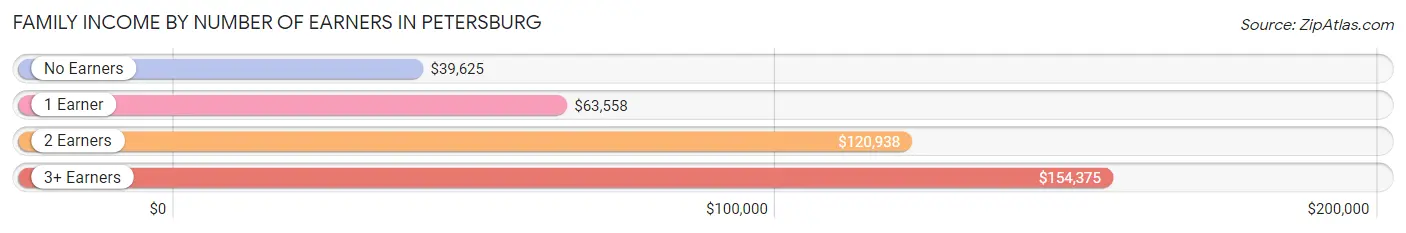
| Number of Earners | # Families | Median Income |
| No Earners | 88 (10.5%) | $39,625 |
| 1 Earner | 275 (32.9%) | $63,558 |
| 2 Earners | 377 (45.0%) | $120,938 |
| 3+ Earners | 97 (11.6%) | $154,375 |
| Total | 837 (100.0%) | $87,750 |
Household Income in Petersburg
Household Income Brackets in Petersburg
With 224 households falling in the category, the $75,000 to $99,999 income range is the most frequent in Petersburg, accounting for 18.3% of all households. In contrast, only 20 households (1.6%) fall into the $10,000 to $14,999 income bracket, making it the least populous group.
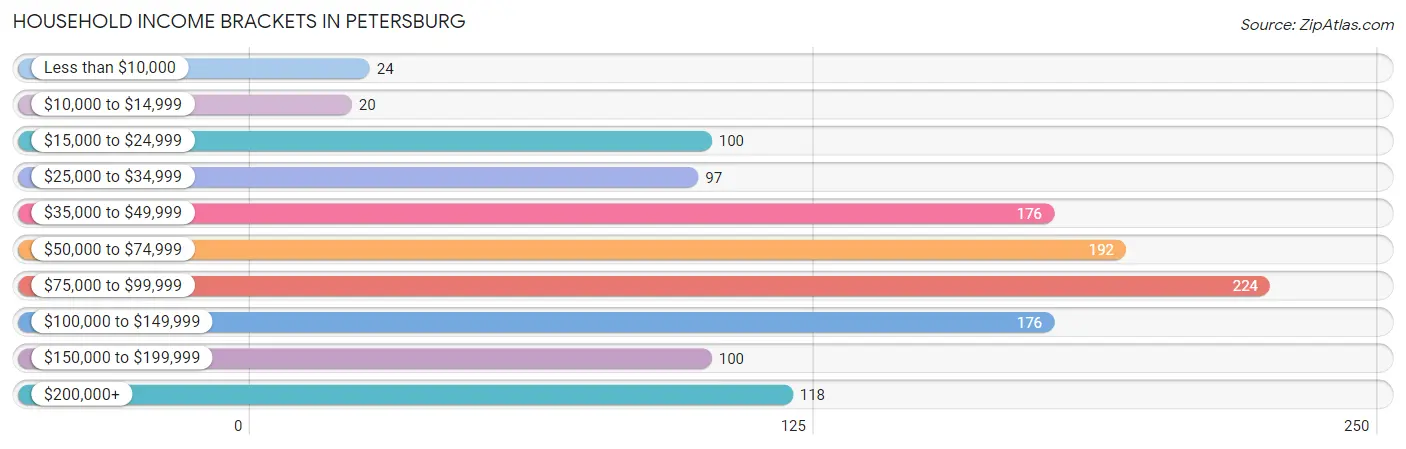
| Income Bracket | # Households | % Households |
| Less than $10,000 | 24 | 2.0% |
| $10,000 to $14,999 | 20 | 1.6% |
| $15,000 to $24,999 | 100 | 8.2% |
| $25,000 to $34,999 | 97 | 7.9% |
| $35,000 to $49,999 | 176 | 14.4% |
| $50,000 to $74,999 | 192 | 15.7% |
| $75,000 to $99,999 | 224 | 18.3% |
| $100,000 to $149,999 | 176 | 14.4% |
| $150,000 to $199,999 | 100 | 8.2% |
| $200,000+ | 118 | 9.6% |
Household Income by Householder Age in Petersburg
The median household income in Petersburg is $77,670, with the highest median household income of $82,386 found in the 45 to 64 years age bracket for the primary householder. A total of 421 households (34.4%) fall into this category. Meanwhile, the 15 to 24 years age bracket for the primary householder has the lowest median household income of $58,750, with 17 households (1.4%) in this group.
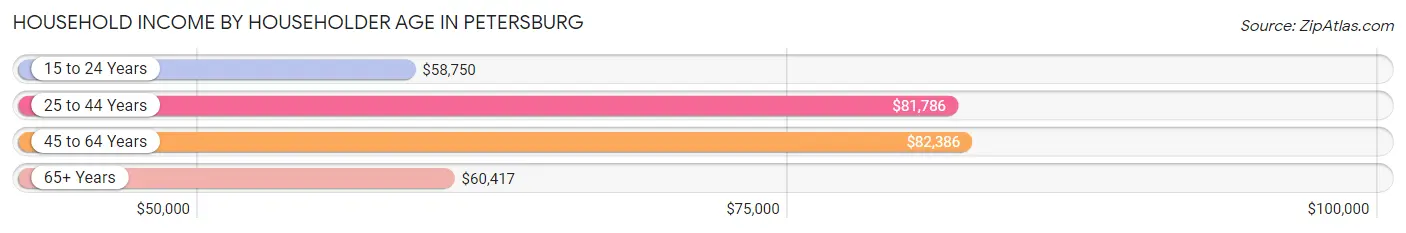
| Income Bracket | # Households | Median Income |
| 15 to 24 Years | 17 (1.4%) | $58,750 |
| 25 to 44 Years | 292 (23.8%) | $81,786 |
| 45 to 64 Years | 421 (34.4%) | $82,386 |
| 65+ Years | 495 (40.4%) | $60,417 |
| Total | 1,225 (100.0%) | $77,670 |
Poverty in Petersburg
Income Below Poverty by Sex and Age in Petersburg
With 4.1% poverty level for males and 5.2% for females among the residents of Petersburg, 18 to 24 year old males and 16 and 17 year old females are the most vulnerable to poverty, with 16 males (14.5%) and 7 females (17.9%) in their respective age groups living below the poverty level.
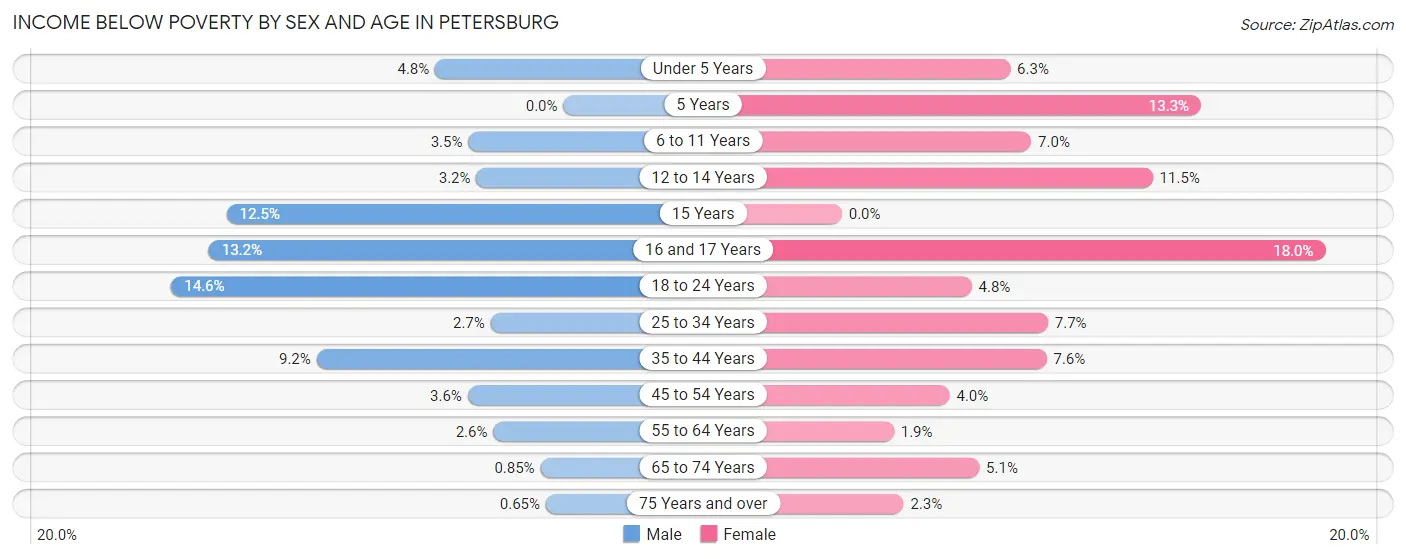
| Age Bracket | Male | Female |
| Under 5 Years | 4 (4.8%) | 4 (6.2%) |
| 5 Years | 0 (0.0%) | 2 (13.3%) |
| 6 to 11 Years | 3 (3.5%) | 9 (7.0%) |
| 12 to 14 Years | 2 (3.2%) | 3 (11.5%) |
| 15 Years | 2 (12.5%) | 0 (0.0%) |
| 16 and 17 Years | 5 (13.2%) | 7 (17.9%) |
| 18 to 24 Years | 16 (14.5%) | 4 (4.8%) |
| 25 to 34 Years | 4 (2.7%) | 15 (7.6%) |
| 35 to 44 Years | 12 (9.2%) | 13 (7.6%) |
| 45 to 54 Years | 5 (3.5%) | 7 (4.0%) |
| 55 to 64 Years | 10 (2.6%) | 6 (1.9%) |
| 65 to 74 Years | 2 (0.9%) | 13 (5.1%) |
| 75 Years and over | 1 (0.6%) | 4 (2.3%) |
| Total | 66 (4.1%) | 87 (5.2%) |
Income Above Poverty by Sex and Age in Petersburg
According to the poverty statistics in Petersburg, males aged 5 years and females aged 15 years are the age groups that are most secure financially, with 100.0% of males and 100.0% of females in these age groups living above the poverty line.
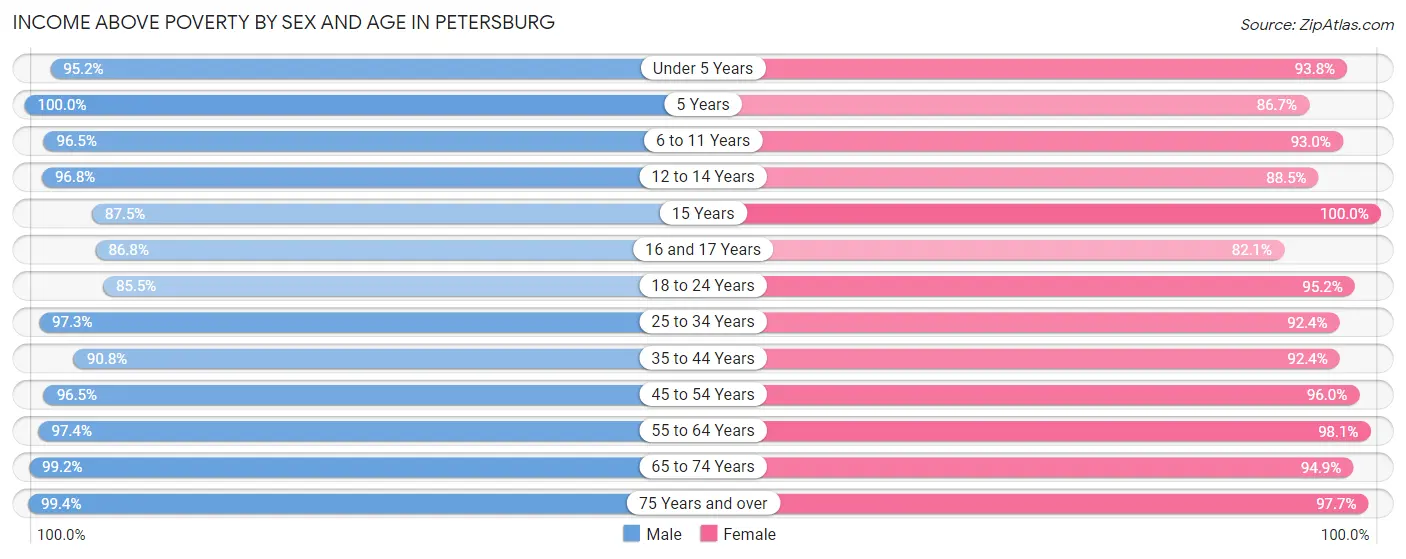
| Age Bracket | Male | Female |
| Under 5 Years | 80 (95.2%) | 60 (93.8%) |
| 5 Years | 16 (100.0%) | 13 (86.7%) |
| 6 to 11 Years | 82 (96.5%) | 119 (93.0%) |
| 12 to 14 Years | 60 (96.8%) | 23 (88.5%) |
| 15 Years | 14 (87.5%) | 26 (100.0%) |
| 16 and 17 Years | 33 (86.8%) | 32 (82.1%) |
| 18 to 24 Years | 94 (85.5%) | 79 (95.2%) |
| 25 to 34 Years | 144 (97.3%) | 181 (92.3%) |
| 35 to 44 Years | 119 (90.8%) | 158 (92.4%) |
| 45 to 54 Years | 136 (96.5%) | 168 (96.0%) |
| 55 to 64 Years | 374 (97.4%) | 305 (98.1%) |
| 65 to 74 Years | 234 (99.2%) | 242 (94.9%) |
| 75 Years and over | 152 (99.4%) | 171 (97.7%) |
| Total | 1,538 (95.9%) | 1,577 (94.8%) |
Income Below Poverty Among Married-Couple Families in Petersburg
The poverty statistics for married-couple families in Petersburg show that 1.7% or 12 of the total 698 families live below the poverty line. Families with 3 or 4 children have the highest poverty rate of 2.9%, comprising of 1 families. On the other hand, families with no children have the lowest poverty rate of 1.3%, which includes 6 families.
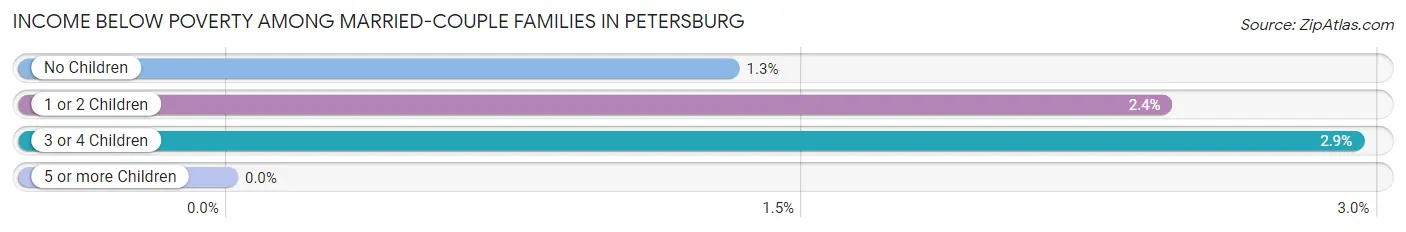
| Children | Above Poverty | Below Poverty |
| No Children | 453 (98.7%) | 6 (1.3%) |
| 1 or 2 Children | 200 (97.6%) | 5 (2.4%) |
| 3 or 4 Children | 33 (97.1%) | 1 (2.9%) |
| 5 or more Children | 0 (0.0%) | 0 (0.0%) |
| Total | 686 (98.3%) | 12 (1.7%) |
Income Below Poverty Among Single-Parent Households in Petersburg
According to the poverty data in Petersburg, 4.3% or 2 single-father households and 20.6% or 19 single-mother households are living below the poverty line. Among single-father households, those with 1 or 2 children have the highest poverty rate, with 2 households (20.0%) experiencing poverty. Likewise, among single-mother households, those with 3 or 4 children have the highest poverty rate, with 5 households (31.2%) falling below the poverty line.
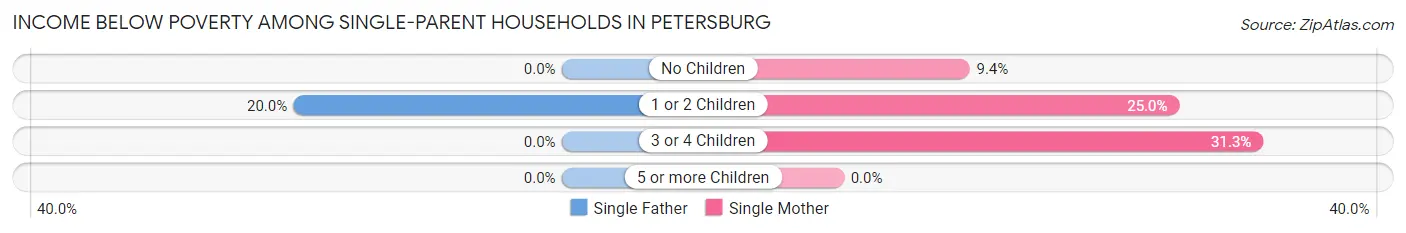
| Children | Single Father | Single Mother |
| No Children | 0 (0.0%) | 3 (9.4%) |
| 1 or 2 Children | 2 (20.0%) | 11 (25.0%) |
| 3 or 4 Children | 0 (0.0%) | 5 (31.2%) |
| 5 or more Children | 0 (0.0%) | 0 (0.0%) |
| Total | 2 (4.3%) | 19 (20.6%) |
Income Below Poverty Among Married-Couple vs Single-Parent Households in Petersburg
The poverty data for Petersburg shows that 12 of the married-couple family households (1.7%) and 21 of the single-parent households (15.1%) are living below the poverty level. Within the married-couple family households, those with 3 or 4 children have the highest poverty rate, with 1 households (2.9%) falling below the poverty line. Among the single-parent households, those with 3 or 4 children have the highest poverty rate, with 5 household (25.0%) living below poverty.
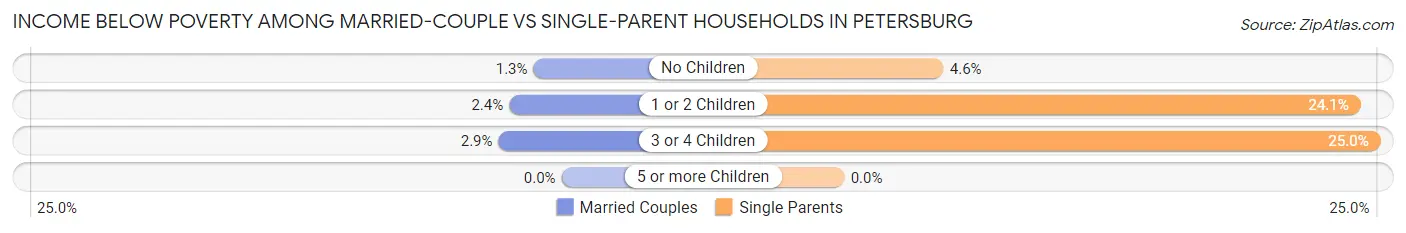
| Children | Married-Couple Families | Single-Parent Households |
| No Children | 6 (1.3%) | 3 (4.6%) |
| 1 or 2 Children | 5 (2.4%) | 13 (24.1%) |
| 3 or 4 Children | 1 (2.9%) | 5 (25.0%) |
| 5 or more Children | 0 (0.0%) | 0 (0.0%) |
| Total | 12 (1.7%) | 21 (15.1%) |
Race in Petersburg
The most populous races in Petersburg are White / Caucasian (1,891 | 57.0%), Asian (602 | 18.1%), and Two or more Races (381 | 11.5%).
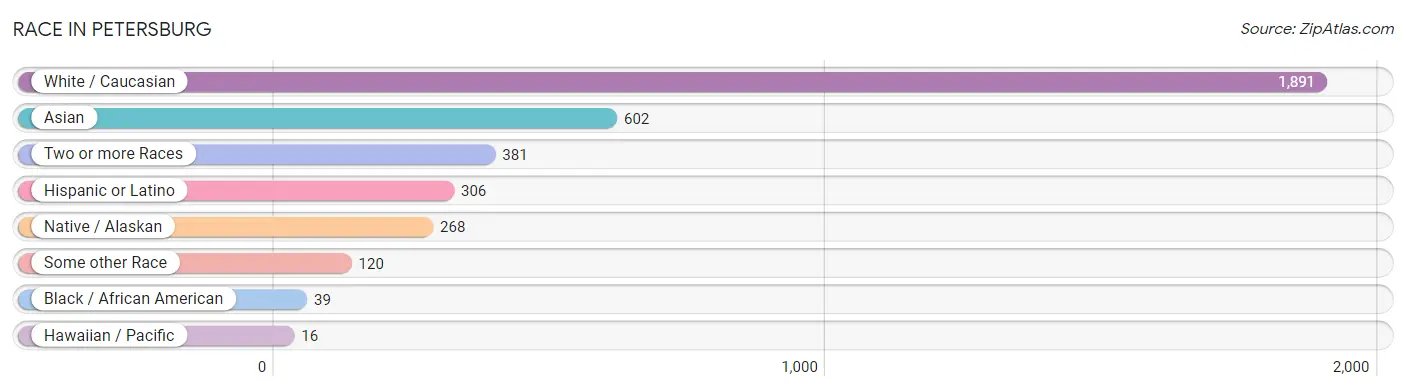
| Race | # Population | % Population |
| Asian | 602 | 18.1% |
| Black / African American | 39 | 1.2% |
| Hawaiian / Pacific | 16 | 0.5% |
| Hispanic or Latino | 306 | 9.2% |
| Native / Alaskan | 268 | 8.1% |
| White / Caucasian | 1,891 | 57.0% |
| Two or more Races | 381 | 11.5% |
| Some other Race | 120 | 3.6% |
| Total | 3,317 | 100.0% |
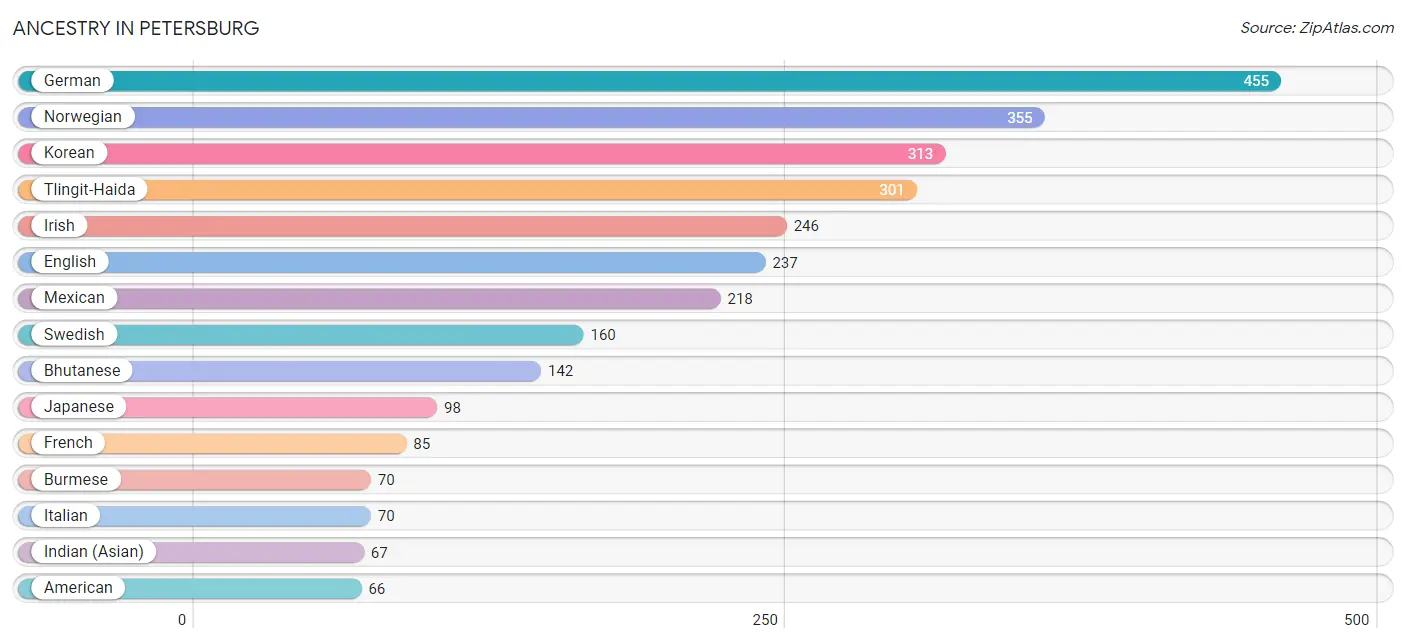
Ancestry in Petersburg
The most populous ancestries reported in Petersburg are German (455 | 13.7%), Norwegian (355 | 10.7%), Korean (313 | 9.4%), Tlingit-Haida (301 | 9.1%), and Irish (246 | 7.4%), together accounting for 50.3% of all Petersburg residents.
| Ancestry | # Population | % Population |
| African | 2 | 0.1% |
| Alaska Native | 9 | 0.3% |
| Alaskan Athabascan | 5 | 0.2% |
| Aleut | 62 | 1.9% |
| American | 66 | 2.0% |
| Arab | 16 | 0.5% |
| Argentinean | 2 | 0.1% |
| Austrian | 3 | 0.1% |
| Belgian | 26 | 0.8% |
| Bhutanese | 142 | 4.3% |
| Blackfeet | 3 | 0.1% |
| British | 2 | 0.1% |
| Burmese | 70 | 2.1% |
| Canadian | 7 | 0.2% |
| Central American | 4 | 0.1% |
| Cherokee | 50 | 1.5% |
| Chippewa | 6 | 0.2% |
| Choctaw | 5 | 0.2% |
| Colombian | 32 | 1.0% |
| Comanche | 2 | 0.1% |
| Cuban | 5 | 0.2% |
| Czech | 18 | 0.5% |
| Czechoslovakian | 1 | 0.0% |
| Danish | 23 | 0.7% |
| Dominican | 3 | 0.1% |
| Dutch | 36 | 1.1% |
| Eastern European | 18 | 0.5% |
| English | 237 | 7.1% |
| Ethiopian | 2 | 0.1% |
| European | 51 | 1.5% |
| Finnish | 63 | 1.9% |
| French | 85 | 2.6% |
| French American Indian | 1 | 0.0% |
| French Canadian | 7 | 0.2% |
| German | 455 | 13.7% |
| Greek | 18 | 0.5% |
| Haitian | 2 | 0.1% |
| Hungarian | 4 | 0.1% |
| Icelander | 9 | 0.3% |
| Indian (Asian) | 67 | 2.0% |
| Inupiat | 4 | 0.1% |
| Irish | 246 | 7.4% |
| Italian | 70 | 2.1% |
| Japanese | 98 | 2.9% |
| Korean | 313 | 9.4% |
| Latvian | 1 | 0.0% |
| Lebanese | 13 | 0.4% |
| Lithuanian | 1 | 0.0% |
| Lumbee | 5 | 0.2% |
| Mexican | 218 | 6.6% |
| Native Hawaiian | 53 | 1.6% |
| Navajo | 2 | 0.1% |
| Nicaraguan | 4 | 0.1% |
| Nigerian | 6 | 0.2% |
| Northern European | 44 | 1.3% |
| Norwegian | 355 | 10.7% |
| Pakistani | 4 | 0.1% |
| Pennsylvania German | 4 | 0.1% |
| Polish | 38 | 1.1% |
| Portuguese | 9 | 0.3% |
| Puerto Rican | 25 | 0.7% |
| Puget Sound Salish | 4 | 0.1% |
| Romanian | 1 | 0.0% |
| Russian | 16 | 0.5% |
| Samoan | 25 | 0.7% |
| Scandinavian | 64 | 1.9% |
| Scotch-Irish | 61 | 1.8% |
| Scottish | 49 | 1.5% |
| Serbian | 1 | 0.0% |
| Somali | 3 | 0.1% |
| South American | 34 | 1.0% |
| Spaniard | 8 | 0.2% |
| Spanish | 7 | 0.2% |
| Sri Lankan | 61 | 1.8% |
| Subsaharan African | 13 | 0.4% |
| Swedish | 160 | 4.8% |
| Swiss | 7 | 0.2% |
| Tlingit-Haida | 301 | 9.1% |
| Tsimshian | 2 | 0.1% |
| Ukrainian | 19 | 0.6% |
| Welsh | 29 | 0.9% |
| Yup'ik | 3 | 0.1% | View All 82 Rows |
Immigrants in Petersburg
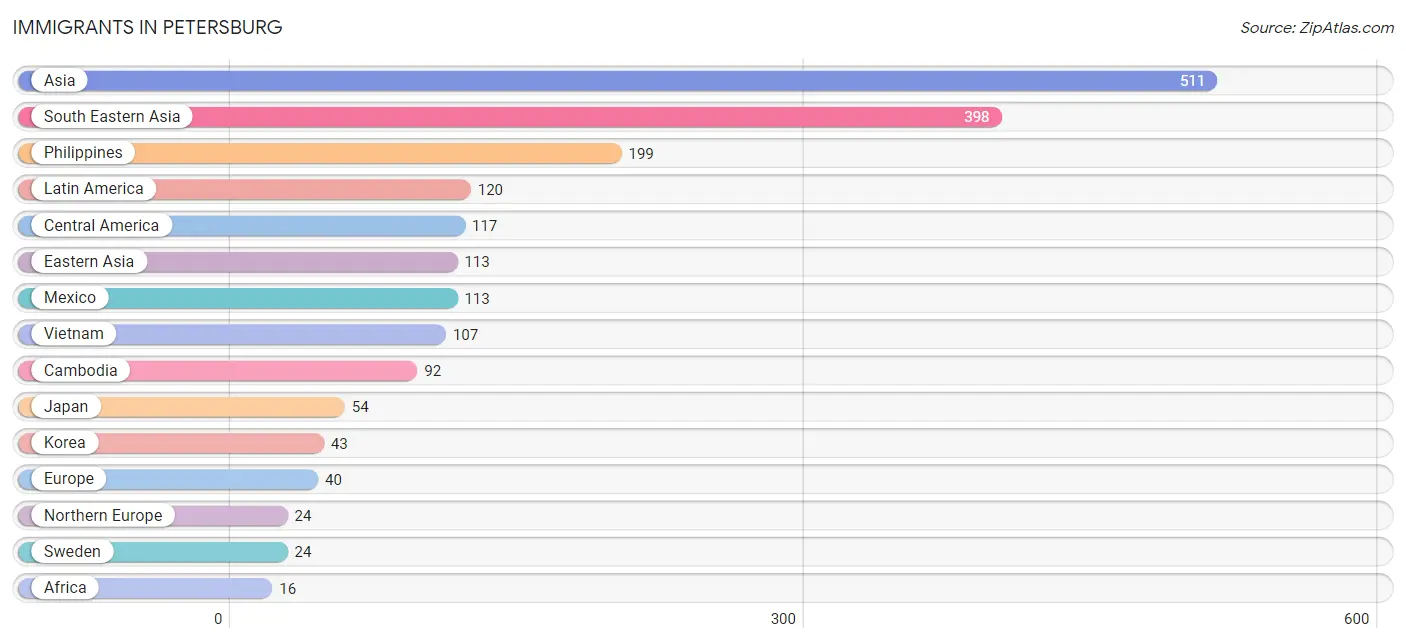
The most numerous immigrant groups reported in Petersburg came from Asia (511 | 15.4%), South Eastern Asia (398 | 12.0%), Philippines (199 | 6.0%), Latin America (120 | 3.6%), and Central America (117 | 3.5%), together accounting for 40.6% of all Petersburg residents.
| Immigration Origin | # Population | % Population |
| Africa | 16 | 0.5% |
| Asia | 511 | 15.4% |
| Belgium | 2 | 0.1% |
| Cambodia | 92 | 2.8% |
| Canada | 7 | 0.2% |
| Caribbean | 3 | 0.1% |
| Central America | 117 | 3.5% |
| China | 16 | 0.5% |
| Czechoslovakia | 1 | 0.0% |
| Dominican Republic | 3 | 0.1% |
| Eastern Africa | 7 | 0.2% |
| Eastern Asia | 113 | 3.4% |
| Eastern Europe | 13 | 0.4% |
| Ethiopia | 2 | 0.1% |
| Europe | 40 | 1.2% |
| Germany | 1 | 0.0% |
| Hong Kong | 16 | 0.5% |
| Hungary | 2 | 0.1% |
| Japan | 54 | 1.6% |
| Korea | 43 | 1.3% |
| Latin America | 120 | 3.6% |
| Mexico | 113 | 3.4% |
| Nicaragua | 4 | 0.1% |
| Nigeria | 6 | 0.2% |
| Northern Africa | 3 | 0.1% |
| Northern Europe | 24 | 0.7% |
| Oceania | 9 | 0.3% |
| Philippines | 199 | 6.0% |
| Russia | 2 | 0.1% |
| Somalia | 3 | 0.1% |
| South Eastern Asia | 398 | 12.0% |
| Sudan | 3 | 0.1% |
| Sweden | 24 | 0.7% |
| Ukraine | 8 | 0.2% |
| Vietnam | 107 | 3.2% |
| Western Africa | 6 | 0.2% |
| Western Europe | 3 | 0.1% | View All 37 Rows |
Sex and Age in Petersburg
Sex and Age in Petersburg
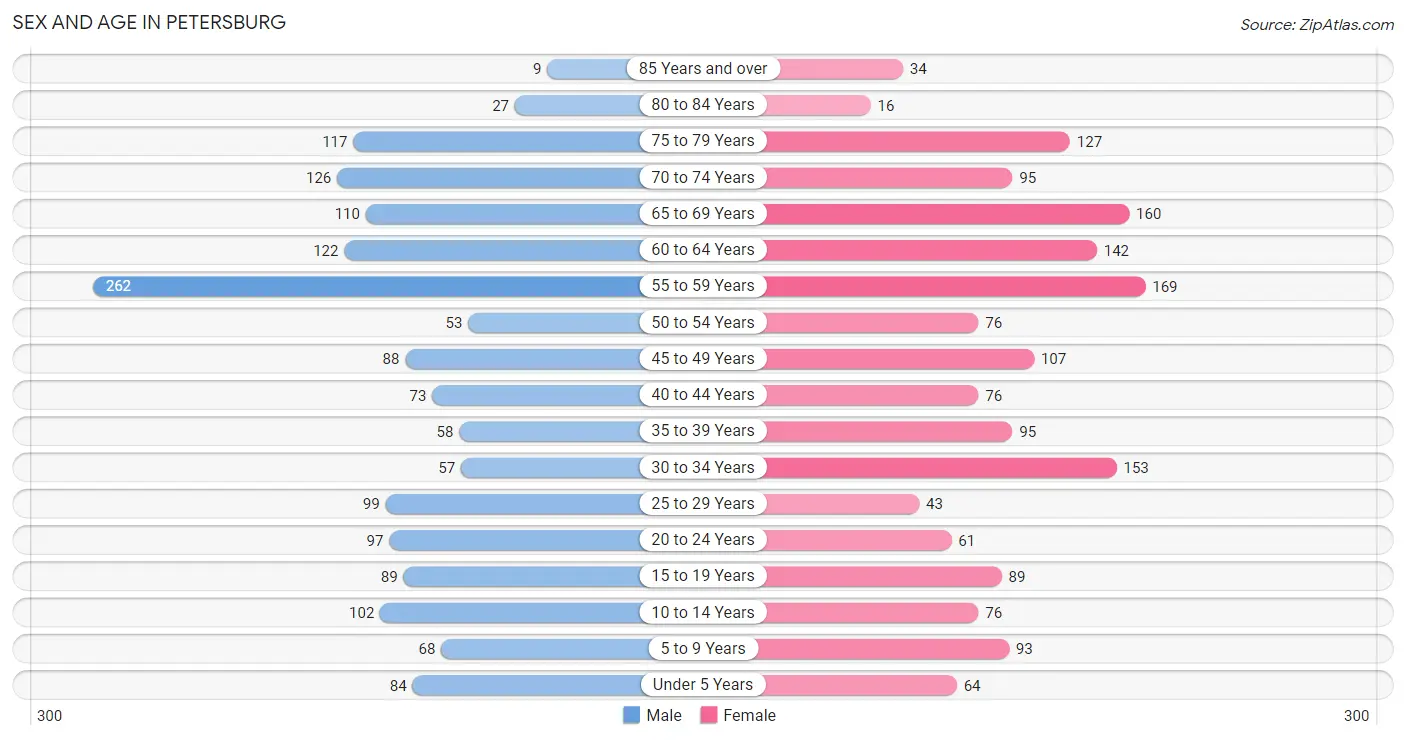
The most populous age groups in Petersburg are 55 to 59 Years (262 | 16.0%) for men and 55 to 59 Years (169 | 10.1%) for women.
| Age Bracket | Male | Female |
| Under 5 Years | 84 (5.1%) | 64 (3.8%) |
| 5 to 9 Years | 68 (4.1%) | 93 (5.6%) |
| 10 to 14 Years | 102 (6.2%) | 76 (4.5%) |
| 15 to 19 Years | 89 (5.4%) | 89 (5.3%) |
| 20 to 24 Years | 97 (5.9%) | 61 (3.6%) |
| 25 to 29 Years | 99 (6.0%) | 43 (2.6%) |
| 30 to 34 Years | 57 (3.5%) | 153 (9.1%) |
| 35 to 39 Years | 58 (3.5%) | 95 (5.7%) |
| 40 to 44 Years | 73 (4.4%) | 76 (4.5%) |
| 45 to 49 Years | 88 (5.4%) | 107 (6.4%) |
| 50 to 54 Years | 53 (3.2%) | 76 (4.5%) |
| 55 to 59 Years | 262 (16.0%) | 169 (10.1%) |
| 60 to 64 Years | 122 (7.4%) | 142 (8.5%) |
| 65 to 69 Years | 110 (6.7%) | 160 (9.6%) |
| 70 to 74 Years | 126 (7.7%) | 95 (5.7%) |
| 75 to 79 Years | 117 (7.1%) | 127 (7.6%) |
| 80 to 84 Years | 27 (1.7%) | 16 (0.9%) |
| 85 Years and over | 9 (0.5%) | 34 (2.0%) |
| Total | 1,641 (100.0%) | 1,676 (100.0%) |
Families and Households in Petersburg
Median Family Size in Petersburg
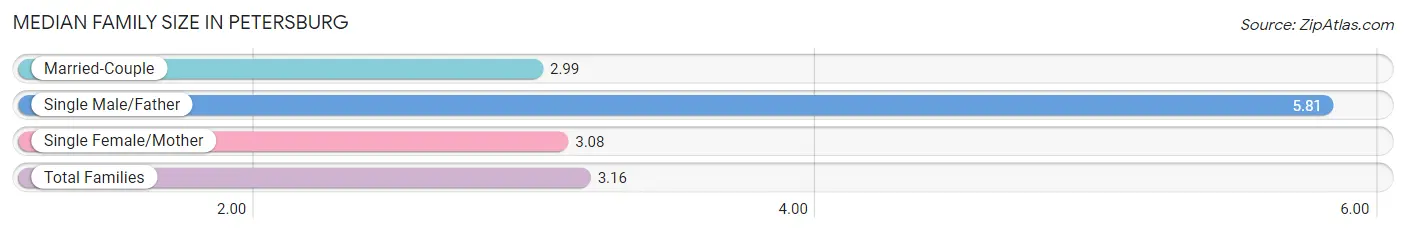
The median family size in Petersburg is 3.16 persons per family, with single male/father families (47 | 5.6%) accounting for the largest median family size of 5.81 persons per family. On the other hand, married-couple families (698 | 83.4%) represent the smallest median family size with 2.99 persons per family.
| Family Type | # Families | Family Size |
| Married-Couple | 698 (83.4%) | 2.99 |
| Single Male/Father | 47 (5.6%) | 5.81 |
| Single Female/Mother | 92 (11.0%) | 3.08 |
| Total Families | 837 (100.0%) | 3.16 |
Median Household Size in Petersburg
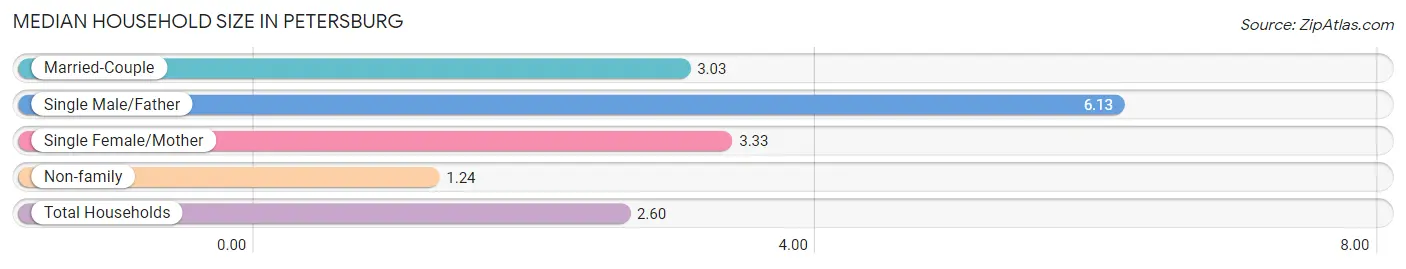
The median household size in Petersburg is 2.60 persons per household, with single male/father households (47 | 3.8%) accounting for the largest median household size of 6.13 persons per household. non-family households (388 | 31.7%) represent the smallest median household size with 1.24 persons per household.
| Household Type | # Households | Household Size |
| Married-Couple | 698 (57.0%) | 3.03 |
| Single Male/Father | 47 (3.8%) | 6.13 |
| Single Female/Mother | 92 (7.5%) | 3.33 |
| Non-family | 388 (31.7%) | 1.24 |
| Total Households | 1,225 (100.0%) | 2.60 |
Household Size by Marriage Status in Petersburg
Out of a total of 1,225 households in Petersburg, 837 (68.3%) are family households, while 388 (31.7%) are nonfamily households. The most numerous type of family households are 2-person households, comprising 442, and the most common type of nonfamily households are 1-person households, comprising 317.
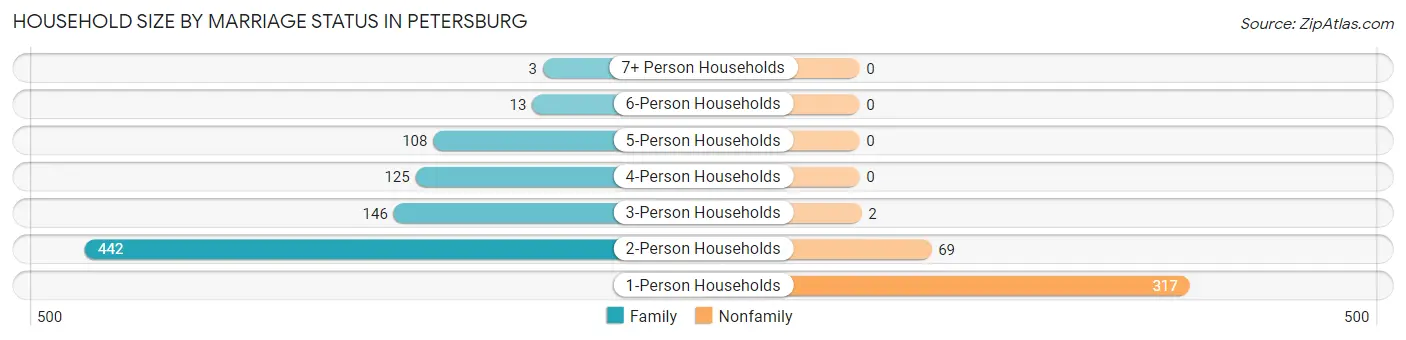
| Household Size | Family Households | Nonfamily Households |
| 1-Person Households | - | 317 (25.9%) |
| 2-Person Households | 442 (36.1%) | 69 (5.6%) |
| 3-Person Households | 146 (11.9%) | 2 (0.2%) |
| 4-Person Households | 125 (10.2%) | 0 (0.0%) |
| 5-Person Households | 108 (8.8%) | 0 (0.0%) |
| 6-Person Households | 13 (1.1%) | 0 (0.0%) |
| 7+ Person Households | 3 (0.2%) | 0 (0.0%) |
| Total | 837 (68.3%) | 388 (31.7%) |
Female Fertility in Petersburg
Fertility by Age in Petersburg
Average fertility rate in Petersburg is 33.0 births per 1,000 women. Women in the age bracket of 20 to 34 years have the highest fertility rate with 62.0 births per 1,000 women. Women in the age bracket of 20 to 34 years acount for 76.2% of all women with births.
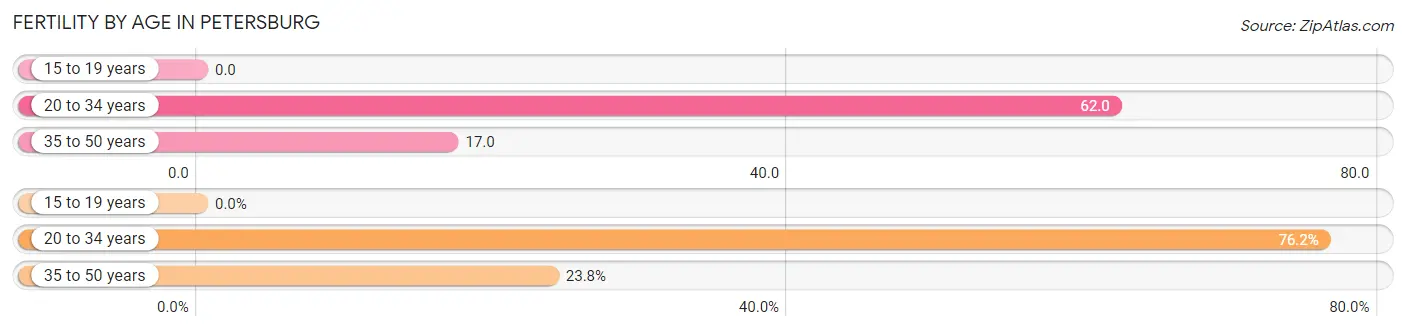
| Age Bracket | Women with Births | Births / 1,000 Women |
| 15 to 19 years | 0 (0.0%) | 0.0 |
| 20 to 34 years | 16 (76.2%) | 62.0 |
| 35 to 50 years | 5 (23.8%) | 17.0 |
| Total | 21 (100.0%) | 33.0 |
Fertility by Age by Marriage Status in Petersburg
76.2% of women with births (21) in Petersburg are married. The highest percentage of unmarried women with births falls into 20 to 34 years age bracket with 31.2% of them unmarried at the time of birth, while the lowest percentage of unmarried women with births belong to 35 to 50 years age bracket with 0.0% of them unmarried.
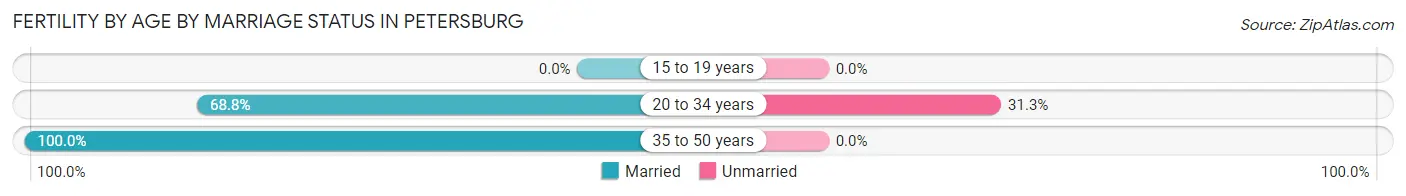
| Age Bracket | Married | Unmarried |
| 15 to 19 years | 0 (0.0%) | 0 (0.0%) |
| 20 to 34 years | 11 (68.8%) | 5 (31.2%) |
| 35 to 50 years | 5 (100.0%) | 0 (0.0%) |
| Total | 16 (76.2%) | 5 (23.8%) |
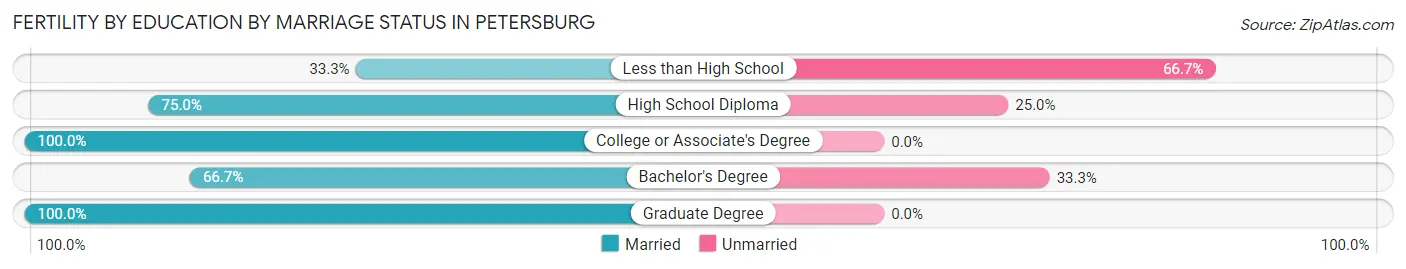
Fertility by Education in Petersburg
Average fertility rate in Petersburg is 33.0 births per 1,000 women. Women with the education attainment of graduate degree have the highest fertility rate of 89.0 births per 1,000 women, while women with the education attainment of college or associate's degree have the lowest fertility at 10.0 births per 1,000 women. Women with the education attainment of high school diploma represent 38.1% of all women with births.
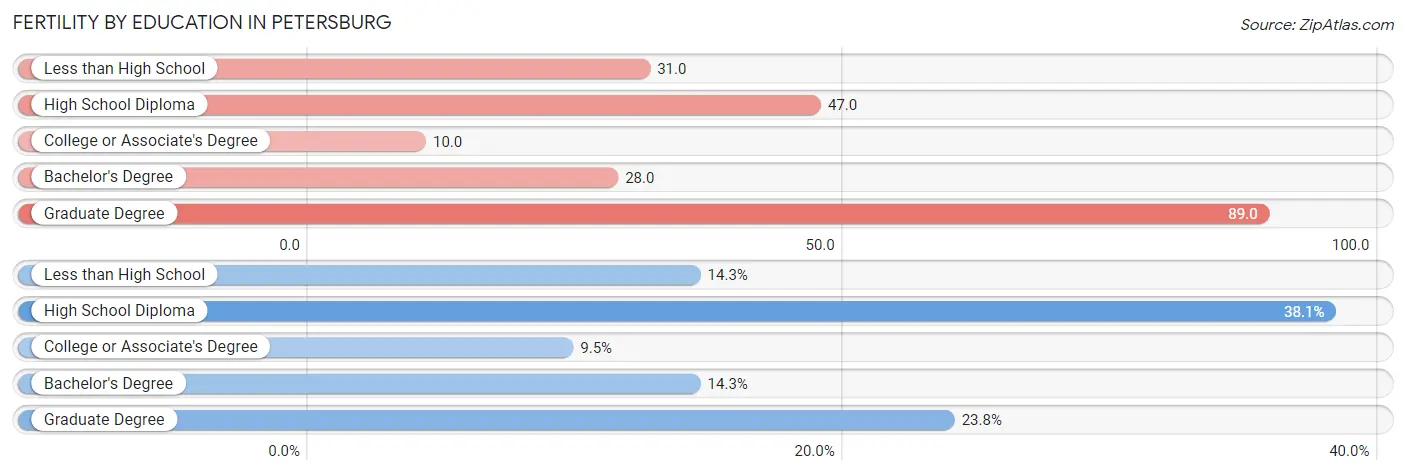
| Educational Attainment | Women with Births | Births / 1,000 Women |
| Less than High School | 3 (14.3%) | 31.0 |
| High School Diploma | 8 (38.1%) | 47.0 |
| College or Associate's Degree | 2 (9.5%) | 10.0 |
| Bachelor's Degree | 3 (14.3%) | 28.0 |
| Graduate Degree | 5 (23.8%) | 89.0 |
| Total | 21 (100.0%) | 33.0 |
Fertility by Education by Marriage Status in Petersburg
23.8% of women with births in Petersburg are unmarried. Women with the educational attainment of college or associate's degree are most likely to be married with 100.0% of them married at childbirth, while women with the educational attainment of less than high school are least likely to be married with 66.7% of them unmarried at childbirth.
| Educational Attainment | Married | Unmarried |
| Less than High School | 1 (33.3%) | 2 (66.7%) |
| High School Diploma | 6 (75.0%) | 2 (25.0%) |
| College or Associate's Degree | 2 (100.0%) | 0 (0.0%) |
| Bachelor's Degree | 2 (66.7%) | 1 (33.3%) |
| Graduate Degree | 5 (100.0%) | 0 (0.0%) |
| Total | 16 (76.2%) | 5 (23.8%) |
Employment Characteristics in Petersburg
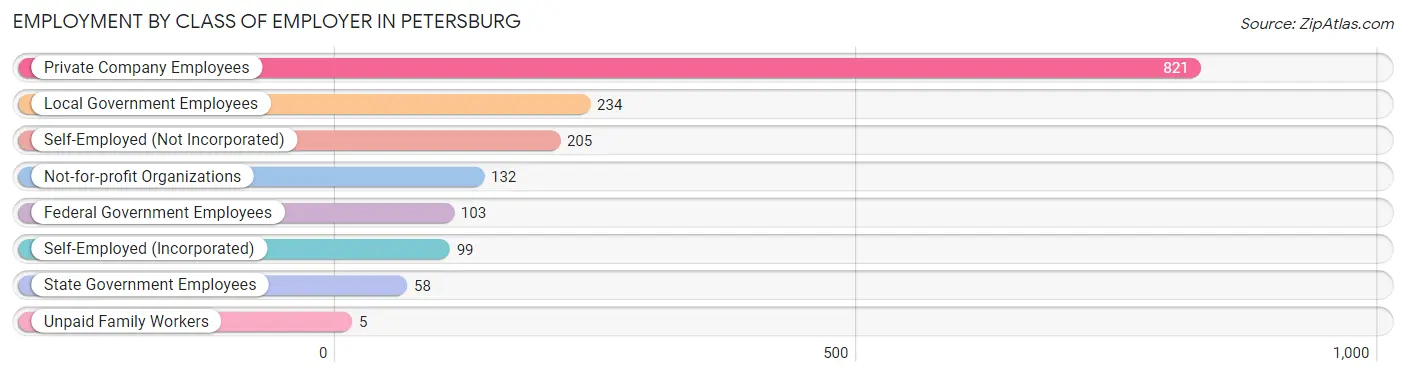
Employment by Class of Employer in Petersburg
Among the 1,657 employed individuals in Petersburg, private company employees (821 | 49.5%), local government employees (234 | 14.1%), and self-employed (not incorporated) (205 | 12.4%) make up the most common classes of employment.
| Employer Class | # Employees | % Employees |
| Private Company Employees | 821 | 49.5% |
| Self-Employed (Incorporated) | 99 | 6.0% |
| Self-Employed (Not Incorporated) | 205 | 12.4% |
| Not-for-profit Organizations | 132 | 8.0% |
| Local Government Employees | 234 | 14.1% |
| State Government Employees | 58 | 3.5% |
| Federal Government Employees | 103 | 6.2% |
| Unpaid Family Workers | 5 | 0.3% |
| Total | 1,657 | 100.0% |
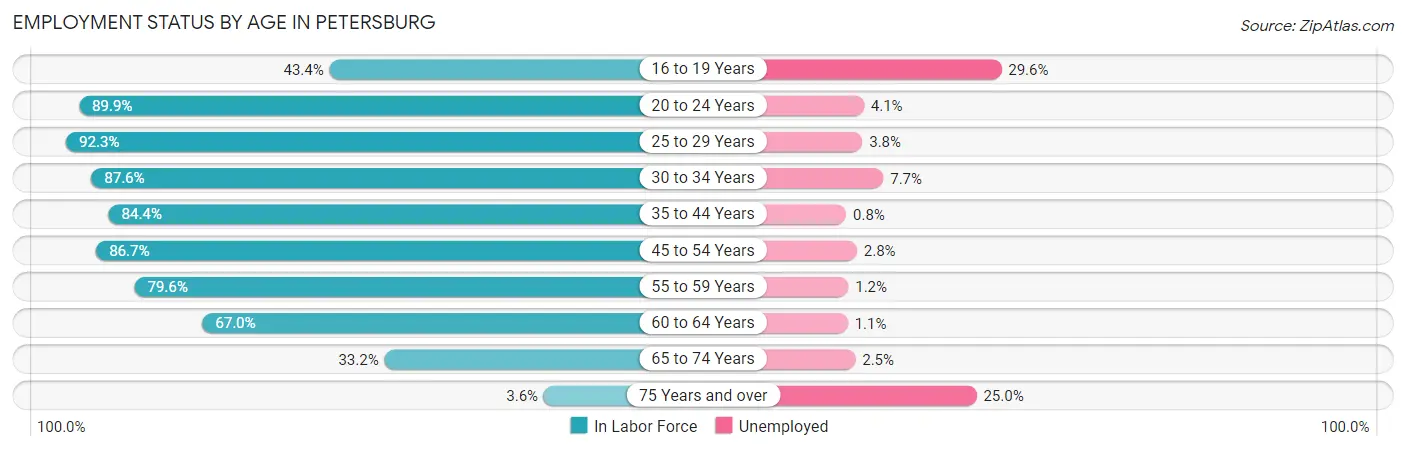
Employment Status by Age in Petersburg
According to the labor force statistics for Petersburg, out of the total population over 16 years of age (2,788), 62.7% or 1,748 individuals are in the labor force, with 3.7% or 65 of them unemployed. The age group with the highest labor force participation rate is 25 to 29 years, with 92.3% or 131 individuals in the labor force. Within the labor force, the 16 to 19 years age range has the highest percentage of unemployed individuals, with 29.6% or 17 of them being unemployed.
| Age Bracket | In Labor Force | Unemployed |
| 16 to 19 Years | 59 (43.4%) | 17 (29.6%) |
| 20 to 24 Years | 142 (89.9%) | 6 (4.1%) |
| 25 to 29 Years | 131 (92.3%) | 5 (3.8%) |
| 30 to 34 Years | 184 (87.6%) | 14 (7.7%) |
| 35 to 44 Years | 255 (84.4%) | 2 (0.8%) |
| 45 to 54 Years | 281 (86.7%) | 8 (2.8%) |
| 55 to 59 Years | 343 (79.6%) | 4 (1.2%) |
| 60 to 64 Years | 177 (67.0%) | 2 (1.1%) |
| 65 to 74 Years | 163 (33.2%) | 4 (2.5%) |
| 75 Years and over | 12 (3.6%) | 3 (25.0%) |
| Total | 1,748 (62.7%) | 65 (3.7%) |
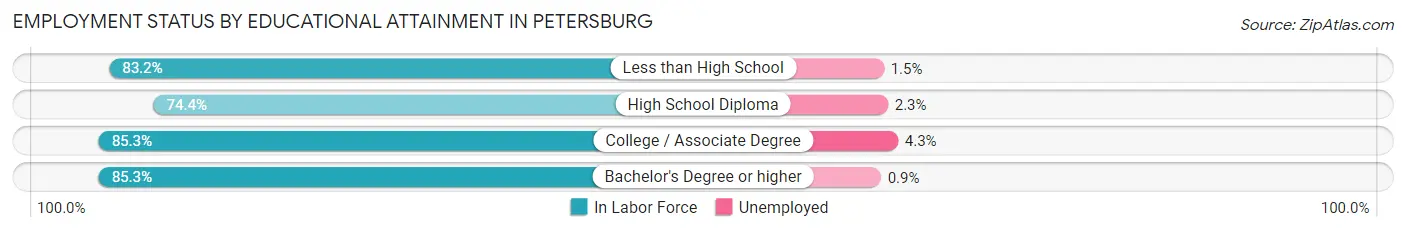
Employment Status by Educational Attainment in Petersburg
According to labor force statistics for Petersburg, 81.9% of individuals (1,370) out of the total population between 25 and 64 years of age (1,673) are in the labor force, with 2.6% or 36 of them being unemployed. The group with the highest labor force participation rate are those with the educational attainment of college / associate degree, with 85.3% or 494 individuals in the labor force. Within the labor force, individuals with college / associate degree education have the highest percentage of unemployment, with 4.3% or 21 of them being unemployed.
| Educational Attainment | In Labor Force | Unemployed |
| Less than High School | 198 (83.2%) | 4 (1.5%) |
| High School Diploma | 349 (74.4%) | 11 (2.3%) |
| College / Associate Degree | 494 (85.3%) | 25 (4.3%) |
| Bachelor's Degree or higher | 330 (85.3%) | 3 (0.9%) |
| Total | 1,370 (81.9%) | 43 (2.6%) |
Employment Occupations by Sex in Petersburg
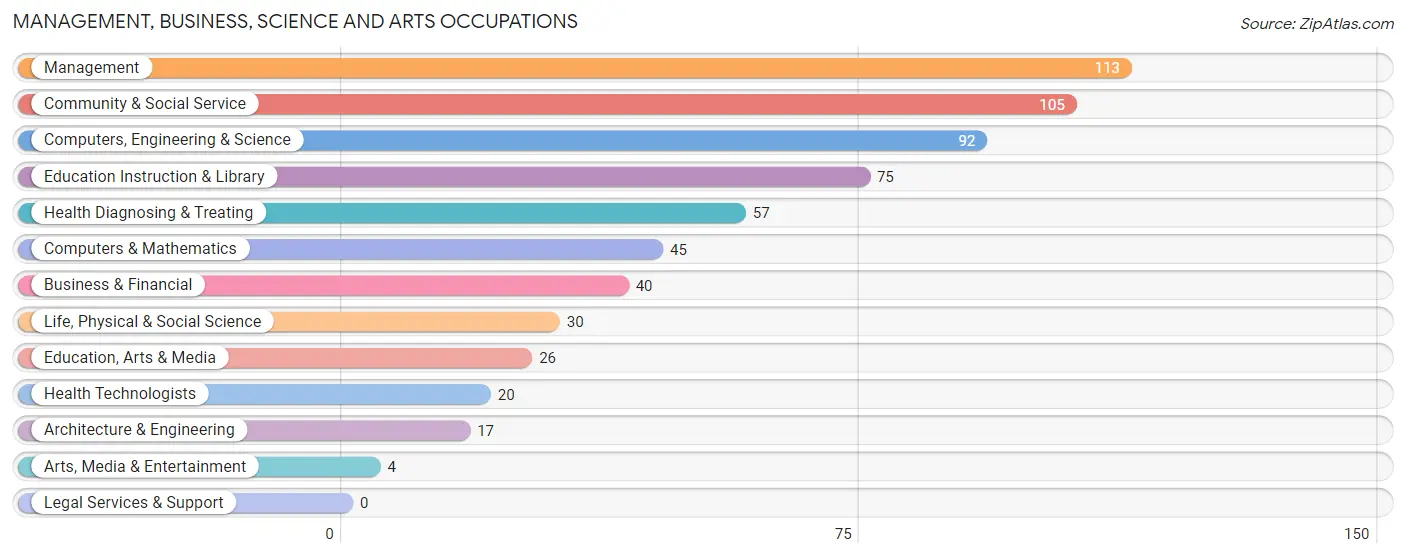
Management, Business, Science and Arts Occupations
The most common Management, Business, Science and Arts occupations in Petersburg are Management (113 | 6.8%), Community & Social Service (105 | 6.3%), Computers, Engineering & Science (92 | 5.6%), Education Instruction & Library (75 | 4.5%), and Health Diagnosing & Treating (57 | 3.4%).
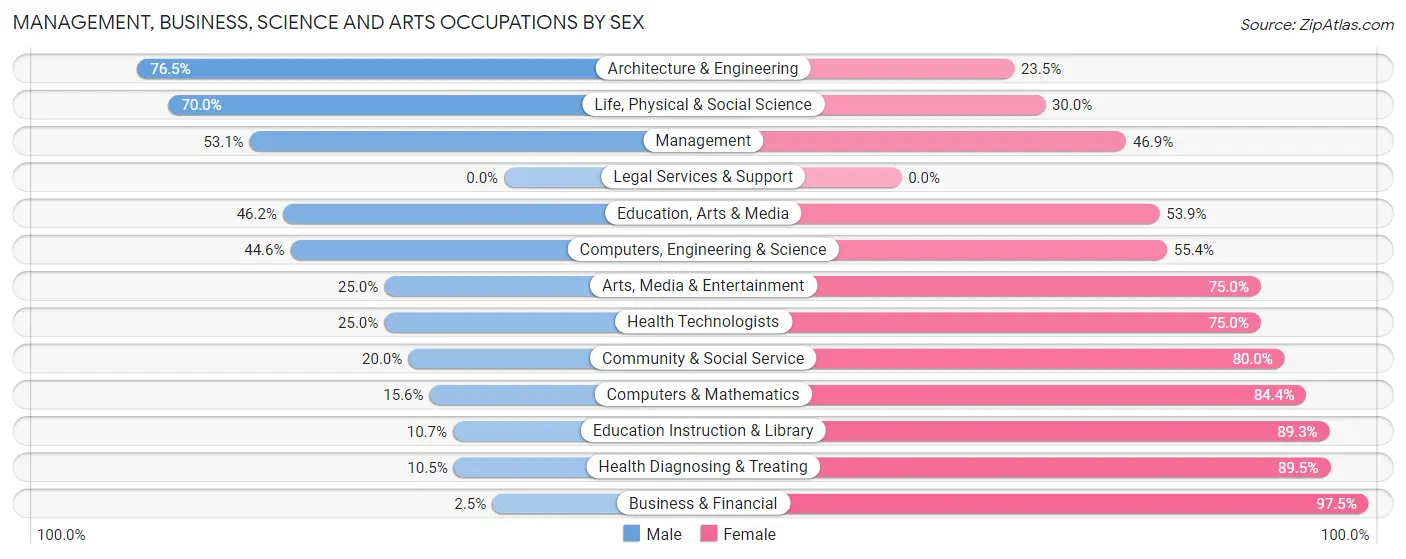
Management, Business, Science and Arts Occupations by Sex
Within the Management, Business, Science and Arts occupations in Petersburg, the most male-oriented occupations are Architecture & Engineering (76.5%), Life, Physical & Social Science (70.0%), and Management (53.1%), while the most female-oriented occupations are Business & Financial (97.5%), Health Diagnosing & Treating (89.5%), and Education Instruction & Library (89.3%).
| Occupation | Male | Female |
| Management | 60 (53.1%) | 53 (46.9%) |
| Business & Financial | 1 (2.5%) | 39 (97.5%) |
| Computers, Engineering & Science | 41 (44.6%) | 51 (55.4%) |
| Computers & Mathematics | 7 (15.6%) | 38 (84.4%) |
| Architecture & Engineering | 13 (76.5%) | 4 (23.5%) |
| Life, Physical & Social Science | 21 (70.0%) | 9 (30.0%) |
| Community & Social Service | 21 (20.0%) | 84 (80.0%) |
| Education, Arts & Media | 12 (46.2%) | 14 (53.8%) |
| Legal Services & Support | 0 (0.0%) | 0 (0.0%) |
| Education Instruction & Library | 8 (10.7%) | 67 (89.3%) |
| Arts, Media & Entertainment | 1 (25.0%) | 3 (75.0%) |
| Health Diagnosing & Treating | 6 (10.5%) | 51 (89.5%) |
| Health Technologists | 5 (25.0%) | 15 (75.0%) |
| Total (Category) | 129 (31.7%) | 278 (68.3%) |
| Total (Overall) | 832 (50.2%) | 825 (49.8%) |
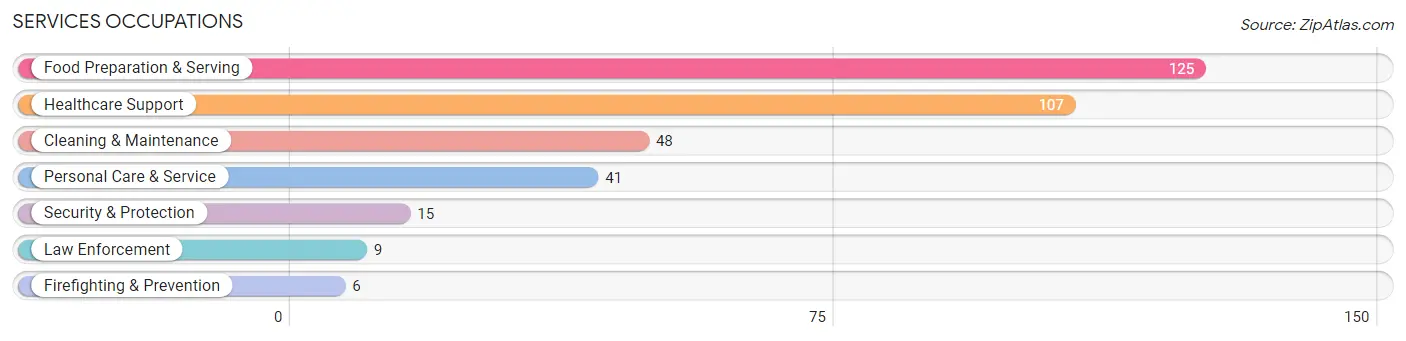
Services Occupations
The most common Services occupations in Petersburg are Food Preparation & Serving (125 | 7.5%), Healthcare Support (107 | 6.5%), Cleaning & Maintenance (48 | 2.9%), Personal Care & Service (41 | 2.5%), and Security & Protection (15 | 0.9%).
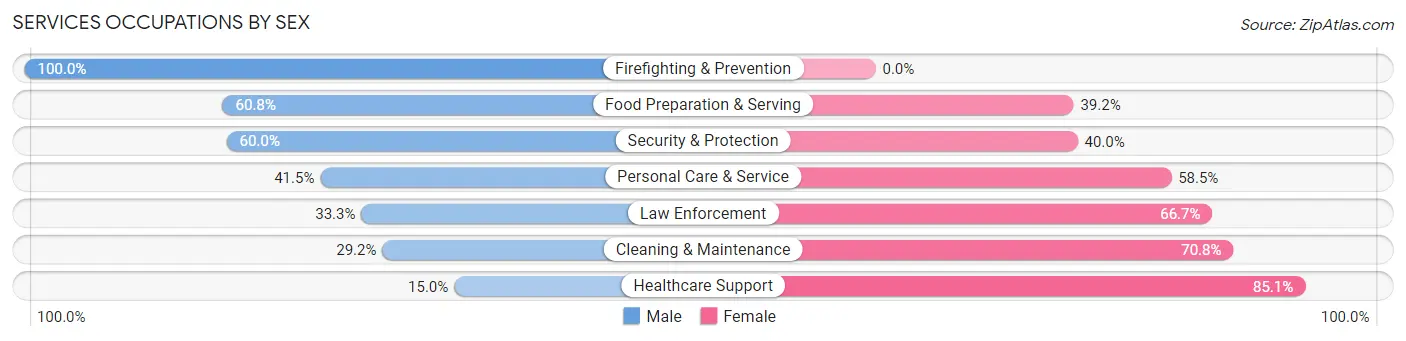
Services Occupations by Sex
Within the Services occupations in Petersburg, the most male-oriented occupations are Firefighting & Prevention (100.0%), Food Preparation & Serving (60.8%), and Security & Protection (60.0%), while the most female-oriented occupations are Healthcare Support (85.1%), Cleaning & Maintenance (70.8%), and Law Enforcement (66.7%).
| Occupation | Male | Female |
| Healthcare Support | 16 (14.9%) | 91 (85.1%) |
| Security & Protection | 9 (60.0%) | 6 (40.0%) |
| Firefighting & Prevention | 6 (100.0%) | 0 (0.0%) |
| Law Enforcement | 3 (33.3%) | 6 (66.7%) |
| Food Preparation & Serving | 76 (60.8%) | 49 (39.2%) |
| Cleaning & Maintenance | 14 (29.2%) | 34 (70.8%) |
| Personal Care & Service | 17 (41.5%) | 24 (58.5%) |
| Total (Category) | 132 (39.3%) | 204 (60.7%) |
| Total (Overall) | 832 (50.2%) | 825 (49.8%) |
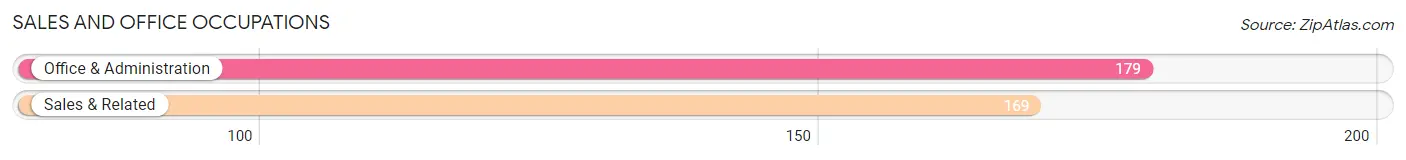
Sales and Office Occupations
The most common Sales and Office occupations in Petersburg are Office & Administration (179 | 10.8%), and Sales & Related (169 | 10.2%).
Sales and Office Occupations by Sex
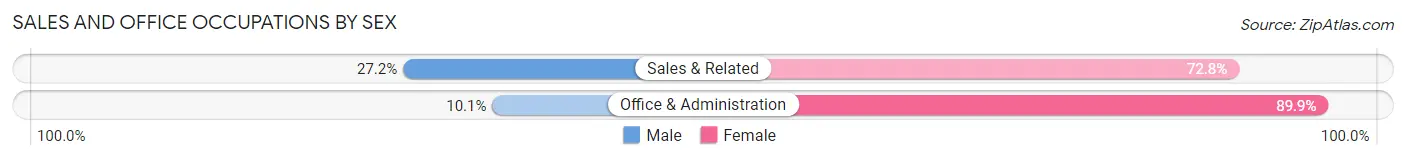
| Occupation | Male | Female |
| Sales & Related | 46 (27.2%) | 123 (72.8%) |
| Office & Administration | 18 (10.1%) | 161 (89.9%) |
| Total (Category) | 64 (18.4%) | 284 (81.6%) |
| Total (Overall) | 832 (50.2%) | 825 (49.8%) |
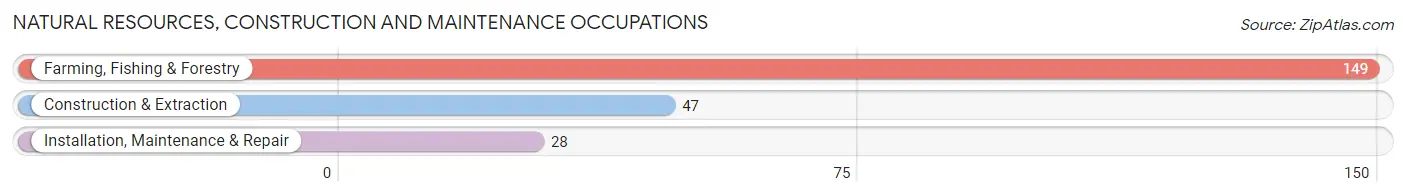
Natural Resources, Construction and Maintenance Occupations
The most common Natural Resources, Construction and Maintenance occupations in Petersburg are Farming, Fishing & Forestry (149 | 9.0%), Construction & Extraction (47 | 2.8%), and Installation, Maintenance & Repair (28 | 1.7%).
Natural Resources, Construction and Maintenance Occupations by Sex
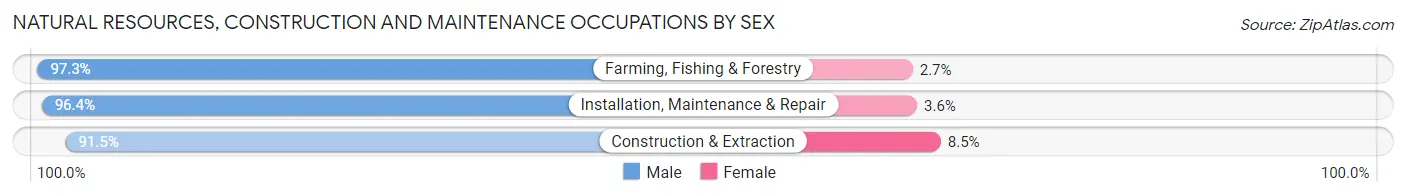
| Occupation | Male | Female |
| Farming, Fishing & Forestry | 145 (97.3%) | 4 (2.7%) |
| Construction & Extraction | 43 (91.5%) | 4 (8.5%) |
| Installation, Maintenance & Repair | 27 (96.4%) | 1 (3.6%) |
| Total (Category) | 215 (96.0%) | 9 (4.0%) |
| Total (Overall) | 832 (50.2%) | 825 (49.8%) |
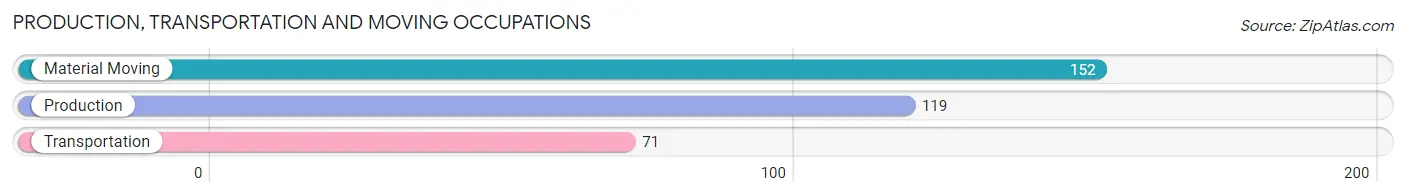
Production, Transportation and Moving Occupations
The most common Production, Transportation and Moving occupations in Petersburg are Material Moving (152 | 9.2%), Production (119 | 7.2%), and Transportation (71 | 4.3%).
Production, Transportation and Moving Occupations by Sex
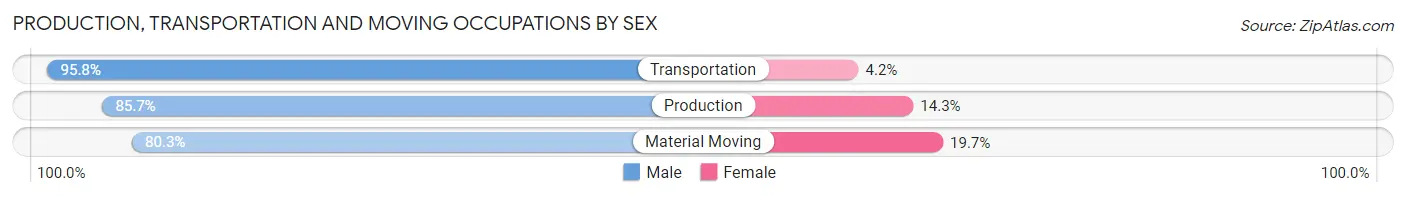
| Occupation | Male | Female |
| Production | 102 (85.7%) | 17 (14.3%) |
| Transportation | 68 (95.8%) | 3 (4.2%) |
| Material Moving | 122 (80.3%) | 30 (19.7%) |
| Total (Category) | 292 (85.4%) | 50 (14.6%) |
| Total (Overall) | 832 (50.2%) | 825 (49.8%) |
Employment Industries by Sex in Petersburg
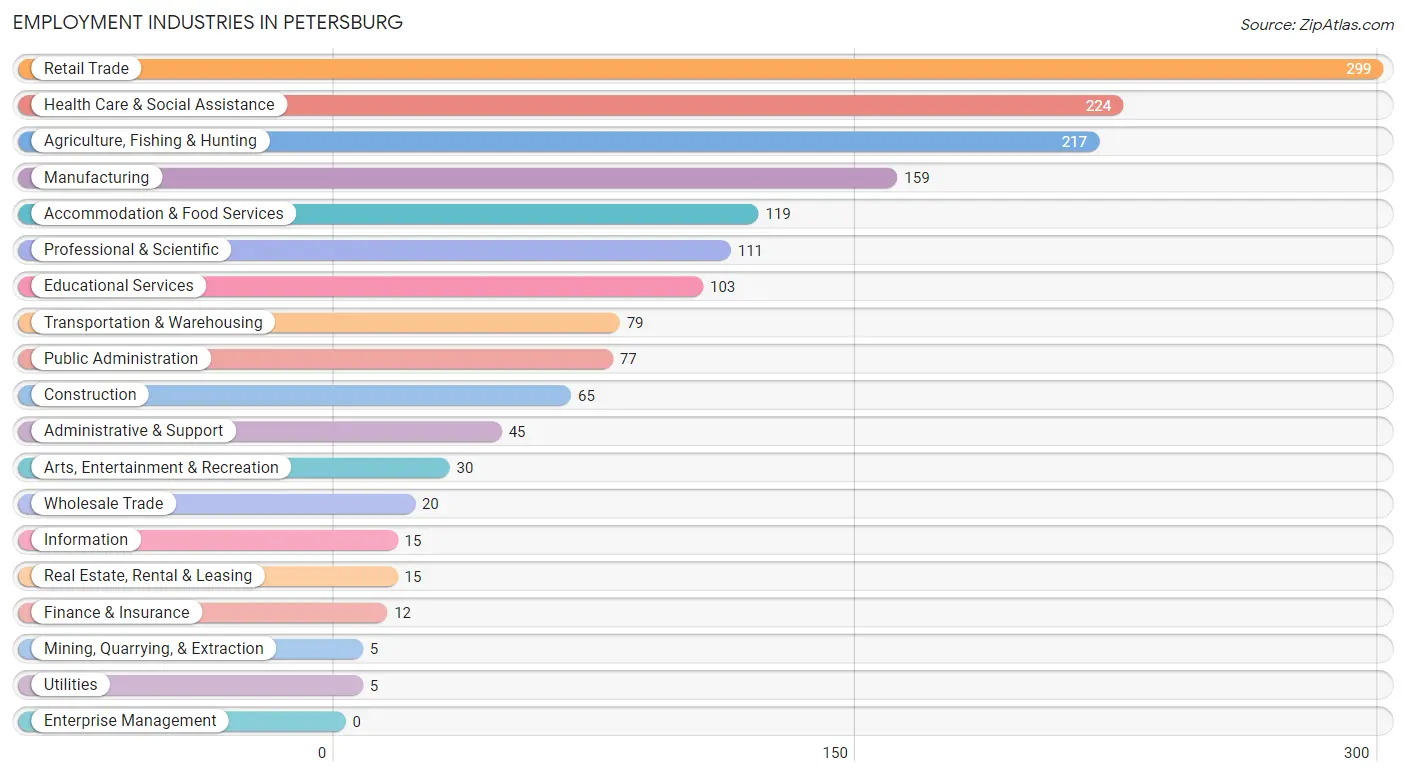
Employment Industries in Petersburg
The major employment industries in Petersburg include Retail Trade (299 | 18.0%), Health Care & Social Assistance (224 | 13.5%), Agriculture, Fishing & Hunting (217 | 13.1%), Manufacturing (159 | 9.6%), and Accommodation & Food Services (119 | 7.2%).
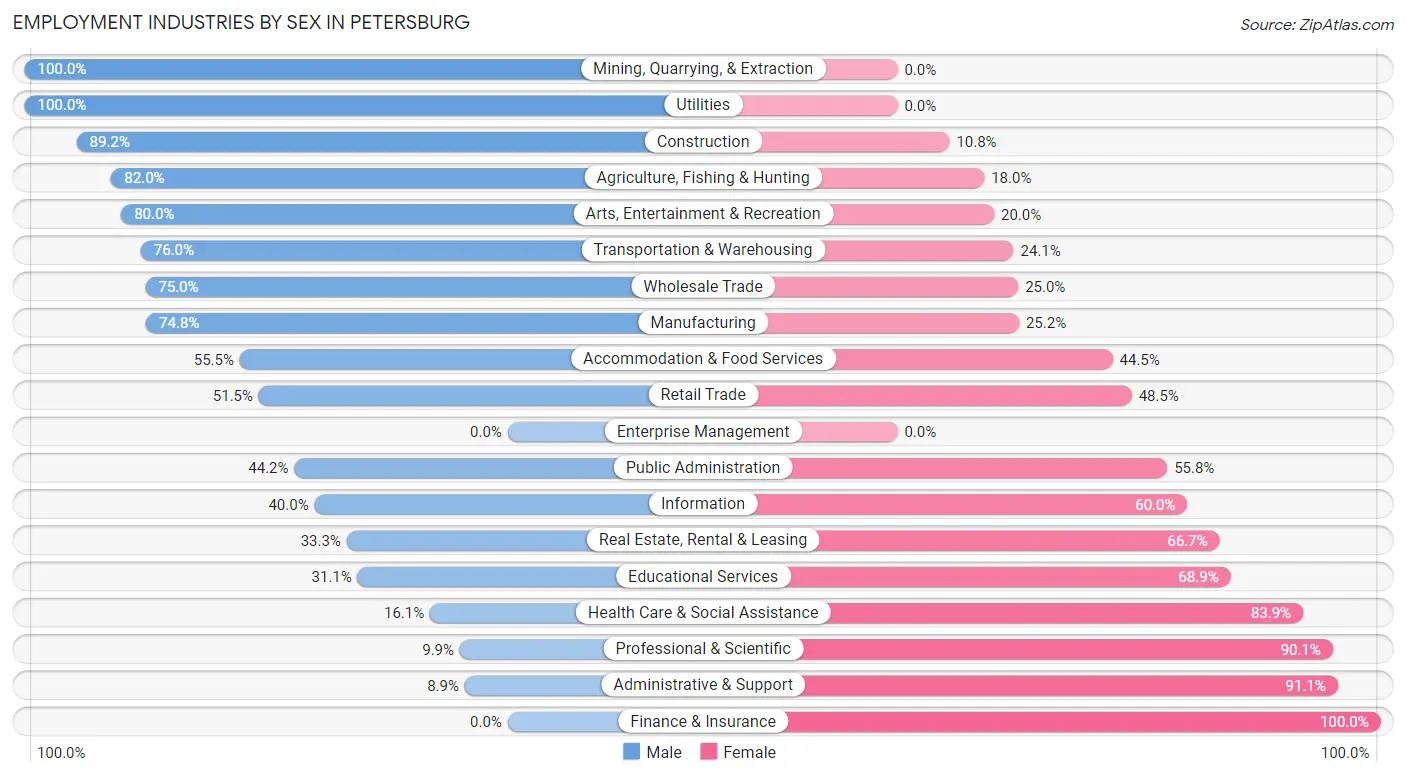
Employment Industries by Sex in Petersburg
The Petersburg industries that see more men than women are Mining, Quarrying, & Extraction (100.0%), Utilities (100.0%), and Construction (89.2%), whereas the industries that tend to have a higher number of women are Finance & Insurance (100.0%), Administrative & Support (91.1%), and Professional & Scientific (90.1%).
| Industry | Male | Female |
| Agriculture, Fishing & Hunting | 178 (82.0%) | 39 (18.0%) |
| Mining, Quarrying, & Extraction | 5 (100.0%) | 0 (0.0%) |
| Construction | 58 (89.2%) | 7 (10.8%) |
| Manufacturing | 119 (74.8%) | 40 (25.2%) |
| Wholesale Trade | 15 (75.0%) | 5 (25.0%) |
| Retail Trade | 154 (51.5%) | 145 (48.5%) |
| Transportation & Warehousing | 60 (75.9%) | 19 (24.0%) |
| Utilities | 5 (100.0%) | 0 (0.0%) |
| Information | 6 (40.0%) | 9 (60.0%) |
| Finance & Insurance | 0 (0.0%) | 12 (100.0%) |
| Real Estate, Rental & Leasing | 5 (33.3%) | 10 (66.7%) |
| Professional & Scientific | 11 (9.9%) | 100 (90.1%) |
| Enterprise Management | 0 (0.0%) | 0 (0.0%) |
| Administrative & Support | 4 (8.9%) | 41 (91.1%) |
| Educational Services | 32 (31.1%) | 71 (68.9%) |
| Health Care & Social Assistance | 36 (16.1%) | 188 (83.9%) |
| Arts, Entertainment & Recreation | 24 (80.0%) | 6 (20.0%) |
| Accommodation & Food Services | 66 (55.5%) | 53 (44.5%) |
| Public Administration | 34 (44.2%) | 43 (55.8%) |
| Total | 832 (50.2%) | 825 (49.8%) |
Education in Petersburg
School Enrollment in Petersburg
The most common levels of schooling among the 569 students in Petersburg are high school (157 | 27.6%), middle school (136 | 23.9%), and elementary school (120 | 21.1%).
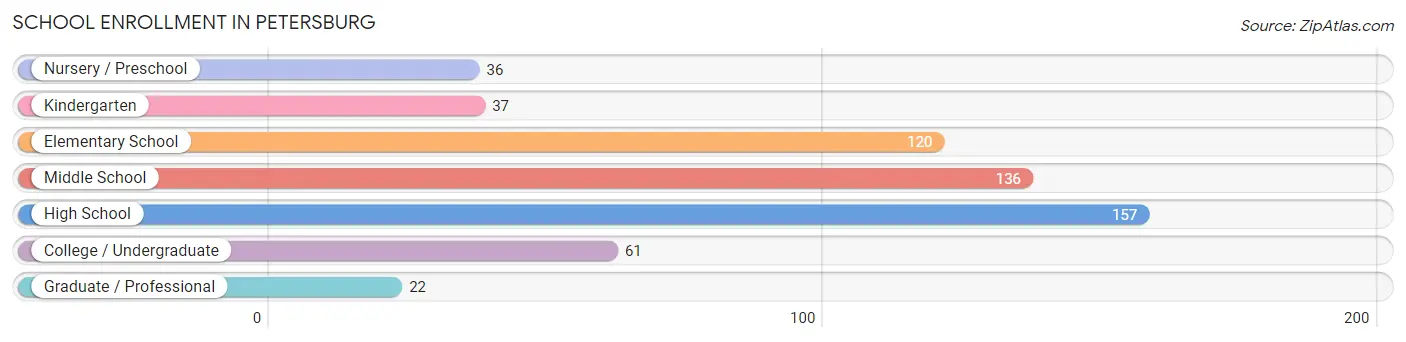
| School Level | # Students | % Students |
| Nursery / Preschool | 36 | 6.3% |
| Kindergarten | 37 | 6.5% |
| Elementary School | 120 | 21.1% |
| Middle School | 136 | 23.9% |
| High School | 157 | 27.6% |
| College / Undergraduate | 61 | 10.7% |
| Graduate / Professional | 22 | 3.9% |
| Total | 569 | 100.0% |
School Enrollment by Age by Funding Source in Petersburg
Out of a total of 569 students who are enrolled in schools in Petersburg, 69 (12.1%) attend a private institution, while the remaining 500 (87.9%) are enrolled in public schools. The age group of 3 to 4 year olds has the highest likelihood of being enrolled in private schools, with 20 (66.7% in the age bracket) enrolled. Conversely, the age group of 25 to 34 year olds has the lowest likelihood of being enrolled in a private school, with 9 (100.0% in the age bracket) attending a public institution.
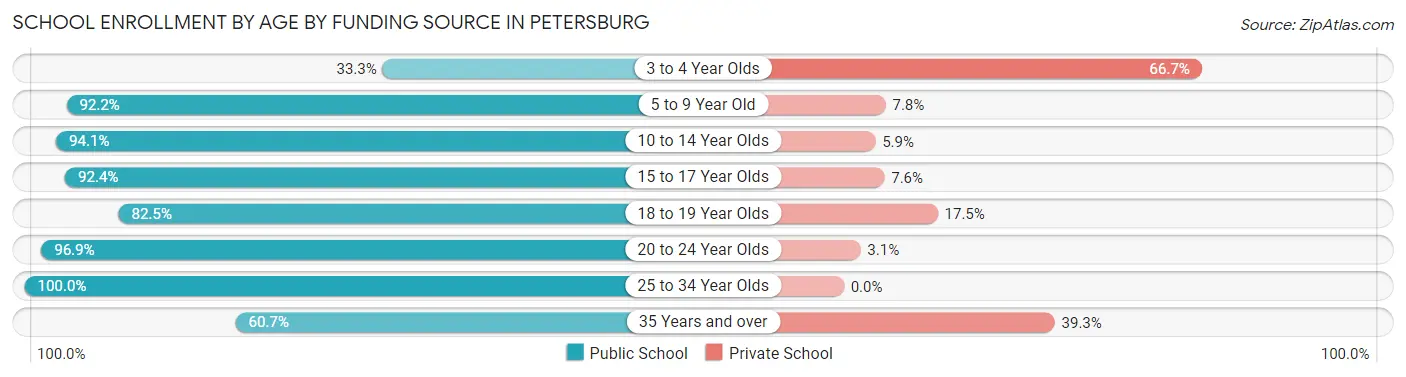
| Age Bracket | Public School | Private School |
| 3 to 4 Year Olds | 10 (33.3%) | 20 (66.7%) |
| 5 to 9 Year Old | 130 (92.2%) | 11 (7.8%) |
| 10 to 14 Year Olds | 160 (94.1%) | 10 (5.9%) |
| 15 to 17 Year Olds | 110 (92.4%) | 9 (7.6%) |
| 18 to 19 Year Olds | 33 (82.5%) | 7 (17.5%) |
| 20 to 24 Year Olds | 31 (96.9%) | 1 (3.1%) |
| 25 to 34 Year Olds | 9 (100.0%) | 0 (0.0%) |
| 35 Years and over | 17 (60.7%) | 11 (39.3%) |
| Total | 500 (87.9%) | 69 (12.1%) |
Educational Attainment by Field of Study in Petersburg
Education (137 | 21.0%), bio, nature & agricultural (131 | 20.1%), business (85 | 13.0%), science & technology (76 | 11.7%), and social sciences (54 | 8.3%) are the most common fields of study among 652 individuals in Petersburg who have obtained a bachelor's degree or higher.
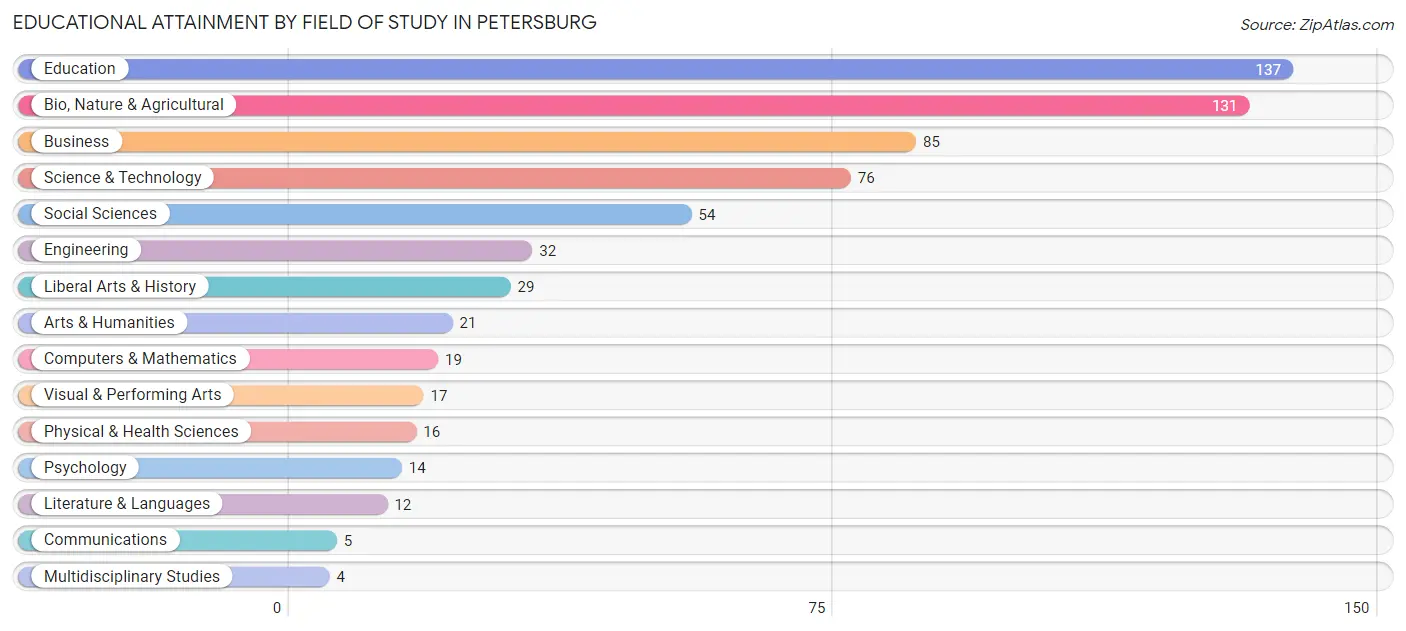
| Field of Study | # Graduates | % Graduates |
| Computers & Mathematics | 19 | 2.9% |
| Bio, Nature & Agricultural | 131 | 20.1% |
| Physical & Health Sciences | 16 | 2.5% |
| Psychology | 14 | 2.1% |
| Social Sciences | 54 | 8.3% |
| Engineering | 32 | 4.9% |
| Multidisciplinary Studies | 4 | 0.6% |
| Science & Technology | 76 | 11.7% |
| Business | 85 | 13.0% |
| Education | 137 | 21.0% |
| Literature & Languages | 12 | 1.8% |
| Liberal Arts & History | 29 | 4.4% |
| Visual & Performing Arts | 17 | 2.6% |
| Communications | 5 | 0.8% |
| Arts & Humanities | 21 | 3.2% |
| Total | 652 | 100.0% |
Transportation & Commute in Petersburg
Vehicle Availability by Sex in Petersburg
The most prevalent vehicle ownership categories in Petersburg are males with 2 vehicles (267, accounting for 34.9%) and females with 2 vehicles (379, making up 34.1%).
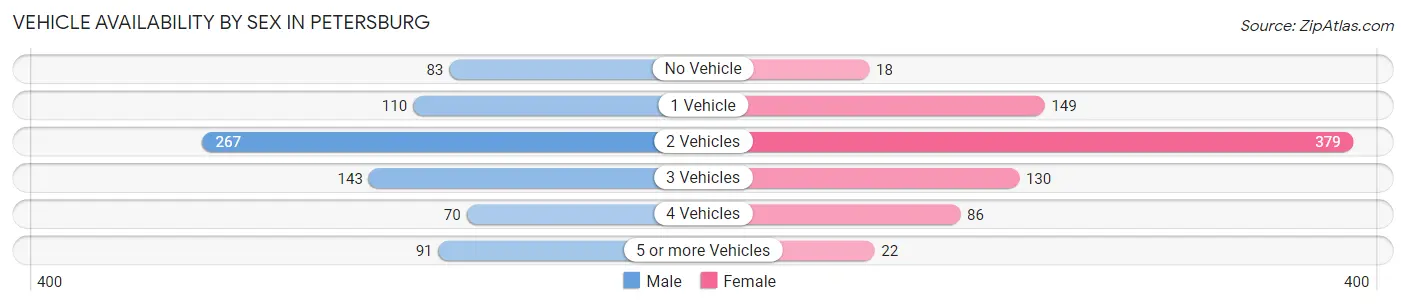
| Vehicles Available | Male | Female |
| No Vehicle | 83 (10.9%) | 18 (2.3%) |
| 1 Vehicle | 110 (14.4%) | 149 (19.0%) |
| 2 Vehicles | 267 (34.9%) | 379 (48.3%) |
| 3 Vehicles | 143 (18.7%) | 130 (16.6%) |
| 4 Vehicles | 70 (9.2%) | 86 (11.0%) |
| 5 or more Vehicles | 91 (11.9%) | 22 (2.8%) |
| Total | 764 (100.0%) | 784 (100.0%) |
Commute Time in Petersburg
The most frequently occuring commute durations in Petersburg are 5 to 9 minutes (685 commuters, 43.9%), less than 5 minutes (536 commuters, 34.4%), and 10 to 14 minutes (187 commuters, 12.0%).
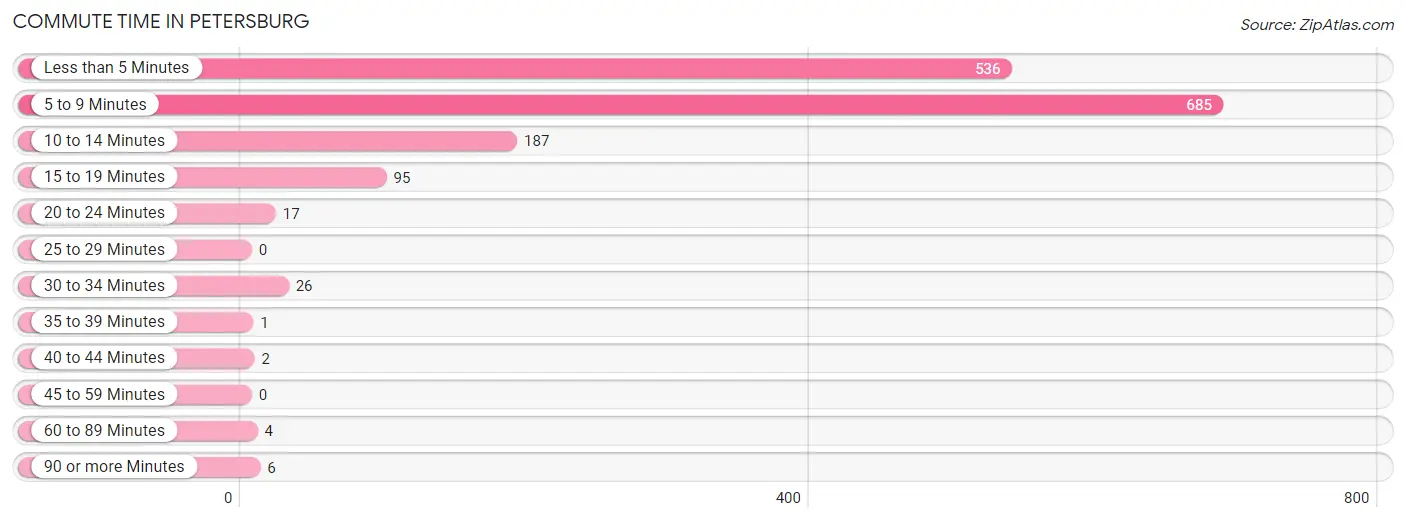
| Commute Time | # Commuters | % Commuters |
| Less than 5 Minutes | 536 | 34.4% |
| 5 to 9 Minutes | 685 | 43.9% |
| 10 to 14 Minutes | 187 | 12.0% |
| 15 to 19 Minutes | 95 | 6.1% |
| 20 to 24 Minutes | 17 | 1.1% |
| 25 to 29 Minutes | 0 | 0.0% |
| 30 to 34 Minutes | 26 | 1.7% |
| 35 to 39 Minutes | 1 | 0.1% |
| 40 to 44 Minutes | 2 | 0.1% |
| 45 to 59 Minutes | 0 | 0.0% |
| 60 to 89 Minutes | 4 | 0.3% |
| 90 or more Minutes | 6 | 0.4% |
Commute Time by Sex in Petersburg
The most common commute times in Petersburg are 5 to 9 minutes (344 commuters, 41.7%) for males and 5 to 9 minutes (341 commuters, 46.4%) for females.
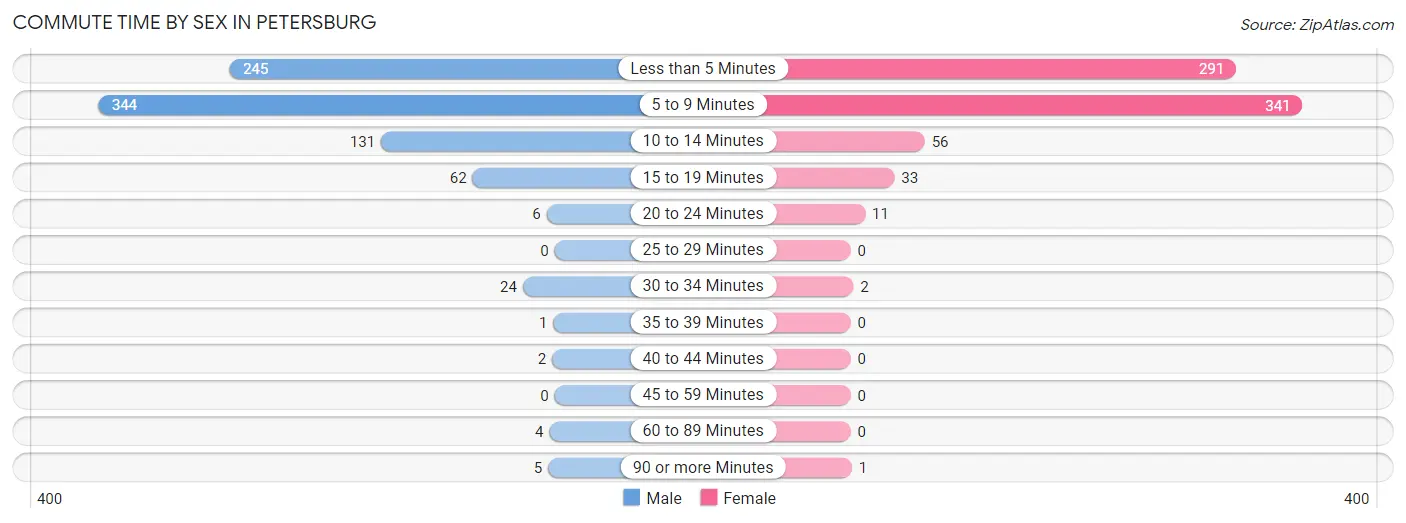
| Commute Time | Male | Female |
| Less than 5 Minutes | 245 (29.7%) | 291 (39.6%) |
| 5 to 9 Minutes | 344 (41.7%) | 341 (46.4%) |
| 10 to 14 Minutes | 131 (15.9%) | 56 (7.6%) |
| 15 to 19 Minutes | 62 (7.5%) | 33 (4.5%) |
| 20 to 24 Minutes | 6 (0.7%) | 11 (1.5%) |
| 25 to 29 Minutes | 0 (0.0%) | 0 (0.0%) |
| 30 to 34 Minutes | 24 (2.9%) | 2 (0.3%) |
| 35 to 39 Minutes | 1 (0.1%) | 0 (0.0%) |
| 40 to 44 Minutes | 2 (0.2%) | 0 (0.0%) |
| 45 to 59 Minutes | 0 (0.0%) | 0 (0.0%) |
| 60 to 89 Minutes | 4 (0.5%) | 0 (0.0%) |
| 90 or more Minutes | 5 (0.6%) | 1 (0.1%) |
Time of Departure to Work by Sex in Petersburg
The most frequent times of departure to work in Petersburg are 7:30 AM to 7:59 AM (137, 16.6%) for males and 7:30 AM to 7:59 AM (243, 33.1%) for females.
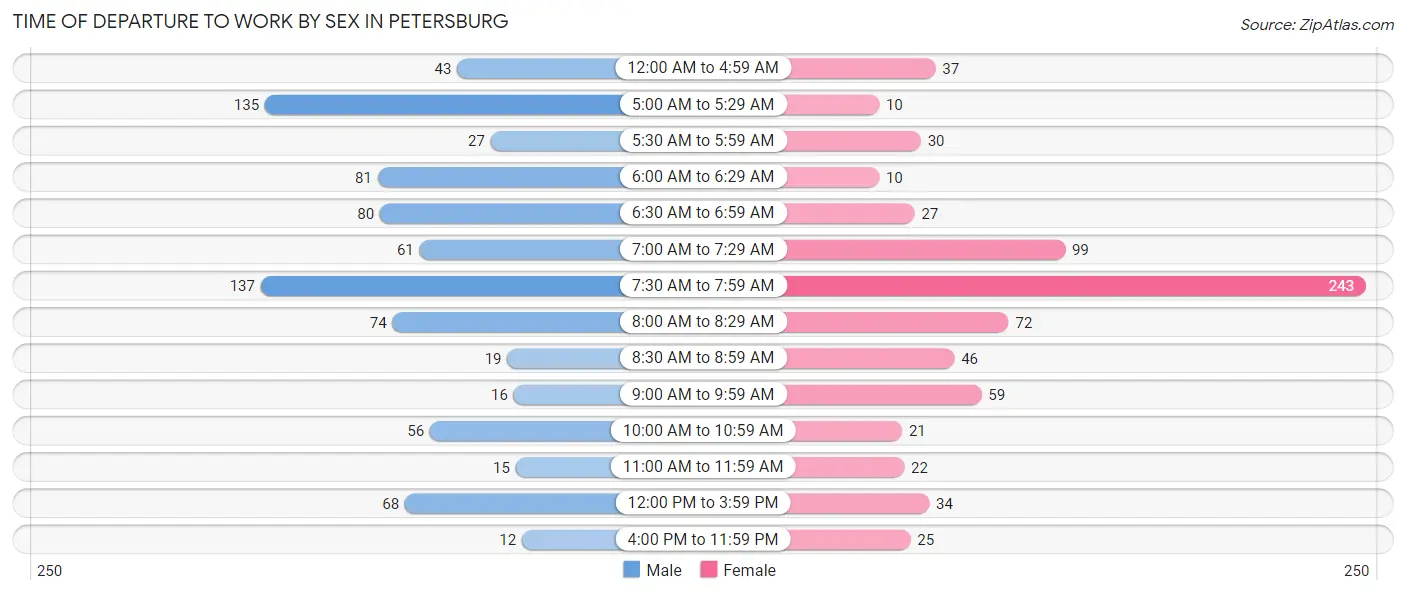
| Time of Departure | Male | Female |
| 12:00 AM to 4:59 AM | 43 (5.2%) | 37 (5.0%) |
| 5:00 AM to 5:29 AM | 135 (16.4%) | 10 (1.4%) |
| 5:30 AM to 5:59 AM | 27 (3.3%) | 30 (4.1%) |
| 6:00 AM to 6:29 AM | 81 (9.8%) | 10 (1.4%) |
| 6:30 AM to 6:59 AM | 80 (9.7%) | 27 (3.7%) |
| 7:00 AM to 7:29 AM | 61 (7.4%) | 99 (13.5%) |
| 7:30 AM to 7:59 AM | 137 (16.6%) | 243 (33.1%) |
| 8:00 AM to 8:29 AM | 74 (9.0%) | 72 (9.8%) |
| 8:30 AM to 8:59 AM | 19 (2.3%) | 46 (6.3%) |
| 9:00 AM to 9:59 AM | 16 (1.9%) | 59 (8.0%) |
| 10:00 AM to 10:59 AM | 56 (6.8%) | 21 (2.9%) |
| 11:00 AM to 11:59 AM | 15 (1.8%) | 22 (3.0%) |
| 12:00 PM to 3:59 PM | 68 (8.3%) | 34 (4.6%) |
| 4:00 PM to 11:59 PM | 12 (1.5%) | 25 (3.4%) |
| Total | 824 (100.0%) | 735 (100.0%) |
Housing Occupancy in Petersburg
Occupancy by Ownership in Petersburg
Of the total 1,225 dwellings in Petersburg, owner-occupied units account for 902 (73.6%), while renter-occupied units make up 323 (26.4%).
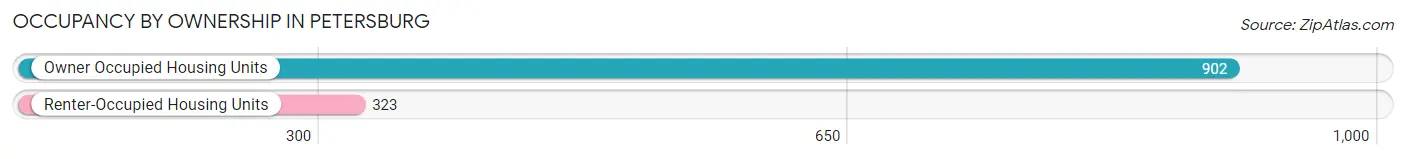
| Occupancy | # Housing Units | % Housing Units |
| Owner Occupied Housing Units | 902 | 73.6% |
| Renter-Occupied Housing Units | 323 | 26.4% |
| Total Occupied Housing Units | 1,225 | 100.0% |
Occupancy by Household Size in Petersburg
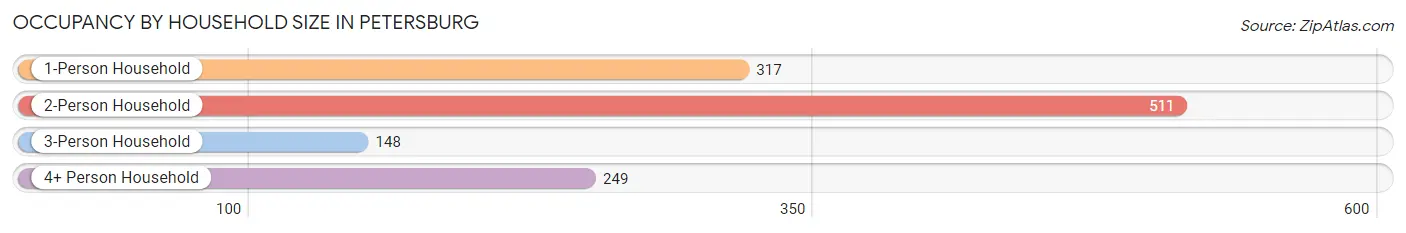
| Household Size | # Housing Units | % Housing Units |
| 1-Person Household | 317 | 25.9% |
| 2-Person Household | 511 | 41.7% |
| 3-Person Household | 148 | 12.1% |
| 4+ Person Household | 249 | 20.3% |
| Total Housing Units | 1,225 | 100.0% |
Occupancy by Ownership by Household Size in Petersburg
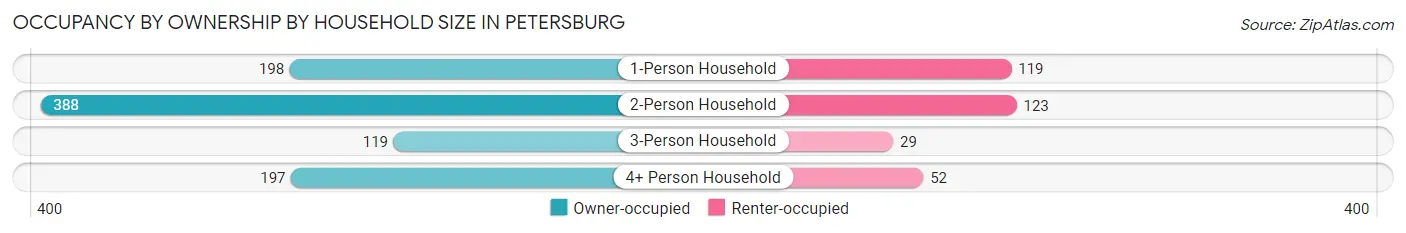
| Household Size | Owner-occupied | Renter-occupied |
| 1-Person Household | 198 (62.5%) | 119 (37.5%) |
| 2-Person Household | 388 (75.9%) | 123 (24.1%) |
| 3-Person Household | 119 (80.4%) | 29 (19.6%) |
| 4+ Person Household | 197 (79.1%) | 52 (20.9%) |
| Total Housing Units | 902 (73.6%) | 323 (26.4%) |
Occupancy by Educational Attainment in Petersburg
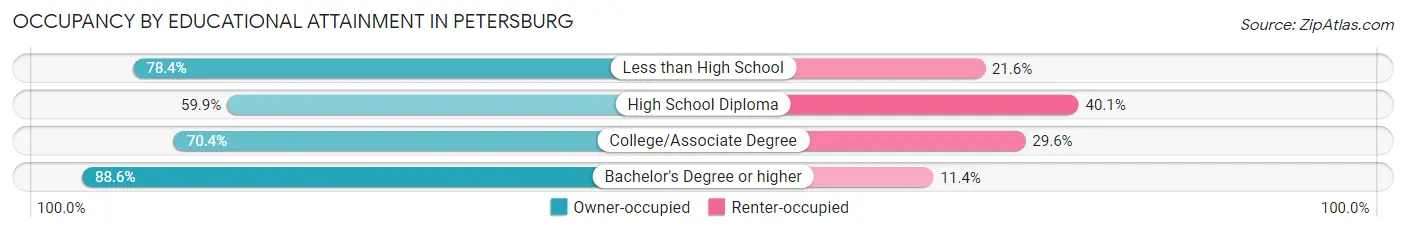
| Household Size | Owner-occupied | Renter-occupied |
| Less than High School | 80 (78.4%) | 22 (21.6%) |
| High School Diploma | 185 (59.9%) | 124 (40.1%) |
| College/Associate Degree | 326 (70.4%) | 137 (29.6%) |
| Bachelor's Degree or higher | 311 (88.6%) | 40 (11.4%) |
Occupancy by Age of Householder in Petersburg
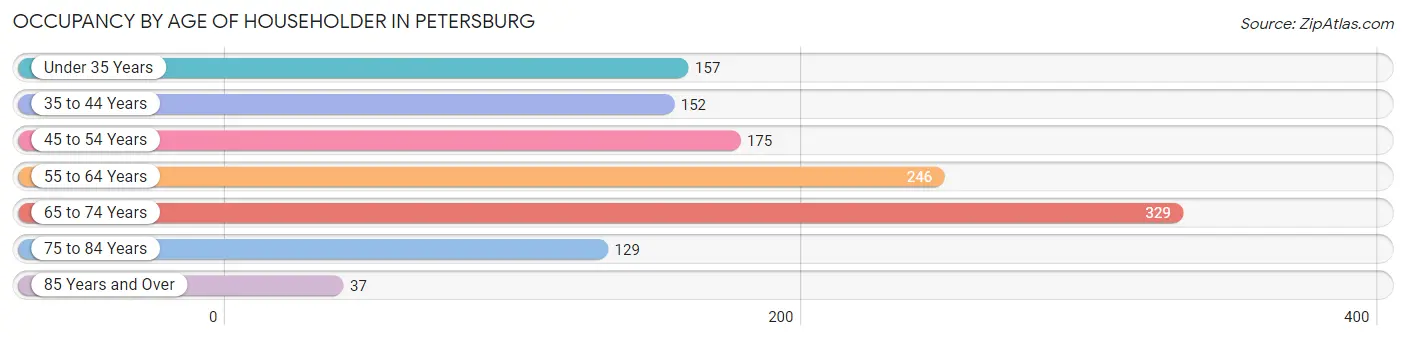
| Age Bracket | # Households | % Households |
| Under 35 Years | 157 | 12.8% |
| 35 to 44 Years | 152 | 12.4% |
| 45 to 54 Years | 175 | 14.3% |
| 55 to 64 Years | 246 | 20.1% |
| 65 to 74 Years | 329 | 26.9% |
| 75 to 84 Years | 129 | 10.5% |
| 85 Years and Over | 37 | 3.0% |
| Total | 1,225 | 100.0% |
Housing Finances in Petersburg
Median Income by Occupancy in Petersburg
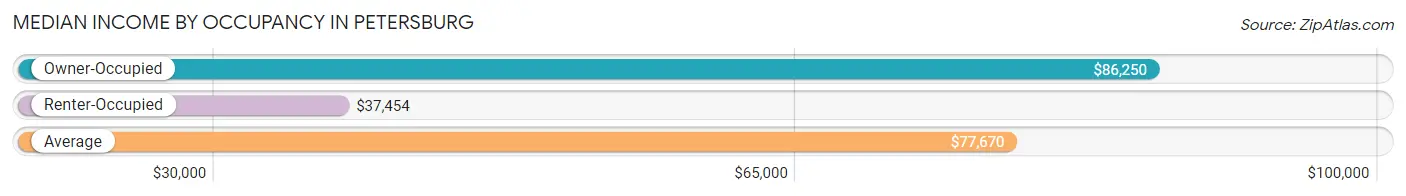
| Occupancy Type | # Households | Median Income |
| Owner-Occupied | 902 (73.6%) | $86,250 |
| Renter-Occupied | 323 (26.4%) | $37,454 |
| Average | 1,225 (100.0%) | $77,670 |
Occupancy by Householder Income Bracket in Petersburg
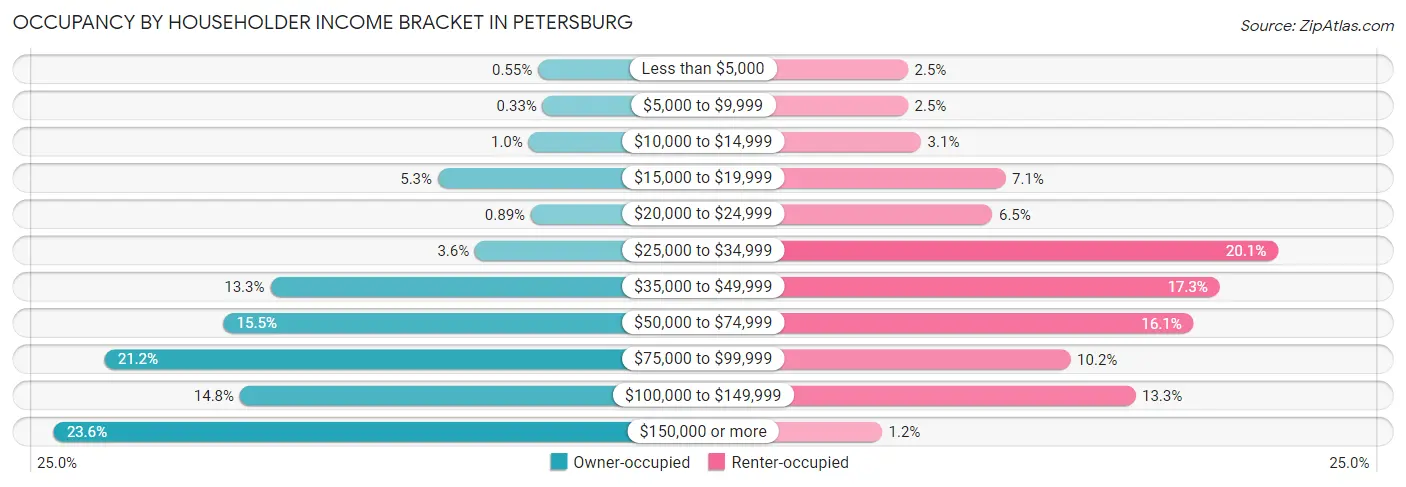
| Income Bracket | Owner-occupied | Renter-occupied |
| Less than $5,000 | 5 (0.5%) | 8 (2.5%) |
| $5,000 to $9,999 | 3 (0.3%) | 8 (2.5%) |
| $10,000 to $14,999 | 9 (1.0%) | 10 (3.1%) |
| $15,000 to $19,999 | 48 (5.3%) | 23 (7.1%) |
| $20,000 to $24,999 | 8 (0.9%) | 21 (6.5%) |
| $25,000 to $34,999 | 32 (3.5%) | 65 (20.1%) |
| $35,000 to $49,999 | 120 (13.3%) | 56 (17.3%) |
| $50,000 to $74,999 | 140 (15.5%) | 52 (16.1%) |
| $75,000 to $99,999 | 191 (21.2%) | 33 (10.2%) |
| $100,000 to $149,999 | 133 (14.7%) | 43 (13.3%) |
| $150,000 or more | 213 (23.6%) | 4 (1.2%) |
| Total | 902 (100.0%) | 323 (100.0%) |
Monthly Housing Cost Tiers in Petersburg
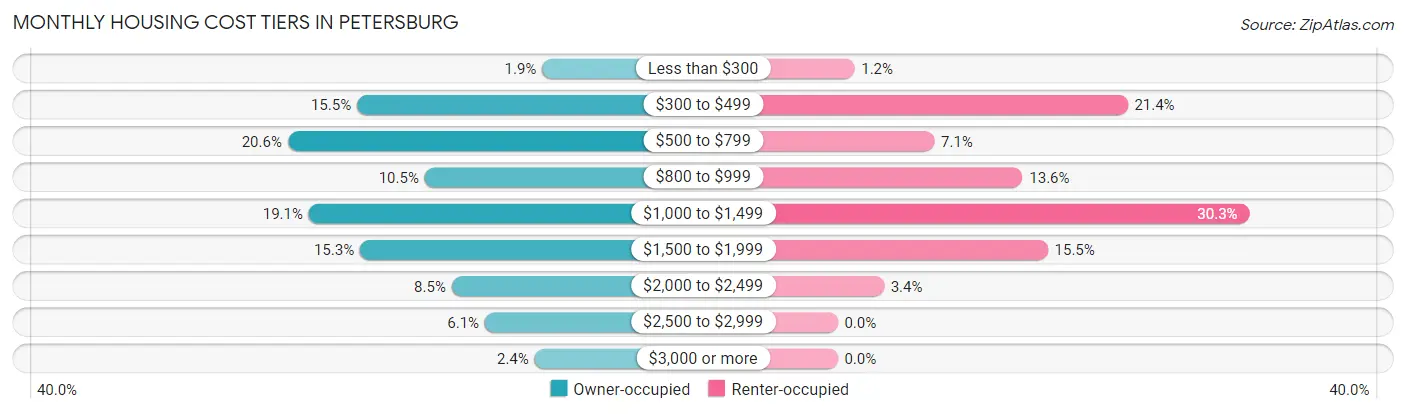
| Monthly Cost | Owner-occupied | Renter-occupied |
| Less than $300 | 17 (1.9%) | 4 (1.2%) |
| $300 to $499 | 140 (15.5%) | 69 (21.4%) |
| $500 to $799 | 186 (20.6%) | 23 (7.1%) |
| $800 to $999 | 95 (10.5%) | 44 (13.6%) |
| $1,000 to $1,499 | 172 (19.1%) | 98 (30.3%) |
| $1,500 to $1,999 | 138 (15.3%) | 50 (15.5%) |
| $2,000 to $2,499 | 77 (8.5%) | 11 (3.4%) |
| $2,500 to $2,999 | 55 (6.1%) | 0 (0.0%) |
| $3,000 or more | 22 (2.4%) | 0 (0.0%) |
| Total | 902 (100.0%) | 323 (100.0%) |
Physical Housing Characteristics in Petersburg
Housing Structures in Petersburg
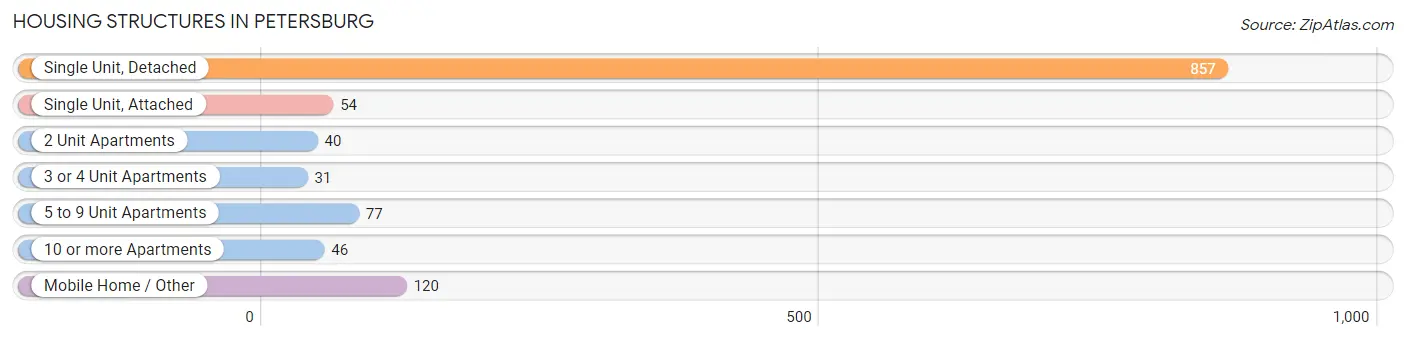
| Structure Type | # Housing Units | % Housing Units |
| Single Unit, Detached | 857 | 70.0% |
| Single Unit, Attached | 54 | 4.4% |
| 2 Unit Apartments | 40 | 3.3% |
| 3 or 4 Unit Apartments | 31 | 2.5% |
| 5 to 9 Unit Apartments | 77 | 6.3% |
| 10 or more Apartments | 46 | 3.8% |
| Mobile Home / Other | 120 | 9.8% |
| Total | 1,225 | 100.0% |
Housing Structures by Occupancy in Petersburg
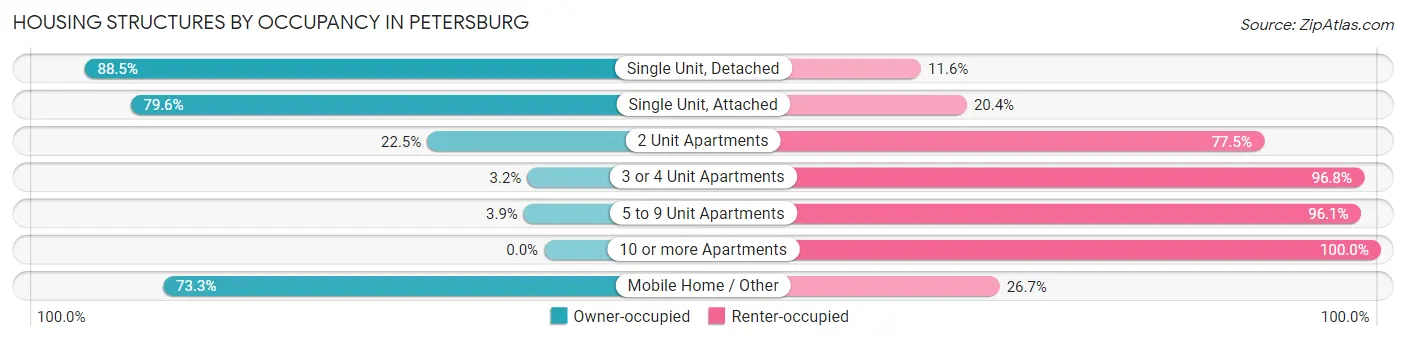
| Structure Type | Owner-occupied | Renter-occupied |
| Single Unit, Detached | 758 (88.4%) | 99 (11.6%) |
| Single Unit, Attached | 43 (79.6%) | 11 (20.4%) |
| 2 Unit Apartments | 9 (22.5%) | 31 (77.5%) |
| 3 or 4 Unit Apartments | 1 (3.2%) | 30 (96.8%) |
| 5 to 9 Unit Apartments | 3 (3.9%) | 74 (96.1%) |
| 10 or more Apartments | 0 (0.0%) | 46 (100.0%) |
| Mobile Home / Other | 88 (73.3%) | 32 (26.7%) |
| Total | 902 (73.6%) | 323 (26.4%) |
Housing Structures by Number of Rooms in Petersburg
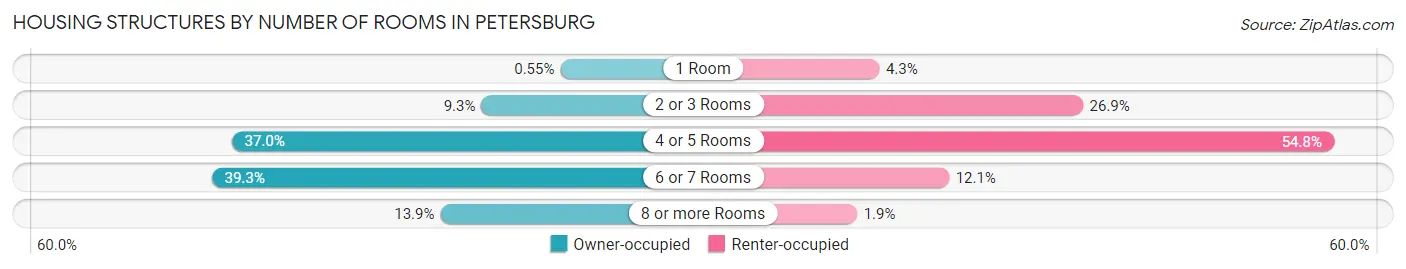
| Number of Rooms | Owner-occupied | Renter-occupied |
| 1 Room | 5 (0.5%) | 14 (4.3%) |
| 2 or 3 Rooms | 84 (9.3%) | 87 (26.9%) |
| 4 or 5 Rooms | 334 (37.0%) | 177 (54.8%) |
| 6 or 7 Rooms | 354 (39.3%) | 39 (12.1%) |
| 8 or more Rooms | 125 (13.9%) | 6 (1.9%) |
| Total | 902 (100.0%) | 323 (100.0%) |
Housing Structure by Heating Type in Petersburg
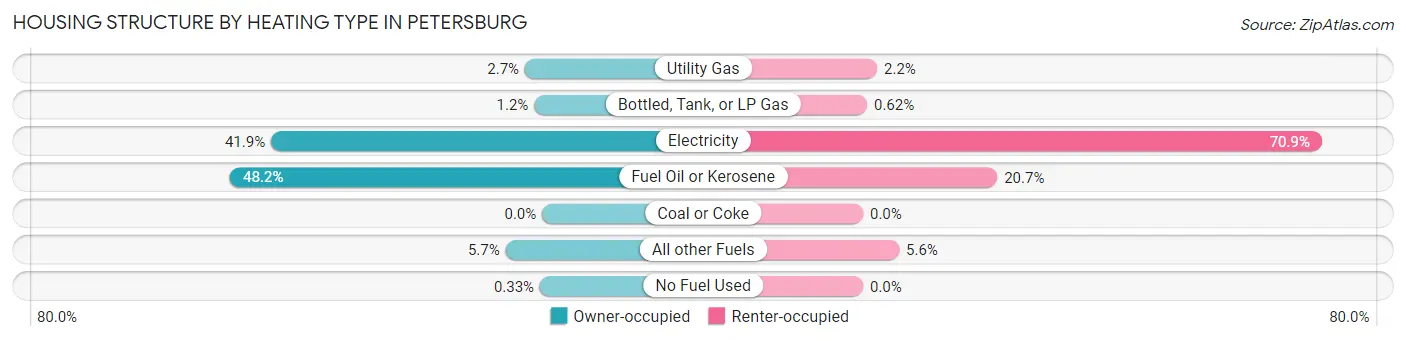
| Heating Type | Owner-occupied | Renter-occupied |
| Utility Gas | 24 (2.7%) | 7 (2.2%) |
| Bottled, Tank, or LP Gas | 11 (1.2%) | 2 (0.6%) |
| Electricity | 378 (41.9%) | 229 (70.9%) |
| Fuel Oil or Kerosene | 435 (48.2%) | 67 (20.7%) |
| Coal or Coke | 0 (0.0%) | 0 (0.0%) |
| All other Fuels | 51 (5.7%) | 18 (5.6%) |
| No Fuel Used | 3 (0.3%) | 0 (0.0%) |
| Total | 902 (100.0%) | 323 (100.0%) |
Household Vehicle Usage in Petersburg
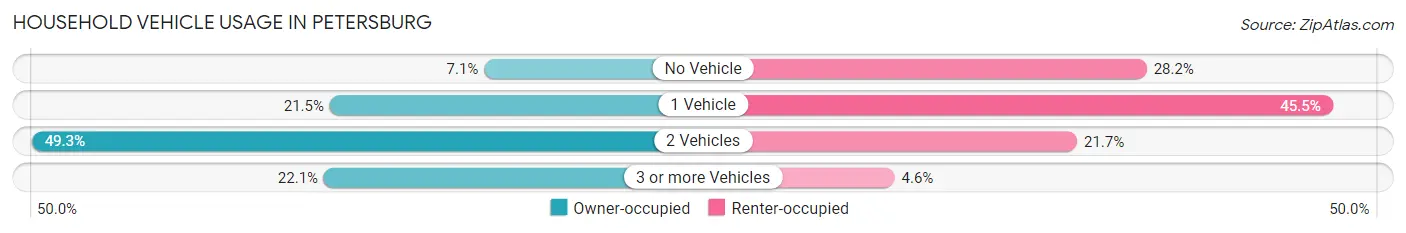
| Vehicles per Household | Owner-occupied | Renter-occupied |
| No Vehicle | 64 (7.1%) | 91 (28.2%) |
| 1 Vehicle | 194 (21.5%) | 147 (45.5%) |
| 2 Vehicles | 445 (49.3%) | 70 (21.7%) |
| 3 or more Vehicles | 199 (22.1%) | 15 (4.6%) |
| Total | 902 (100.0%) | 323 (100.0%) |
Real Estate & Mortgages in Petersburg
Real Estate and Mortgage Overview in Petersburg
| Characteristic | Without Mortgage | With Mortgage |
| Housing Units | 395 | 507 |
| Median Property Value | $277,700 | $278,000 |
| Median Household Income | $62,250 | $148 |
| Monthly Housing Costs | $601 | $22 |
| Real Estate Taxes | $1,353 | $79 |
Property Value by Mortgage Status in Petersburg
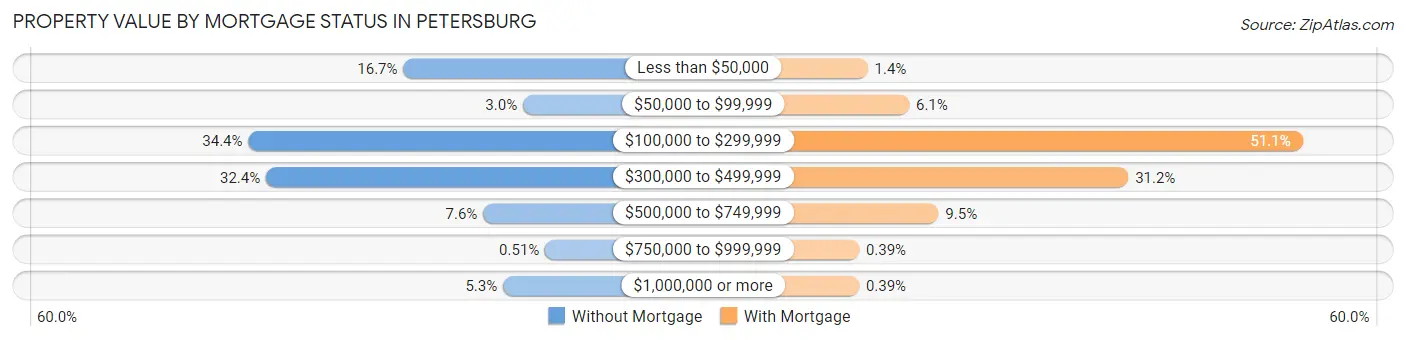
| Property Value | Without Mortgage | With Mortgage |
| Less than $50,000 | 66 (16.7%) | 7 (1.4%) |
| $50,000 to $99,999 | 12 (3.0%) | 31 (6.1%) |
| $100,000 to $299,999 | 136 (34.4%) | 259 (51.1%) |
| $300,000 to $499,999 | 128 (32.4%) | 158 (31.2%) |
| $500,000 to $749,999 | 30 (7.6%) | 48 (9.5%) |
| $750,000 to $999,999 | 2 (0.5%) | 2 (0.4%) |
| $1,000,000 or more | 21 (5.3%) | 2 (0.4%) |
| Total | 395 (100.0%) | 507 (100.0%) |
Household Income by Mortgage Status in Petersburg
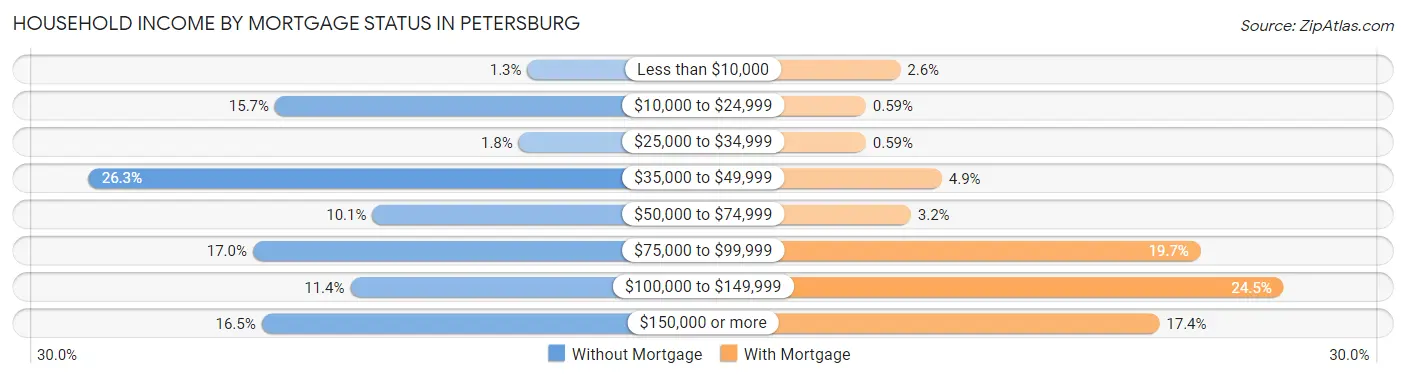
| Household Income | Without Mortgage | With Mortgage |
| Less than $10,000 | 5 (1.3%) | 13 (2.6%) |
| $10,000 to $24,999 | 62 (15.7%) | 3 (0.6%) |
| $25,000 to $34,999 | 7 (1.8%) | 3 (0.6%) |
| $35,000 to $49,999 | 104 (26.3%) | 25 (4.9%) |
| $50,000 to $74,999 | 40 (10.1%) | 16 (3.2%) |
| $75,000 to $99,999 | 67 (17.0%) | 100 (19.7%) |
| $100,000 to $149,999 | 45 (11.4%) | 124 (24.5%) |
| $150,000 or more | 65 (16.5%) | 88 (17.4%) |
| Total | 395 (100.0%) | 507 (100.0%) |
Property Value to Household Income Ratio in Petersburg
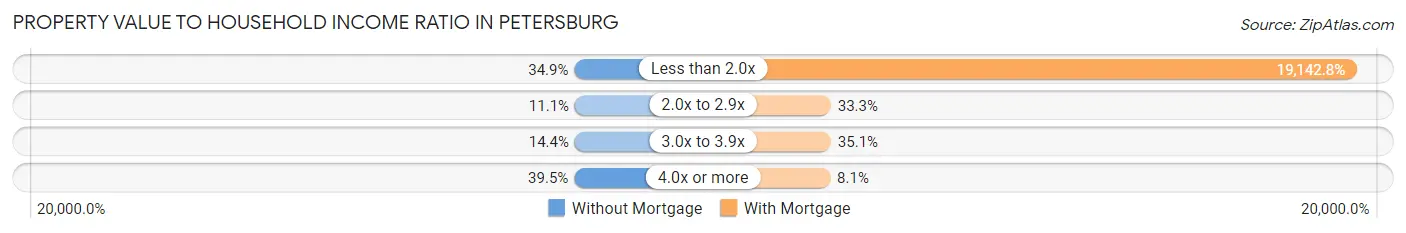
| Value-to-Income Ratio | Without Mortgage | With Mortgage |
| Less than 2.0x | 138 (34.9%) | 97,054 (19,142.8%) |
| 2.0x to 2.9x | 44 (11.1%) | 169 (33.3%) |
| 3.0x to 3.9x | 57 (14.4%) | 178 (35.1%) |
| 4.0x or more | 156 (39.5%) | 41 (8.1%) |
| Total | 395 (100.0%) | 507 (100.0%) |
Real Estate Taxes by Mortgage Status in Petersburg
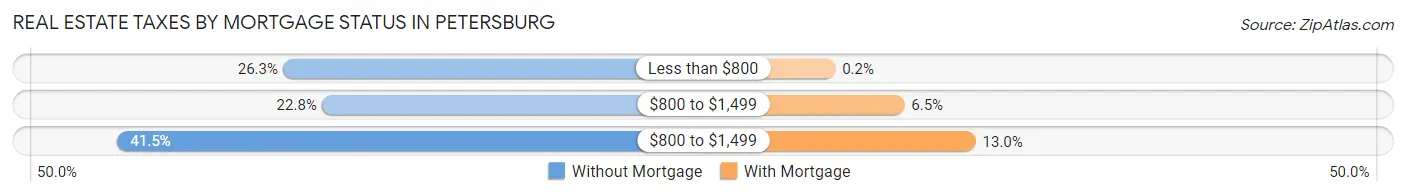
| Property Taxes | Without Mortgage | With Mortgage |
| Less than $800 | 104 (26.3%) | 1 (0.2%) |
| $800 to $1,499 | 90 (22.8%) | 33 (6.5%) |
| $800 to $1,499 | 164 (41.5%) | 66 (13.0%) |
| Total | 395 (100.0%) | 507 (100.0%) |
Health & Disability in Petersburg
Health Insurance Coverage by Age in Petersburg
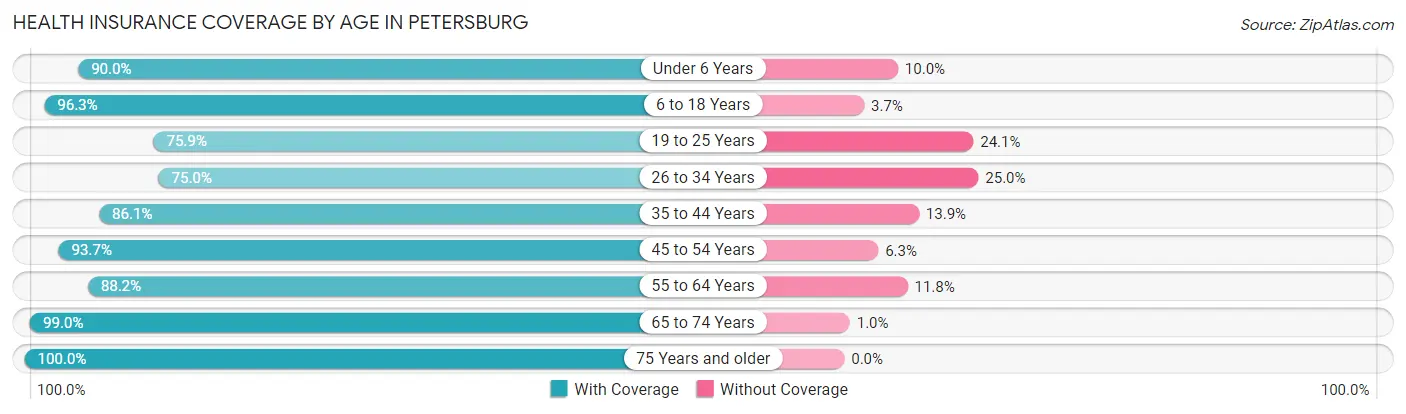
| Age Bracket | With Coverage | Without Coverage |
| Under 6 Years | 162 (90.0%) | 18 (10.0%) |
| 6 to 18 Years | 444 (96.3%) | 17 (3.7%) |
| 19 to 25 Years | 142 (75.9%) | 45 (24.1%) |
| 26 to 34 Years | 234 (75.0%) | 78 (25.0%) |
| 35 to 44 Years | 260 (86.1%) | 42 (13.9%) |
| 45 to 54 Years | 296 (93.7%) | 20 (6.3%) |
| 55 to 64 Years | 613 (88.2%) | 82 (11.8%) |
| 65 to 74 Years | 486 (99.0%) | 5 (1.0%) |
| 75 Years and older | 328 (100.0%) | 0 (0.0%) |
| Total | 2,965 (90.6%) | 307 (9.4%) |
Health Insurance Coverage by Citizenship Status in Petersburg
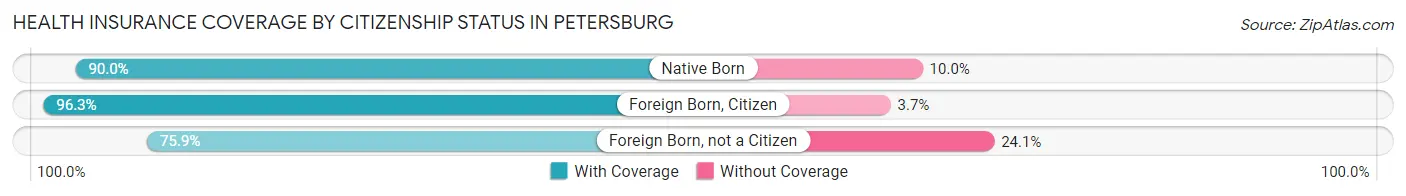
| Citizenship Status | With Coverage | Without Coverage |
| Native Born | 162 (90.0%) | 18 (10.0%) |
| Foreign Born, Citizen | 444 (96.3%) | 17 (3.7%) |
| Foreign Born, not a Citizen | 142 (75.9%) | 45 (24.1%) |
Health Insurance Coverage by Household Income in Petersburg
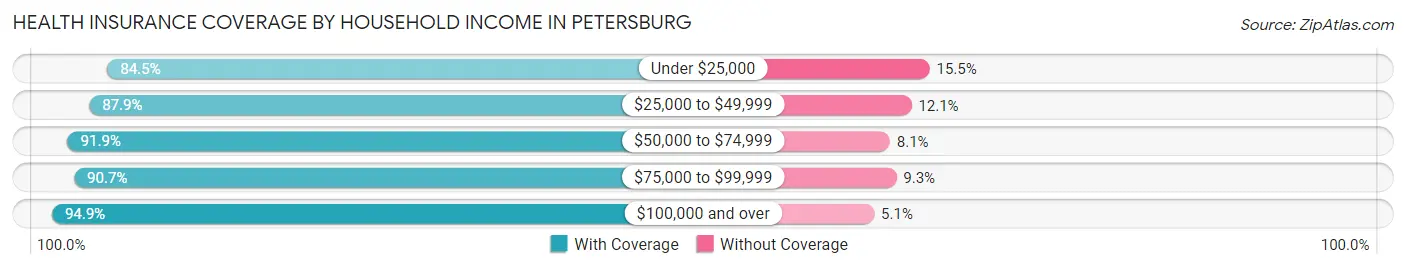
| Household Income | With Coverage | Without Coverage |
| Under $25,000 | 169 (84.5%) | 31 (15.5%) |
| $25,000 to $49,999 | 479 (87.9%) | 66 (12.1%) |
| $50,000 to $74,999 | 410 (91.9%) | 36 (8.1%) |
| $75,000 to $99,999 | 693 (90.7%) | 71 (9.3%) |
| $100,000 and over | 1,165 (94.9%) | 63 (5.1%) |
Public vs Private Health Insurance Coverage by Age in Petersburg
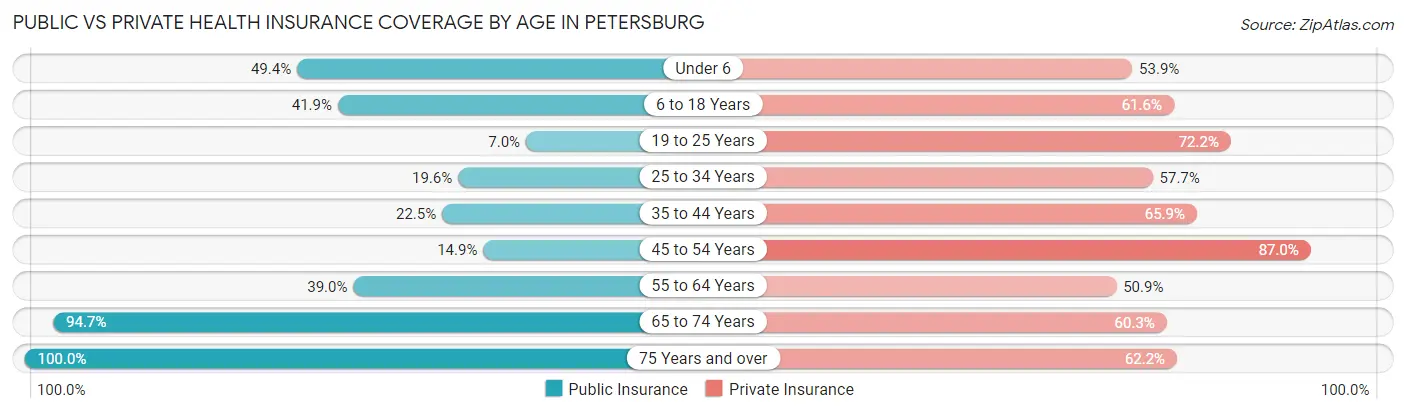
| Age Bracket | Public Insurance | Private Insurance |
| Under 6 | 89 (49.4%) | 97 (53.9%) |
| 6 to 18 Years | 193 (41.9%) | 284 (61.6%) |
| 19 to 25 Years | 13 (7.0%) | 135 (72.2%) |
| 25 to 34 Years | 61 (19.6%) | 180 (57.7%) |
| 35 to 44 Years | 68 (22.5%) | 199 (65.9%) |
| 45 to 54 Years | 47 (14.9%) | 275 (87.0%) |
| 55 to 64 Years | 271 (39.0%) | 354 (50.9%) |
| 65 to 74 Years | 465 (94.7%) | 296 (60.3%) |
| 75 Years and over | 328 (100.0%) | 204 (62.2%) |
| Total | 1,535 (46.9%) | 2,024 (61.9%) |
Disability Status by Sex by Age in Petersburg
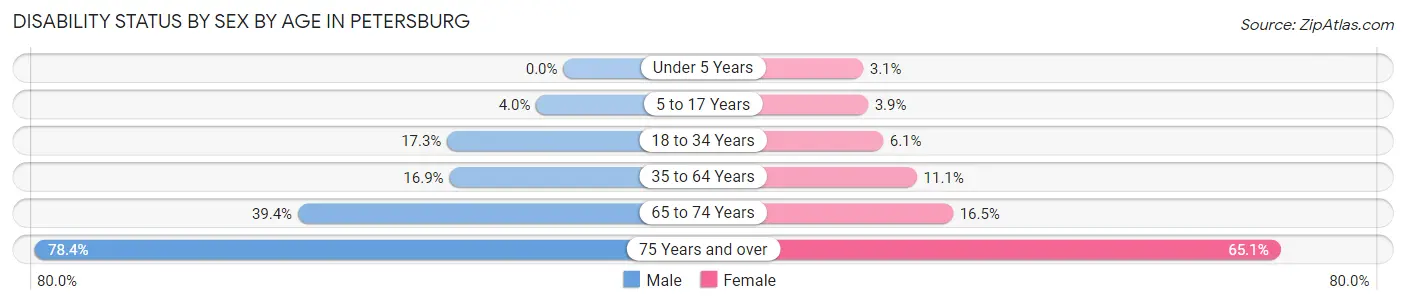
| Age Bracket | Male | Female |
| Under 5 Years | 0 (0.0%) | 2 (3.1%) |
| 5 to 17 Years | 9 (4.0%) | 9 (3.8%) |
| 18 to 34 Years | 44 (17.2%) | 17 (6.1%) |
| 35 to 64 Years | 111 (16.9%) | 73 (11.1%) |
| 65 to 74 Years | 93 (39.4%) | 42 (16.5%) |
| 75 Years and over | 120 (78.4%) | 114 (65.1%) |
Disability Class by Sex by Age in Petersburg
Disability Class: Hearing Difficulty
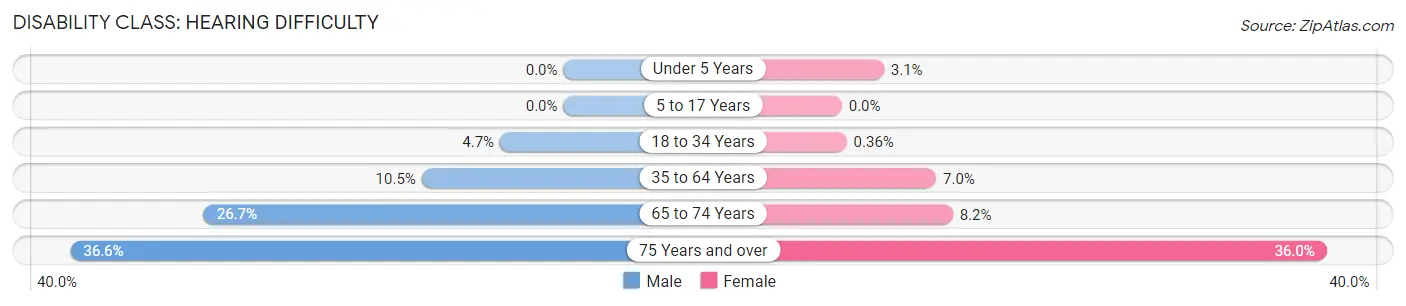
| Age Bracket | Male | Female |
| Under 5 Years | 0 (0.0%) | 2 (3.1%) |
| 5 to 17 Years | 0 (0.0%) | 0 (0.0%) |
| 18 to 34 Years | 12 (4.7%) | 1 (0.4%) |
| 35 to 64 Years | 69 (10.5%) | 46 (7.0%) |
| 65 to 74 Years | 63 (26.7%) | 21 (8.2%) |
| 75 Years and over | 56 (36.6%) | 63 (36.0%) |
Disability Class: Vision Difficulty
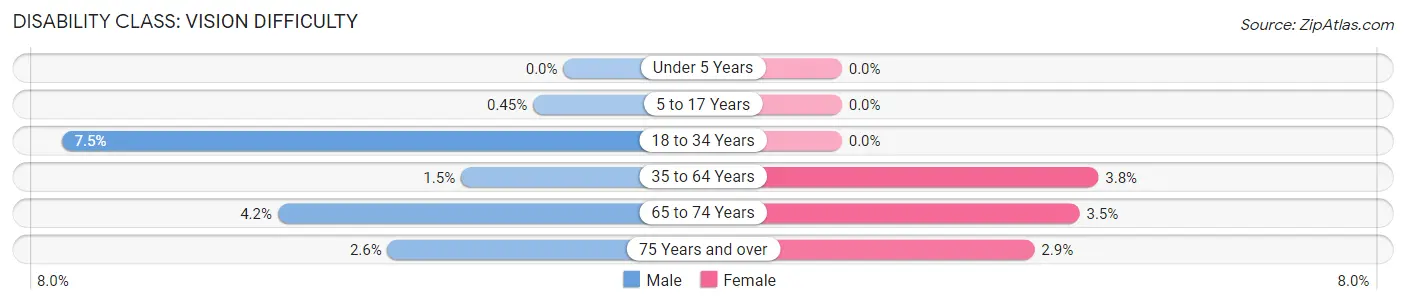
| Age Bracket | Male | Female |
| Under 5 Years | 0 (0.0%) | 0 (0.0%) |
| 5 to 17 Years | 1 (0.4%) | 0 (0.0%) |
| 18 to 34 Years | 19 (7.4%) | 0 (0.0%) |
| 35 to 64 Years | 10 (1.5%) | 25 (3.8%) |
| 65 to 74 Years | 10 (4.2%) | 9 (3.5%) |
| 75 Years and over | 4 (2.6%) | 5 (2.9%) |
Disability Class: Cognitive Difficulty
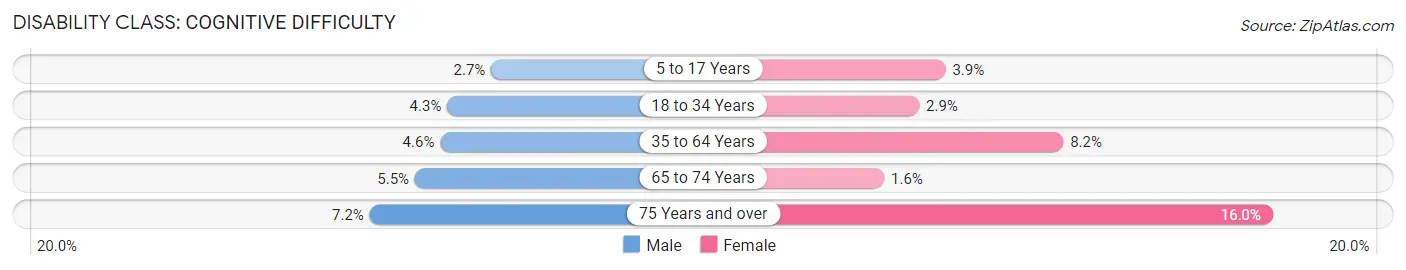
| Age Bracket | Male | Female |
| 5 to 17 Years | 6 (2.7%) | 9 (3.8%) |
| 18 to 34 Years | 11 (4.3%) | 8 (2.9%) |
| 35 to 64 Years | 30 (4.6%) | 54 (8.2%) |
| 65 to 74 Years | 13 (5.5%) | 4 (1.6%) |
| 75 Years and over | 11 (7.2%) | 28 (16.0%) |
Disability Class: Ambulatory Difficulty
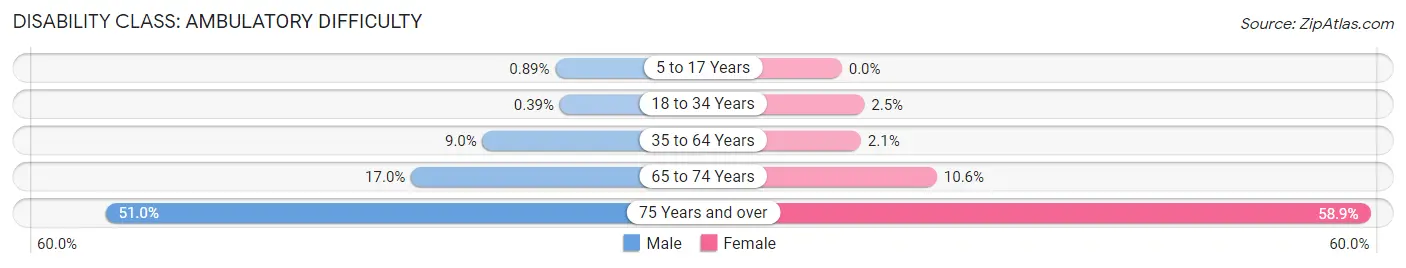
| Age Bracket | Male | Female |
| 5 to 17 Years | 2 (0.9%) | 0 (0.0%) |
| 18 to 34 Years | 1 (0.4%) | 7 (2.5%) |
| 35 to 64 Years | 59 (9.0%) | 14 (2.1%) |
| 65 to 74 Years | 40 (17.0%) | 27 (10.6%) |
| 75 Years and over | 78 (51.0%) | 103 (58.9%) |
Disability Class: Self-Care Difficulty
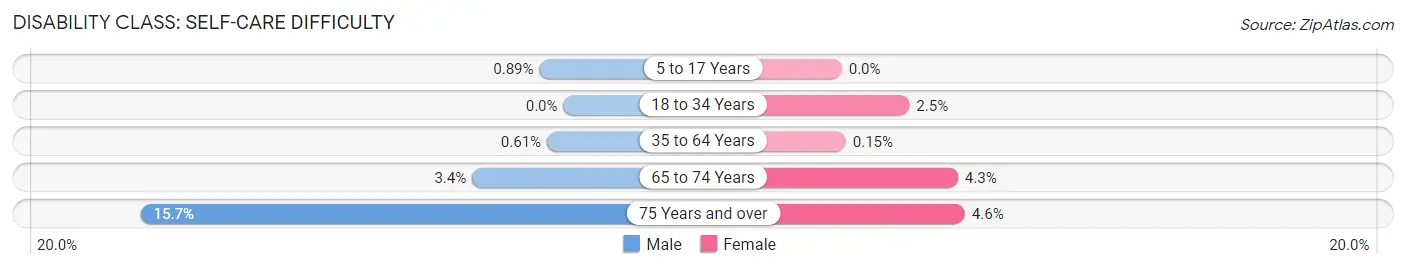
| Age Bracket | Male | Female |
| 5 to 17 Years | 2 (0.9%) | 0 (0.0%) |
| 18 to 34 Years | 0 (0.0%) | 7 (2.5%) |
| 35 to 64 Years | 4 (0.6%) | 1 (0.2%) |
| 65 to 74 Years | 8 (3.4%) | 11 (4.3%) |
| 75 Years and over | 24 (15.7%) | 8 (4.6%) |
Technology Access in Petersburg
Computing Device Access in Petersburg
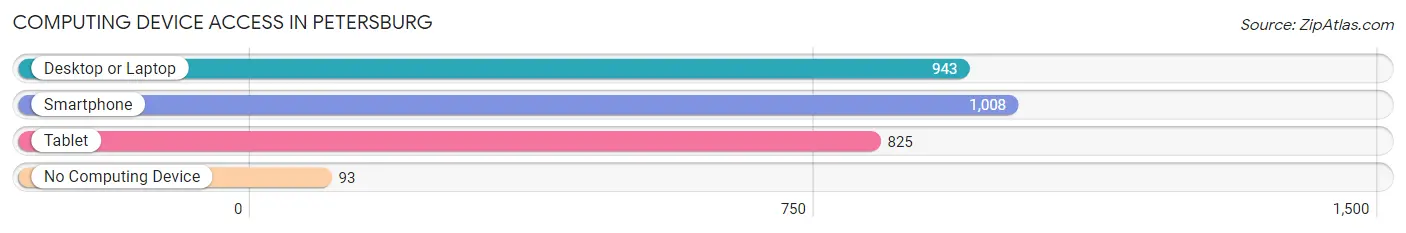
| Device Type | # Households | % Households |
| Desktop or Laptop | 943 | 77.0% |
| Smartphone | 1,008 | 82.3% |
| Tablet | 825 | 67.3% |
| No Computing Device | 93 | 7.6% |
| Total | 1,225 | 100.0% |
Internet Access in Petersburg
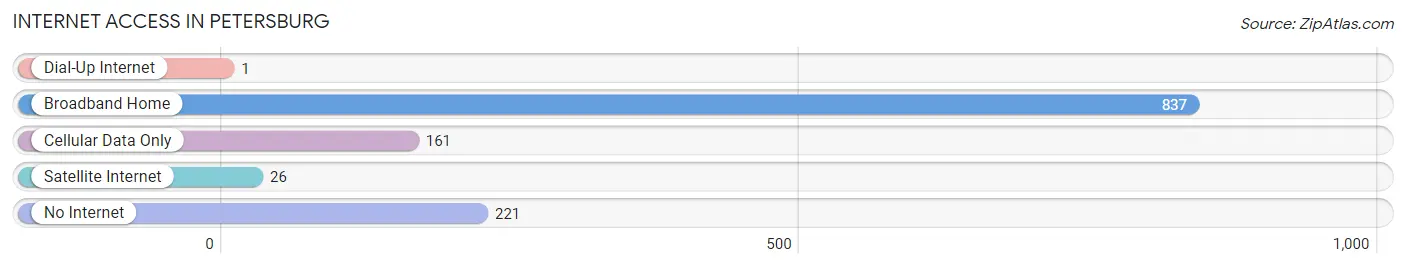
| Internet Type | # Households | % Households |
| Dial-Up Internet | 1 | 0.1% |
| Broadband Home | 837 | 68.3% |
| Cellular Data Only | 161 | 13.1% |
| Satellite Internet | 26 | 2.1% |
| No Internet | 221 | 18.0% |
| Total | 1,225 | 100.0% |
Petersburg Summary
Petersburg, Alaska is a small city located in the southeastern part of the state, on Mitkof Island in the Alexander Archipelago. It is the northernmost city in the United States with a population of over 2,000 people. Petersburg is known for its fishing industry, and is a popular tourist destination for its natural beauty and outdoor activities.
History
Petersburg was founded in 1867 by Norwegian immigrant Peter Buschmann, who named the settlement after his hometown of Petersburg, Norway. Buschmann and his family were among the first settlers in the area, and they established a salmon cannery and trading post. The settlement grew quickly, and by the early 1900s, it had become a major fishing port.
In 1912, the Alaska-Juneau Gold Mining Company built a smelter in Petersburg, which helped to spur the city’s growth. The smelter was in operation until the 1950s, when it was closed due to environmental concerns.
In the 1950s, the fishing industry began to decline, and the city’s population began to shrink. However, in the 1970s, the fishing industry began to rebound, and the city’s population began to grow again.
Geography
Petersburg is located on Mitkof Island, which is part of the Alexander Archipelago in southeastern Alaska. The island is approximately 25 miles long and 10 miles wide, and is surrounded by the waters of the Wrangell Narrows and Frederick Sound.
The city is located on the northern end of the island, and is bordered by the Wrangell Narrows to the east and Frederick Sound to the west. The city is situated at an elevation of approximately 20 feet above sea level.
The climate in Petersburg is mild and temperate, with average temperatures ranging from the mid-30s in the winter to the mid-50s in the summer. The city receives an average of 40 inches of precipitation per year, with most of it falling in the form of rain.
Economy
Petersburg’s economy is largely based on fishing and tourism. The city is home to several seafood processing plants, which process and can salmon, halibut, and other fish. The city also has a thriving tourism industry, with visitors coming to enjoy the city’s natural beauty and outdoor activities.
The city is also home to several small businesses, including restaurants, retail stores, and art galleries. The city also has a small port, which is used for shipping and receiving goods.
Demographics
As of the 2010 census, the population of Petersburg was 2,383. The city is predominantly white, with approximately 85% of the population identifying as white. The remaining 15% of the population is made up of Native Americans, Asians, and other races.
The median household income in Petersburg is $50,000, and the median home value is $170,000. The city has a high rate of homeownership, with approximately 70% of the population owning their own homes.
Petersburg is a small city with a rich history and a vibrant economy. It is a popular tourist destination, and is known for its natural beauty and outdoor activities. The city is home to a diverse population, and is a great place to live and work.
Common Questions
What is Per Capita Income in Petersburg?
Per Capita income in Petersburg is $37,415.
What is the Median Family Income in Petersburg?
Median Family Income in Petersburg is $87,750.
What is the Median Household income in Petersburg?
Median Household Income in Petersburg is $77,670.
What is Income or Wage Gap in Petersburg?
Income or Wage Gap in Petersburg is 4.4%.
Women in Petersburg earn 95.6 cents for every dollar earned by a man.
What is Inequality or Gini Index in Petersburg?
Inequality or Gini Index in Petersburg is 0.42.
What is the Total Population of Petersburg?
Total Population of Petersburg is 3,317.
What is the Total Male Population of Petersburg?
Total Male Population of Petersburg is 1,641.
What is the Total Female Population of Petersburg?
Total Female Population of Petersburg is 1,676.
What is the Ratio of Males per 100 Females in Petersburg?
There are 97.91 Males per 100 Females in Petersburg.
What is the Ratio of Females per 100 Males in Petersburg?
There are 102.13 Females per 100 Males in Petersburg.
What is the Median Population Age in Petersburg?
Median Population Age in Petersburg is 49.8 Years.
What is the Average Family Size in Petersburg
Average Family Size in Petersburg is 3.2 People.
What is the Average Household Size in Petersburg
Average Household Size in Petersburg is 2.6 People.
How Large is the Labor Force in Petersburg?
There are 1,748 People in the Labor Forcein in Petersburg.
What is the Percentage of People in the Labor Force in Petersburg?
62.7% of People are in the Labor Force in Petersburg.
What is the Unemployment Rate in Petersburg?
Unemployment Rate in Petersburg is 3.7%.