Zip Codes with the Highest Percentage of Households with Income Below $10,000 in Farmington, MI
RELATED REPORTS & OPTIONS
Household Income | $0-10k
Farmington
Compare Zip Codes
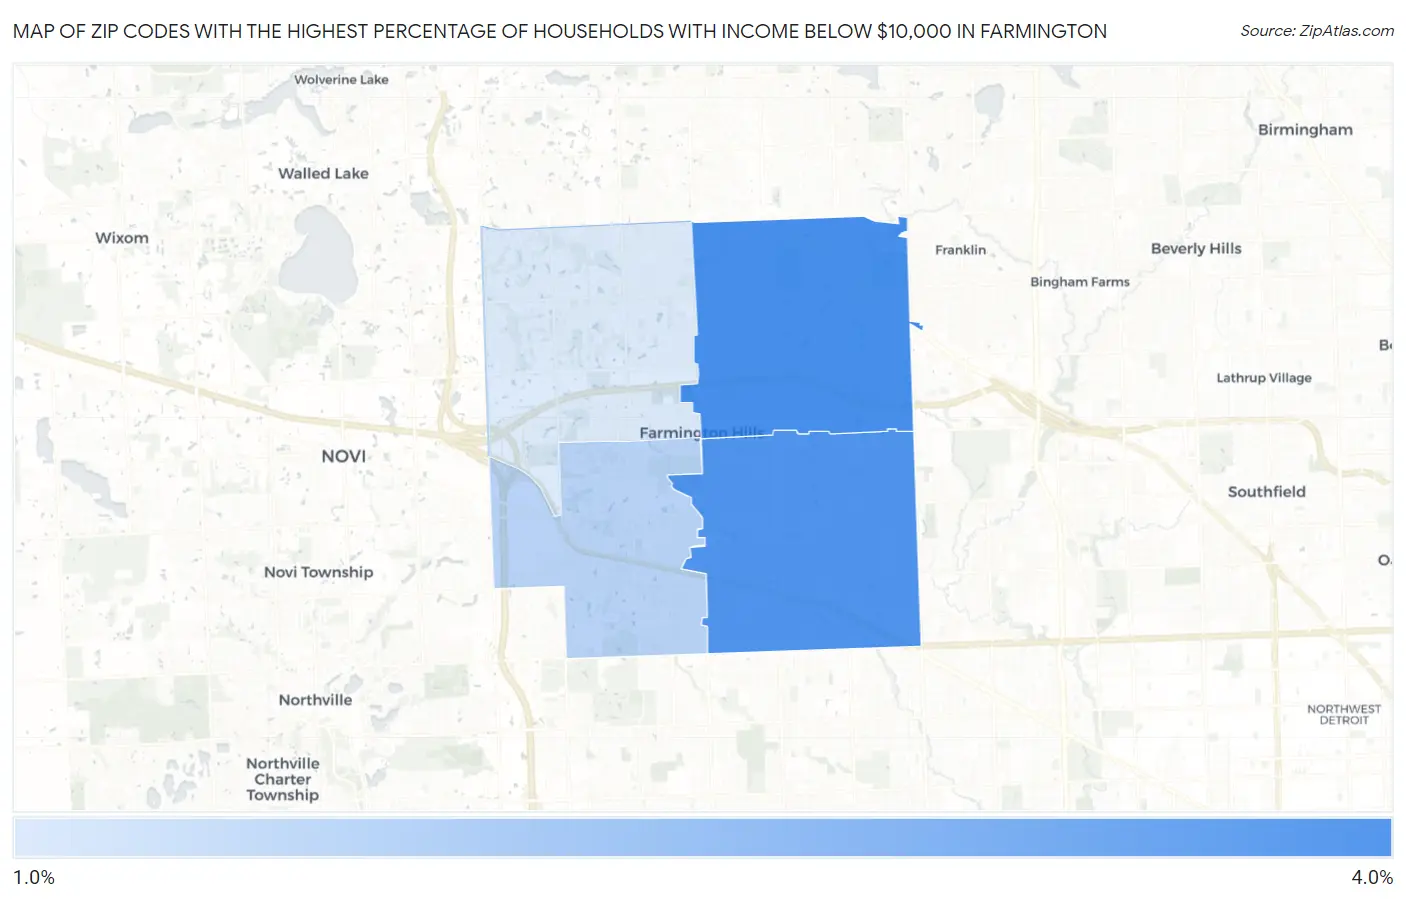
Map of Zip Codes with the Highest Percentage of Households with Income Below $10,000 in Farmington
1.9%
4.0%
Zip Codes with the Highest Percentage of Households with Income Below $10,000 in Farmington, MI
| Zip Code | Households with Income < $10k | vs State | vs National | |
| 1. | 48334 | 4.0% | 5.0%(-1.00)#446 | 4.9%(-0.900)#15,300 |
| 2. | 48336 | 3.9% | 5.0%(-1.10)#460 | 4.9%(-1.00)#15,645 |
| 3. | 48335 | 2.4% | 5.0%(-2.60)#719 | 4.9%(-2.50)#22,053 |
| 4. | 48331 | 1.9% | 5.0%(-3.10)#788 | 4.9%(-3.00)#24,027 |
1
Common Questions
What are the Top 3 Zip Codes with the Highest Percentage of Households with Income Below $10,000 in Farmington, MI?
Top 3 Zip Codes with the Highest Percentage of Households with Income Below $10,000 in Farmington, MI are:
What zip code has the Highest Percentage of Households with Income Below $10,000 in Farmington, MI?
48334 has the Highest Percentage of Households with Income Below $10,000 in Farmington, MI with 4.0%.
What is the Percentage of Households with Income Below $10,000 in Farmington, MI?
Percentage of Households with Income Below $10,000 in Farmington is 1.8%.
What is the Percentage of Households with Income Below $10,000 in Michigan?
Percentage of Households with Income Below $10,000 in Michigan is 5.0%.
What is the Percentage of Households with Income Below $10,000 in the United States?
Percentage of Households with Income Below $10,000 in the United States is 4.9%.