Zip Codes with the Highest Percentage of Households with Income Below $10,000 in Sterling Heights, MI
RELATED REPORTS & OPTIONS
Household Income | $0-10k
Sterling Heights
Compare Zip Codes
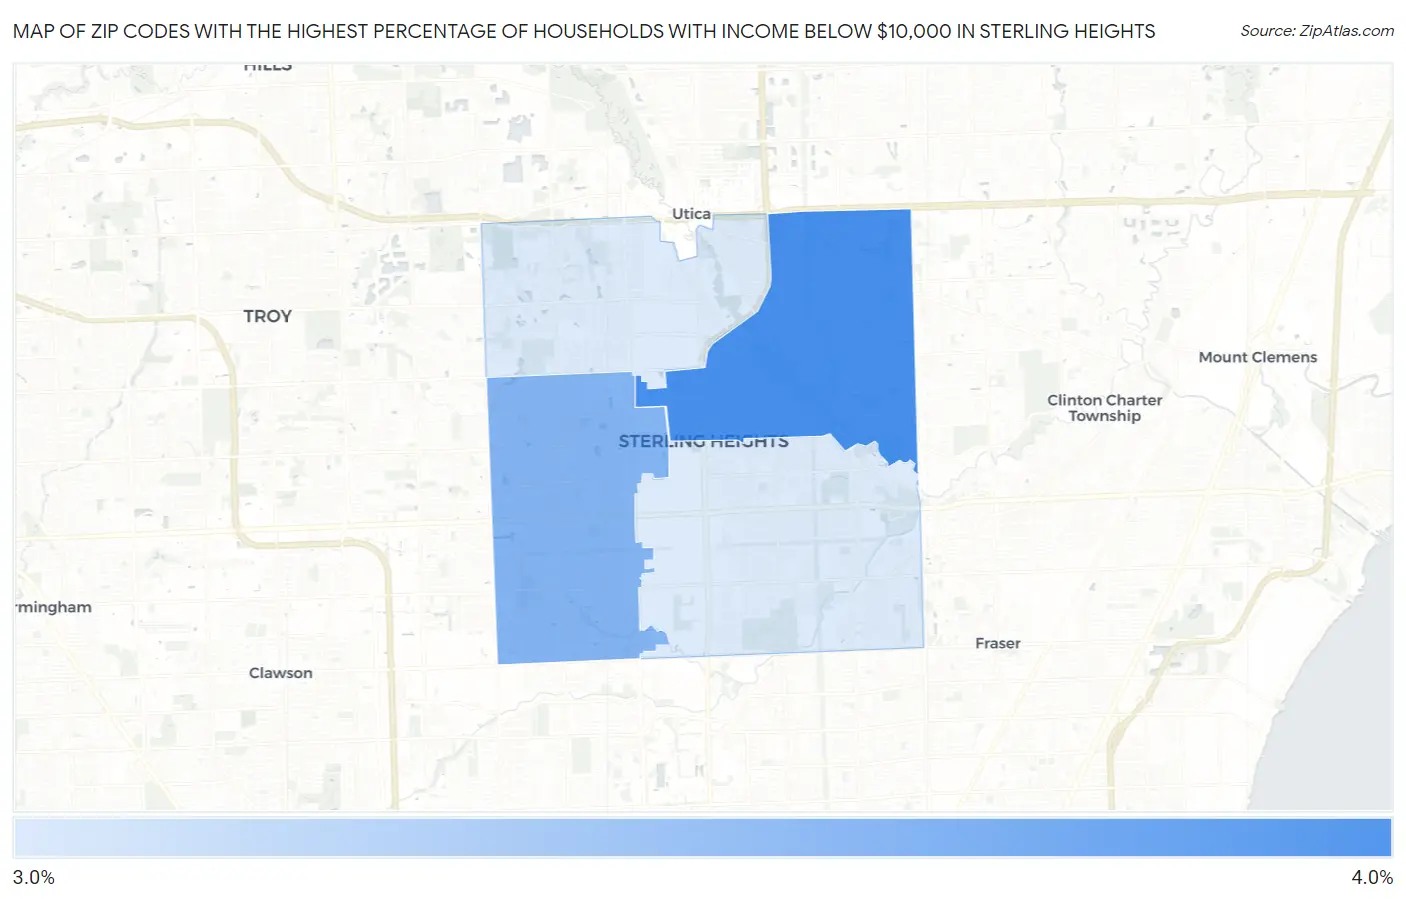
Map of Zip Codes with the Highest Percentage of Households with Income Below $10,000 in Sterling Heights
3.5%
4.0%
Zip Codes with the Highest Percentage of Households with Income Below $10,000 in Sterling Heights, MI
| Zip Code | Households with Income < $10k | vs State | vs National | |
| 1. | 48313 | 4.0% | 5.0%(-1.00)#443 | 4.9%(-0.900)#15,238 |
| 2. | 48310 | 3.8% | 5.0%(-1.20)#479 | 4.9%(-1.10)#15,984 |
| 3. | 48312 | 3.5% | 5.0%(-1.50)#517 | 4.9%(-1.40)#17,227 |
| 4. | 48314 | 3.5% | 5.0%(-1.50)#519 | 4.9%(-1.40)#17,288 |
1
Common Questions
What are the Top 3 Zip Codes with the Highest Percentage of Households with Income Below $10,000 in Sterling Heights, MI?
Top 3 Zip Codes with the Highest Percentage of Households with Income Below $10,000 in Sterling Heights, MI are:
What zip code has the Highest Percentage of Households with Income Below $10,000 in Sterling Heights, MI?
48313 has the Highest Percentage of Households with Income Below $10,000 in Sterling Heights, MI with 4.0%.
What is the Percentage of Households with Income Below $10,000 in Sterling Heights, MI?
Percentage of Households with Income Below $10,000 in Sterling Heights is 3.7%.
What is the Percentage of Households with Income Below $10,000 in Michigan?
Percentage of Households with Income Below $10,000 in Michigan is 5.0%.
What is the Percentage of Households with Income Below $10,000 in the United States?
Percentage of Households with Income Below $10,000 in the United States is 4.9%.