Zip Codes with the Highest Percentage of Population Employed in Education Instruction & Library in Detroit, MI
RELATED REPORTS & OPTIONS
Education Instruction & Library
Detroit
Compare Zip Codes
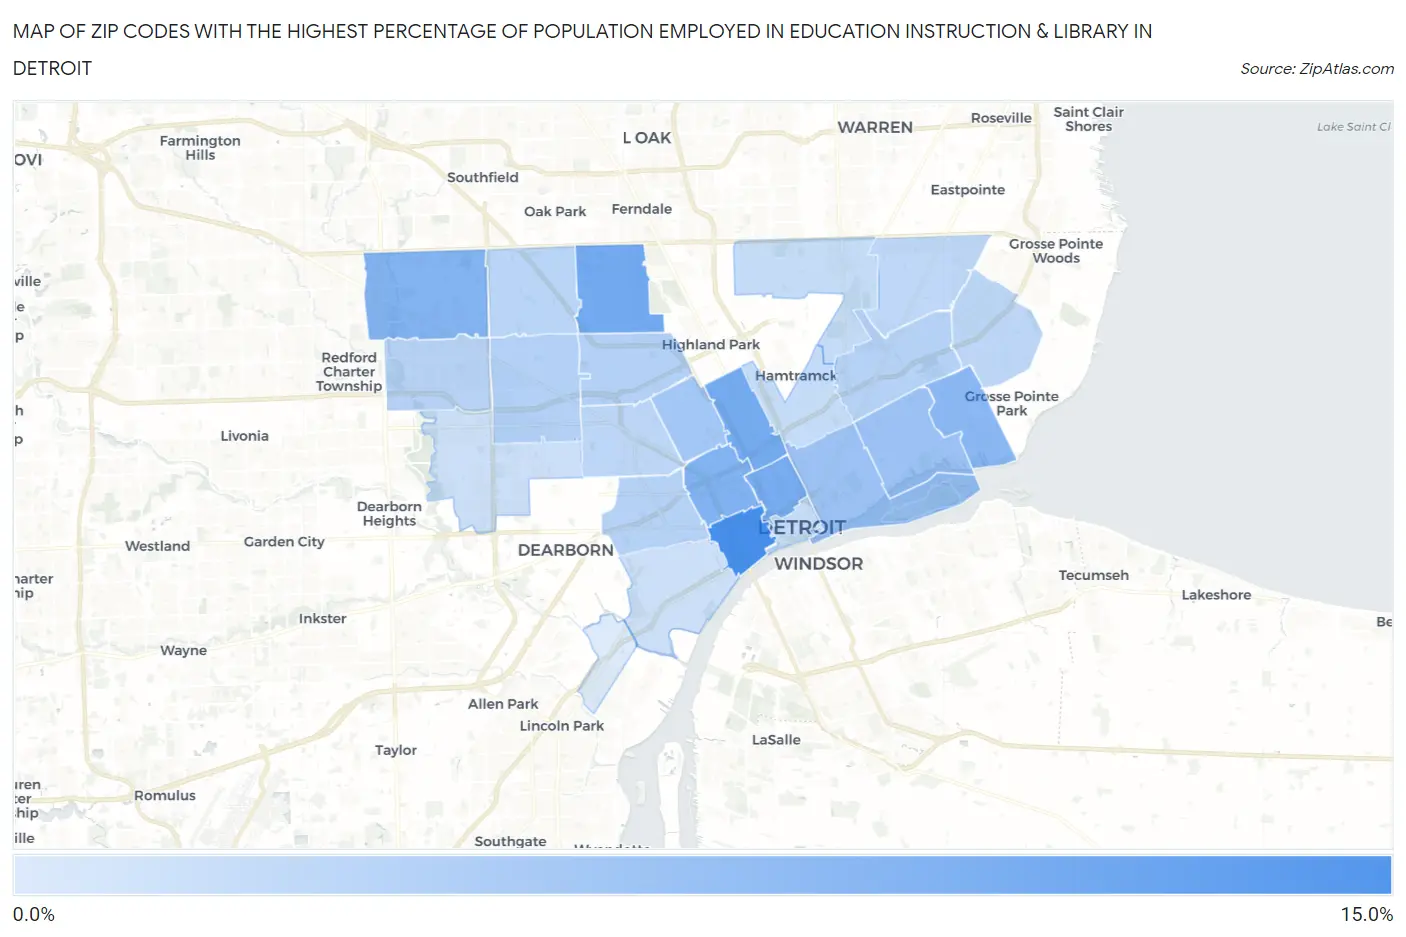
Map of Zip Codes with the Highest Percentage of Population Employed in Education Instruction & Library in Detroit
0.91%
11.3%
Zip Codes with the Highest Percentage of Population Employed in Education Instruction & Library in Detroit, MI
| Zip Code | % Employed | vs State | vs National | |
| 1. | 48216 | 11.3% | 5.3%(+5.95)#29 | 6.2%(+5.11)#2,859 |
| 2. | 48221 | 8.2% | 5.3%(+2.82)#95 | 6.2%(+1.97)#6,823 |
| 3. | 48202 | 8.0% | 5.3%(+2.65)#102 | 6.2%(+1.81)#7,176 |
| 4. | 48201 | 7.8% | 5.3%(+2.50)#110 | 6.2%(+1.66)#7,537 |
| 5. | 48208 | 7.2% | 5.3%(+1.90)#125 | 6.2%(+1.06)#9,190 |
| 6. | 48219 | 7.0% | 5.3%(+1.68)#137 | 6.2%(+0.836)#9,841 |
| 7. | 48215 | 6.5% | 5.3%(+1.16)#188 | 6.2%(+0.319)#11,612 |
| 8. | 48207 | 5.3% | 5.3%(-0.031)#323 | 6.2%(-0.874)#16,347 |
| 9. | 48214 | 5.3% | 5.3%(-0.055)#328 | 6.2%(-0.899)#16,434 |
| 10. | 48206 | 4.9% | 5.3%(-0.478)#396 | 6.2%(-1.32)#18,230 |
| 11. | 48238 | 3.7% | 5.3%(-1.62)#586 | 6.2%(-2.46)#22,648 |
| 12. | 48227 | 3.6% | 5.3%(-1.71)#607 | 6.2%(-2.55)#22,934 |
| 13. | 48210 | 3.6% | 5.3%(-1.74)#613 | 6.2%(-2.58)#23,035 |
| 14. | 48213 | 3.5% | 5.3%(-1.85)#633 | 6.2%(-2.70)#23,406 |
| 15. | 48223 | 3.3% | 5.3%(-1.99)#652 | 6.2%(-2.83)#23,832 |
| 16. | 48235 | 3.1% | 5.3%(-2.19)#687 | 6.2%(-3.03)#24,469 |
| 17. | 48204 | 3.0% | 5.3%(-2.33)#711 | 6.2%(-3.17)#24,829 |
| 18. | 48224 | 3.0% | 5.3%(-2.35)#713 | 6.2%(-3.19)#24,861 |
| 19. | 48205 | 2.9% | 5.3%(-2.41)#726 | 6.2%(-3.26)#24,995 |
| 20. | 48226 | 2.5% | 5.3%(-2.85)#786 | 6.2%(-3.69)#26,028 |
| 21. | 48211 | 2.4% | 5.3%(-2.90)#800 | 6.2%(-3.75)#26,141 |
| 22. | 48234 | 2.4% | 5.3%(-2.92)#802 | 6.2%(-3.76)#26,169 |
| 23. | 48228 | 2.0% | 5.3%(-3.34)#832 | 6.2%(-4.19)#26,949 |
| 24. | 48209 | 1.9% | 5.3%(-3.41)#838 | 6.2%(-4.26)#27,052 |
| 25. | 48217 | 0.91% | 5.3%(-4.42)#897 | 6.2%(-5.27)#28,302 |
1
Common Questions
What are the Top 10 Zip Codes with the Highest Percentage of Population Employed in Education Instruction & Library in Detroit, MI?
Top 10 Zip Codes with the Highest Percentage of Population Employed in Education Instruction & Library in Detroit, MI are:
What zip code has the Highest Percentage of Population Employed in Education Instruction & Library in Detroit, MI?
48216 has the Highest Percentage of Population Employed in Education Instruction & Library in Detroit, MI with 11.3%.
What is the Percentage of Population Employed in Education Instruction & Library in Detroit, MI?
Percentage of Population Employed in Education Instruction & Library in Detroit is 4.2%.
What is the Percentage of Population Employed in Education Instruction & Library in Michigan?
Percentage of Population Employed in Education Instruction & Library in Michigan is 5.3%.
What is the Percentage of Population Employed in Education Instruction & Library in the United States?
Percentage of Population Employed in Education Instruction & Library in the United States is 6.2%.