Zip Codes with the Highest Percentage of Population Employed in Education Instruction & Library in Michigan
RELATED REPORTS & OPTIONS
Education Instruction & Library
Michigan
Compare Zip Codes
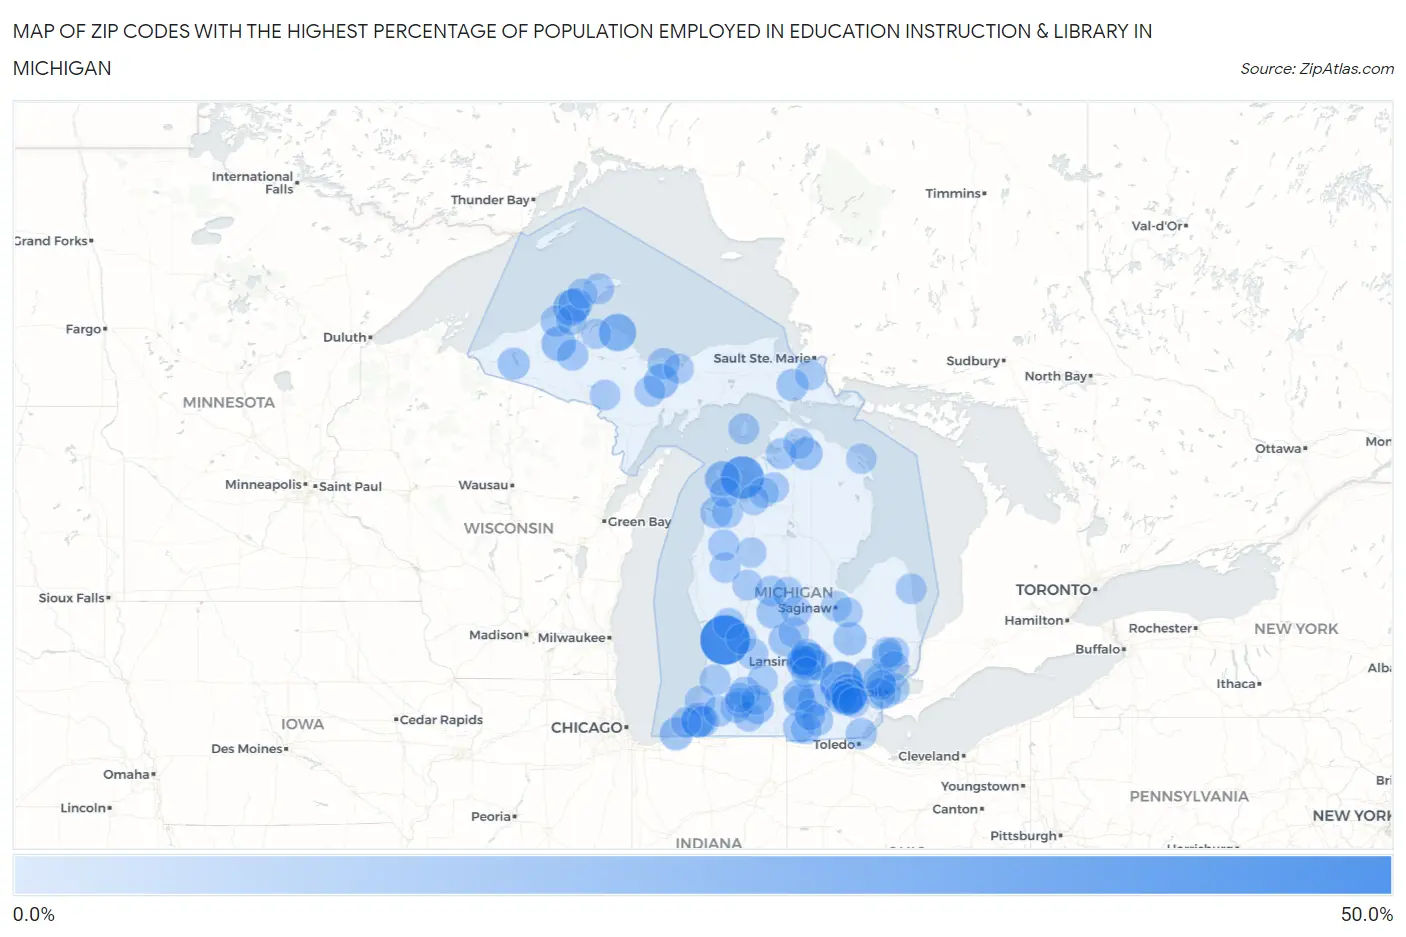
Map of Zip Codes with the Highest Percentage of Population Employed in Education Instruction & Library in Michigan
0.0%
50.0%
Zip Codes with the Highest Percentage of Population Employed in Education Instruction & Library in Michigan
| Zip Code | % Employed | vs State | vs National | |
| 1. | 49430 | 50.0% | 5.3%(+44.7)#1 | 6.2%(+43.8)#75 |
| 2. | 49674 | 34.8% | 5.3%(+29.4)#2 | 6.2%(+28.6)#185 |
| 3. | 48143 | 34.5% | 5.3%(+29.2)#3 | 6.2%(+28.3)#191 |
| 4. | 48105 | 24.6% | 5.3%(+19.3)#4 | 6.2%(+18.4)#383 |
| 5. | 49808 | 23.0% | 5.3%(+17.6)#5 | 6.2%(+16.8)#468 |
| 6. | 49931 | 20.8% | 5.3%(+15.4)#6 | 6.2%(+14.6)#582 |
| 7. | 48104 | 19.6% | 5.3%(+14.3)#7 | 6.2%(+13.5)#677 |
| 8. | 48109 | 19.5% | 5.3%(+14.1)#8 | 6.2%(+13.3)#697 |
| 9. | 49654 | 18.7% | 5.3%(+13.4)#9 | 6.2%(+12.5)#767 |
| 10. | 49891 | 17.3% | 5.3%(+12.0)#10 | 6.2%(+11.1)#911 |
| 11. | 49952 | 17.3% | 5.3%(+12.0)#11 | 6.2%(+11.1)#912 |
| 12. | 49104 | 17.2% | 5.3%(+11.8)#12 | 6.2%(+11.0)#932 |
| 13. | 48864 | 16.5% | 5.3%(+11.2)#13 | 6.2%(+10.3)#1,028 |
| 14. | 49930 | 15.6% | 5.3%(+10.2)#14 | 6.2%(+9.40)#1,173 |
| 15. | 48823 | 15.2% | 5.3%(+9.86)#15 | 6.2%(+9.02)#1,250 |
| 16. | 49117 | 14.4% | 5.3%(+9.02)#16 | 6.2%(+8.18)#1,429 |
| 17. | 48502 | 13.9% | 5.3%(+8.58)#17 | 6.2%(+7.74)#1,562 |
| 18. | 49052 | 13.8% | 5.3%(+8.49)#18 | 6.2%(+7.65)#1,593 |
| 19. | 49254 | 13.6% | 5.3%(+8.27)#19 | 6.2%(+7.43)#1,672 |
| 20. | 49283 | 13.5% | 5.3%(+8.14)#20 | 6.2%(+7.30)#1,715 |
| 21. | 49705 | 13.1% | 5.3%(+7.72)#21 | 6.2%(+6.87)#1,878 |
| 22. | 48103 | 13.0% | 5.3%(+7.69)#22 | 6.2%(+6.85)#1,892 |
| 23. | 48873 | 12.9% | 5.3%(+7.60)#23 | 6.2%(+6.76)#1,927 |
| 24. | 49103 | 12.4% | 5.3%(+7.09)#24 | 6.2%(+6.25)#2,159 |
| 25. | 49617 | 12.1% | 5.3%(+6.80)#25 | 6.2%(+5.95)#2,318 |
| 26. | 49947 | 12.0% | 5.3%(+6.69)#26 | 6.2%(+5.84)#2,375 |
| 27. | 49780 | 11.9% | 5.3%(+6.57)#27 | 6.2%(+5.73)#2,434 |
| 28. | 48852 | 11.9% | 5.3%(+6.52)#28 | 6.2%(+5.68)#2,467 |
| 29. | 48216 | 11.3% | 5.3%(+5.95)#29 | 6.2%(+5.11)#2,859 |
| 30. | 49806 | 11.2% | 5.3%(+5.88)#30 | 6.2%(+5.04)#2,903 |
| 31. | 48070 | 11.0% | 5.3%(+5.71)#31 | 6.2%(+4.87)#3,026 |
| 32. | 48108 | 11.0% | 5.3%(+5.63)#32 | 6.2%(+4.79)#3,076 |
| 33. | 49965 | 10.9% | 5.3%(+5.55)#33 | 6.2%(+4.71)#3,141 |
| 34. | 49970 | 10.6% | 5.3%(+5.30)#34 | 6.2%(+4.45)#3,325 |
| 35. | 49318 | 10.6% | 5.3%(+5.24)#35 | 6.2%(+4.40)#3,382 |
| 36. | 49242 | 10.5% | 5.3%(+5.21)#36 | 6.2%(+4.36)#3,414 |
| 37. | 49269 | 10.5% | 5.3%(+5.21)#37 | 6.2%(+4.36)#3,415 |
| 38. | 49074 | 10.5% | 5.3%(+5.19)#38 | 6.2%(+4.34)#3,438 |
| 39. | 49253 | 10.4% | 5.3%(+5.03)#39 | 6.2%(+4.19)#3,582 |
| 40. | 48230 | 10.2% | 5.3%(+4.90)#40 | 6.2%(+4.06)#3,699 |
| 41. | 48840 | 10.2% | 5.3%(+4.87)#41 | 6.2%(+4.03)#3,725 |
| 42. | 49689 | 10.2% | 5.3%(+4.85)#42 | 6.2%(+4.00)#3,747 |
| 43. | 48133 | 10.1% | 5.3%(+4.79)#43 | 6.2%(+3.94)#3,802 |
| 44. | 49782 | 10.0% | 5.3%(+4.61)#44 | 6.2%(+3.77)#3,991 |
| 45. | 49302 | 9.9% | 5.3%(+4.59)#45 | 6.2%(+3.75)#4,016 |
| 46. | 48933 | 9.9% | 5.3%(+4.53)#46 | 6.2%(+3.69)#4,091 |
| 47. | 48120 | 9.8% | 5.3%(+4.49)#47 | 6.2%(+3.65)#4,137 |
| 48. | 49770 | 9.8% | 5.3%(+4.49)#48 | 6.2%(+3.65)#4,139 |
| 49. | 49087 | 9.8% | 5.3%(+4.44)#49 | 6.2%(+3.60)#4,196 |
| 50. | 49340 | 9.6% | 5.3%(+4.27)#50 | 6.2%(+3.42)#4,396 |
| 51. | 49450 | 9.6% | 5.3%(+4.23)#51 | 6.2%(+3.38)#4,449 |
| 52. | 48825 | 9.6% | 5.3%(+4.21)#52 | 6.2%(+3.37)#4,464 |
| 53. | 49271 | 9.6% | 5.3%(+4.21)#53 | 6.2%(+3.37)#4,465 |
| 54. | 49643 | 9.5% | 5.3%(+4.17)#54 | 6.2%(+3.33)#4,510 |
| 55. | 49282 | 9.4% | 5.3%(+4.04)#55 | 6.2%(+3.19)#4,686 |
| 56. | 49950 | 9.3% | 5.3%(+3.95)#56 | 6.2%(+3.10)#4,816 |
| 57. | 48095 | 9.3% | 5.3%(+3.92)#57 | 6.2%(+3.08)#4,850 |
| 58. | 48853 | 9.3% | 5.3%(+3.91)#58 | 6.2%(+3.07)#4,866 |
| 59. | 49038 | 9.2% | 5.3%(+3.90)#59 | 6.2%(+3.05)#4,888 |
| 60. | 49102 | 9.2% | 5.3%(+3.89)#60 | 6.2%(+3.05)#4,898 |
| 61. | 49304 | 9.2% | 5.3%(+3.88)#61 | 6.2%(+3.04)#4,903 |
| 62. | 49791 | 9.2% | 5.3%(+3.87)#62 | 6.2%(+3.03)#4,929 |
| 63. | 49880 | 9.2% | 5.3%(+3.86)#63 | 6.2%(+3.01)#4,941 |
| 64. | 48434 | 9.1% | 5.3%(+3.75)#64 | 6.2%(+2.91)#5,091 |
| 65. | 48858 | 9.1% | 5.3%(+3.71)#65 | 6.2%(+2.87)#5,150 |
| 66. | 49916 | 9.0% | 5.3%(+3.70)#66 | 6.2%(+2.85)#5,178 |
| 67. | 48895 | 8.9% | 5.3%(+3.57)#67 | 6.2%(+2.73)#5,367 |
| 68. | 48910 | 8.9% | 5.3%(+3.55)#68 | 6.2%(+2.71)#5,406 |
| 69. | 49045 | 8.8% | 5.3%(+3.47)#69 | 6.2%(+2.63)#5,526 |
| 70. | 49525 | 8.8% | 5.3%(+3.43)#70 | 6.2%(+2.58)#5,598 |
| 71. | 49024 | 8.8% | 5.3%(+3.42)#71 | 6.2%(+2.58)#5,605 |
| 72. | 49881 | 8.7% | 5.3%(+3.39)#72 | 6.2%(+2.54)#5,670 |
| 73. | 49072 | 8.7% | 5.3%(+3.36)#73 | 6.2%(+2.52)#5,723 |
| 74. | 49050 | 8.7% | 5.3%(+3.36)#74 | 6.2%(+2.51)#5,730 |
| 75. | 48801 | 8.7% | 5.3%(+3.35)#75 | 6.2%(+2.50)#5,756 |
| 76. | 48005 | 8.7% | 5.3%(+3.34)#76 | 6.2%(+2.49)#5,773 |
| 77. | 49106 | 8.7% | 5.3%(+3.33)#77 | 6.2%(+2.49)#5,774 |
| 78. | 49659 | 8.6% | 5.3%(+3.29)#78 | 6.2%(+2.44)#5,871 |
| 79. | 48065 | 8.6% | 5.3%(+3.27)#79 | 6.2%(+2.43)#5,907 |
| 80. | 49307 | 8.6% | 5.3%(+3.25)#80 | 6.2%(+2.40)#5,949 |
| 81. | 49777 | 8.5% | 5.3%(+3.12)#81 | 6.2%(+2.27)#6,171 |
| 82. | 48042 | 8.5% | 5.3%(+3.11)#82 | 6.2%(+2.27)#6,177 |
| 83. | 48607 | 8.4% | 5.3%(+3.09)#83 | 6.2%(+2.25)#6,213 |
| 84. | 49688 | 8.4% | 5.3%(+3.08)#84 | 6.2%(+2.24)#6,243 |
| 85. | 48912 | 8.4% | 5.3%(+3.07)#85 | 6.2%(+2.22)#6,280 |
| 86. | 49962 | 8.3% | 5.3%(+2.99)#86 | 6.2%(+2.15)#6,451 |
| 87. | 49664 | 8.3% | 5.3%(+2.99)#87 | 6.2%(+2.14)#6,475 |
| 88. | 49034 | 8.3% | 5.3%(+2.98)#88 | 6.2%(+2.14)#6,480 |
| 89. | 48323 | 8.3% | 5.3%(+2.95)#89 | 6.2%(+2.10)#6,546 |
| 90. | 48197 | 8.3% | 5.3%(+2.91)#90 | 6.2%(+2.07)#6,607 |
| 91. | 49612 | 8.2% | 5.3%(+2.89)#91 | 6.2%(+2.05)#6,655 |
| 92. | 49008 | 8.2% | 5.3%(+2.86)#92 | 6.2%(+2.02)#6,712 |
| 93. | 49901 | 8.2% | 5.3%(+2.86)#93 | 6.2%(+2.01)#6,720 |
| 94. | 48734 | 8.2% | 5.3%(+2.85)#94 | 6.2%(+2.00)#6,751 |
| 95. | 48221 | 8.2% | 5.3%(+2.82)#95 | 6.2%(+1.97)#6,823 |
| 96. | 49690 | 8.1% | 5.3%(+2.81)#96 | 6.2%(+1.96)#6,836 |
| 97. | 49862 | 8.1% | 5.3%(+2.80)#97 | 6.2%(+1.95)#6,856 |
| 98. | 48808 | 8.1% | 5.3%(+2.76)#98 | 6.2%(+1.92)#6,927 |
| 99. | 48854 | 8.1% | 5.3%(+2.75)#99 | 6.2%(+1.91)#6,948 |
| 100. | 49724 | 8.0% | 5.3%(+2.71)#100 | 6.2%(+1.86)#7,054 |
Common Questions
What are the Top 10 Zip Codes with the Highest Percentage of Population Employed in Education Instruction & Library in Michigan?
Top 10 Zip Codes with the Highest Percentage of Population Employed in Education Instruction & Library in Michigan are:
What zip code has the Highest Percentage of Population Employed in Education Instruction & Library in Michigan?
49430 has the Highest Percentage of Population Employed in Education Instruction & Library in Michigan with 50.0%.
What is the Percentage of Population Employed in Education Instruction & Library in the State of Michigan?
Percentage of Population Employed in Education Instruction & Library in Michigan is 5.3%.
What is the Percentage of Population Employed in Education Instruction & Library in the United States?
Percentage of Population Employed in Education Instruction & Library in the United States is 6.2%.