Zip Codes with the Largest Hispanic or Latino Community in Berrien Springs, MI
RELATED REPORTS & OPTIONS
Hispanic or Latino
Berrien Springs
Compare Zip Codes
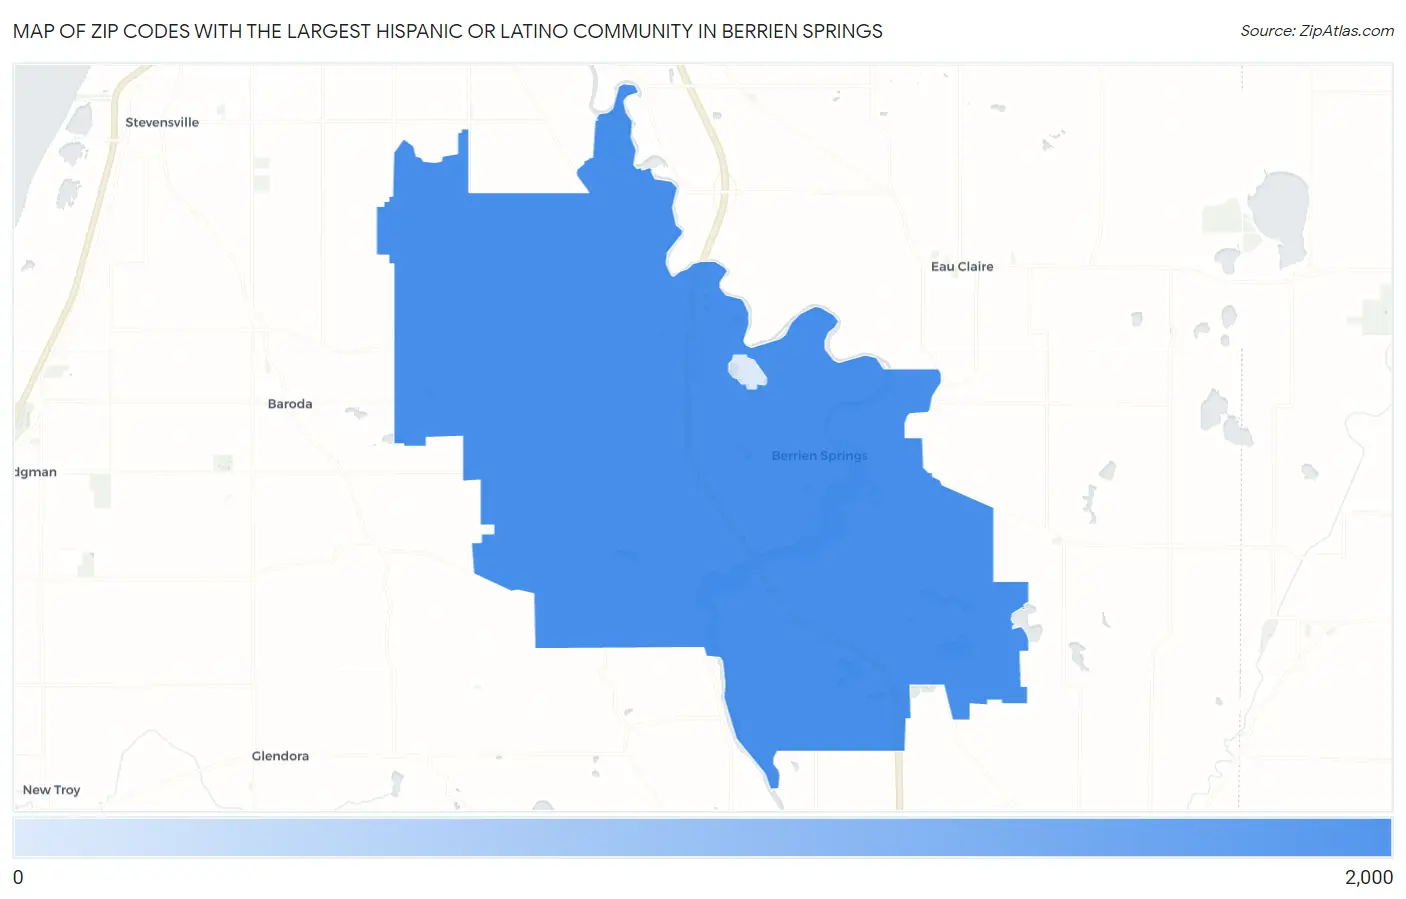
Map of Zip Codes with the Largest Hispanic or Latino Community in Berrien Springs
75
1,669
Zip Codes with the Largest Hispanic or Latino Community in Berrien Springs, MI
| Zip Code | Hispanic or Latino | vs State | vs National | |
| 1. | 49103 | 1,669 | 550,427(0.30%)#74 | 61,755,866(0.00%)#6,383 |
| 2. | 49104 | 75 | 550,427(0.01%)#602 | 61,755,866(0.00%)#17,980 |
1
Common Questions
What are the Top Zip Codes with the Largest Hispanic or Latino Community in Berrien Springs, MI?
Top Zip Codes with the Largest Hispanic or Latino Community in Berrien Springs, MI are:
What zip code has the Largest Hispanic or Latino Community in Berrien Springs, MI?
49103 has the Largest Hispanic or Latino Community in Berrien Springs, MI with 1,669.
What is the Total Hispanic or Latino Population in Berrien Springs, MI?
Total Hispanic or Latino Population in Berrien Springs is 234.
What is the Total Hispanic or Latino Population in Michigan?
Total Hispanic or Latino Population in Michigan is 550,427.
What is the Total Hispanic or Latino Population in the United States?
Total Hispanic or Latino Population in the United States is 61,755,866.