Monroe, MI Map & Demographics
Monroe Map
Monroe Overview
$29,814
PER CAPITA INCOME
$72,500
AVG FAMILY INCOME
$57,779
AVG HOUSEHOLD INCOME
40.6%
WAGE / INCOME GAP [ % ]
59.4¢/ $1
WAGE / INCOME GAP [ $ ]
$11,465
FAMILY INCOME DEFICIT
0.43
INEQUALITY / GINI INDEX
20,400
TOTAL POPULATION
9,797
MALE POPULATION
10,603
FEMALE POPULATION
92.40
MALES / 100 FEMALES
108.23
FEMALES / 100 MALES
36.6
MEDIAN AGE
3.1
AVG FAMILY SIZE
2.3
AVG HOUSEHOLD SIZE
9,522
LABOR FORCE [ PEOPLE ]
59.4%
PERCENT IN LABOR FORCE
7.8%
UNEMPLOYMENT RATE
Monroe Area Codes
Income in Monroe
Income Overview in Monroe
Per Capita Income in Monroe is $29,814, while median incomes of families and households are $72,500 and $57,779 respectively.
| Characteristic | Number | Measure |
| Per Capita Income | 20,400 | $29,814 |
| Median Family Income | 4,788 | $72,500 |
| Mean Family Income | 4,788 | $84,332 |
| Median Household Income | 8,532 | $57,779 |
| Mean Household Income | 8,532 | $69,841 |
| Income Deficit | 4,788 | $11,465 |
| Wage / Income Gap (%) | 20,400 | 40.56% |
| Wage / Income Gap ($) | 20,400 | 59.44¢ per $1 |
| Gini / Inequality Index | 20,400 | 0.43 |
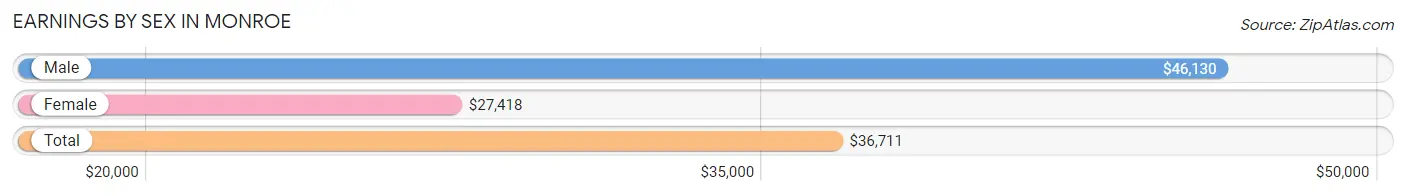
Earnings by Sex in Monroe
Average Earnings in Monroe are $36,711, $46,130 for men and $27,418 for women, a difference of 40.6%.
| Sex | Number | Average Earnings |
| Male | 5,495 (53.8%) | $46,130 |
| Female | 4,723 (46.2%) | $27,418 |
| Total | 10,218 (100.0%) | $36,711 |
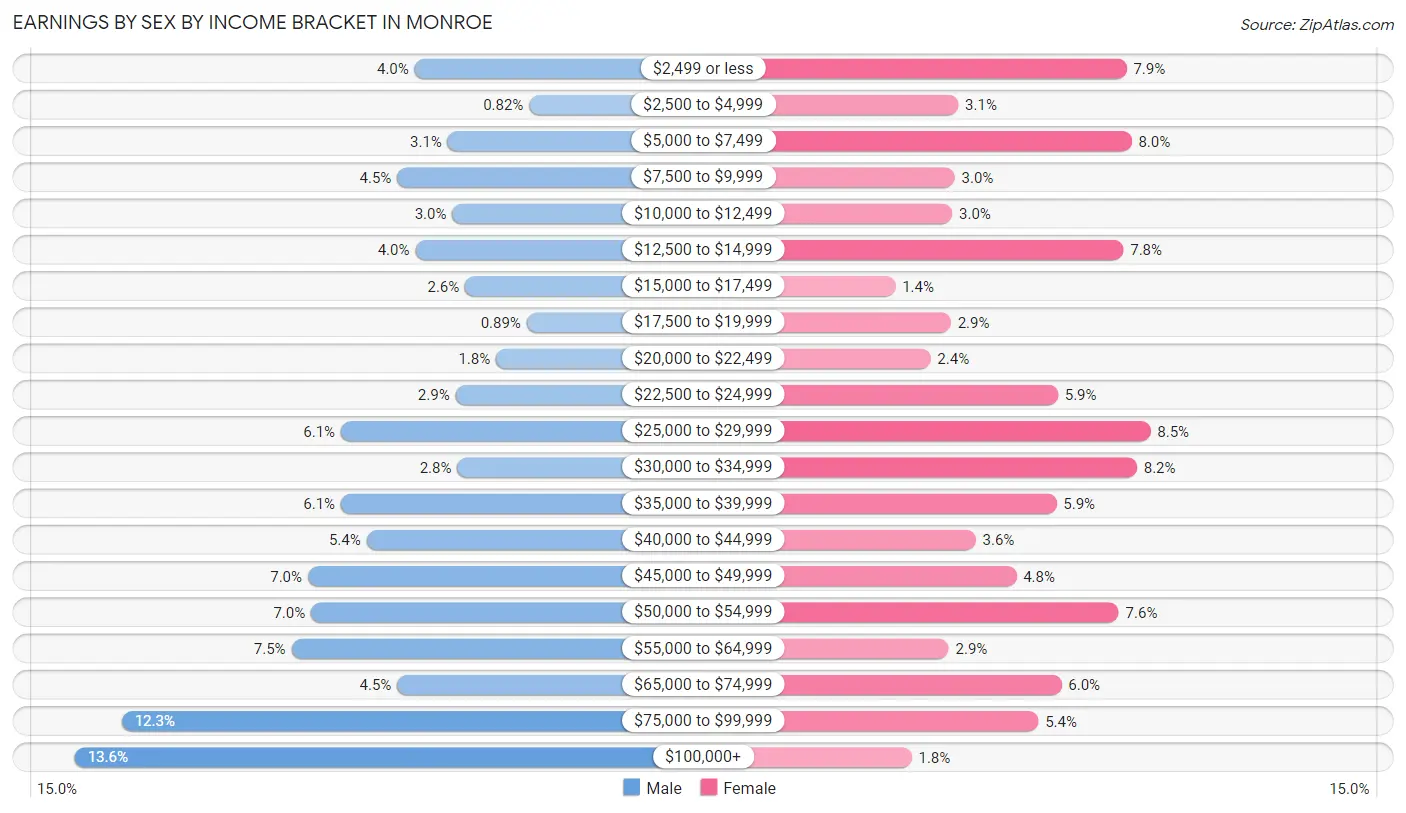
Earnings by Sex by Income Bracket in Monroe
The most common earnings brackets in Monroe are $100,000+ for men (747 | 13.6%) and $25,000 to $29,999 for women (403 | 8.5%).
| Income | Male | Female |
| $2,499 or less | 222 (4.0%) | 371 (7.9%) |
| $2,500 to $4,999 | 45 (0.8%) | 148 (3.1%) |
| $5,000 to $7,499 | 171 (3.1%) | 378 (8.0%) |
| $7,500 to $9,999 | 249 (4.5%) | 143 (3.0%) |
| $10,000 to $12,499 | 164 (3.0%) | 140 (3.0%) |
| $12,500 to $14,999 | 221 (4.0%) | 367 (7.8%) |
| $15,000 to $17,499 | 144 (2.6%) | 64 (1.4%) |
| $17,500 to $19,999 | 49 (0.9%) | 138 (2.9%) |
| $20,000 to $22,499 | 96 (1.8%) | 111 (2.4%) |
| $22,500 to $24,999 | 159 (2.9%) | 280 (5.9%) |
| $25,000 to $29,999 | 336 (6.1%) | 403 (8.5%) |
| $30,000 to $34,999 | 156 (2.8%) | 385 (8.2%) |
| $35,000 to $39,999 | 336 (6.1%) | 278 (5.9%) |
| $40,000 to $44,999 | 296 (5.4%) | 171 (3.6%) |
| $45,000 to $49,999 | 387 (7.0%) | 225 (4.8%) |
| $50,000 to $54,999 | 382 (7.0%) | 361 (7.6%) |
| $55,000 to $64,999 | 412 (7.5%) | 135 (2.9%) |
| $65,000 to $74,999 | 249 (4.5%) | 285 (6.0%) |
| $75,000 to $99,999 | 674 (12.3%) | 254 (5.4%) |
| $100,000+ | 747 (13.6%) | 86 (1.8%) |
| Total | 5,495 (100.0%) | 4,723 (100.0%) |
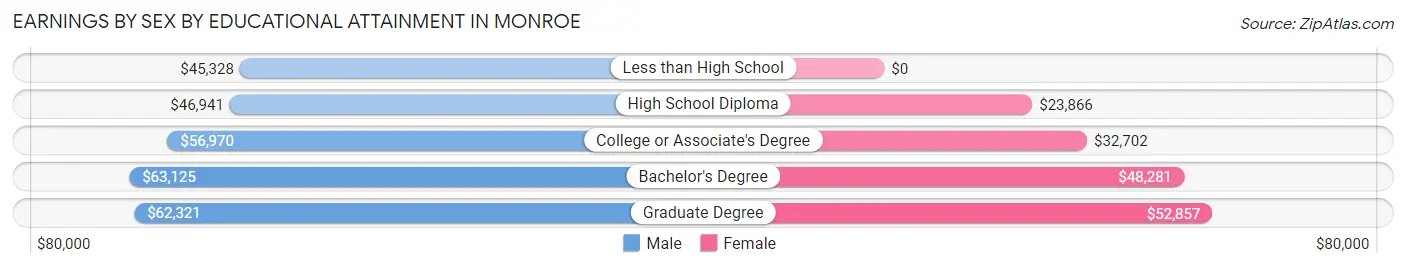
Earnings by Sex by Educational Attainment in Monroe
Average earnings in Monroe are $50,111 for men and $30,315 for women, a difference of 39.5%. Men with an educational attainment of bachelor's degree enjoy the highest average annual earnings of $63,125, while those with less than high school education earn the least with $45,328. Women with an educational attainment of graduate degree earn the most with the average annual earnings of $52,857, while those with high school diploma education have the smallest earnings of $23,866.
| Educational Attainment | Male Income | Female Income |
| Less than High School | $45,328 | $0 |
| High School Diploma | $46,941 | $23,866 |
| College or Associate's Degree | $56,970 | $32,702 |
| Bachelor's Degree | $63,125 | $48,281 |
| Graduate Degree | $62,321 | $52,857 |
| Total | $50,111 | $30,315 |
Family Income in Monroe
Family Income Brackets in Monroe
According to the Monroe family income data, there are 1,044 families falling into the $100,000 to $149,999 income range, which is the most common income bracket and makes up 21.8% of all families. Conversely, the $10,000 to $14,999 income bracket is the least frequent group with only 120 families (2.5%) belonging to this category.
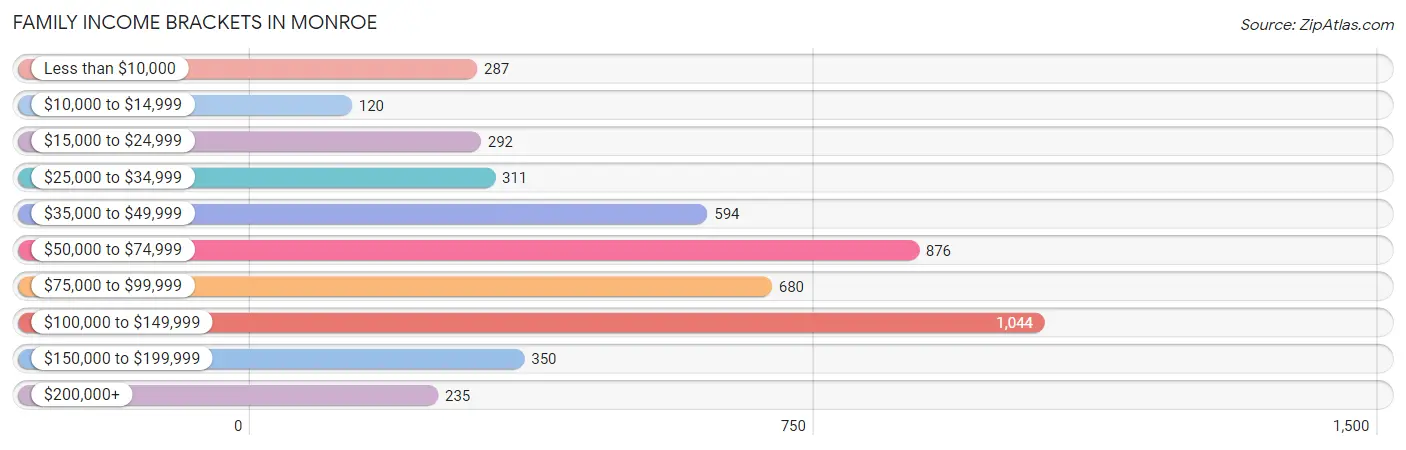
| Income Bracket | # Families | % Families |
| Less than $10,000 | 287 | 6.0% |
| $10,000 to $14,999 | 120 | 2.5% |
| $15,000 to $24,999 | 292 | 6.1% |
| $25,000 to $34,999 | 311 | 6.5% |
| $35,000 to $49,999 | 594 | 12.4% |
| $50,000 to $74,999 | 876 | 18.3% |
| $75,000 to $99,999 | 680 | 14.2% |
| $100,000 to $149,999 | 1,044 | 21.8% |
| $150,000 to $199,999 | 350 | 7.3% |
| $200,000+ | 235 | 4.9% |
Family Income by Famaliy Size in Monroe
5-person families (274 | 5.7%) account for the highest median family income in Monroe with $91,346 per family, while 2-person families (2,143 | 44.8%) have the highest median income of $33,076 per family member.
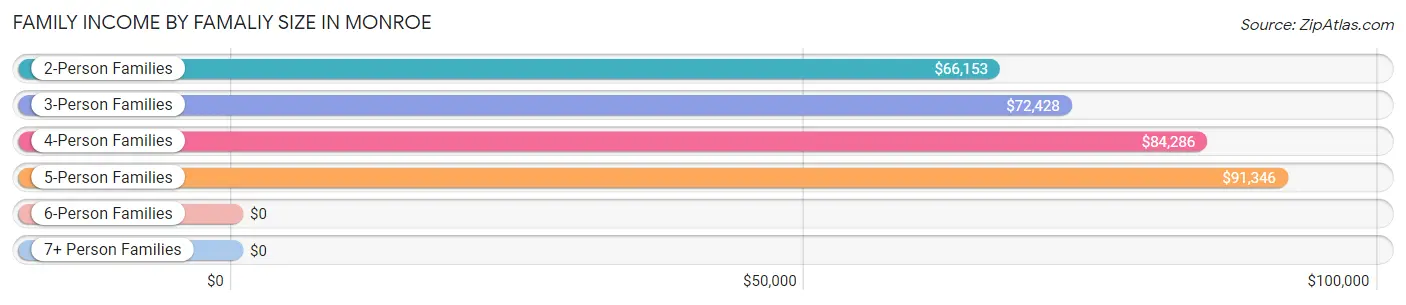
| Income Bracket | # Families | Median Income |
| 2-Person Families | 2,143 (44.8%) | $66,153 |
| 3-Person Families | 1,239 (25.9%) | $72,428 |
| 4-Person Families | 1,020 (21.3%) | $84,286 |
| 5-Person Families | 274 (5.7%) | $91,346 |
| 6-Person Families | 105 (2.2%) | $0 |
| 7+ Person Families | 7 (0.2%) | $0 |
| Total | 4,788 (100.0%) | $72,500 |
Family Income by Number of Earners in Monroe
The median family income in Monroe is $72,500, with families comprising 3+ earners (360) having the highest median family income of $165,781, while families with no earners (802) have the lowest median family income of $39,130, accounting for 7.5% and 16.8% of families, respectively.
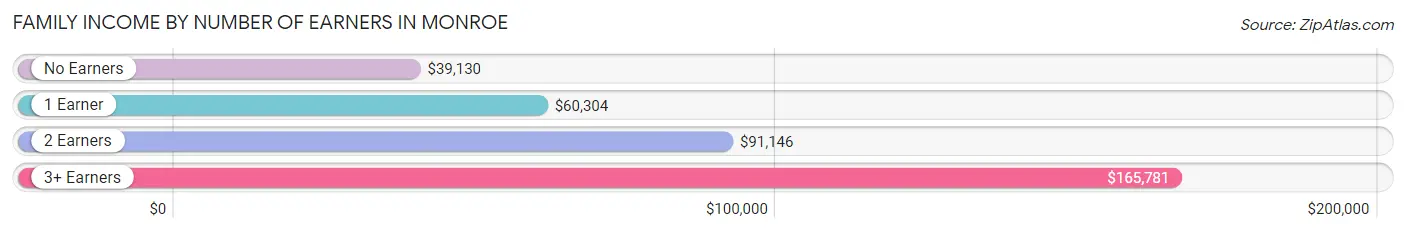
| Number of Earners | # Families | Median Income |
| No Earners | 802 (16.8%) | $39,130 |
| 1 Earner | 1,717 (35.9%) | $60,304 |
| 2 Earners | 1,909 (39.9%) | $91,146 |
| 3+ Earners | 360 (7.5%) | $165,781 |
| Total | 4,788 (100.0%) | $72,500 |
Household Income in Monroe
Household Income Brackets in Monroe
With 1,468 households falling in the category, the $50,000 to $74,999 income range is the most frequent in Monroe, accounting for 17.2% of all households. In contrast, only 256 households (3.0%) fall into the $200,000+ income bracket, making it the least populous group.
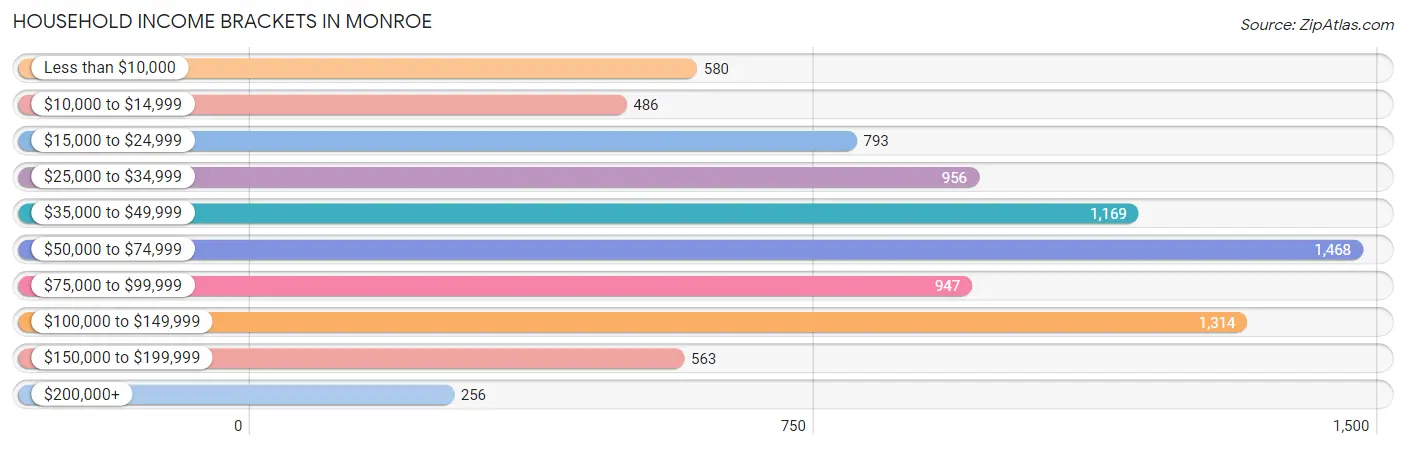
| Income Bracket | # Households | % Households |
| Less than $10,000 | 580 | 6.8% |
| $10,000 to $14,999 | 486 | 5.7% |
| $15,000 to $24,999 | 793 | 9.3% |
| $25,000 to $34,999 | 956 | 11.2% |
| $35,000 to $49,999 | 1,169 | 13.7% |
| $50,000 to $74,999 | 1,468 | 17.2% |
| $75,000 to $99,999 | 947 | 11.1% |
| $100,000 to $149,999 | 1,314 | 15.4% |
| $150,000 to $199,999 | 563 | 6.6% |
| $200,000+ | 256 | 3.0% |
Household Income by Householder Age in Monroe
The median household income in Monroe is $57,779, with the highest median household income of $72,807 found in the 45 to 64 years age bracket for the primary householder. A total of 3,264 households (38.3%) fall into this category. Meanwhile, the 15 to 24 years age bracket for the primary householder has the lowest median household income of $23,966, with 330 households (3.9%) in this group.
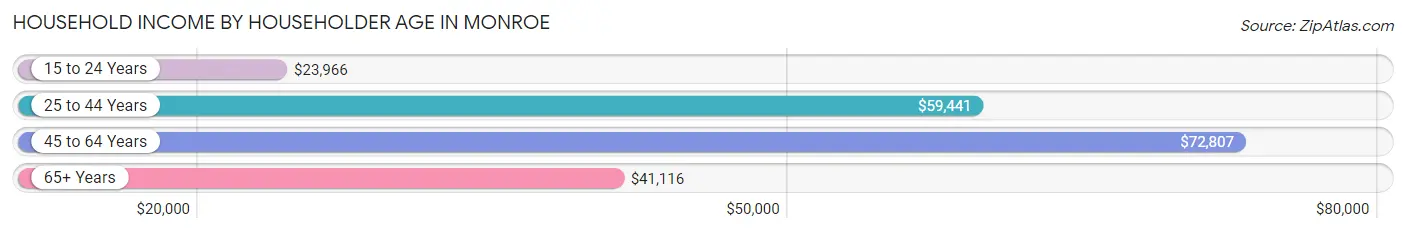
| Income Bracket | # Households | Median Income |
| 15 to 24 Years | 330 (3.9%) | $23,966 |
| 25 to 44 Years | 2,896 (33.9%) | $59,441 |
| 45 to 64 Years | 3,264 (38.3%) | $72,807 |
| 65+ Years | 2,042 (23.9%) | $41,116 |
| Total | 8,532 (100.0%) | $57,779 |
Poverty in Monroe
Income Below Poverty by Sex and Age in Monroe
With 13.3% poverty level for males and 19.3% for females among the residents of Monroe, 6 to 11 year old males and under 5 year old females are the most vulnerable to poverty, with 253 males (32.1%) and 376 females (43.6%) in their respective age groups living below the poverty level.
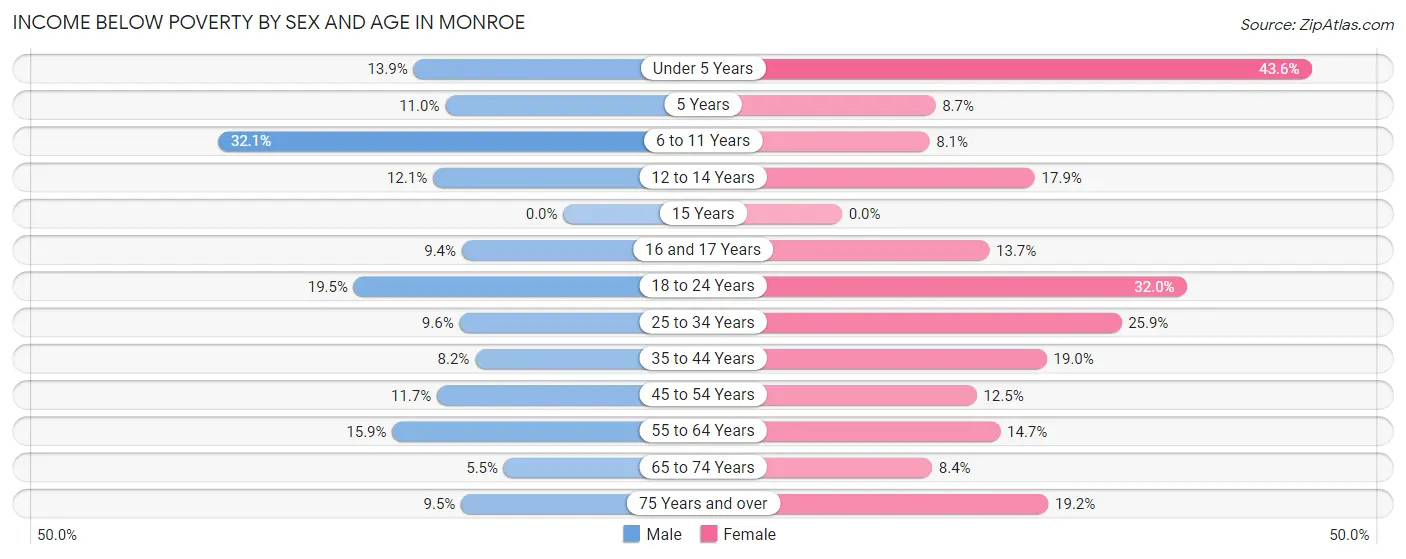
| Age Bracket | Male | Female |
| Under 5 Years | 121 (13.9%) | 376 (43.6%) |
| 5 Years | 24 (11.0%) | 13 (8.7%) |
| 6 to 11 Years | 253 (32.1%) | 58 (8.1%) |
| 12 to 14 Years | 15 (12.1%) | 46 (17.9%) |
| 15 Years | 0 (0.0%) | 0 (0.0%) |
| 16 and 17 Years | 18 (9.4%) | 19 (13.7%) |
| 18 to 24 Years | 163 (19.5%) | 228 (32.0%) |
| 25 to 34 Years | 157 (9.6%) | 461 (25.9%) |
| 35 to 44 Years | 97 (8.2%) | 185 (19.0%) |
| 45 to 54 Years | 143 (11.7%) | 164 (12.5%) |
| 55 to 64 Years | 209 (15.9%) | 204 (14.7%) |
| 65 to 74 Years | 44 (5.5%) | 88 (8.4%) |
| 75 Years and over | 42 (9.5%) | 163 (19.2%) |
| Total | 1,286 (13.3%) | 2,005 (19.3%) |
Income Above Poverty by Sex and Age in Monroe
According to the poverty statistics in Monroe, males aged 15 years and females aged 15 years are the age groups that are most secure financially, with 100.0% of males and 100.0% of females in these age groups living above the poverty line.
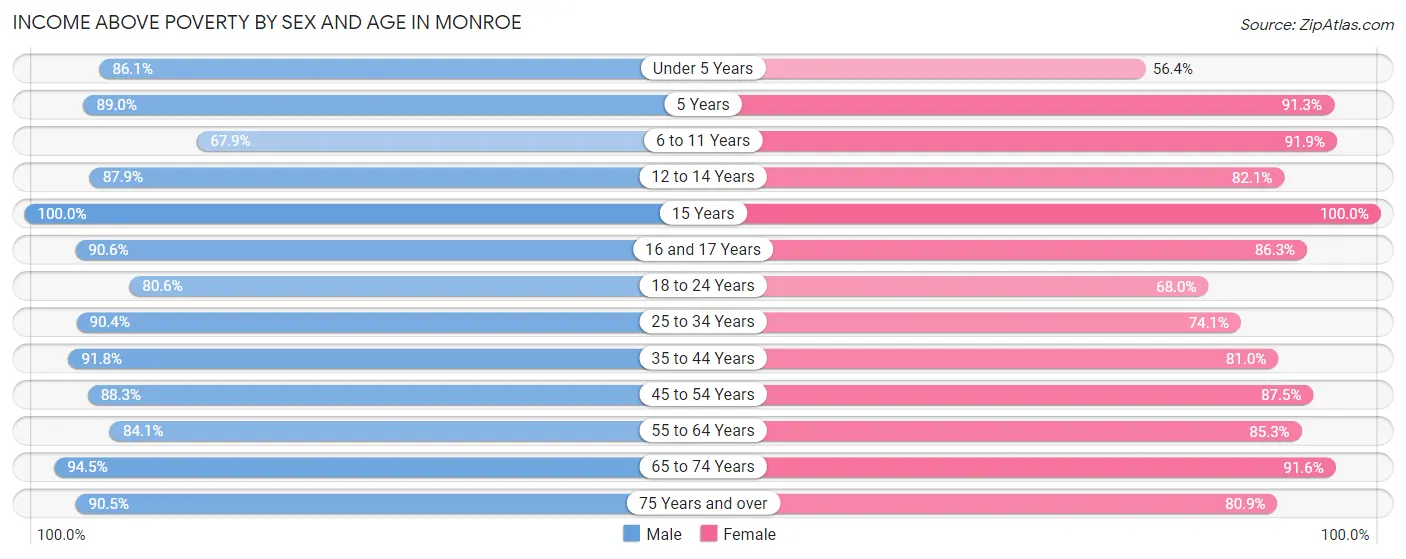
| Age Bracket | Male | Female |
| Under 5 Years | 749 (86.1%) | 487 (56.4%) |
| 5 Years | 195 (89.0%) | 137 (91.3%) |
| 6 to 11 Years | 536 (67.9%) | 656 (91.9%) |
| 12 to 14 Years | 109 (87.9%) | 211 (82.1%) |
| 15 Years | 81 (100.0%) | 186 (100.0%) |
| 16 and 17 Years | 173 (90.6%) | 120 (86.3%) |
| 18 to 24 Years | 675 (80.5%) | 485 (68.0%) |
| 25 to 34 Years | 1,471 (90.4%) | 1,317 (74.1%) |
| 35 to 44 Years | 1,089 (91.8%) | 788 (81.0%) |
| 45 to 54 Years | 1,077 (88.3%) | 1,148 (87.5%) |
| 55 to 64 Years | 1,108 (84.1%) | 1,185 (85.3%) |
| 65 to 74 Years | 753 (94.5%) | 965 (91.6%) |
| 75 Years and over | 401 (90.5%) | 688 (80.8%) |
| Total | 8,417 (86.8%) | 8,373 (80.7%) |
Income Below Poverty Among Married-Couple Families in Monroe
The poverty statistics for married-couple families in Monroe show that 4.4% or 142 of the total 3,216 families live below the poverty line. Families with 1 or 2 children have the highest poverty rate of 7.3%, comprising of 87 families. On the other hand, families with 5 or more children have the lowest poverty rate of 0.0%, which includes 0 families.
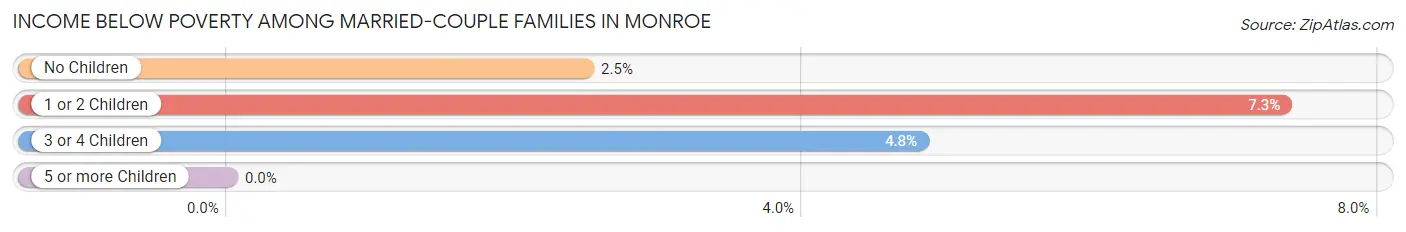
| Children | Above Poverty | Below Poverty |
| No Children | 1,771 (97.5%) | 45 (2.5%) |
| 1 or 2 Children | 1,098 (92.7%) | 87 (7.3%) |
| 3 or 4 Children | 198 (95.2%) | 10 (4.8%) |
| 5 or more Children | 7 (100.0%) | 0 (0.0%) |
| Total | 3,074 (95.6%) | 142 (4.4%) |
Income Below Poverty Among Single-Parent Households in Monroe
According to the poverty data in Monroe, 7.1% or 31 single-father households and 37.9% or 431 single-mother households are living below the poverty line. Among single-father households, those with 1 or 2 children have the highest poverty rate, with 31 households (10.8%) experiencing poverty. Likewise, among single-mother households, those with 3 or 4 children have the highest poverty rate, with 57 households (67.9%) falling below the poverty line.
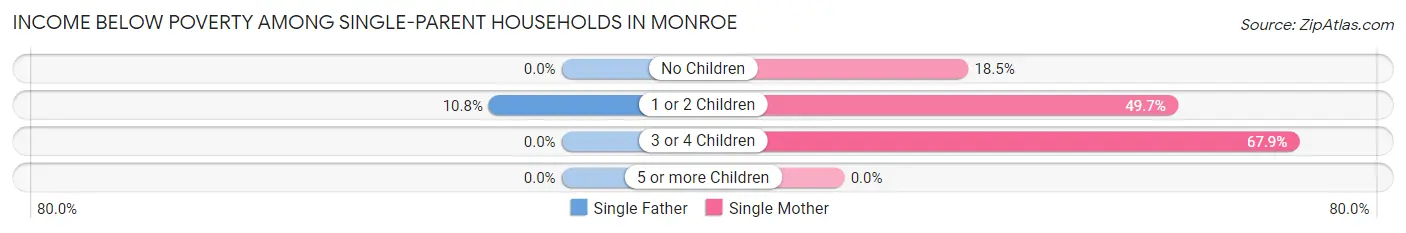
| Children | Single Father | Single Mother |
| No Children | 0 (0.0%) | 88 (18.4%) |
| 1 or 2 Children | 31 (10.8%) | 286 (49.7%) |
| 3 or 4 Children | 0 (0.0%) | 57 (67.9%) |
| 5 or more Children | 0 (0.0%) | 0 (0.0%) |
| Total | 31 (7.1%) | 431 (37.9%) |
Income Below Poverty Among Married-Couple vs Single-Parent Households in Monroe
The poverty data for Monroe shows that 142 of the married-couple family households (4.4%) and 462 of the single-parent households (29.4%) are living below the poverty level. Within the married-couple family households, those with 1 or 2 children have the highest poverty rate, with 87 households (7.3%) falling below the poverty line. Among the single-parent households, those with 3 or 4 children have the highest poverty rate, with 57 household (60.0%) living below poverty.
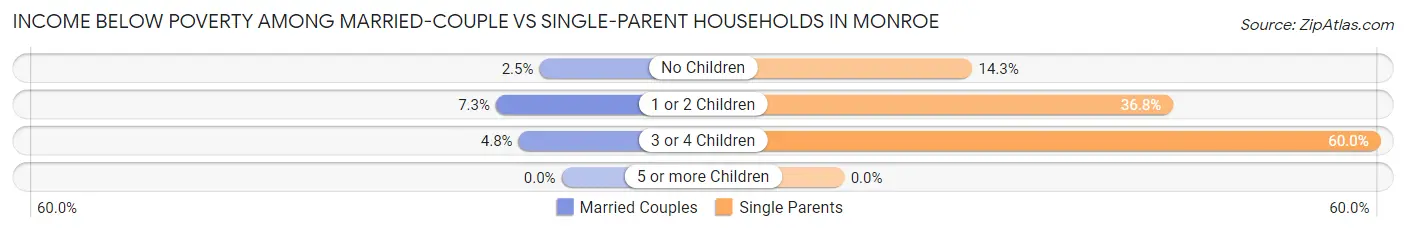
| Children | Married-Couple Families | Single-Parent Households |
| No Children | 45 (2.5%) | 88 (14.3%) |
| 1 or 2 Children | 87 (7.3%) | 317 (36.8%) |
| 3 or 4 Children | 10 (4.8%) | 57 (60.0%) |
| 5 or more Children | 0 (0.0%) | 0 (0.0%) |
| Total | 142 (4.4%) | 462 (29.4%) |
Race in Monroe
The most populous races in Monroe are White / Caucasian (17,772 | 87.1%), Black / African American (1,299 | 6.4%), and Two or more Races (854 | 4.2%).
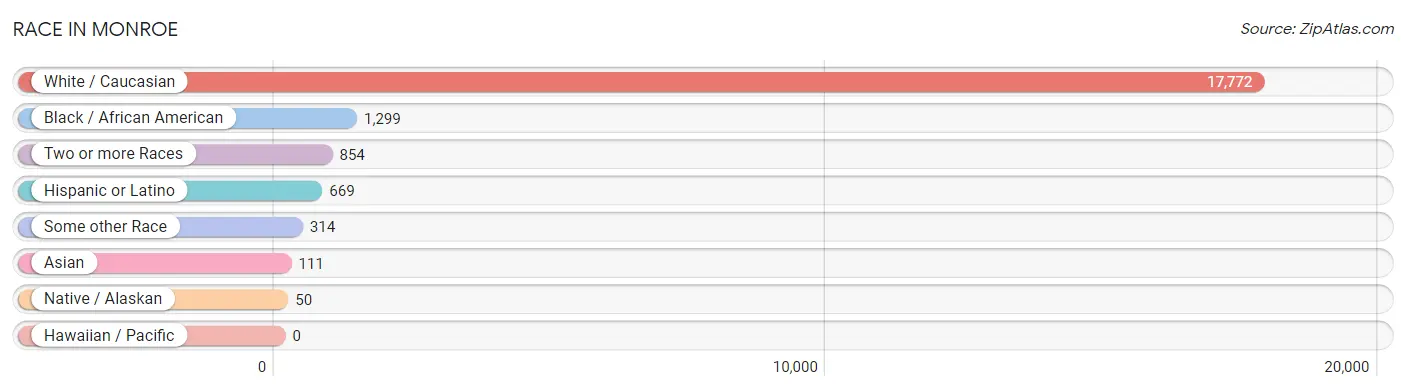
| Race | # Population | % Population |
| Asian | 111 | 0.5% |
| Black / African American | 1,299 | 6.4% |
| Hawaiian / Pacific | 0 | 0.0% |
| Hispanic or Latino | 669 | 3.3% |
| Native / Alaskan | 50 | 0.3% |
| White / Caucasian | 17,772 | 87.1% |
| Two or more Races | 854 | 4.2% |
| Some other Race | 314 | 1.5% |
| Total | 20,400 | 100.0% |
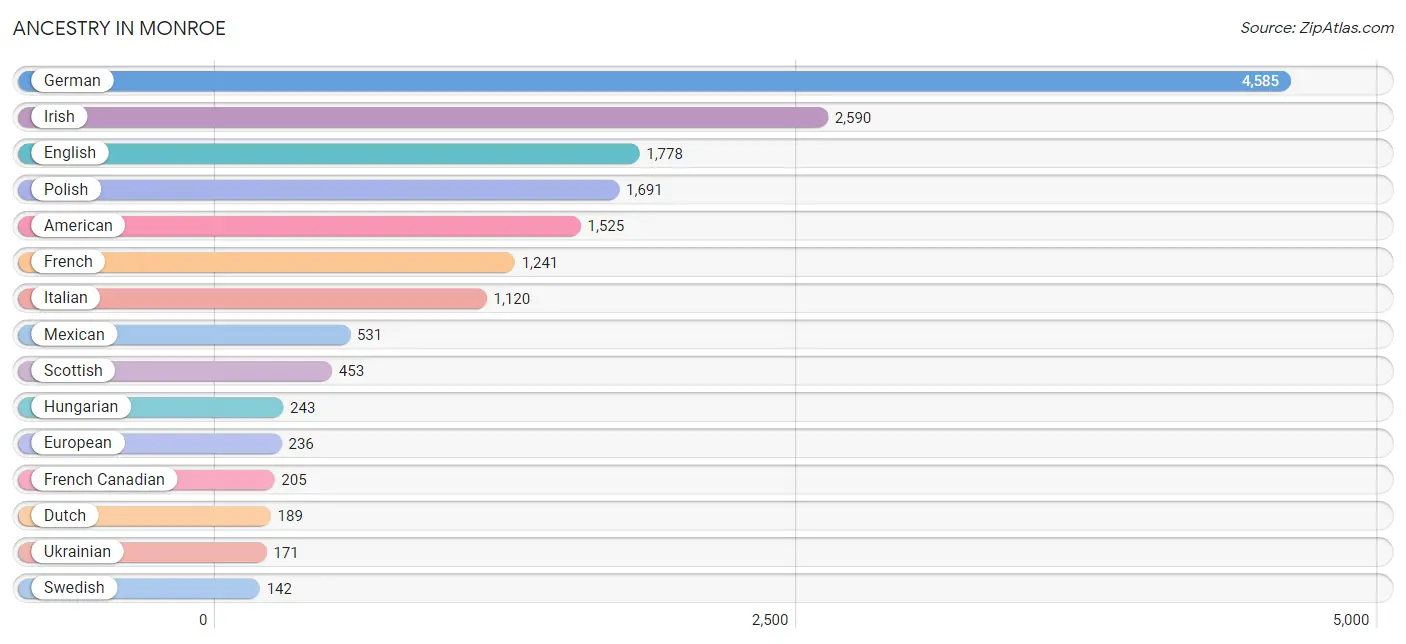
Ancestry in Monroe
The most populous ancestries reported in Monroe are German (4,585 | 22.5%), Irish (2,590 | 12.7%), English (1,778 | 8.7%), Polish (1,691 | 8.3%), and American (1,525 | 7.5%), together accounting for 59.7% of all Monroe residents.
| Ancestry | # Population | % Population |
| African | 21 | 0.1% |
| Albanian | 136 | 0.7% |
| American | 1,525 | 7.5% |
| Arab | 64 | 0.3% |
| Armenian | 17 | 0.1% |
| Australian | 36 | 0.2% |
| Austrian | 25 | 0.1% |
| Belgian | 140 | 0.7% |
| Bhutanese | 35 | 0.2% |
| Blackfeet | 9 | 0.0% |
| Brazilian | 53 | 0.3% |
| British | 111 | 0.5% |
| Burmese | 29 | 0.1% |
| Canadian | 76 | 0.4% |
| Central American | 26 | 0.1% |
| Cherokee | 58 | 0.3% |
| Chippewa | 20 | 0.1% |
| Colombian | 34 | 0.2% |
| Comanche | 1 | 0.0% |
| Creek | 3 | 0.0% |
| Croatian | 28 | 0.1% |
| Cuban | 8 | 0.0% |
| Czech | 33 | 0.2% |
| Czechoslovakian | 2 | 0.0% |
| Danish | 71 | 0.4% |
| Dominican | 2 | 0.0% |
| Dutch | 189 | 0.9% |
| Dutch West Indian | 35 | 0.2% |
| Eastern European | 87 | 0.4% |
| Ecuadorian | 26 | 0.1% |
| English | 1,778 | 8.7% |
| European | 236 | 1.2% |
| Finnish | 44 | 0.2% |
| French | 1,241 | 6.1% |
| French Canadian | 205 | 1.0% |
| German | 4,585 | 22.5% |
| Greek | 102 | 0.5% |
| Hungarian | 243 | 1.2% |
| Indian (Asian) | 13 | 0.1% |
| Irish | 2,590 | 12.7% |
| Italian | 1,120 | 5.5% |
| Jamaican | 1 | 0.0% |
| Korean | 29 | 0.1% |
| Laotian | 4 | 0.0% |
| Lebanese | 9 | 0.0% |
| Lithuanian | 7 | 0.0% |
| Macedonian | 23 | 0.1% |
| Mexican | 531 | 2.6% |
| Mexican American Indian | 19 | 0.1% |
| Nicaraguan | 26 | 0.1% |
| Norwegian | 51 | 0.3% |
| Ottawa | 6 | 0.0% |
| Polish | 1,691 | 8.3% |
| Potawatomi | 3 | 0.0% |
| Puerto Rican | 33 | 0.2% |
| Russian | 35 | 0.2% |
| Scandinavian | 18 | 0.1% |
| Scotch-Irish | 107 | 0.5% |
| Scottish | 453 | 2.2% |
| Serbian | 122 | 0.6% |
| Slovak | 28 | 0.1% |
| Slovene | 6 | 0.0% |
| South American | 60 | 0.3% |
| Spanish | 9 | 0.0% |
| Subsaharan African | 21 | 0.1% |
| Swedish | 142 | 0.7% |
| Swiss | 28 | 0.1% |
| Thai | 20 | 0.1% |
| Turkish | 38 | 0.2% |
| Ukrainian | 171 | 0.8% |
| Welsh | 48 | 0.2% |
| Yugoslavian | 60 | 0.3% | View All 72 Rows |
Immigrants in Monroe
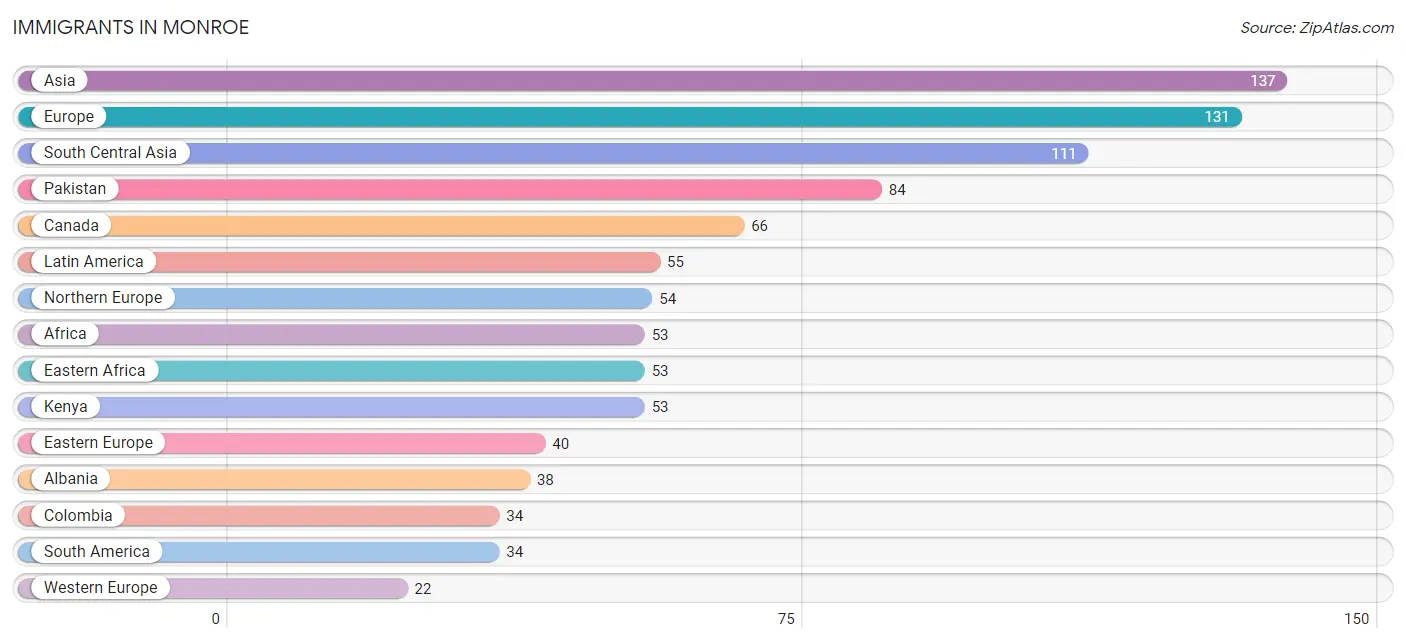
The most numerous immigrant groups reported in Monroe came from Asia (137 | 0.7%), Europe (131 | 0.6%), South Central Asia (111 | 0.5%), Pakistan (84 | 0.4%), and Canada (66 | 0.3%), together accounting for 2.6% of all Monroe residents.
| Immigration Origin | # Population | % Population |
| Africa | 53 | 0.3% |
| Albania | 38 | 0.2% |
| Asia | 137 | 0.7% |
| Australia | 13 | 0.1% |
| Canada | 66 | 0.3% |
| Caribbean | 9 | 0.0% |
| Central America | 12 | 0.1% |
| China | 7 | 0.0% |
| Colombia | 34 | 0.2% |
| Cuba | 8 | 0.0% |
| Eastern Africa | 53 | 0.3% |
| Eastern Asia | 19 | 0.1% |
| Eastern Europe | 40 | 0.2% |
| England | 9 | 0.0% |
| Europe | 131 | 0.6% |
| France | 7 | 0.0% |
| Hong Kong | 7 | 0.0% |
| India | 13 | 0.1% |
| Iraq | 7 | 0.0% |
| Ireland | 18 | 0.1% |
| Italy | 15 | 0.1% |
| Jamaica | 1 | 0.0% |
| Kenya | 53 | 0.3% |
| Korea | 12 | 0.1% |
| Latin America | 55 | 0.3% |
| Mexico | 12 | 0.1% |
| Netherlands | 15 | 0.1% |
| Northern Europe | 54 | 0.3% |
| Oceania | 13 | 0.1% |
| Pakistan | 84 | 0.4% |
| Russia | 2 | 0.0% |
| South America | 34 | 0.2% |
| South Central Asia | 111 | 0.5% |
| Southern Europe | 15 | 0.1% |
| Sri Lanka | 14 | 0.1% |
| Western Asia | 7 | 0.0% |
| Western Europe | 22 | 0.1% | View All 37 Rows |
Sex and Age in Monroe
Sex and Age in Monroe
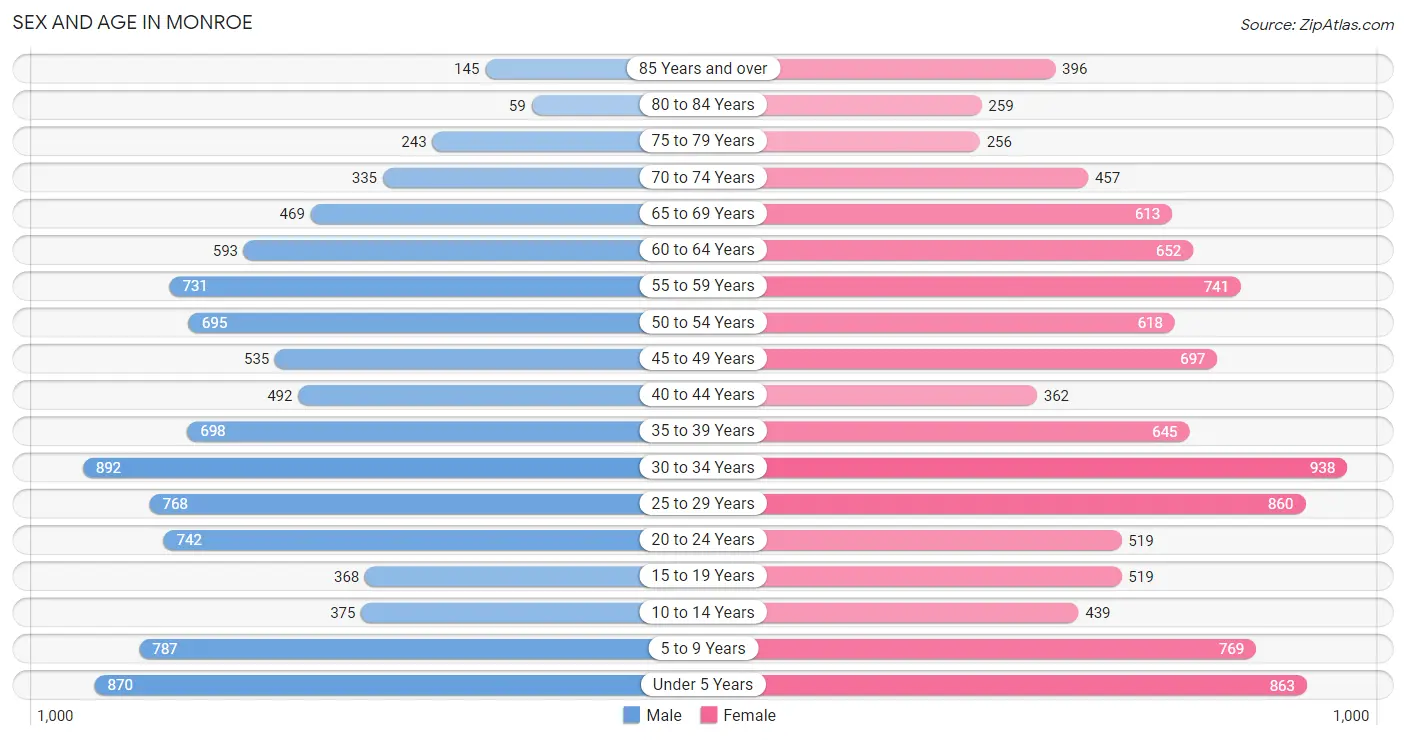
The most populous age groups in Monroe are 30 to 34 Years (892 | 9.1%) for men and 30 to 34 Years (938 | 8.8%) for women.
| Age Bracket | Male | Female |
| Under 5 Years | 870 (8.9%) | 863 (8.1%) |
| 5 to 9 Years | 787 (8.0%) | 769 (7.2%) |
| 10 to 14 Years | 375 (3.8%) | 439 (4.1%) |
| 15 to 19 Years | 368 (3.8%) | 519 (4.9%) |
| 20 to 24 Years | 742 (7.6%) | 519 (4.9%) |
| 25 to 29 Years | 768 (7.8%) | 860 (8.1%) |
| 30 to 34 Years | 892 (9.1%) | 938 (8.8%) |
| 35 to 39 Years | 698 (7.1%) | 645 (6.1%) |
| 40 to 44 Years | 492 (5.0%) | 362 (3.4%) |
| 45 to 49 Years | 535 (5.5%) | 697 (6.6%) |
| 50 to 54 Years | 695 (7.1%) | 618 (5.8%) |
| 55 to 59 Years | 731 (7.5%) | 741 (7.0%) |
| 60 to 64 Years | 593 (6.0%) | 652 (6.1%) |
| 65 to 69 Years | 469 (4.8%) | 613 (5.8%) |
| 70 to 74 Years | 335 (3.4%) | 457 (4.3%) |
| 75 to 79 Years | 243 (2.5%) | 256 (2.4%) |
| 80 to 84 Years | 59 (0.6%) | 259 (2.4%) |
| 85 Years and over | 145 (1.5%) | 396 (3.7%) |
| Total | 9,797 (100.0%) | 10,603 (100.0%) |
Families and Households in Monroe
Median Family Size in Monroe
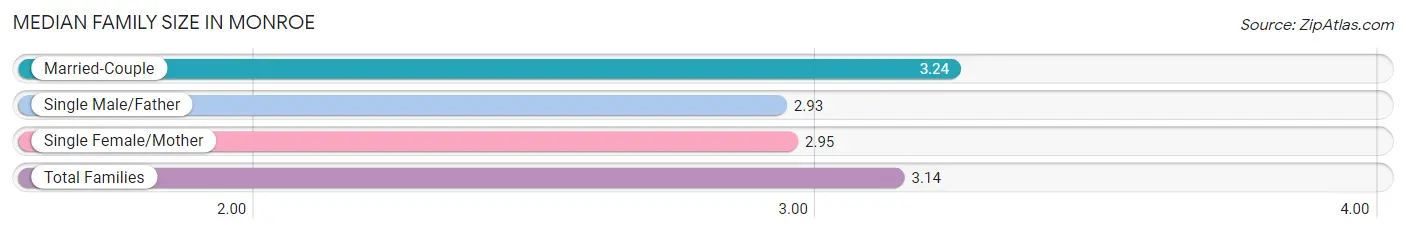
The median family size in Monroe is 3.14 persons per family, with married-couple families (3,216 | 67.2%) accounting for the largest median family size of 3.24 persons per family. On the other hand, single male/father families (436 | 9.1%) represent the smallest median family size with 2.93 persons per family.
| Family Type | # Families | Family Size |
| Married-Couple | 3,216 (67.2%) | 3.24 |
| Single Male/Father | 436 (9.1%) | 2.93 |
| Single Female/Mother | 1,136 (23.7%) | 2.95 |
| Total Families | 4,788 (100.0%) | 3.14 |
Median Household Size in Monroe
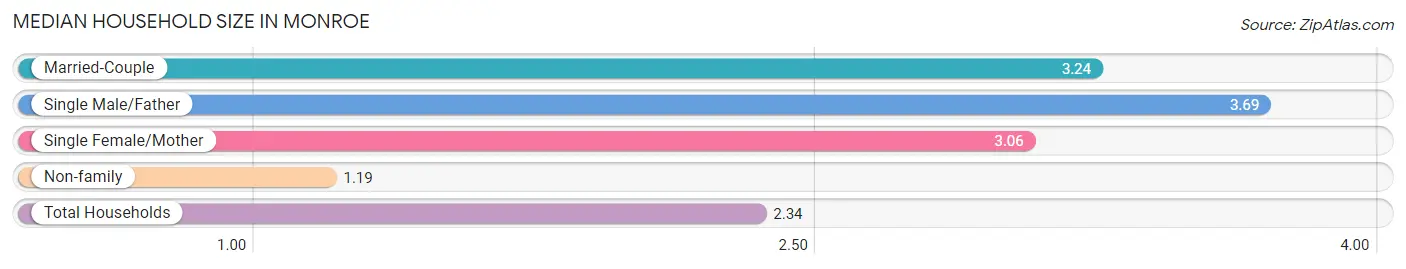
The median household size in Monroe is 2.34 persons per household, with single male/father households (436 | 5.1%) accounting for the largest median household size of 3.69 persons per household. non-family households (3,744 | 43.9%) represent the smallest median household size with 1.19 persons per household.
| Household Type | # Households | Household Size |
| Married-Couple | 3,216 (37.7%) | 3.24 |
| Single Male/Father | 436 (5.1%) | 3.69 |
| Single Female/Mother | 1,136 (13.3%) | 3.06 |
| Non-family | 3,744 (43.9%) | 1.19 |
| Total Households | 8,532 (100.0%) | 2.34 |
Household Size by Marriage Status in Monroe
Out of a total of 8,532 households in Monroe, 4,788 (56.1%) are family households, while 3,744 (43.9%) are nonfamily households. The most numerous type of family households are 2-person households, comprising 2,036, and the most common type of nonfamily households are 1-person households, comprising 3,119.
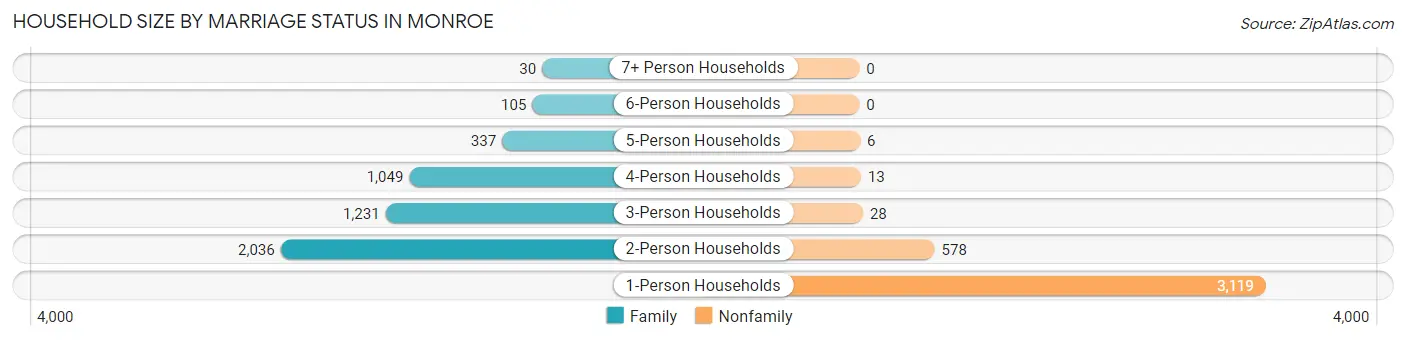
| Household Size | Family Households | Nonfamily Households |
| 1-Person Households | - | 3,119 (36.6%) |
| 2-Person Households | 2,036 (23.9%) | 578 (6.8%) |
| 3-Person Households | 1,231 (14.4%) | 28 (0.3%) |
| 4-Person Households | 1,049 (12.3%) | 13 (0.2%) |
| 5-Person Households | 337 (4.0%) | 6 (0.1%) |
| 6-Person Households | 105 (1.2%) | 0 (0.0%) |
| 7+ Person Households | 30 (0.4%) | 0 (0.0%) |
| Total | 4,788 (56.1%) | 3,744 (43.9%) |
Female Fertility in Monroe
Fertility by Age in Monroe
Average fertility rate in Monroe is 56.0 births per 1,000 women. Women in the age bracket of 20 to 34 years have the highest fertility rate with 90.0 births per 1,000 women. Women in the age bracket of 20 to 34 years acount for 80.9% of all women with births.
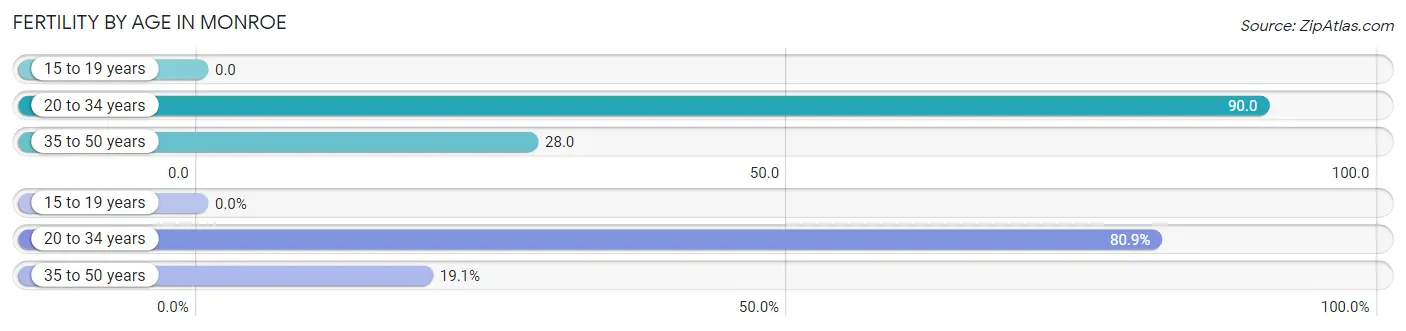
| Age Bracket | Women with Births | Births / 1,000 Women |
| 15 to 19 years | 0 (0.0%) | 0.0 |
| 20 to 34 years | 208 (80.9%) | 90.0 |
| 35 to 50 years | 49 (19.1%) | 28.0 |
| Total | 257 (100.0%) | 56.0 |
Fertility by Age by Marriage Status in Monroe
66.5% of women with births (257) in Monroe are married. The highest percentage of unmarried women with births falls into 35 to 50 years age bracket with 53.1% of them unmarried at the time of birth, while the lowest percentage of unmarried women with births belong to 20 to 34 years age bracket with 28.8% of them unmarried.
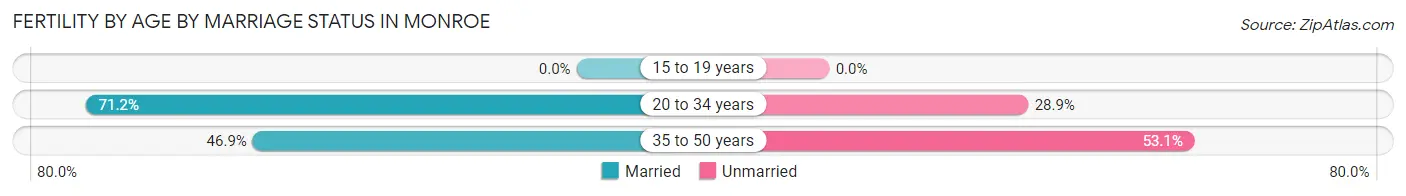
| Age Bracket | Married | Unmarried |
| 15 to 19 years | 0 (0.0%) | 0 (0.0%) |
| 20 to 34 years | 148 (71.2%) | 60 (28.8%) |
| 35 to 50 years | 23 (46.9%) | 26 (53.1%) |
| Total | 171 (66.5%) | 86 (33.5%) |
Fertility by Education in Monroe
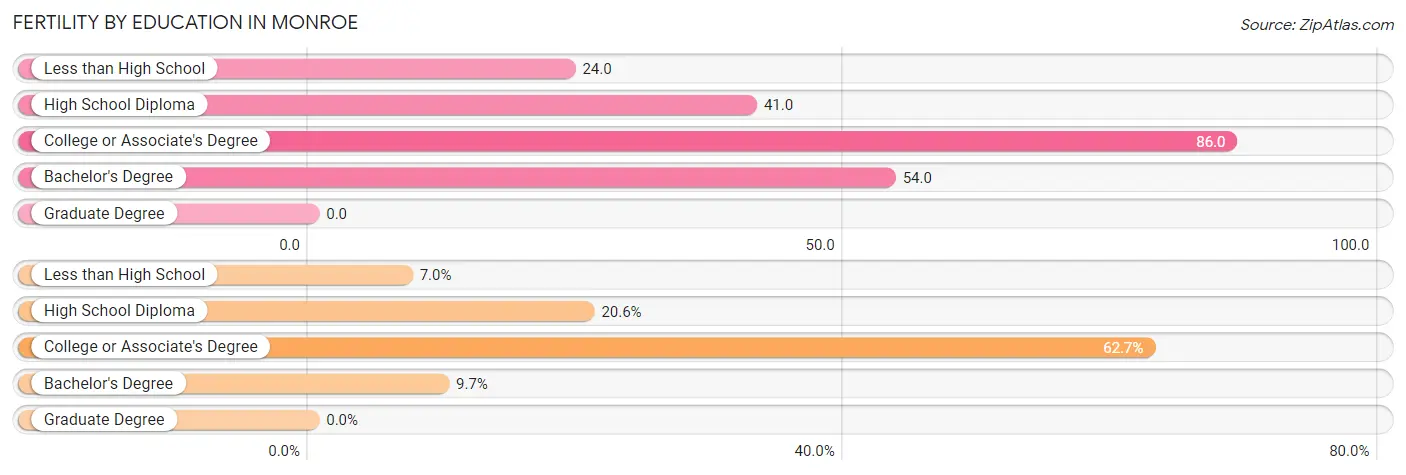
| Educational Attainment | Women with Births | Births / 1,000 Women |
| Less than High School | 18 (7.0%) | 24.0 |
| High School Diploma | 53 (20.6%) | 41.0 |
| College or Associate's Degree | 161 (62.6%) | 86.0 |
| Bachelor's Degree | 25 (9.7%) | 54.0 |
| Graduate Degree | 0 (0.0%) | 0.0 |
| Total | 257 (100.0%) | 56.0 |
Fertility by Education by Marriage Status in Monroe
33.5% of women with births in Monroe are unmarried. Women with the educational attainment of bachelor's degree are most likely to be married with 100.0% of them married at childbirth, while women with the educational attainment of less than high school are least likely to be married with 100.0% of them unmarried at childbirth.
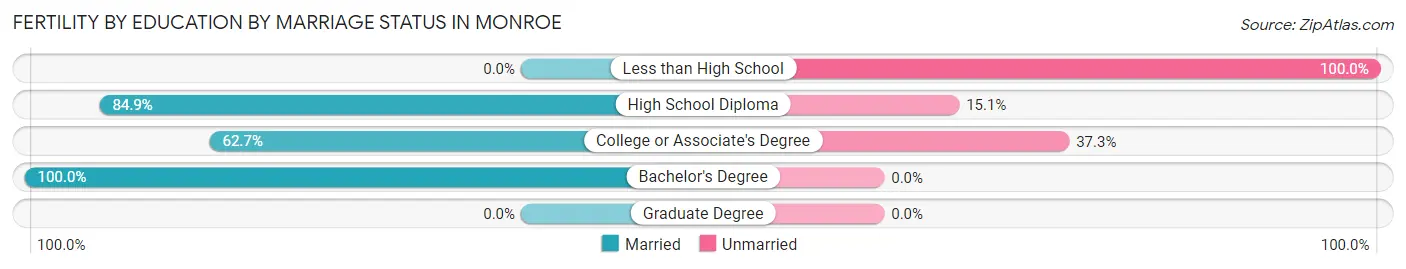
| Educational Attainment | Married | Unmarried |
| Less than High School | 0 (0.0%) | 18 (100.0%) |
| High School Diploma | 45 (84.9%) | 8 (15.1%) |
| College or Associate's Degree | 101 (62.7%) | 60 (37.3%) |
| Bachelor's Degree | 25 (100.0%) | 0 (0.0%) |
| Graduate Degree | 0 (0.0%) | 0 (0.0%) |
| Total | 171 (66.5%) | 86 (33.5%) |
Employment Characteristics in Monroe
Employment by Class of Employer in Monroe
Among the 8,576 employed individuals in Monroe, private company employees (6,263 | 73.0%), not-for-profit organizations (979 | 11.4%), and local government employees (554 | 6.5%) make up the most common classes of employment.
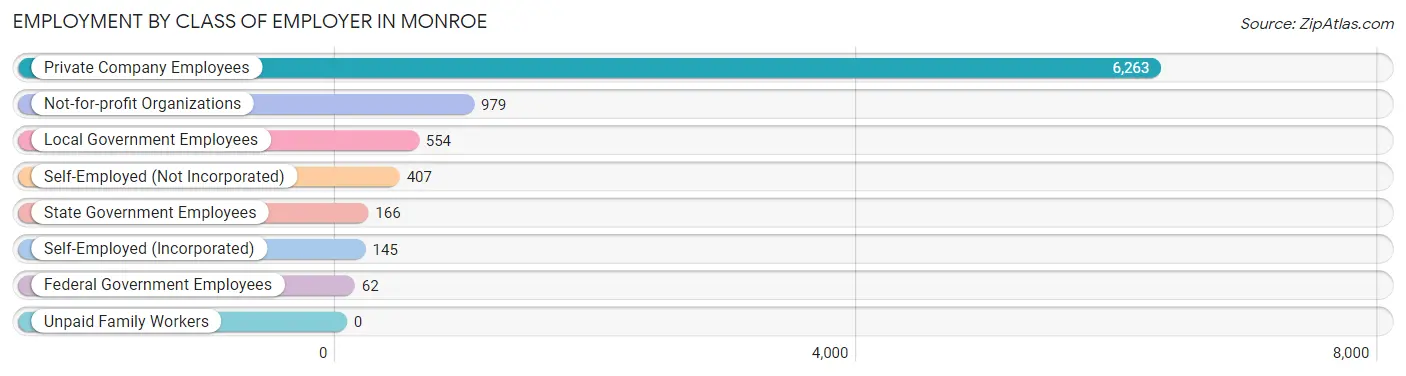
| Employer Class | # Employees | % Employees |
| Private Company Employees | 6,263 | 73.0% |
| Self-Employed (Incorporated) | 145 | 1.7% |
| Self-Employed (Not Incorporated) | 407 | 4.8% |
| Not-for-profit Organizations | 979 | 11.4% |
| Local Government Employees | 554 | 6.5% |
| State Government Employees | 166 | 1.9% |
| Federal Government Employees | 62 | 0.7% |
| Unpaid Family Workers | 0 | 0.0% |
| Total | 8,576 | 100.0% |
Employment Status by Age in Monroe
According to the labor force statistics for Monroe, out of the total population over 16 years of age (16,030), 59.4% or 9,522 individuals are in the labor force, with 7.8% or 743 of them unemployed. The age group with the highest labor force participation rate is 20 to 24 years, with 85.5% or 1,078 individuals in the labor force. Within the labor force, the 75 years and over age range has the highest percentage of unemployed individuals, with 100.0% or 12 of them being unemployed.
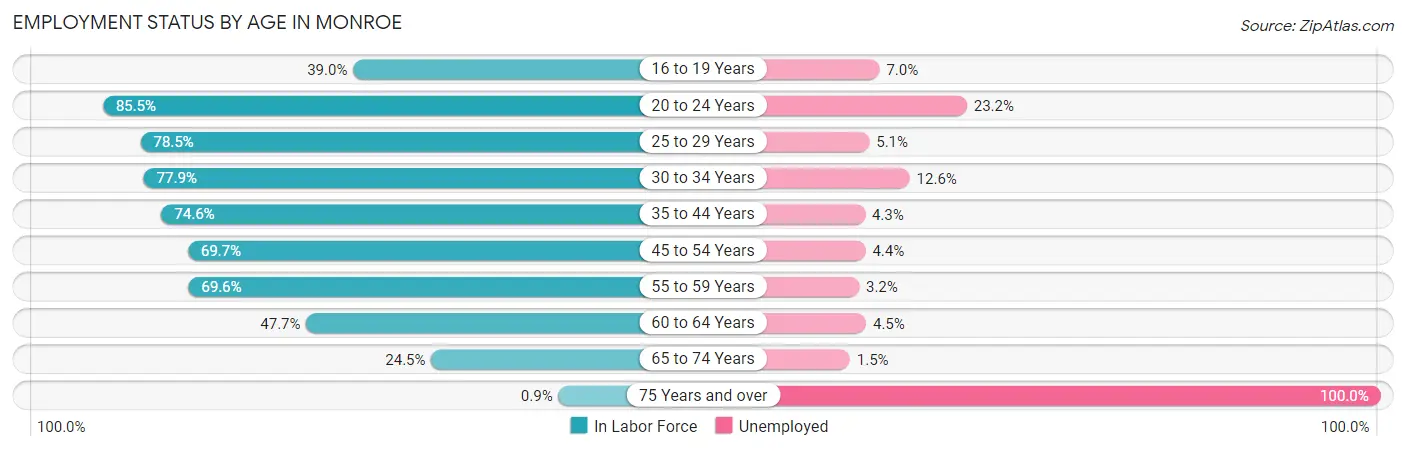
| Age Bracket | In Labor Force | Unemployed |
| 16 to 19 Years | 242 (39.0%) | 17 (7.0%) |
| 20 to 24 Years | 1,078 (85.5%) | 250 (23.2%) |
| 25 to 29 Years | 1,278 (78.5%) | 65 (5.1%) |
| 30 to 34 Years | 1,426 (77.9%) | 180 (12.6%) |
| 35 to 44 Years | 1,639 (74.6%) | 70 (4.3%) |
| 45 to 54 Years | 1,774 (69.7%) | 78 (4.4%) |
| 55 to 59 Years | 1,025 (69.6%) | 33 (3.2%) |
| 60 to 64 Years | 594 (47.7%) | 27 (4.5%) |
| 65 to 74 Years | 459 (24.5%) | 7 (1.5%) |
| 75 Years and over | 12 (0.9%) | 12 (100.0%) |
| Total | 9,522 (59.4%) | 743 (7.8%) |
Employment Status by Educational Attainment in Monroe
According to labor force statistics for Monroe, 70.8% of individuals (7,729) out of the total population between 25 and 64 years of age (10,917) are in the labor force, with 5.9% or 456 of them being unemployed. The group with the highest labor force participation rate are those with the educational attainment of bachelor's degree or higher, with 81.2% or 1,661 individuals in the labor force. Within the labor force, individuals with high school diploma education have the highest percentage of unemployment, with 13.5% or 302 of them being unemployed.
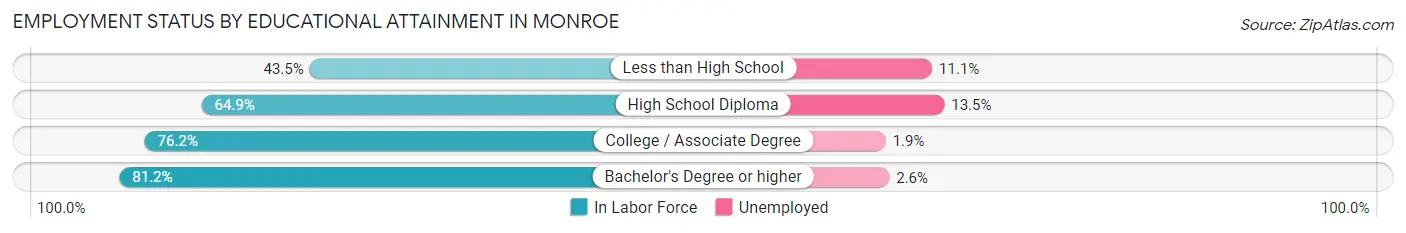
| Educational Attainment | In Labor Force | Unemployed |
| Less than High School | 397 (43.5%) | 101 (11.1%) |
| High School Diploma | 2,234 (64.9%) | 465 (13.5%) |
| College / Associate Degree | 3,443 (76.2%) | 86 (1.9%) |
| Bachelor's Degree or higher | 1,661 (81.2%) | 53 (2.6%) |
| Total | 7,729 (70.8%) | 644 (5.9%) |
Employment Occupations by Sex in Monroe
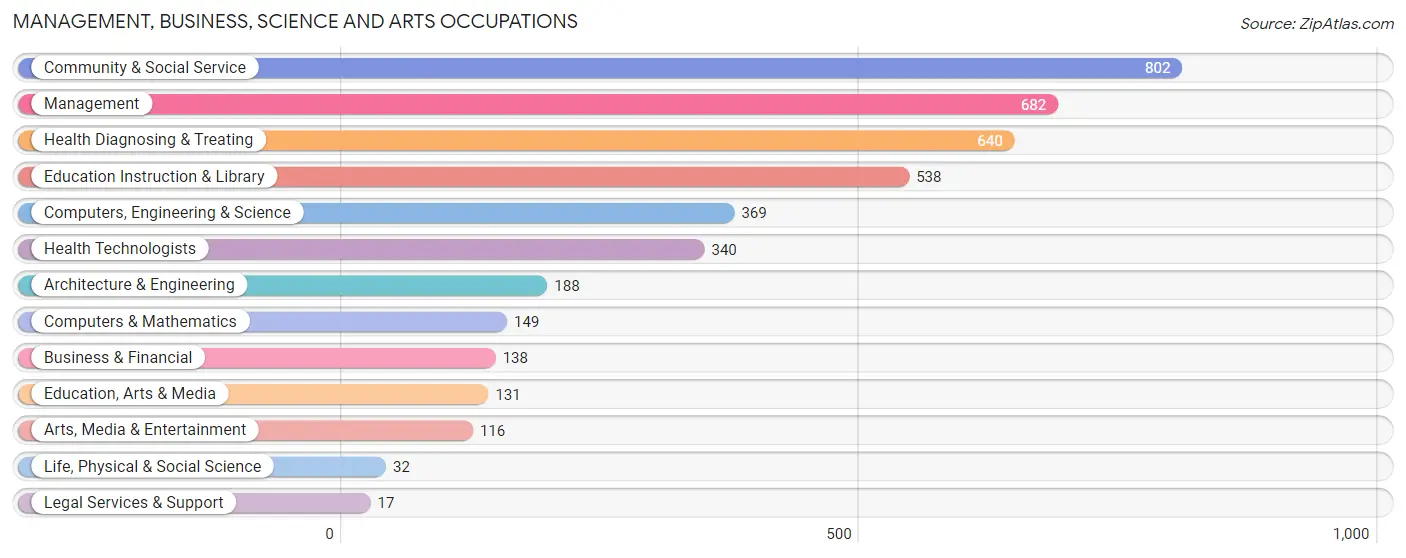
Management, Business, Science and Arts Occupations
The most common Management, Business, Science and Arts occupations in Monroe are Community & Social Service (802 | 9.1%), Management (682 | 7.8%), Health Diagnosing & Treating (640 | 7.3%), Education Instruction & Library (538 | 6.1%), and Computers, Engineering & Science (369 | 4.2%).
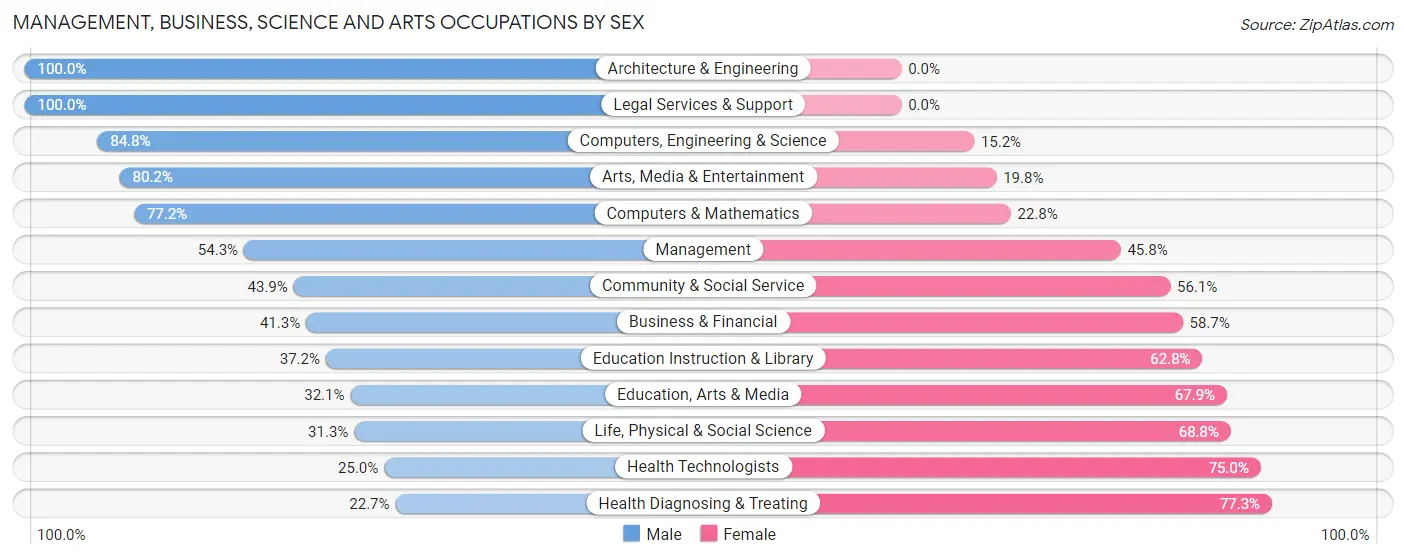
Management, Business, Science and Arts Occupations by Sex
Within the Management, Business, Science and Arts occupations in Monroe, the most male-oriented occupations are Architecture & Engineering (100.0%), Legal Services & Support (100.0%), and Computers, Engineering & Science (84.8%), while the most female-oriented occupations are Health Diagnosing & Treating (77.3%), Health Technologists (75.0%), and Life, Physical & Social Science (68.8%).
| Occupation | Male | Female |
| Management | 370 (54.2%) | 312 (45.8%) |
| Business & Financial | 57 (41.3%) | 81 (58.7%) |
| Computers, Engineering & Science | 313 (84.8%) | 56 (15.2%) |
| Computers & Mathematics | 115 (77.2%) | 34 (22.8%) |
| Architecture & Engineering | 188 (100.0%) | 0 (0.0%) |
| Life, Physical & Social Science | 10 (31.2%) | 22 (68.8%) |
| Community & Social Service | 352 (43.9%) | 450 (56.1%) |
| Education, Arts & Media | 42 (32.1%) | 89 (67.9%) |
| Legal Services & Support | 17 (100.0%) | 0 (0.0%) |
| Education Instruction & Library | 200 (37.2%) | 338 (62.8%) |
| Arts, Media & Entertainment | 93 (80.2%) | 23 (19.8%) |
| Health Diagnosing & Treating | 145 (22.7%) | 495 (77.3%) |
| Health Technologists | 85 (25.0%) | 255 (75.0%) |
| Total (Category) | 1,237 (47.0%) | 1,394 (53.0%) |
| Total (Overall) | 4,737 (53.9%) | 4,048 (46.1%) |
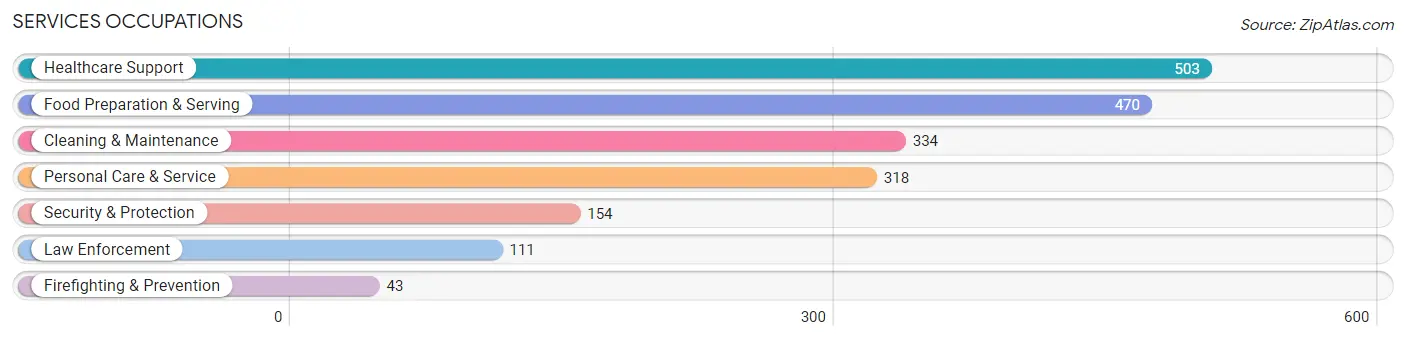
Services Occupations
The most common Services occupations in Monroe are Healthcare Support (503 | 5.7%), Food Preparation & Serving (470 | 5.3%), Cleaning & Maintenance (334 | 3.8%), Personal Care & Service (318 | 3.6%), and Security & Protection (154 | 1.8%).
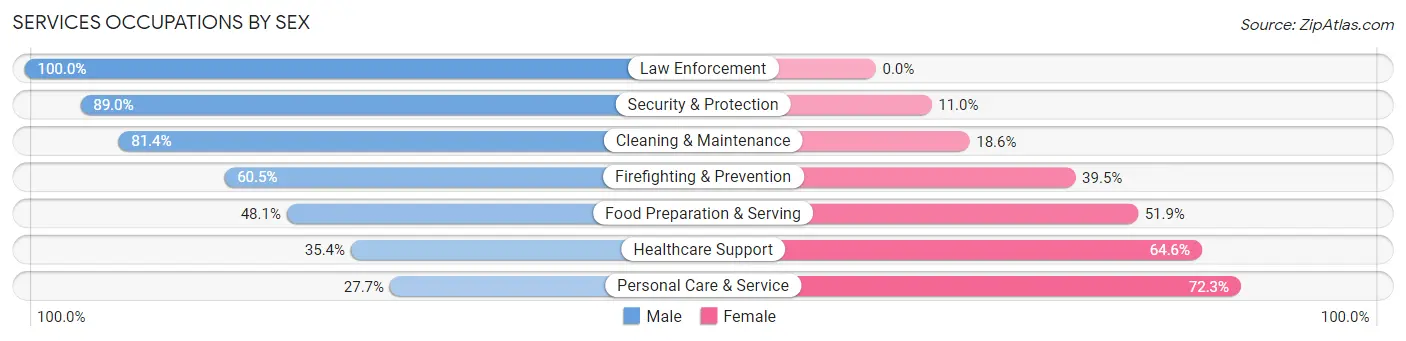
Services Occupations by Sex
Within the Services occupations in Monroe, the most male-oriented occupations are Law Enforcement (100.0%), Security & Protection (89.0%), and Cleaning & Maintenance (81.4%), while the most female-oriented occupations are Personal Care & Service (72.3%), Healthcare Support (64.6%), and Food Preparation & Serving (51.9%).
| Occupation | Male | Female |
| Healthcare Support | 178 (35.4%) | 325 (64.6%) |
| Security & Protection | 137 (89.0%) | 17 (11.0%) |
| Firefighting & Prevention | 26 (60.5%) | 17 (39.5%) |
| Law Enforcement | 111 (100.0%) | 0 (0.0%) |
| Food Preparation & Serving | 226 (48.1%) | 244 (51.9%) |
| Cleaning & Maintenance | 272 (81.4%) | 62 (18.6%) |
| Personal Care & Service | 88 (27.7%) | 230 (72.3%) |
| Total (Category) | 901 (50.6%) | 878 (49.3%) |
| Total (Overall) | 4,737 (53.9%) | 4,048 (46.1%) |
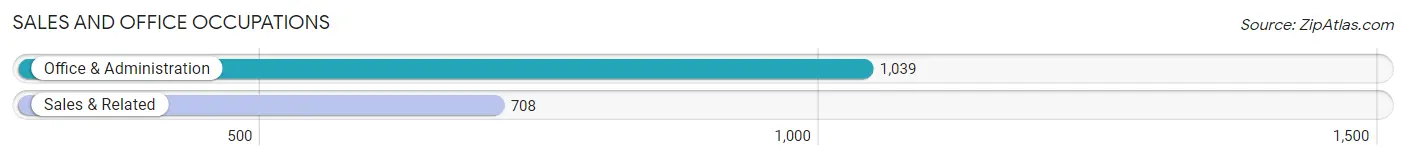
Sales and Office Occupations
The most common Sales and Office occupations in Monroe are Office & Administration (1,039 | 11.8%), and Sales & Related (708 | 8.1%).
Sales and Office Occupations by Sex
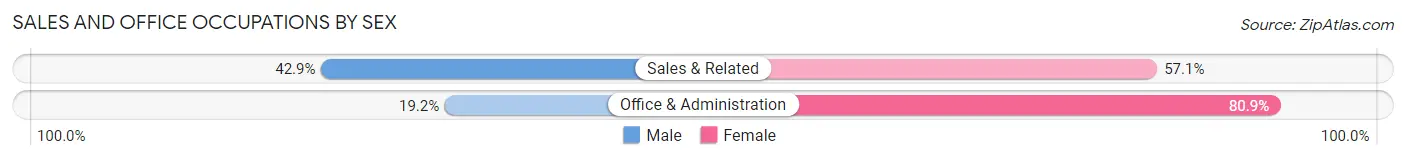
| Occupation | Male | Female |
| Sales & Related | 304 (42.9%) | 404 (57.1%) |
| Office & Administration | 199 (19.2%) | 840 (80.8%) |
| Total (Category) | 503 (28.8%) | 1,244 (71.2%) |
| Total (Overall) | 4,737 (53.9%) | 4,048 (46.1%) |
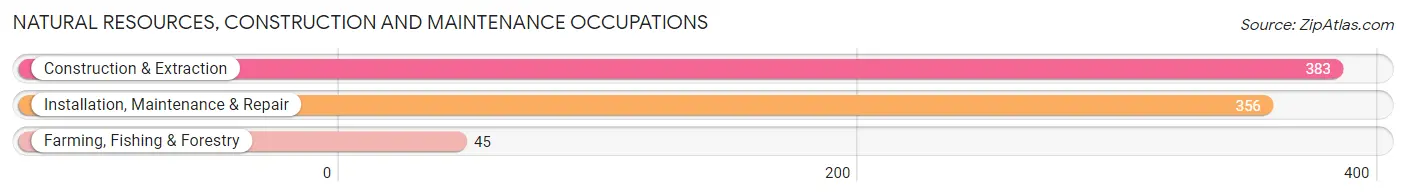
Natural Resources, Construction and Maintenance Occupations
The most common Natural Resources, Construction and Maintenance occupations in Monroe are Construction & Extraction (383 | 4.4%), Installation, Maintenance & Repair (356 | 4.1%), and Farming, Fishing & Forestry (45 | 0.5%).
Natural Resources, Construction and Maintenance Occupations by Sex
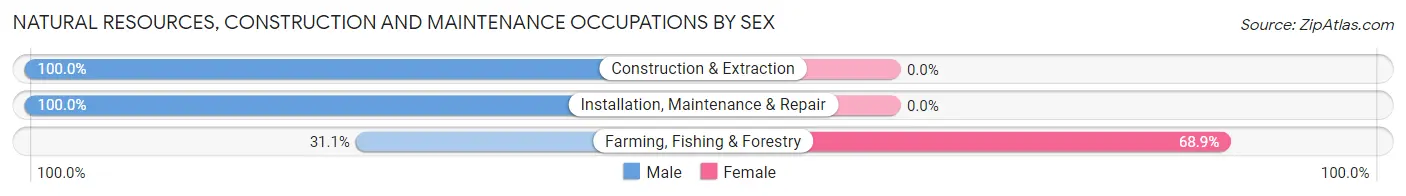
| Occupation | Male | Female |
| Farming, Fishing & Forestry | 14 (31.1%) | 31 (68.9%) |
| Construction & Extraction | 383 (100.0%) | 0 (0.0%) |
| Installation, Maintenance & Repair | 356 (100.0%) | 0 (0.0%) |
| Total (Category) | 753 (96.1%) | 31 (4.0%) |
| Total (Overall) | 4,737 (53.9%) | 4,048 (46.1%) |
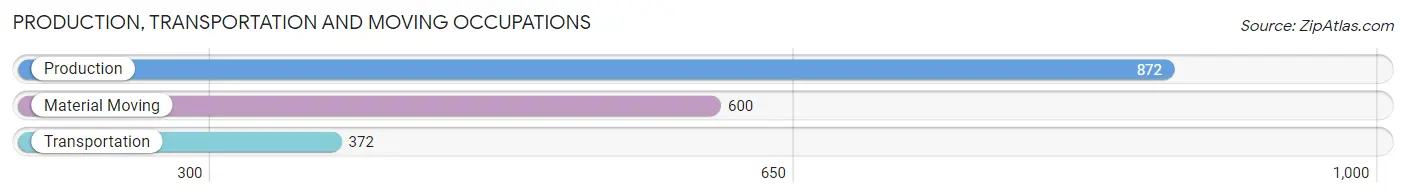
Production, Transportation and Moving Occupations
The most common Production, Transportation and Moving occupations in Monroe are Production (872 | 9.9%), Material Moving (600 | 6.8%), and Transportation (372 | 4.2%).
Production, Transportation and Moving Occupations by Sex
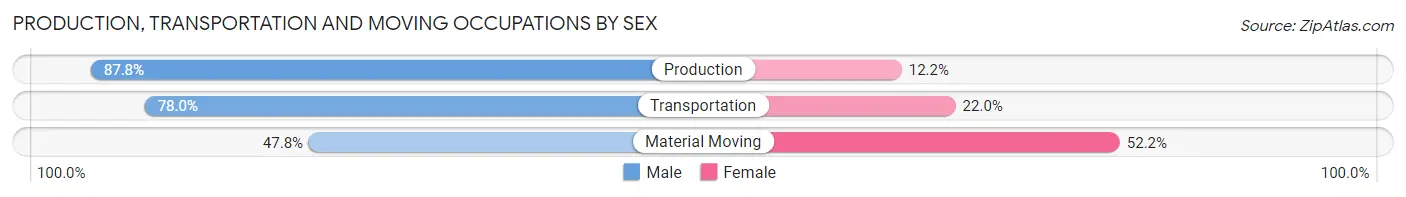
| Occupation | Male | Female |
| Production | 766 (87.8%) | 106 (12.2%) |
| Transportation | 290 (78.0%) | 82 (22.0%) |
| Material Moving | 287 (47.8%) | 313 (52.2%) |
| Total (Category) | 1,343 (72.8%) | 501 (27.2%) |
| Total (Overall) | 4,737 (53.9%) | 4,048 (46.1%) |
Employment Industries by Sex in Monroe
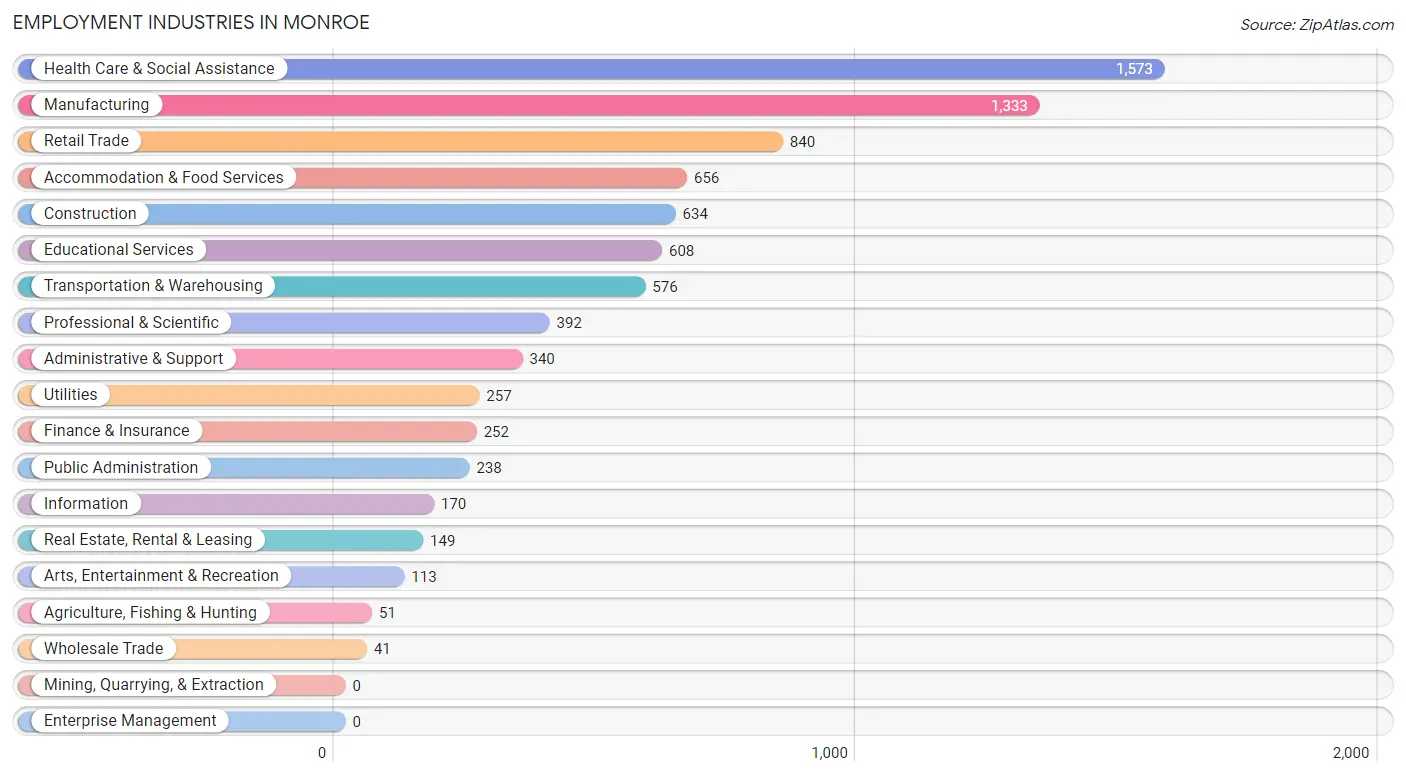
Employment Industries in Monroe
The major employment industries in Monroe include Health Care & Social Assistance (1,573 | 17.9%), Manufacturing (1,333 | 15.2%), Retail Trade (840 | 9.6%), Accommodation & Food Services (656 | 7.5%), and Construction (634 | 7.2%).
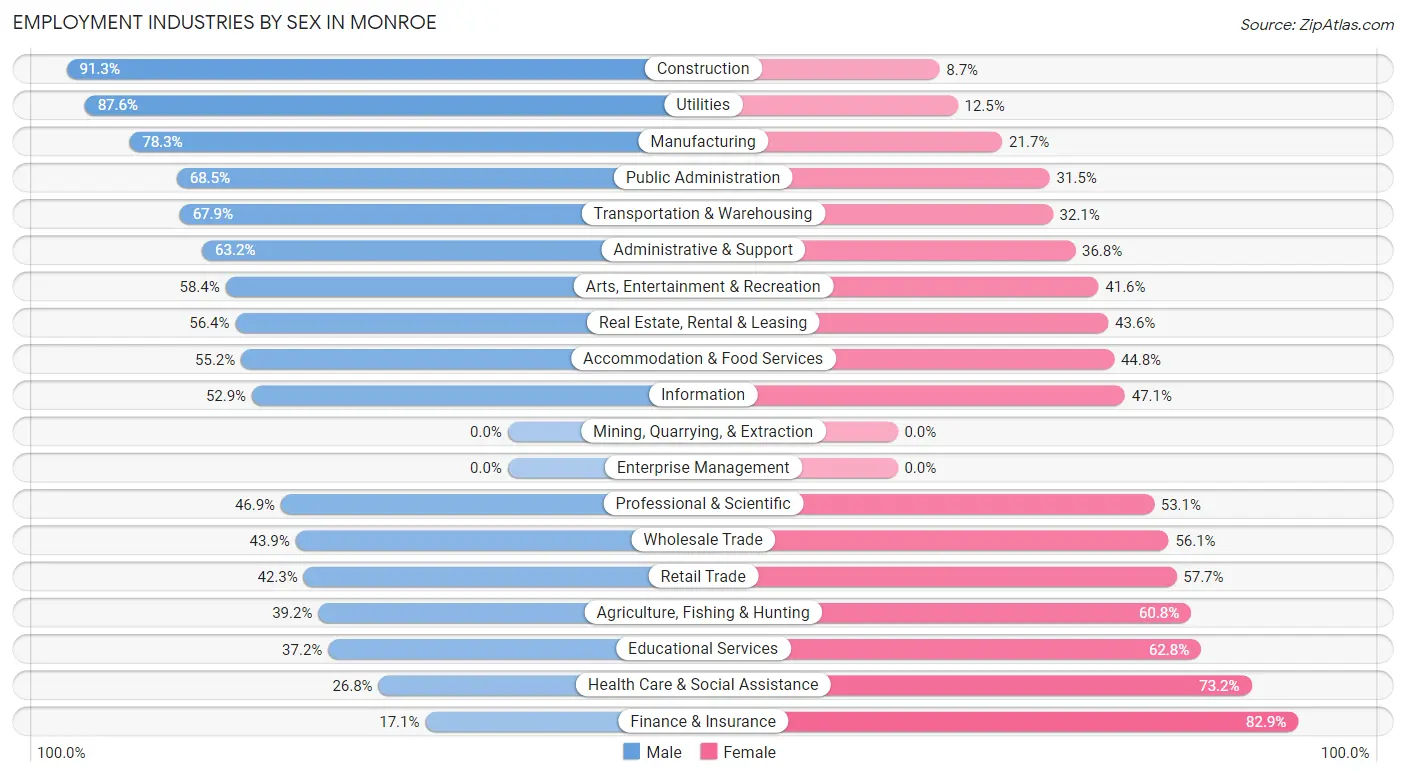
Employment Industries by Sex in Monroe
The Monroe industries that see more men than women are Construction (91.3%), Utilities (87.5%), and Manufacturing (78.3%), whereas the industries that tend to have a higher number of women are Finance & Insurance (82.9%), Health Care & Social Assistance (73.2%), and Educational Services (62.8%).
| Industry | Male | Female |
| Agriculture, Fishing & Hunting | 20 (39.2%) | 31 (60.8%) |
| Mining, Quarrying, & Extraction | 0 (0.0%) | 0 (0.0%) |
| Construction | 579 (91.3%) | 55 (8.7%) |
| Manufacturing | 1,044 (78.3%) | 289 (21.7%) |
| Wholesale Trade | 18 (43.9%) | 23 (56.1%) |
| Retail Trade | 355 (42.3%) | 485 (57.7%) |
| Transportation & Warehousing | 391 (67.9%) | 185 (32.1%) |
| Utilities | 225 (87.5%) | 32 (12.4%) |
| Information | 90 (52.9%) | 80 (47.1%) |
| Finance & Insurance | 43 (17.1%) | 209 (82.9%) |
| Real Estate, Rental & Leasing | 84 (56.4%) | 65 (43.6%) |
| Professional & Scientific | 184 (46.9%) | 208 (53.1%) |
| Enterprise Management | 0 (0.0%) | 0 (0.0%) |
| Administrative & Support | 215 (63.2%) | 125 (36.8%) |
| Educational Services | 226 (37.2%) | 382 (62.8%) |
| Health Care & Social Assistance | 421 (26.8%) | 1,152 (73.2%) |
| Arts, Entertainment & Recreation | 66 (58.4%) | 47 (41.6%) |
| Accommodation & Food Services | 362 (55.2%) | 294 (44.8%) |
| Public Administration | 163 (68.5%) | 75 (31.5%) |
| Total | 4,737 (53.9%) | 4,048 (46.1%) |
Education in Monroe
School Enrollment in Monroe
The most common levels of schooling among the 4,143 students in Monroe are elementary school (1,157 | 27.9%), high school (896 | 21.6%), and college / undergraduate (557 | 13.4%).
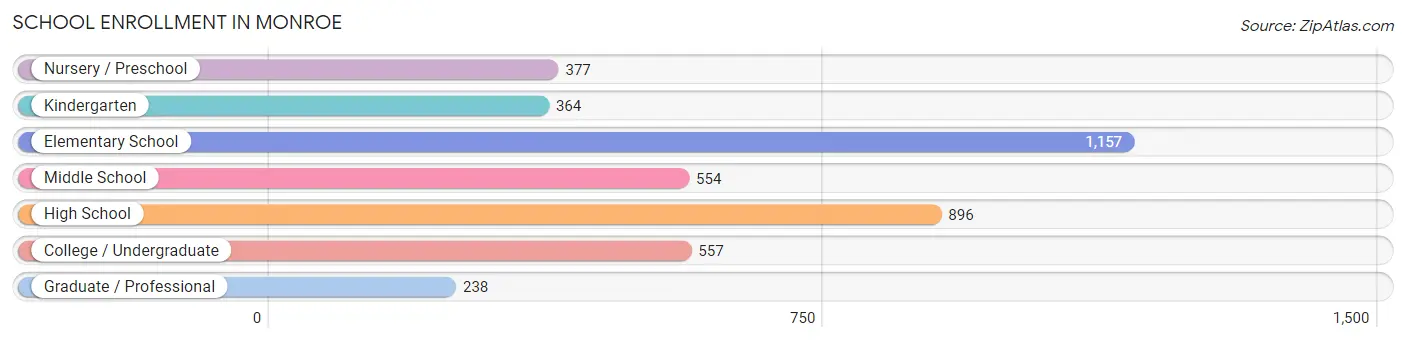
| School Level | # Students | % Students |
| Nursery / Preschool | 377 | 9.1% |
| Kindergarten | 364 | 8.8% |
| Elementary School | 1,157 | 27.9% |
| Middle School | 554 | 13.4% |
| High School | 896 | 21.6% |
| College / Undergraduate | 557 | 13.4% |
| Graduate / Professional | 238 | 5.7% |
| Total | 4,143 | 100.0% |
School Enrollment by Age by Funding Source in Monroe
Out of a total of 4,143 students who are enrolled in schools in Monroe, 949 (22.9%) attend a private institution, while the remaining 3,194 (77.1%) are enrolled in public schools. The age group of 35 years and over has the highest likelihood of being enrolled in private schools, with 71 (48.6% in the age bracket) enrolled. Conversely, the age group of 15 to 17 year olds has the lowest likelihood of being enrolled in a private school, with 581 (98.5% in the age bracket) attending a public institution.
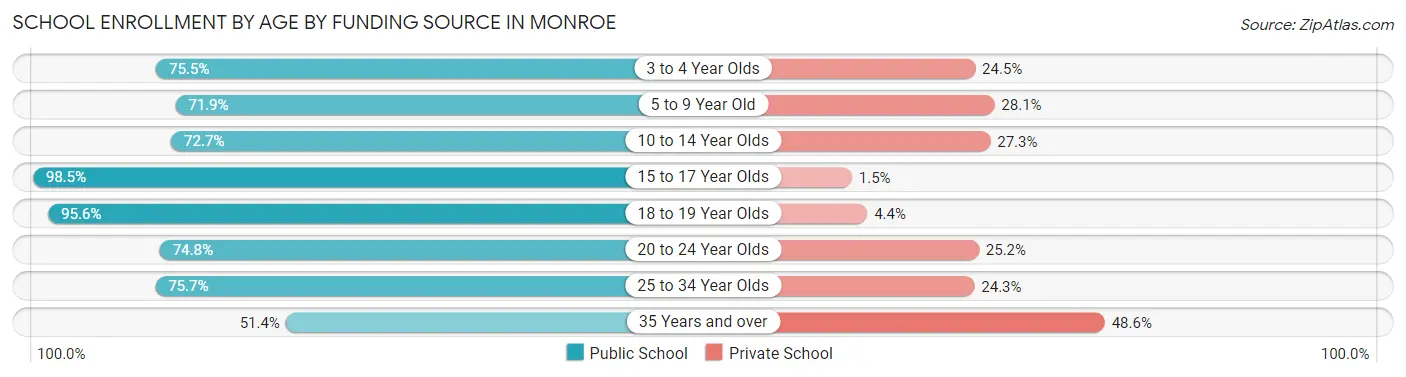
| Age Bracket | Public School | Private School |
| 3 to 4 Year Olds | 259 (75.5%) | 84 (24.5%) |
| 5 to 9 Year Old | 1,017 (71.9%) | 397 (28.1%) |
| 10 to 14 Year Olds | 583 (72.7%) | 219 (27.3%) |
| 15 to 17 Year Olds | 581 (98.5%) | 9 (1.5%) |
| 18 to 19 Year Olds | 196 (95.6%) | 9 (4.4%) |
| 20 to 24 Year Olds | 312 (74.8%) | 105 (25.2%) |
| 25 to 34 Year Olds | 171 (75.7%) | 55 (24.3%) |
| 35 Years and over | 75 (51.4%) | 71 (48.6%) |
| Total | 3,194 (77.1%) | 949 (22.9%) |
Educational Attainment by Field of Study in Monroe
Education (541 | 19.1%), business (488 | 17.2%), science & technology (483 | 17.1%), social sciences (206 | 7.3%), and engineering (200 | 7.1%) are the most common fields of study among 2,833 individuals in Monroe who have obtained a bachelor's degree or higher.
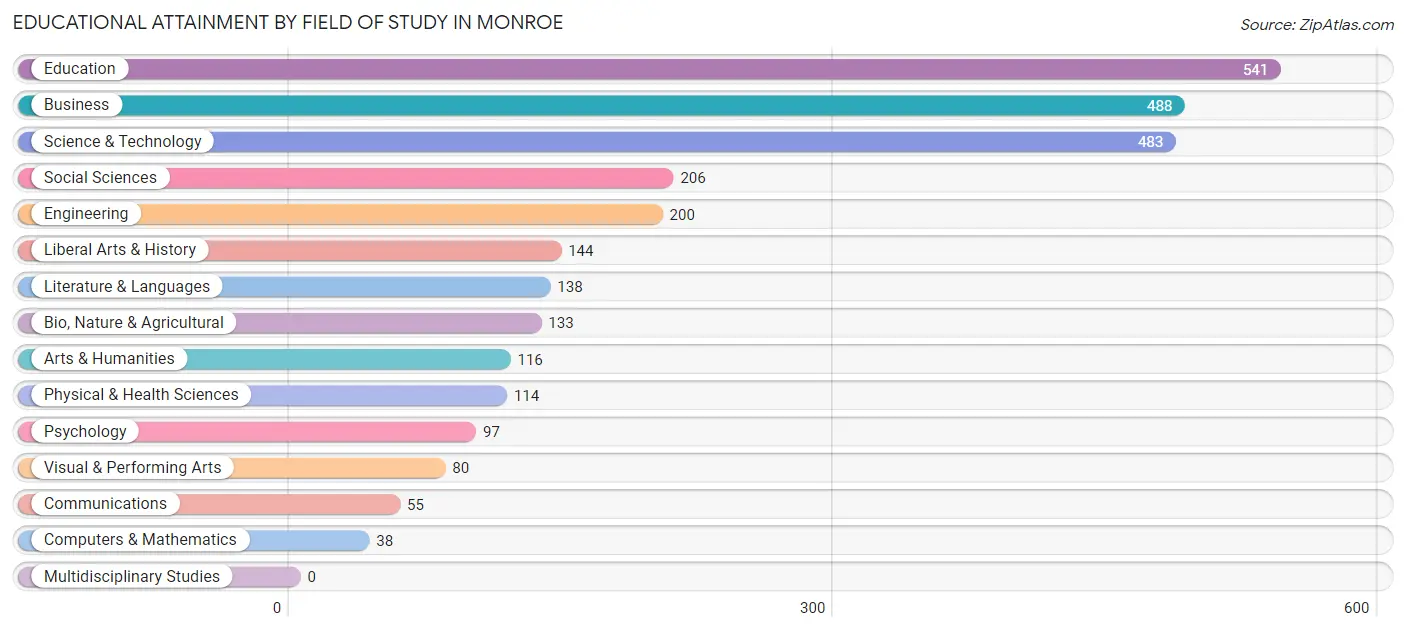
| Field of Study | # Graduates | % Graduates |
| Computers & Mathematics | 38 | 1.3% |
| Bio, Nature & Agricultural | 133 | 4.7% |
| Physical & Health Sciences | 114 | 4.0% |
| Psychology | 97 | 3.4% |
| Social Sciences | 206 | 7.3% |
| Engineering | 200 | 7.1% |
| Multidisciplinary Studies | 0 | 0.0% |
| Science & Technology | 483 | 17.1% |
| Business | 488 | 17.2% |
| Education | 541 | 19.1% |
| Literature & Languages | 138 | 4.9% |
| Liberal Arts & History | 144 | 5.1% |
| Visual & Performing Arts | 80 | 2.8% |
| Communications | 55 | 1.9% |
| Arts & Humanities | 116 | 4.1% |
| Total | 2,833 | 100.0% |
Transportation & Commute in Monroe
Vehicle Availability by Sex in Monroe
The most prevalent vehicle ownership categories in Monroe are males with 2 vehicles (1,989, accounting for 42.7%) and females with 2 vehicles (1,800, making up 50.8%).
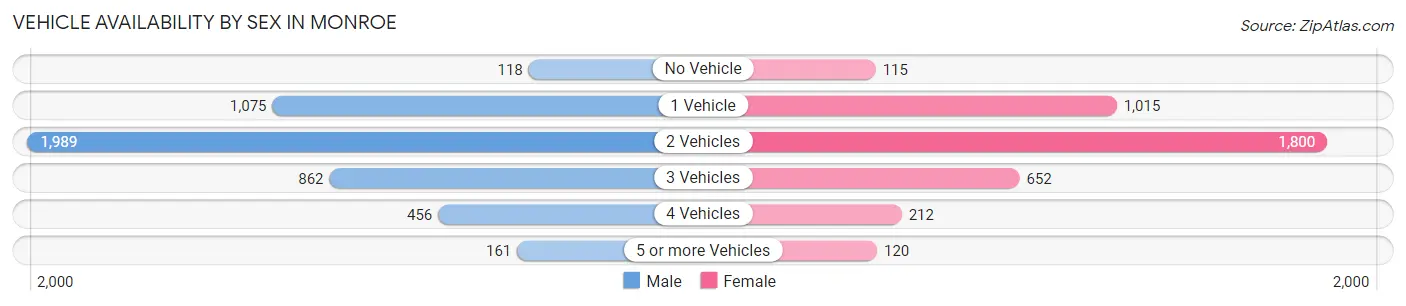
| Vehicles Available | Male | Female |
| No Vehicle | 118 (2.5%) | 115 (2.9%) |
| 1 Vehicle | 1,075 (23.1%) | 1,015 (25.9%) |
| 2 Vehicles | 1,989 (42.7%) | 1,800 (46.0%) |
| 3 Vehicles | 862 (18.5%) | 652 (16.7%) |
| 4 Vehicles | 456 (9.8%) | 212 (5.4%) |
| 5 or more Vehicles | 161 (3.5%) | 120 (3.1%) |
| Total | 4,661 (100.0%) | 3,914 (100.0%) |
Commute Time in Monroe
The most frequently occuring commute durations in Monroe are 5 to 9 minutes (1,711 commuters, 21.0%), 10 to 14 minutes (1,382 commuters, 17.0%), and 15 to 19 minutes (917 commuters, 11.3%).
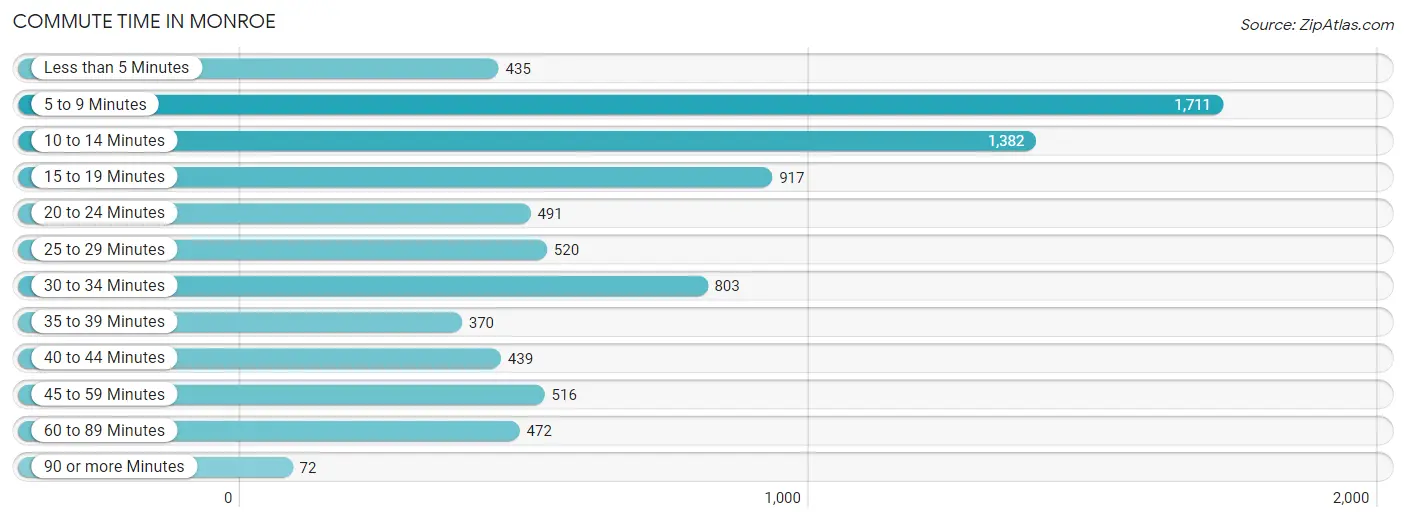
| Commute Time | # Commuters | % Commuters |
| Less than 5 Minutes | 435 | 5.3% |
| 5 to 9 Minutes | 1,711 | 21.0% |
| 10 to 14 Minutes | 1,382 | 17.0% |
| 15 to 19 Minutes | 917 | 11.3% |
| 20 to 24 Minutes | 491 | 6.0% |
| 25 to 29 Minutes | 520 | 6.4% |
| 30 to 34 Minutes | 803 | 9.9% |
| 35 to 39 Minutes | 370 | 4.5% |
| 40 to 44 Minutes | 439 | 5.4% |
| 45 to 59 Minutes | 516 | 6.4% |
| 60 to 89 Minutes | 472 | 5.8% |
| 90 or more Minutes | 72 | 0.9% |
Commute Time by Sex in Monroe
The most common commute times in Monroe are 5 to 9 minutes (707 commuters, 15.7%) for males and 5 to 9 minutes (1,004 commuters, 27.8%) for females.
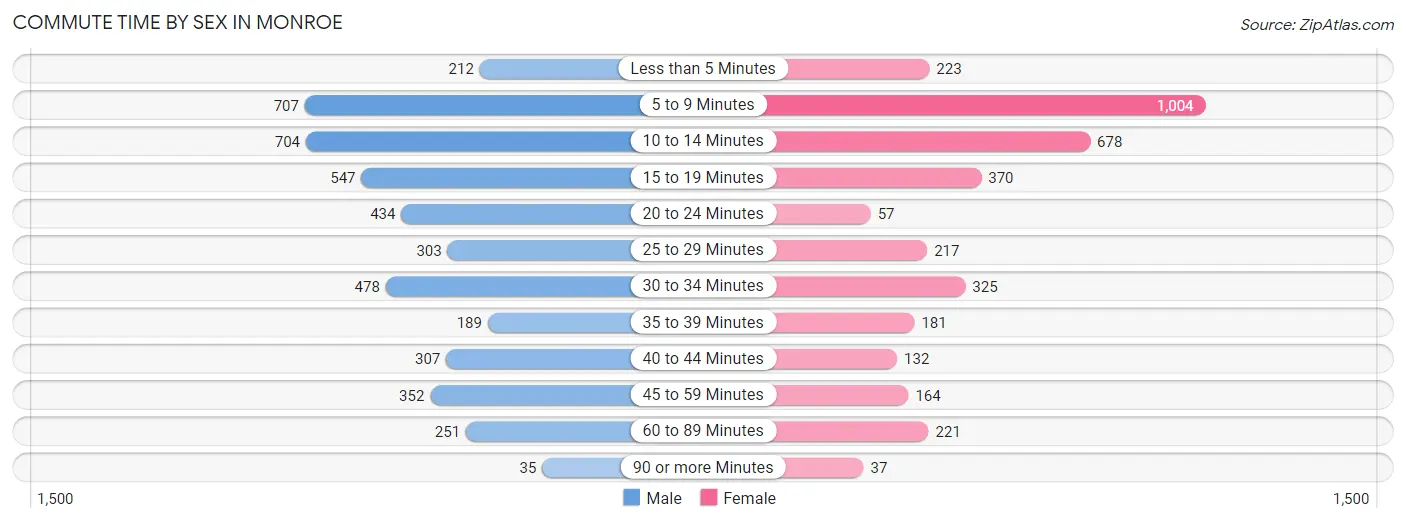
| Commute Time | Male | Female |
| Less than 5 Minutes | 212 (4.7%) | 223 (6.2%) |
| 5 to 9 Minutes | 707 (15.7%) | 1,004 (27.8%) |
| 10 to 14 Minutes | 704 (15.6%) | 678 (18.8%) |
| 15 to 19 Minutes | 547 (12.1%) | 370 (10.2%) |
| 20 to 24 Minutes | 434 (9.6%) | 57 (1.6%) |
| 25 to 29 Minutes | 303 (6.7%) | 217 (6.0%) |
| 30 to 34 Minutes | 478 (10.6%) | 325 (9.0%) |
| 35 to 39 Minutes | 189 (4.2%) | 181 (5.0%) |
| 40 to 44 Minutes | 307 (6.8%) | 132 (3.7%) |
| 45 to 59 Minutes | 352 (7.8%) | 164 (4.5%) |
| 60 to 89 Minutes | 251 (5.6%) | 221 (6.1%) |
| 90 or more Minutes | 35 (0.8%) | 37 (1.0%) |
Time of Departure to Work by Sex in Monroe
The most frequent times of departure to work in Monroe are 7:00 AM to 7:29 AM (577, 12.8%) for males and 7:30 AM to 7:59 AM (532, 14.7%) for females.
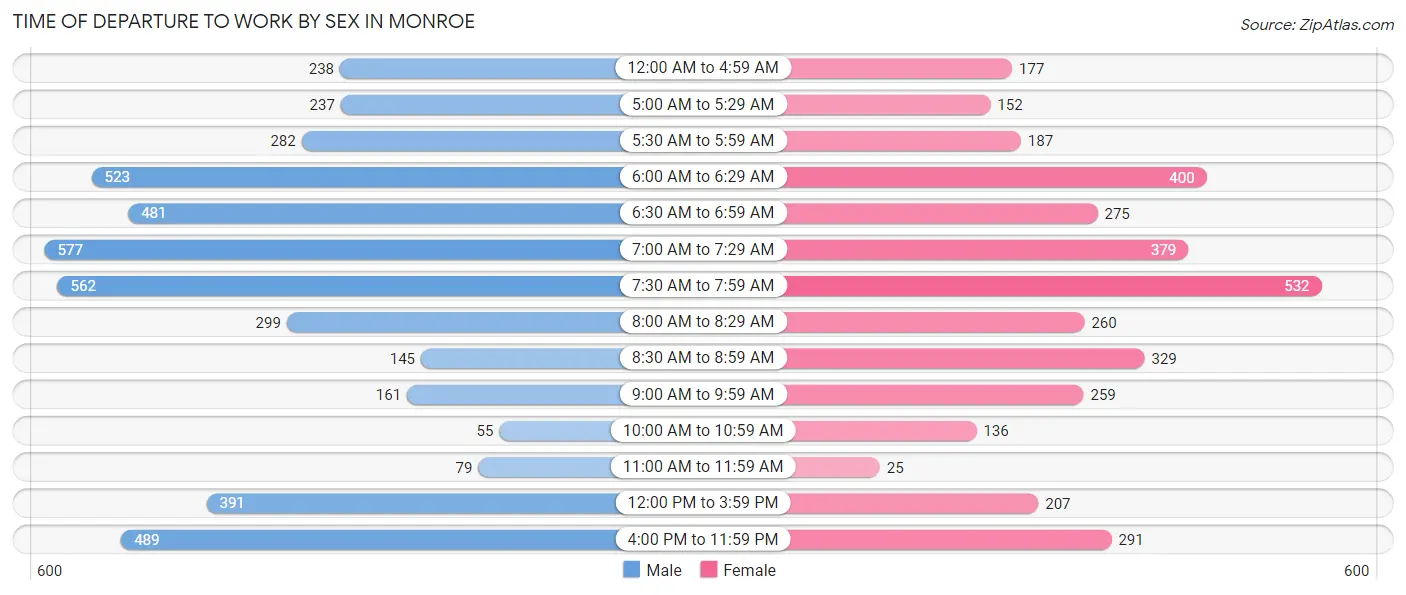
| Time of Departure | Male | Female |
| 12:00 AM to 4:59 AM | 238 (5.3%) | 177 (4.9%) |
| 5:00 AM to 5:29 AM | 237 (5.2%) | 152 (4.2%) |
| 5:30 AM to 5:59 AM | 282 (6.2%) | 187 (5.2%) |
| 6:00 AM to 6:29 AM | 523 (11.6%) | 400 (11.1%) |
| 6:30 AM to 6:59 AM | 481 (10.6%) | 275 (7.6%) |
| 7:00 AM to 7:29 AM | 577 (12.8%) | 379 (10.5%) |
| 7:30 AM to 7:59 AM | 562 (12.4%) | 532 (14.7%) |
| 8:00 AM to 8:29 AM | 299 (6.6%) | 260 (7.2%) |
| 8:30 AM to 8:59 AM | 145 (3.2%) | 329 (9.1%) |
| 9:00 AM to 9:59 AM | 161 (3.6%) | 259 (7.2%) |
| 10:00 AM to 10:59 AM | 55 (1.2%) | 136 (3.8%) |
| 11:00 AM to 11:59 AM | 79 (1.8%) | 25 (0.7%) |
| 12:00 PM to 3:59 PM | 391 (8.6%) | 207 (5.7%) |
| 4:00 PM to 11:59 PM | 489 (10.8%) | 291 (8.1%) |
| Total | 4,519 (100.0%) | 3,609 (100.0%) |
Housing Occupancy in Monroe
Occupancy by Ownership in Monroe
Of the total 8,532 dwellings in Monroe, owner-occupied units account for 5,783 (67.8%), while renter-occupied units make up 2,749 (32.2%).
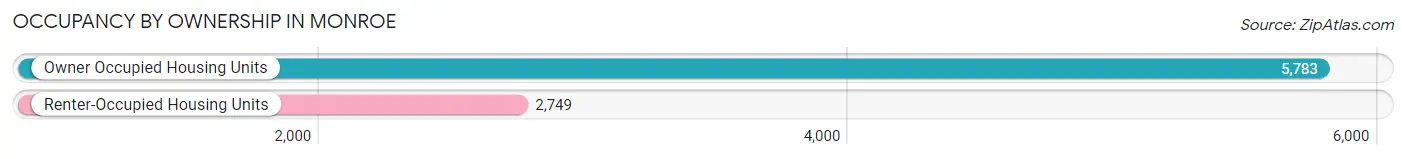
| Occupancy | # Housing Units | % Housing Units |
| Owner Occupied Housing Units | 5,783 | 67.8% |
| Renter-Occupied Housing Units | 2,749 | 32.2% |
| Total Occupied Housing Units | 8,532 | 100.0% |
Occupancy by Household Size in Monroe
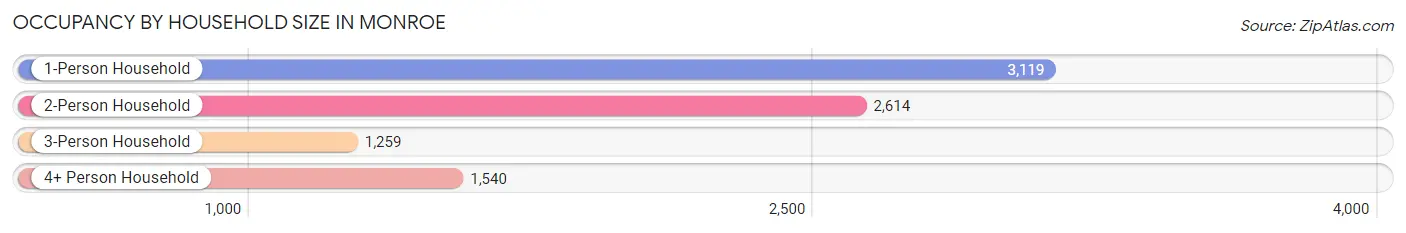
| Household Size | # Housing Units | % Housing Units |
| 1-Person Household | 3,119 | 36.6% |
| 2-Person Household | 2,614 | 30.6% |
| 3-Person Household | 1,259 | 14.8% |
| 4+ Person Household | 1,540 | 18.0% |
| Total Housing Units | 8,532 | 100.0% |
Occupancy by Ownership by Household Size in Monroe
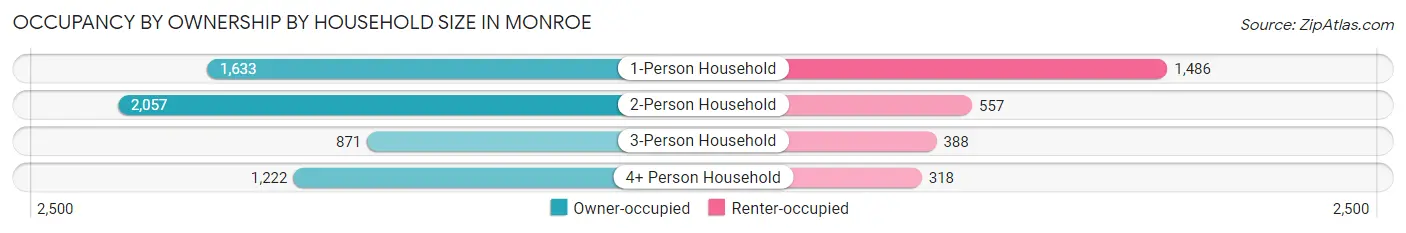
| Household Size | Owner-occupied | Renter-occupied |
| 1-Person Household | 1,633 (52.4%) | 1,486 (47.6%) |
| 2-Person Household | 2,057 (78.7%) | 557 (21.3%) |
| 3-Person Household | 871 (69.2%) | 388 (30.8%) |
| 4+ Person Household | 1,222 (79.3%) | 318 (20.6%) |
| Total Housing Units | 5,783 (67.8%) | 2,749 (32.2%) |
Occupancy by Educational Attainment in Monroe
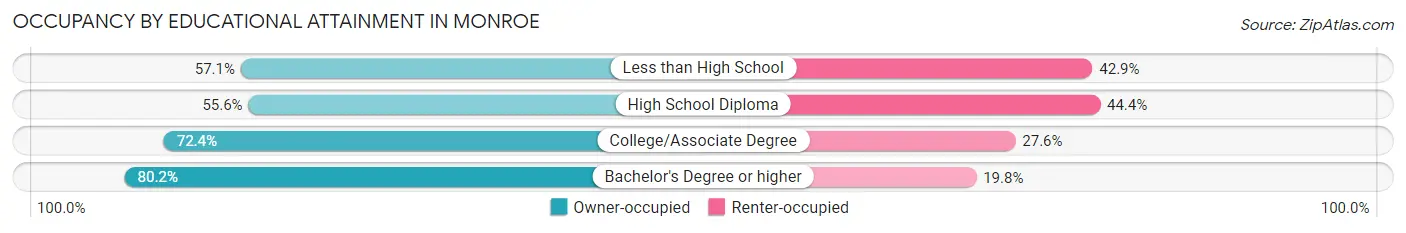
| Household Size | Owner-occupied | Renter-occupied |
| Less than High School | 408 (57.1%) | 306 (42.9%) |
| High School Diploma | 1,390 (55.6%) | 1,109 (44.4%) |
| College/Associate Degree | 2,599 (72.4%) | 991 (27.6%) |
| Bachelor's Degree or higher | 1,386 (80.2%) | 343 (19.8%) |
Occupancy by Age of Householder in Monroe
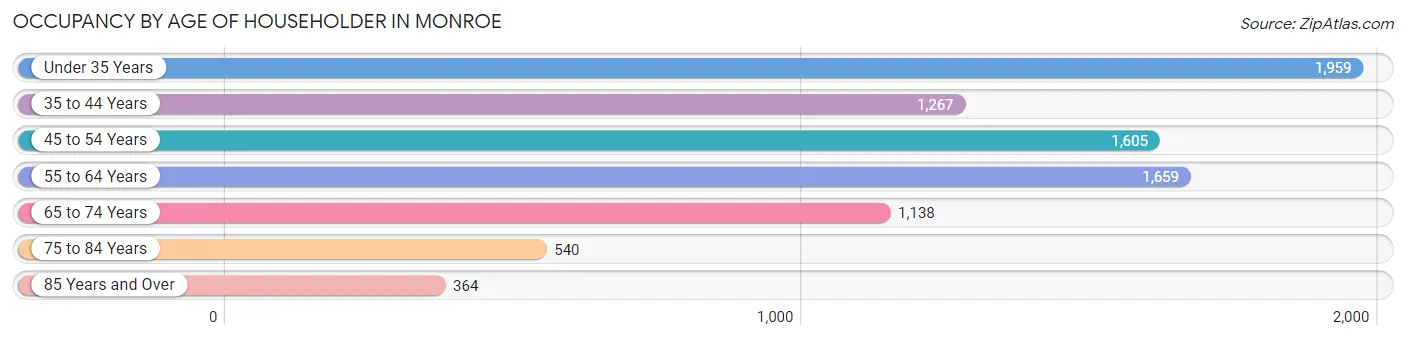
| Age Bracket | # Households | % Households |
| Under 35 Years | 1,959 | 23.0% |
| 35 to 44 Years | 1,267 | 14.8% |
| 45 to 54 Years | 1,605 | 18.8% |
| 55 to 64 Years | 1,659 | 19.4% |
| 65 to 74 Years | 1,138 | 13.3% |
| 75 to 84 Years | 540 | 6.3% |
| 85 Years and Over | 364 | 4.3% |
| Total | 8,532 | 100.0% |
Housing Finances in Monroe
Median Income by Occupancy in Monroe
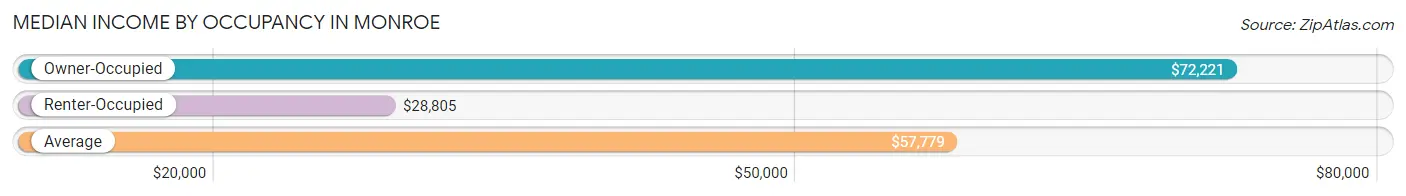
| Occupancy Type | # Households | Median Income |
| Owner-Occupied | 5,783 (67.8%) | $72,221 |
| Renter-Occupied | 2,749 (32.2%) | $28,805 |
| Average | 8,532 (100.0%) | $57,779 |
Occupancy by Householder Income Bracket in Monroe
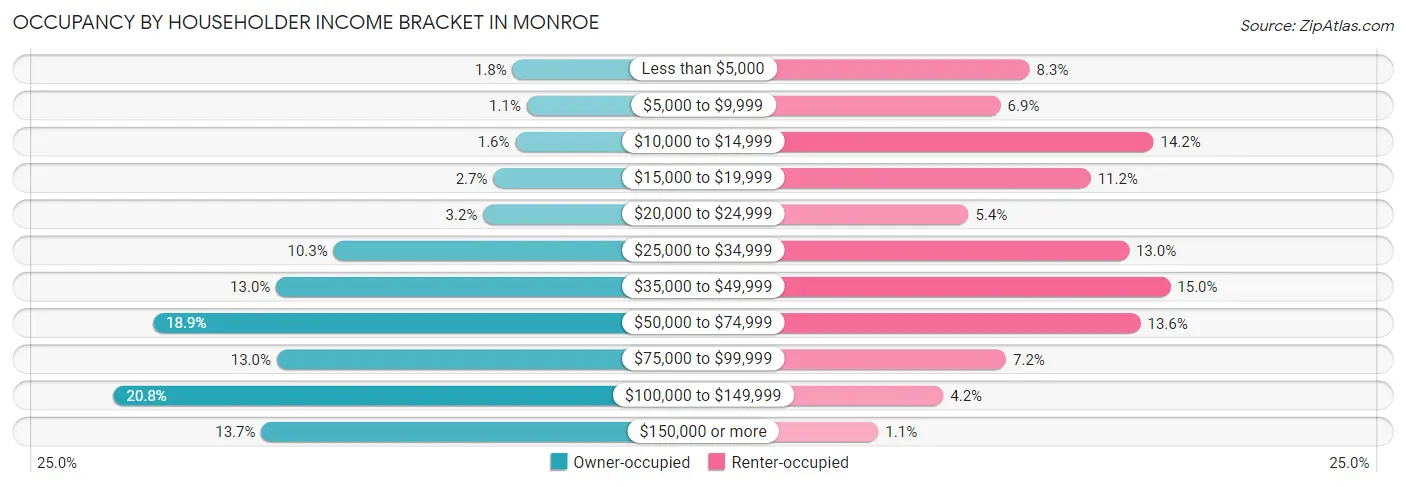
| Income Bracket | Owner-occupied | Renter-occupied |
| Less than $5,000 | 102 (1.8%) | 228 (8.3%) |
| $5,000 to $9,999 | 63 (1.1%) | 190 (6.9%) |
| $10,000 to $14,999 | 94 (1.6%) | 390 (14.2%) |
| $15,000 to $19,999 | 155 (2.7%) | 308 (11.2%) |
| $20,000 to $24,999 | 183 (3.2%) | 148 (5.4%) |
| $25,000 to $34,999 | 595 (10.3%) | 358 (13.0%) |
| $35,000 to $49,999 | 753 (13.0%) | 412 (15.0%) |
| $50,000 to $74,999 | 1,092 (18.9%) | 373 (13.6%) |
| $75,000 to $99,999 | 751 (13.0%) | 197 (7.2%) |
| $100,000 to $149,999 | 1,201 (20.8%) | 115 (4.2%) |
| $150,000 or more | 794 (13.7%) | 30 (1.1%) |
| Total | 5,783 (100.0%) | 2,749 (100.0%) |
Monthly Housing Cost Tiers in Monroe
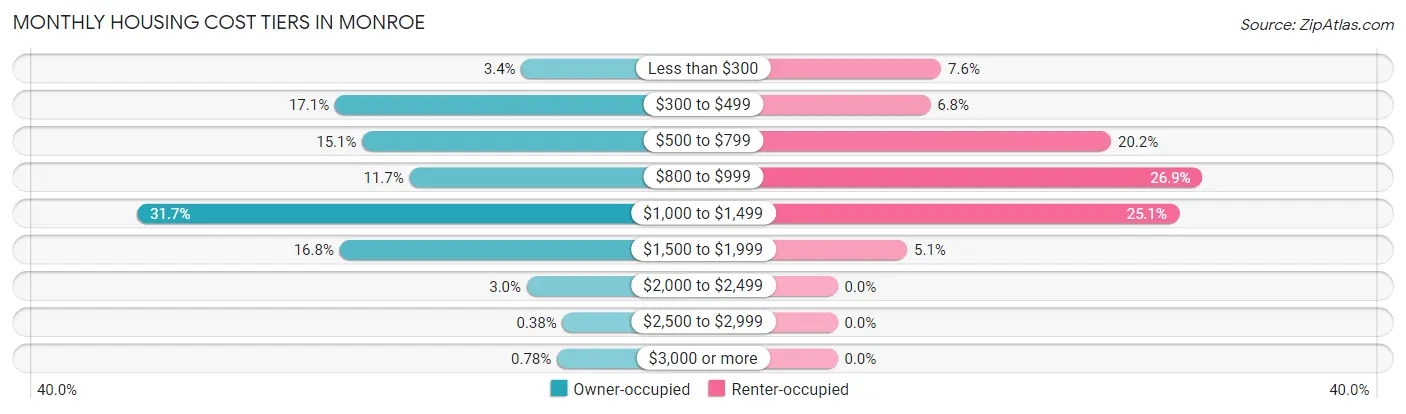
| Monthly Cost | Owner-occupied | Renter-occupied |
| Less than $300 | 197 (3.4%) | 210 (7.6%) |
| $300 to $499 | 991 (17.1%) | 188 (6.8%) |
| $500 to $799 | 875 (15.1%) | 554 (20.2%) |
| $800 to $999 | 674 (11.7%) | 739 (26.9%) |
| $1,000 to $1,499 | 1,834 (31.7%) | 691 (25.1%) |
| $1,500 to $1,999 | 971 (16.8%) | 141 (5.1%) |
| $2,000 to $2,499 | 174 (3.0%) | 0 (0.0%) |
| $2,500 to $2,999 | 22 (0.4%) | 0 (0.0%) |
| $3,000 or more | 45 (0.8%) | 0 (0.0%) |
| Total | 5,783 (100.0%) | 2,749 (100.0%) |
Physical Housing Characteristics in Monroe
Housing Structures in Monroe
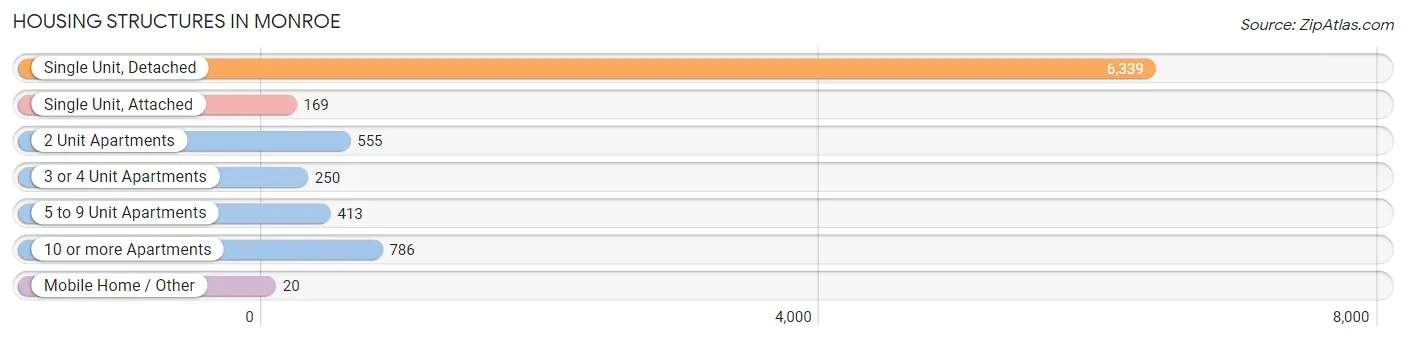
| Structure Type | # Housing Units | % Housing Units |
| Single Unit, Detached | 6,339 | 74.3% |
| Single Unit, Attached | 169 | 2.0% |
| 2 Unit Apartments | 555 | 6.5% |
| 3 or 4 Unit Apartments | 250 | 2.9% |
| 5 to 9 Unit Apartments | 413 | 4.8% |
| 10 or more Apartments | 786 | 9.2% |
| Mobile Home / Other | 20 | 0.2% |
| Total | 8,532 | 100.0% |
Housing Structures by Occupancy in Monroe
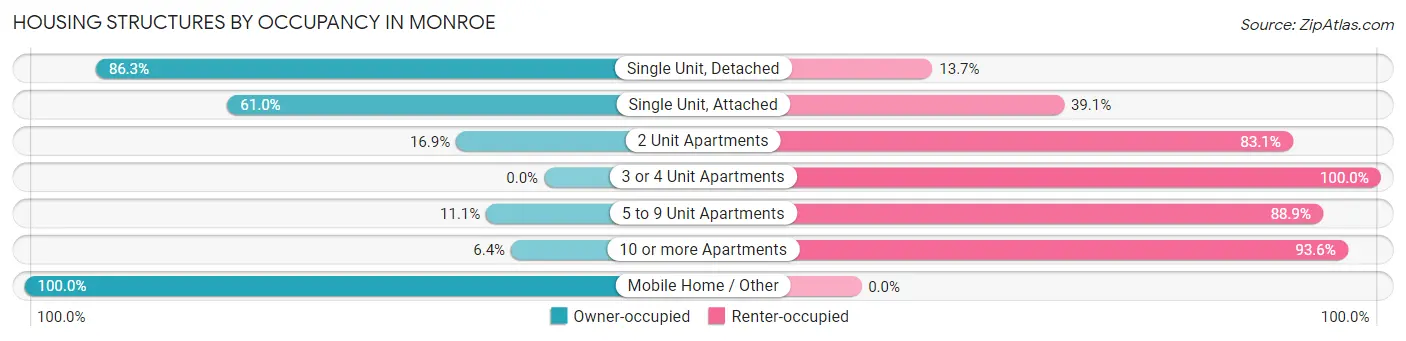
| Structure Type | Owner-occupied | Renter-occupied |
| Single Unit, Detached | 5,470 (86.3%) | 869 (13.7%) |
| Single Unit, Attached | 103 (61.0%) | 66 (39.1%) |
| 2 Unit Apartments | 94 (16.9%) | 461 (83.1%) |
| 3 or 4 Unit Apartments | 0 (0.0%) | 250 (100.0%) |
| 5 to 9 Unit Apartments | 46 (11.1%) | 367 (88.9%) |
| 10 or more Apartments | 50 (6.4%) | 736 (93.6%) |
| Mobile Home / Other | 20 (100.0%) | 0 (0.0%) |
| Total | 5,783 (67.8%) | 2,749 (32.2%) |
Housing Structures by Number of Rooms in Monroe
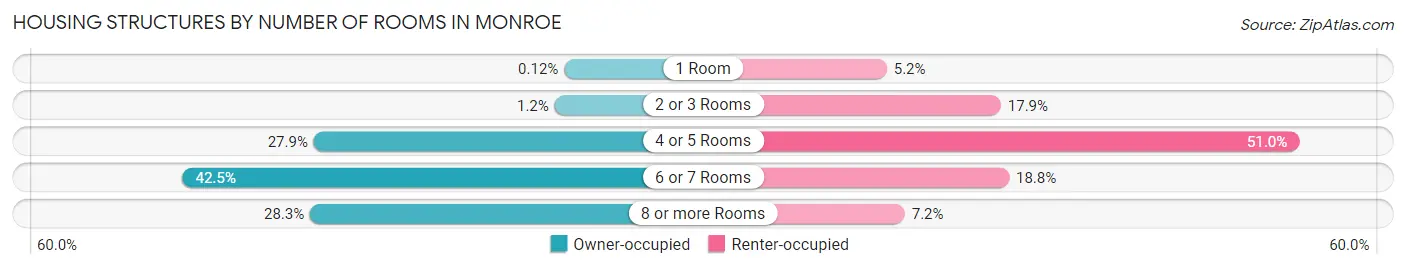
| Number of Rooms | Owner-occupied | Renter-occupied |
| 1 Room | 7 (0.1%) | 143 (5.2%) |
| 2 or 3 Rooms | 68 (1.2%) | 491 (17.9%) |
| 4 or 5 Rooms | 1,614 (27.9%) | 1,401 (51.0%) |
| 6 or 7 Rooms | 2,456 (42.5%) | 516 (18.8%) |
| 8 or more Rooms | 1,638 (28.3%) | 198 (7.2%) |
| Total | 5,783 (100.0%) | 2,749 (100.0%) |
Housing Structure by Heating Type in Monroe
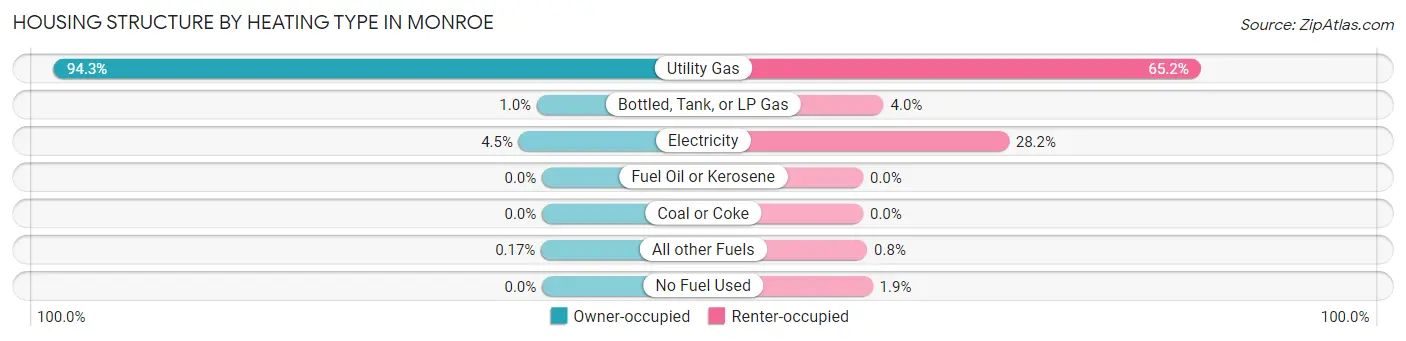
| Heating Type | Owner-occupied | Renter-occupied |
| Utility Gas | 5,455 (94.3%) | 1,793 (65.2%) |
| Bottled, Tank, or LP Gas | 58 (1.0%) | 109 (4.0%) |
| Electricity | 260 (4.5%) | 774 (28.2%) |
| Fuel Oil or Kerosene | 0 (0.0%) | 0 (0.0%) |
| Coal or Coke | 0 (0.0%) | 0 (0.0%) |
| All other Fuels | 10 (0.2%) | 22 (0.8%) |
| No Fuel Used | 0 (0.0%) | 51 (1.9%) |
| Total | 5,783 (100.0%) | 2,749 (100.0%) |
Household Vehicle Usage in Monroe
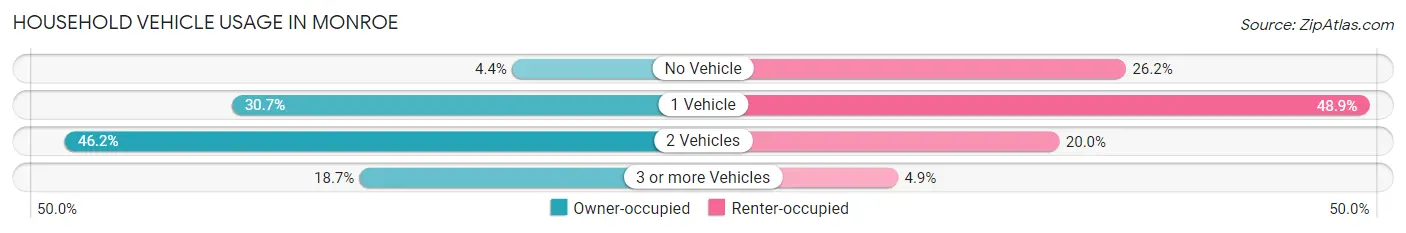
| Vehicles per Household | Owner-occupied | Renter-occupied |
| No Vehicle | 257 (4.4%) | 720 (26.2%) |
| 1 Vehicle | 1,773 (30.7%) | 1,345 (48.9%) |
| 2 Vehicles | 2,673 (46.2%) | 549 (20.0%) |
| 3 or more Vehicles | 1,080 (18.7%) | 135 (4.9%) |
| Total | 5,783 (100.0%) | 2,749 (100.0%) |
Real Estate & Mortgages in Monroe
Real Estate and Mortgage Overview in Monroe
| Characteristic | Without Mortgage | With Mortgage |
| Housing Units | 1,925 | 3,858 |
| Median Property Value | $145,900 | $154,800 |
| Median Household Income | $55,852 | $668 |
| Monthly Housing Costs | $459 | $45 |
| Real Estate Taxes | $2,139 | $164 |
Property Value by Mortgage Status in Monroe
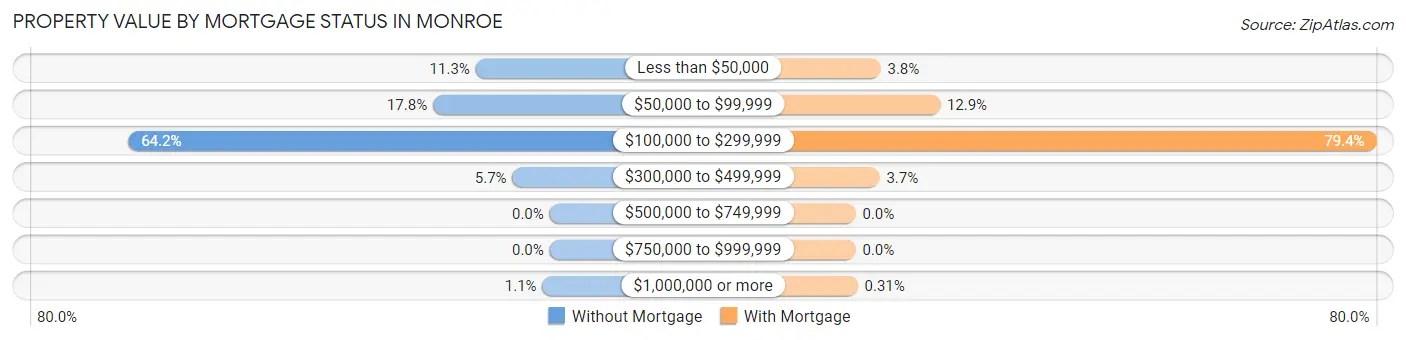
| Property Value | Without Mortgage | With Mortgage |
| Less than $50,000 | 217 (11.3%) | 147 (3.8%) |
| $50,000 to $99,999 | 342 (17.8%) | 496 (12.9%) |
| $100,000 to $299,999 | 1,236 (64.2%) | 3,062 (79.4%) |
| $300,000 to $499,999 | 109 (5.7%) | 141 (3.6%) |
| $500,000 to $749,999 | 0 (0.0%) | 0 (0.0%) |
| $750,000 to $999,999 | 0 (0.0%) | 0 (0.0%) |
| $1,000,000 or more | 21 (1.1%) | 12 (0.3%) |
| Total | 1,925 (100.0%) | 3,858 (100.0%) |
Household Income by Mortgage Status in Monroe
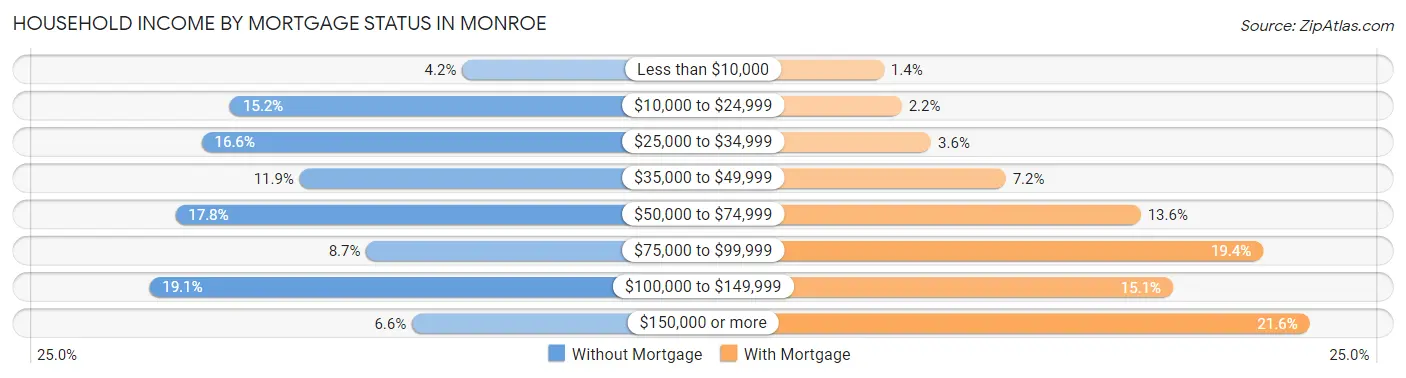
| Household Income | Without Mortgage | With Mortgage |
| Less than $10,000 | 80 (4.2%) | 52 (1.3%) |
| $10,000 to $24,999 | 293 (15.2%) | 85 (2.2%) |
| $25,000 to $34,999 | 319 (16.6%) | 139 (3.6%) |
| $35,000 to $49,999 | 229 (11.9%) | 276 (7.1%) |
| $50,000 to $74,999 | 343 (17.8%) | 524 (13.6%) |
| $75,000 to $99,999 | 168 (8.7%) | 749 (19.4%) |
| $100,000 to $149,999 | 367 (19.1%) | 583 (15.1%) |
| $150,000 or more | 126 (6.6%) | 834 (21.6%) |
| Total | 1,925 (100.0%) | 3,858 (100.0%) |
Property Value to Household Income Ratio in Monroe
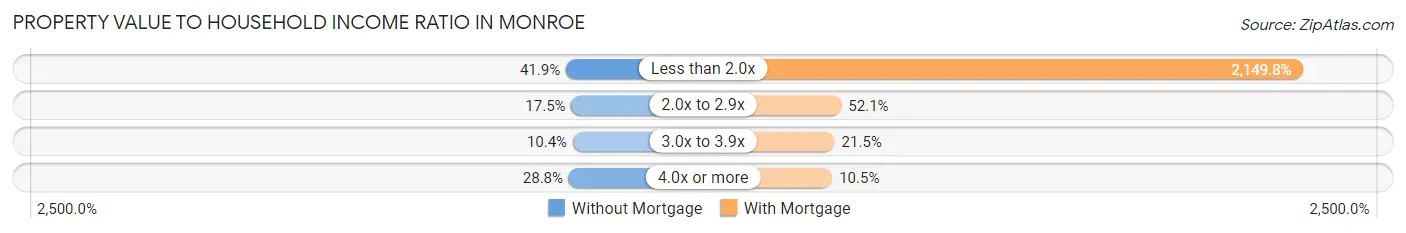
| Value-to-Income Ratio | Without Mortgage | With Mortgage |
| Less than 2.0x | 806 (41.9%) | 82,939 (2,149.8%) |
| 2.0x to 2.9x | 336 (17.4%) | 2,010 (52.1%) |
| 3.0x to 3.9x | 201 (10.4%) | 831 (21.5%) |
| 4.0x or more | 555 (28.8%) | 403 (10.4%) |
| Total | 1,925 (100.0%) | 3,858 (100.0%) |
Real Estate Taxes by Mortgage Status in Monroe
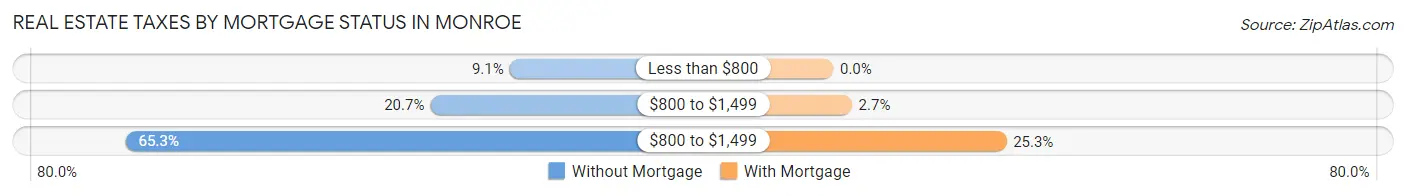
| Property Taxes | Without Mortgage | With Mortgage |
| Less than $800 | 176 (9.1%) | 0 (0.0%) |
| $800 to $1,499 | 399 (20.7%) | 105 (2.7%) |
| $800 to $1,499 | 1,256 (65.2%) | 976 (25.3%) |
| Total | 1,925 (100.0%) | 3,858 (100.0%) |
Health & Disability in Monroe
Health Insurance Coverage by Age in Monroe
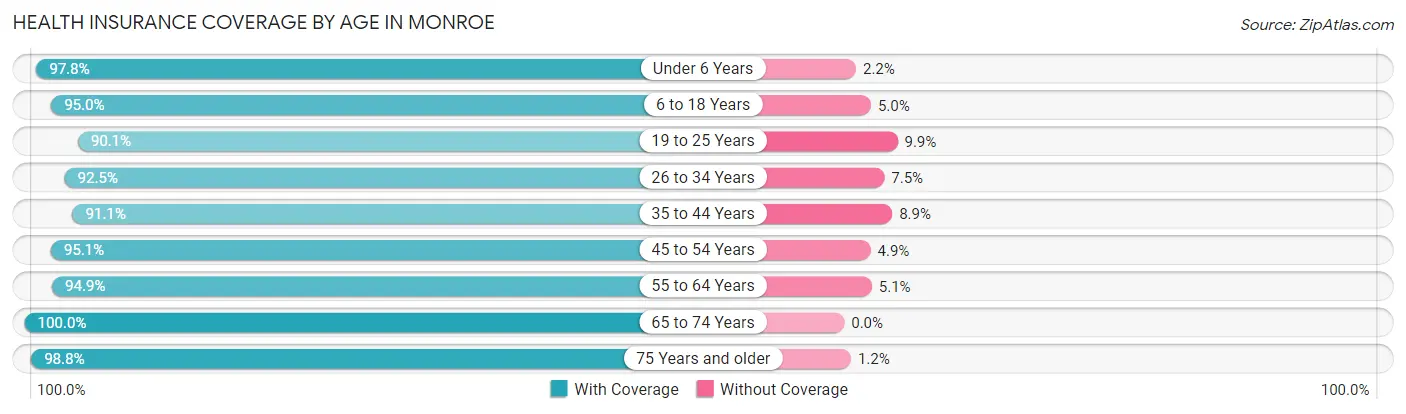
| Age Bracket | With Coverage | Without Coverage |
| Under 6 Years | 2,056 (97.8%) | 46 (2.2%) |
| 6 to 18 Years | 2,660 (95.0%) | 139 (5.0%) |
| 19 to 25 Years | 1,570 (90.1%) | 173 (9.9%) |
| 26 to 34 Years | 2,788 (92.5%) | 225 (7.5%) |
| 35 to 44 Years | 1,966 (91.1%) | 193 (8.9%) |
| 45 to 54 Years | 2,408 (95.1%) | 124 (4.9%) |
| 55 to 64 Years | 2,567 (94.9%) | 139 (5.1%) |
| 65 to 74 Years | 1,850 (100.0%) | 0 (0.0%) |
| 75 Years and older | 1,278 (98.8%) | 16 (1.2%) |
| Total | 19,143 (94.8%) | 1,055 (5.2%) |
Health Insurance Coverage by Citizenship Status in Monroe
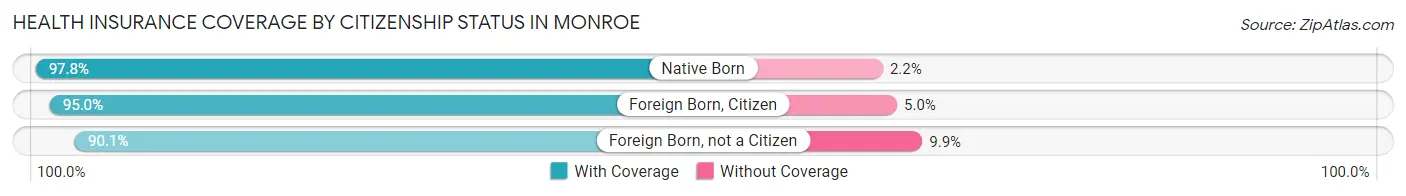
| Citizenship Status | With Coverage | Without Coverage |
| Native Born | 2,056 (97.8%) | 46 (2.2%) |
| Foreign Born, Citizen | 2,660 (95.0%) | 139 (5.0%) |
| Foreign Born, not a Citizen | 1,570 (90.1%) | 173 (9.9%) |
Health Insurance Coverage by Household Income in Monroe
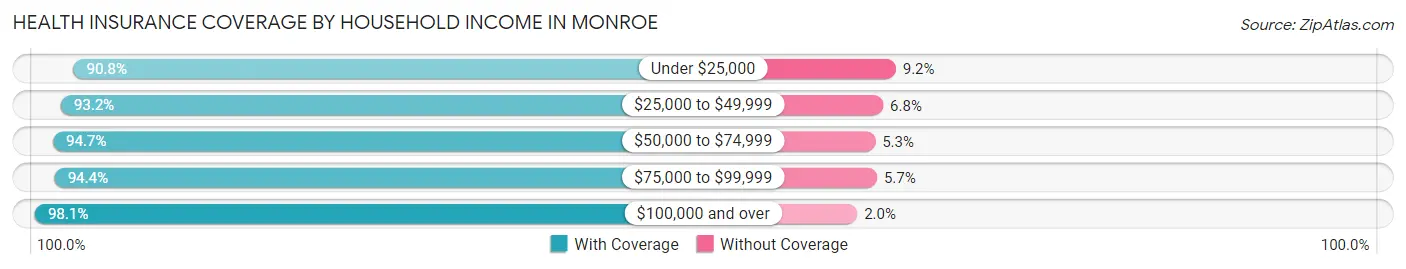
| Household Income | With Coverage | Without Coverage |
| Under $25,000 | 3,095 (90.8%) | 313 (9.2%) |
| $25,000 to $49,999 | 3,788 (93.2%) | 277 (6.8%) |
| $50,000 to $74,999 | 3,444 (94.7%) | 194 (5.3%) |
| $75,000 to $99,999 | 2,489 (94.4%) | 149 (5.7%) |
| $100,000 and over | 6,084 (98.1%) | 121 (1.9%) |
Public vs Private Health Insurance Coverage by Age in Monroe
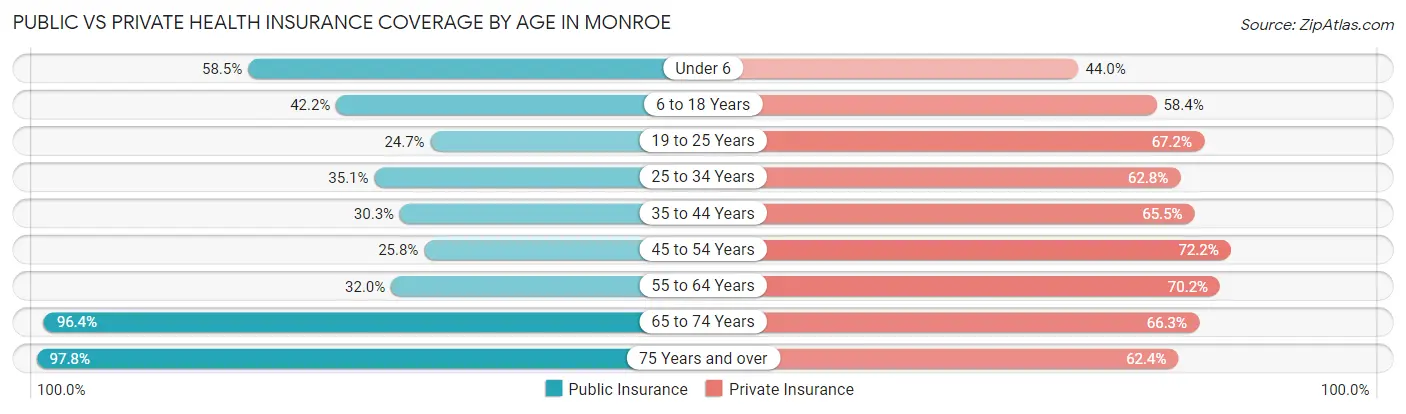
| Age Bracket | Public Insurance | Private Insurance |
| Under 6 | 1,230 (58.5%) | 924 (44.0%) |
| 6 to 18 Years | 1,180 (42.2%) | 1,635 (58.4%) |
| 19 to 25 Years | 430 (24.7%) | 1,171 (67.2%) |
| 25 to 34 Years | 1,057 (35.1%) | 1,892 (62.8%) |
| 35 to 44 Years | 655 (30.3%) | 1,413 (65.4%) |
| 45 to 54 Years | 654 (25.8%) | 1,827 (72.2%) |
| 55 to 64 Years | 865 (32.0%) | 1,899 (70.2%) |
| 65 to 74 Years | 1,784 (96.4%) | 1,226 (66.3%) |
| 75 Years and over | 1,265 (97.8%) | 808 (62.4%) |
| Total | 9,120 (45.2%) | 12,795 (63.3%) |
Disability Status by Sex by Age in Monroe
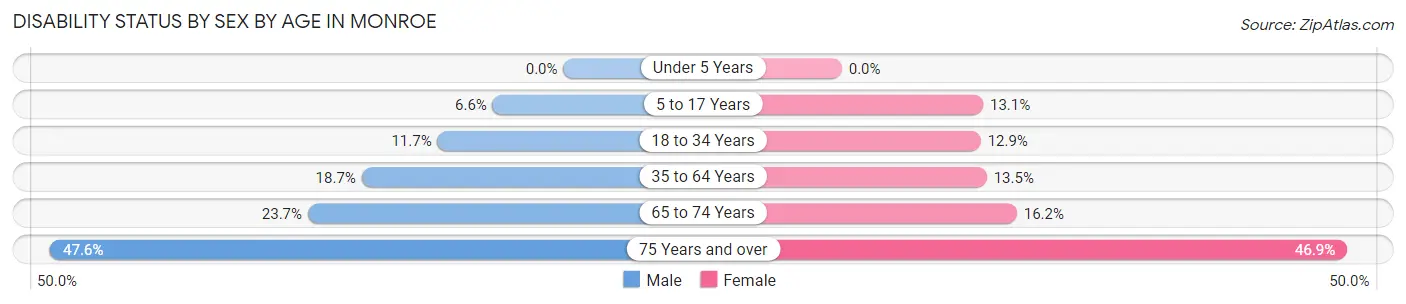
| Age Bracket | Male | Female |
| Under 5 Years | 0 (0.0%) | 0 (0.0%) |
| 5 to 17 Years | 94 (6.6%) | 201 (13.1%) |
| 18 to 34 Years | 288 (11.7%) | 321 (12.9%) |
| 35 to 64 Years | 697 (18.7%) | 494 (13.5%) |
| 65 to 74 Years | 189 (23.7%) | 171 (16.2%) |
| 75 Years and over | 211 (47.6%) | 399 (46.9%) |
Disability Class by Sex by Age in Monroe
Disability Class: Hearing Difficulty
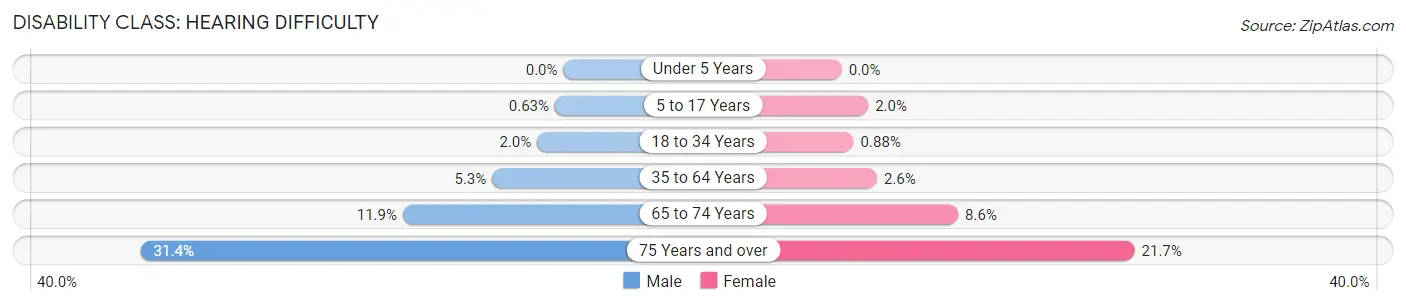
| Age Bracket | Male | Female |
| Under 5 Years | 0 (0.0%) | 0 (0.0%) |
| 5 to 17 Years | 9 (0.6%) | 30 (2.0%) |
| 18 to 34 Years | 48 (1.9%) | 22 (0.9%) |
| 35 to 64 Years | 197 (5.3%) | 96 (2.6%) |
| 65 to 74 Years | 95 (11.9%) | 91 (8.6%) |
| 75 Years and over | 139 (31.4%) | 185 (21.7%) |
Disability Class: Vision Difficulty
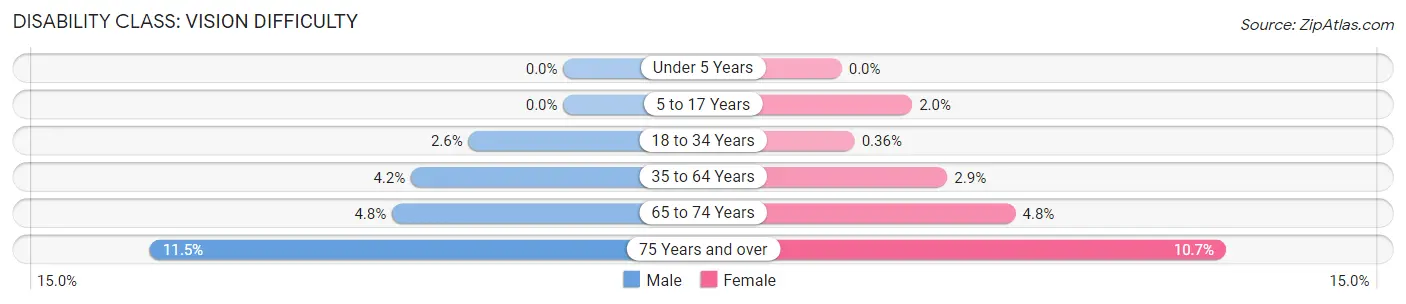
| Age Bracket | Male | Female |
| Under 5 Years | 0 (0.0%) | 0 (0.0%) |
| 5 to 17 Years | 0 (0.0%) | 30 (2.0%) |
| 18 to 34 Years | 65 (2.6%) | 9 (0.4%) |
| 35 to 64 Years | 158 (4.2%) | 108 (2.9%) |
| 65 to 74 Years | 38 (4.8%) | 51 (4.8%) |
| 75 Years and over | 51 (11.5%) | 91 (10.7%) |
Disability Class: Cognitive Difficulty
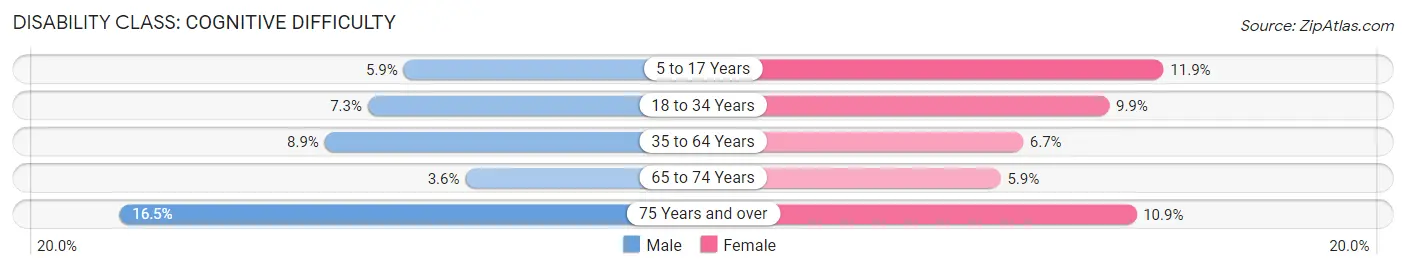
| Age Bracket | Male | Female |
| 5 to 17 Years | 85 (5.9%) | 183 (11.9%) |
| 18 to 34 Years | 179 (7.3%) | 247 (9.9%) |
| 35 to 64 Years | 330 (8.9%) | 247 (6.7%) |
| 65 to 74 Years | 29 (3.6%) | 62 (5.9%) |
| 75 Years and over | 73 (16.5%) | 93 (10.9%) |
Disability Class: Ambulatory Difficulty
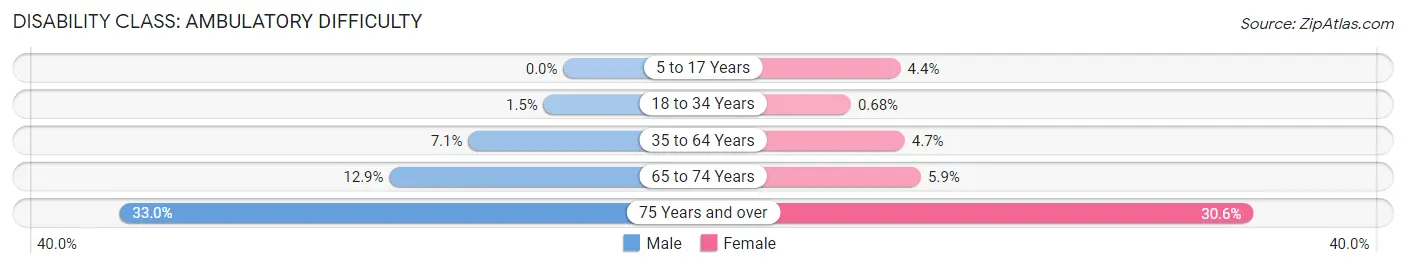
| Age Bracket | Male | Female |
| 5 to 17 Years | 0 (0.0%) | 67 (4.4%) |
| 18 to 34 Years | 36 (1.5%) | 17 (0.7%) |
| 35 to 64 Years | 263 (7.1%) | 172 (4.7%) |
| 65 to 74 Years | 103 (12.9%) | 62 (5.9%) |
| 75 Years and over | 146 (33.0%) | 260 (30.5%) |
Disability Class: Self-Care Difficulty
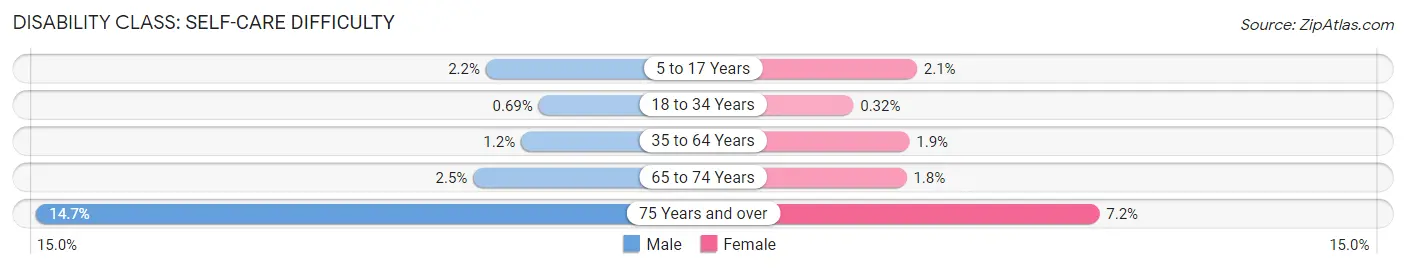
| Age Bracket | Male | Female |
| 5 to 17 Years | 31 (2.2%) | 32 (2.1%) |
| 18 to 34 Years | 17 (0.7%) | 8 (0.3%) |
| 35 to 64 Years | 44 (1.2%) | 69 (1.9%) |
| 65 to 74 Years | 20 (2.5%) | 19 (1.8%) |
| 75 Years and over | 65 (14.7%) | 61 (7.2%) |
Technology Access in Monroe
Computing Device Access in Monroe
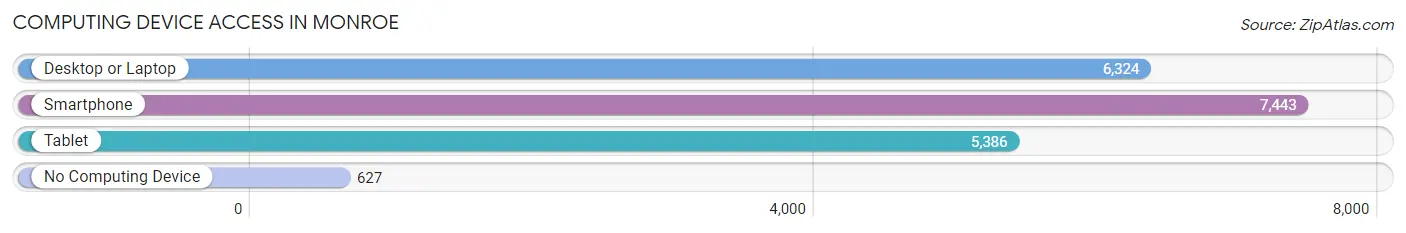
| Device Type | # Households | % Households |
| Desktop or Laptop | 6,324 | 74.1% |
| Smartphone | 7,443 | 87.2% |
| Tablet | 5,386 | 63.1% |
| No Computing Device | 627 | 7.3% |
| Total | 8,532 | 100.0% |
Internet Access in Monroe
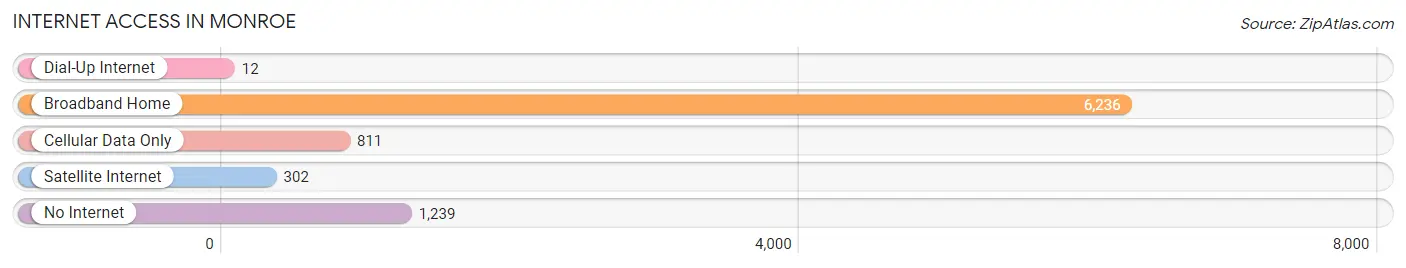
| Internet Type | # Households | % Households |
| Dial-Up Internet | 12 | 0.1% |
| Broadband Home | 6,236 | 73.1% |
| Cellular Data Only | 811 | 9.5% |
| Satellite Internet | 302 | 3.5% |
| No Internet | 1,239 | 14.5% |
| Total | 8,532 | 100.0% |
Monroe Summary
Monroe, Michigan is a city located in the southeastern corner of the state, along the shores of Lake Erie. It is the county seat of Monroe County and is part of the Detroit metropolitan area. The city has a population of approximately 20,000 people and is known for its rich history, diverse geography, and vibrant economy.
History
Monroe was first settled in 1784 by French-Canadian fur traders. The city was named after James Monroe, the fifth President of the United States. In 1817, the city was officially incorporated and became the county seat of Monroe County. During the 19th century, Monroe was a major port city and a hub for the Great Lakes shipping industry. The city was also a major stop on the Underground Railroad, providing a safe haven for escaped slaves.
In the early 20th century, Monroe experienced a period of rapid growth and industrialization. The city was home to several large factories, including the Monroe Auto Equipment Company, which produced parts for the automotive industry. The city also became a major center for the production of glass and steel products.
Geography
Monroe is located in the southeastern corner of Michigan, along the shores of Lake Erie. The city is situated on the banks of the River Raisin, which flows into Lake Erie. The city is surrounded by several small towns and villages, including Dundee, Maybee, and Ida. The city is also located near the Michigan-Ohio border, and is approximately 40 miles from Toledo, Ohio.
The city has a total area of 8.7 square miles, of which 8.3 square miles is land and 0.4 square miles is water. The terrain is mostly flat, with some rolling hills in the northern part of the city. The climate is humid continental, with hot summers and cold winters.
Economy
Monroe’s economy is largely based on manufacturing and tourism. The city is home to several large factories, including the Monroe Auto Equipment Company, which produces parts for the automotive industry. The city is also a major center for the production of glass and steel products.
The city is also a popular tourist destination, with several attractions, including the River Raisin National Battlefield Park, the Monroe County Historical Museum, and the Monroe County Fairgrounds. The city is also home to several festivals and events, including the Monroe County Fair and the Monroe County Music Festival.
Demographics
As of the 2010 census, Monroe had a population of 20,733 people. The racial makeup of the city was 87.3% White, 8.2% African American, 0.5% Native American, 0.7% Asian, 0.1% Pacific Islander, and 2.2% from other races. The median household income was $37,945, and the median family income was $45,945. The per capita income was $19,945.
Monroe is a diverse city, with a variety of cultures and backgrounds. The city is home to a large Hispanic population, as well as a significant number of African Americans and Native Americans. The city also has a large number of immigrants from Europe, Asia, and Latin America.
Common Questions
What is Per Capita Income in Monroe?
Per Capita income in Monroe is $29,814.
What is the Median Family Income in Monroe?
Median Family Income in Monroe is $72,500.
What is the Median Household income in Monroe?
Median Household Income in Monroe is $57,779.
What is Income or Wage Gap in Monroe?
Income or Wage Gap in Monroe is 40.6%.
Women in Monroe earn 59.4 cents for every dollar earned by a man.
What is Family Income Deficit in Monroe?
Family Income Deficit in Monroe is $11,465.
Families that are below poverty line in Monroe earn $11,465 less on average than the poverty threshold level.
What is Inequality or Gini Index in Monroe?
Inequality or Gini Index in Monroe is 0.43.
What is the Total Population of Monroe?
Total Population of Monroe is 20,400.
What is the Total Male Population of Monroe?
Total Male Population of Monroe is 9,797.
What is the Total Female Population of Monroe?
Total Female Population of Monroe is 10,603.
What is the Ratio of Males per 100 Females in Monroe?
There are 92.40 Males per 100 Females in Monroe.
What is the Ratio of Females per 100 Males in Monroe?
There are 108.23 Females per 100 Males in Monroe.
What is the Median Population Age in Monroe?
Median Population Age in Monroe is 36.6 Years.
What is the Average Family Size in Monroe
Average Family Size in Monroe is 3.1 People.
What is the Average Household Size in Monroe
Average Household Size in Monroe is 2.3 People.
How Large is the Labor Force in Monroe?
There are 9,522 People in the Labor Forcein in Monroe.
What is the Percentage of People in the Labor Force in Monroe?
59.4% of People are in the Labor Force in Monroe.
What is the Unemployment Rate in Monroe?
Unemployment Rate in Monroe is 7.8%.