Zip Codes with the Highest Percentage of Population with a Degree in Visual and Performing Arts in Glen Burnie, MD
RELATED REPORTS & OPTIONS
Visual and Performing Arts
Glen Burnie
Compare Zip Codes
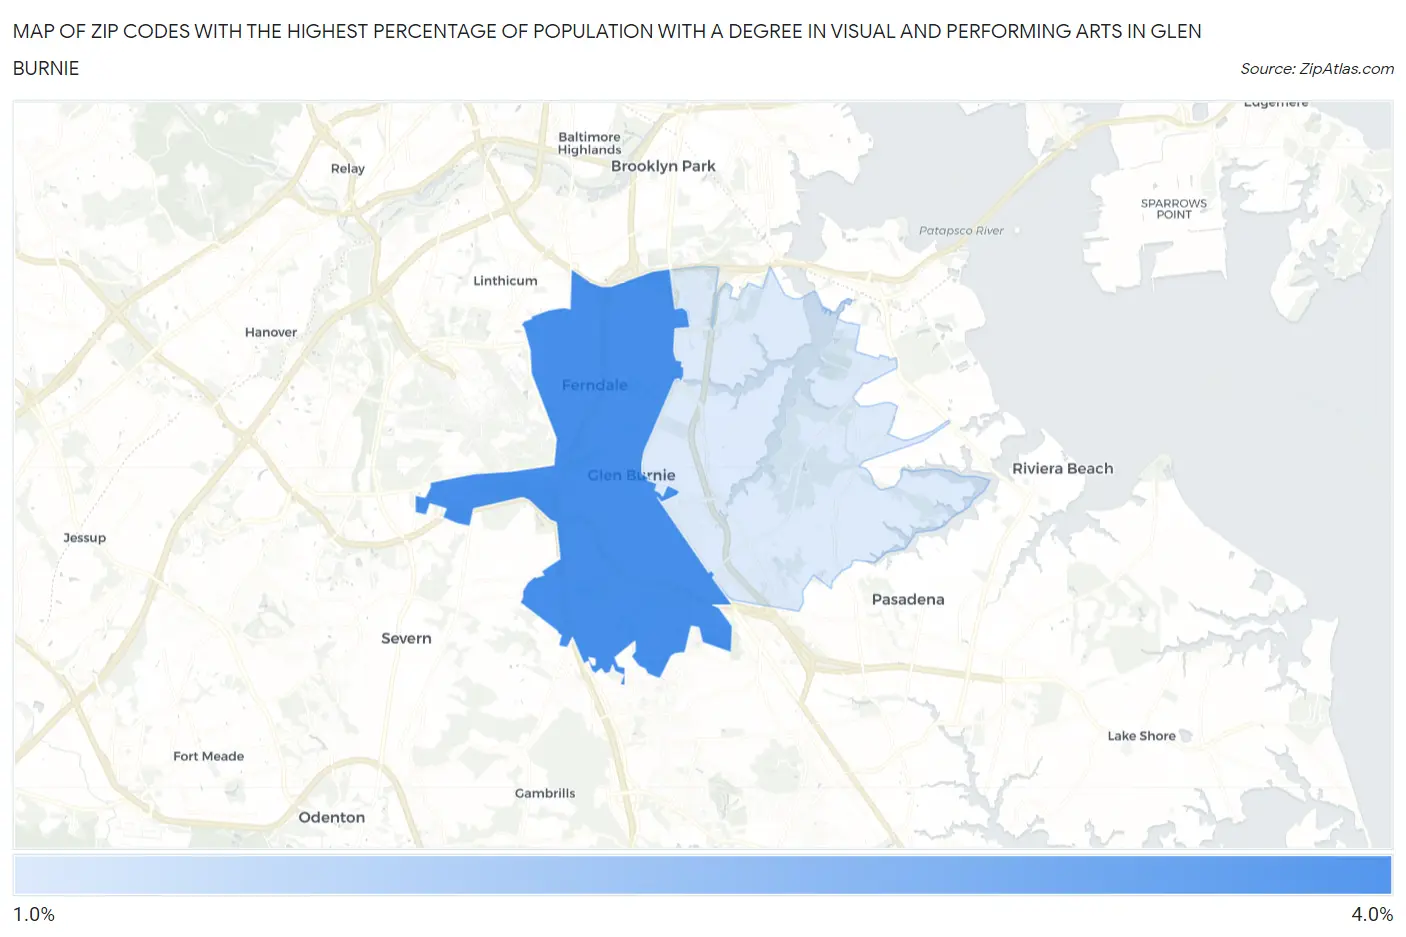
Map of Zip Codes with the Highest Percentage of Population with a Degree in Visual and Performing Arts in Glen Burnie
1.8%
3.8%
Zip Codes with the Highest Percentage of Population with a Degree in Visual and Performing Arts in Glen Burnie, MD
| Zip Code | % Graduates | vs State | vs National | |
| 1. | 21061 | 3.8% | 3.8%(-0.004)#181 | 4.3%(-0.433)#9,811 |
| 2. | 21060 | 1.8% | 3.8%(-2.05)#316 | 4.3%(-2.48)#17,222 |
1
Common Questions
What are the Top Zip Codes with the Highest Percentage of Population with a Degree in Visual and Performing Arts in Glen Burnie, MD?
Top Zip Codes with the Highest Percentage of Population with a Degree in Visual and Performing Arts in Glen Burnie, MD are:
What zip code has the Highest Percentage of Population with a Degree in Visual and Performing Arts in Glen Burnie, MD?
21061 has the Highest Percentage of Population with a Degree in Visual and Performing Arts in Glen Burnie, MD with 3.8%.
What is the Percentage of Population with a Degree in Visual and Performing Arts in Glen Burnie, MD?
Percentage of Population with a Degree in Visual and Performing Arts in Glen Burnie is 3.2%.
What is the Percentage of Population with a Degree in Visual and Performing Arts in Maryland?
Percentage of Population with a Degree in Visual and Performing Arts in Maryland is 3.8%.
What is the Percentage of Population with a Degree in Visual and Performing Arts in the United States?
Percentage of Population with a Degree in Visual and Performing Arts in the United States is 4.3%.