Zip Codes with the Highest Percentage of Population with a Degree in Visual and Performing Arts in Baltimore, MD
RELATED REPORTS & OPTIONS
Visual and Performing Arts
Baltimore
Compare Zip Codes
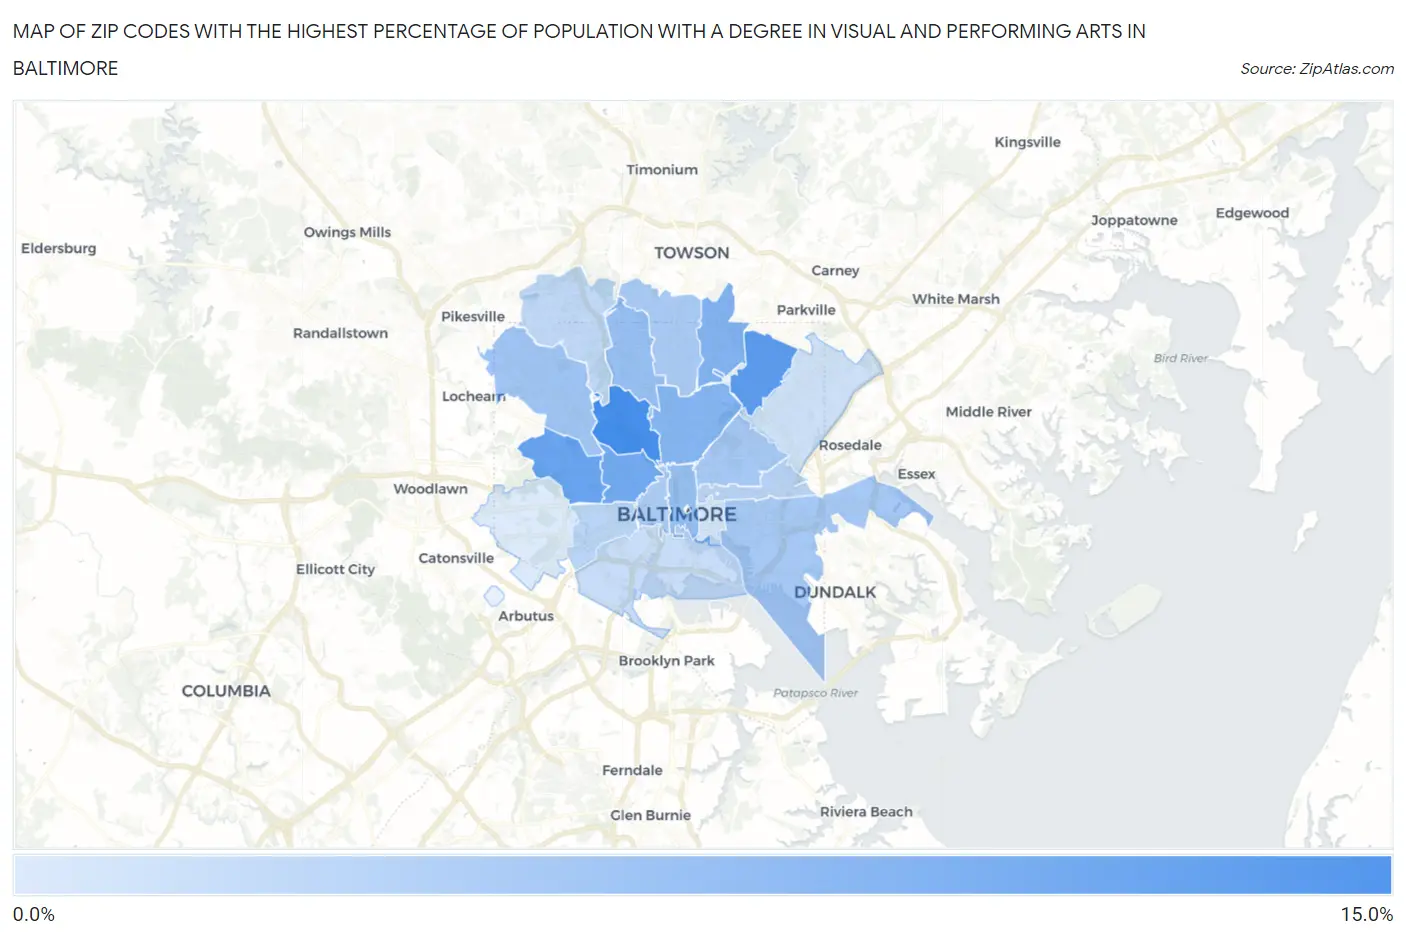
Map of Zip Codes with the Highest Percentage of Population with a Degree in Visual and Performing Arts in Baltimore
3.1%
13.2%
Zip Codes with the Highest Percentage of Population with a Degree in Visual and Performing Arts in Baltimore, MD
| Zip Code | % Graduates | vs State | vs National | |
| 1. | 21211 | 13.2% | 3.8%(+9.40)#16 | 4.3%(+8.97)#1,064 |
| 2. | 21214 | 11.9% | 3.8%(+8.10)#19 | 4.3%(+7.67)#1,301 |
| 3. | 21216 | 10.8% | 3.8%(+7.00)#25 | 4.3%(+6.57)#1,579 |
| 4. | 21217 | 10.2% | 3.8%(+6.40)#32 | 4.3%(+5.97)#1,768 |
| 5. | 21239 | 9.0% | 3.8%(+5.18)#41 | 4.3%(+4.75)#2,263 |
| 6. | 21218 | 8.9% | 3.8%(+5.10)#43 | 4.3%(+4.67)#2,297 |
| 7. | 21202 | 7.7% | 3.8%(+3.90)#49 | 4.3%(+3.47)#3,037 |
| 8. | 21210 | 7.7% | 3.8%(+3.87)#50 | 4.3%(+3.44)#3,054 |
| 9. | 21215 | 7.0% | 3.8%(+3.14)#59 | 4.3%(+2.71)#3,693 |
| 10. | 21213 | 6.8% | 3.8%(+2.93)#62 | 4.3%(+2.50)#3,932 |
| 11. | 21224 | 6.7% | 3.8%(+2.90)#64 | 4.3%(+2.47)#3,959 |
| 12. | 21212 | 6.4% | 3.8%(+2.62)#72 | 4.3%(+2.20)#4,294 |
| 13. | 21201 | 6.3% | 3.8%(+2.45)#73 | 4.3%(+2.03)#4,499 |
| 14. | 21205 | 5.5% | 3.8%(+1.71)#88 | 4.3%(+1.28)#5,623 |
| 15. | 21223 | 5.3% | 3.8%(+1.47)#91 | 4.3%(+1.04)#6,064 |
| 16. | 21209 | 4.9% | 3.8%(+1.04)#110 | 4.3%(+0.609)#6,944 |
| 17. | 21230 | 4.5% | 3.8%(+0.671)#132 | 4.3%(+0.242)#7,828 |
| 18. | 21206 | 3.9% | 3.8%(+0.072)#172 | 4.3%(-0.357)#9,594 |
| 19. | 21231 | 3.8% | 3.8%(+0.006)#179 | 4.3%(-0.423)#9,788 |
| 20. | 21229 | 3.1% | 3.8%(-0.751)#228 | 4.3%(-1.18)#12,447 |
1
Common Questions
What are the Top 10 Zip Codes with the Highest Percentage of Population with a Degree in Visual and Performing Arts in Baltimore, MD?
Top 10 Zip Codes with the Highest Percentage of Population with a Degree in Visual and Performing Arts in Baltimore, MD are:
What zip code has the Highest Percentage of Population with a Degree in Visual and Performing Arts in Baltimore, MD?
21211 has the Highest Percentage of Population with a Degree in Visual and Performing Arts in Baltimore, MD with 13.2%.
What is the Percentage of Population with a Degree in Visual and Performing Arts in Baltimore, MD?
Percentage of Population with a Degree in Visual and Performing Arts in Baltimore is 7.4%.
What is the Percentage of Population with a Degree in Visual and Performing Arts in Maryland?
Percentage of Population with a Degree in Visual and Performing Arts in Maryland is 3.8%.
What is the Percentage of Population with a Degree in Visual and Performing Arts in the United States?
Percentage of Population with a Degree in Visual and Performing Arts in the United States is 4.3%.