Pembroke, KY Map & Demographics
Pembroke Map
Pembroke Overview
$30,572
PER CAPITA INCOME
$100,833
AVG FAMILY INCOME
$80,893
AVG HOUSEHOLD INCOME
37.2%
WAGE / INCOME GAP [ % ]
62.8¢/ $1
WAGE / INCOME GAP [ $ ]
0.34
INEQUALITY / GINI INDEX
900
TOTAL POPULATION
477
MALE POPULATION
423
FEMALE POPULATION
112.77
MALES / 100 FEMALES
88.68
FEMALES / 100 MALES
37.8
MEDIAN AGE
2.9
AVG FAMILY SIZE
2.5
AVG HOUSEHOLD SIZE
426
LABOR FORCE [ PEOPLE ]
57.4%
PERCENT IN LABOR FORCE
3.8%
UNEMPLOYMENT RATE
Pembroke Zip Codes
Pembroke Area Codes
Income in Pembroke
Income Overview in Pembroke
Per Capita Income in Pembroke is $30,572, while median incomes of families and households are $100,833 and $80,893 respectively.
| Characteristic | Number | Measure |
| Per Capita Income | 900 | $30,572 |
| Median Family Income | 246 | $100,833 |
| Mean Family Income | 246 | $99,624 |
| Median Household Income | 338 | $80,893 |
| Mean Household Income | 338 | $84,449 |
| Income Deficit | 246 | $0 |
| Wage / Income Gap (%) | 900 | 37.21% |
| Wage / Income Gap ($) | 900 | 62.79¢ per $1 |
| Gini / Inequality Index | 900 | 0.34 |
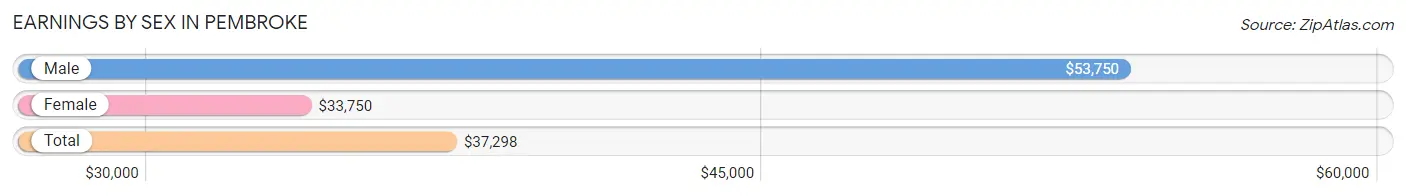
Earnings by Sex in Pembroke
Average Earnings in Pembroke are $37,298, $53,750 for men and $33,750 for women, a difference of 37.2%.
| Sex | Number | Average Earnings |
| Male | 263 (55.8%) | $53,750 |
| Female | 208 (44.2%) | $33,750 |
| Total | 471 (100.0%) | $37,298 |
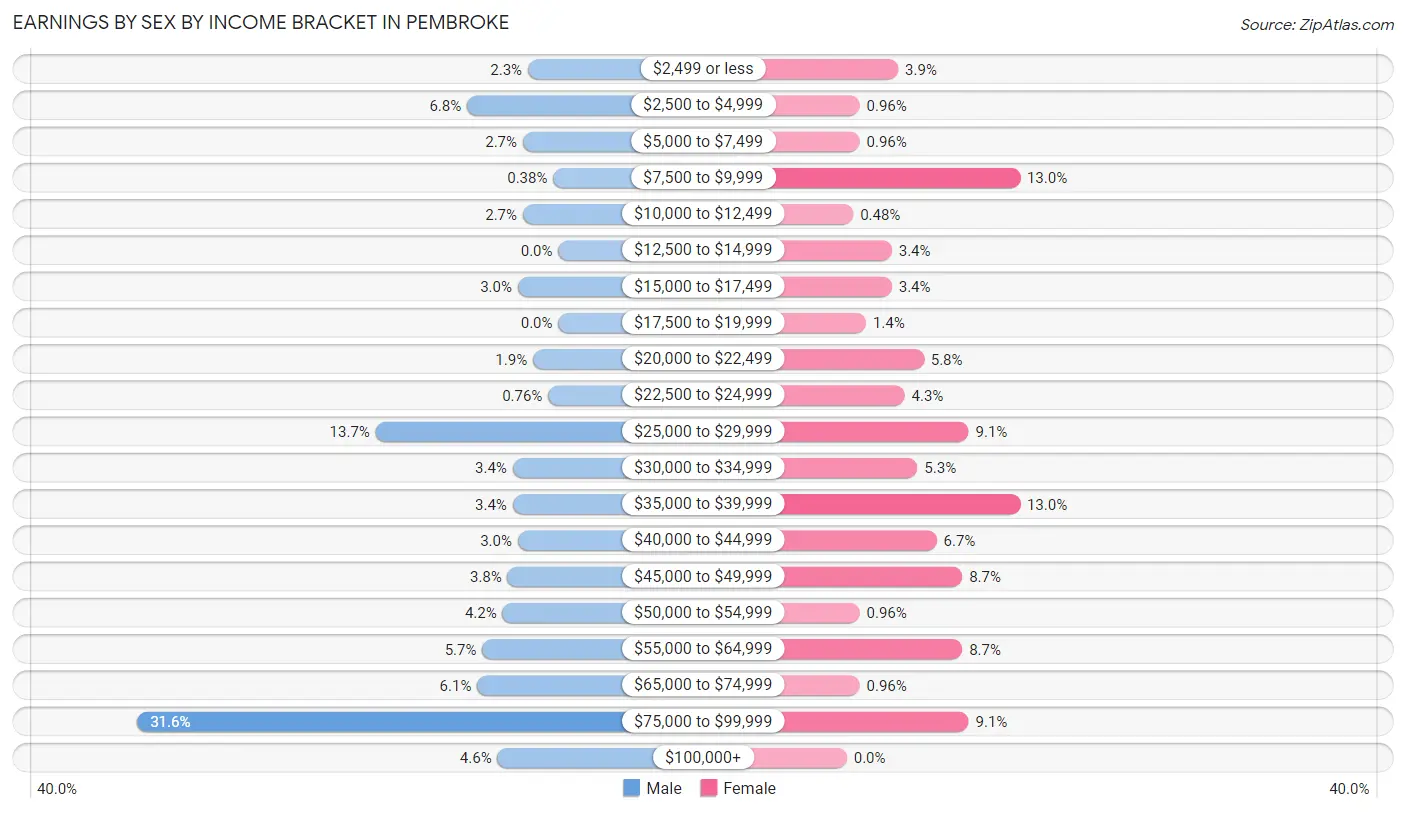
Earnings by Sex by Income Bracket in Pembroke
The most common earnings brackets in Pembroke are $75,000 to $99,999 for men (83 | 31.6%) and $7,500 to $9,999 for women (27 | 13.0%).
| Income | Male | Female |
| $2,499 or less | 6 (2.3%) | 8 (3.8%) |
| $2,500 to $4,999 | 18 (6.8%) | 2 (1.0%) |
| $5,000 to $7,499 | 7 (2.7%) | 2 (1.0%) |
| $7,500 to $9,999 | 1 (0.4%) | 27 (13.0%) |
| $10,000 to $12,499 | 7 (2.7%) | 1 (0.5%) |
| $12,500 to $14,999 | 0 (0.0%) | 7 (3.4%) |
| $15,000 to $17,499 | 8 (3.0%) | 7 (3.4%) |
| $17,500 to $19,999 | 0 (0.0%) | 3 (1.4%) |
| $20,000 to $22,499 | 5 (1.9%) | 12 (5.8%) |
| $22,500 to $24,999 | 2 (0.8%) | 9 (4.3%) |
| $25,000 to $29,999 | 36 (13.7%) | 19 (9.1%) |
| $30,000 to $34,999 | 9 (3.4%) | 11 (5.3%) |
| $35,000 to $39,999 | 9 (3.4%) | 27 (13.0%) |
| $40,000 to $44,999 | 8 (3.0%) | 14 (6.7%) |
| $45,000 to $49,999 | 10 (3.8%) | 18 (8.6%) |
| $50,000 to $54,999 | 11 (4.2%) | 2 (1.0%) |
| $55,000 to $64,999 | 15 (5.7%) | 18 (8.6%) |
| $65,000 to $74,999 | 16 (6.1%) | 2 (1.0%) |
| $75,000 to $99,999 | 83 (31.6%) | 19 (9.1%) |
| $100,000+ | 12 (4.6%) | 0 (0.0%) |
| Total | 263 (100.0%) | 208 (100.0%) |
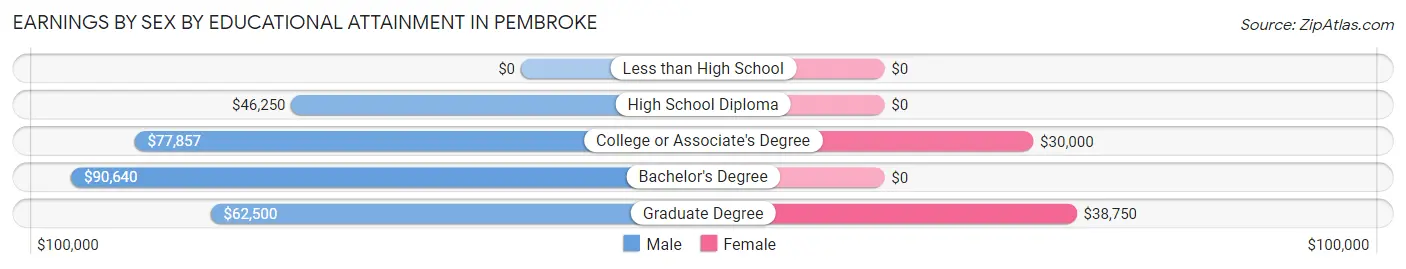
Earnings by Sex by Educational Attainment in Pembroke
Average earnings in Pembroke are $70,500 for men and $34,063 for women, a difference of 51.7%. Men with an educational attainment of bachelor's degree enjoy the highest average annual earnings of $90,640, while those with high school diploma education earn the least with $46,250. Women with an educational attainment of graduate degree earn the most with the average annual earnings of $38,750, while those with college or associate's degree education have the smallest earnings of $30,000.
| Educational Attainment | Male Income | Female Income |
| Less than High School | - | - |
| High School Diploma | $46,250 | $0 |
| College or Associate's Degree | $77,857 | $30,000 |
| Bachelor's Degree | $90,640 | $0 |
| Graduate Degree | $62,500 | $38,750 |
| Total | $70,500 | $34,063 |
Family Income in Pembroke
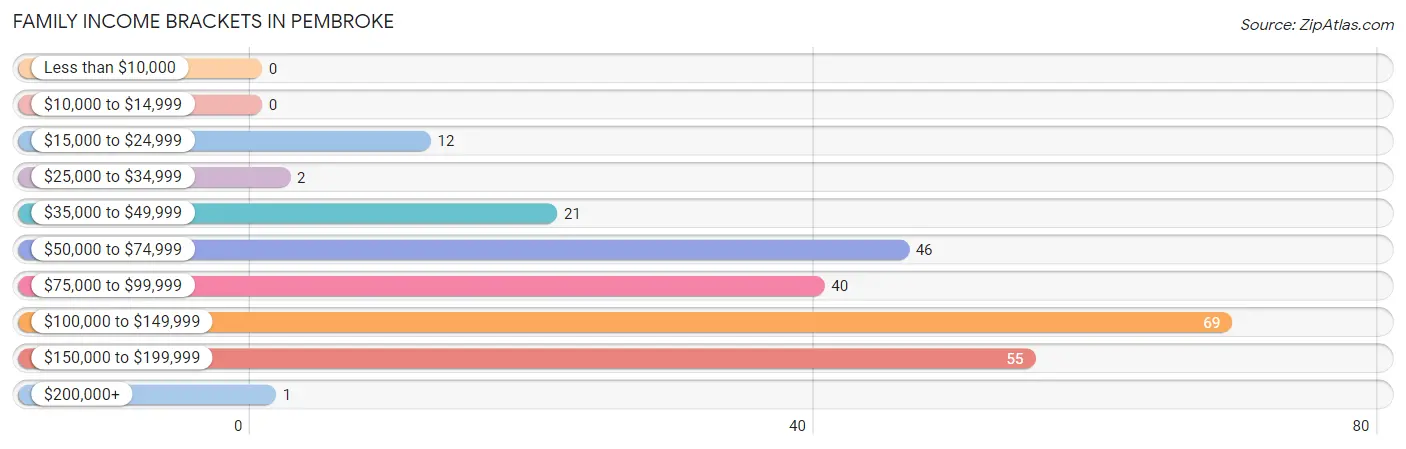
Family Income Brackets in Pembroke
According to the Pembroke family income data, there are 69 families falling into the $100,000 to $149,999 income range, which is the most common income bracket and makes up 28.1% of all families.
| Income Bracket | # Families | % Families |
| Less than $10,000 | 0 | 0.0% |
| $10,000 to $14,999 | 0 | 0.0% |
| $15,000 to $24,999 | 12 | 4.9% |
| $25,000 to $34,999 | 2 | 0.8% |
| $35,000 to $49,999 | 21 | 8.5% |
| $50,000 to $74,999 | 46 | 18.7% |
| $75,000 to $99,999 | 40 | 16.3% |
| $100,000 to $149,999 | 69 | 28.0% |
| $150,000 to $199,999 | 55 | 22.4% |
| $200,000+ | 1 | 0.4% |
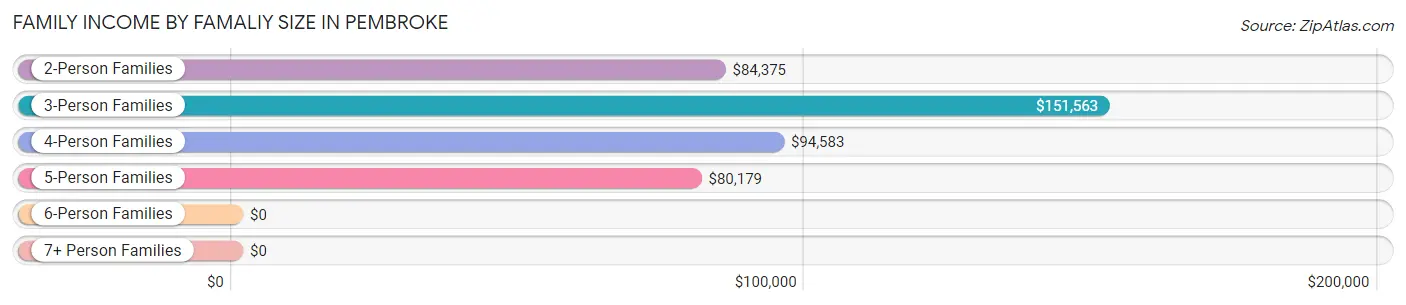
Family Income by Famaliy Size in Pembroke
3-person families (87 | 35.4%) account for the highest median family income in Pembroke with $151,563 per family, while 3-person families (87 | 35.4%) have the highest median income of $50,521 per family member.
| Income Bracket | # Families | Median Income |
| 2-Person Families | 95 (38.6%) | $84,375 |
| 3-Person Families | 87 (35.4%) | $151,563 |
| 4-Person Families | 35 (14.2%) | $94,583 |
| 5-Person Families | 26 (10.6%) | $80,179 |
| 6-Person Families | 3 (1.2%) | $0 |
| 7+ Person Families | 0 (0.0%) | $0 |
| Total | 246 (100.0%) | $100,833 |
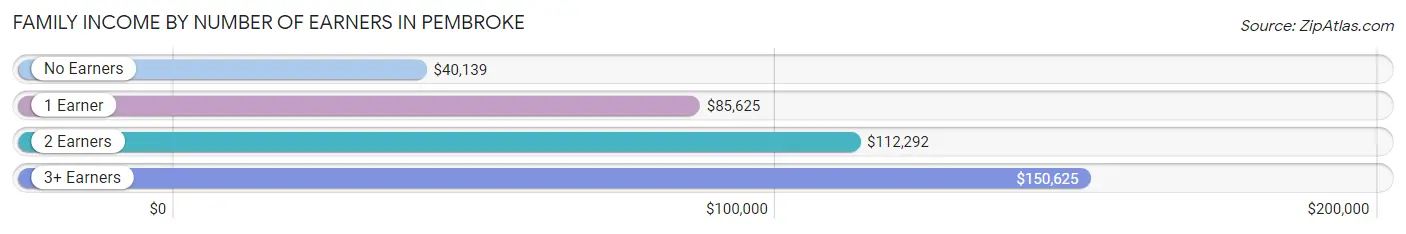
Family Income by Number of Earners in Pembroke
The median family income in Pembroke is $100,833, with families comprising 3+ earners (24) having the highest median family income of $150,625, while families with no earners (37) have the lowest median family income of $40,139, accounting for 9.8% and 15.0% of families, respectively.
| Number of Earners | # Families | Median Income |
| No Earners | 37 (15.0%) | $40,139 |
| 1 Earner | 53 (21.5%) | $85,625 |
| 2 Earners | 132 (53.7%) | $112,292 |
| 3+ Earners | 24 (9.8%) | $150,625 |
| Total | 246 (100.0%) | $100,833 |
Household Income in Pembroke
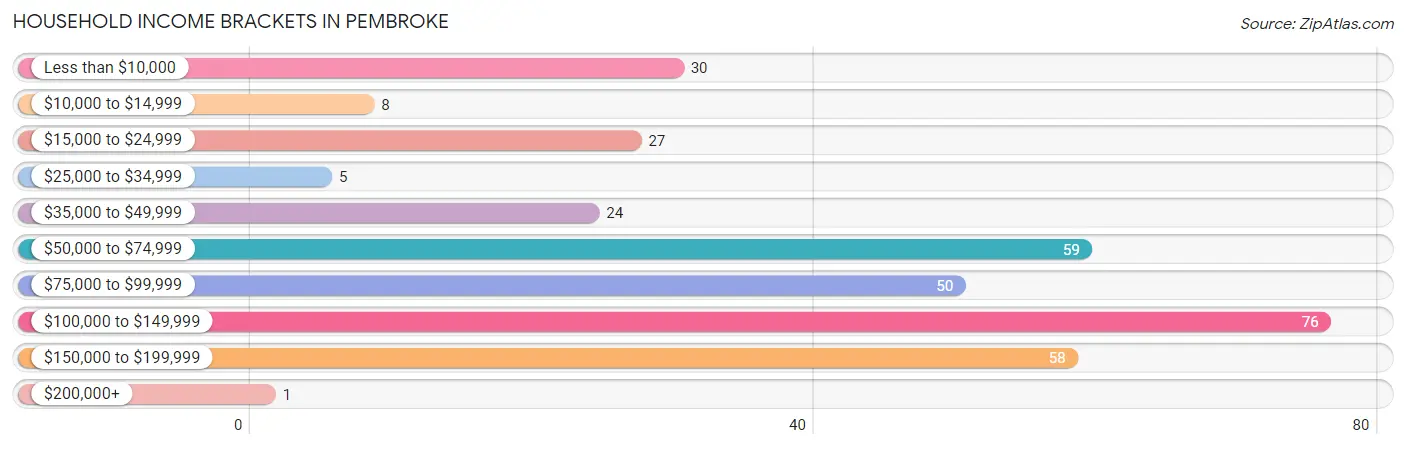
Household Income Brackets in Pembroke
With 76 households falling in the category, the $100,000 to $149,999 income range is the most frequent in Pembroke, accounting for 22.5% of all households. In contrast, only 1 households (0.3%) fall into the $200,000+ income bracket, making it the least populous group.
| Income Bracket | # Households | % Households |
| Less than $10,000 | 30 | 8.9% |
| $10,000 to $14,999 | 8 | 2.4% |
| $15,000 to $24,999 | 27 | 8.0% |
| $25,000 to $34,999 | 5 | 1.5% |
| $35,000 to $49,999 | 24 | 7.1% |
| $50,000 to $74,999 | 59 | 17.5% |
| $75,000 to $99,999 | 50 | 14.8% |
| $100,000 to $149,999 | 76 | 22.5% |
| $150,000 to $199,999 | 58 | 17.2% |
| $200,000+ | 1 | 0.3% |
Household Income by Householder Age in Pembroke
The median household income in Pembroke is $80,893, with the highest median household income of $98,750 found in the 25 to 44 years age bracket for the primary householder. A total of 141 households (41.7%) fall into this category. Meanwhile, the 15 to 24 years age bracket for the primary householder has the lowest median household income of $0, with 12 households (3.5%) in this group.
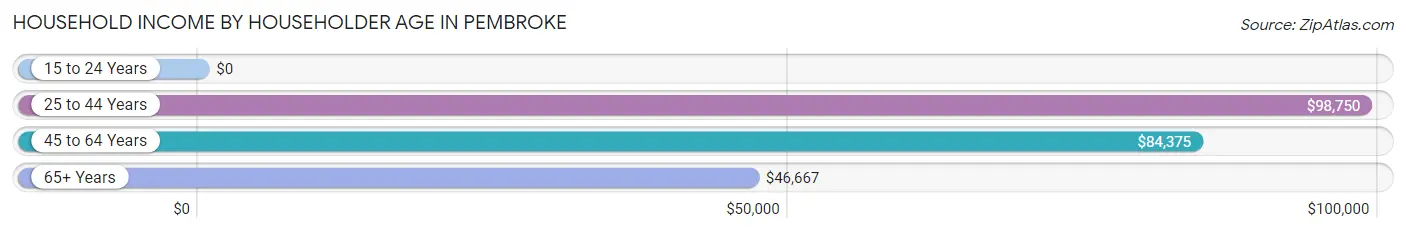
| Income Bracket | # Households | Median Income |
| 15 to 24 Years | 12 (3.5%) | $0 |
| 25 to 44 Years | 141 (41.7%) | $98,750 |
| 45 to 64 Years | 115 (34.0%) | $84,375 |
| 65+ Years | 70 (20.7%) | $46,667 |
| Total | 338 (100.0%) | $80,893 |
Poverty in Pembroke
Income Below Poverty by Sex and Age in Pembroke
With 5.7% poverty level for males and 8.5% for females among the residents of Pembroke, 45 to 54 year old males and 55 to 64 year old females are the most vulnerable to poverty, with 14 males (36.8%) and 24 females (28.2%) in their respective age groups living below the poverty level.
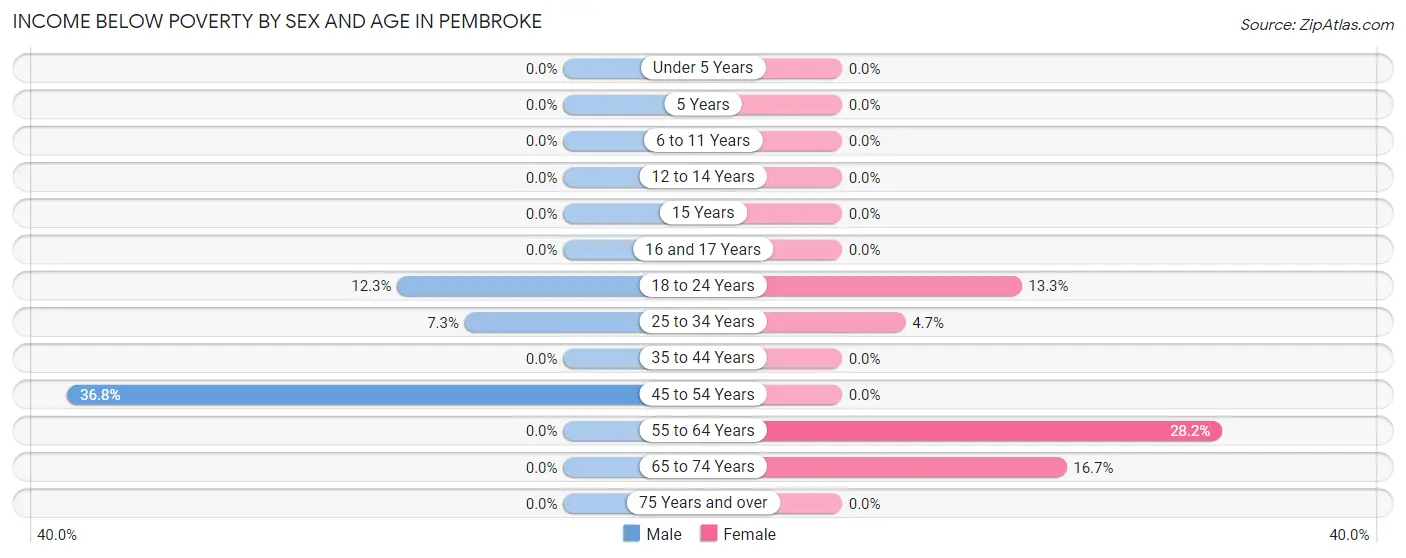
| Age Bracket | Male | Female |
| Under 5 Years | 0 (0.0%) | 0 (0.0%) |
| 5 Years | 0 (0.0%) | 0 (0.0%) |
| 6 to 11 Years | 0 (0.0%) | 0 (0.0%) |
| 12 to 14 Years | 0 (0.0%) | 0 (0.0%) |
| 15 Years | 0 (0.0%) | 0 (0.0%) |
| 16 and 17 Years | 0 (0.0%) | 0 (0.0%) |
| 18 to 24 Years | 9 (12.3%) | 2 (13.3%) |
| 25 to 34 Years | 3 (7.3%) | 4 (4.7%) |
| 35 to 44 Years | 0 (0.0%) | 0 (0.0%) |
| 45 to 54 Years | 14 (36.8%) | 0 (0.0%) |
| 55 to 64 Years | 0 (0.0%) | 24 (28.2%) |
| 65 to 74 Years | 0 (0.0%) | 3 (16.7%) |
| 75 Years and over | 0 (0.0%) | 0 (0.0%) |
| Total | 26 (5.7%) | 33 (8.5%) |
Income Above Poverty by Sex and Age in Pembroke
According to the poverty statistics in Pembroke, males aged under 5 years and females aged under 5 years are the age groups that are most secure financially, with 100.0% of males and 100.0% of females in these age groups living above the poverty line.
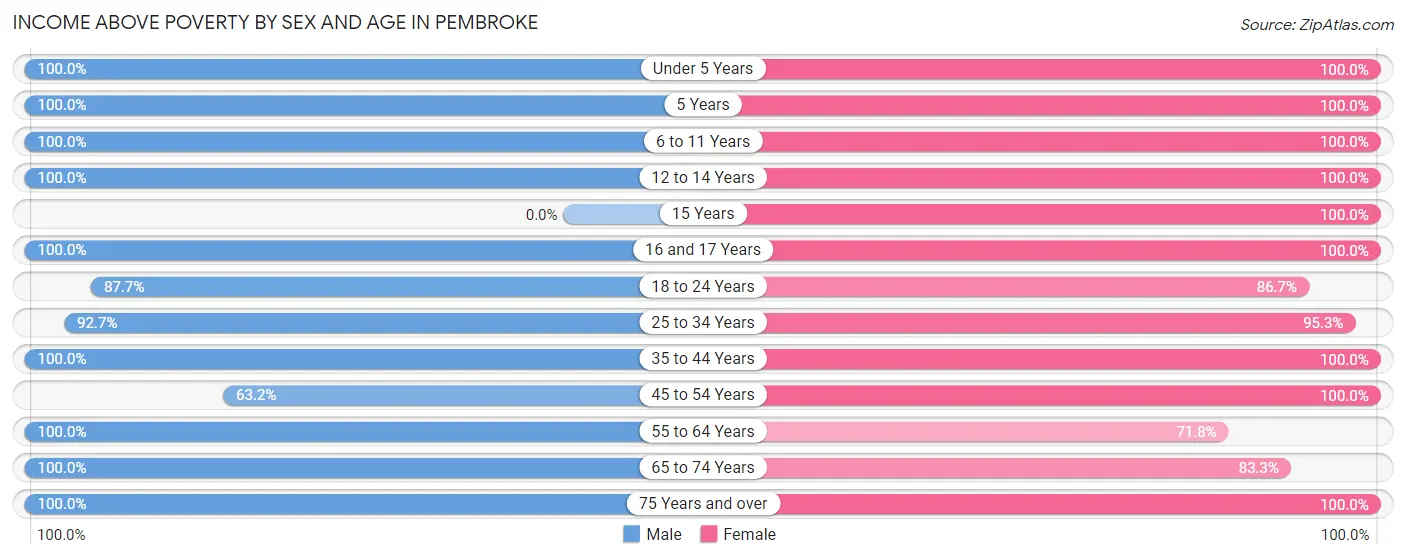
| Age Bracket | Male | Female |
| Under 5 Years | 23 (100.0%) | 32 (100.0%) |
| 5 Years | 14 (100.0%) | 2 (100.0%) |
| 6 to 11 Years | 46 (100.0%) | 17 (100.0%) |
| 12 to 14 Years | 8 (100.0%) | 6 (100.0%) |
| 15 Years | 0 (0.0%) | 5 (100.0%) |
| 16 and 17 Years | 5 (100.0%) | 5 (100.0%) |
| 18 to 24 Years | 64 (87.7%) | 13 (86.7%) |
| 25 to 34 Years | 38 (92.7%) | 81 (95.3%) |
| 35 to 44 Years | 79 (100.0%) | 52 (100.0%) |
| 45 to 54 Years | 24 (63.2%) | 23 (100.0%) |
| 55 to 64 Years | 74 (100.0%) | 61 (71.8%) |
| 65 to 74 Years | 35 (100.0%) | 15 (83.3%) |
| 75 Years and over | 17 (100.0%) | 43 (100.0%) |
| Total | 427 (94.3%) | 355 (91.5%) |
Income Below Poverty Among Married-Couple Families in Pembroke
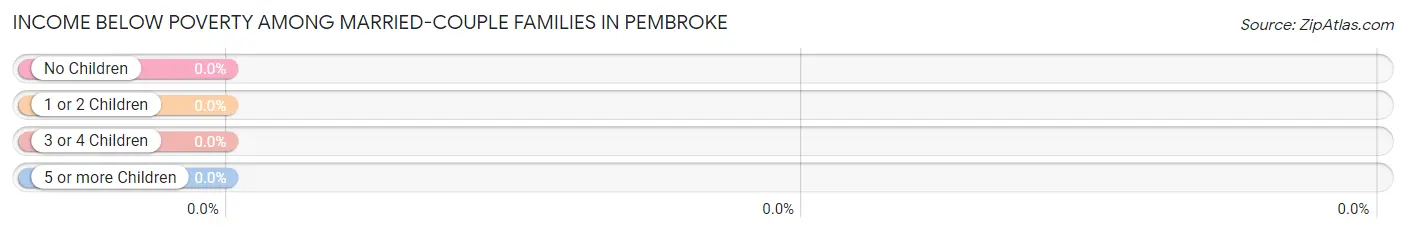
| Children | Above Poverty | Below Poverty |
| No Children | 95 (100.0%) | 0 (0.0%) |
| 1 or 2 Children | 63 (100.0%) | 0 (0.0%) |
| 3 or 4 Children | 21 (100.0%) | 0 (0.0%) |
| 5 or more Children | 0 (0.0%) | 0 (0.0%) |
| Total | 179 (100.0%) | 0 (0.0%) |
Income Below Poverty Among Single-Parent Households in Pembroke
According to the poverty data in Pembroke, 5.0% or 2 single-father households and 11.1% or 3 single-mother households are living below the poverty line. Among single-father households, those with no children have the highest poverty rate, with 2 households (5.0%) experiencing poverty. Likewise, among single-mother households, those with no children have the highest poverty rate, with 3 households (17.6%) falling below the poverty line.
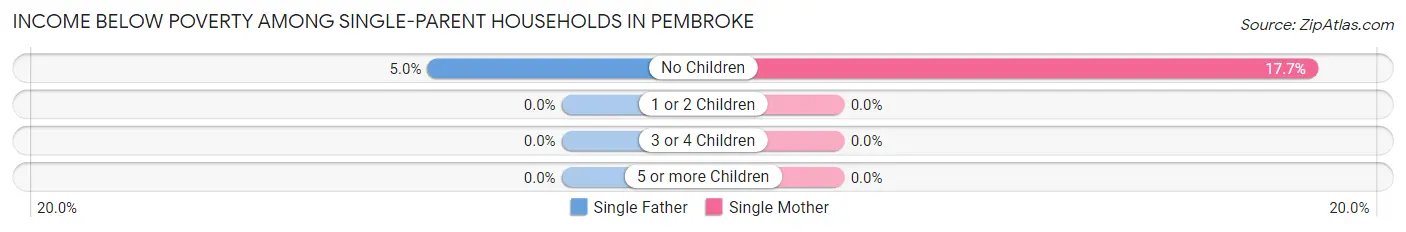
| Children | Single Father | Single Mother |
| No Children | 2 (5.0%) | 3 (17.6%) |
| 1 or 2 Children | 0 (0.0%) | 0 (0.0%) |
| 3 or 4 Children | 0 (0.0%) | 0 (0.0%) |
| 5 or more Children | 0 (0.0%) | 0 (0.0%) |
| Total | 2 (5.0%) | 3 (11.1%) |
Income Below Poverty Among Married-Couple vs Single-Parent Households in Pembroke
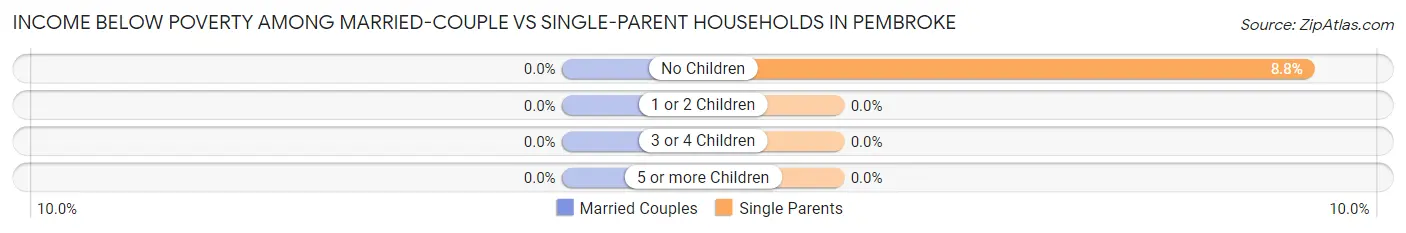
| Children | Married-Couple Families | Single-Parent Households |
| No Children | 0 (0.0%) | 5 (8.8%) |
| 1 or 2 Children | 0 (0.0%) | 0 (0.0%) |
| 3 or 4 Children | 0 (0.0%) | 0 (0.0%) |
| 5 or more Children | 0 (0.0%) | 0 (0.0%) |
| Total | 0 (0.0%) | 5 (7.5%) |
Race in Pembroke
The most populous races in Pembroke are White / Caucasian (638 | 70.9%), Two or more Races (92 | 10.2%), and Asian (74 | 8.2%).
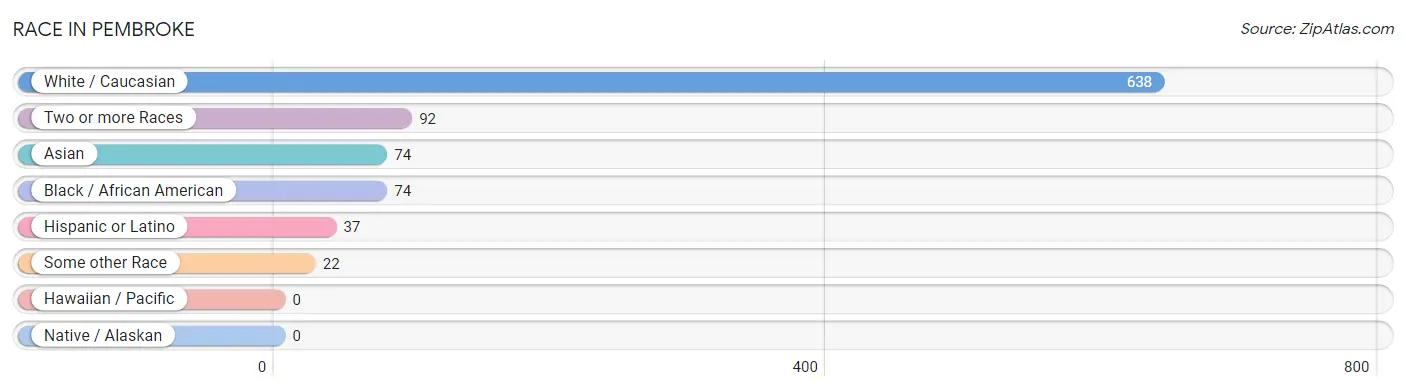
| Race | # Population | % Population |
| Asian | 74 | 8.2% |
| Black / African American | 74 | 8.2% |
| Hawaiian / Pacific | 0 | 0.0% |
| Hispanic or Latino | 37 | 4.1% |
| Native / Alaskan | 0 | 0.0% |
| White / Caucasian | 638 | 70.9% |
| Two or more Races | 92 | 10.2% |
| Some other Race | 22 | 2.4% |
| Total | 900 | 100.0% |
Ancestry in Pembroke
The most populous ancestries reported in Pembroke are English (120 | 13.3%), Bhutanese (67 | 7.4%), American (61 | 6.8%), German (38 | 4.2%), and Irish (34 | 3.8%), together accounting for 35.5% of all Pembroke residents.
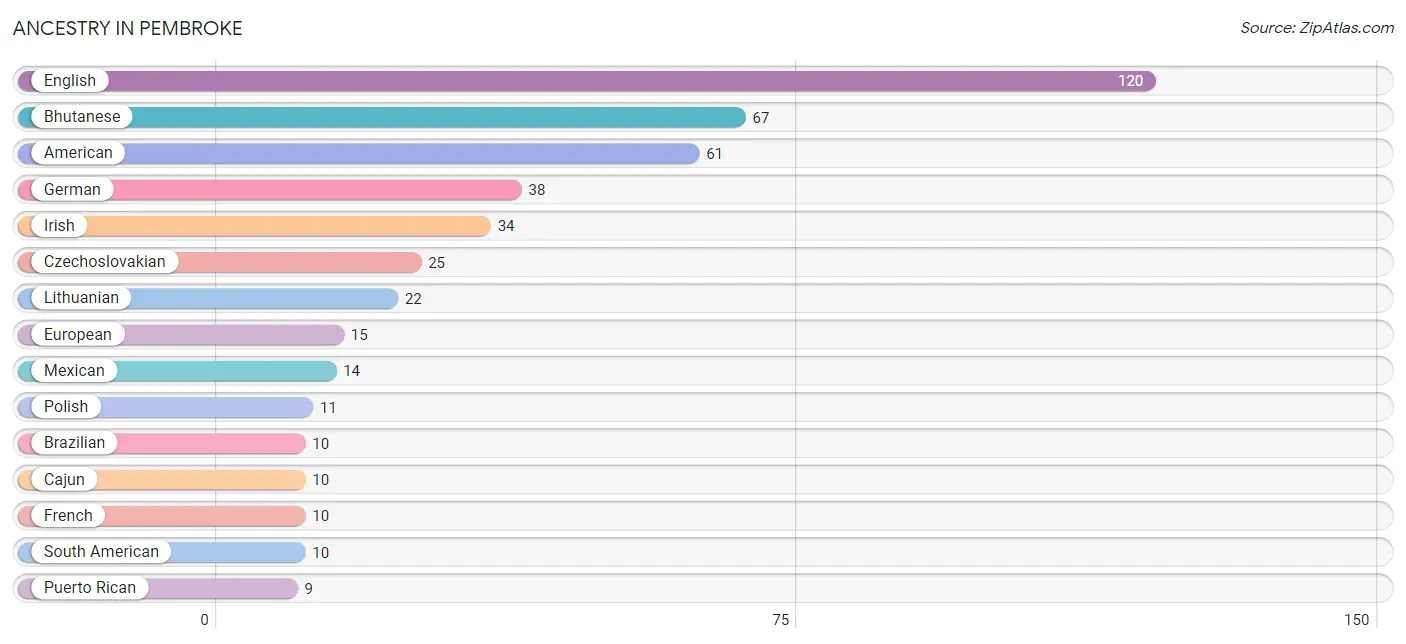
| Ancestry | # Population | % Population |
| American | 61 | 6.8% |
| Bhutanese | 67 | 7.4% |
| Brazilian | 10 | 1.1% |
| Cajun | 10 | 1.1% |
| Central American | 4 | 0.4% |
| Cherokee | 3 | 0.3% |
| Czechoslovakian | 25 | 2.8% |
| Danish | 2 | 0.2% |
| Dutch | 3 | 0.3% |
| English | 120 | 13.3% |
| European | 15 | 1.7% |
| French | 10 | 1.1% |
| German | 38 | 4.2% |
| Irish | 34 | 3.8% |
| Italian | 2 | 0.2% |
| Korean | 7 | 0.8% |
| Lithuanian | 22 | 2.4% |
| Mexican | 14 | 1.6% |
| Polish | 11 | 1.2% |
| Puerto Rican | 9 | 1.0% |
| Salvadoran | 4 | 0.4% |
| Scotch-Irish | 2 | 0.2% |
| Scottish | 1 | 0.1% |
| South American | 10 | 1.1% | View All 24 Rows |
Immigrants in Pembroke
The most numerous immigrant groups reported in Pembroke came from Asia (13 | 1.4%), Latin America (13 | 1.4%), Brazil (10 | 1.1%), South America (10 | 1.1%), and Philippines (7 | 0.8%), together accounting for 5.9% of all Pembroke residents.
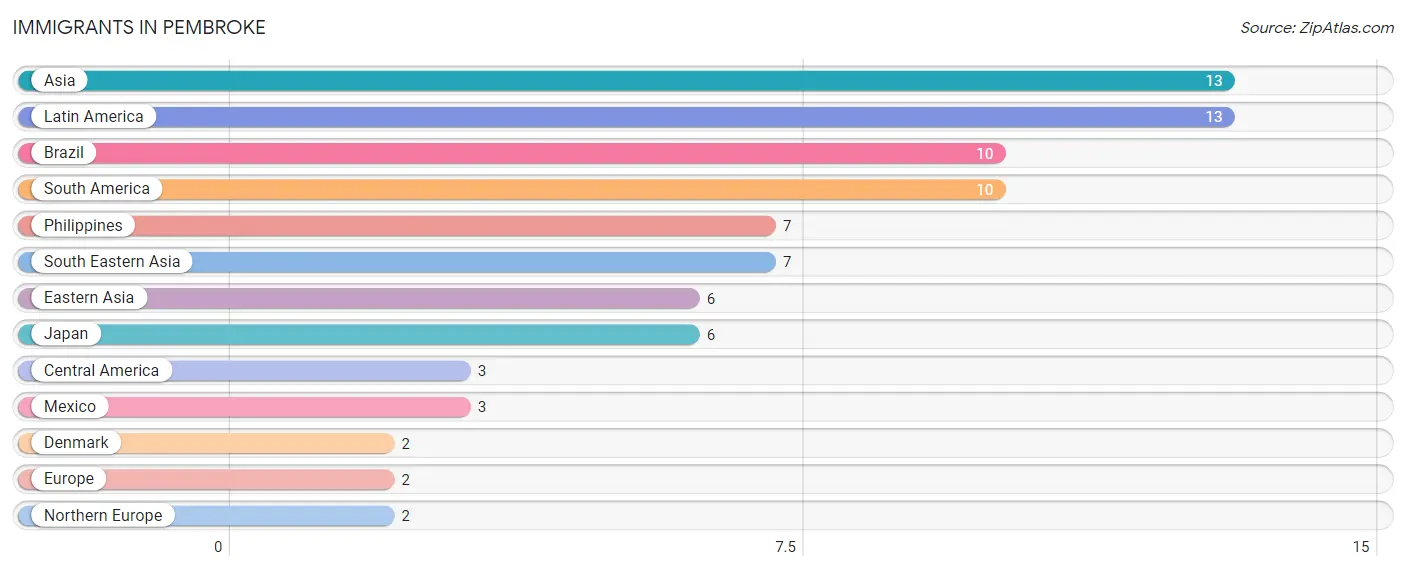
| Immigration Origin | # Population | % Population |
| Asia | 13 | 1.4% |
| Brazil | 10 | 1.1% |
| Central America | 3 | 0.3% |
| Denmark | 2 | 0.2% |
| Eastern Asia | 6 | 0.7% |
| Europe | 2 | 0.2% |
| Japan | 6 | 0.7% |
| Latin America | 13 | 1.4% |
| Mexico | 3 | 0.3% |
| Northern Europe | 2 | 0.2% |
| Philippines | 7 | 0.8% |
| South America | 10 | 1.1% |
| South Eastern Asia | 7 | 0.8% | View All 13 Rows |
Sex and Age in Pembroke
Sex and Age in Pembroke
The most populous age groups in Pembroke are 20 to 24 Years (61 | 12.8%) for men and 30 to 34 Years (52 | 12.3%) for women.
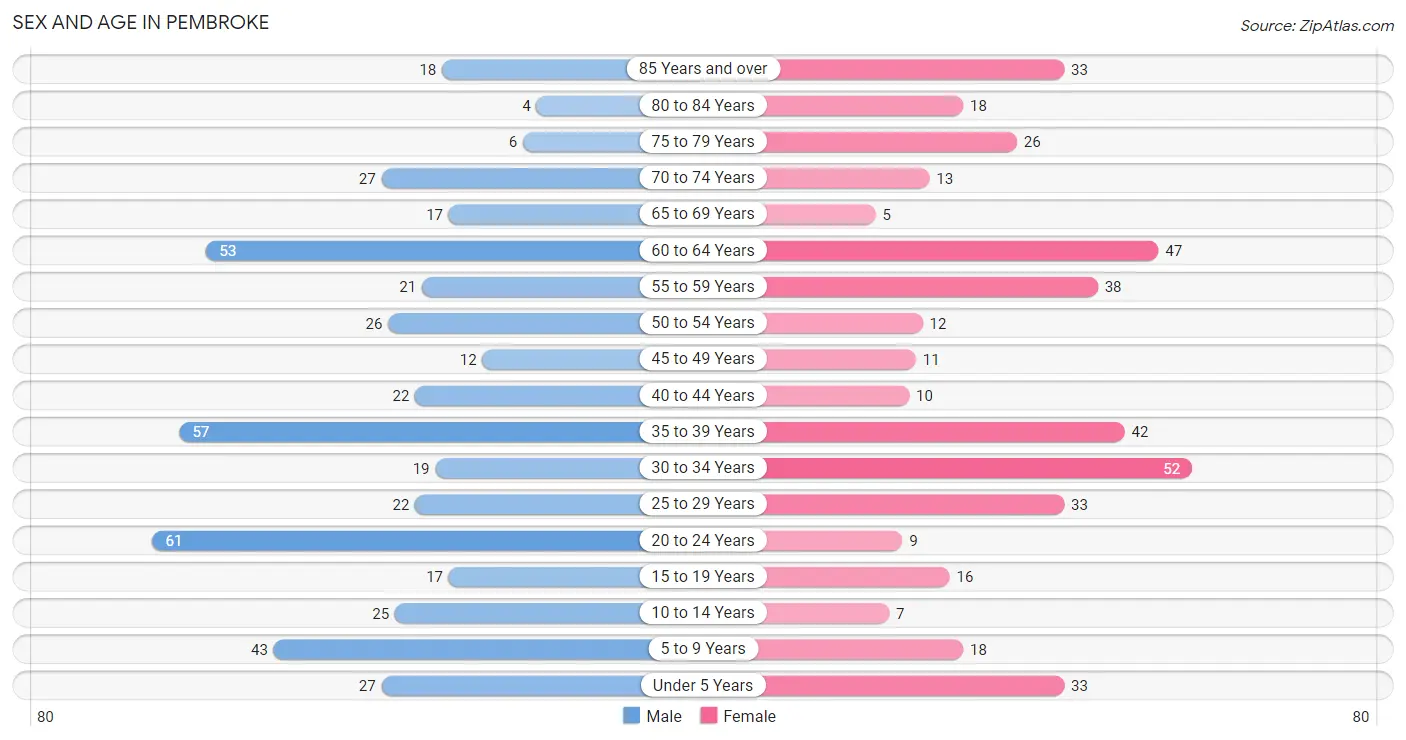
| Age Bracket | Male | Female |
| Under 5 Years | 27 (5.7%) | 33 (7.8%) |
| 5 to 9 Years | 43 (9.0%) | 18 (4.3%) |
| 10 to 14 Years | 25 (5.2%) | 7 (1.7%) |
| 15 to 19 Years | 17 (3.6%) | 16 (3.8%) |
| 20 to 24 Years | 61 (12.8%) | 9 (2.1%) |
| 25 to 29 Years | 22 (4.6%) | 33 (7.8%) |
| 30 to 34 Years | 19 (4.0%) | 52 (12.3%) |
| 35 to 39 Years | 57 (11.9%) | 42 (9.9%) |
| 40 to 44 Years | 22 (4.6%) | 10 (2.4%) |
| 45 to 49 Years | 12 (2.5%) | 11 (2.6%) |
| 50 to 54 Years | 26 (5.4%) | 12 (2.8%) |
| 55 to 59 Years | 21 (4.4%) | 38 (9.0%) |
| 60 to 64 Years | 53 (11.1%) | 47 (11.1%) |
| 65 to 69 Years | 17 (3.6%) | 5 (1.2%) |
| 70 to 74 Years | 27 (5.7%) | 13 (3.1%) |
| 75 to 79 Years | 6 (1.3%) | 26 (6.1%) |
| 80 to 84 Years | 4 (0.8%) | 18 (4.3%) |
| 85 Years and over | 18 (3.8%) | 33 (7.8%) |
| Total | 477 (100.0%) | 423 (100.0%) |
Families and Households in Pembroke
Median Family Size in Pembroke
The median family size in Pembroke is 2.88 persons per family, with married-couple families (179 | 72.8%) accounting for the largest median family size of 3.12 persons per family. On the other hand, single male/father families (40 | 16.3%) represent the smallest median family size with 2.05 persons per family.
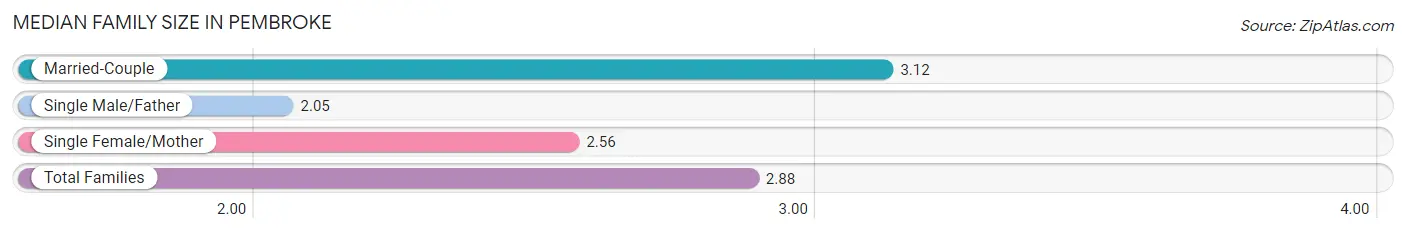
| Family Type | # Families | Family Size |
| Married-Couple | 179 (72.8%) | 3.12 |
| Single Male/Father | 40 (16.3%) | 2.05 |
| Single Female/Mother | 27 (11.0%) | 2.56 |
| Total Families | 246 (100.0%) | 2.88 |
Median Household Size in Pembroke
The median household size in Pembroke is 2.50 persons per household, with married-couple households (179 | 53.0%) accounting for the largest median household size of 3.15 persons per household. non-family households (92 | 27.2%) represent the smallest median household size with 1.37 persons per household.
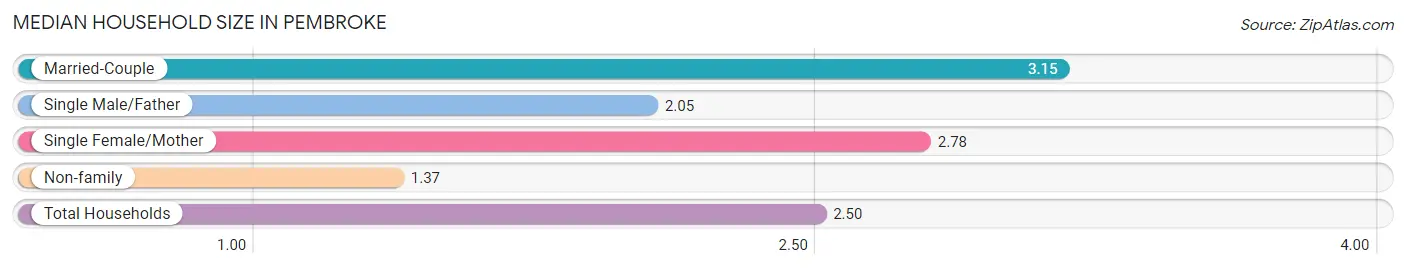
| Household Type | # Households | Household Size |
| Married-Couple | 179 (53.0%) | 3.15 |
| Single Male/Father | 40 (11.8%) | 2.05 |
| Single Female/Mother | 27 (8.0%) | 2.78 |
| Non-family | 92 (27.2%) | 1.37 |
| Total Households | 338 (100.0%) | 2.50 |
Household Size by Marriage Status in Pembroke
Out of a total of 338 households in Pembroke, 246 (72.8%) are family households, while 92 (27.2%) are nonfamily households. The most numerous type of family households are 3-person households, comprising 92, and the most common type of nonfamily households are 1-person households, comprising 76.
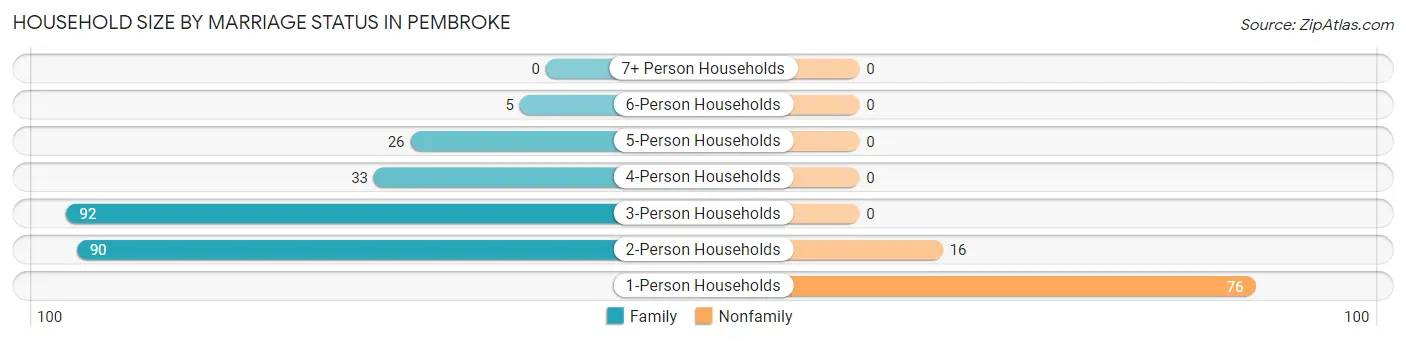
| Household Size | Family Households | Nonfamily Households |
| 1-Person Households | - | 76 (22.5%) |
| 2-Person Households | 90 (26.6%) | 16 (4.7%) |
| 3-Person Households | 92 (27.2%) | 0 (0.0%) |
| 4-Person Households | 33 (9.8%) | 0 (0.0%) |
| 5-Person Households | 26 (7.7%) | 0 (0.0%) |
| 6-Person Households | 5 (1.5%) | 0 (0.0%) |
| 7+ Person Households | 0 (0.0%) | 0 (0.0%) |
| Total | 246 (72.8%) | 92 (27.2%) |
Female Fertility in Pembroke
Fertility by Age in Pembroke
Average fertility rate in Pembroke is 115.0 births per 1,000 women. Women in the age bracket of 20 to 34 years have the highest fertility rate with 213.0 births per 1,000 women. Women in the age bracket of 20 to 34 years acount for 100.0% of all women with births.
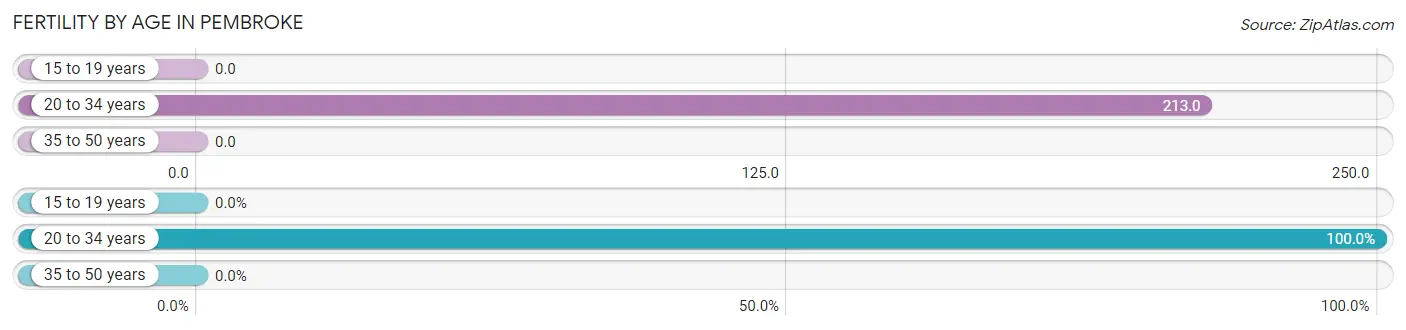
| Age Bracket | Women with Births | Births / 1,000 Women |
| 15 to 19 years | 0 (0.0%) | 0.0 |
| 20 to 34 years | 20 (100.0%) | 213.0 |
| 35 to 50 years | 0 (0.0%) | 0.0 |
| Total | 20 (100.0%) | 115.0 |
Fertility by Age by Marriage Status in Pembroke
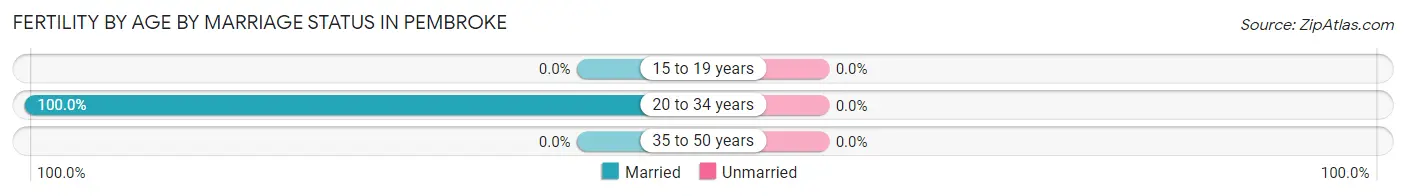
| Age Bracket | Married | Unmarried |
| 15 to 19 years | 0 (0.0%) | 0 (0.0%) |
| 20 to 34 years | 20 (100.0%) | 0 (0.0%) |
| 35 to 50 years | 0 (0.0%) | 0 (0.0%) |
| Total | 20 (100.0%) | 0 (0.0%) |
Fertility by Education in Pembroke
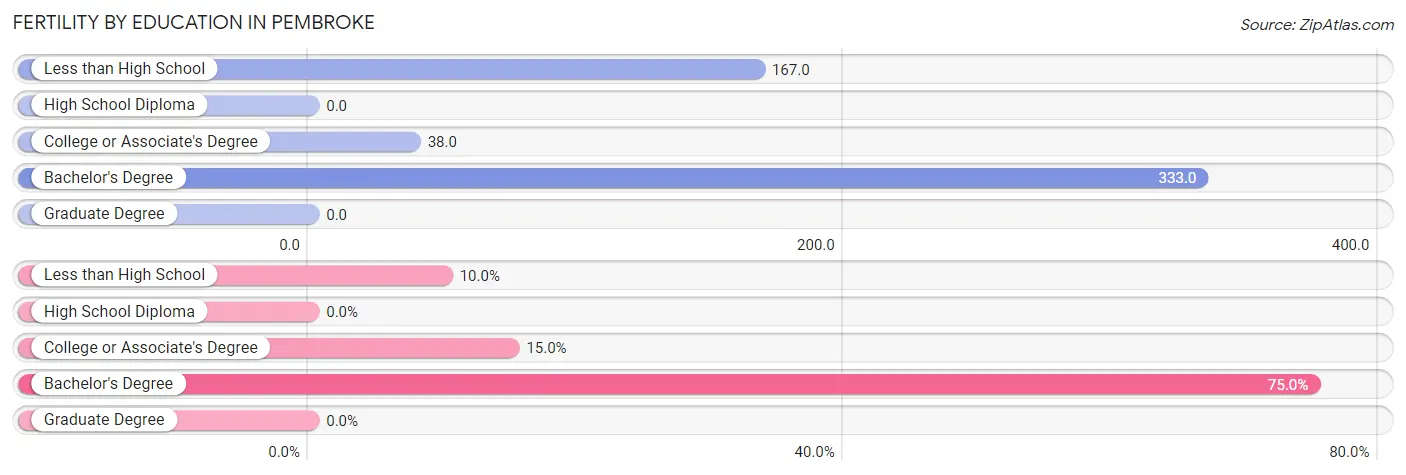
| Educational Attainment | Women with Births | Births / 1,000 Women |
| Less than High School | 2 (10.0%) | 167.0 |
| High School Diploma | 0 (0.0%) | 0.0 |
| College or Associate's Degree | 3 (15.0%) | 38.0 |
| Bachelor's Degree | 15 (75.0%) | 333.0 |
| Graduate Degree | 0 (0.0%) | 0.0 |
| Total | 20 (100.0%) | 115.0 |
Fertility by Education by Marriage Status in Pembroke
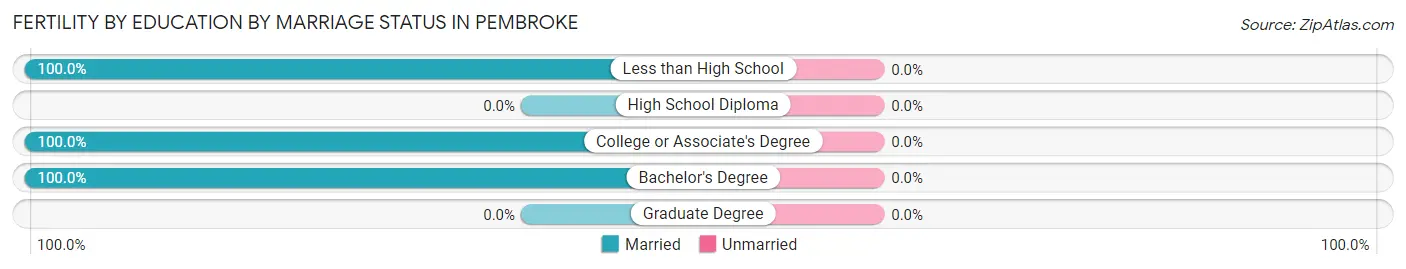
| Educational Attainment | Married | Unmarried |
| Less than High School | 2 (100.0%) | 0 (0.0%) |
| High School Diploma | 0 (0.0%) | 0 (0.0%) |
| College or Associate's Degree | 3 (100.0%) | 0 (0.0%) |
| Bachelor's Degree | 15 (100.0%) | 0 (0.0%) |
| Graduate Degree | 0 (0.0%) | 0 (0.0%) |
| Total | 20 (100.0%) | 0 (0.0%) |
Employment Characteristics in Pembroke
Employment by Class of Employer in Pembroke
Among the 403 employed individuals in Pembroke, private company employees (295 | 73.2%), federal government employees (30 | 7.4%), and not-for-profit organizations (29 | 7.2%) make up the most common classes of employment.
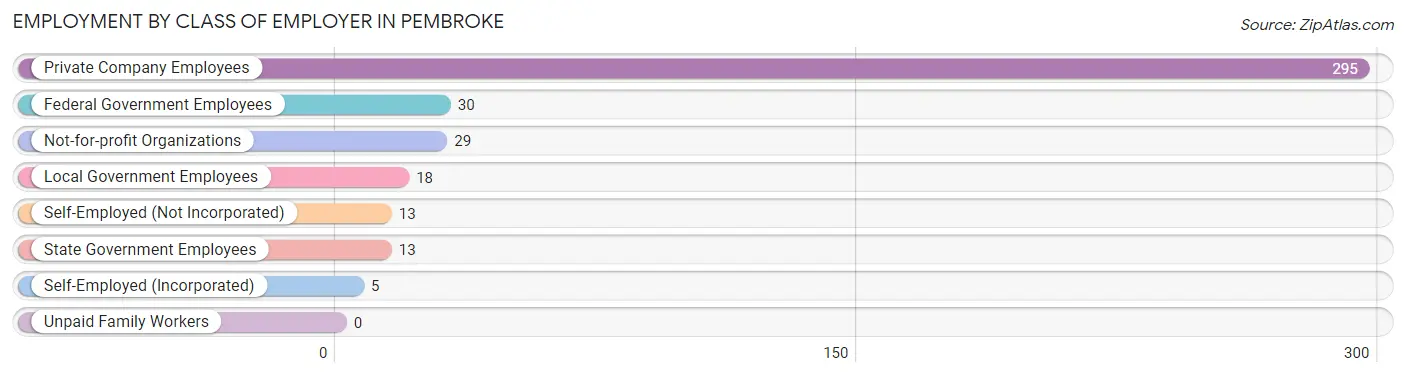
| Employer Class | # Employees | % Employees |
| Private Company Employees | 295 | 73.2% |
| Self-Employed (Incorporated) | 5 | 1.2% |
| Self-Employed (Not Incorporated) | 13 | 3.2% |
| Not-for-profit Organizations | 29 | 7.2% |
| Local Government Employees | 18 | 4.5% |
| State Government Employees | 13 | 3.2% |
| Federal Government Employees | 30 | 7.4% |
| Unpaid Family Workers | 0 | 0.0% |
| Total | 403 | 100.0% |
Employment Status by Age in Pembroke
According to the labor force statistics for Pembroke, out of the total population over 16 years of age (742), 57.4% or 426 individuals are in the labor force, with 3.8% or 16 of them unemployed. The age group with the highest labor force participation rate is 35 to 44 years, with 93.9% or 123 individuals in the labor force. Within the labor force, the 45 to 54 years age range has the highest percentage of unemployed individuals, with 14.6% or 6 of them being unemployed.
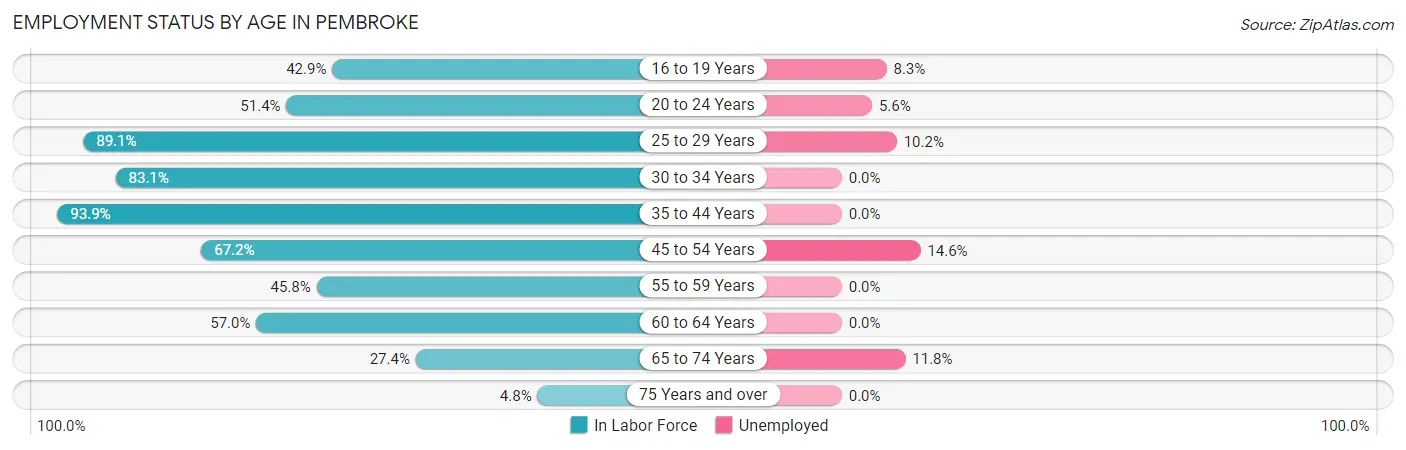
| Age Bracket | In Labor Force | Unemployed |
| 16 to 19 Years | 12 (42.9%) | 1 (8.3%) |
| 20 to 24 Years | 36 (51.4%) | 2 (5.6%) |
| 25 to 29 Years | 49 (89.1%) | 5 (10.2%) |
| 30 to 34 Years | 59 (83.1%) | 0 (0.0%) |
| 35 to 44 Years | 123 (93.9%) | 0 (0.0%) |
| 45 to 54 Years | 41 (67.2%) | 6 (14.6%) |
| 55 to 59 Years | 27 (45.8%) | 0 (0.0%) |
| 60 to 64 Years | 57 (57.0%) | 0 (0.0%) |
| 65 to 74 Years | 17 (27.4%) | 2 (11.8%) |
| 75 Years and over | 5 (4.8%) | 0 (0.0%) |
| Total | 426 (57.4%) | 16 (3.8%) |
Employment Status by Educational Attainment in Pembroke
According to labor force statistics for Pembroke, 74.6% of individuals (356) out of the total population between 25 and 64 years of age (477) are in the labor force, with 3.2% or 11 of them being unemployed. The group with the highest labor force participation rate are those with the educational attainment of bachelor's degree or higher, with 91.8% or 134 individuals in the labor force. Within the labor force, individuals with high school diploma education have the highest percentage of unemployment, with 9.8% or 9 of them being unemployed.
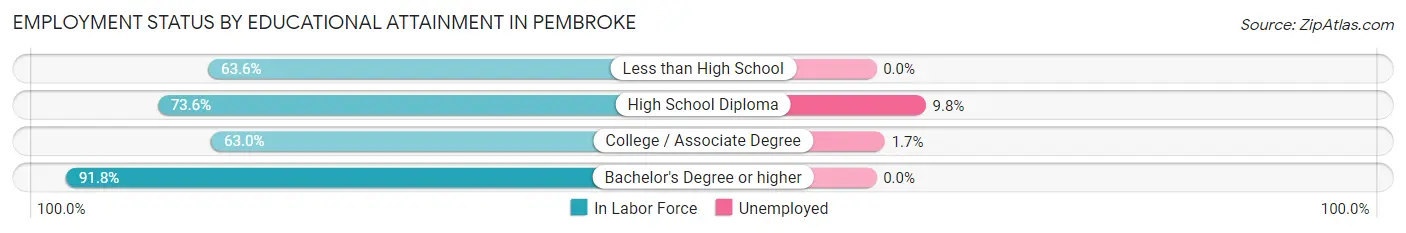
| Educational Attainment | In Labor Force | Unemployed |
| Less than High School | 14 (63.6%) | 0 (0.0%) |
| High School Diploma | 92 (73.6%) | 12 (9.8%) |
| College / Associate Degree | 116 (63.0%) | 3 (1.7%) |
| Bachelor's Degree or higher | 134 (91.8%) | 0 (0.0%) |
| Total | 356 (74.6%) | 15 (3.2%) |
Employment Occupations by Sex in Pembroke
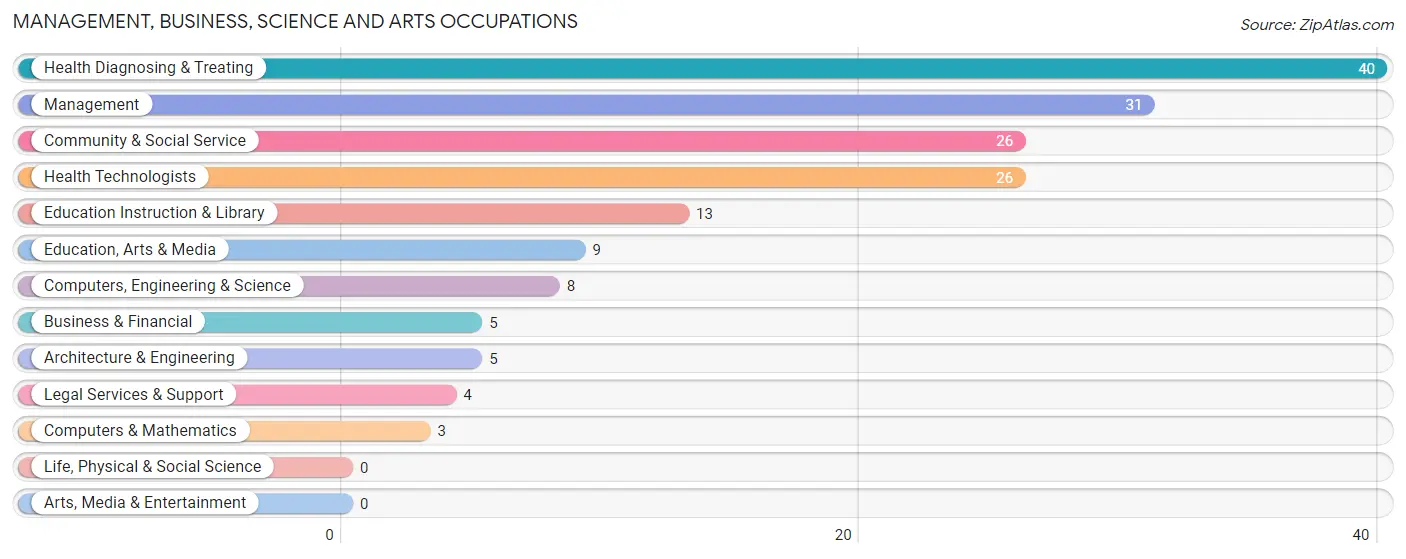
Management, Business, Science and Arts Occupations
The most common Management, Business, Science and Arts occupations in Pembroke are Health Diagnosing & Treating (40 | 10.0%), Management (31 | 7.7%), Community & Social Service (26 | 6.5%), Health Technologists (26 | 6.5%), and Education Instruction & Library (13 | 3.2%).
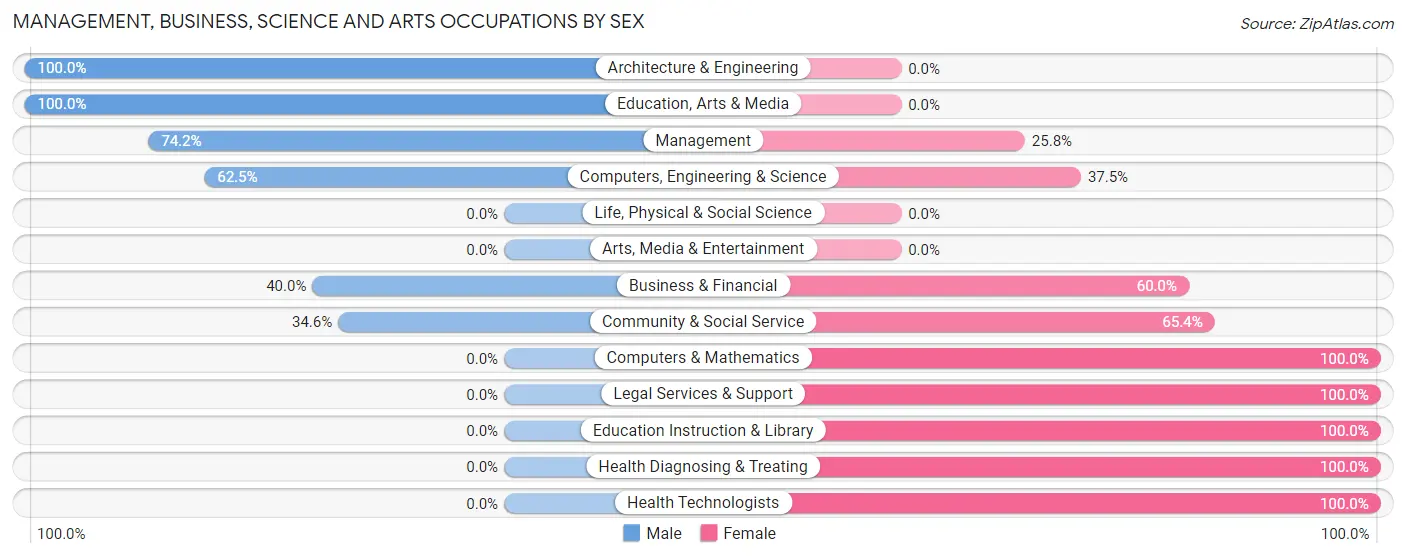
Management, Business, Science and Arts Occupations by Sex
Within the Management, Business, Science and Arts occupations in Pembroke, the most male-oriented occupations are Architecture & Engineering (100.0%), Education, Arts & Media (100.0%), and Management (74.2%), while the most female-oriented occupations are Computers & Mathematics (100.0%), Legal Services & Support (100.0%), and Education Instruction & Library (100.0%).
| Occupation | Male | Female |
| Management | 23 (74.2%) | 8 (25.8%) |
| Business & Financial | 2 (40.0%) | 3 (60.0%) |
| Computers, Engineering & Science | 5 (62.5%) | 3 (37.5%) |
| Computers & Mathematics | 0 (0.0%) | 3 (100.0%) |
| Architecture & Engineering | 5 (100.0%) | 0 (0.0%) |
| Life, Physical & Social Science | 0 (0.0%) | 0 (0.0%) |
| Community & Social Service | 9 (34.6%) | 17 (65.4%) |
| Education, Arts & Media | 9 (100.0%) | 0 (0.0%) |
| Legal Services & Support | 0 (0.0%) | 4 (100.0%) |
| Education Instruction & Library | 0 (0.0%) | 13 (100.0%) |
| Arts, Media & Entertainment | 0 (0.0%) | 0 (0.0%) |
| Health Diagnosing & Treating | 0 (0.0%) | 40 (100.0%) |
| Health Technologists | 0 (0.0%) | 26 (100.0%) |
| Total (Category) | 39 (35.4%) | 71 (64.5%) |
| Total (Overall) | 216 (53.7%) | 186 (46.3%) |
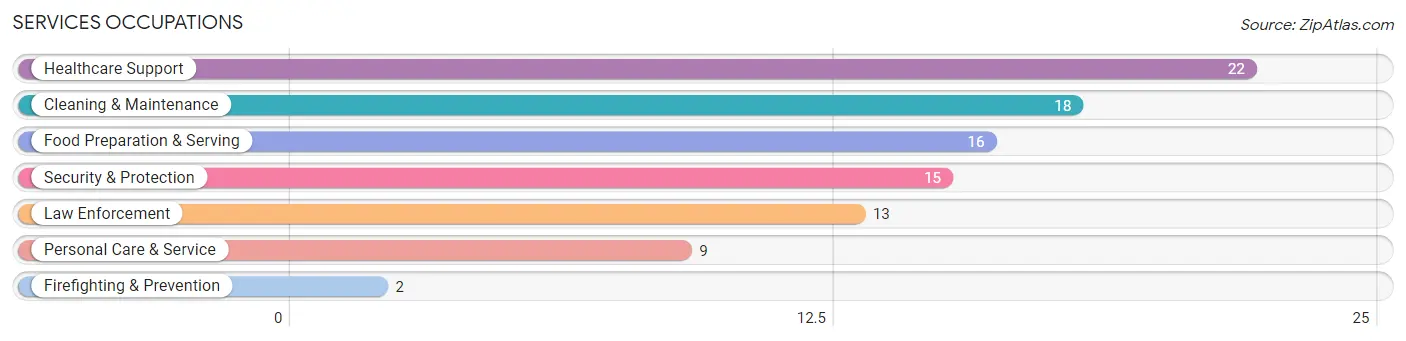
Services Occupations
The most common Services occupations in Pembroke are Healthcare Support (22 | 5.5%), Cleaning & Maintenance (18 | 4.5%), Food Preparation & Serving (16 | 4.0%), Security & Protection (15 | 3.7%), and Law Enforcement (13 | 3.2%).
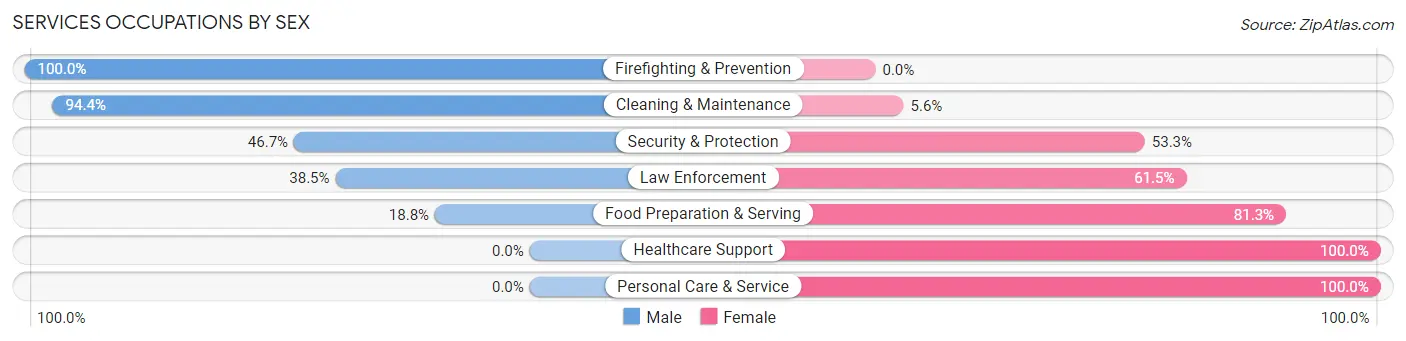
Services Occupations by Sex
Within the Services occupations in Pembroke, the most male-oriented occupations are Firefighting & Prevention (100.0%), Cleaning & Maintenance (94.4%), and Security & Protection (46.7%), while the most female-oriented occupations are Healthcare Support (100.0%), Personal Care & Service (100.0%), and Food Preparation & Serving (81.2%).
| Occupation | Male | Female |
| Healthcare Support | 0 (0.0%) | 22 (100.0%) |
| Security & Protection | 7 (46.7%) | 8 (53.3%) |
| Firefighting & Prevention | 2 (100.0%) | 0 (0.0%) |
| Law Enforcement | 5 (38.5%) | 8 (61.5%) |
| Food Preparation & Serving | 3 (18.8%) | 13 (81.2%) |
| Cleaning & Maintenance | 17 (94.4%) | 1 (5.6%) |
| Personal Care & Service | 0 (0.0%) | 9 (100.0%) |
| Total (Category) | 27 (33.8%) | 53 (66.2%) |
| Total (Overall) | 216 (53.7%) | 186 (46.3%) |
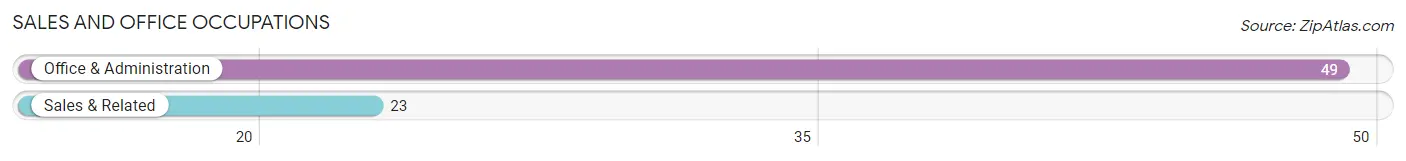
Sales and Office Occupations
The most common Sales and Office occupations in Pembroke are Office & Administration (49 | 12.2%), and Sales & Related (23 | 5.7%).
Sales and Office Occupations by Sex
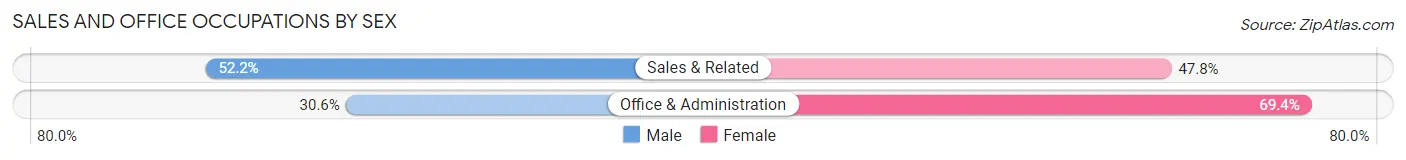
| Occupation | Male | Female |
| Sales & Related | 12 (52.2%) | 11 (47.8%) |
| Office & Administration | 15 (30.6%) | 34 (69.4%) |
| Total (Category) | 27 (37.5%) | 45 (62.5%) |
| Total (Overall) | 216 (53.7%) | 186 (46.3%) |
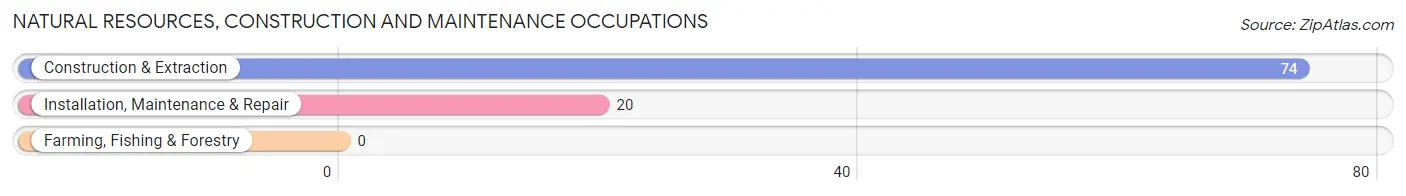
Natural Resources, Construction and Maintenance Occupations
The most common Natural Resources, Construction and Maintenance occupations in Pembroke are Construction & Extraction (74 | 18.4%), and Installation, Maintenance & Repair (20 | 5.0%).
Natural Resources, Construction and Maintenance Occupations by Sex
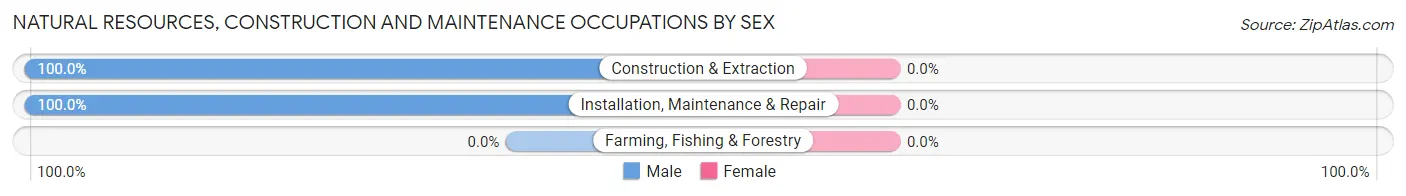
| Occupation | Male | Female |
| Farming, Fishing & Forestry | 0 (0.0%) | 0 (0.0%) |
| Construction & Extraction | 74 (100.0%) | 0 (0.0%) |
| Installation, Maintenance & Repair | 20 (100.0%) | 0 (0.0%) |
| Total (Category) | 94 (100.0%) | 0 (0.0%) |
| Total (Overall) | 216 (53.7%) | 186 (46.3%) |
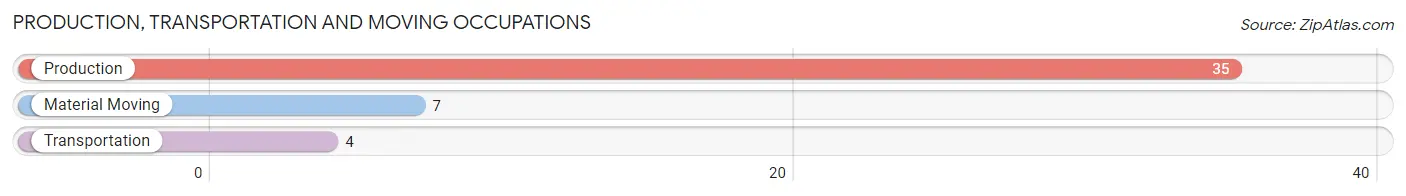
Production, Transportation and Moving Occupations
The most common Production, Transportation and Moving occupations in Pembroke are Production (35 | 8.7%), Material Moving (7 | 1.7%), and Transportation (4 | 1.0%).
Production, Transportation and Moving Occupations by Sex
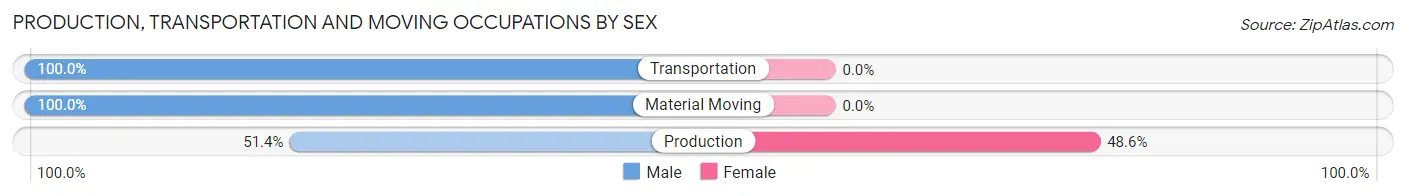
| Occupation | Male | Female |
| Production | 18 (51.4%) | 17 (48.6%) |
| Transportation | 4 (100.0%) | 0 (0.0%) |
| Material Moving | 7 (100.0%) | 0 (0.0%) |
| Total (Category) | 29 (63.0%) | 17 (37.0%) |
| Total (Overall) | 216 (53.7%) | 186 (46.3%) |
Employment Industries by Sex in Pembroke
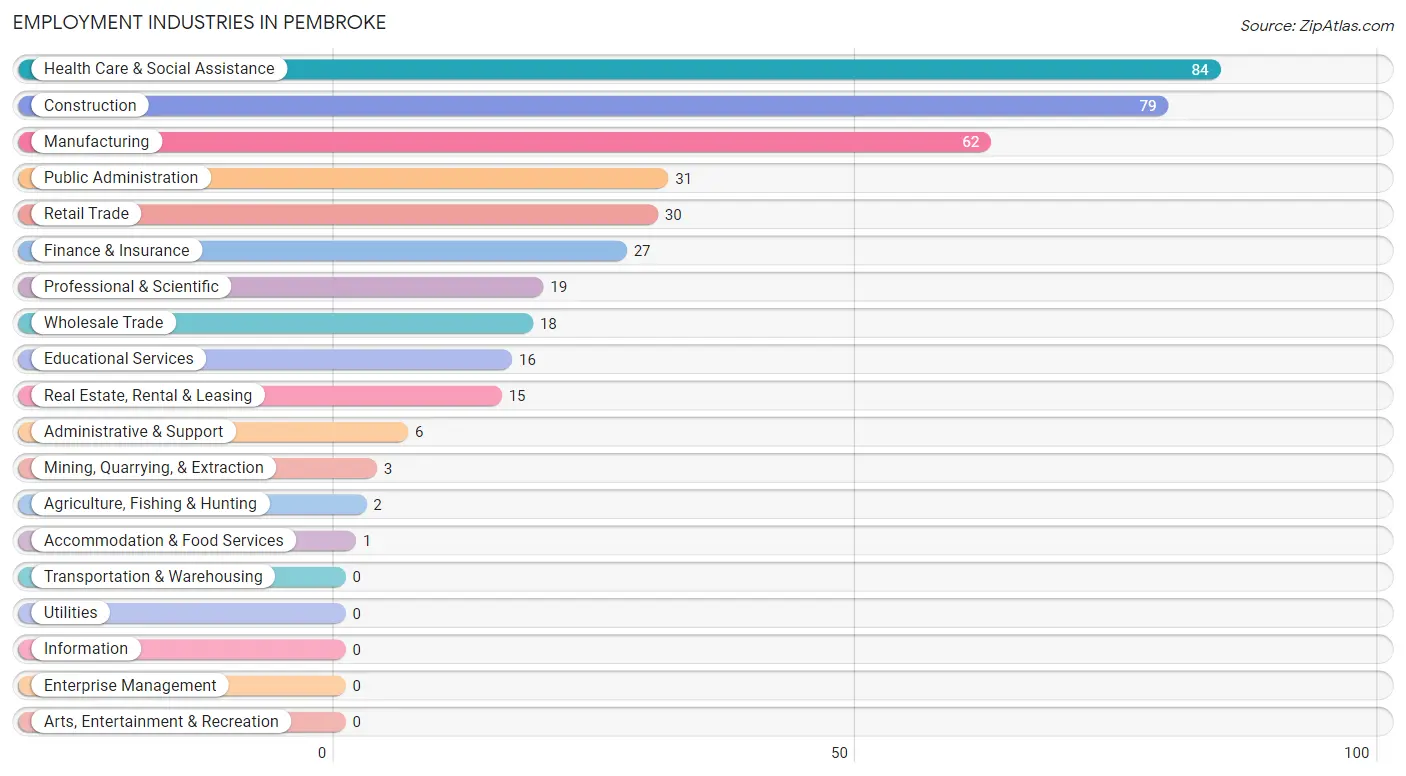
Employment Industries in Pembroke
The major employment industries in Pembroke include Health Care & Social Assistance (84 | 20.9%), Construction (79 | 19.7%), Manufacturing (62 | 15.4%), Public Administration (31 | 7.7%), and Retail Trade (30 | 7.5%).
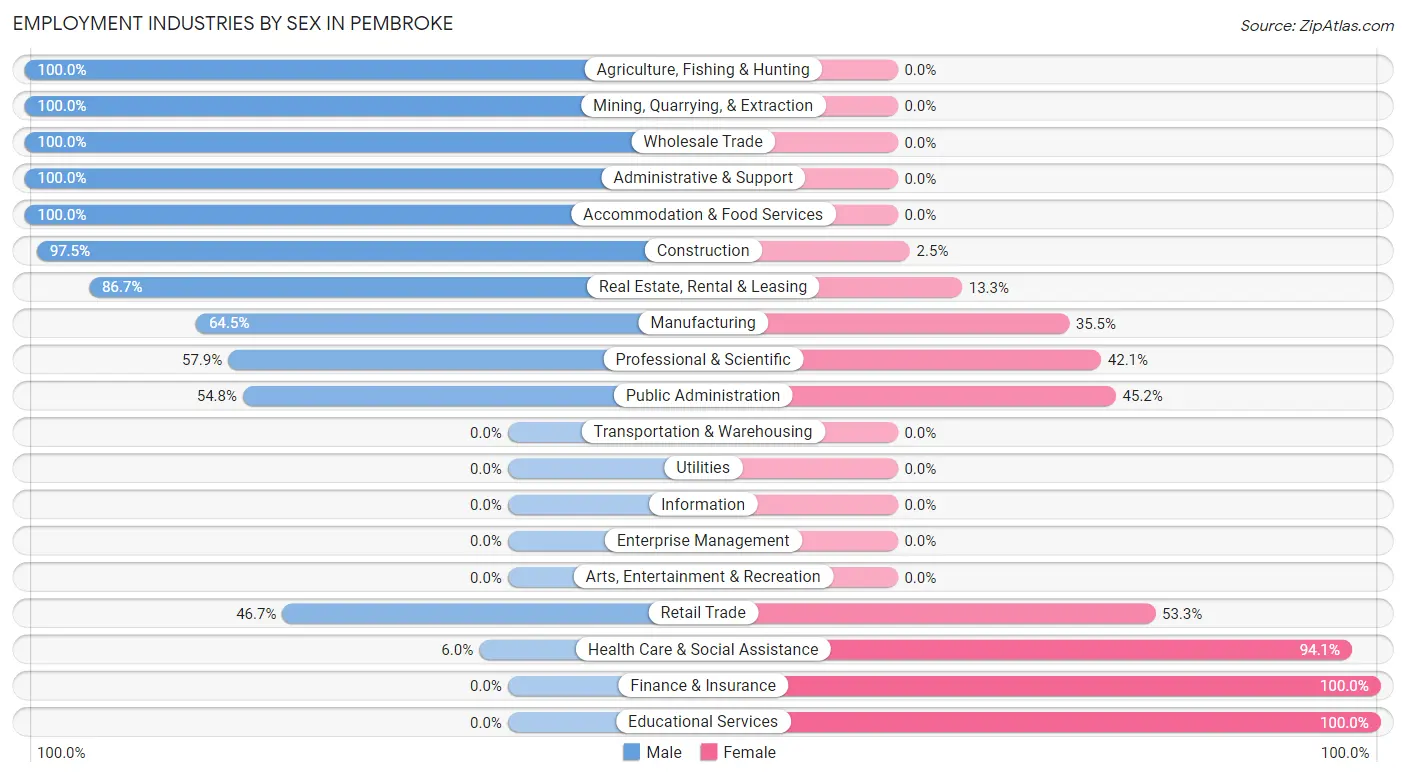
Employment Industries by Sex in Pembroke
The Pembroke industries that see more men than women are Agriculture, Fishing & Hunting (100.0%), Mining, Quarrying, & Extraction (100.0%), and Wholesale Trade (100.0%), whereas the industries that tend to have a higher number of women are Finance & Insurance (100.0%), Educational Services (100.0%), and Health Care & Social Assistance (94.1%).
| Industry | Male | Female |
| Agriculture, Fishing & Hunting | 2 (100.0%) | 0 (0.0%) |
| Mining, Quarrying, & Extraction | 3 (100.0%) | 0 (0.0%) |
| Construction | 77 (97.5%) | 2 (2.5%) |
| Manufacturing | 40 (64.5%) | 22 (35.5%) |
| Wholesale Trade | 18 (100.0%) | 0 (0.0%) |
| Retail Trade | 14 (46.7%) | 16 (53.3%) |
| Transportation & Warehousing | 0 (0.0%) | 0 (0.0%) |
| Utilities | 0 (0.0%) | 0 (0.0%) |
| Information | 0 (0.0%) | 0 (0.0%) |
| Finance & Insurance | 0 (0.0%) | 27 (100.0%) |
| Real Estate, Rental & Leasing | 13 (86.7%) | 2 (13.3%) |
| Professional & Scientific | 11 (57.9%) | 8 (42.1%) |
| Enterprise Management | 0 (0.0%) | 0 (0.0%) |
| Administrative & Support | 6 (100.0%) | 0 (0.0%) |
| Educational Services | 0 (0.0%) | 16 (100.0%) |
| Health Care & Social Assistance | 5 (5.9%) | 79 (94.1%) |
| Arts, Entertainment & Recreation | 0 (0.0%) | 0 (0.0%) |
| Accommodation & Food Services | 1 (100.0%) | 0 (0.0%) |
| Public Administration | 17 (54.8%) | 14 (45.2%) |
| Total | 216 (53.7%) | 186 (46.3%) |
Education in Pembroke
School Enrollment in Pembroke
The most common levels of schooling among the 147 students in Pembroke are elementary school (52 | 35.4%), high school (25 | 17.0%), and college / undergraduate (25 | 17.0%).
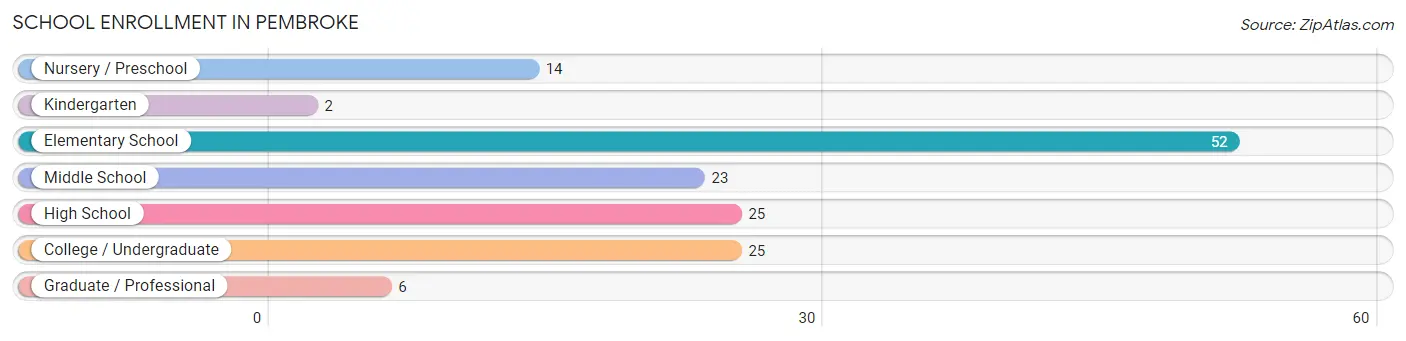
| School Level | # Students | % Students |
| Nursery / Preschool | 14 | 9.5% |
| Kindergarten | 2 | 1.4% |
| Elementary School | 52 | 35.4% |
| Middle School | 23 | 15.7% |
| High School | 25 | 17.0% |
| College / Undergraduate | 25 | 17.0% |
| Graduate / Professional | 6 | 4.1% |
| Total | 147 | 100.0% |
School Enrollment by Age by Funding Source in Pembroke
Out of a total of 147 students who are enrolled in schools in Pembroke, 14 (9.5%) attend a private institution, while the remaining 133 (90.5%) are enrolled in public schools. The age group of 35 years and over has the highest likelihood of being enrolled in private schools, with 1 (20.0% in the age bracket) enrolled. Conversely, the age group of 15 to 17 year olds has the lowest likelihood of being enrolled in a private school, with 15 (100.0% in the age bracket) attending a public institution.
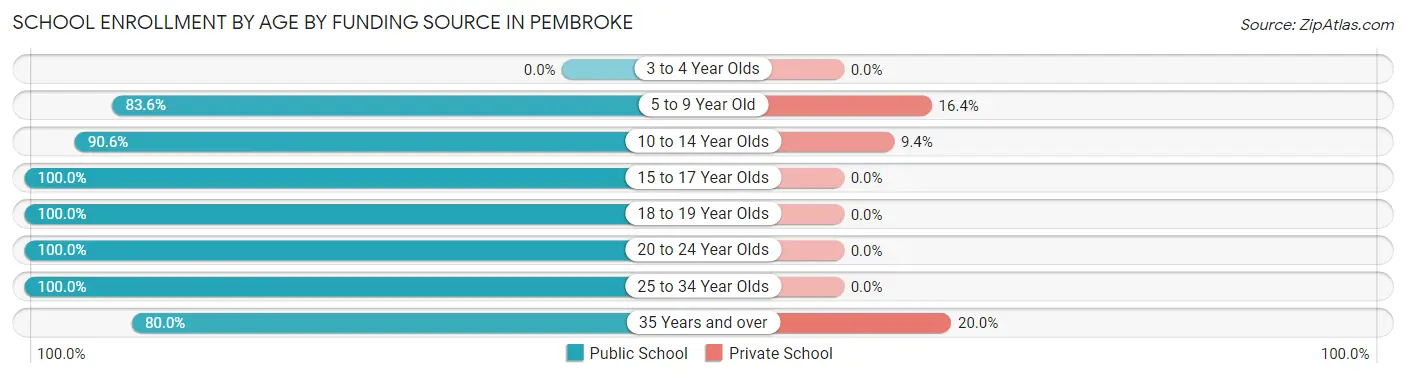
| Age Bracket | Public School | Private School |
| 3 to 4 Year Olds | 0 (0.0%) | 0 (0.0%) |
| 5 to 9 Year Old | 51 (83.6%) | 10 (16.4%) |
| 10 to 14 Year Olds | 29 (90.6%) | 3 (9.4%) |
| 15 to 17 Year Olds | 15 (100.0%) | 0 (0.0%) |
| 18 to 19 Year Olds | 18 (100.0%) | 0 (0.0%) |
| 20 to 24 Year Olds | 6 (100.0%) | 0 (0.0%) |
| 25 to 34 Year Olds | 10 (100.0%) | 0 (0.0%) |
| 35 Years and over | 4 (80.0%) | 1 (20.0%) |
| Total | 133 (90.5%) | 14 (9.5%) |
Educational Attainment by Field of Study in Pembroke
Science & technology (63 | 34.1%), education (32 | 17.3%), business (28 | 15.1%), arts & humanities (22 | 11.9%), and engineering (13 | 7.0%) are the most common fields of study among 185 individuals in Pembroke who have obtained a bachelor's degree or higher.
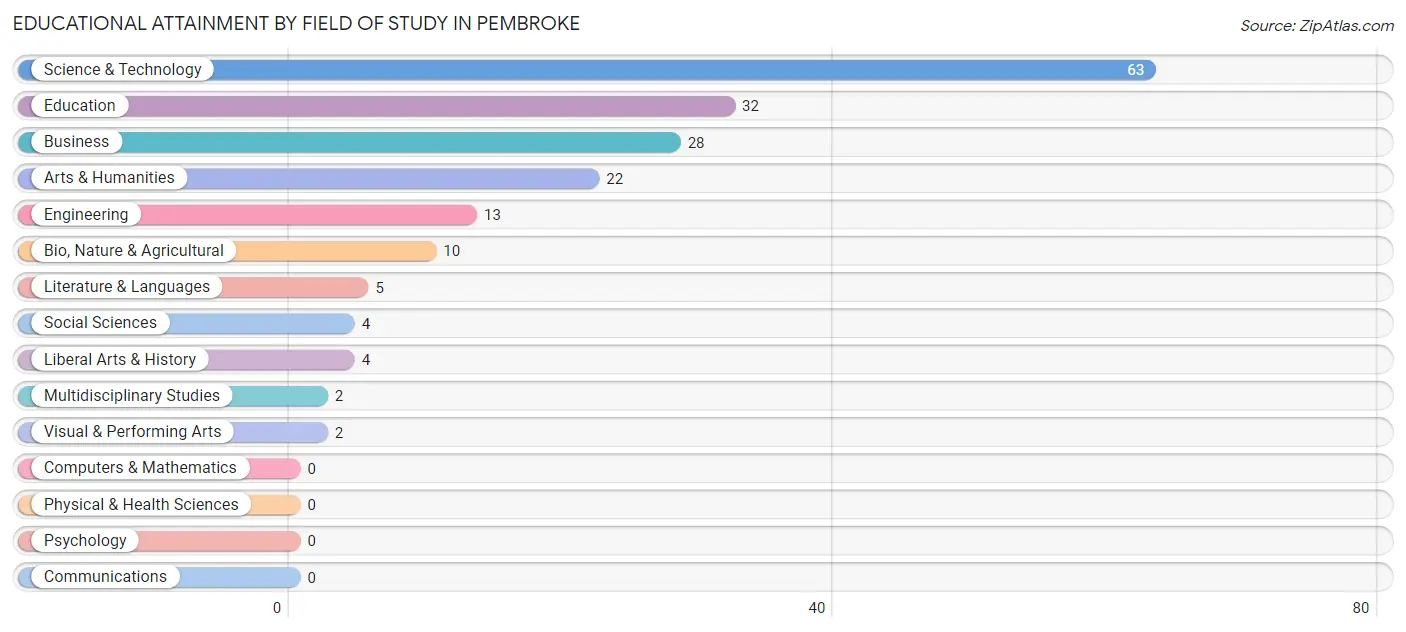
| Field of Study | # Graduates | % Graduates |
| Computers & Mathematics | 0 | 0.0% |
| Bio, Nature & Agricultural | 10 | 5.4% |
| Physical & Health Sciences | 0 | 0.0% |
| Psychology | 0 | 0.0% |
| Social Sciences | 4 | 2.2% |
| Engineering | 13 | 7.0% |
| Multidisciplinary Studies | 2 | 1.1% |
| Science & Technology | 63 | 34.1% |
| Business | 28 | 15.1% |
| Education | 32 | 17.3% |
| Literature & Languages | 5 | 2.7% |
| Liberal Arts & History | 4 | 2.2% |
| Visual & Performing Arts | 2 | 1.1% |
| Communications | 0 | 0.0% |
| Arts & Humanities | 22 | 11.9% |
| Total | 185 | 100.0% |
Transportation & Commute in Pembroke
Vehicle Availability by Sex in Pembroke
The most prevalent vehicle ownership categories in Pembroke are males with 3 vehicles (84, accounting for 37.5%) and females with 3 vehicles (52, making up 46.9%).
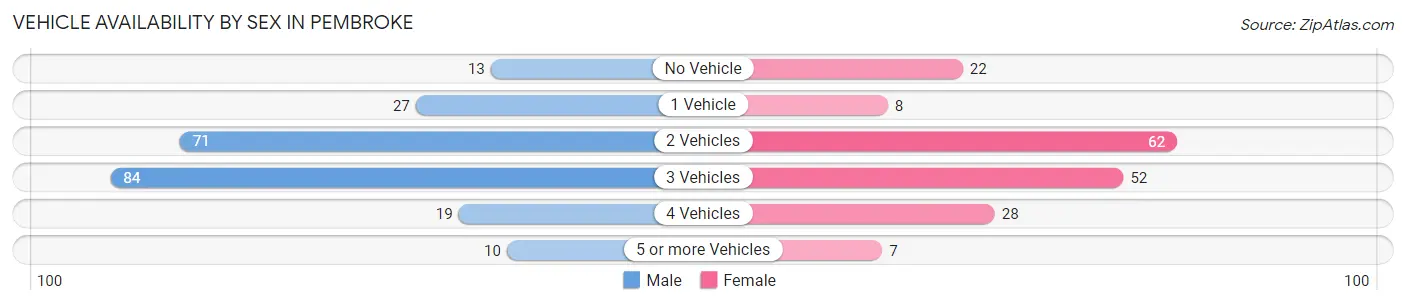
| Vehicles Available | Male | Female |
| No Vehicle | 13 (5.8%) | 22 (12.3%) |
| 1 Vehicle | 27 (12.0%) | 8 (4.5%) |
| 2 Vehicles | 71 (31.7%) | 62 (34.6%) |
| 3 Vehicles | 84 (37.5%) | 52 (29.0%) |
| 4 Vehicles | 19 (8.5%) | 28 (15.6%) |
| 5 or more Vehicles | 10 (4.5%) | 7 (3.9%) |
| Total | 224 (100.0%) | 179 (100.0%) |
Commute Time in Pembroke
The most frequently occuring commute durations in Pembroke are 20 to 24 minutes (120 commuters, 31.6%), 10 to 14 minutes (45 commuters, 11.8%), and 5 to 9 minutes (41 commuters, 10.8%).
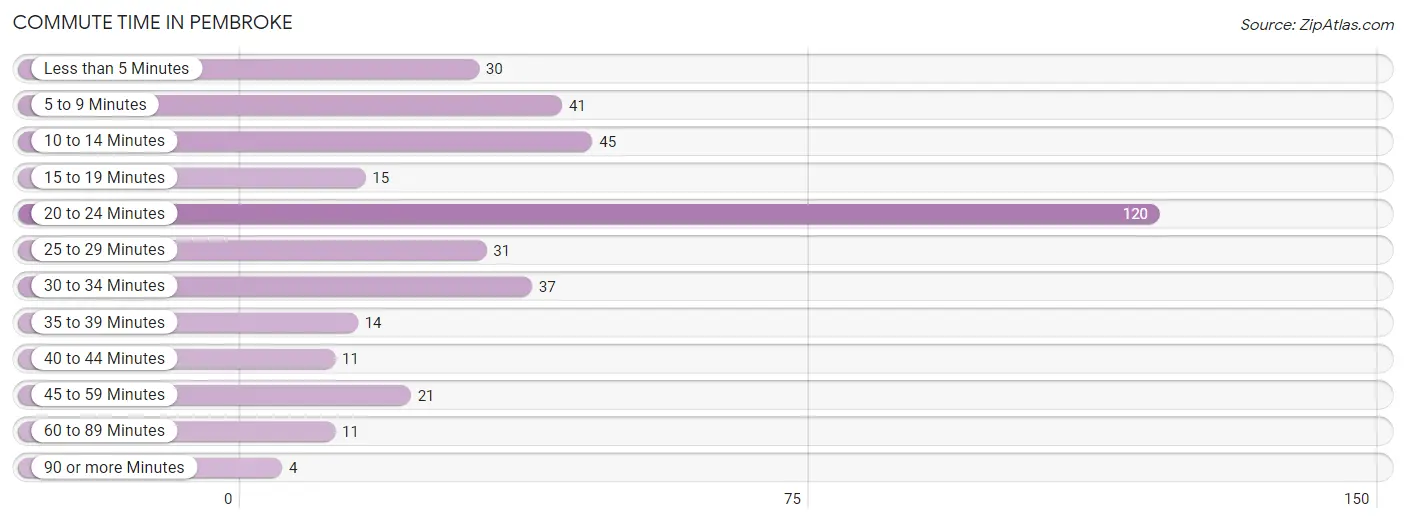
| Commute Time | # Commuters | % Commuters |
| Less than 5 Minutes | 30 | 7.9% |
| 5 to 9 Minutes | 41 | 10.8% |
| 10 to 14 Minutes | 45 | 11.8% |
| 15 to 19 Minutes | 15 | 4.0% |
| 20 to 24 Minutes | 120 | 31.6% |
| 25 to 29 Minutes | 31 | 8.2% |
| 30 to 34 Minutes | 37 | 9.7% |
| 35 to 39 Minutes | 14 | 3.7% |
| 40 to 44 Minutes | 11 | 2.9% |
| 45 to 59 Minutes | 21 | 5.5% |
| 60 to 89 Minutes | 11 | 2.9% |
| 90 or more Minutes | 4 | 1.1% |
Commute Time by Sex in Pembroke
The most common commute times in Pembroke are 20 to 24 minutes (61 commuters, 29.0%) for males and 20 to 24 minutes (59 commuters, 34.7%) for females.
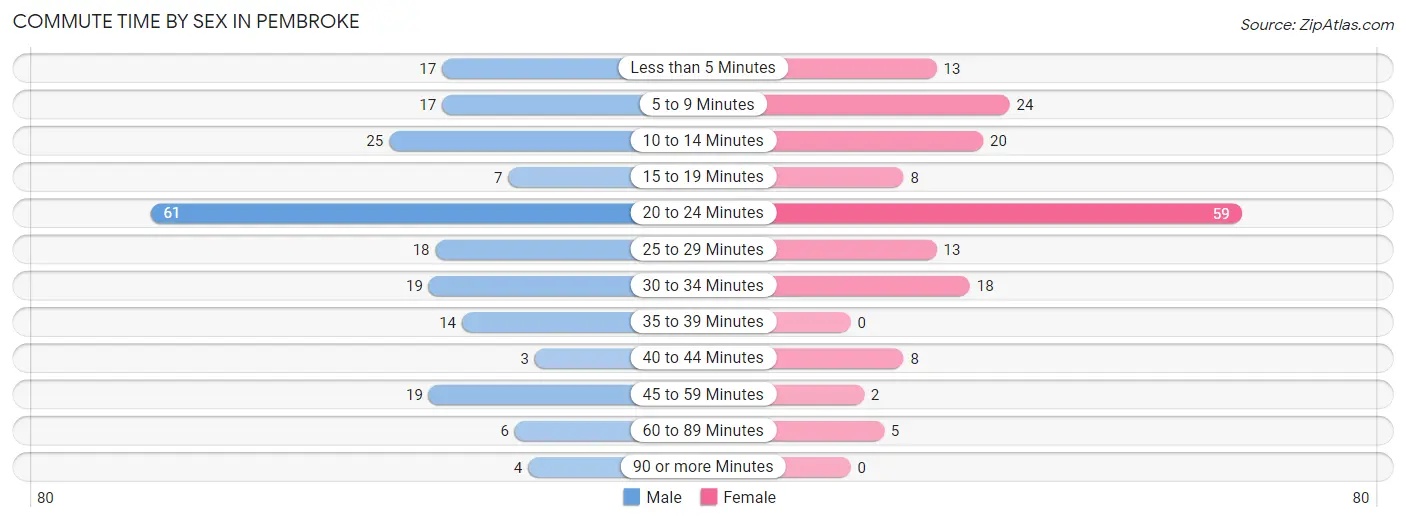
| Commute Time | Male | Female |
| Less than 5 Minutes | 17 (8.1%) | 13 (7.6%) |
| 5 to 9 Minutes | 17 (8.1%) | 24 (14.1%) |
| 10 to 14 Minutes | 25 (11.9%) | 20 (11.8%) |
| 15 to 19 Minutes | 7 (3.3%) | 8 (4.7%) |
| 20 to 24 Minutes | 61 (29.0%) | 59 (34.7%) |
| 25 to 29 Minutes | 18 (8.6%) | 13 (7.6%) |
| 30 to 34 Minutes | 19 (9.0%) | 18 (10.6%) |
| 35 to 39 Minutes | 14 (6.7%) | 0 (0.0%) |
| 40 to 44 Minutes | 3 (1.4%) | 8 (4.7%) |
| 45 to 59 Minutes | 19 (9.0%) | 2 (1.2%) |
| 60 to 89 Minutes | 6 (2.9%) | 5 (2.9%) |
| 90 or more Minutes | 4 (1.9%) | 0 (0.0%) |
Time of Departure to Work by Sex in Pembroke
The most frequent times of departure to work in Pembroke are 7:00 AM to 7:29 AM (70, 33.3%) for males and 12:00 AM to 4:59 AM (31, 18.2%) for females.
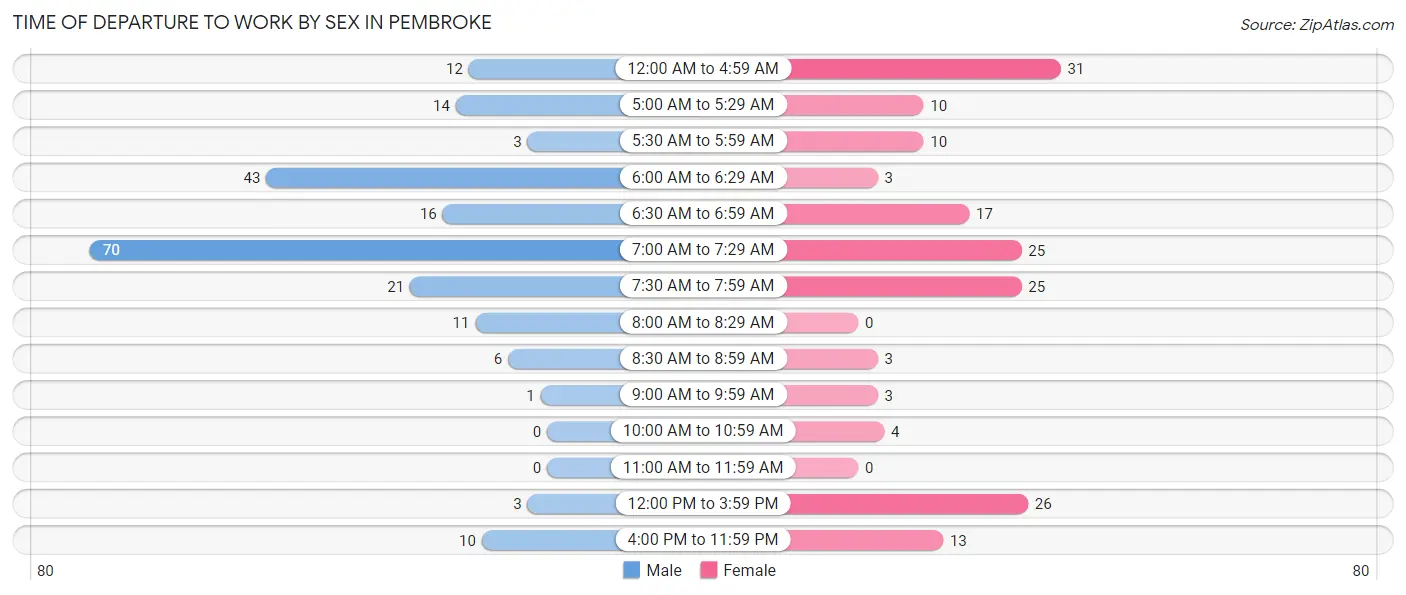
| Time of Departure | Male | Female |
| 12:00 AM to 4:59 AM | 12 (5.7%) | 31 (18.2%) |
| 5:00 AM to 5:29 AM | 14 (6.7%) | 10 (5.9%) |
| 5:30 AM to 5:59 AM | 3 (1.4%) | 10 (5.9%) |
| 6:00 AM to 6:29 AM | 43 (20.5%) | 3 (1.8%) |
| 6:30 AM to 6:59 AM | 16 (7.6%) | 17 (10.0%) |
| 7:00 AM to 7:29 AM | 70 (33.3%) | 25 (14.7%) |
| 7:30 AM to 7:59 AM | 21 (10.0%) | 25 (14.7%) |
| 8:00 AM to 8:29 AM | 11 (5.2%) | 0 (0.0%) |
| 8:30 AM to 8:59 AM | 6 (2.9%) | 3 (1.8%) |
| 9:00 AM to 9:59 AM | 1 (0.5%) | 3 (1.8%) |
| 10:00 AM to 10:59 AM | 0 (0.0%) | 4 (2.4%) |
| 11:00 AM to 11:59 AM | 0 (0.0%) | 0 (0.0%) |
| 12:00 PM to 3:59 PM | 3 (1.4%) | 26 (15.3%) |
| 4:00 PM to 11:59 PM | 10 (4.8%) | 13 (7.6%) |
| Total | 210 (100.0%) | 170 (100.0%) |
Housing Occupancy in Pembroke
Occupancy by Ownership in Pembroke
Of the total 338 dwellings in Pembroke, owner-occupied units account for 231 (68.3%), while renter-occupied units make up 107 (31.7%).
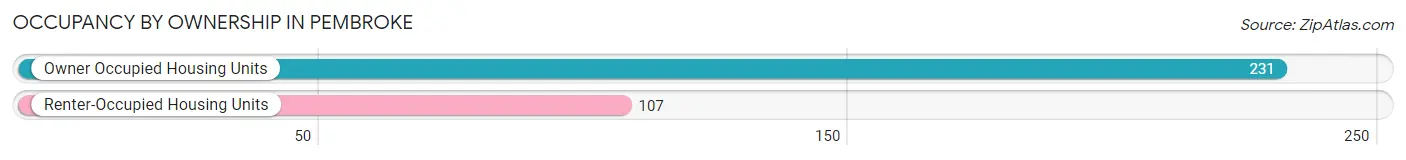
| Occupancy | # Housing Units | % Housing Units |
| Owner Occupied Housing Units | 231 | 68.3% |
| Renter-Occupied Housing Units | 107 | 31.7% |
| Total Occupied Housing Units | 338 | 100.0% |
Occupancy by Household Size in Pembroke
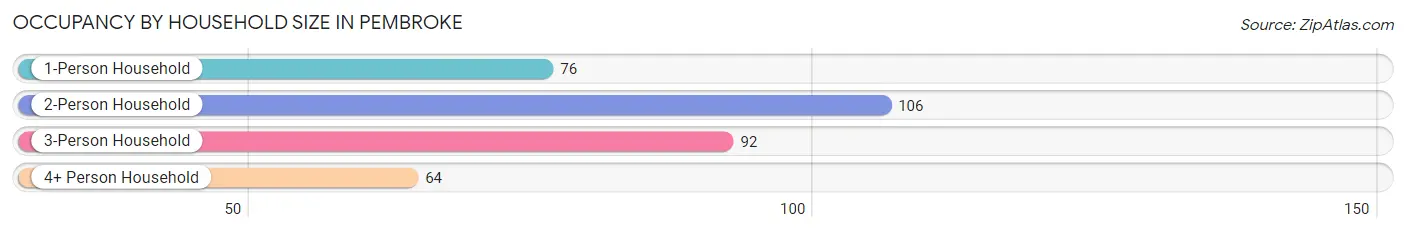
| Household Size | # Housing Units | % Housing Units |
| 1-Person Household | 76 | 22.5% |
| 2-Person Household | 106 | 31.4% |
| 3-Person Household | 92 | 27.2% |
| 4+ Person Household | 64 | 18.9% |
| Total Housing Units | 338 | 100.0% |
Occupancy by Ownership by Household Size in Pembroke
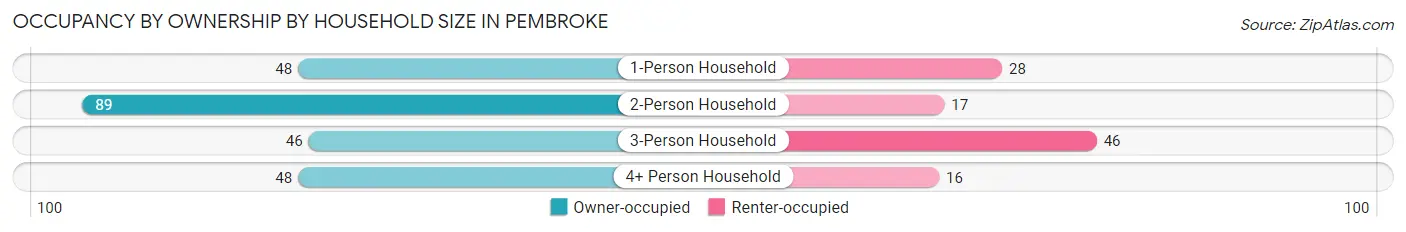
| Household Size | Owner-occupied | Renter-occupied |
| 1-Person Household | 48 (63.2%) | 28 (36.8%) |
| 2-Person Household | 89 (84.0%) | 17 (16.0%) |
| 3-Person Household | 46 (50.0%) | 46 (50.0%) |
| 4+ Person Household | 48 (75.0%) | 16 (25.0%) |
| Total Housing Units | 231 (68.3%) | 107 (31.7%) |
Occupancy by Educational Attainment in Pembroke
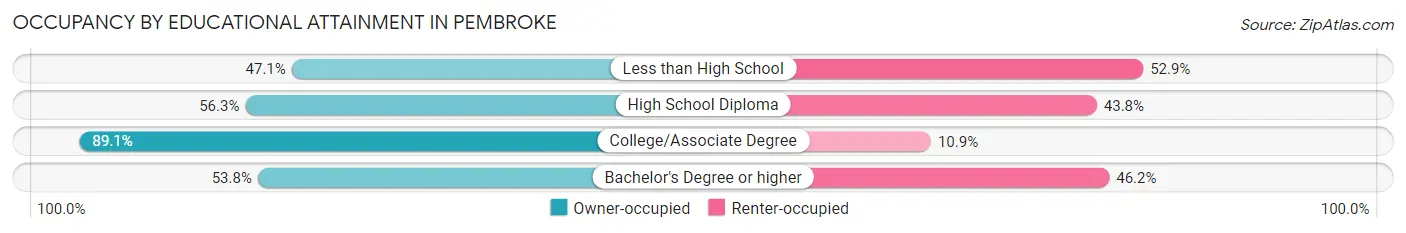
| Household Size | Owner-occupied | Renter-occupied |
| Less than High School | 8 (47.1%) | 9 (52.9%) |
| High School Diploma | 36 (56.2%) | 28 (43.8%) |
| College/Associate Degree | 123 (89.1%) | 15 (10.9%) |
| Bachelor's Degree or higher | 64 (53.8%) | 55 (46.2%) |
Occupancy by Age of Householder in Pembroke
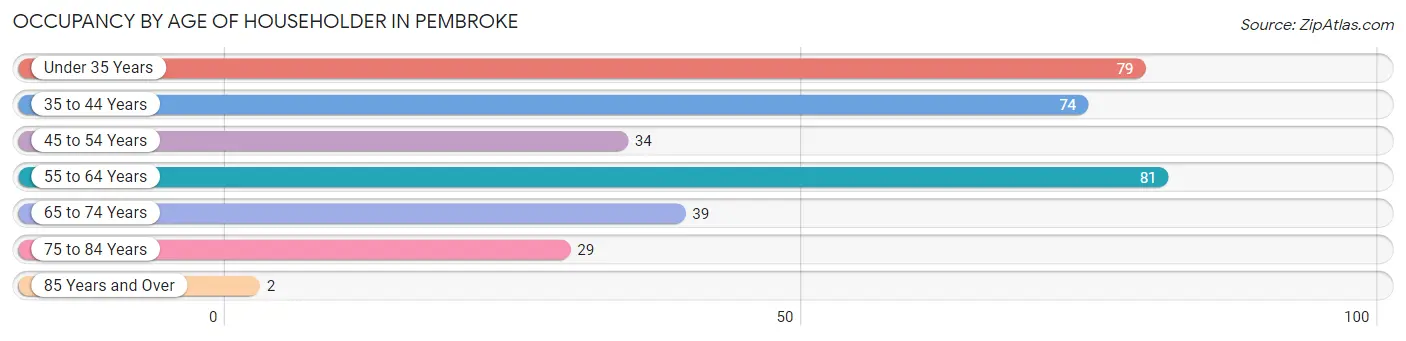
| Age Bracket | # Households | % Households |
| Under 35 Years | 79 | 23.4% |
| 35 to 44 Years | 74 | 21.9% |
| 45 to 54 Years | 34 | 10.1% |
| 55 to 64 Years | 81 | 24.0% |
| 65 to 74 Years | 39 | 11.5% |
| 75 to 84 Years | 29 | 8.6% |
| 85 Years and Over | 2 | 0.6% |
| Total | 338 | 100.0% |
Housing Finances in Pembroke
Median Income by Occupancy in Pembroke
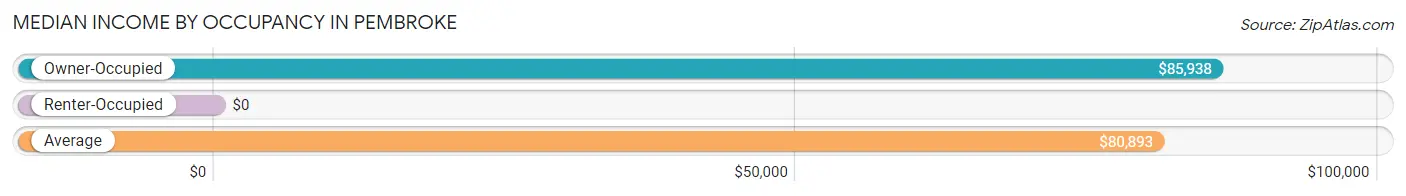
| Occupancy Type | # Households | Median Income |
| Owner-Occupied | 231 (68.3%) | $85,938 |
| Renter-Occupied | 107 (31.7%) | $0 |
| Average | 338 (100.0%) | $80,893 |
Occupancy by Householder Income Bracket in Pembroke
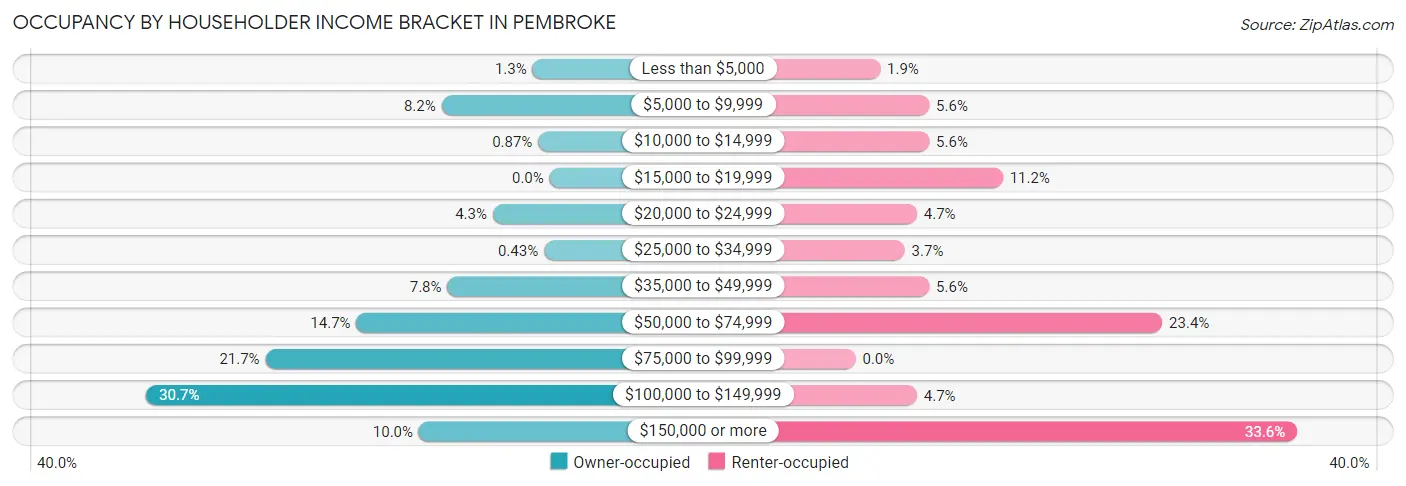
| Income Bracket | Owner-occupied | Renter-occupied |
| Less than $5,000 | 3 (1.3%) | 2 (1.9%) |
| $5,000 to $9,999 | 19 (8.2%) | 6 (5.6%) |
| $10,000 to $14,999 | 2 (0.9%) | 6 (5.6%) |
| $15,000 to $19,999 | 0 (0.0%) | 12 (11.2%) |
| $20,000 to $24,999 | 10 (4.3%) | 5 (4.7%) |
| $25,000 to $34,999 | 1 (0.4%) | 4 (3.7%) |
| $35,000 to $49,999 | 18 (7.8%) | 6 (5.6%) |
| $50,000 to $74,999 | 34 (14.7%) | 25 (23.4%) |
| $75,000 to $99,999 | 50 (21.6%) | 0 (0.0%) |
| $100,000 to $149,999 | 71 (30.7%) | 5 (4.7%) |
| $150,000 or more | 23 (10.0%) | 36 (33.6%) |
| Total | 231 (100.0%) | 107 (100.0%) |
Monthly Housing Cost Tiers in Pembroke
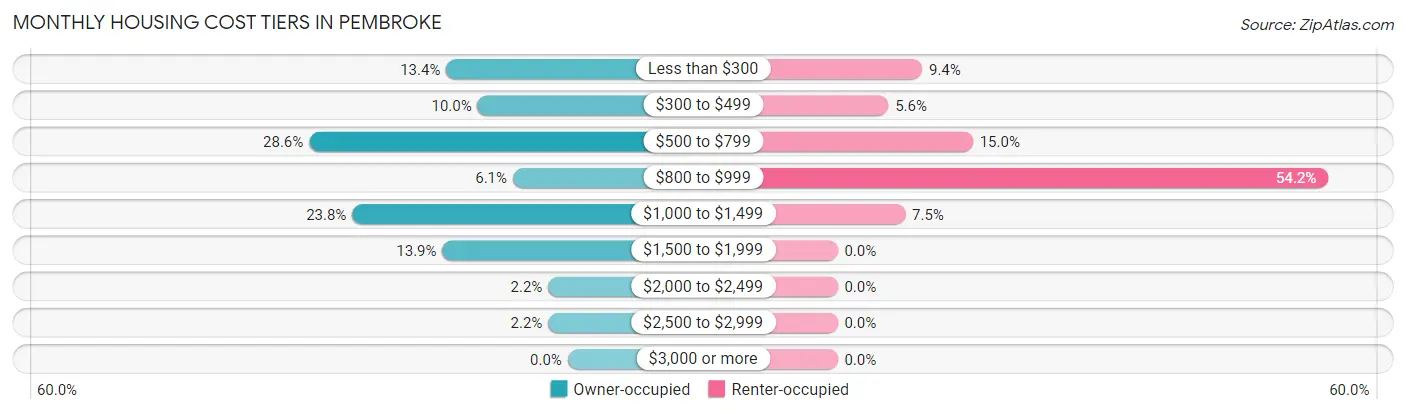
| Monthly Cost | Owner-occupied | Renter-occupied |
| Less than $300 | 31 (13.4%) | 10 (9.3%) |
| $300 to $499 | 23 (10.0%) | 6 (5.6%) |
| $500 to $799 | 66 (28.6%) | 16 (14.9%) |
| $800 to $999 | 14 (6.1%) | 58 (54.2%) |
| $1,000 to $1,499 | 55 (23.8%) | 8 (7.5%) |
| $1,500 to $1,999 | 32 (13.9%) | 0 (0.0%) |
| $2,000 to $2,499 | 5 (2.2%) | 0 (0.0%) |
| $2,500 to $2,999 | 5 (2.2%) | 0 (0.0%) |
| $3,000 or more | 0 (0.0%) | 0 (0.0%) |
| Total | 231 (100.0%) | 107 (100.0%) |
Physical Housing Characteristics in Pembroke
Housing Structures in Pembroke
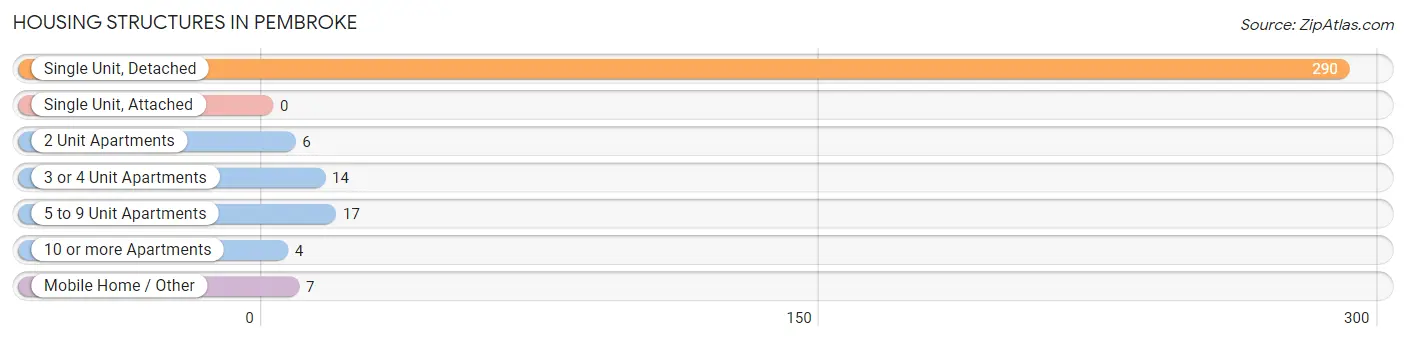
| Structure Type | # Housing Units | % Housing Units |
| Single Unit, Detached | 290 | 85.8% |
| Single Unit, Attached | 0 | 0.0% |
| 2 Unit Apartments | 6 | 1.8% |
| 3 or 4 Unit Apartments | 14 | 4.1% |
| 5 to 9 Unit Apartments | 17 | 5.0% |
| 10 or more Apartments | 4 | 1.2% |
| Mobile Home / Other | 7 | 2.1% |
| Total | 338 | 100.0% |
Housing Structures by Occupancy in Pembroke
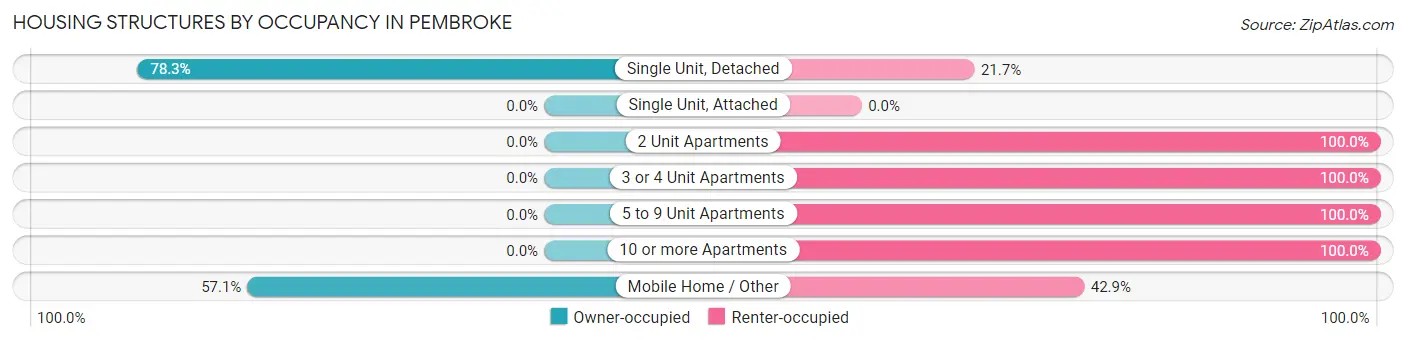
| Structure Type | Owner-occupied | Renter-occupied |
| Single Unit, Detached | 227 (78.3%) | 63 (21.7%) |
| Single Unit, Attached | 0 (0.0%) | 0 (0.0%) |
| 2 Unit Apartments | 0 (0.0%) | 6 (100.0%) |
| 3 or 4 Unit Apartments | 0 (0.0%) | 14 (100.0%) |
| 5 to 9 Unit Apartments | 0 (0.0%) | 17 (100.0%) |
| 10 or more Apartments | 0 (0.0%) | 4 (100.0%) |
| Mobile Home / Other | 4 (57.1%) | 3 (42.9%) |
| Total | 231 (68.3%) | 107 (31.7%) |
Housing Structures by Number of Rooms in Pembroke
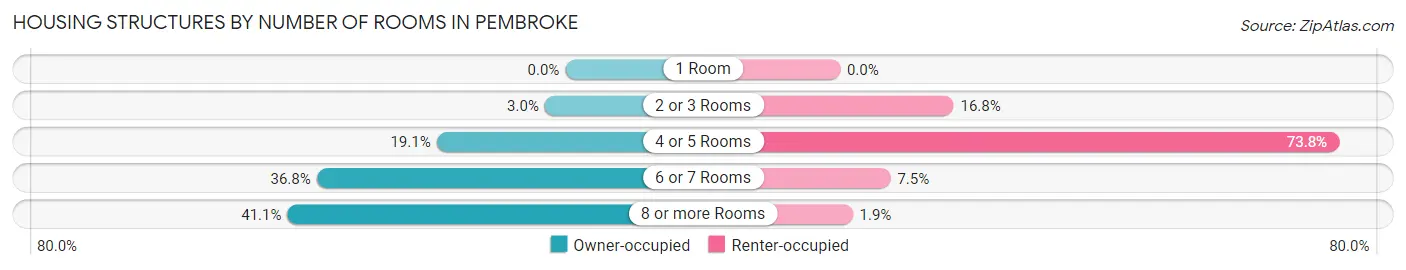
| Number of Rooms | Owner-occupied | Renter-occupied |
| 1 Room | 0 (0.0%) | 0 (0.0%) |
| 2 or 3 Rooms | 7 (3.0%) | 18 (16.8%) |
| 4 or 5 Rooms | 44 (19.1%) | 79 (73.8%) |
| 6 or 7 Rooms | 85 (36.8%) | 8 (7.5%) |
| 8 or more Rooms | 95 (41.1%) | 2 (1.9%) |
| Total | 231 (100.0%) | 107 (100.0%) |
Housing Structure by Heating Type in Pembroke
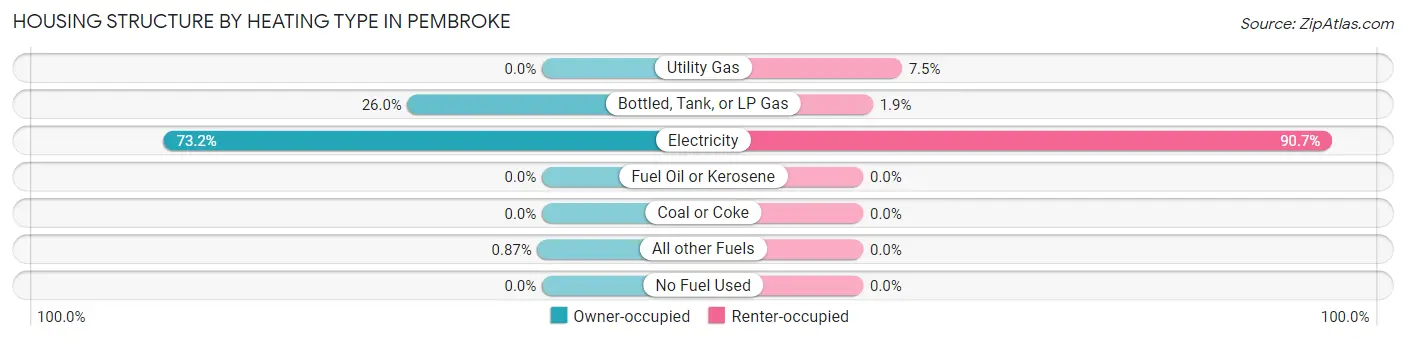
| Heating Type | Owner-occupied | Renter-occupied |
| Utility Gas | 0 (0.0%) | 8 (7.5%) |
| Bottled, Tank, or LP Gas | 60 (26.0%) | 2 (1.9%) |
| Electricity | 169 (73.2%) | 97 (90.6%) |
| Fuel Oil or Kerosene | 0 (0.0%) | 0 (0.0%) |
| Coal or Coke | 0 (0.0%) | 0 (0.0%) |
| All other Fuels | 2 (0.9%) | 0 (0.0%) |
| No Fuel Used | 0 (0.0%) | 0 (0.0%) |
| Total | 231 (100.0%) | 107 (100.0%) |
Household Vehicle Usage in Pembroke
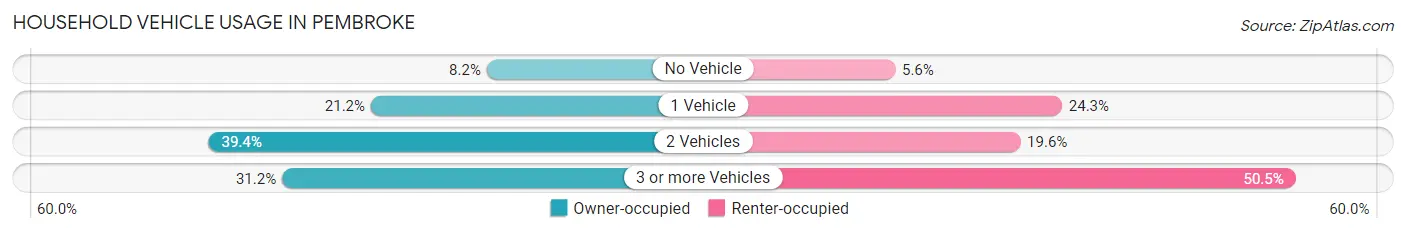
| Vehicles per Household | Owner-occupied | Renter-occupied |
| No Vehicle | 19 (8.2%) | 6 (5.6%) |
| 1 Vehicle | 49 (21.2%) | 26 (24.3%) |
| 2 Vehicles | 91 (39.4%) | 21 (19.6%) |
| 3 or more Vehicles | 72 (31.2%) | 54 (50.5%) |
| Total | 231 (100.0%) | 107 (100.0%) |
Real Estate & Mortgages in Pembroke
Real Estate and Mortgage Overview in Pembroke
| Characteristic | Without Mortgage | With Mortgage |
| Housing Units | 112 | 119 |
| Median Property Value | $110,400 | $227,300 |
| Median Household Income | $64,500 | $8 |
| Monthly Housing Costs | $507 | $0 |
| Real Estate Taxes | $927 | $2 |
Property Value by Mortgage Status in Pembroke
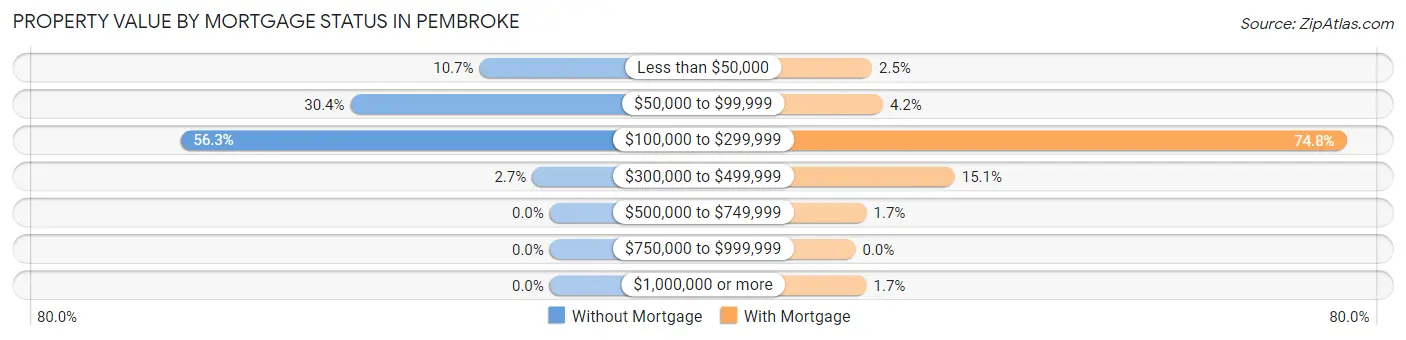
| Property Value | Without Mortgage | With Mortgage |
| Less than $50,000 | 12 (10.7%) | 3 (2.5%) |
| $50,000 to $99,999 | 34 (30.4%) | 5 (4.2%) |
| $100,000 to $299,999 | 63 (56.2%) | 89 (74.8%) |
| $300,000 to $499,999 | 3 (2.7%) | 18 (15.1%) |
| $500,000 to $749,999 | 0 (0.0%) | 2 (1.7%) |
| $750,000 to $999,999 | 0 (0.0%) | 0 (0.0%) |
| $1,000,000 or more | 0 (0.0%) | 2 (1.7%) |
| Total | 112 (100.0%) | 119 (100.0%) |
Household Income by Mortgage Status in Pembroke
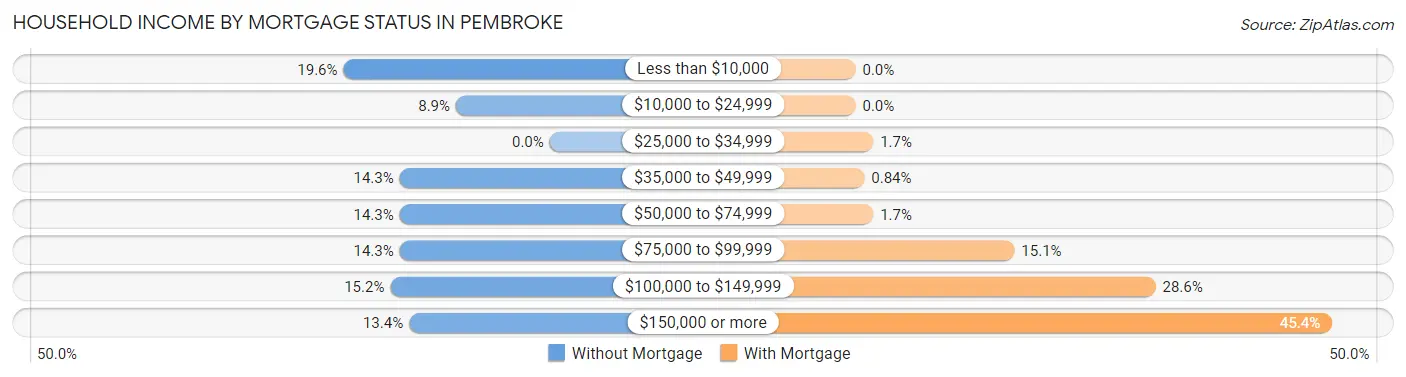
| Household Income | Without Mortgage | With Mortgage |
| Less than $10,000 | 22 (19.6%) | 0 (0.0%) |
| $10,000 to $24,999 | 10 (8.9%) | 0 (0.0%) |
| $25,000 to $34,999 | 0 (0.0%) | 2 (1.7%) |
| $35,000 to $49,999 | 16 (14.3%) | 1 (0.8%) |
| $50,000 to $74,999 | 16 (14.3%) | 2 (1.7%) |
| $75,000 to $99,999 | 16 (14.3%) | 18 (15.1%) |
| $100,000 to $149,999 | 17 (15.2%) | 34 (28.6%) |
| $150,000 or more | 15 (13.4%) | 54 (45.4%) |
| Total | 112 (100.0%) | 119 (100.0%) |
Property Value to Household Income Ratio in Pembroke
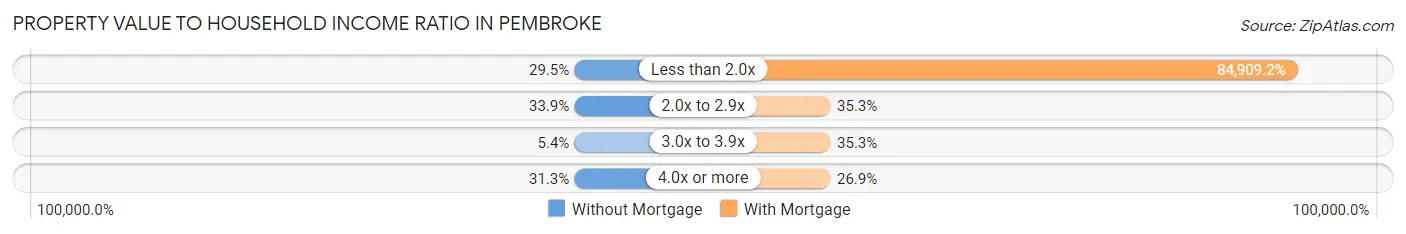
| Value-to-Income Ratio | Without Mortgage | With Mortgage |
| Less than 2.0x | 33 (29.5%) | 101,042 (84,909.2%) |
| 2.0x to 2.9x | 38 (33.9%) | 42 (35.3%) |
| 3.0x to 3.9x | 6 (5.4%) | 42 (35.3%) |
| 4.0x or more | 35 (31.2%) | 32 (26.9%) |
| Total | 112 (100.0%) | 119 (100.0%) |
Real Estate Taxes by Mortgage Status in Pembroke
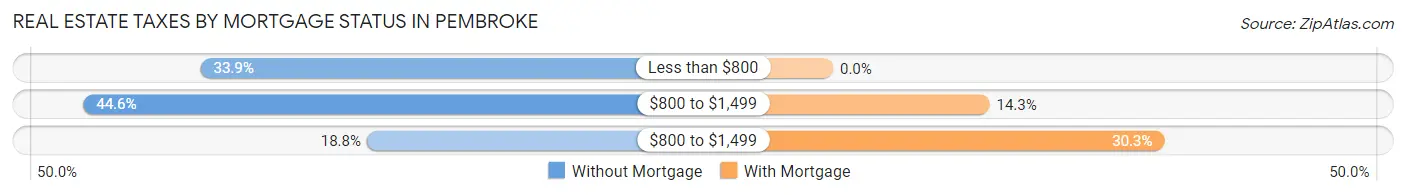
| Property Taxes | Without Mortgage | With Mortgage |
| Less than $800 | 38 (33.9%) | 0 (0.0%) |
| $800 to $1,499 | 50 (44.6%) | 17 (14.3%) |
| $800 to $1,499 | 21 (18.8%) | 36 (30.2%) |
| Total | 112 (100.0%) | 119 (100.0%) |
Health & Disability in Pembroke
Health Insurance Coverage by Age in Pembroke
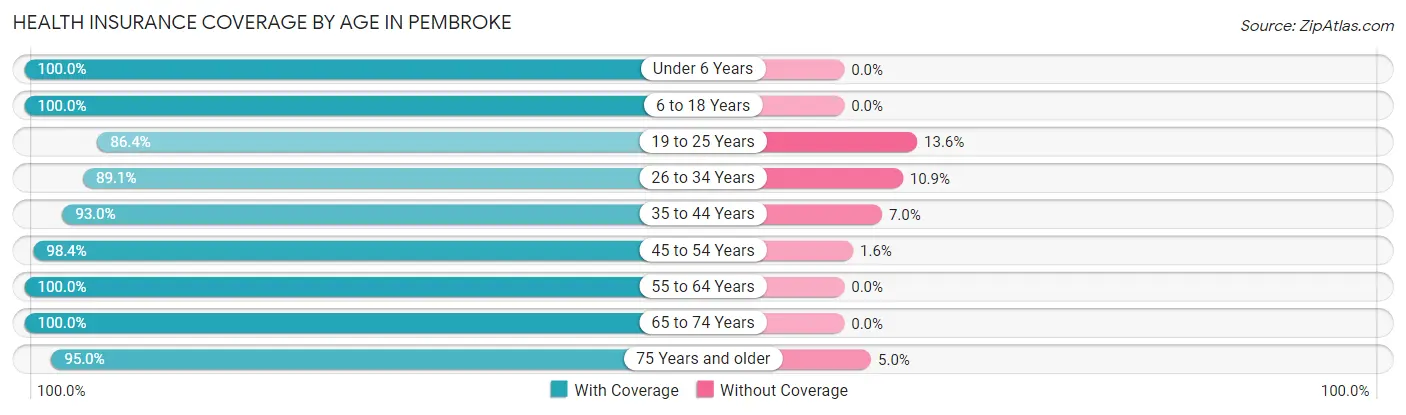
| Age Bracket | With Coverage | Without Coverage |
| Under 6 Years | 76 (100.0%) | 0 (0.0%) |
| 6 to 18 Years | 110 (100.0%) | 0 (0.0%) |
| 19 to 25 Years | 70 (86.4%) | 11 (13.6%) |
| 26 to 34 Years | 98 (89.1%) | 12 (10.9%) |
| 35 to 44 Years | 119 (93.0%) | 9 (7.0%) |
| 45 to 54 Years | 60 (98.4%) | 1 (1.6%) |
| 55 to 64 Years | 159 (100.0%) | 0 (0.0%) |
| 65 to 74 Years | 53 (100.0%) | 0 (0.0%) |
| 75 Years and older | 57 (95.0%) | 3 (5.0%) |
| Total | 802 (95.7%) | 36 (4.3%) |
Health Insurance Coverage by Citizenship Status in Pembroke
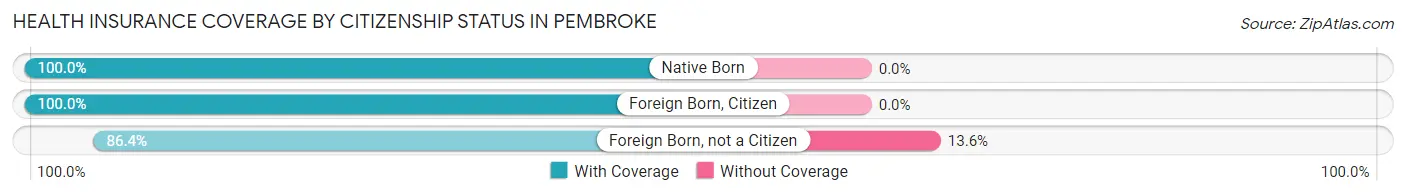
| Citizenship Status | With Coverage | Without Coverage |
| Native Born | 76 (100.0%) | 0 (0.0%) |
| Foreign Born, Citizen | 110 (100.0%) | 0 (0.0%) |
| Foreign Born, not a Citizen | 70 (86.4%) | 11 (13.6%) |
Health Insurance Coverage by Household Income in Pembroke
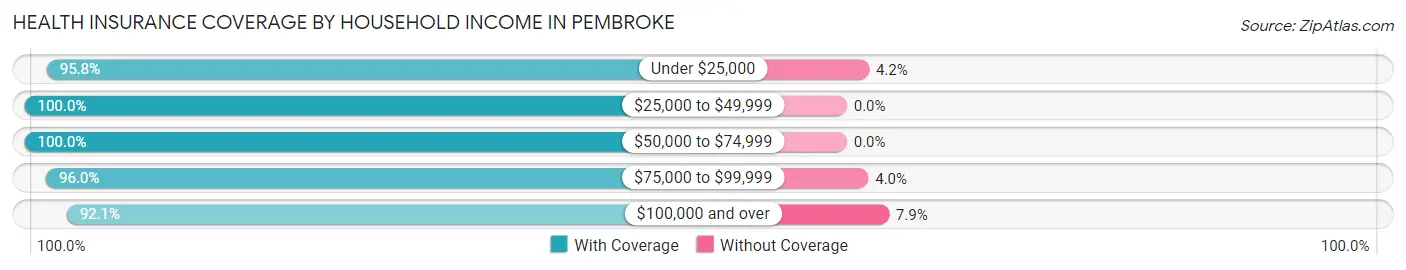
| Household Income | With Coverage | Without Coverage |
| Under $25,000 | 92 (95.8%) | 4 (4.2%) |
| $25,000 to $49,999 | 73 (100.0%) | 0 (0.0%) |
| $50,000 to $74,999 | 203 (100.0%) | 0 (0.0%) |
| $75,000 to $99,999 | 119 (96.0%) | 5 (4.0%) |
| $100,000 and over | 315 (92.1%) | 27 (7.9%) |
Public vs Private Health Insurance Coverage by Age in Pembroke
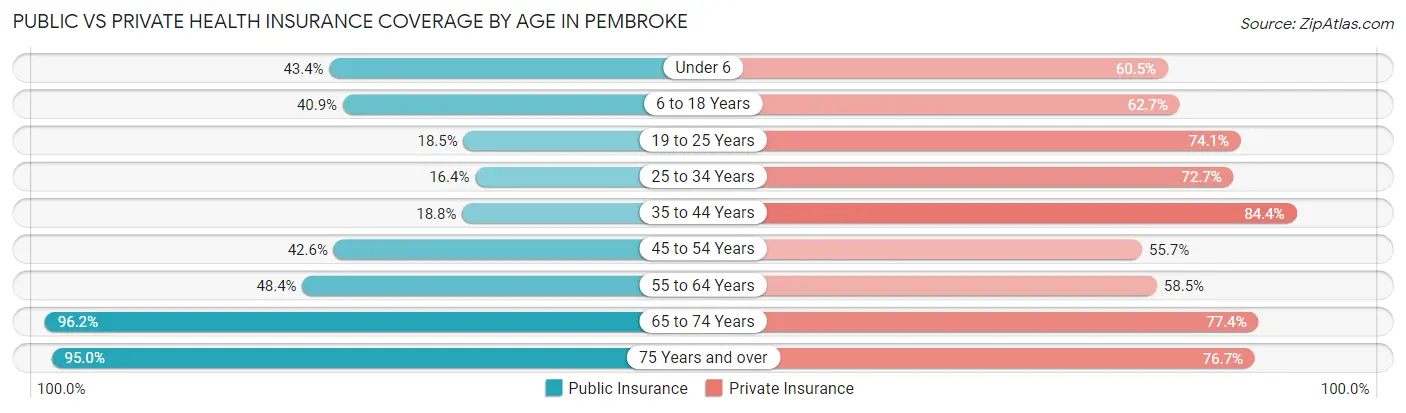
| Age Bracket | Public Insurance | Private Insurance |
| Under 6 | 33 (43.4%) | 46 (60.5%) |
| 6 to 18 Years | 45 (40.9%) | 69 (62.7%) |
| 19 to 25 Years | 15 (18.5%) | 60 (74.1%) |
| 25 to 34 Years | 18 (16.4%) | 80 (72.7%) |
| 35 to 44 Years | 24 (18.8%) | 108 (84.4%) |
| 45 to 54 Years | 26 (42.6%) | 34 (55.7%) |
| 55 to 64 Years | 77 (48.4%) | 93 (58.5%) |
| 65 to 74 Years | 51 (96.2%) | 41 (77.4%) |
| 75 Years and over | 57 (95.0%) | 46 (76.7%) |
| Total | 346 (41.3%) | 577 (68.9%) |
Disability Status by Sex by Age in Pembroke
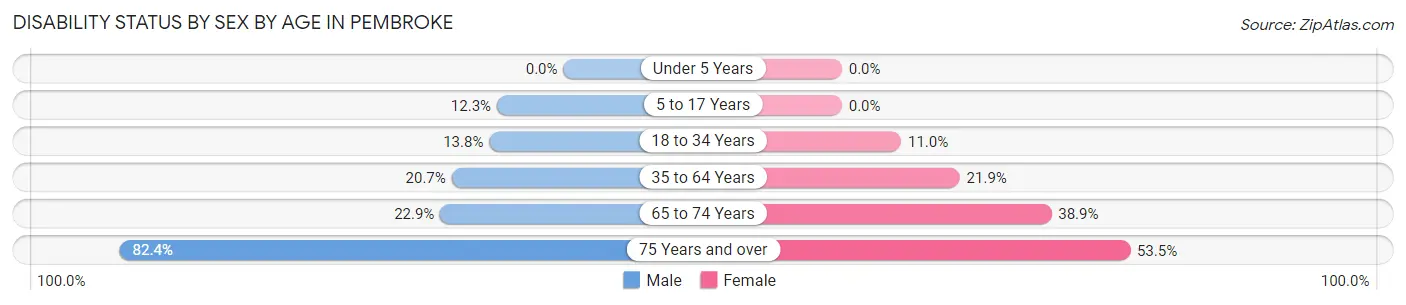
| Age Bracket | Male | Female |
| Under 5 Years | 0 (0.0%) | 0 (0.0%) |
| 5 to 17 Years | 9 (12.3%) | 0 (0.0%) |
| 18 to 34 Years | 15 (13.8%) | 11 (11.0%) |
| 35 to 64 Years | 39 (20.7%) | 35 (21.9%) |
| 65 to 74 Years | 8 (22.9%) | 7 (38.9%) |
| 75 Years and over | 14 (82.4%) | 23 (53.5%) |
Disability Class by Sex by Age in Pembroke
Disability Class: Hearing Difficulty
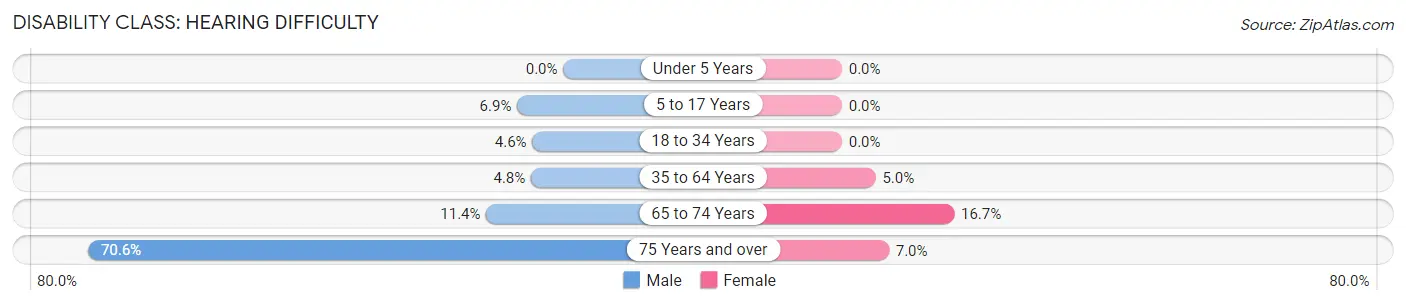
| Age Bracket | Male | Female |
| Under 5 Years | 0 (0.0%) | 0 (0.0%) |
| 5 to 17 Years | 5 (6.9%) | 0 (0.0%) |
| 18 to 34 Years | 5 (4.6%) | 0 (0.0%) |
| 35 to 64 Years | 9 (4.8%) | 8 (5.0%) |
| 65 to 74 Years | 4 (11.4%) | 3 (16.7%) |
| 75 Years and over | 12 (70.6%) | 3 (7.0%) |
Disability Class: Vision Difficulty
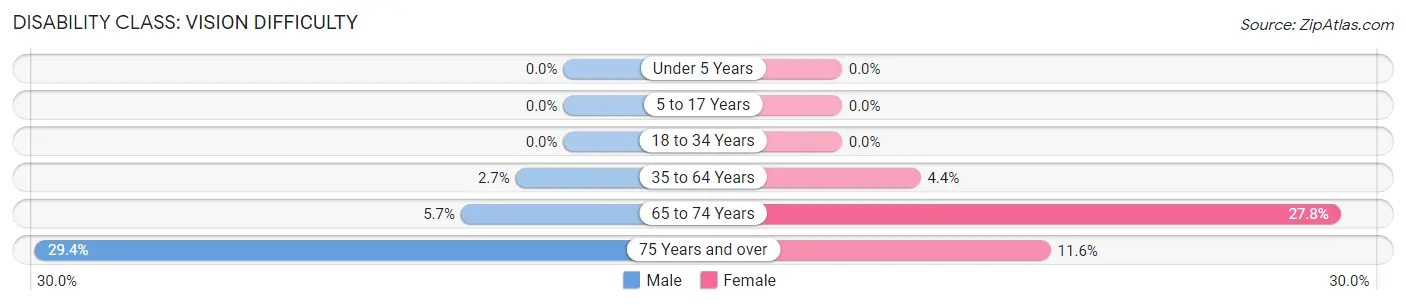
| Age Bracket | Male | Female |
| Under 5 Years | 0 (0.0%) | 0 (0.0%) |
| 5 to 17 Years | 0 (0.0%) | 0 (0.0%) |
| 18 to 34 Years | 0 (0.0%) | 0 (0.0%) |
| 35 to 64 Years | 5 (2.7%) | 7 (4.4%) |
| 65 to 74 Years | 2 (5.7%) | 5 (27.8%) |
| 75 Years and over | 5 (29.4%) | 5 (11.6%) |
Disability Class: Cognitive Difficulty
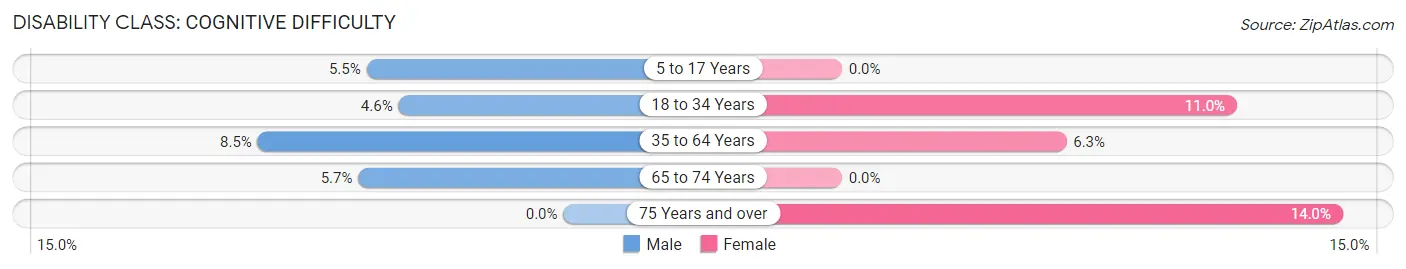
| Age Bracket | Male | Female |
| 5 to 17 Years | 4 (5.5%) | 0 (0.0%) |
| 18 to 34 Years | 5 (4.6%) | 11 (11.0%) |
| 35 to 64 Years | 16 (8.5%) | 10 (6.2%) |
| 65 to 74 Years | 2 (5.7%) | 0 (0.0%) |
| 75 Years and over | 0 (0.0%) | 6 (14.0%) |
Disability Class: Ambulatory Difficulty
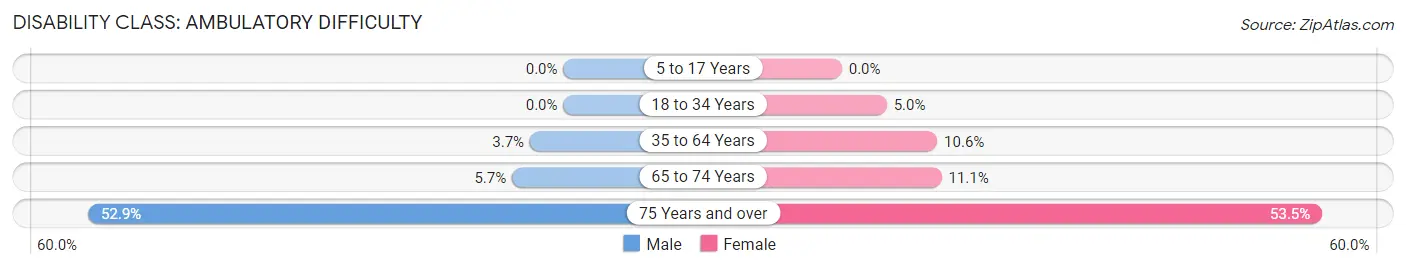
| Age Bracket | Male | Female |
| 5 to 17 Years | 0 (0.0%) | 0 (0.0%) |
| 18 to 34 Years | 0 (0.0%) | 5 (5.0%) |
| 35 to 64 Years | 7 (3.7%) | 17 (10.6%) |
| 65 to 74 Years | 2 (5.7%) | 2 (11.1%) |
| 75 Years and over | 9 (52.9%) | 23 (53.5%) |
Disability Class: Self-Care Difficulty
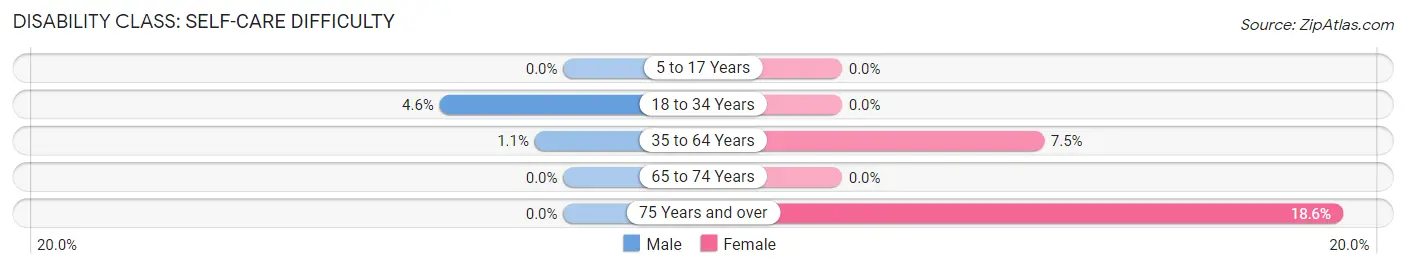
| Age Bracket | Male | Female |
| 5 to 17 Years | 0 (0.0%) | 0 (0.0%) |
| 18 to 34 Years | 5 (4.6%) | 0 (0.0%) |
| 35 to 64 Years | 2 (1.1%) | 12 (7.5%) |
| 65 to 74 Years | 0 (0.0%) | 0 (0.0%) |
| 75 Years and over | 0 (0.0%) | 8 (18.6%) |
Technology Access in Pembroke
Computing Device Access in Pembroke
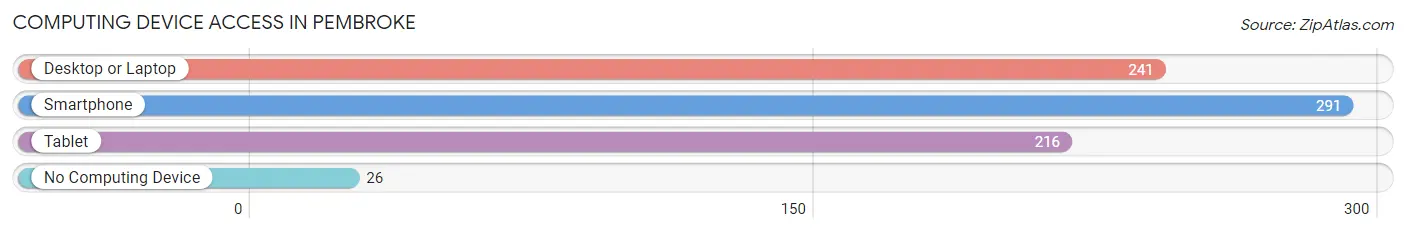
| Device Type | # Households | % Households |
| Desktop or Laptop | 241 | 71.3% |
| Smartphone | 291 | 86.1% |
| Tablet | 216 | 63.9% |
| No Computing Device | 26 | 7.7% |
| Total | 338 | 100.0% |
Internet Access in Pembroke
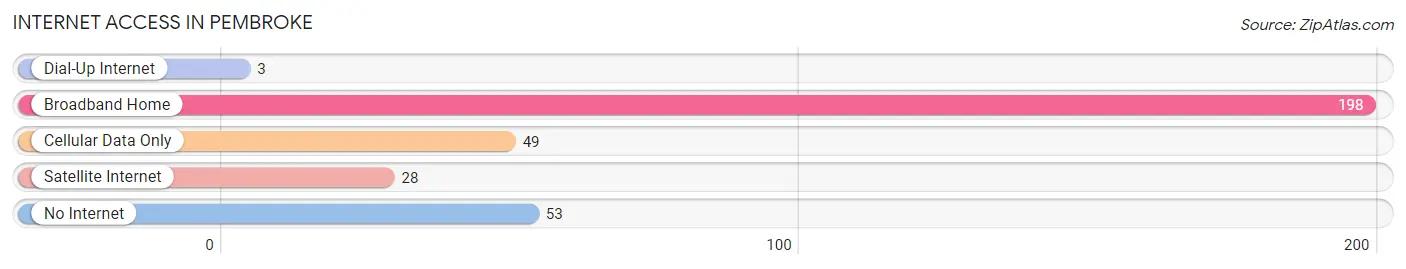
| Internet Type | # Households | % Households |
| Dial-Up Internet | 3 | 0.9% |
| Broadband Home | 198 | 58.6% |
| Cellular Data Only | 49 | 14.5% |
| Satellite Internet | 28 | 8.3% |
| No Internet | 53 | 15.7% |
| Total | 338 | 100.0% |
Pembroke Summary
Pembroke, Kentucky is a small town located in Christian County, Kentucky. It is situated in the western part of the state, about 20 miles from the Tennessee border. The town has a population of just over 1,000 people, and is part of the Hopkinsville, Kentucky Metropolitan Statistical Area.
History
Pembroke was founded in 1820 by a group of settlers from Virginia. The town was named after the Pembroke family, who were among the first settlers. The town was originally a farming community, and the main crops grown were corn, wheat, and tobacco. In the late 19th century, the town began to grow and develop, and by the early 20th century, it had become a thriving community.
In the early 1900s, the town was home to several businesses, including a general store, a blacksmith shop, a sawmill, and a gristmill. The town also had a post office, a bank, and a hotel. In the 1920s, the town was connected to the rest of the state by the Louisville and Nashville Railroad.
Geography
Pembroke is located in western Kentucky, about 20 miles from the Tennessee border. The town is situated in the Pennyrile region of the state, which is characterized by rolling hills and fertile farmland. The town is located on the banks of the Tradewater River, which flows through the town and provides a source of recreation for the locals.
The town is located in a humid subtropical climate zone, with hot summers and mild winters. The average annual temperature is around 60 degrees Fahrenheit, and the average annual precipitation is around 45 inches.
Economy
The economy of Pembroke is largely based on agriculture. The town is home to several farms, which produce a variety of crops, including corn, wheat, soybeans, and tobacco. The town also has several small businesses, including a general store, a hardware store, and a restaurant.
The town is also home to a number of manufacturing companies, including a furniture factory, a plastics factory, and a metal fabrication plant. The town is also home to a number of service-based businesses, including a bank, a post office, and a hotel.
Demographics
As of the 2010 census, the population of Pembroke was 1,072. The racial makeup of the town was 95.3% White, 2.2% African American, 0.3% Native American, 0.2% Asian, 0.1% Pacific Islander, 0.7% from other races, and 1.3% from two or more races. Hispanic or Latino of any race were 1.7% of the population.
The median household income in Pembroke was $35,938, and the median family income was $41,250. The per capita income for the town was $17,845. About 16.2% of the population was below the poverty line.
Conclusion
Pembroke, Kentucky is a small town located in Christian County, Kentucky. It is situated in the western part of the state, about 20 miles from the Tennessee border. The town has a population of just over 1,000 people, and is part of the Hopkinsville, Kentucky Metropolitan Statistical Area. The town was founded in 1820 by a group of settlers from Virginia, and the economy is largely based on agriculture. The town is also home to several small businesses, manufacturing companies, and service-based businesses. The population of Pembroke is mostly White, with a small percentage of African American, Native American, Asian, and Pacific Islander residents. The median household income in Pembroke is $35,938, and the per capita income is $17,845.
Common Questions
What is Per Capita Income in Pembroke?
Per Capita income in Pembroke is $30,572.
What is the Median Family Income in Pembroke?
Median Family Income in Pembroke is $100,833.
What is the Median Household income in Pembroke?
Median Household Income in Pembroke is $80,893.
What is Income or Wage Gap in Pembroke?
Income or Wage Gap in Pembroke is 37.2%.
Women in Pembroke earn 62.8 cents for every dollar earned by a man.
What is Inequality or Gini Index in Pembroke?
Inequality or Gini Index in Pembroke is 0.34.
What is the Total Population of Pembroke?
Total Population of Pembroke is 900.
What is the Total Male Population of Pembroke?
Total Male Population of Pembroke is 477.
What is the Total Female Population of Pembroke?
Total Female Population of Pembroke is 423.
What is the Ratio of Males per 100 Females in Pembroke?
There are 112.77 Males per 100 Females in Pembroke.
What is the Ratio of Females per 100 Males in Pembroke?
There are 88.68 Females per 100 Males in Pembroke.
What is the Median Population Age in Pembroke?
Median Population Age in Pembroke is 37.8 Years.
What is the Average Family Size in Pembroke
Average Family Size in Pembroke is 2.9 People.
What is the Average Household Size in Pembroke
Average Household Size in Pembroke is 2.5 People.
How Large is the Labor Force in Pembroke?
There are 426 People in the Labor Forcein in Pembroke.
What is the Percentage of People in the Labor Force in Pembroke?
57.4% of People are in the Labor Force in Pembroke.
What is the Unemployment Rate in Pembroke?
Unemployment Rate in Pembroke is 3.8%.