Nebo, KY Map & Demographics
Nebo Map
Nebo Overview
$31,278
PER CAPITA INCOME
$83,068
AVG FAMILY INCOME
$75,938
AVG HOUSEHOLD INCOME
3.8%
WAGE / INCOME GAP [ % ]
96.2¢/ $1
WAGE / INCOME GAP [ $ ]
0.45
INEQUALITY / GINI INDEX
203
TOTAL POPULATION
115
MALE POPULATION
88
FEMALE POPULATION
130.68
MALES / 100 FEMALES
76.52
FEMALES / 100 MALES
45.1
MEDIAN AGE
2.8
AVG FAMILY SIZE
2.6
AVG HOUSEHOLD SIZE
108
LABOR FORCE [ PEOPLE ]
63.9%
PERCENT IN LABOR FORCE
2.8%
UNEMPLOYMENT RATE
Nebo Zip Codes
Nebo Area Codes
Income in Nebo
Income Overview in Nebo
Per Capita Income in Nebo is $31,278, while median incomes of families and households are $83,068 and $75,938 respectively.
| Characteristic | Number | Measure |
| Per Capita Income | 203 | $31,278 |
| Median Family Income | 61 | $83,068 |
| Mean Family Income | 61 | $97,270 |
| Median Household Income | 77 | $75,938 |
| Mean Household Income | 77 | $84,173 |
| Income Deficit | 61 | $0 |
| Wage / Income Gap (%) | 203 | 3.75% |
| Wage / Income Gap ($) | 203 | 96.25¢ per $1 |
| Gini / Inequality Index | 203 | 0.45 |
Earnings by Sex in Nebo
Average Earnings in Nebo are $39,145, $39,773 for men and $38,281 for women, a difference of 3.7%.
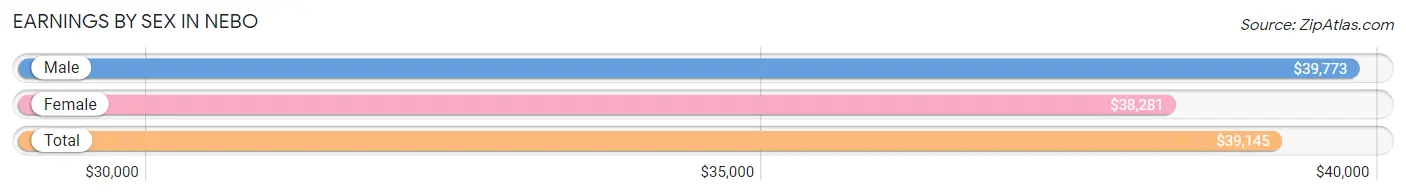
| Sex | Number | Average Earnings |
| Male | 70 (62.0%) | $39,773 |
| Female | 43 (38.1%) | $38,281 |
| Total | 113 (100.0%) | $39,145 |
Earnings by Sex by Income Bracket in Nebo
The most common earnings brackets in Nebo are $45,000 to $49,999 for men (12 | 17.1%) and $35,000 to $39,999 for women (9 | 20.9%).
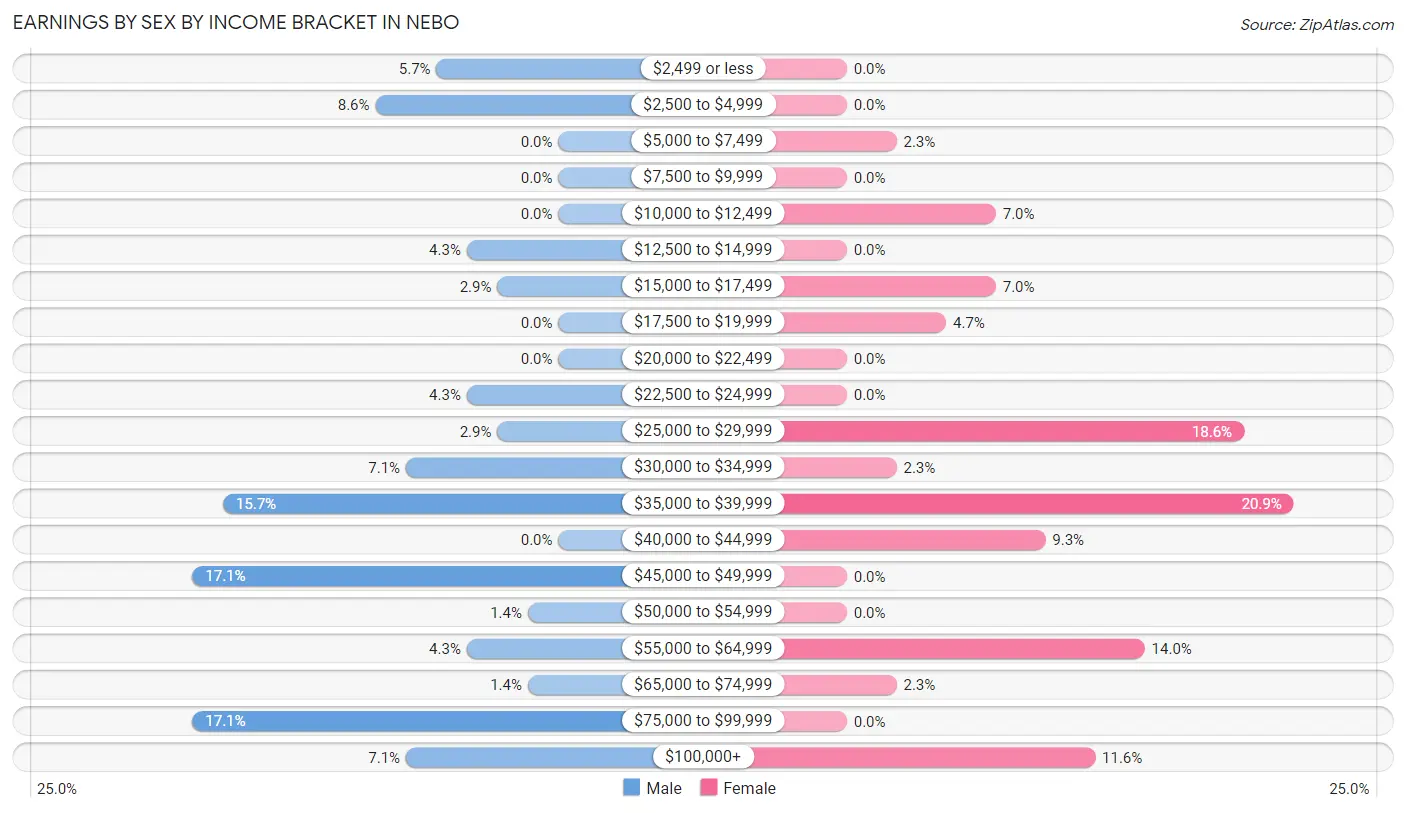
| Income | Male | Female |
| $2,499 or less | 4 (5.7%) | 0 (0.0%) |
| $2,500 to $4,999 | 6 (8.6%) | 0 (0.0%) |
| $5,000 to $7,499 | 0 (0.0%) | 1 (2.3%) |
| $7,500 to $9,999 | 0 (0.0%) | 0 (0.0%) |
| $10,000 to $12,499 | 0 (0.0%) | 3 (7.0%) |
| $12,500 to $14,999 | 3 (4.3%) | 0 (0.0%) |
| $15,000 to $17,499 | 2 (2.9%) | 3 (7.0%) |
| $17,500 to $19,999 | 0 (0.0%) | 2 (4.6%) |
| $20,000 to $22,499 | 0 (0.0%) | 0 (0.0%) |
| $22,500 to $24,999 | 3 (4.3%) | 0 (0.0%) |
| $25,000 to $29,999 | 2 (2.9%) | 8 (18.6%) |
| $30,000 to $34,999 | 5 (7.1%) | 1 (2.3%) |
| $35,000 to $39,999 | 11 (15.7%) | 9 (20.9%) |
| $40,000 to $44,999 | 0 (0.0%) | 4 (9.3%) |
| $45,000 to $49,999 | 12 (17.1%) | 0 (0.0%) |
| $50,000 to $54,999 | 1 (1.4%) | 0 (0.0%) |
| $55,000 to $64,999 | 3 (4.3%) | 6 (14.0%) |
| $65,000 to $74,999 | 1 (1.4%) | 1 (2.3%) |
| $75,000 to $99,999 | 12 (17.1%) | 0 (0.0%) |
| $100,000+ | 5 (7.1%) | 5 (11.6%) |
| Total | 70 (100.0%) | 43 (100.0%) |
Earnings by Sex by Educational Attainment in Nebo
Average earnings in Nebo are $46,458 for men and $42,917 for women, a difference of 7.6%. Men with an educational attainment of high school diploma enjoy the highest average annual earnings of $47,188, while those with high school diploma education earn the least with $47,188. Women with an educational attainment of college or associate's degree earn the most with the average annual earnings of $58,438, while those with high school diploma education have the smallest earnings of $38,125.
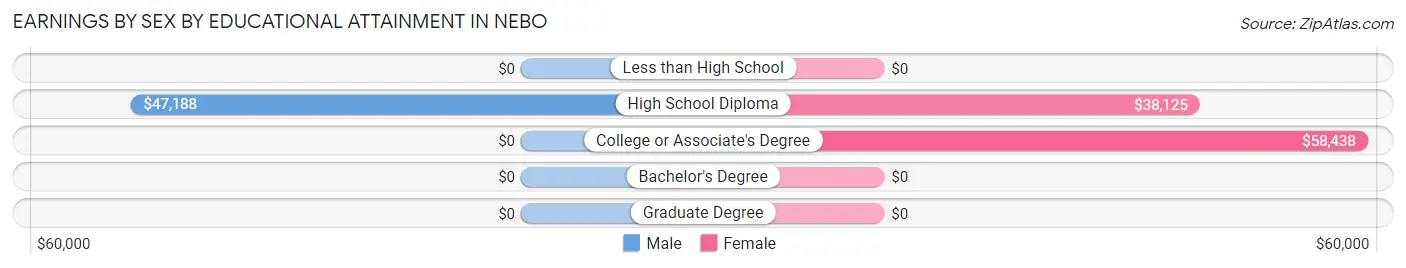
| Educational Attainment | Male Income | Female Income |
| Less than High School | - | - |
| High School Diploma | $47,188 | $38,125 |
| College or Associate's Degree | - | - |
| Bachelor's Degree | - | - |
| Graduate Degree | - | - |
| Total | $46,458 | $42,917 |
Family Income in Nebo
Family Income Brackets in Nebo
According to the Nebo family income data, there are 18 families falling into the $75,000 to $99,999 income range, which is the most common income bracket and makes up 29.5% of all families.
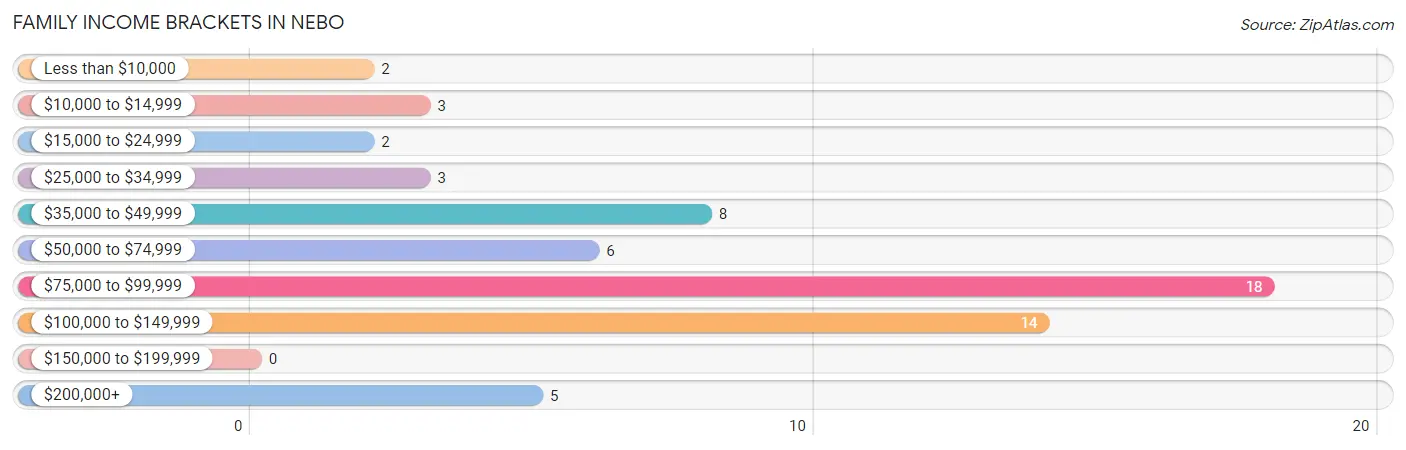
| Income Bracket | # Families | % Families |
| Less than $10,000 | 2 | 3.3% |
| $10,000 to $14,999 | 3 | 4.9% |
| $15,000 to $24,999 | 2 | 3.3% |
| $25,000 to $34,999 | 3 | 4.9% |
| $35,000 to $49,999 | 8 | 13.1% |
| $50,000 to $74,999 | 6 | 9.8% |
| $75,000 to $99,999 | 18 | 29.5% |
| $100,000 to $149,999 | 14 | 23.0% |
| $150,000 to $199,999 | 0 | 0.0% |
| $200,000+ | 5 | 8.2% |
Family Income by Famaliy Size in Nebo
2-person families (31 | 50.8%) account for the highest median family income in Nebo with $82,841 per family, while 2-person families (31 | 50.8%) have the highest median income of $41,420 per family member.
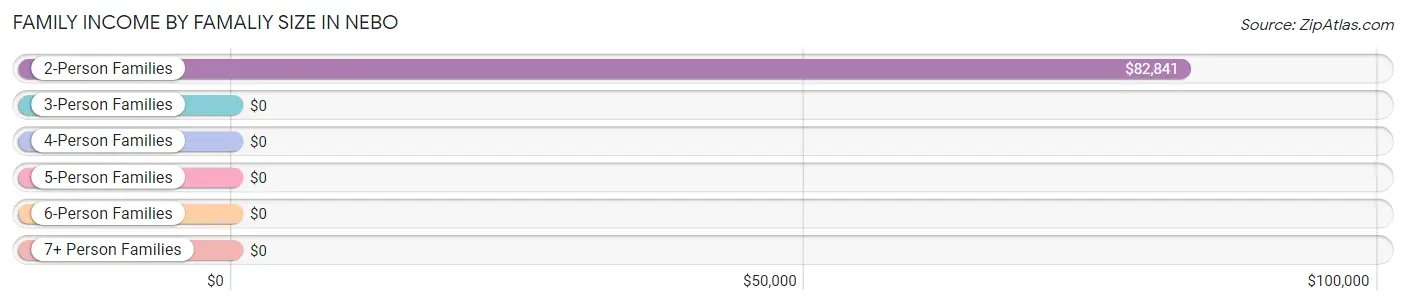
| Income Bracket | # Families | Median Income |
| 2-Person Families | 31 (50.8%) | $82,841 |
| 3-Person Families | 16 (26.2%) | $0 |
| 4-Person Families | 11 (18.0%) | $0 |
| 5-Person Families | 3 (4.9%) | $0 |
| 6-Person Families | 0 (0.0%) | $0 |
| 7+ Person Families | 0 (0.0%) | $0 |
| Total | 61 (100.0%) | $83,068 |
Family Income by Number of Earners in Nebo
The median family income in Nebo is $83,068, with families comprising 3+ earners (5) having the highest median family income of $132,917, while families with no earners (8) have the lowest median family income of $26,250, accounting for 8.2% and 13.1% of families, respectively.
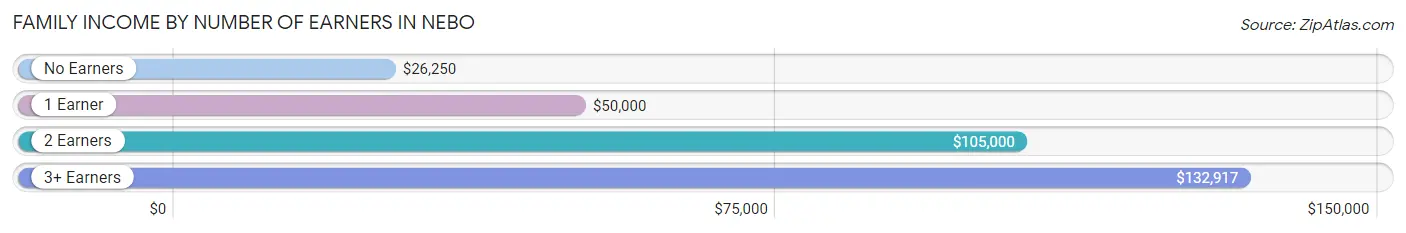
| Number of Earners | # Families | Median Income |
| No Earners | 8 (13.1%) | $26,250 |
| 1 Earner | 16 (26.2%) | $50,000 |
| 2 Earners | 32 (52.5%) | $105,000 |
| 3+ Earners | 5 (8.2%) | $132,917 |
| Total | 61 (100.0%) | $83,068 |
Household Income in Nebo
Household Income Brackets in Nebo
With 20 households falling in the category, the $75,000 to $99,999 income range is the most frequent in Nebo, accounting for 26.0% of all households.
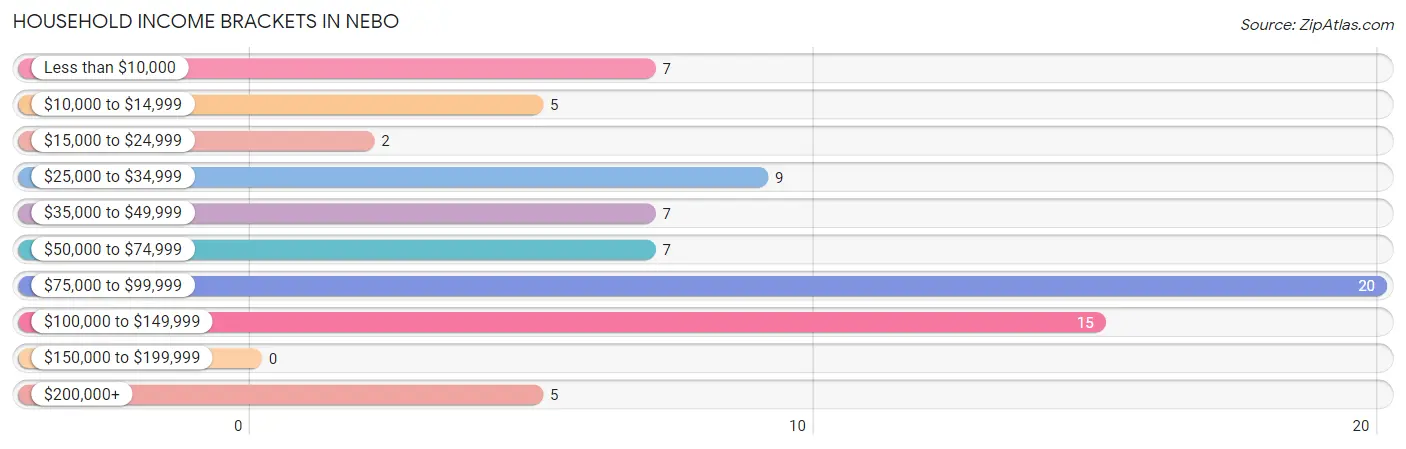
| Income Bracket | # Households | % Households |
| Less than $10,000 | 7 | 9.1% |
| $10,000 to $14,999 | 5 | 6.5% |
| $15,000 to $24,999 | 2 | 2.6% |
| $25,000 to $34,999 | 9 | 11.7% |
| $35,000 to $49,999 | 7 | 9.1% |
| $50,000 to $74,999 | 7 | 9.1% |
| $75,000 to $99,999 | 20 | 26.0% |
| $100,000 to $149,999 | 15 | 19.5% |
| $150,000 to $199,999 | 0 | 0.0% |
| $200,000+ | 5 | 6.5% |
Household Income by Householder Age in Nebo
The median household income in Nebo is $75,938, with the highest median household income of $97,500 found in the 25 to 44 years age bracket for the primary householder. A total of 22 households (28.6%) fall into this category. Meanwhile, the 65+ years age bracket for the primary householder has the lowest median household income of $0, with 19 households (24.7%) in this group.
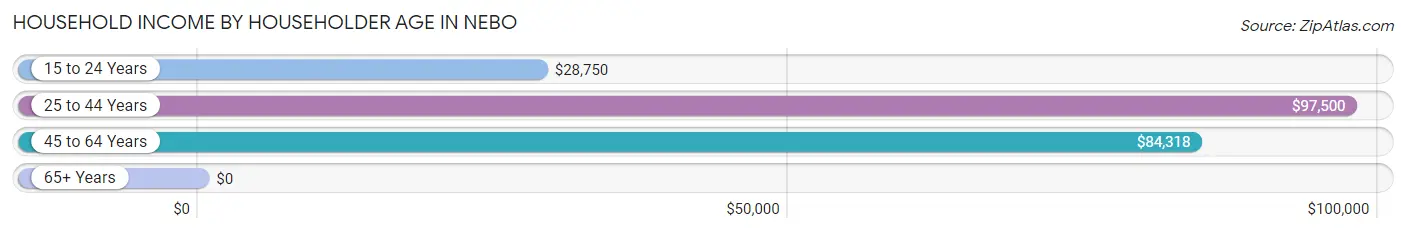
| Income Bracket | # Households | Median Income |
| 15 to 24 Years | 6 (7.8%) | $28,750 |
| 25 to 44 Years | 22 (28.6%) | $97,500 |
| 45 to 64 Years | 30 (39.0%) | $84,318 |
| 65+ Years | 19 (24.7%) | $0 |
| Total | 77 (100.0%) | $75,938 |
Poverty in Nebo
Income Below Poverty by Sex and Age in Nebo
With 20.9% poverty level for males and 21.6% for females among the residents of Nebo, 25 to 34 year old males and 12 to 14 year old females are the most vulnerable to poverty, with 6 males (60.0%) and 1 females (50.0%) in their respective age groups living below the poverty level.
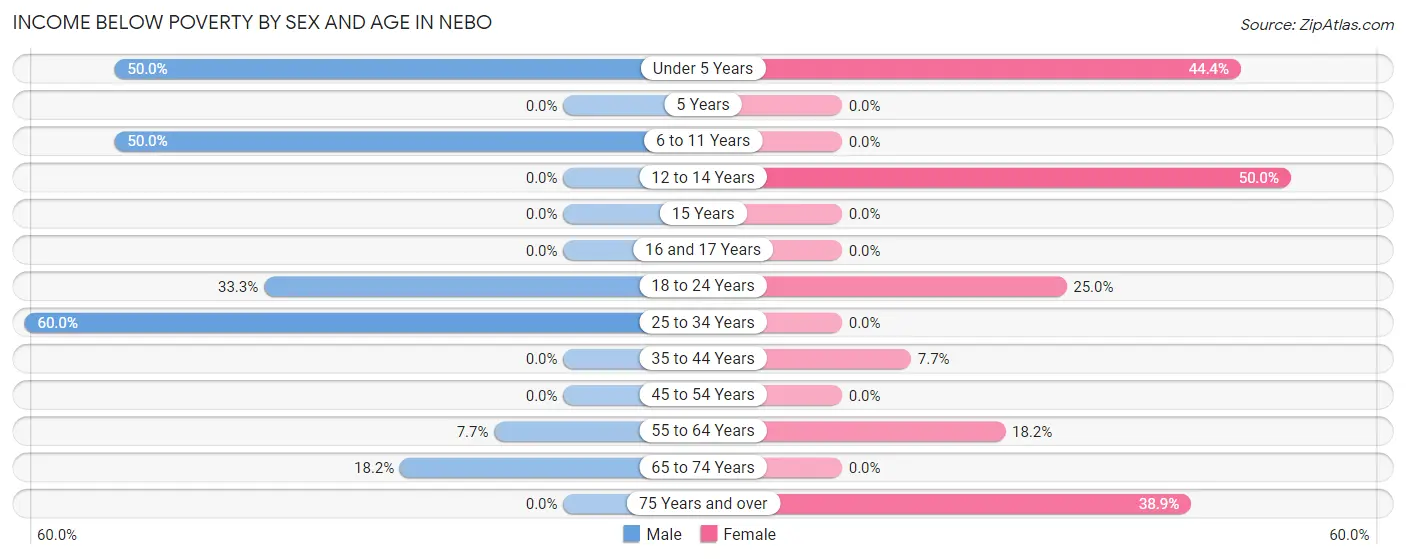
| Age Bracket | Male | Female |
| Under 5 Years | 5 (50.0%) | 4 (44.4%) |
| 5 Years | 0 (0.0%) | 0 (0.0%) |
| 6 to 11 Years | 3 (50.0%) | 0 (0.0%) |
| 12 to 14 Years | 0 (0.0%) | 1 (50.0%) |
| 15 Years | 0 (0.0%) | 0 (0.0%) |
| 16 and 17 Years | 0 (0.0%) | 0 (0.0%) |
| 18 to 24 Years | 5 (33.3%) | 4 (25.0%) |
| 25 to 34 Years | 6 (60.0%) | 0 (0.0%) |
| 35 to 44 Years | 0 (0.0%) | 1 (7.7%) |
| 45 to 54 Years | 0 (0.0%) | 0 (0.0%) |
| 55 to 64 Years | 3 (7.7%) | 2 (18.2%) |
| 65 to 74 Years | 2 (18.2%) | 0 (0.0%) |
| 75 Years and over | 0 (0.0%) | 7 (38.9%) |
| Total | 24 (20.9%) | 19 (21.6%) |
Income Above Poverty by Sex and Age in Nebo
According to the poverty statistics in Nebo, males aged 12 to 14 years and females aged 6 to 11 years are the age groups that are most secure financially, with 100.0% of males and 100.0% of females in these age groups living above the poverty line.
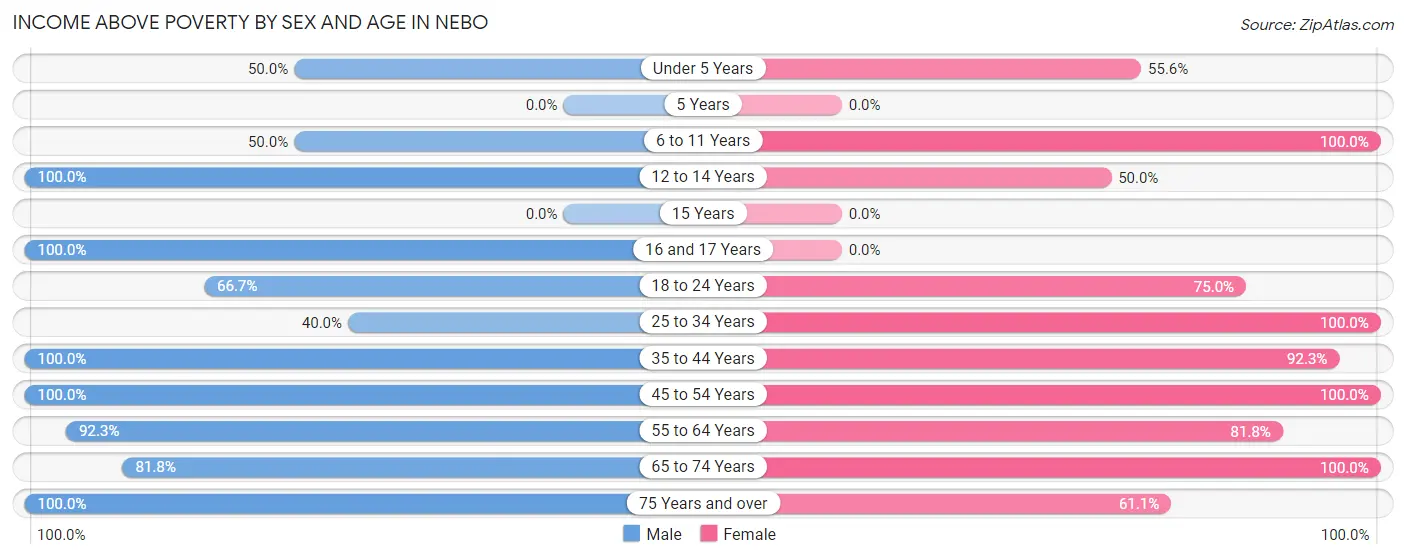
| Age Bracket | Male | Female |
| Under 5 Years | 5 (50.0%) | 5 (55.6%) |
| 5 Years | 0 (0.0%) | 0 (0.0%) |
| 6 to 11 Years | 3 (50.0%) | 2 (100.0%) |
| 12 to 14 Years | 5 (100.0%) | 1 (50.0%) |
| 15 Years | 0 (0.0%) | 0 (0.0%) |
| 16 and 17 Years | 1 (100.0%) | 0 (0.0%) |
| 18 to 24 Years | 10 (66.7%) | 12 (75.0%) |
| 25 to 34 Years | 4 (40.0%) | 4 (100.0%) |
| 35 to 44 Years | 8 (100.0%) | 12 (92.3%) |
| 45 to 54 Years | 6 (100.0%) | 8 (100.0%) |
| 55 to 64 Years | 36 (92.3%) | 9 (81.8%) |
| 65 to 74 Years | 9 (81.8%) | 5 (100.0%) |
| 75 Years and over | 4 (100.0%) | 11 (61.1%) |
| Total | 91 (79.1%) | 69 (78.4%) |
Income Below Poverty Among Married-Couple Families in Nebo
The poverty statistics for married-couple families in Nebo show that 7.0% or 4 of the total 57 families live below the poverty line. Families with 1 or 2 children have the highest poverty rate of 18.2%, comprising of 2 families. On the other hand, families with 3 or 4 children have the lowest poverty rate of 0.0%, which includes 0 families.
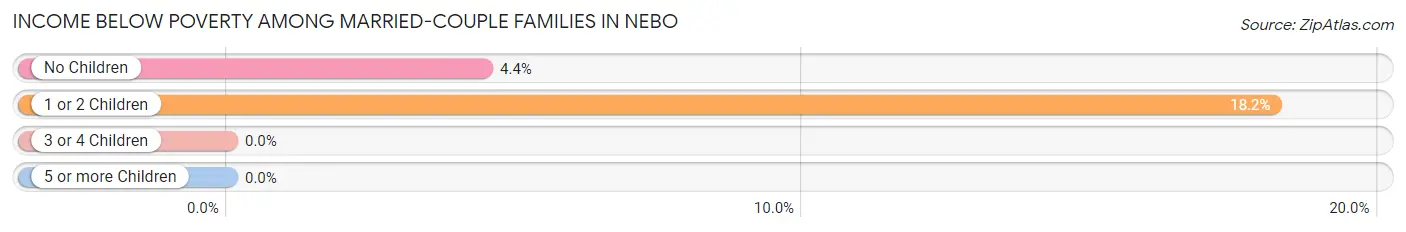
| Children | Above Poverty | Below Poverty |
| No Children | 43 (95.6%) | 2 (4.4%) |
| 1 or 2 Children | 9 (81.8%) | 2 (18.2%) |
| 3 or 4 Children | 1 (100.0%) | 0 (0.0%) |
| 5 or more Children | 0 (0.0%) | 0 (0.0%) |
| Total | 53 (93.0%) | 4 (7.0%) |
Income Below Poverty Among Single-Parent Households in Nebo
According to the poverty data in Nebo, 100.0% or 2 single-father households and 50.0% or 1 single-mother households are living below the poverty line. Among single-father households, those with 1 or 2 children have the highest poverty rate, with 2 households (100.0%) experiencing poverty. Likewise, among single-mother households, those with 3 or 4 children have the highest poverty rate, with 1 households (50.0%) falling below the poverty line.
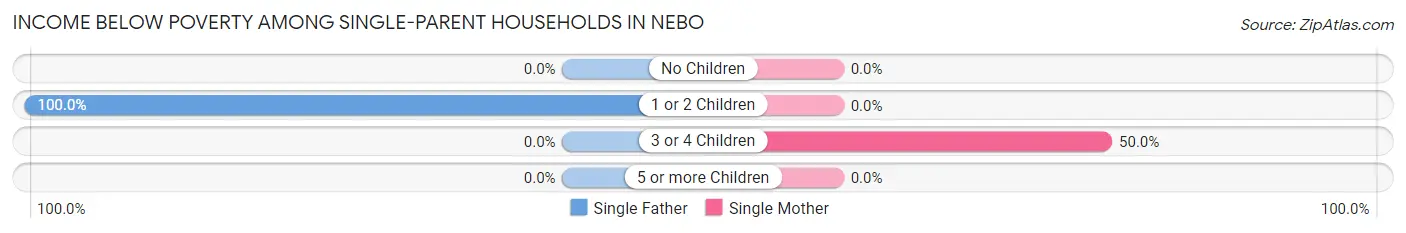
| Children | Single Father | Single Mother |
| No Children | 0 (0.0%) | 0 (0.0%) |
| 1 or 2 Children | 2 (100.0%) | 0 (0.0%) |
| 3 or 4 Children | 0 (0.0%) | 1 (50.0%) |
| 5 or more Children | 0 (0.0%) | 0 (0.0%) |
| Total | 2 (100.0%) | 1 (50.0%) |
Income Below Poverty Among Married-Couple vs Single-Parent Households in Nebo
The poverty data for Nebo shows that 4 of the married-couple family households (7.0%) and 3 of the single-parent households (75.0%) are living below the poverty level. Within the married-couple family households, those with 1 or 2 children have the highest poverty rate, with 2 households (18.2%) falling below the poverty line. Among the single-parent households, those with 1 or 2 children have the highest poverty rate, with 2 household (100.0%) living below poverty.
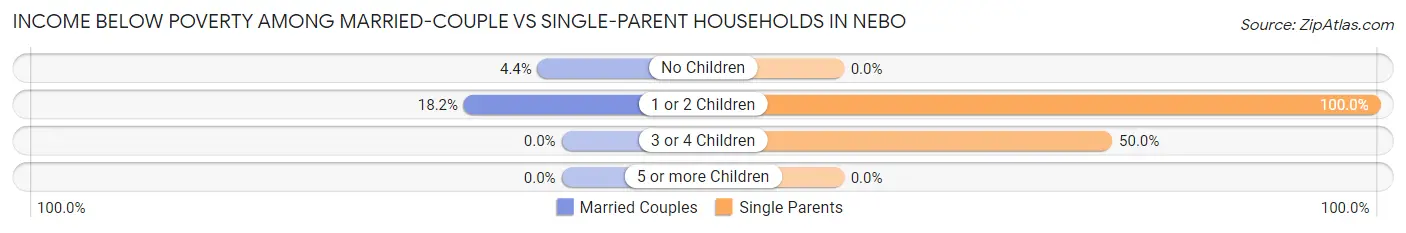
| Children | Married-Couple Families | Single-Parent Households |
| No Children | 2 (4.4%) | 0 (0.0%) |
| 1 or 2 Children | 2 (18.2%) | 2 (100.0%) |
| 3 or 4 Children | 0 (0.0%) | 1 (50.0%) |
| 5 or more Children | 0 (0.0%) | 0 (0.0%) |
| Total | 4 (7.0%) | 3 (75.0%) |
Race in Nebo
The most populous races in Nebo are White / Caucasian (168 | 82.8%), Two or more Races (21 | 10.3%), and Black / African American (13 | 6.4%).
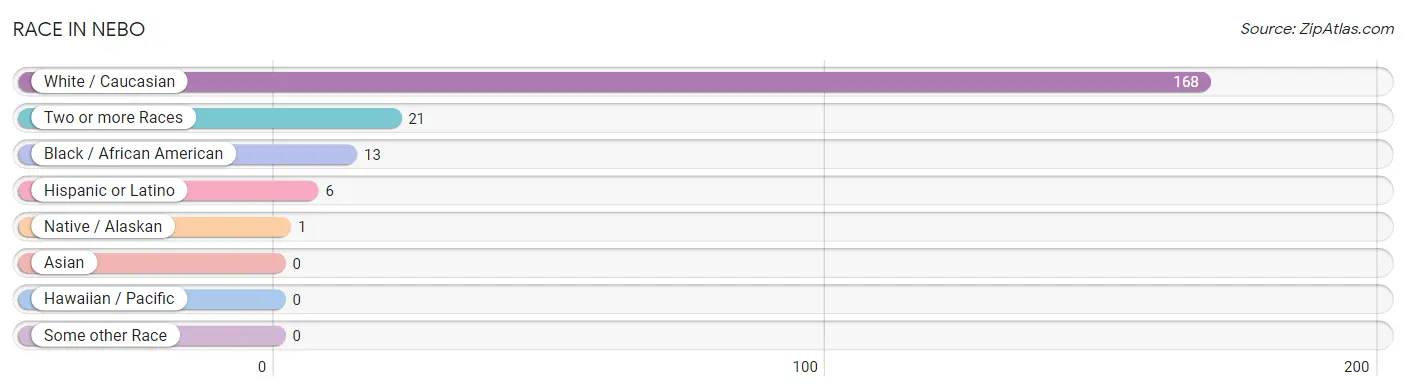
| Race | # Population | % Population |
| Asian | 0 | 0.0% |
| Black / African American | 13 | 6.4% |
| Hawaiian / Pacific | 0 | 0.0% |
| Hispanic or Latino | 6 | 3.0% |
| Native / Alaskan | 1 | 0.5% |
| White / Caucasian | 168 | 82.8% |
| Two or more Races | 21 | 10.3% |
| Some other Race | 0 | 0.0% |
| Total | 203 | 100.0% |
Ancestry in Nebo
The most populous ancestries reported in Nebo are English (49 | 24.1%), American (24 | 11.8%), Dutch (12 | 5.9%), European (8 | 3.9%), and French (6 | 3.0%), together accounting for 48.8% of all Nebo residents.
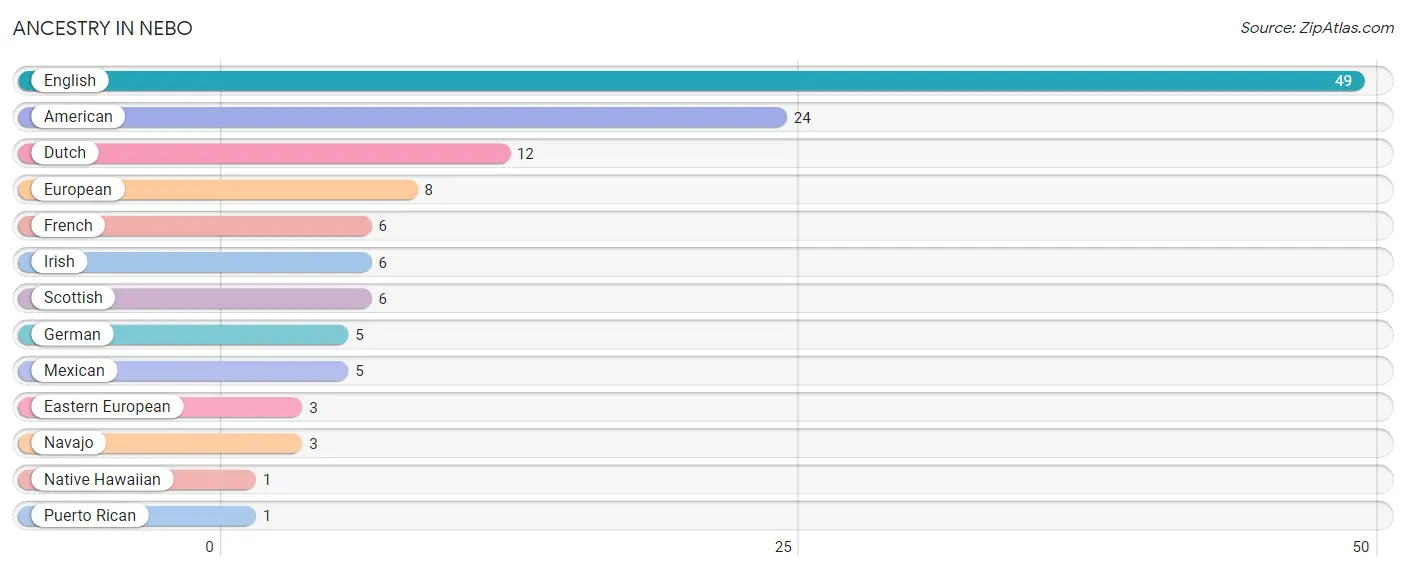
| Ancestry | # Population | % Population |
| American | 24 | 11.8% |
| Dutch | 12 | 5.9% |
| Eastern European | 3 | 1.5% |
| English | 49 | 24.1% |
| European | 8 | 3.9% |
| French | 6 | 3.0% |
| German | 5 | 2.5% |
| Irish | 6 | 3.0% |
| Mexican | 5 | 2.5% |
| Native Hawaiian | 1 | 0.5% |
| Navajo | 3 | 1.5% |
| Puerto Rican | 1 | 0.5% |
| Scottish | 6 | 3.0% | View All 13 Rows |
Immigrants in Nebo

| Immigration Origin | # Population | % Population | View All 0 Rows |
Sex and Age in Nebo
Sex and Age in Nebo
The most populous age groups in Nebo are 55 to 59 Years (26 | 22.6%) for men and 20 to 24 Years (16 | 18.2%) for women.
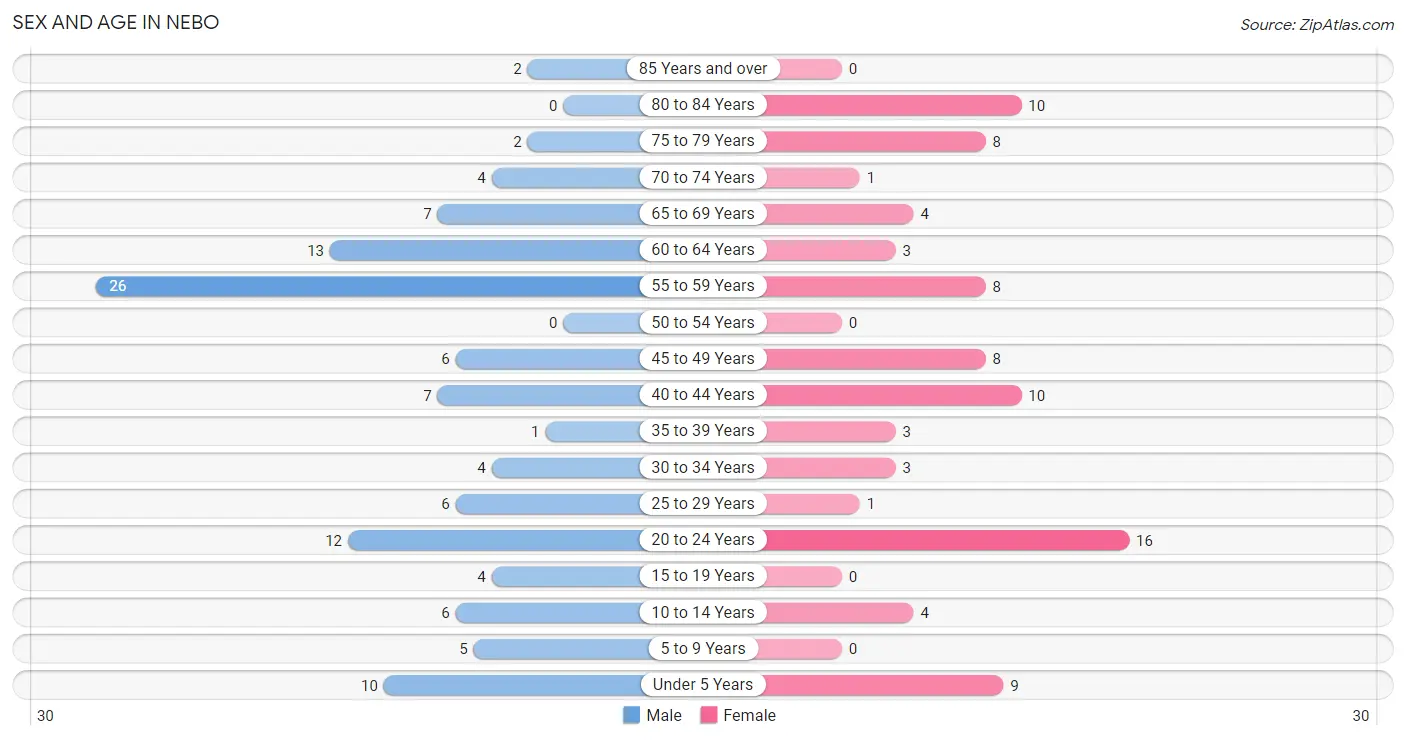
| Age Bracket | Male | Female |
| Under 5 Years | 10 (8.7%) | 9 (10.2%) |
| 5 to 9 Years | 5 (4.3%) | 0 (0.0%) |
| 10 to 14 Years | 6 (5.2%) | 4 (4.5%) |
| 15 to 19 Years | 4 (3.5%) | 0 (0.0%) |
| 20 to 24 Years | 12 (10.4%) | 16 (18.2%) |
| 25 to 29 Years | 6 (5.2%) | 1 (1.1%) |
| 30 to 34 Years | 4 (3.5%) | 3 (3.4%) |
| 35 to 39 Years | 1 (0.9%) | 3 (3.4%) |
| 40 to 44 Years | 7 (6.1%) | 10 (11.4%) |
| 45 to 49 Years | 6 (5.2%) | 8 (9.1%) |
| 50 to 54 Years | 0 (0.0%) | 0 (0.0%) |
| 55 to 59 Years | 26 (22.6%) | 8 (9.1%) |
| 60 to 64 Years | 13 (11.3%) | 3 (3.4%) |
| 65 to 69 Years | 7 (6.1%) | 4 (4.5%) |
| 70 to 74 Years | 4 (3.5%) | 1 (1.1%) |
| 75 to 79 Years | 2 (1.7%) | 8 (9.1%) |
| 80 to 84 Years | 0 (0.0%) | 10 (11.4%) |
| 85 Years and over | 2 (1.7%) | 0 (0.0%) |
| Total | 115 (100.0%) | 88 (100.0%) |
Families and Households in Nebo
Median Family Size in Nebo
The median family size in Nebo is 2.82 persons per family, with single female/mother families (2 | 3.3%) accounting for the largest median family size of 5.5 persons per family. On the other hand, single male/father families (2 | 3.3%) represent the smallest median family size with 2.00 persons per family.
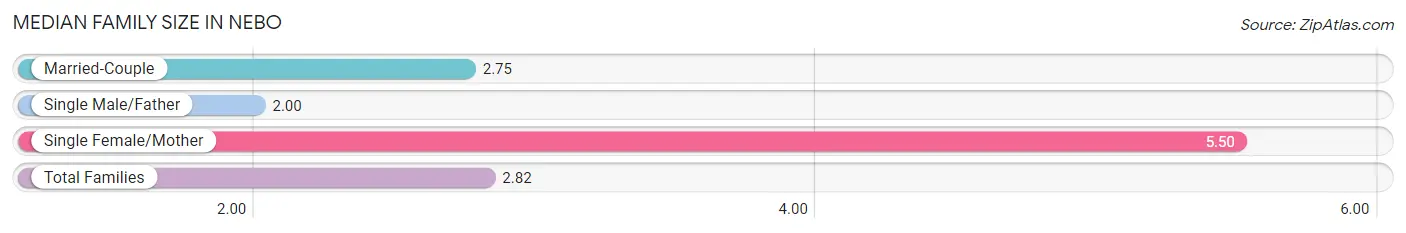
| Family Type | # Families | Family Size |
| Married-Couple | 57 (93.4%) | 2.75 |
| Single Male/Father | 2 (3.3%) | 2.00 |
| Single Female/Mother | 2 (3.3%) | 5.50 |
| Total Families | 61 (100.0%) | 2.82 |
Median Household Size in Nebo
The median household size in Nebo is 2.64 persons per household, with single female/mother households (2 | 2.6%) accounting for the largest median household size of 6 persons per household. non-family households (16 | 20.8%) represent the smallest median household size with 1.69 persons per household.
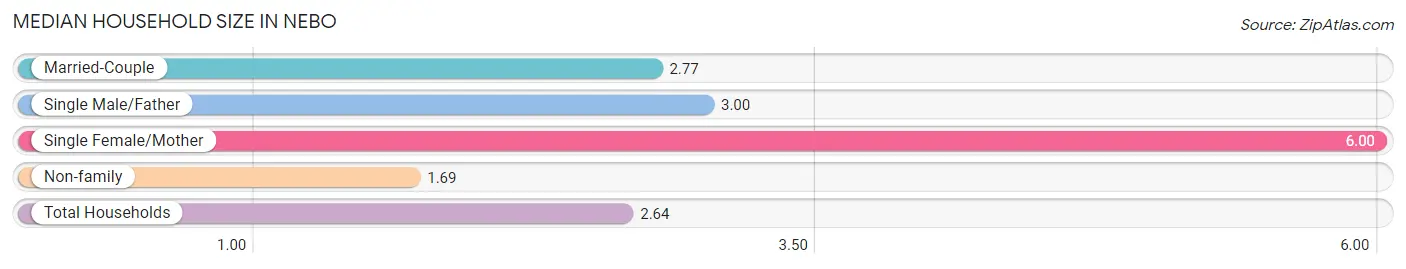
| Household Type | # Households | Household Size |
| Married-Couple | 57 (74.0%) | 2.77 |
| Single Male/Father | 2 (2.6%) | 3.00 |
| Single Female/Mother | 2 (2.6%) | 6.00 |
| Non-family | 16 (20.8%) | 1.69 |
| Total Households | 77 (100.0%) | 2.64 |
Household Size by Marriage Status in Nebo
Out of a total of 77 households in Nebo, 61 (79.2%) are family households, while 16 (20.8%) are nonfamily households. The most numerous type of family households are 2-person households, comprising 31, and the most common type of nonfamily households are 1-person households, comprising 9.
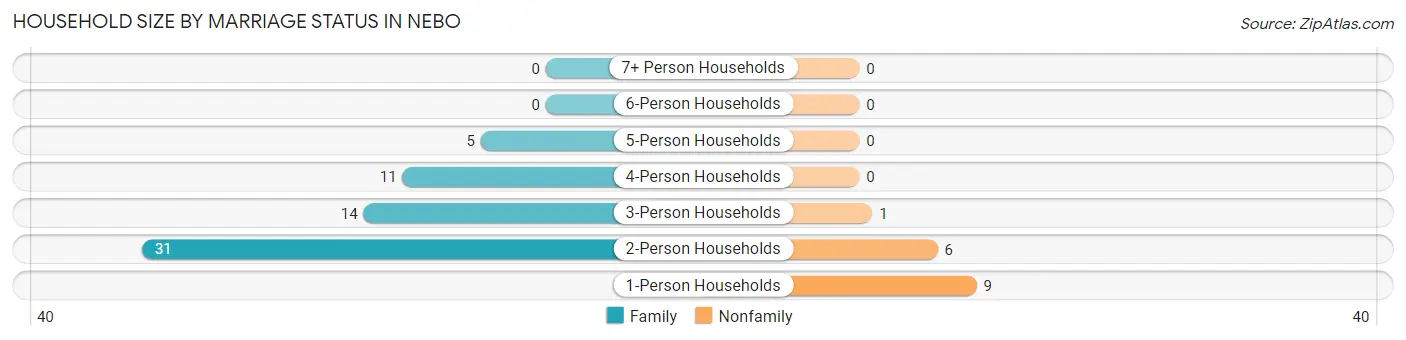
| Household Size | Family Households | Nonfamily Households |
| 1-Person Households | - | 9 (11.7%) |
| 2-Person Households | 31 (40.3%) | 6 (7.8%) |
| 3-Person Households | 14 (18.2%) | 1 (1.3%) |
| 4-Person Households | 11 (14.3%) | 0 (0.0%) |
| 5-Person Households | 5 (6.5%) | 0 (0.0%) |
| 6-Person Households | 0 (0.0%) | 0 (0.0%) |
| 7+ Person Households | 0 (0.0%) | 0 (0.0%) |
| Total | 61 (79.2%) | 16 (20.8%) |
Female Fertility in Nebo
Fertility by Age in Nebo
Average fertility rate in Nebo is 171.0 births per 1,000 women. Women in the age bracket of 20 to 34 years have the highest fertility rate with 350.0 births per 1,000 women. Women in the age bracket of 20 to 34 years acount for 100.0% of all women with births.
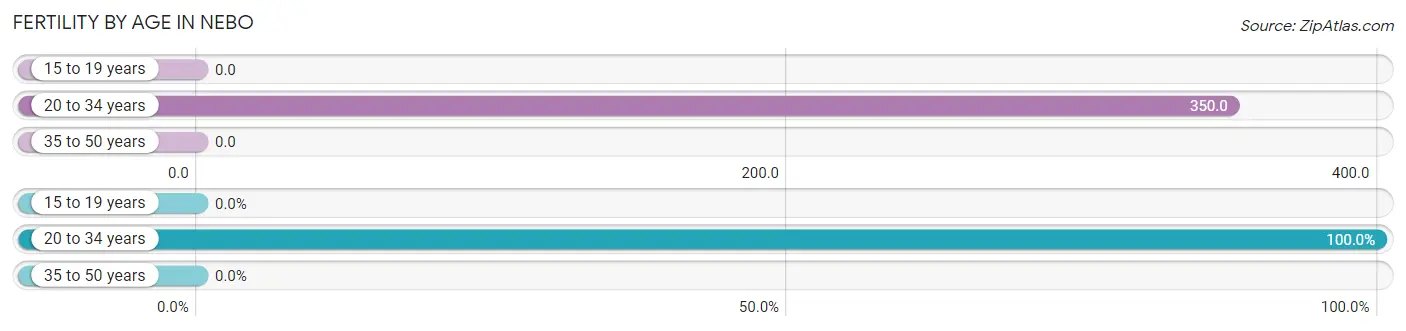
| Age Bracket | Women with Births | Births / 1,000 Women |
| 15 to 19 years | 0 (0.0%) | 0.0 |
| 20 to 34 years | 7 (100.0%) | 350.0 |
| 35 to 50 years | 0 (0.0%) | 0.0 |
| Total | 7 (100.0%) | 171.0 |
Fertility by Age by Marriage Status in Nebo
71.4% of women with births (7) in Nebo are married. The highest percentage of unmarried women with births falls into 20 to 34 years age bracket with 28.6% of them unmarried at the time of birth, while the lowest percentage of unmarried women with births belong to 20 to 34 years age bracket with 28.6% of them unmarried.
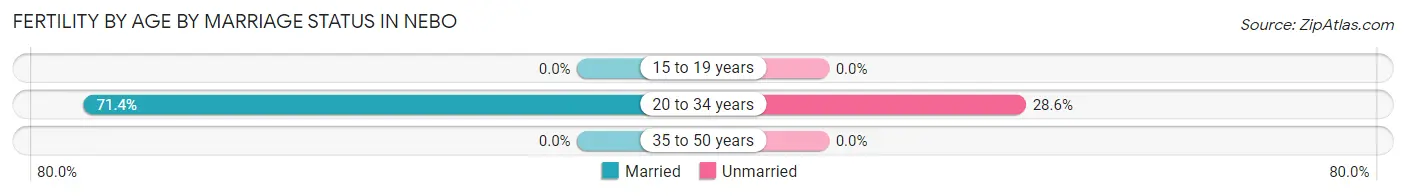
| Age Bracket | Married | Unmarried |
| 15 to 19 years | 0 (0.0%) | 0 (0.0%) |
| 20 to 34 years | 5 (71.4%) | 2 (28.6%) |
| 35 to 50 years | 0 (0.0%) | 0 (0.0%) |
| Total | 5 (71.4%) | 2 (28.6%) |
Fertility by Education in Nebo
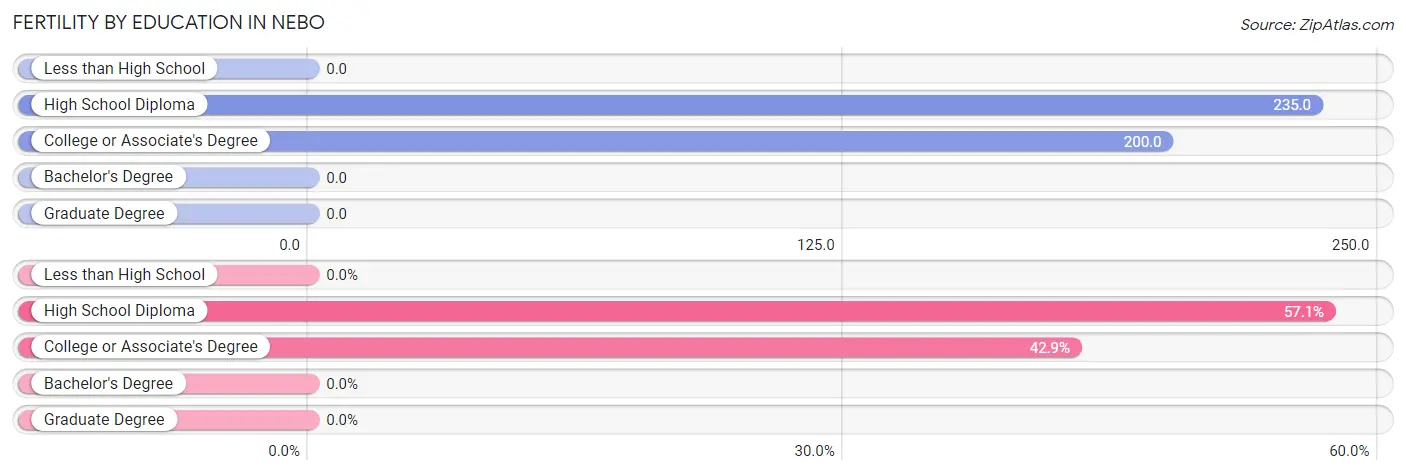
| Educational Attainment | Women with Births | Births / 1,000 Women |
| Less than High School | 0 (0.0%) | 0.0 |
| High School Diploma | 4 (57.1%) | 235.0 |
| College or Associate's Degree | 3 (42.9%) | 200.0 |
| Bachelor's Degree | 0 (0.0%) | 0.0 |
| Graduate Degree | 0 (0.0%) | 0.0 |
| Total | 7 (100.0%) | 171.0 |
Fertility by Education by Marriage Status in Nebo
28.6% of women with births in Nebo are unmarried. Women with the educational attainment of college or associate's degree are most likely to be married with 100.0% of them married at childbirth, while women with the educational attainment of high school diploma are least likely to be married with 50.0% of them unmarried at childbirth.
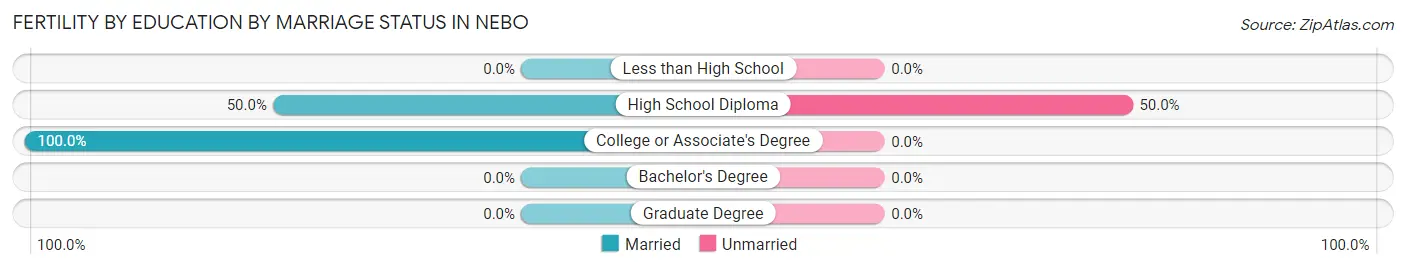
| Educational Attainment | Married | Unmarried |
| Less than High School | 0 (0.0%) | 0 (0.0%) |
| High School Diploma | 2 (50.0%) | 2 (50.0%) |
| College or Associate's Degree | 3 (100.0%) | 0 (0.0%) |
| Bachelor's Degree | 0 (0.0%) | 0 (0.0%) |
| Graduate Degree | 0 (0.0%) | 0 (0.0%) |
| Total | 5 (71.4%) | 2 (28.6%) |
Employment Characteristics in Nebo
Employment by Class of Employer in Nebo
Among the 104 employed individuals in Nebo, private company employees (73 | 70.2%), state government employees (10 | 9.6%), and not-for-profit organizations (8 | 7.7%) make up the most common classes of employment.
| Employer Class | # Employees | % Employees |
| Private Company Employees | 73 | 70.2% |
| Self-Employed (Incorporated) | 2 | 1.9% |
| Self-Employed (Not Incorporated) | 5 | 4.8% |
| Not-for-profit Organizations | 8 | 7.7% |
| Local Government Employees | 2 | 1.9% |
| State Government Employees | 10 | 9.6% |
| Federal Government Employees | 4 | 3.8% |
| Unpaid Family Workers | 0 | 0.0% |
| Total | 104 | 100.0% |
Employment Status by Age in Nebo
According to the labor force statistics for Nebo, out of the total population over 16 years of age (169), 63.9% or 108 individuals are in the labor force, with 2.8% or 3 of them unemployed. The age group with the highest labor force participation rate is 16 to 19 years, with 100.0% or 4 individuals in the labor force. Within the labor force, the 35 to 44 years age range has the highest percentage of unemployed individuals, with 9.5% or 2 of them being unemployed.
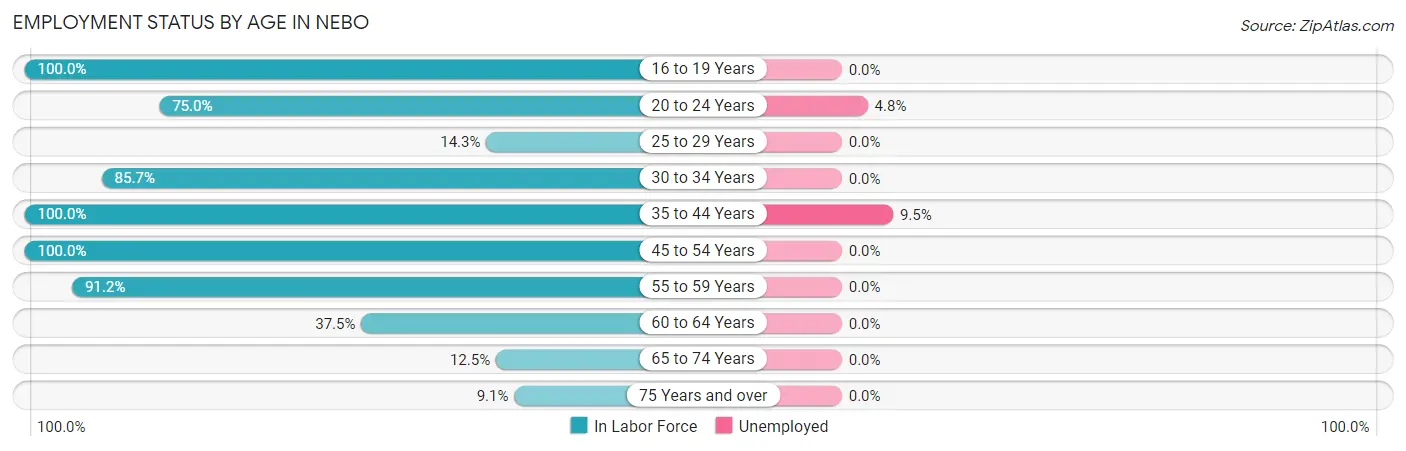
| Age Bracket | In Labor Force | Unemployed |
| 16 to 19 Years | 4 (100.0%) | 0 (0.0%) |
| 20 to 24 Years | 21 (75.0%) | 1 (4.8%) |
| 25 to 29 Years | 1 (14.3%) | 0 (0.0%) |
| 30 to 34 Years | 6 (85.7%) | 0 (0.0%) |
| 35 to 44 Years | 21 (100.0%) | 2 (9.5%) |
| 45 to 54 Years | 14 (100.0%) | 0 (0.0%) |
| 55 to 59 Years | 31 (91.2%) | 0 (0.0%) |
| 60 to 64 Years | 6 (37.5%) | 0 (0.0%) |
| 65 to 74 Years | 2 (12.5%) | 0 (0.0%) |
| 75 Years and over | 2 (9.1%) | 0 (0.0%) |
| Total | 108 (63.9%) | 3 (2.8%) |
Employment Status by Educational Attainment in Nebo
According to labor force statistics for Nebo, 79.8% of individuals (79) out of the total population between 25 and 64 years of age (99) are in the labor force, with 2.5% or 2 of them being unemployed. The group with the highest labor force participation rate are those with the educational attainment of college / associate degree, with 90.3% or 28 individuals in the labor force. Within the labor force, individuals with high school diploma education have the highest percentage of unemployment, with 4.7% or 2 of them being unemployed.
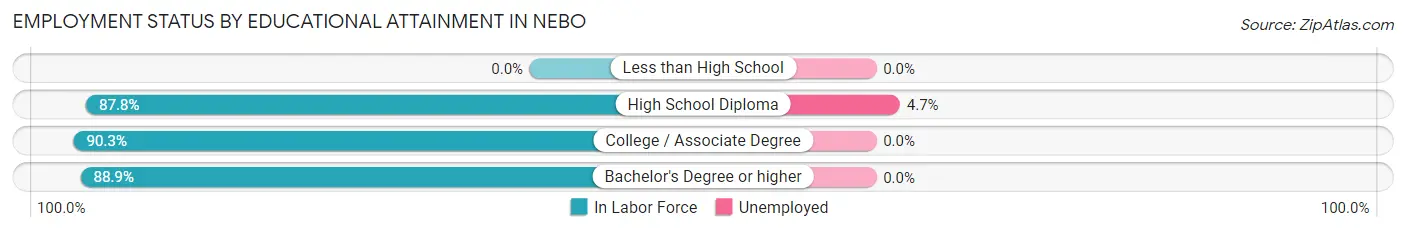
| Educational Attainment | In Labor Force | Unemployed |
| Less than High School | 0 (0.0%) | 0 (0.0%) |
| High School Diploma | 43 (87.8%) | 2 (4.7%) |
| College / Associate Degree | 28 (90.3%) | 0 (0.0%) |
| Bachelor's Degree or higher | 8 (88.9%) | 0 (0.0%) |
| Total | 79 (79.8%) | 2 (2.5%) |
Employment Occupations by Sex in Nebo
Management, Business, Science and Arts Occupations
The most common Management, Business, Science and Arts occupations in Nebo are Management (21 | 20.0%), Community & Social Service (6 | 5.7%), Education Instruction & Library (4 | 3.8%), Health Diagnosing & Treating (4 | 3.8%), and Health Technologists (3 | 2.9%).
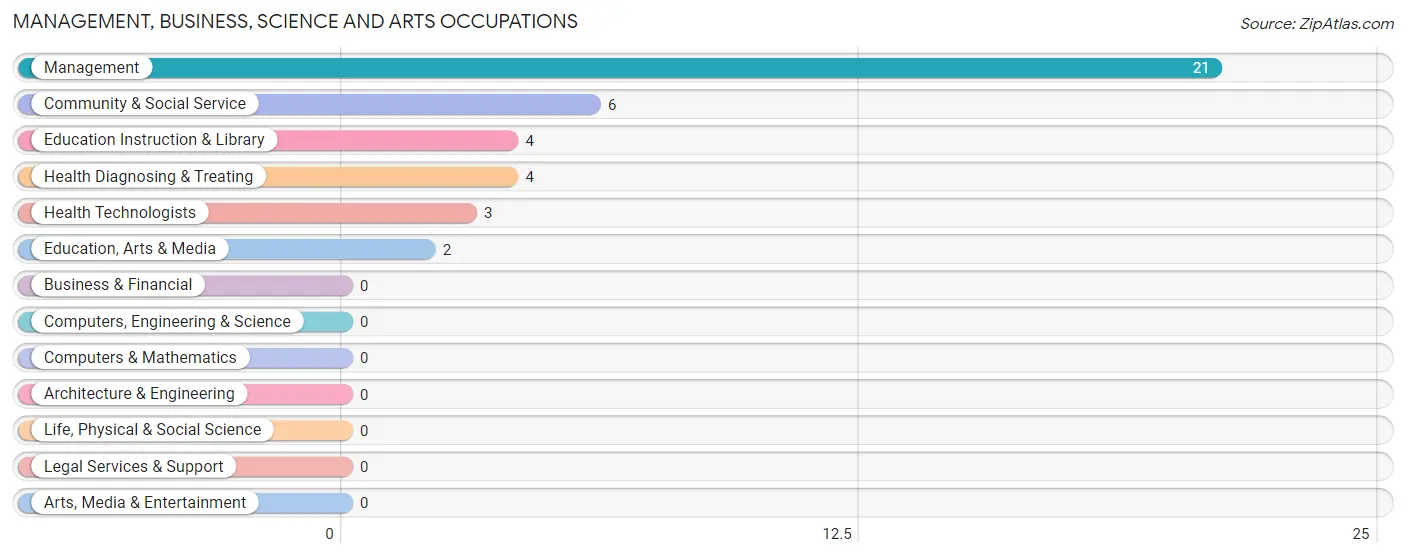
Management, Business, Science and Arts Occupations by Sex
Within the Management, Business, Science and Arts occupations in Nebo, the most male-oriented occupations are Education, Arts & Media (100.0%), Management (80.9%), and Community & Social Service (33.3%), while the most female-oriented occupations are Education Instruction & Library (100.0%), Health Diagnosing & Treating (100.0%), and Health Technologists (100.0%).
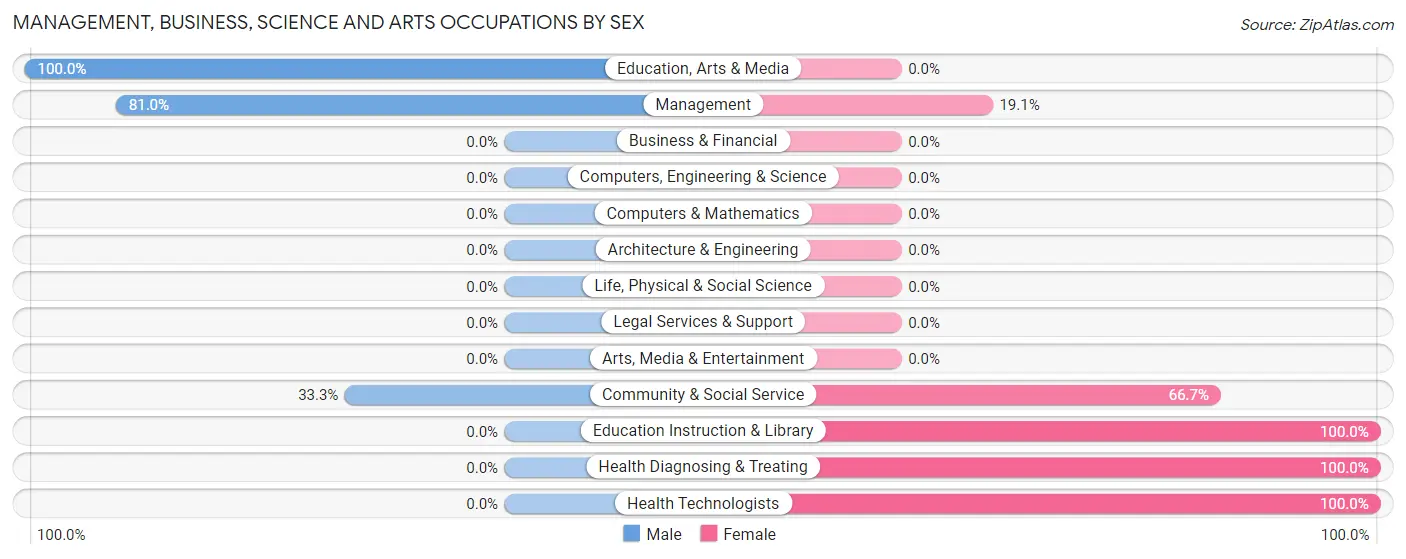
| Occupation | Male | Female |
| Management | 17 (80.9%) | 4 (19.1%) |
| Business & Financial | 0 (0.0%) | 0 (0.0%) |
| Computers, Engineering & Science | 0 (0.0%) | 0 (0.0%) |
| Computers & Mathematics | 0 (0.0%) | 0 (0.0%) |
| Architecture & Engineering | 0 (0.0%) | 0 (0.0%) |
| Life, Physical & Social Science | 0 (0.0%) | 0 (0.0%) |
| Community & Social Service | 2 (33.3%) | 4 (66.7%) |
| Education, Arts & Media | 2 (100.0%) | 0 (0.0%) |
| Legal Services & Support | 0 (0.0%) | 0 (0.0%) |
| Education Instruction & Library | 0 (0.0%) | 4 (100.0%) |
| Arts, Media & Entertainment | 0 (0.0%) | 0 (0.0%) |
| Health Diagnosing & Treating | 0 (0.0%) | 4 (100.0%) |
| Health Technologists | 0 (0.0%) | 3 (100.0%) |
| Total (Category) | 19 (61.3%) | 12 (38.7%) |
| Total (Overall) | 64 (61.0%) | 41 (39.1%) |
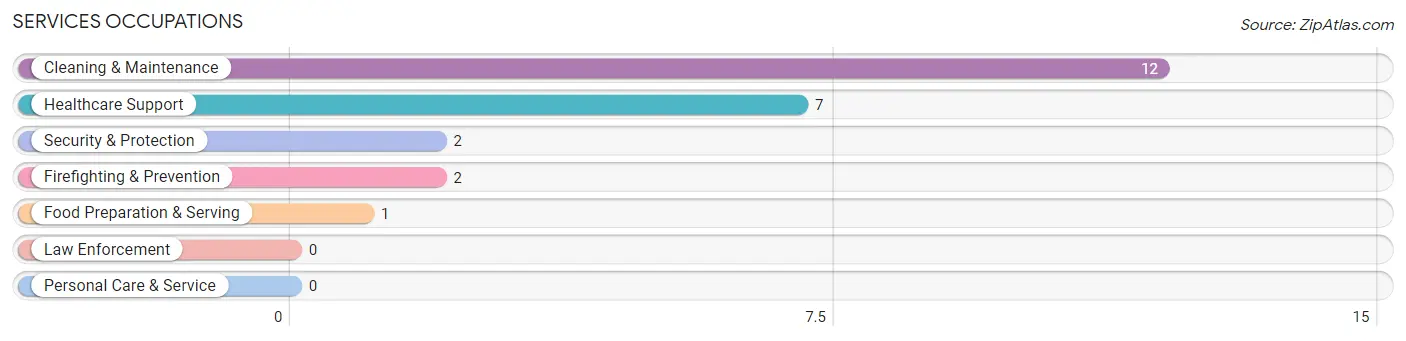
Services Occupations
The most common Services occupations in Nebo are Cleaning & Maintenance (12 | 11.4%), Healthcare Support (7 | 6.7%), Security & Protection (2 | 1.9%), Firefighting & Prevention (2 | 1.9%), and Food Preparation & Serving (1 | 0.9%).
Services Occupations by Sex
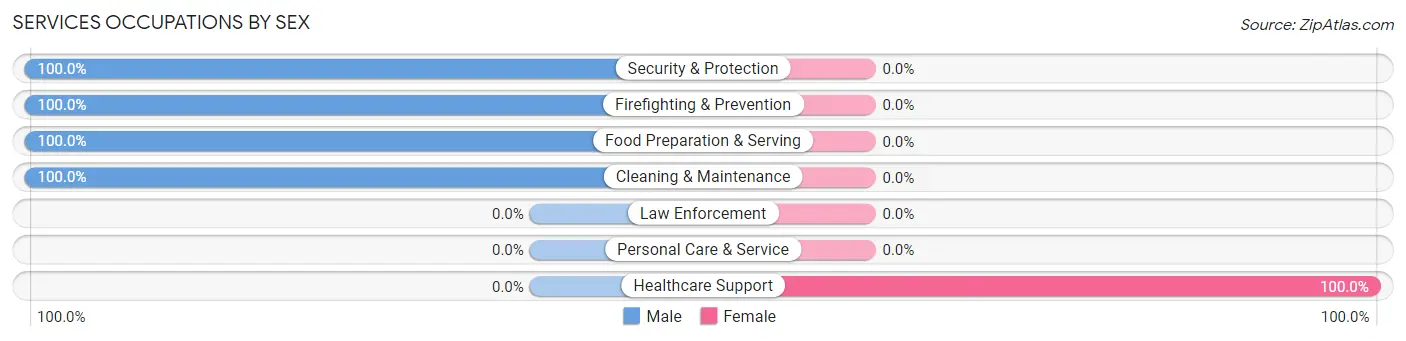
| Occupation | Male | Female |
| Healthcare Support | 0 (0.0%) | 7 (100.0%) |
| Security & Protection | 2 (100.0%) | 0 (0.0%) |
| Firefighting & Prevention | 2 (100.0%) | 0 (0.0%) |
| Law Enforcement | 0 (0.0%) | 0 (0.0%) |
| Food Preparation & Serving | 1 (100.0%) | 0 (0.0%) |
| Cleaning & Maintenance | 12 (100.0%) | 0 (0.0%) |
| Personal Care & Service | 0 (0.0%) | 0 (0.0%) |
| Total (Category) | 15 (68.2%) | 7 (31.8%) |
| Total (Overall) | 64 (61.0%) | 41 (39.1%) |
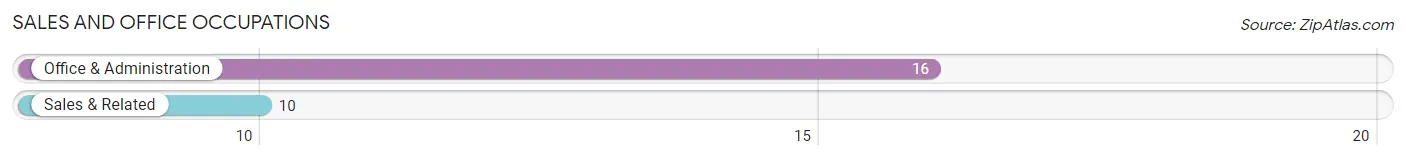
Sales and Office Occupations
The most common Sales and Office occupations in Nebo are Office & Administration (16 | 15.2%), and Sales & Related (10 | 9.5%).
Sales and Office Occupations by Sex
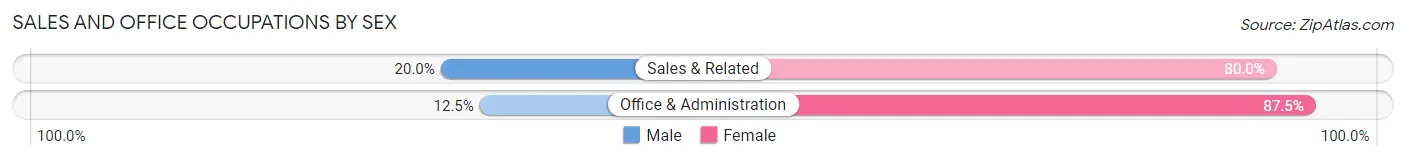
| Occupation | Male | Female |
| Sales & Related | 2 (20.0%) | 8 (80.0%) |
| Office & Administration | 2 (12.5%) | 14 (87.5%) |
| Total (Category) | 4 (15.4%) | 22 (84.6%) |
| Total (Overall) | 64 (61.0%) | 41 (39.1%) |
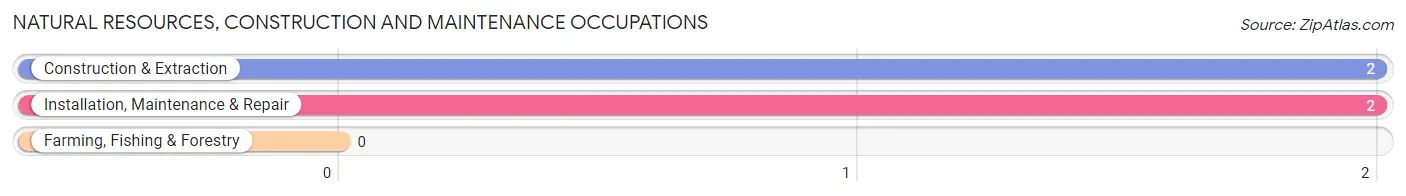
Natural Resources, Construction and Maintenance Occupations
The most common Natural Resources, Construction and Maintenance occupations in Nebo are Construction & Extraction (2 | 1.9%), and Installation, Maintenance & Repair (2 | 1.9%).
Natural Resources, Construction and Maintenance Occupations by Sex
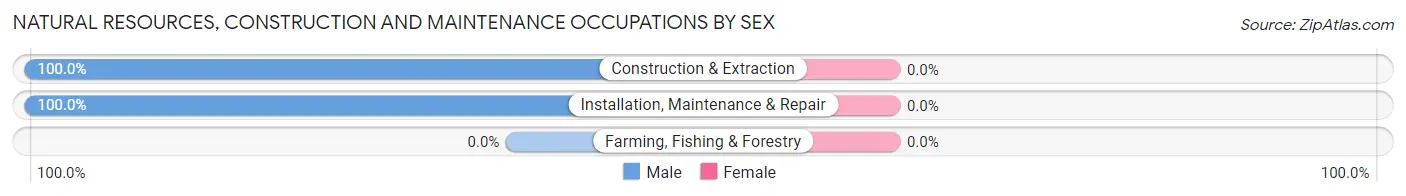
| Occupation | Male | Female |
| Farming, Fishing & Forestry | 0 (0.0%) | 0 (0.0%) |
| Construction & Extraction | 2 (100.0%) | 0 (0.0%) |
| Installation, Maintenance & Repair | 2 (100.0%) | 0 (0.0%) |
| Total (Category) | 4 (100.0%) | 0 (0.0%) |
| Total (Overall) | 64 (61.0%) | 41 (39.1%) |
Production, Transportation and Moving Occupations
The most common Production, Transportation and Moving occupations in Nebo are Production (15 | 14.3%), Material Moving (6 | 5.7%), and Transportation (1 | 0.9%).
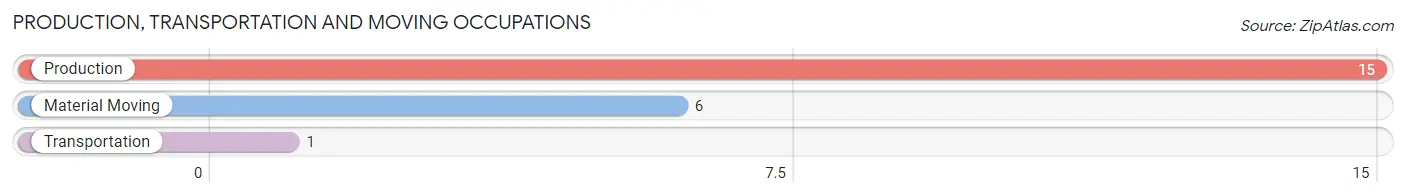
Production, Transportation and Moving Occupations by Sex
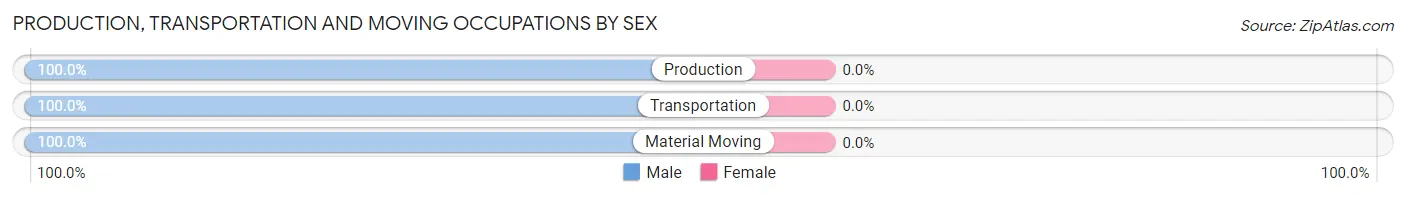
| Occupation | Male | Female |
| Production | 15 (100.0%) | 0 (0.0%) |
| Transportation | 1 (100.0%) | 0 (0.0%) |
| Material Moving | 6 (100.0%) | 0 (0.0%) |
| Total (Category) | 22 (100.0%) | 0 (0.0%) |
| Total (Overall) | 64 (61.0%) | 41 (39.1%) |
Employment Industries by Sex in Nebo
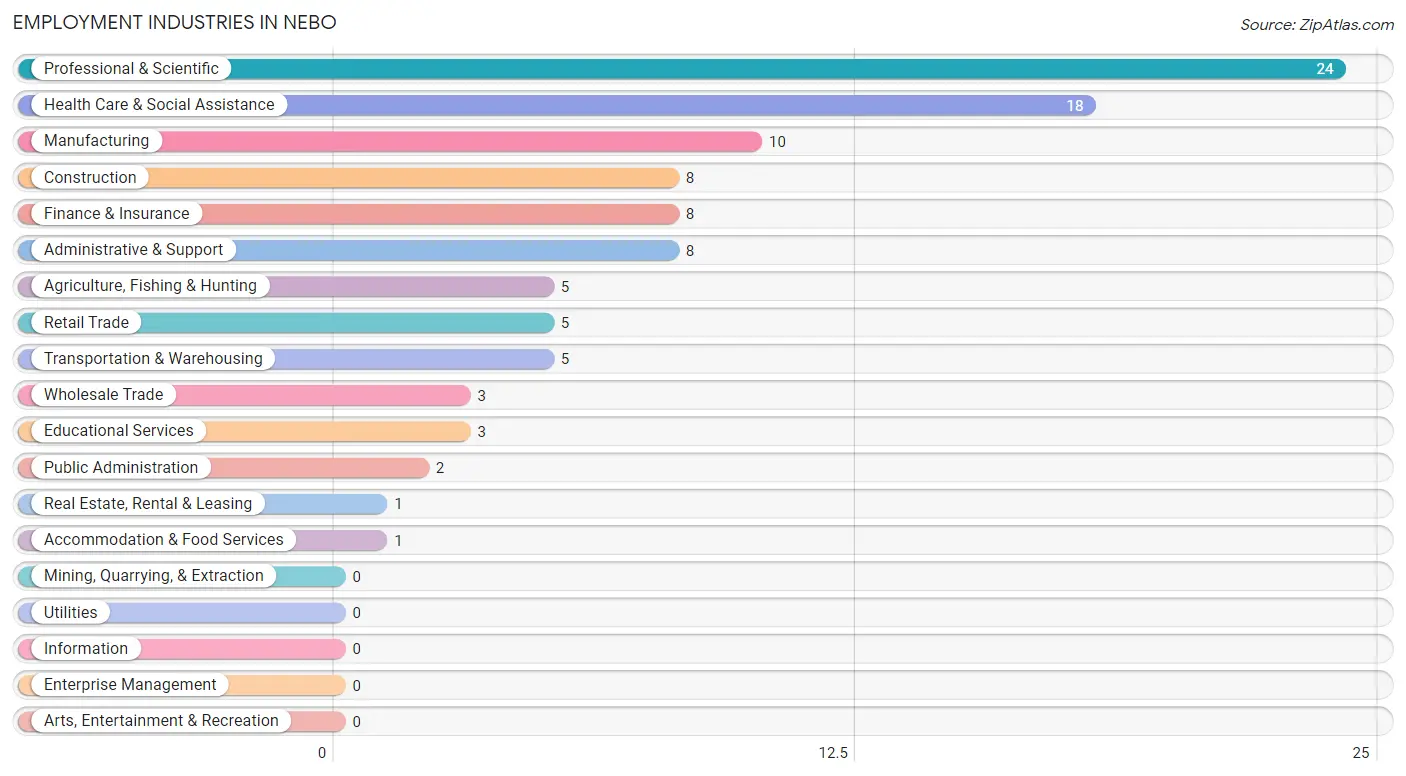
Employment Industries in Nebo
The major employment industries in Nebo include Professional & Scientific (24 | 22.9%), Health Care & Social Assistance (18 | 17.1%), Manufacturing (10 | 9.5%), Construction (8 | 7.6%), and Finance & Insurance (8 | 7.6%).
Employment Industries by Sex in Nebo
The Nebo industries that see more men than women are Agriculture, Fishing & Hunting (100.0%), Construction (100.0%), and Manufacturing (100.0%), whereas the industries that tend to have a higher number of women are Finance & Insurance (100.0%), Real Estate, Rental & Leasing (100.0%), and Administrative & Support (100.0%).
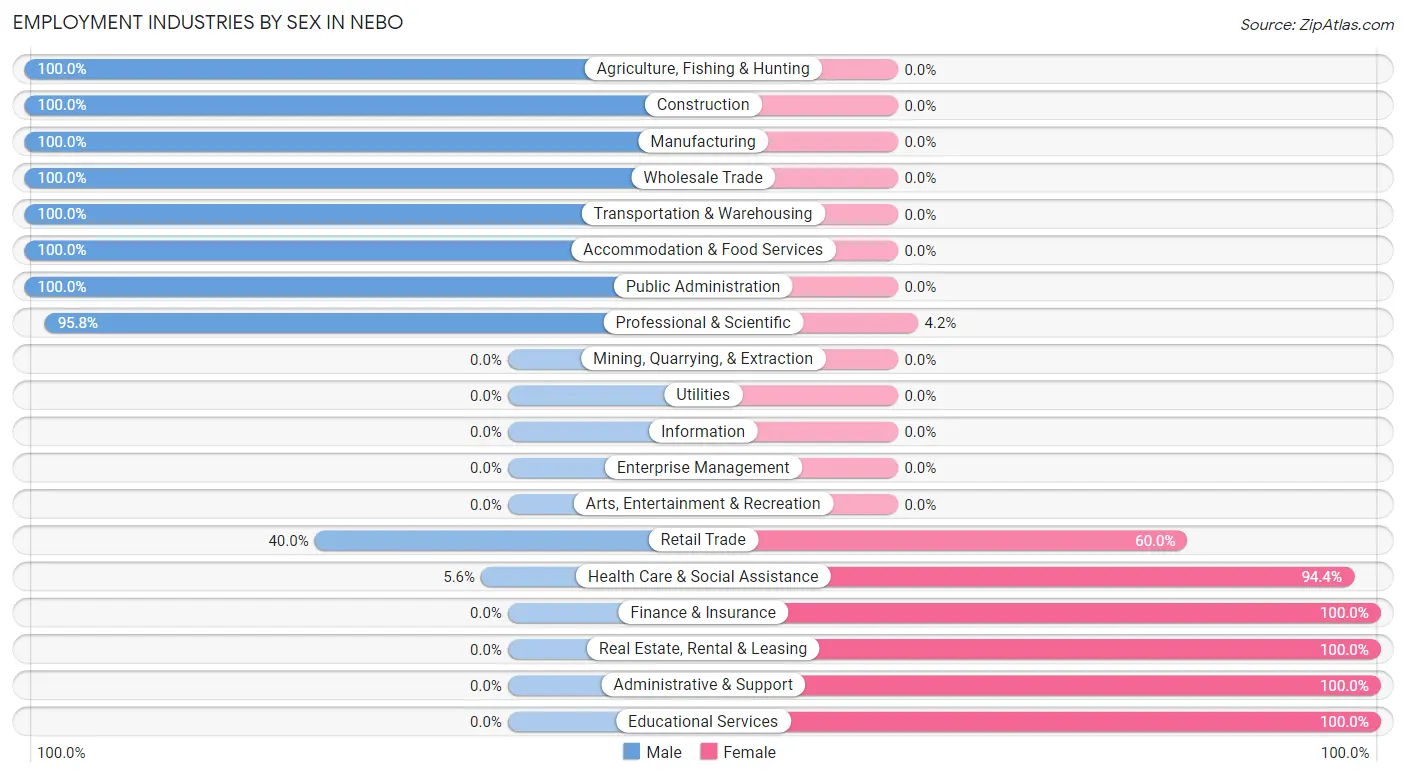
| Industry | Male | Female |
| Agriculture, Fishing & Hunting | 5 (100.0%) | 0 (0.0%) |
| Mining, Quarrying, & Extraction | 0 (0.0%) | 0 (0.0%) |
| Construction | 8 (100.0%) | 0 (0.0%) |
| Manufacturing | 10 (100.0%) | 0 (0.0%) |
| Wholesale Trade | 3 (100.0%) | 0 (0.0%) |
| Retail Trade | 2 (40.0%) | 3 (60.0%) |
| Transportation & Warehousing | 5 (100.0%) | 0 (0.0%) |
| Utilities | 0 (0.0%) | 0 (0.0%) |
| Information | 0 (0.0%) | 0 (0.0%) |
| Finance & Insurance | 0 (0.0%) | 8 (100.0%) |
| Real Estate, Rental & Leasing | 0 (0.0%) | 1 (100.0%) |
| Professional & Scientific | 23 (95.8%) | 1 (4.2%) |
| Enterprise Management | 0 (0.0%) | 0 (0.0%) |
| Administrative & Support | 0 (0.0%) | 8 (100.0%) |
| Educational Services | 0 (0.0%) | 3 (100.0%) |
| Health Care & Social Assistance | 1 (5.6%) | 17 (94.4%) |
| Arts, Entertainment & Recreation | 0 (0.0%) | 0 (0.0%) |
| Accommodation & Food Services | 1 (100.0%) | 0 (0.0%) |
| Public Administration | 2 (100.0%) | 0 (0.0%) |
| Total | 64 (61.0%) | 41 (39.1%) |
Education in Nebo
School Enrollment in Nebo
The most common levels of schooling among the 24 students in Nebo are middle school (9 | 37.5%), nursery / preschool (6 | 25.0%), and elementary school (4 | 16.7%).
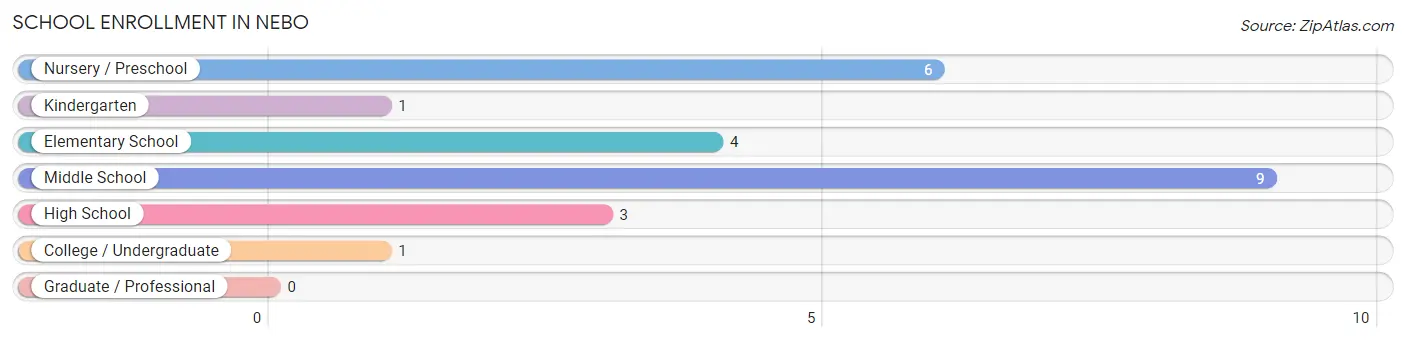
| School Level | # Students | % Students |
| Nursery / Preschool | 6 | 25.0% |
| Kindergarten | 1 | 4.2% |
| Elementary School | 4 | 16.7% |
| Middle School | 9 | 37.5% |
| High School | 3 | 12.5% |
| College / Undergraduate | 1 | 4.2% |
| Graduate / Professional | 0 | 0.0% |
| Total | 24 | 100.0% |
School Enrollment by Age by Funding Source in Nebo
Out of a total of 24 students who are enrolled in schools in Nebo, 9 (37.5%) attend a private institution, while the remaining 15 (62.5%) are enrolled in public schools. The age group of 3 to 4 year olds has the highest likelihood of being enrolled in private schools, with 4 (66.7% in the age bracket) enrolled. Conversely, the age group of 15 to 17 year olds has the lowest likelihood of being enrolled in a private school, with 1 (100.0% in the age bracket) attending a public institution.
| Age Bracket | Public School | Private School |
| 3 to 4 Year Olds | 2 (33.3%) | 4 (66.7%) |
| 5 to 9 Year Old | 3 (60.0%) | 2 (40.0%) |
| 10 to 14 Year Olds | 8 (80.0%) | 2 (20.0%) |
| 15 to 17 Year Olds | 1 (100.0%) | 0 (0.0%) |
| 18 to 19 Year Olds | 0 (0.0%) | 0 (0.0%) |
| 20 to 24 Year Olds | 1 (50.0%) | 1 (50.0%) |
| 25 to 34 Year Olds | 0 (0.0%) | 0 (0.0%) |
| 35 Years and over | 0 (0.0%) | 0 (0.0%) |
| Total | 15 (62.5%) | 9 (37.5%) |
Educational Attainment by Field of Study in Nebo
Business (5 | 55.6%), education (3 | 33.3%), and science & technology (1 | 11.1%) are the most common fields of study among 9 individuals in Nebo who have obtained a bachelor's degree or higher.
| Field of Study | # Graduates | % Graduates |
| Computers & Mathematics | 0 | 0.0% |
| Bio, Nature & Agricultural | 0 | 0.0% |
| Physical & Health Sciences | 0 | 0.0% |
| Psychology | 0 | 0.0% |
| Social Sciences | 0 | 0.0% |
| Engineering | 0 | 0.0% |
| Multidisciplinary Studies | 0 | 0.0% |
| Science & Technology | 1 | 11.1% |
| Business | 5 | 55.6% |
| Education | 3 | 33.3% |
| Literature & Languages | 0 | 0.0% |
| Liberal Arts & History | 0 | 0.0% |
| Visual & Performing Arts | 0 | 0.0% |
| Communications | 0 | 0.0% |
| Arts & Humanities | 0 | 0.0% |
| Total | 9 | 100.0% |
Transportation & Commute in Nebo
Vehicle Availability by Sex in Nebo
The most prevalent vehicle ownership categories in Nebo are males with 2 vehicles (35, accounting for 54.7%) and females with 2 vehicles (21, making up 87.5%).
| Vehicles Available | Male | Female |
| No Vehicle | 2 (3.1%) | 0 (0.0%) |
| 1 Vehicle | 3 (4.7%) | 3 (7.5%) |
| 2 Vehicles | 35 (54.7%) | 21 (52.5%) |
| 3 Vehicles | 19 (29.7%) | 14 (35.0%) |
| 4 Vehicles | 0 (0.0%) | 0 (0.0%) |
| 5 or more Vehicles | 5 (7.8%) | 2 (5.0%) |
| Total | 64 (100.0%) | 40 (100.0%) |
Commute Time in Nebo
The most frequently occuring commute durations in Nebo are 20 to 24 minutes (33 commuters, 31.7%), 15 to 19 minutes (16 commuters, 15.4%), and 60 to 89 minutes (10 commuters, 9.6%).
| Commute Time | # Commuters | % Commuters |
| Less than 5 Minutes | 8 | 7.7% |
| 5 to 9 Minutes | 2 | 1.9% |
| 10 to 14 Minutes | 7 | 6.7% |
| 15 to 19 Minutes | 16 | 15.4% |
| 20 to 24 Minutes | 33 | 31.7% |
| 25 to 29 Minutes | 8 | 7.7% |
| 30 to 34 Minutes | 9 | 8.6% |
| 35 to 39 Minutes | 3 | 2.9% |
| 40 to 44 Minutes | 2 | 1.9% |
| 45 to 59 Minutes | 6 | 5.8% |
| 60 to 89 Minutes | 10 | 9.6% |
| 90 or more Minutes | 0 | 0.0% |
Commute Time by Sex in Nebo
The most common commute times in Nebo are 20 to 24 minutes (32 commuters, 50.0%) for males and 15 to 19 minutes (13 commuters, 32.5%) for females.
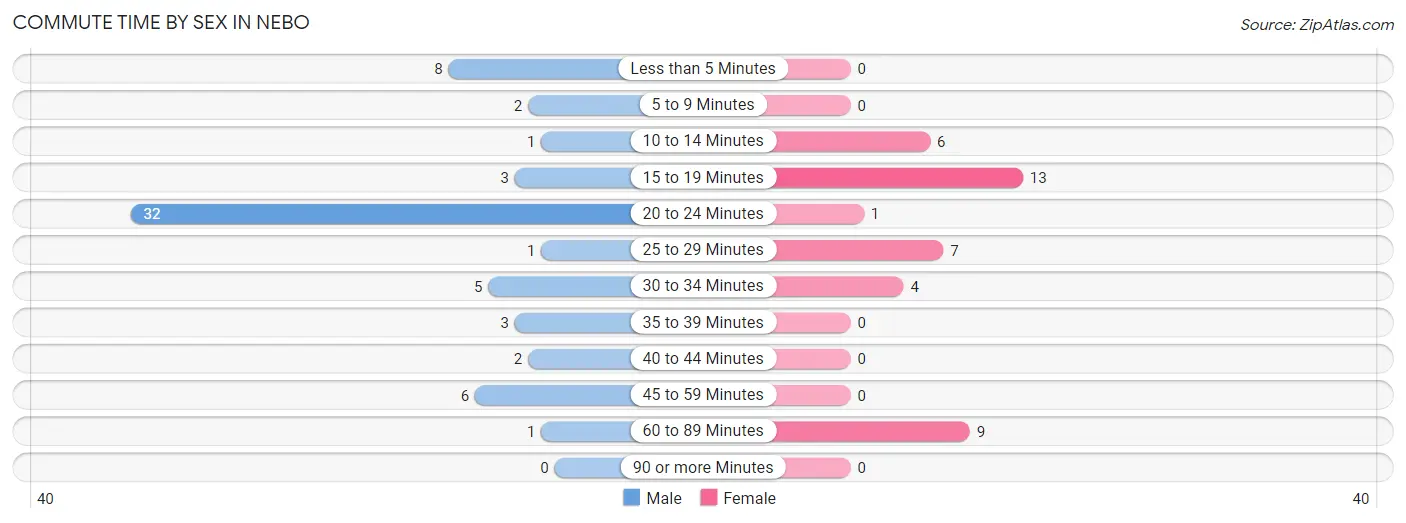
| Commute Time | Male | Female |
| Less than 5 Minutes | 8 (12.5%) | 0 (0.0%) |
| 5 to 9 Minutes | 2 (3.1%) | 0 (0.0%) |
| 10 to 14 Minutes | 1 (1.6%) | 6 (15.0%) |
| 15 to 19 Minutes | 3 (4.7%) | 13 (32.5%) |
| 20 to 24 Minutes | 32 (50.0%) | 1 (2.5%) |
| 25 to 29 Minutes | 1 (1.6%) | 7 (17.5%) |
| 30 to 34 Minutes | 5 (7.8%) | 4 (10.0%) |
| 35 to 39 Minutes | 3 (4.7%) | 0 (0.0%) |
| 40 to 44 Minutes | 2 (3.1%) | 0 (0.0%) |
| 45 to 59 Minutes | 6 (9.4%) | 0 (0.0%) |
| 60 to 89 Minutes | 1 (1.6%) | 9 (22.5%) |
| 90 or more Minutes | 0 (0.0%) | 0 (0.0%) |
Time of Departure to Work by Sex in Nebo
The most frequent times of departure to work in Nebo are 4:00 PM to 11:59 PM (24, 37.5%) for males and 5:00 AM to 5:29 AM (8, 20.0%) for females.
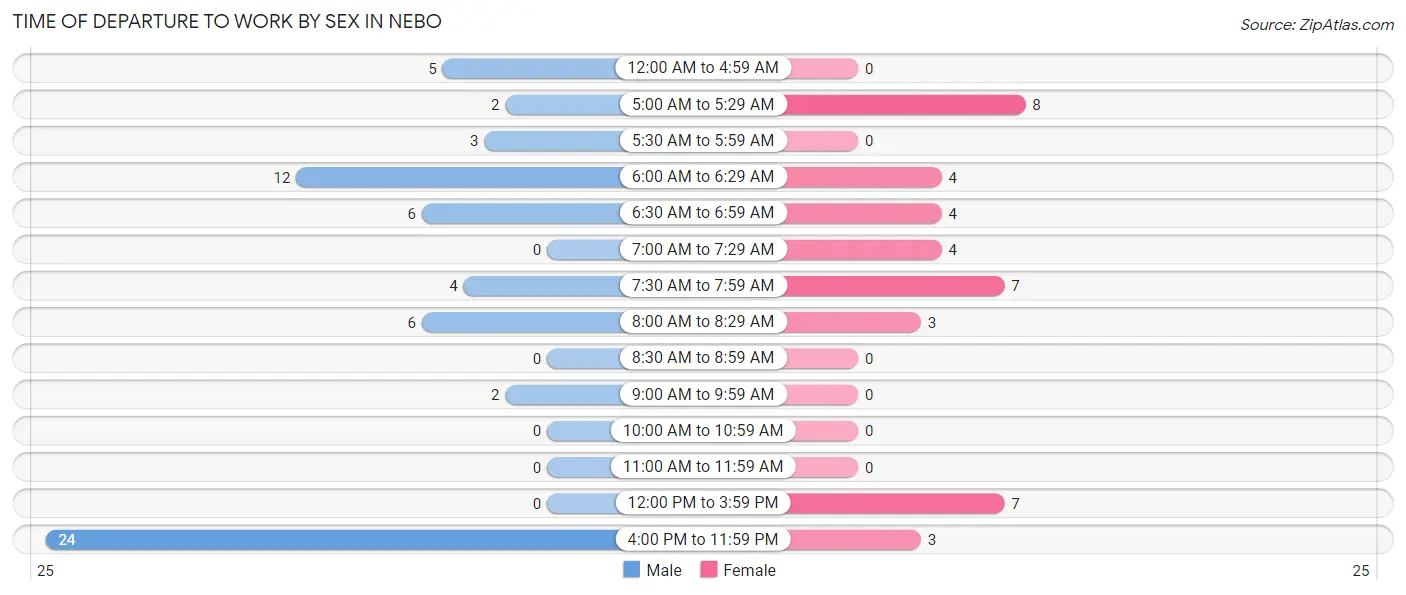
| Time of Departure | Male | Female |
| 12:00 AM to 4:59 AM | 5 (7.8%) | 0 (0.0%) |
| 5:00 AM to 5:29 AM | 2 (3.1%) | 8 (20.0%) |
| 5:30 AM to 5:59 AM | 3 (4.7%) | 0 (0.0%) |
| 6:00 AM to 6:29 AM | 12 (18.8%) | 4 (10.0%) |
| 6:30 AM to 6:59 AM | 6 (9.4%) | 4 (10.0%) |
| 7:00 AM to 7:29 AM | 0 (0.0%) | 4 (10.0%) |
| 7:30 AM to 7:59 AM | 4 (6.2%) | 7 (17.5%) |
| 8:00 AM to 8:29 AM | 6 (9.4%) | 3 (7.5%) |
| 8:30 AM to 8:59 AM | 0 (0.0%) | 0 (0.0%) |
| 9:00 AM to 9:59 AM | 2 (3.1%) | 0 (0.0%) |
| 10:00 AM to 10:59 AM | 0 (0.0%) | 0 (0.0%) |
| 11:00 AM to 11:59 AM | 0 (0.0%) | 0 (0.0%) |
| 12:00 PM to 3:59 PM | 0 (0.0%) | 7 (17.5%) |
| 4:00 PM to 11:59 PM | 24 (37.5%) | 3 (7.5%) |
| Total | 64 (100.0%) | 40 (100.0%) |
Housing Occupancy in Nebo
Occupancy by Ownership in Nebo
Of the total 77 dwellings in Nebo, owner-occupied units account for 59 (76.6%), while renter-occupied units make up 18 (23.4%).
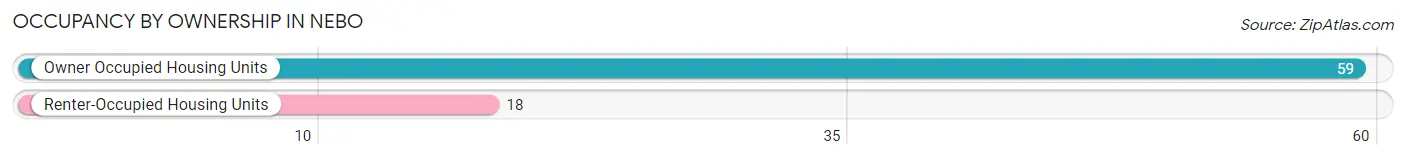
| Occupancy | # Housing Units | % Housing Units |
| Owner Occupied Housing Units | 59 | 76.6% |
| Renter-Occupied Housing Units | 18 | 23.4% |
| Total Occupied Housing Units | 77 | 100.0% |
Occupancy by Household Size in Nebo
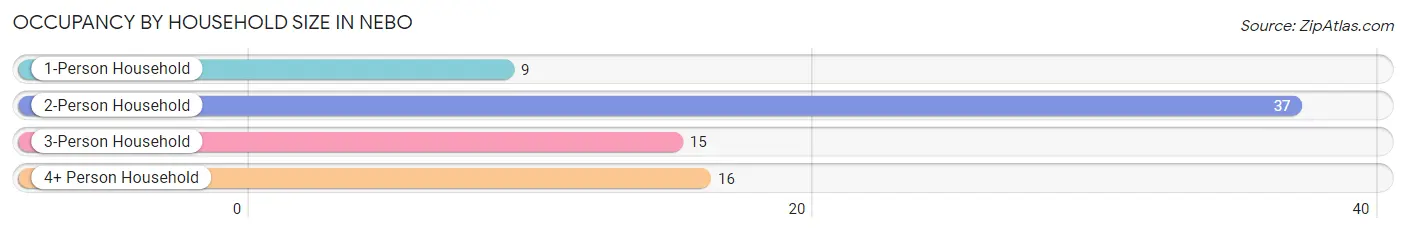
| Household Size | # Housing Units | % Housing Units |
| 1-Person Household | 9 | 11.7% |
| 2-Person Household | 37 | 48.0% |
| 3-Person Household | 15 | 19.5% |
| 4+ Person Household | 16 | 20.8% |
| Total Housing Units | 77 | 100.0% |
Occupancy by Ownership by Household Size in Nebo
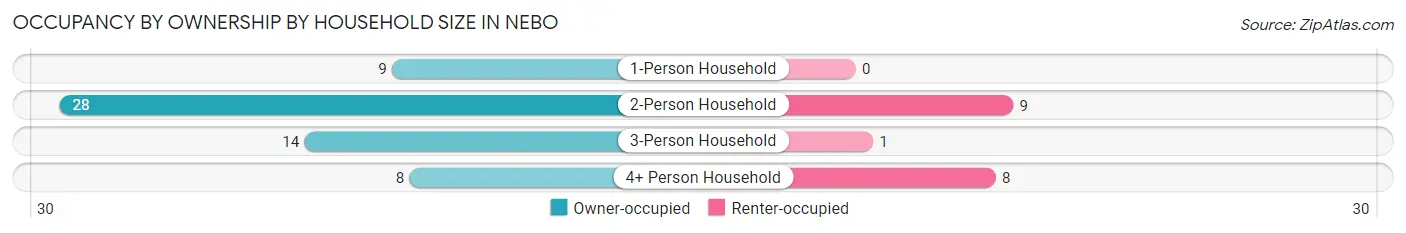
| Household Size | Owner-occupied | Renter-occupied |
| 1-Person Household | 9 (100.0%) | 0 (0.0%) |
| 2-Person Household | 28 (75.7%) | 9 (24.3%) |
| 3-Person Household | 14 (93.3%) | 1 (6.7%) |
| 4+ Person Household | 8 (50.0%) | 8 (50.0%) |
| Total Housing Units | 59 (76.6%) | 18 (23.4%) |
Occupancy by Educational Attainment in Nebo
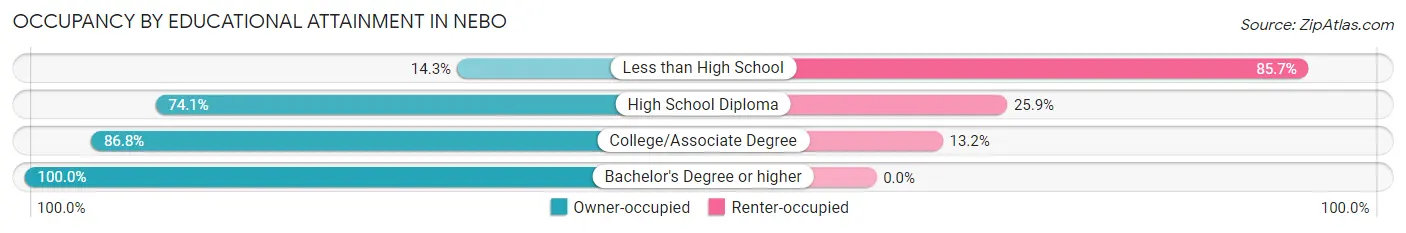
| Household Size | Owner-occupied | Renter-occupied |
| Less than High School | 1 (14.3%) | 6 (85.7%) |
| High School Diploma | 20 (74.1%) | 7 (25.9%) |
| College/Associate Degree | 33 (86.8%) | 5 (13.2%) |
| Bachelor's Degree or higher | 5 (100.0%) | 0 (0.0%) |
Occupancy by Age of Householder in Nebo
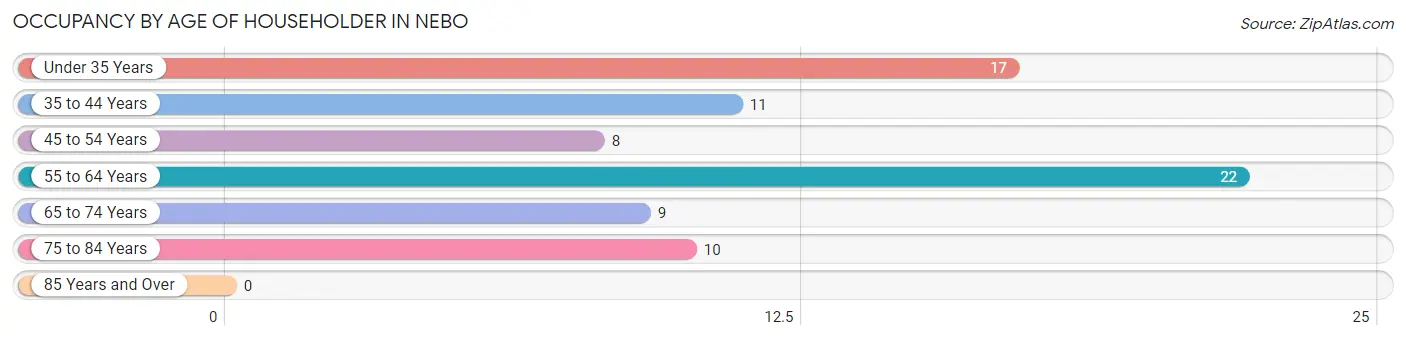
| Age Bracket | # Households | % Households |
| Under 35 Years | 17 | 22.1% |
| 35 to 44 Years | 11 | 14.3% |
| 45 to 54 Years | 8 | 10.4% |
| 55 to 64 Years | 22 | 28.6% |
| 65 to 74 Years | 9 | 11.7% |
| 75 to 84 Years | 10 | 13.0% |
| 85 Years and Over | 0 | 0.0% |
| Total | 77 | 100.0% |
Housing Finances in Nebo
Median Income by Occupancy in Nebo
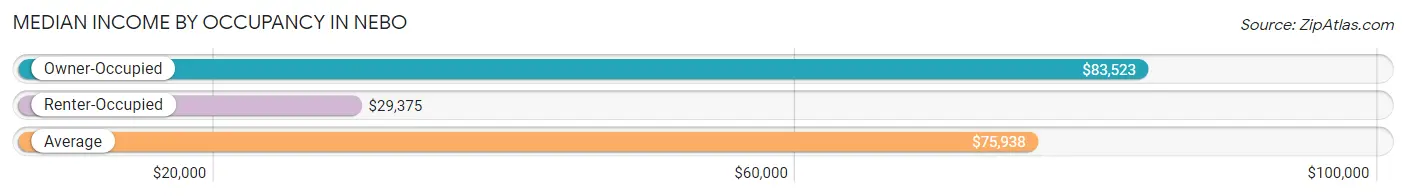
| Occupancy Type | # Households | Median Income |
| Owner-Occupied | 59 (76.6%) | $83,523 |
| Renter-Occupied | 18 (23.4%) | $29,375 |
| Average | 77 (100.0%) | $75,938 |
Occupancy by Householder Income Bracket in Nebo
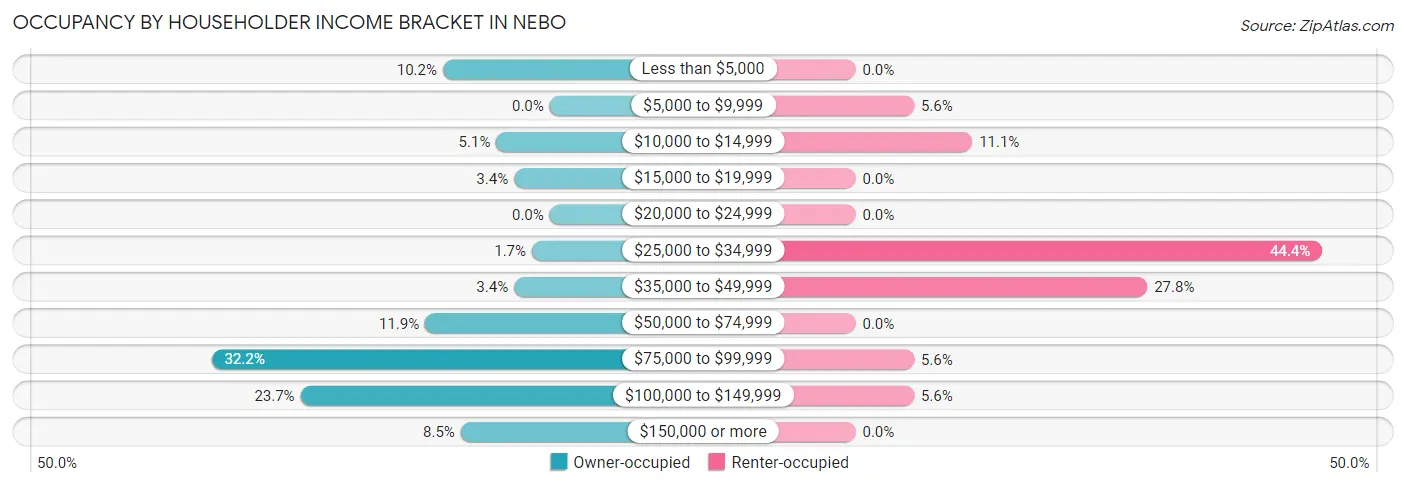
| Income Bracket | Owner-occupied | Renter-occupied |
| Less than $5,000 | 6 (10.2%) | 0 (0.0%) |
| $5,000 to $9,999 | 0 (0.0%) | 1 (5.6%) |
| $10,000 to $14,999 | 3 (5.1%) | 2 (11.1%) |
| $15,000 to $19,999 | 2 (3.4%) | 0 (0.0%) |
| $20,000 to $24,999 | 0 (0.0%) | 0 (0.0%) |
| $25,000 to $34,999 | 1 (1.7%) | 8 (44.4%) |
| $35,000 to $49,999 | 2 (3.4%) | 5 (27.8%) |
| $50,000 to $74,999 | 7 (11.9%) | 0 (0.0%) |
| $75,000 to $99,999 | 19 (32.2%) | 1 (5.6%) |
| $100,000 to $149,999 | 14 (23.7%) | 1 (5.6%) |
| $150,000 or more | 5 (8.5%) | 0 (0.0%) |
| Total | 59 (100.0%) | 18 (100.0%) |
Monthly Housing Cost Tiers in Nebo
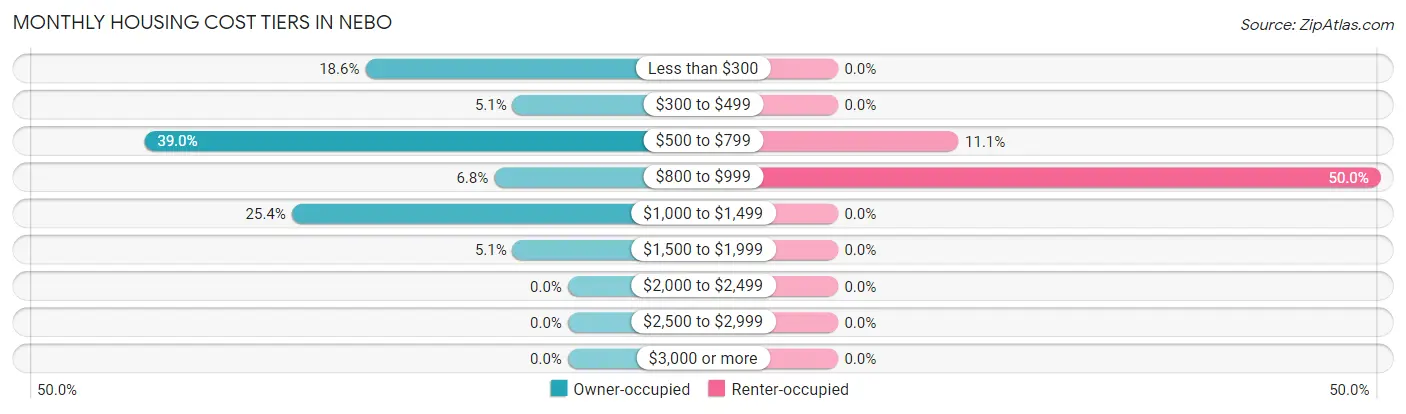
| Monthly Cost | Owner-occupied | Renter-occupied |
| Less than $300 | 11 (18.6%) | 0 (0.0%) |
| $300 to $499 | 3 (5.1%) | 0 (0.0%) |
| $500 to $799 | 23 (39.0%) | 2 (11.1%) |
| $800 to $999 | 4 (6.8%) | 9 (50.0%) |
| $1,000 to $1,499 | 15 (25.4%) | 0 (0.0%) |
| $1,500 to $1,999 | 3 (5.1%) | 0 (0.0%) |
| $2,000 to $2,499 | 0 (0.0%) | 0 (0.0%) |
| $2,500 to $2,999 | 0 (0.0%) | 0 (0.0%) |
| $3,000 or more | 0 (0.0%) | 0 (0.0%) |
| Total | 59 (100.0%) | 18 (100.0%) |
Physical Housing Characteristics in Nebo
Housing Structures in Nebo
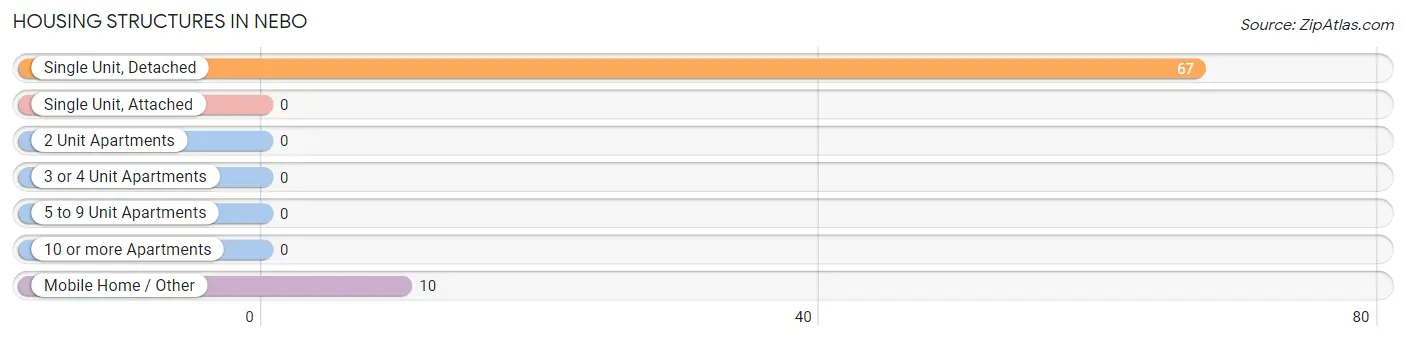
| Structure Type | # Housing Units | % Housing Units |
| Single Unit, Detached | 67 | 87.0% |
| Single Unit, Attached | 0 | 0.0% |
| 2 Unit Apartments | 0 | 0.0% |
| 3 or 4 Unit Apartments | 0 | 0.0% |
| 5 to 9 Unit Apartments | 0 | 0.0% |
| 10 or more Apartments | 0 | 0.0% |
| Mobile Home / Other | 10 | 13.0% |
| Total | 77 | 100.0% |
Housing Structures by Occupancy in Nebo
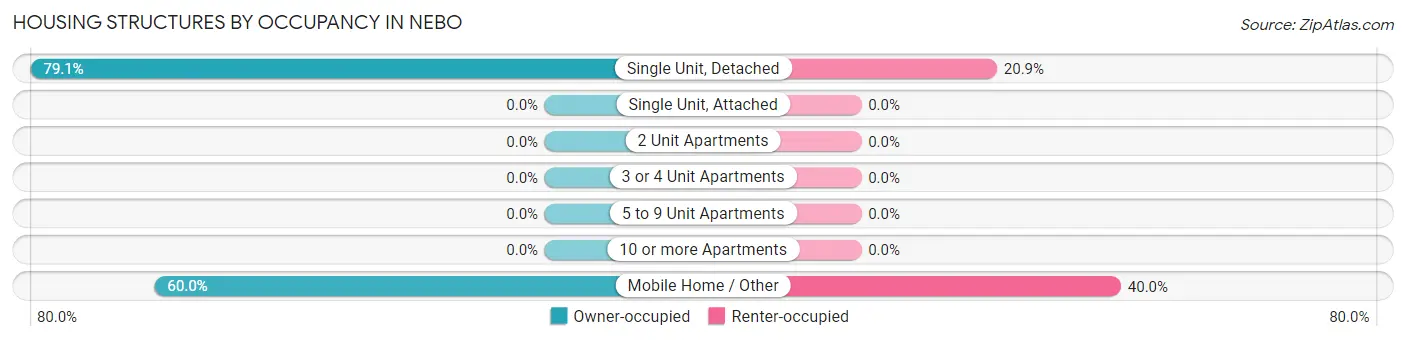
| Structure Type | Owner-occupied | Renter-occupied |
| Single Unit, Detached | 53 (79.1%) | 14 (20.9%) |
| Single Unit, Attached | 0 (0.0%) | 0 (0.0%) |
| 2 Unit Apartments | 0 (0.0%) | 0 (0.0%) |
| 3 or 4 Unit Apartments | 0 (0.0%) | 0 (0.0%) |
| 5 to 9 Unit Apartments | 0 (0.0%) | 0 (0.0%) |
| 10 or more Apartments | 0 (0.0%) | 0 (0.0%) |
| Mobile Home / Other | 6 (60.0%) | 4 (40.0%) |
| Total | 59 (76.6%) | 18 (23.4%) |
Housing Structures by Number of Rooms in Nebo
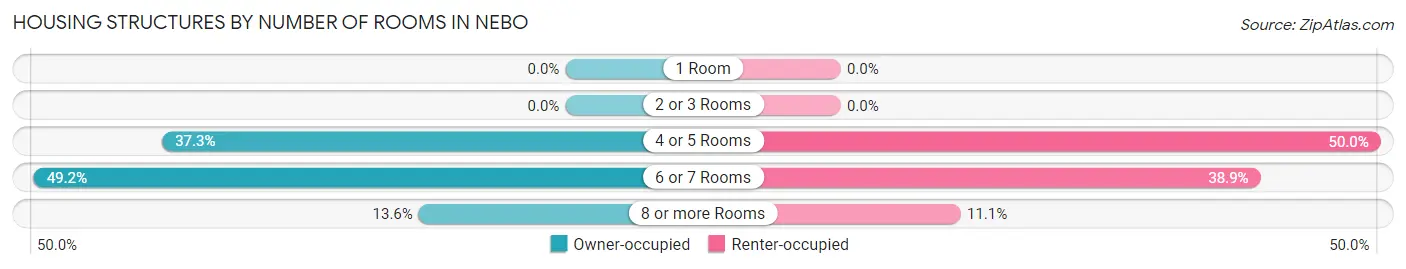
| Number of Rooms | Owner-occupied | Renter-occupied |
| 1 Room | 0 (0.0%) | 0 (0.0%) |
| 2 or 3 Rooms | 0 (0.0%) | 0 (0.0%) |
| 4 or 5 Rooms | 22 (37.3%) | 9 (50.0%) |
| 6 or 7 Rooms | 29 (49.1%) | 7 (38.9%) |
| 8 or more Rooms | 8 (13.6%) | 2 (11.1%) |
| Total | 59 (100.0%) | 18 (100.0%) |
Housing Structure by Heating Type in Nebo
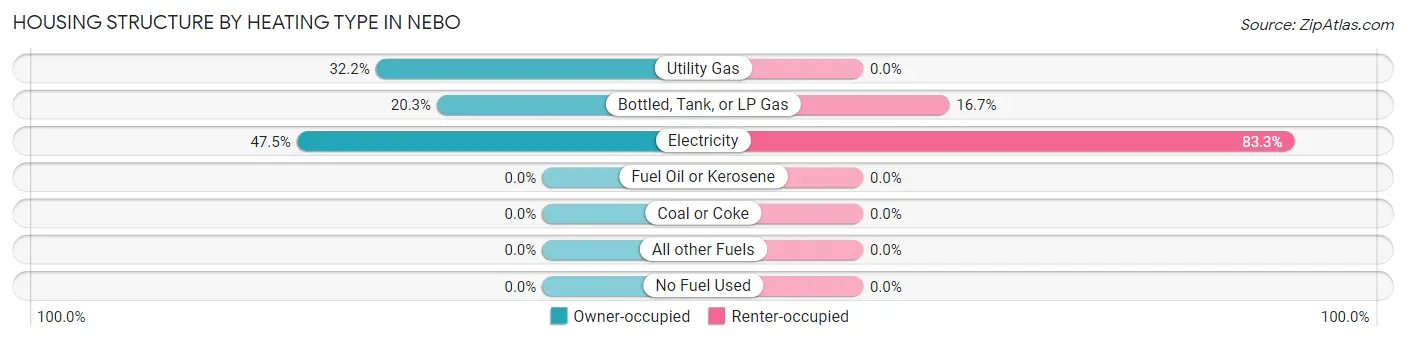
| Heating Type | Owner-occupied | Renter-occupied |
| Utility Gas | 19 (32.2%) | 0 (0.0%) |
| Bottled, Tank, or LP Gas | 12 (20.3%) | 3 (16.7%) |
| Electricity | 28 (47.5%) | 15 (83.3%) |
| Fuel Oil or Kerosene | 0 (0.0%) | 0 (0.0%) |
| Coal or Coke | 0 (0.0%) | 0 (0.0%) |
| All other Fuels | 0 (0.0%) | 0 (0.0%) |
| No Fuel Used | 0 (0.0%) | 0 (0.0%) |
| Total | 59 (100.0%) | 18 (100.0%) |
Household Vehicle Usage in Nebo
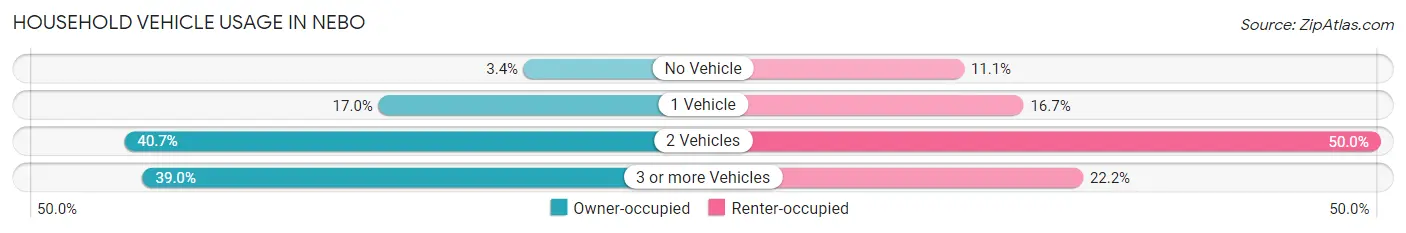
| Vehicles per Household | Owner-occupied | Renter-occupied |
| No Vehicle | 2 (3.4%) | 2 (11.1%) |
| 1 Vehicle | 10 (17.0%) | 3 (16.7%) |
| 2 Vehicles | 24 (40.7%) | 9 (50.0%) |
| 3 or more Vehicles | 23 (39.0%) | 4 (22.2%) |
| Total | 59 (100.0%) | 18 (100.0%) |
Real Estate & Mortgages in Nebo
Real Estate and Mortgage Overview in Nebo
| Characteristic | Without Mortgage | With Mortgage |
| Housing Units | 26 | 33 |
| Median Property Value | - | - |
| Median Household Income | - | - |
| Monthly Housing Costs | $450 | $0 |
| Real Estate Taxes | $780 | $0 |
Property Value by Mortgage Status in Nebo
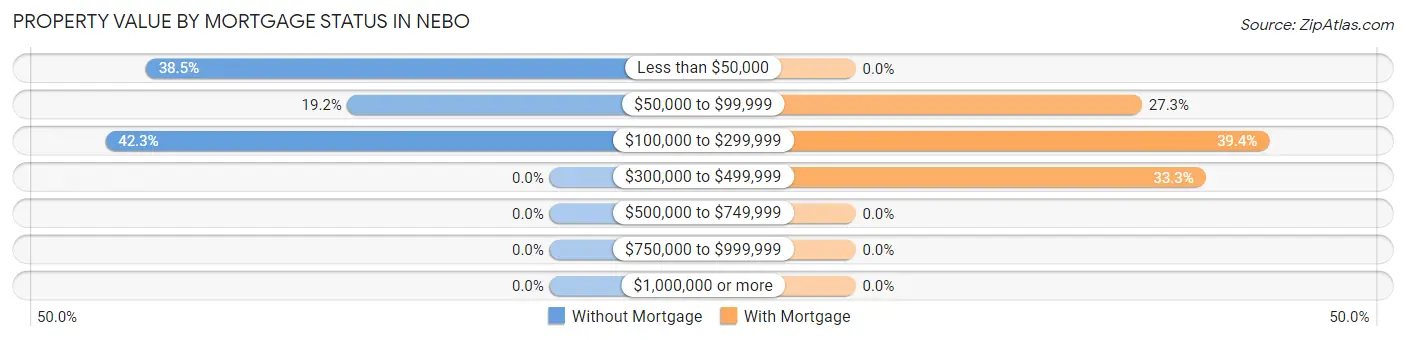
| Property Value | Without Mortgage | With Mortgage |
| Less than $50,000 | 10 (38.5%) | 0 (0.0%) |
| $50,000 to $99,999 | 5 (19.2%) | 9 (27.3%) |
| $100,000 to $299,999 | 11 (42.3%) | 13 (39.4%) |
| $300,000 to $499,999 | 0 (0.0%) | 11 (33.3%) |
| $500,000 to $749,999 | 0 (0.0%) | 0 (0.0%) |
| $750,000 to $999,999 | 0 (0.0%) | 0 (0.0%) |
| $1,000,000 or more | 0 (0.0%) | 0 (0.0%) |
| Total | 26 (100.0%) | 33 (100.0%) |
Household Income by Mortgage Status in Nebo
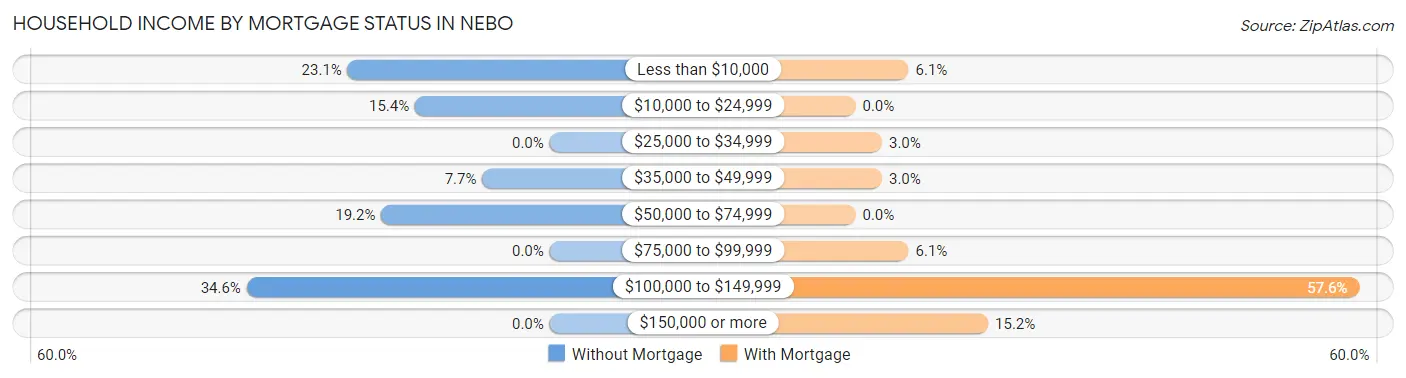
| Household Income | Without Mortgage | With Mortgage |
| Less than $10,000 | 6 (23.1%) | 2 (6.1%) |
| $10,000 to $24,999 | 4 (15.4%) | 0 (0.0%) |
| $25,000 to $34,999 | 0 (0.0%) | 1 (3.0%) |
| $35,000 to $49,999 | 2 (7.7%) | 1 (3.0%) |
| $50,000 to $74,999 | 5 (19.2%) | 0 (0.0%) |
| $75,000 to $99,999 | 0 (0.0%) | 2 (6.1%) |
| $100,000 to $149,999 | 9 (34.6%) | 19 (57.6%) |
| $150,000 or more | 0 (0.0%) | 5 (15.1%) |
| Total | 26 (100.0%) | 33 (100.0%) |
Property Value to Household Income Ratio in Nebo
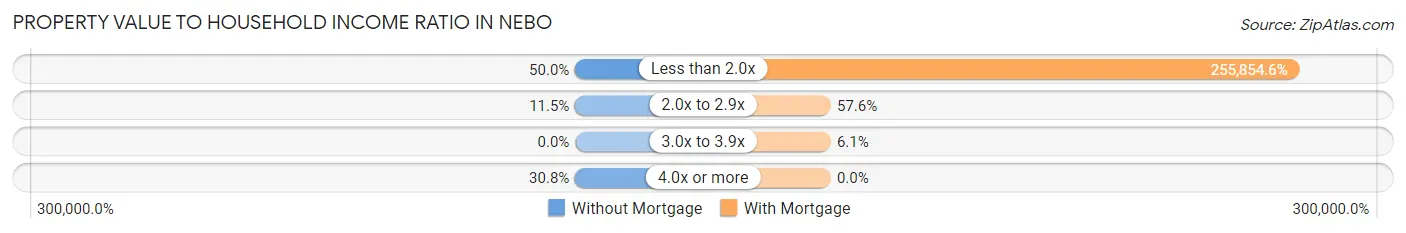
| Value-to-Income Ratio | Without Mortgage | With Mortgage |
| Less than 2.0x | 13 (50.0%) | 84,432 (255,854.6%) |
| 2.0x to 2.9x | 3 (11.5%) | 19 (57.6%) |
| 3.0x to 3.9x | 0 (0.0%) | 2 (6.1%) |
| 4.0x or more | 8 (30.8%) | 0 (0.0%) |
| Total | 26 (100.0%) | 33 (100.0%) |
Real Estate Taxes by Mortgage Status in Nebo
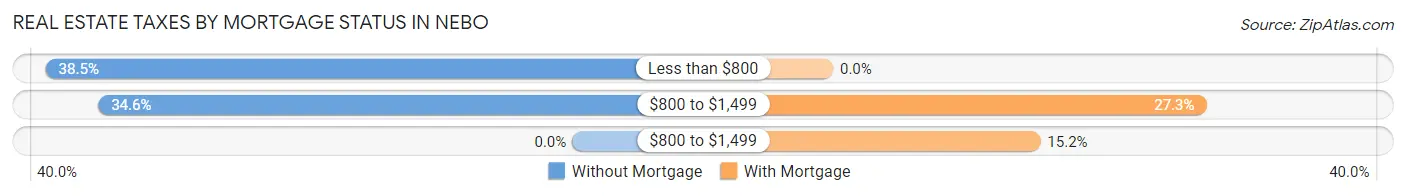
| Property Taxes | Without Mortgage | With Mortgage |
| Less than $800 | 10 (38.5%) | 0 (0.0%) |
| $800 to $1,499 | 9 (34.6%) | 9 (27.3%) |
| $800 to $1,499 | 0 (0.0%) | 5 (15.1%) |
| Total | 26 (100.0%) | 33 (100.0%) |
Health & Disability in Nebo
Health Insurance Coverage by Age in Nebo
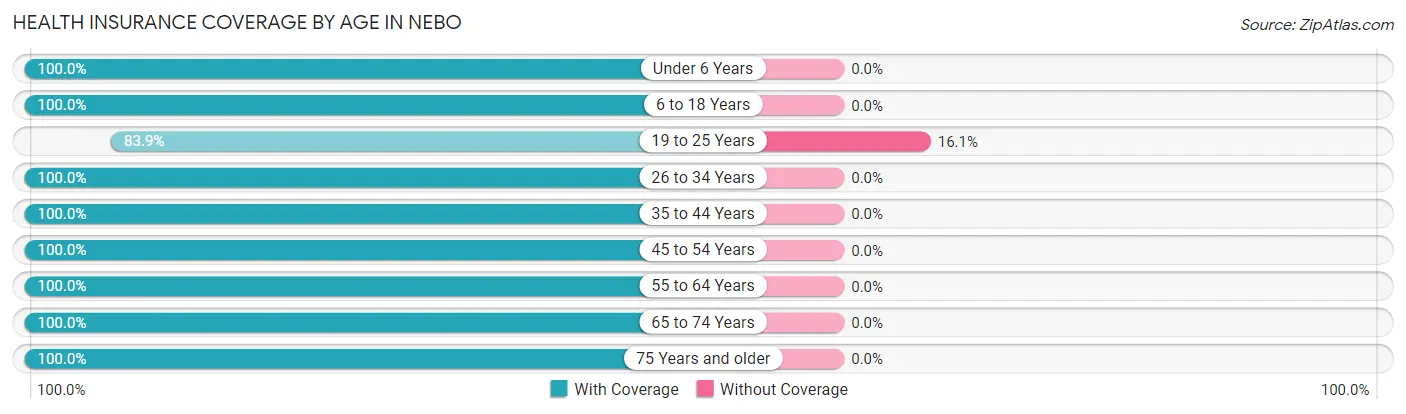
| Age Bracket | With Coverage | Without Coverage |
| Under 6 Years | 19 (100.0%) | 0 (0.0%) |
| 6 to 18 Years | 16 (100.0%) | 0 (0.0%) |
| 19 to 25 Years | 26 (83.9%) | 5 (16.1%) |
| 26 to 34 Years | 14 (100.0%) | 0 (0.0%) |
| 35 to 44 Years | 21 (100.0%) | 0 (0.0%) |
| 45 to 54 Years | 14 (100.0%) | 0 (0.0%) |
| 55 to 64 Years | 50 (100.0%) | 0 (0.0%) |
| 65 to 74 Years | 16 (100.0%) | 0 (0.0%) |
| 75 Years and older | 22 (100.0%) | 0 (0.0%) |
| Total | 198 (97.5%) | 5 (2.5%) |
Health Insurance Coverage by Citizenship Status in Nebo
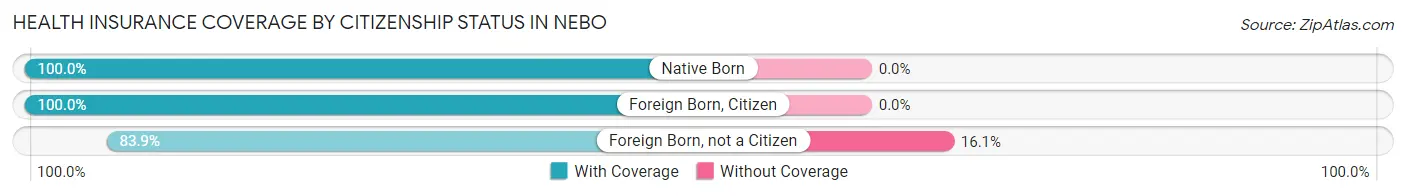
| Citizenship Status | With Coverage | Without Coverage |
| Native Born | 19 (100.0%) | 0 (0.0%) |
| Foreign Born, Citizen | 16 (100.0%) | 0 (0.0%) |
| Foreign Born, not a Citizen | 26 (83.9%) | 5 (16.1%) |
Health Insurance Coverage by Household Income in Nebo
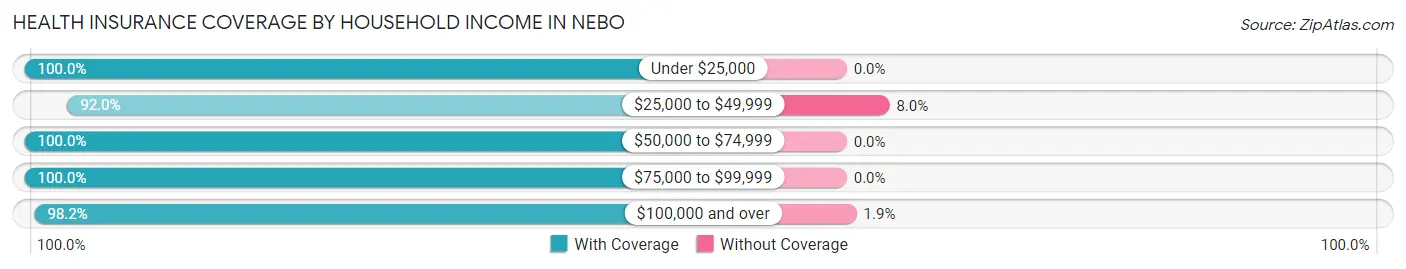
| Household Income | With Coverage | Without Coverage |
| Under $25,000 | 31 (100.0%) | 0 (0.0%) |
| $25,000 to $49,999 | 46 (92.0%) | 4 (8.0%) |
| $50,000 to $74,999 | 23 (100.0%) | 0 (0.0%) |
| $75,000 to $99,999 | 45 (100.0%) | 0 (0.0%) |
| $100,000 and over | 53 (98.2%) | 1 (1.8%) |
Public vs Private Health Insurance Coverage by Age in Nebo
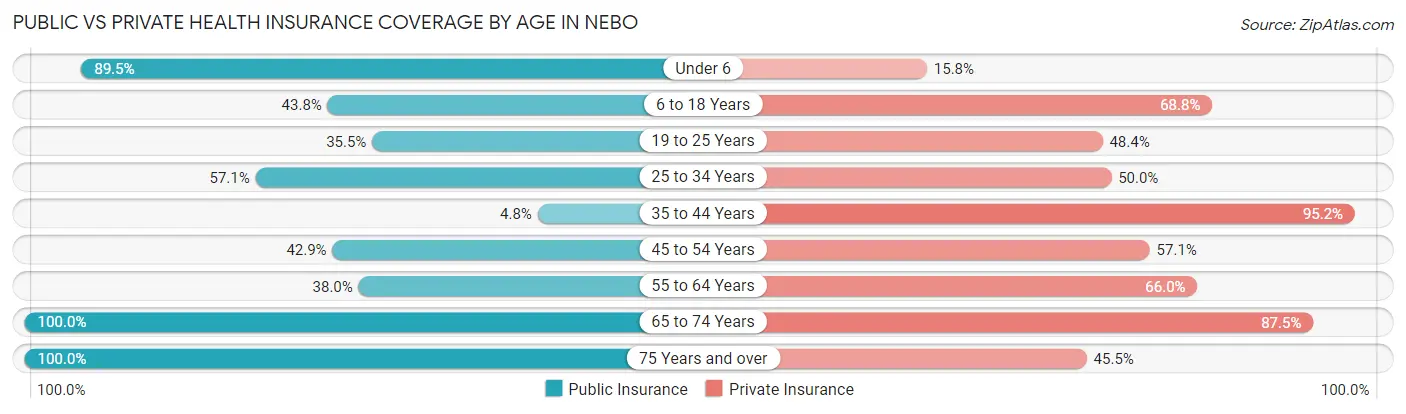
| Age Bracket | Public Insurance | Private Insurance |
| Under 6 | 17 (89.5%) | 3 (15.8%) |
| 6 to 18 Years | 7 (43.8%) | 11 (68.8%) |
| 19 to 25 Years | 11 (35.5%) | 15 (48.4%) |
| 25 to 34 Years | 8 (57.1%) | 7 (50.0%) |
| 35 to 44 Years | 1 (4.8%) | 20 (95.2%) |
| 45 to 54 Years | 6 (42.9%) | 8 (57.1%) |
| 55 to 64 Years | 19 (38.0%) | 33 (66.0%) |
| 65 to 74 Years | 16 (100.0%) | 14 (87.5%) |
| 75 Years and over | 22 (100.0%) | 10 (45.5%) |
| Total | 107 (52.7%) | 121 (59.6%) |
Disability Status by Sex by Age in Nebo
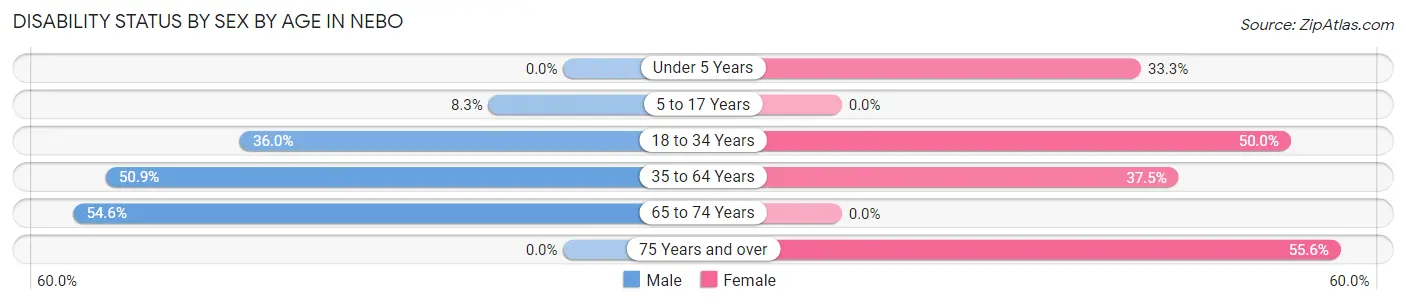
| Age Bracket | Male | Female |
| Under 5 Years | 0 (0.0%) | 3 (33.3%) |
| 5 to 17 Years | 1 (8.3%) | 0 (0.0%) |
| 18 to 34 Years | 9 (36.0%) | 10 (50.0%) |
| 35 to 64 Years | 27 (50.9%) | 12 (37.5%) |
| 65 to 74 Years | 6 (54.5%) | 0 (0.0%) |
| 75 Years and over | 0 (0.0%) | 10 (55.6%) |
Disability Class by Sex by Age in Nebo
Disability Class: Hearing Difficulty
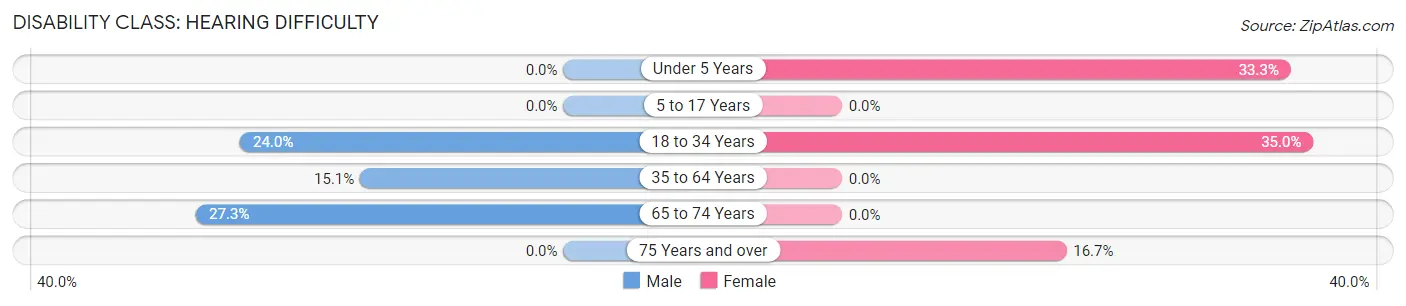
| Age Bracket | Male | Female |
| Under 5 Years | 0 (0.0%) | 3 (33.3%) |
| 5 to 17 Years | 0 (0.0%) | 0 (0.0%) |
| 18 to 34 Years | 6 (24.0%) | 7 (35.0%) |
| 35 to 64 Years | 8 (15.1%) | 0 (0.0%) |
| 65 to 74 Years | 3 (27.3%) | 0 (0.0%) |
| 75 Years and over | 0 (0.0%) | 3 (16.7%) |
Disability Class: Vision Difficulty
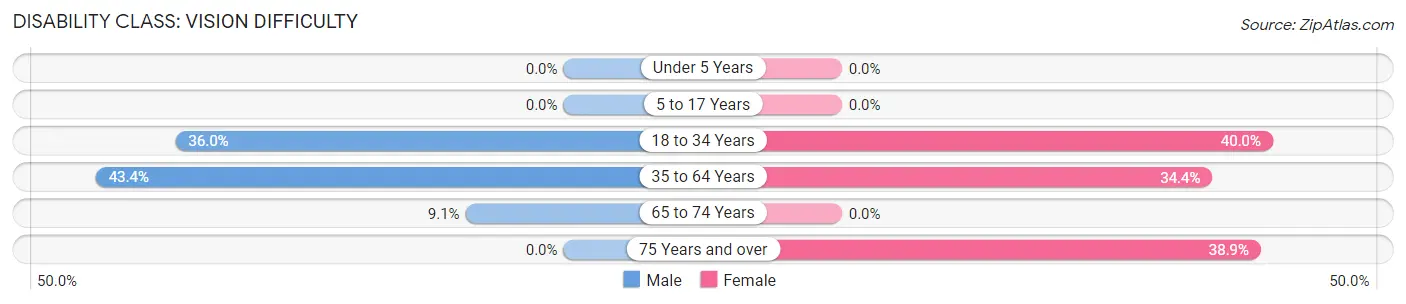
| Age Bracket | Male | Female |
| Under 5 Years | 0 (0.0%) | 0 (0.0%) |
| 5 to 17 Years | 0 (0.0%) | 0 (0.0%) |
| 18 to 34 Years | 9 (36.0%) | 8 (40.0%) |
| 35 to 64 Years | 23 (43.4%) | 11 (34.4%) |
| 65 to 74 Years | 1 (9.1%) | 0 (0.0%) |
| 75 Years and over | 0 (0.0%) | 7 (38.9%) |
Disability Class: Cognitive Difficulty
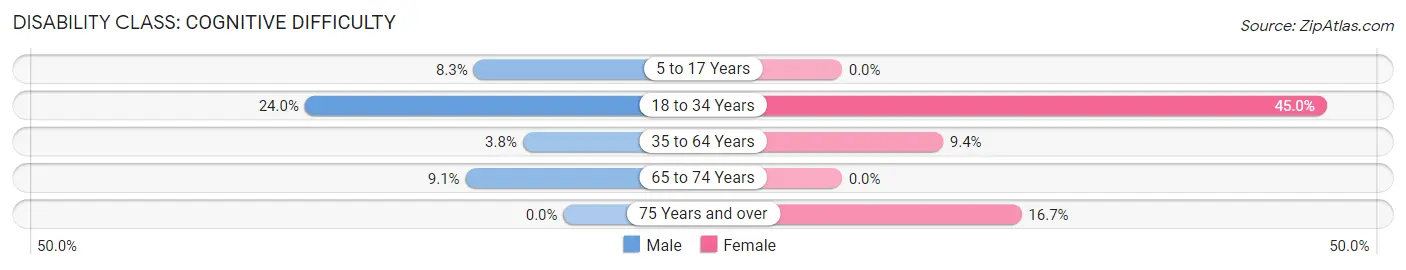
| Age Bracket | Male | Female |
| 5 to 17 Years | 1 (8.3%) | 0 (0.0%) |
| 18 to 34 Years | 6 (24.0%) | 9 (45.0%) |
| 35 to 64 Years | 2 (3.8%) | 3 (9.4%) |
| 65 to 74 Years | 1 (9.1%) | 0 (0.0%) |
| 75 Years and over | 0 (0.0%) | 3 (16.7%) |
Disability Class: Ambulatory Difficulty
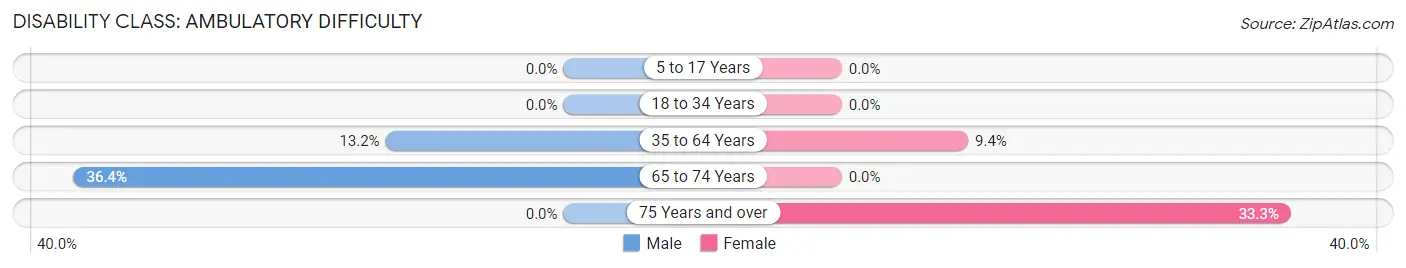
| Age Bracket | Male | Female |
| 5 to 17 Years | 0 (0.0%) | 0 (0.0%) |
| 18 to 34 Years | 0 (0.0%) | 0 (0.0%) |
| 35 to 64 Years | 7 (13.2%) | 3 (9.4%) |
| 65 to 74 Years | 4 (36.4%) | 0 (0.0%) |
| 75 Years and over | 0 (0.0%) | 6 (33.3%) |
Disability Class: Self-Care Difficulty
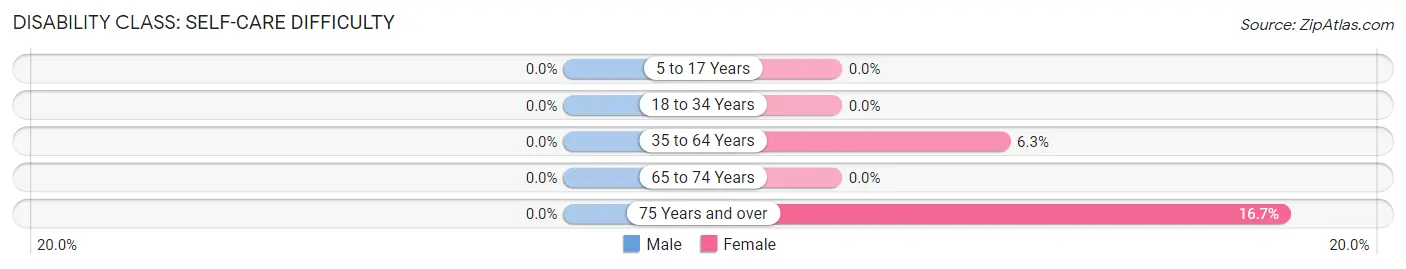
| Age Bracket | Male | Female |
| 5 to 17 Years | 0 (0.0%) | 0 (0.0%) |
| 18 to 34 Years | 0 (0.0%) | 0 (0.0%) |
| 35 to 64 Years | 0 (0.0%) | 2 (6.2%) |
| 65 to 74 Years | 0 (0.0%) | 0 (0.0%) |
| 75 Years and over | 0 (0.0%) | 3 (16.7%) |
Technology Access in Nebo
Computing Device Access in Nebo
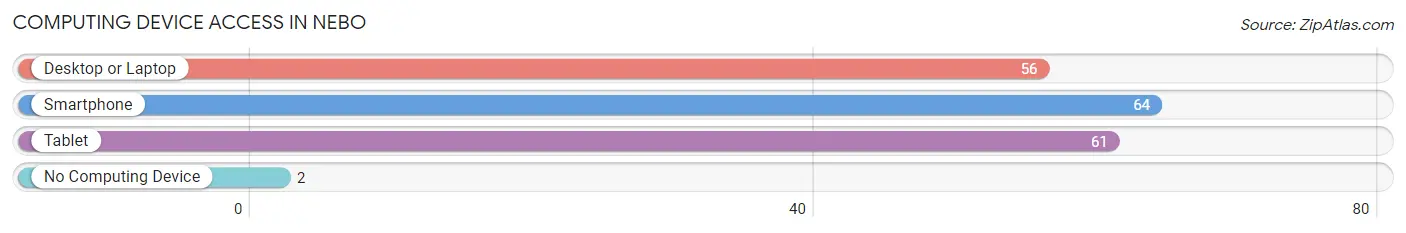
| Device Type | # Households | % Households |
| Desktop or Laptop | 56 | 72.7% |
| Smartphone | 64 | 83.1% |
| Tablet | 61 | 79.2% |
| No Computing Device | 2 | 2.6% |
| Total | 77 | 100.0% |
Internet Access in Nebo
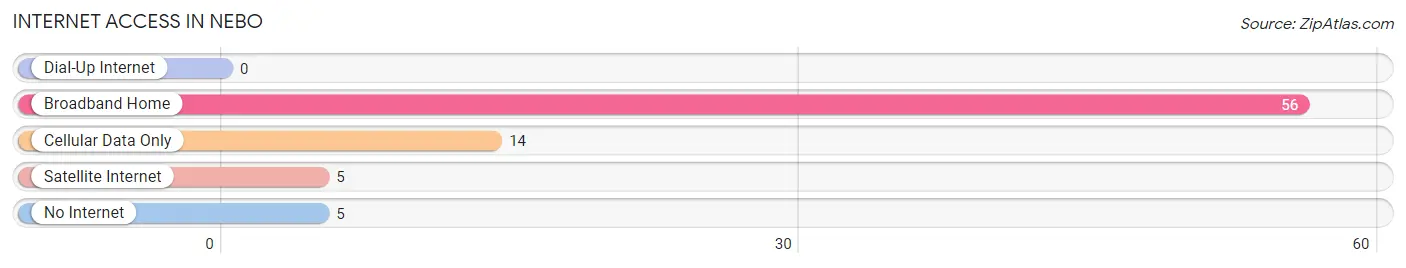
| Internet Type | # Households | % Households |
| Dial-Up Internet | 0 | 0.0% |
| Broadband Home | 56 | 72.7% |
| Cellular Data Only | 14 | 18.2% |
| Satellite Internet | 5 | 6.5% |
| No Internet | 5 | 6.5% |
| Total | 77 | 100.0% |
Nebo Summary
Nebo is a small unincorporated community located in the western part of Muhlenberg County, Kentucky. It is situated along the banks of the Green River, approximately 10 miles south of Central City. The population of Nebo was estimated to be around 500 people in 2000.
History
Nebo was first settled in the early 1800s by a group of settlers from Virginia. The town was named after the biblical mountain of Nebo, which is located in modern-day Jordan. The town was originally a farming community, but it soon became a center for coal mining. The first coal mine in the area was opened in 1883, and by the early 1900s, the town had become a major coal-producing center.
Geography
Nebo is located in western Muhlenberg County, approximately 10 miles south of Central City. The town is situated along the banks of the Green River, which is a tributary of the Ohio River. The terrain in the area is mostly flat, with some rolling hills. The climate in Nebo is humid subtropical, with hot summers and mild winters.
Economy
Nebo’s economy is largely based on coal mining. The town is home to several coal mines, which provide jobs for many of the town’s residents. In addition to coal mining, Nebo also has a few small businesses, including a general store, a gas station, and a few restaurants.
Demographics
As of the 2000 census, the population of Nebo was estimated to be around 500 people. The racial makeup of the town was 97.2% White, 0.8% African American, 0.4% Native American, and 1.6% from other races. The median household income in Nebo was $25,000, and the median family income was $30,000. The per capita income in Nebo was $14,000.
Conclusion
Nebo is a small unincorporated community located in western Muhlenberg County, Kentucky. It is situated along the banks of the Green River, and has a population of around 500 people. The town’s economy is largely based on coal mining, and it also has a few small businesses. The racial makeup of the town is mostly White, with a small percentage of African American, Native American, and other races. The median household income in Nebo is $25,000, and the per capita income is $14,000.
Common Questions
What is Per Capita Income in Nebo?
Per Capita income in Nebo is $31,278.
What is the Median Family Income in Nebo?
Median Family Income in Nebo is $83,068.
What is the Median Household income in Nebo?
Median Household Income in Nebo is $75,938.
What is Income or Wage Gap in Nebo?
Income or Wage Gap in Nebo is 3.8%.
Women in Nebo earn 96.2 cents for every dollar earned by a man.
What is Inequality or Gini Index in Nebo?
Inequality or Gini Index in Nebo is 0.45.
What is the Total Population of Nebo?
Total Population of Nebo is 203.
What is the Total Male Population of Nebo?
Total Male Population of Nebo is 115.
What is the Total Female Population of Nebo?
Total Female Population of Nebo is 88.
What is the Ratio of Males per 100 Females in Nebo?
There are 130.68 Males per 100 Females in Nebo.
What is the Ratio of Females per 100 Males in Nebo?
There are 76.52 Females per 100 Males in Nebo.
What is the Median Population Age in Nebo?
Median Population Age in Nebo is 45.1 Years.
What is the Average Family Size in Nebo
Average Family Size in Nebo is 2.8 People.
What is the Average Household Size in Nebo
Average Household Size in Nebo is 2.6 People.
How Large is the Labor Force in Nebo?
There are 108 People in the Labor Forcein in Nebo.
What is the Percentage of People in the Labor Force in Nebo?
63.9% of People are in the Labor Force in Nebo.
What is the Unemployment Rate in Nebo?
Unemployment Rate in Nebo is 2.8%.