Auburn, KY Map & Demographics
Auburn Map
Auburn Overview
$24,570
PER CAPITA INCOME
$53,056
AVG FAMILY INCOME
$40,259
AVG HOUSEHOLD INCOME
30.1%
WAGE / INCOME GAP [ % ]
69.9¢/ $1
WAGE / INCOME GAP [ $ ]
0.40
INEQUALITY / GINI INDEX
1,645
TOTAL POPULATION
843
MALE POPULATION
802
FEMALE POPULATION
105.11
MALES / 100 FEMALES
95.14
FEMALES / 100 MALES
36.3
MEDIAN AGE
3.3
AVG FAMILY SIZE
2.2
AVG HOUSEHOLD SIZE
788
LABOR FORCE [ PEOPLE ]
58.7%
PERCENT IN LABOR FORCE
8.8%
UNEMPLOYMENT RATE
Auburn Zip Codes
Auburn Area Codes
Income in Auburn
Income Overview in Auburn
Per Capita Income in Auburn is $24,570, while median incomes of families and households are $53,056 and $40,259 respectively.
| Characteristic | Number | Measure |
| Per Capita Income | 1,645 | $24,570 |
| Median Family Income | 334 | $53,056 |
| Mean Family Income | 334 | $70,230 |
| Median Household Income | 716 | $40,259 |
| Mean Household Income | 716 | $54,116 |
| Income Deficit | 334 | $0 |
| Wage / Income Gap (%) | 1,645 | 30.11% |
| Wage / Income Gap ($) | 1,645 | 69.89¢ per $1 |
| Gini / Inequality Index | 1,645 | 0.40 |
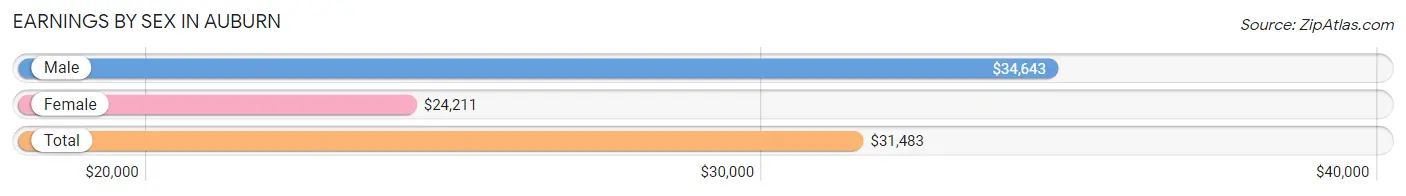
Earnings by Sex in Auburn
Average Earnings in Auburn are $31,483, $34,643 for men and $24,211 for women, a difference of 30.1%.
| Sex | Number | Average Earnings |
| Male | 488 (58.8%) | $34,643 |
| Female | 342 (41.2%) | $24,211 |
| Total | 830 (100.0%) | $31,483 |
Earnings by Sex by Income Bracket in Auburn
The most common earnings brackets in Auburn are $55,000 to $64,999 for men (96 | 19.7%) and $2,499 or less for women (40 | 11.7%).
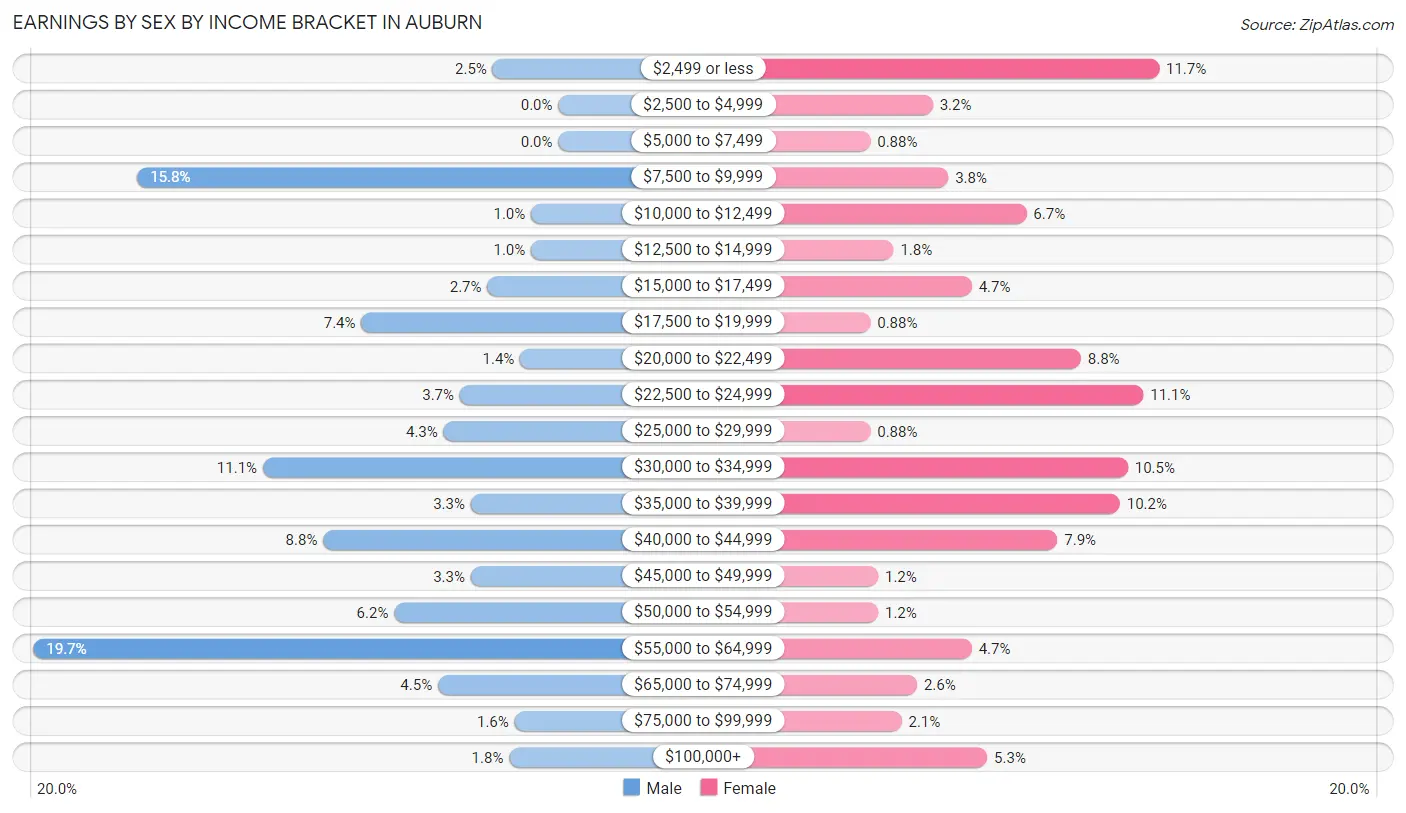
| Income | Male | Female |
| $2,499 or less | 12 (2.5%) | 40 (11.7%) |
| $2,500 to $4,999 | 0 (0.0%) | 11 (3.2%) |
| $5,000 to $7,499 | 0 (0.0%) | 3 (0.9%) |
| $7,500 to $9,999 | 77 (15.8%) | 13 (3.8%) |
| $10,000 to $12,499 | 5 (1.0%) | 23 (6.7%) |
| $12,500 to $14,999 | 5 (1.0%) | 6 (1.8%) |
| $15,000 to $17,499 | 13 (2.7%) | 16 (4.7%) |
| $17,500 to $19,999 | 36 (7.4%) | 3 (0.9%) |
| $20,000 to $22,499 | 7 (1.4%) | 30 (8.8%) |
| $22,500 to $24,999 | 18 (3.7%) | 38 (11.1%) |
| $25,000 to $29,999 | 21 (4.3%) | 3 (0.9%) |
| $30,000 to $34,999 | 54 (11.1%) | 36 (10.5%) |
| $35,000 to $39,999 | 16 (3.3%) | 35 (10.2%) |
| $40,000 to $44,999 | 43 (8.8%) | 27 (7.9%) |
| $45,000 to $49,999 | 16 (3.3%) | 4 (1.2%) |
| $50,000 to $54,999 | 30 (6.1%) | 4 (1.2%) |
| $55,000 to $64,999 | 96 (19.7%) | 16 (4.7%) |
| $65,000 to $74,999 | 22 (4.5%) | 9 (2.6%) |
| $75,000 to $99,999 | 8 (1.6%) | 7 (2.1%) |
| $100,000+ | 9 (1.8%) | 18 (5.3%) |
| Total | 488 (100.0%) | 342 (100.0%) |
Earnings by Sex by Educational Attainment in Auburn
Average earnings in Auburn are $50,952 for men and $28,750 for women, a difference of 43.6%. Men with an educational attainment of graduate degree enjoy the highest average annual earnings of $70,833, while those with less than high school education earn the least with $23,750. Women with an educational attainment of graduate degree earn the most with the average annual earnings of $83,500, while those with bachelor's degree education have the smallest earnings of $23,365.
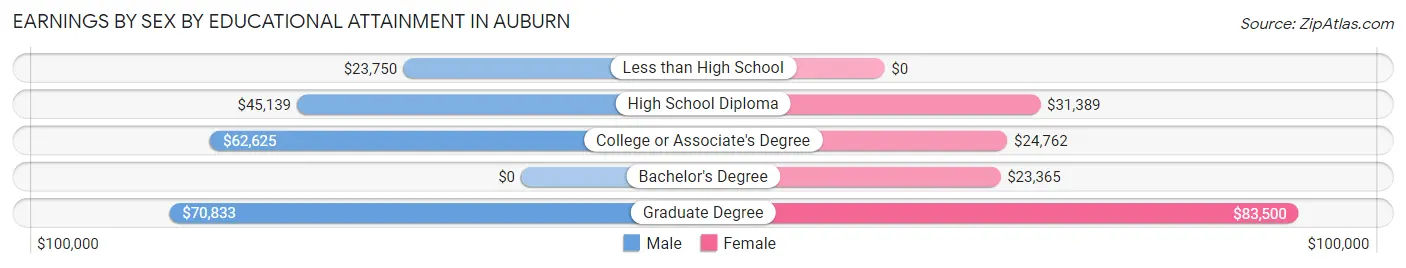
| Educational Attainment | Male Income | Female Income |
| Less than High School | $23,750 | $0 |
| High School Diploma | $45,139 | $31,389 |
| College or Associate's Degree | $62,625 | $24,762 |
| Bachelor's Degree | - | - |
| Graduate Degree | $70,833 | $83,500 |
| Total | $50,952 | $28,750 |
Family Income in Auburn
Family Income Brackets in Auburn
According to the Auburn family income data, there are 69 families falling into the $50,000 to $74,999 income range, which is the most common income bracket and makes up 20.7% of all families. Conversely, the less than $10,000 income bracket is the least frequent group with only 3 families (0.9%) belonging to this category.
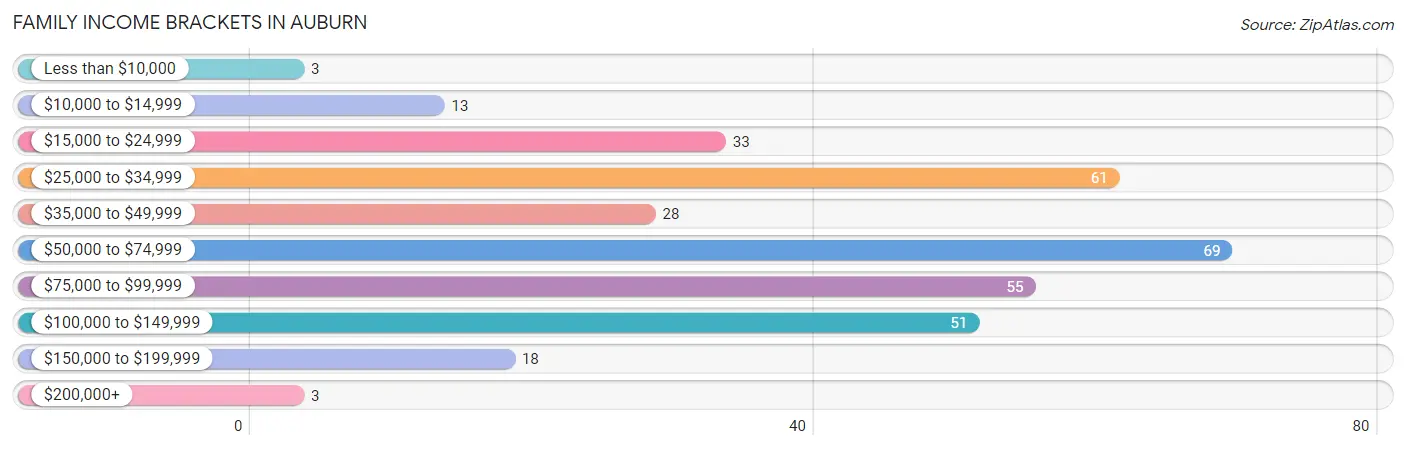
| Income Bracket | # Families | % Families |
| Less than $10,000 | 3 | 0.9% |
| $10,000 to $14,999 | 13 | 3.9% |
| $15,000 to $24,999 | 33 | 9.9% |
| $25,000 to $34,999 | 61 | 18.3% |
| $35,000 to $49,999 | 28 | 8.4% |
| $50,000 to $74,999 | 69 | 20.7% |
| $75,000 to $99,999 | 55 | 16.5% |
| $100,000 to $149,999 | 51 | 15.3% |
| $150,000 to $199,999 | 18 | 5.4% |
| $200,000+ | 3 | 0.9% |
Family Income by Famaliy Size in Auburn
4-person families (37 | 11.1%) account for the highest median family income in Auburn with $77,917 per family, while 2-person families (164 | 49.1%) have the highest median income of $25,729 per family member.
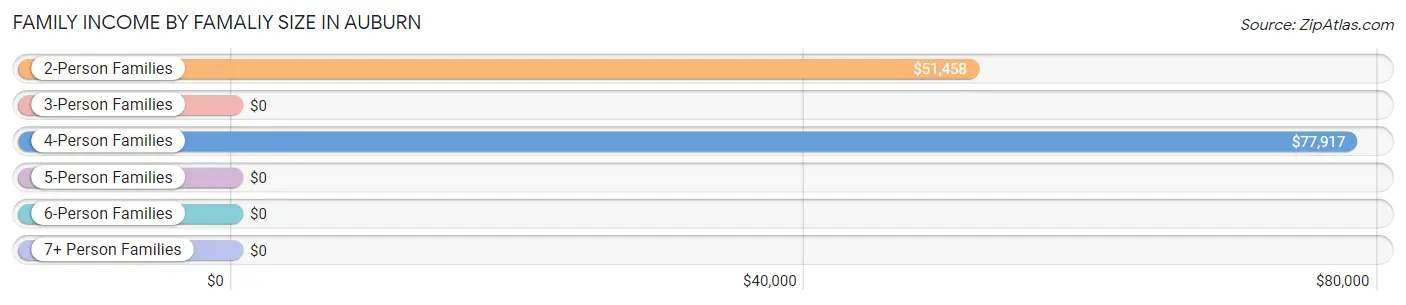
| Income Bracket | # Families | Median Income |
| 2-Person Families | 164 (49.1%) | $51,458 |
| 3-Person Families | 65 (19.5%) | $0 |
| 4-Person Families | 37 (11.1%) | $77,917 |
| 5-Person Families | 57 (17.1%) | $0 |
| 6-Person Families | 11 (3.3%) | $0 |
| 7+ Person Families | 0 (0.0%) | $0 |
| Total | 334 (100.0%) | $53,056 |
Family Income by Number of Earners in Auburn
The median family income in Auburn is $53,056, with families comprising 3+ earners (31) having the highest median family income of $136,563, while families with 1 earner (114) have the lowest median family income of $34,500, accounting for 9.3% and 34.1% of families, respectively.
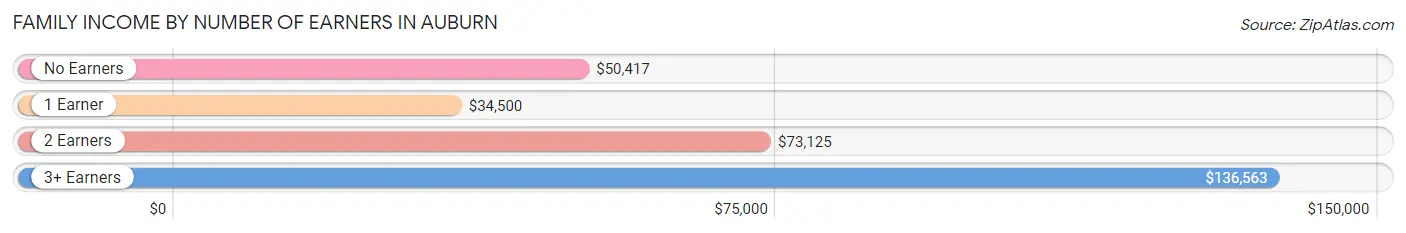
| Number of Earners | # Families | Median Income |
| No Earners | 32 (9.6%) | $50,417 |
| 1 Earner | 114 (34.1%) | $34,500 |
| 2 Earners | 157 (47.0%) | $73,125 |
| 3+ Earners | 31 (9.3%) | $136,563 |
| Total | 334 (100.0%) | $53,056 |
Household Income in Auburn
Household Income Brackets in Auburn
With 205 households falling in the category, the $25,000 to $34,999 income range is the most frequent in Auburn, accounting for 28.6% of all households. In contrast, only 3 households (0.4%) fall into the $200,000+ income bracket, making it the least populous group.
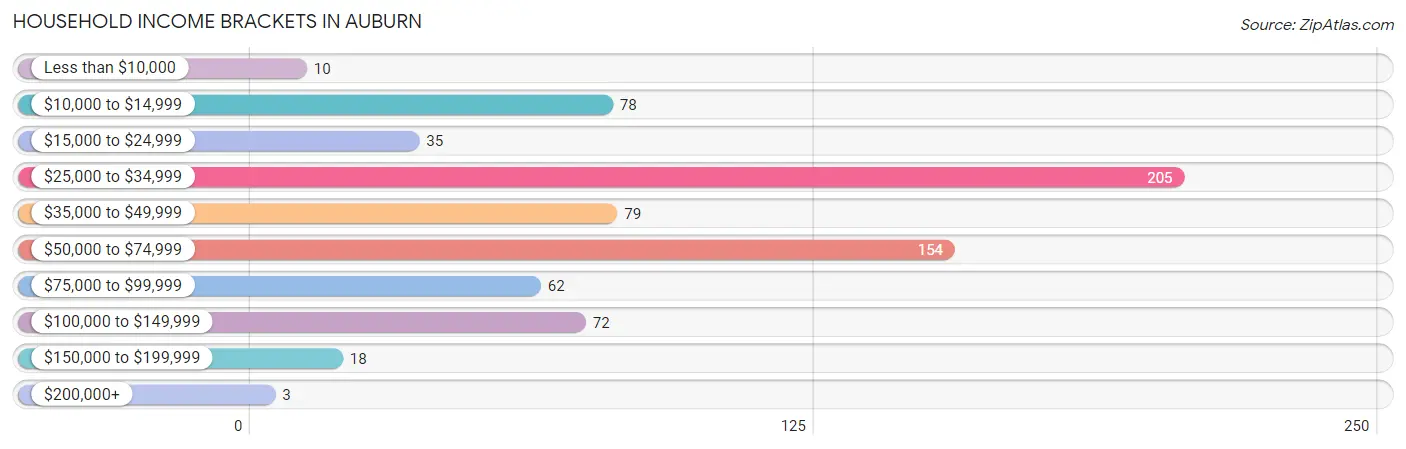
| Income Bracket | # Households | % Households |
| Less than $10,000 | 10 | 1.4% |
| $10,000 to $14,999 | 78 | 10.9% |
| $15,000 to $24,999 | 35 | 4.9% |
| $25,000 to $34,999 | 205 | 28.6% |
| $35,000 to $49,999 | 79 | 11.0% |
| $50,000 to $74,999 | 154 | 21.5% |
| $75,000 to $99,999 | 62 | 8.7% |
| $100,000 to $149,999 | 72 | 10.1% |
| $150,000 to $199,999 | 18 | 2.5% |
| $200,000+ | 3 | 0.4% |
Household Income by Householder Age in Auburn
The median household income in Auburn is $40,259, with the highest median household income of $63,667 found in the 45 to 64 years age bracket for the primary householder. A total of 178 households (24.9%) fall into this category. Meanwhile, the 65+ years age bracket for the primary householder has the lowest median household income of $26,262, with 250 households (34.9%) in this group.
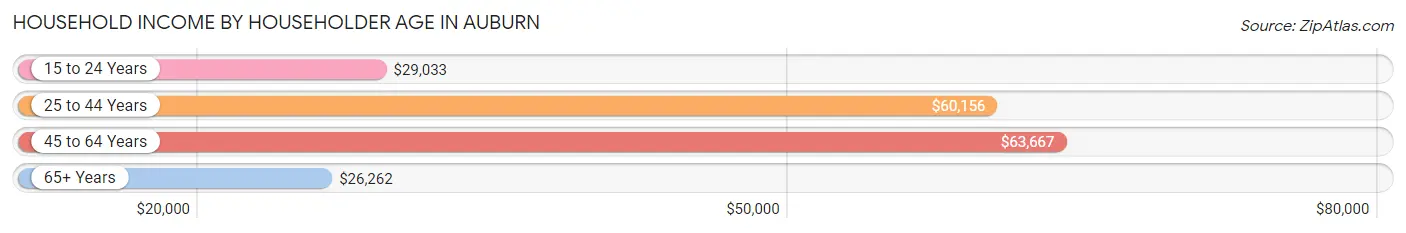
| Income Bracket | # Households | Median Income |
| 15 to 24 Years | 105 (14.7%) | $29,033 |
| 25 to 44 Years | 183 (25.6%) | $60,156 |
| 45 to 64 Years | 178 (24.9%) | $63,667 |
| 65+ Years | 250 (34.9%) | $26,262 |
| Total | 716 (100.0%) | $40,259 |
Poverty in Auburn
Income Below Poverty by Sex and Age in Auburn
With 21.4% poverty level for males and 24.4% for females among the residents of Auburn, 15 year old males and 12 to 14 year old females are the most vulnerable to poverty, with 8 males (100.0%) and 6 females (75.0%) in their respective age groups living below the poverty level.
| Age Bracket | Male | Female |
| Under 5 Years | 40 (50.6%) | 11 (47.8%) |
| 5 Years | 0 (0.0%) | 0 (0.0%) |
| 6 to 11 Years | 28 (31.1%) | 20 (40.0%) |
| 12 to 14 Years | 4 (26.7%) | 6 (75.0%) |
| 15 Years | 8 (100.0%) | 0 (0.0%) |
| 16 and 17 Years | 0 (0.0%) | 5 (38.5%) |
| 18 to 24 Years | 21 (12.3%) | 38 (29.9%) |
| 25 to 34 Years | 3 (3.7%) | 19 (25.0%) |
| 35 to 44 Years | 66 (55.5%) | 12 (15.2%) |
| 45 to 54 Years | 7 (5.5%) | 6 (10.7%) |
| 55 to 64 Years | 1 (2.6%) | 12 (21.0%) |
| 65 to 74 Years | 0 (0.0%) | 26 (41.3%) |
| 75 Years and over | 0 (0.0%) | 30 (17.0%) |
| Total | 178 (21.4%) | 185 (24.4%) |
Income Above Poverty by Sex and Age in Auburn
According to the poverty statistics in Auburn, males aged 5 years and females aged 5 years are the age groups that are most secure financially, with 100.0% of males and 100.0% of females in these age groups living above the poverty line.
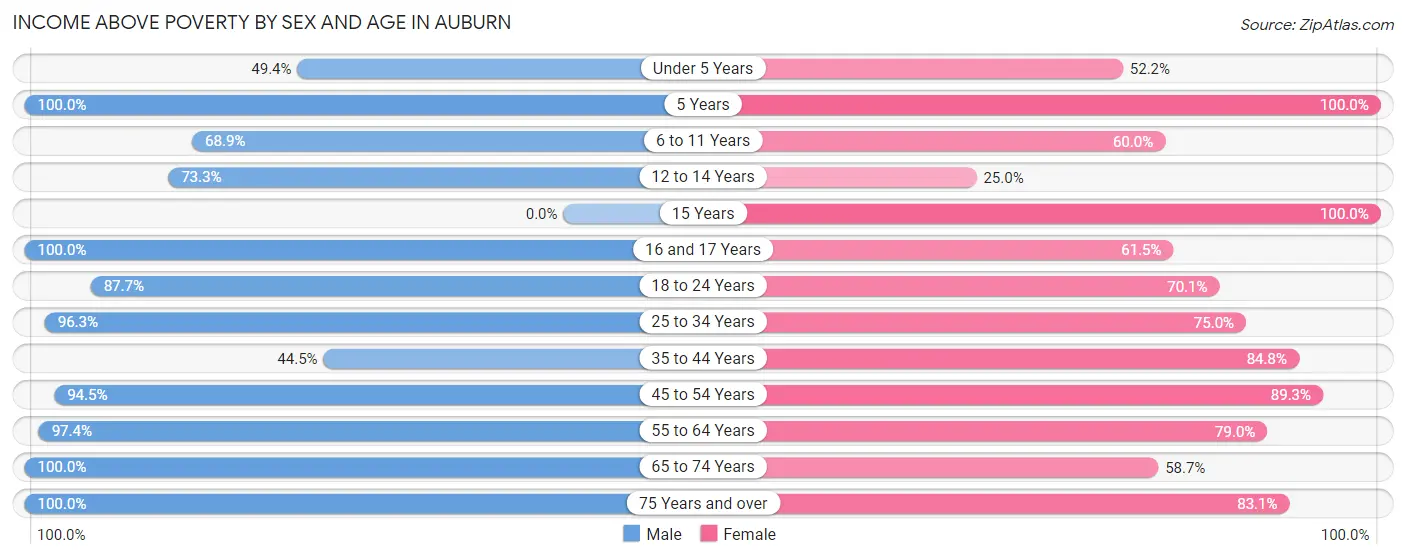
| Age Bracket | Male | Female |
| Under 5 Years | 39 (49.4%) | 12 (52.2%) |
| 5 Years | 1 (100.0%) | 25 (100.0%) |
| 6 to 11 Years | 62 (68.9%) | 30 (60.0%) |
| 12 to 14 Years | 11 (73.3%) | 2 (25.0%) |
| 15 Years | 0 (0.0%) | 3 (100.0%) |
| 16 and 17 Years | 9 (100.0%) | 8 (61.5%) |
| 18 to 24 Years | 150 (87.7%) | 89 (70.1%) |
| 25 to 34 Years | 77 (96.3%) | 57 (75.0%) |
| 35 to 44 Years | 53 (44.5%) | 67 (84.8%) |
| 45 to 54 Years | 120 (94.5%) | 50 (89.3%) |
| 55 to 64 Years | 37 (97.4%) | 45 (78.9%) |
| 65 to 74 Years | 46 (100.0%) | 37 (58.7%) |
| 75 Years and over | 49 (100.0%) | 147 (83.1%) |
| Total | 654 (78.6%) | 572 (75.6%) |
Income Below Poverty Among Married-Couple Families in Auburn
The poverty statistics for married-couple families in Auburn show that 4.3% or 8 of the total 185 families live below the poverty line. Families with 3 or 4 children have the highest poverty rate of 26.7%, comprising of 8 families. On the other hand, families with no children have the lowest poverty rate of 0.0%, which includes 0 families.
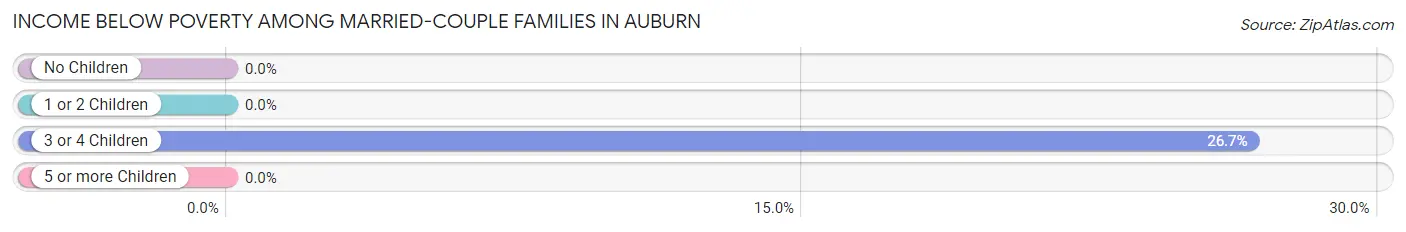
| Children | Above Poverty | Below Poverty |
| No Children | 109 (100.0%) | 0 (0.0%) |
| 1 or 2 Children | 46 (100.0%) | 0 (0.0%) |
| 3 or 4 Children | 22 (73.3%) | 8 (26.7%) |
| 5 or more Children | 0 (0.0%) | 0 (0.0%) |
| Total | 177 (95.7%) | 8 (4.3%) |
Income Below Poverty Among Single-Parent Households in Auburn
According to the poverty data in Auburn, 33.7% or 31 single-father households and 28.1% or 16 single-mother households are living below the poverty line. Among single-father households, those with 3 or 4 children have the highest poverty rate, with 21 households (100.0%) experiencing poverty. Likewise, among single-mother households, those with 3 or 4 children have the highest poverty rate, with 4 households (100.0%) falling below the poverty line.
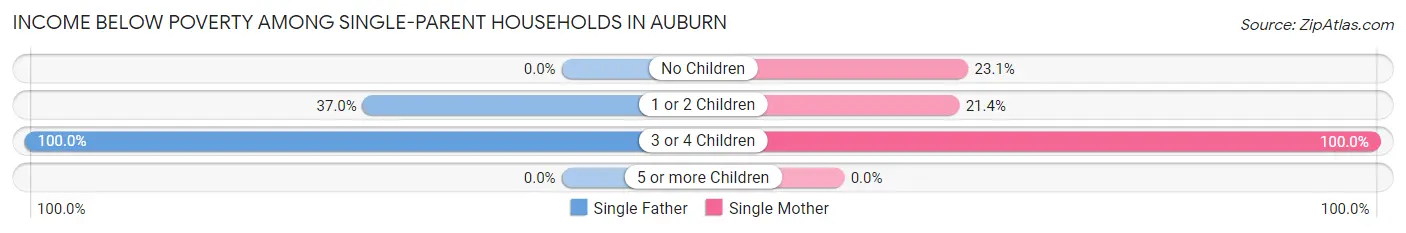
| Children | Single Father | Single Mother |
| No Children | 0 (0.0%) | 9 (23.1%) |
| 1 or 2 Children | 10 (37.0%) | 3 (21.4%) |
| 3 or 4 Children | 21 (100.0%) | 4 (100.0%) |
| 5 or more Children | 0 (0.0%) | 0 (0.0%) |
| Total | 31 (33.7%) | 16 (28.1%) |
Income Below Poverty Among Married-Couple vs Single-Parent Households in Auburn
The poverty data for Auburn shows that 8 of the married-couple family households (4.3%) and 47 of the single-parent households (31.5%) are living below the poverty level. Within the married-couple family households, those with 3 or 4 children have the highest poverty rate, with 8 households (26.7%) falling below the poverty line. Among the single-parent households, those with 3 or 4 children have the highest poverty rate, with 25 household (100.0%) living below poverty.
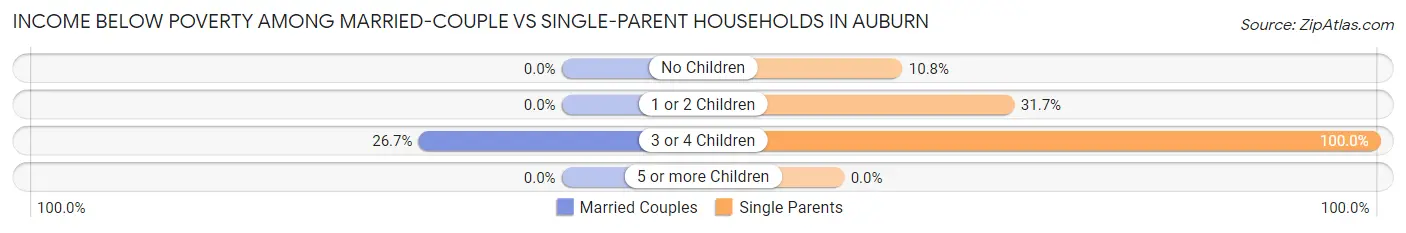
| Children | Married-Couple Families | Single-Parent Households |
| No Children | 0 (0.0%) | 9 (10.8%) |
| 1 or 2 Children | 0 (0.0%) | 13 (31.7%) |
| 3 or 4 Children | 8 (26.7%) | 25 (100.0%) |
| 5 or more Children | 0 (0.0%) | 0 (0.0%) |
| Total | 8 (4.3%) | 47 (31.5%) |
Race in Auburn
The most populous races in Auburn are White / Caucasian (1,393 | 84.7%), Two or more Races (124 | 7.5%), and Black / African American (117 | 7.1%).
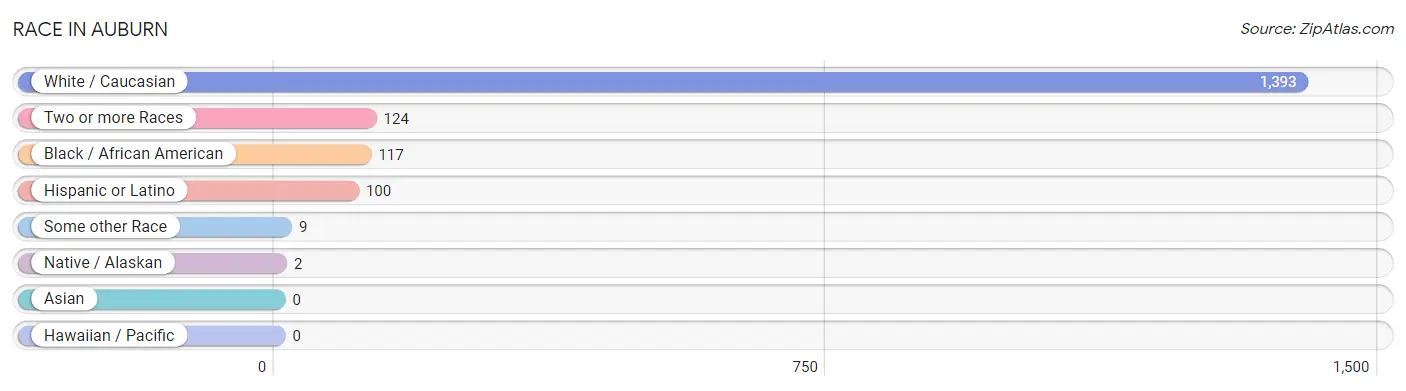
| Race | # Population | % Population |
| Asian | 0 | 0.0% |
| Black / African American | 117 | 7.1% |
| Hawaiian / Pacific | 0 | 0.0% |
| Hispanic or Latino | 100 | 6.1% |
| Native / Alaskan | 2 | 0.1% |
| White / Caucasian | 1,393 | 84.7% |
| Two or more Races | 124 | 7.5% |
| Some other Race | 9 | 0.5% |
| Total | 1,645 | 100.0% |
Ancestry in Auburn
The most populous ancestries reported in Auburn are American (331 | 20.1%), German (167 | 10.2%), English (80 | 4.9%), Irish (75 | 4.6%), and Cuban (48 | 2.9%), together accounting for 42.6% of all Auburn residents.
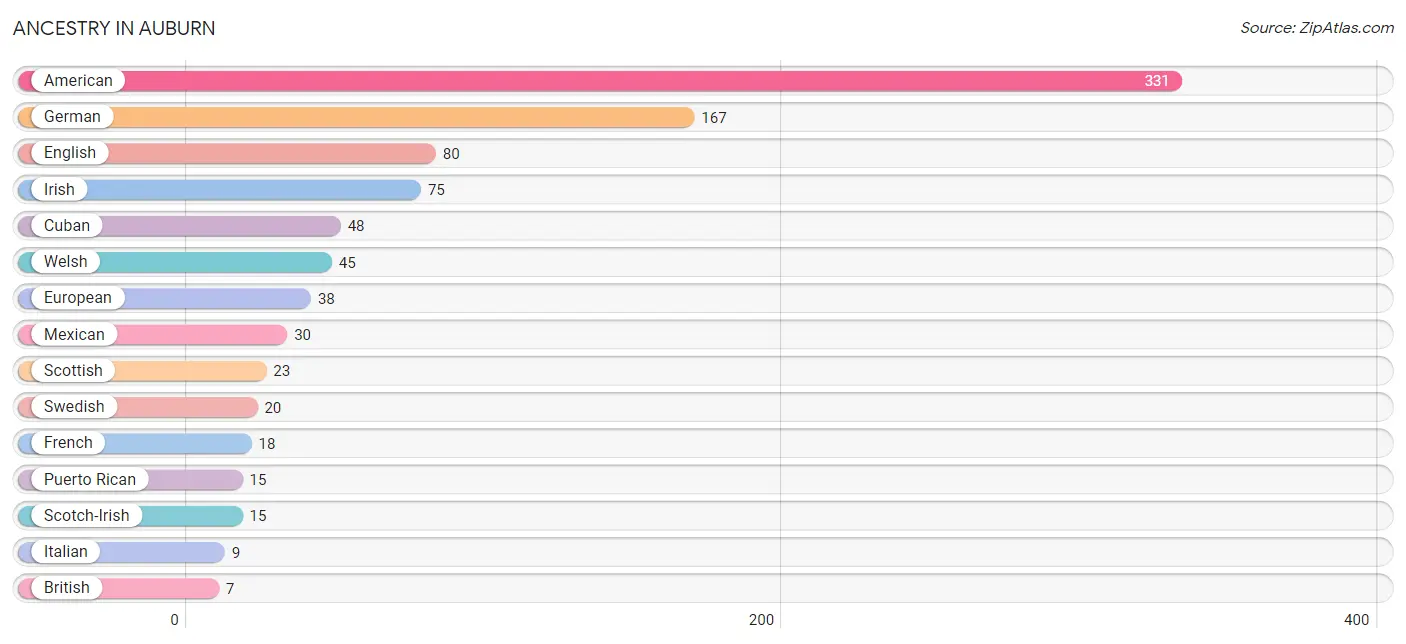
| Ancestry | # Population | % Population |
| African | 2 | 0.1% |
| American | 331 | 20.1% |
| British | 7 | 0.4% |
| Cherokee | 7 | 0.4% |
| Croatian | 1 | 0.1% |
| Cuban | 48 | 2.9% |
| Dutch | 4 | 0.2% |
| English | 80 | 4.9% |
| European | 38 | 2.3% |
| French | 18 | 1.1% |
| French Canadian | 3 | 0.2% |
| German | 167 | 10.2% |
| Irish | 75 | 4.6% |
| Italian | 9 | 0.5% |
| Mexican | 30 | 1.8% |
| Puerto Rican | 15 | 0.9% |
| Scandinavian | 5 | 0.3% |
| Scotch-Irish | 15 | 0.9% |
| Scottish | 23 | 1.4% |
| Subsaharan African | 2 | 0.1% |
| Swedish | 20 | 1.2% |
| Swiss | 7 | 0.4% |
| Welsh | 45 | 2.7% | View All 23 Rows |
Immigrants in Auburn
The most numerous immigrant groups reported in Auburn came from Caribbean (48 | 2.9%), Cuba (48 | 2.9%), Latin America (48 | 2.9%), Europe (3 | 0.2%), and Germany (3 | 0.2%), together accounting for 9.1% of all Auburn residents.
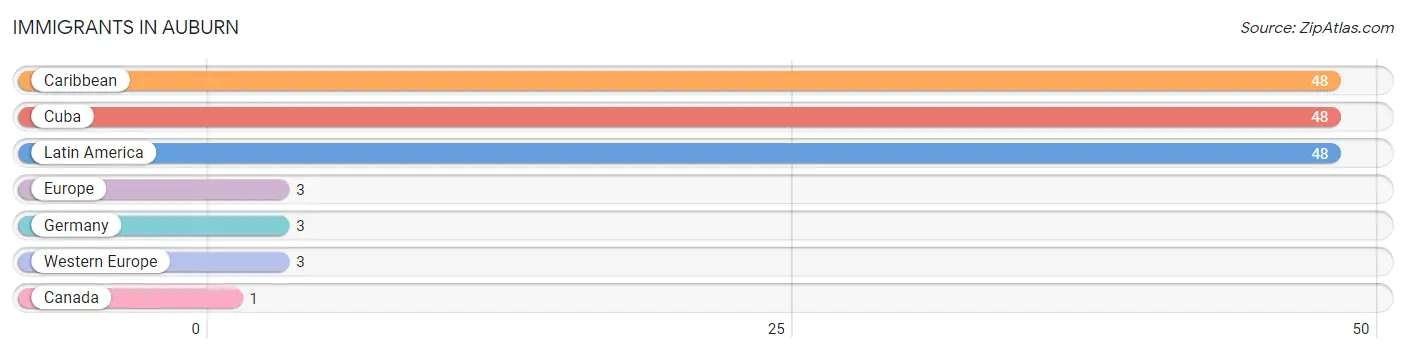
| Immigration Origin | # Population | % Population |
| Canada | 1 | 0.1% |
| Caribbean | 48 | 2.9% |
| Cuba | 48 | 2.9% |
| Europe | 3 | 0.2% |
| Germany | 3 | 0.2% |
| Latin America | 48 | 2.9% |
| Western Europe | 3 | 0.2% | View All 7 Rows |
Sex and Age in Auburn
Sex and Age in Auburn
The most populous age groups in Auburn are 20 to 24 Years (101 | 12.0%) for men and 75 to 79 Years (139 | 17.3%) for women.
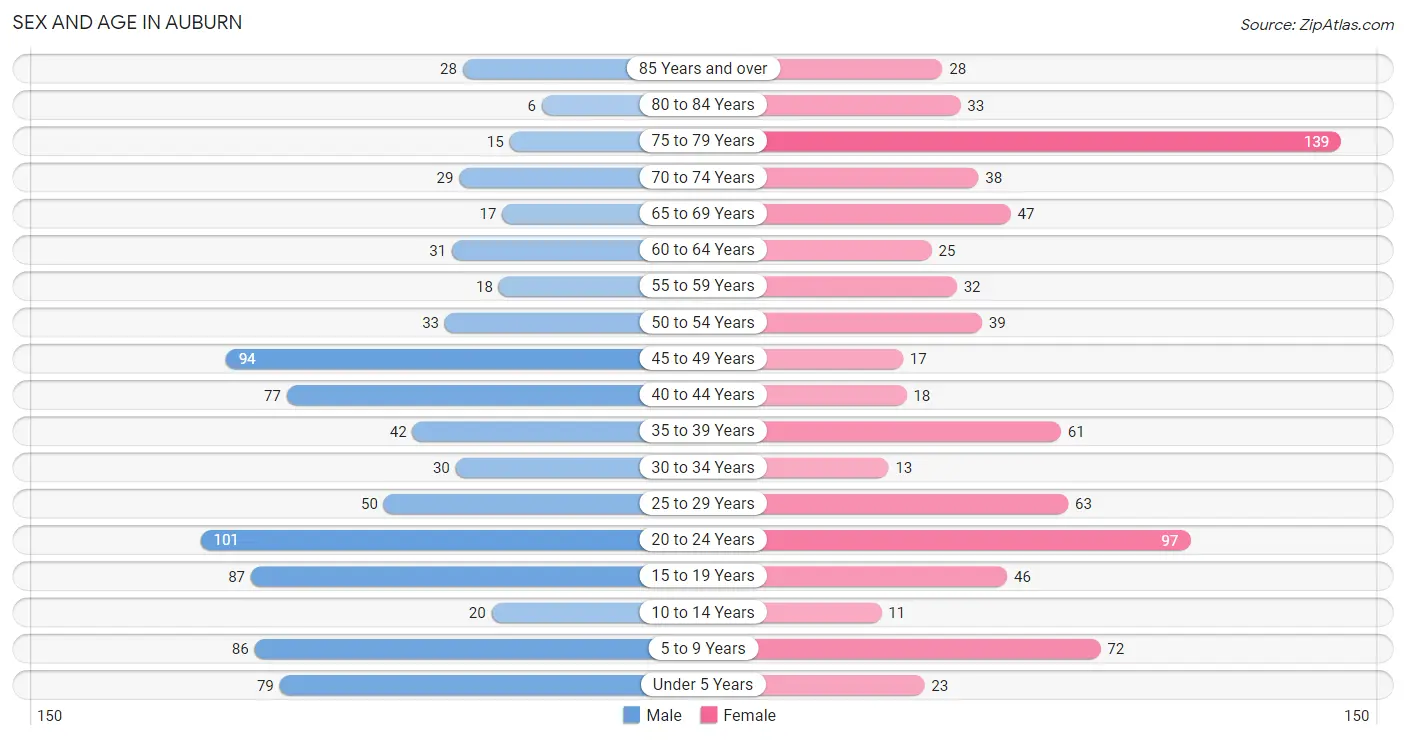
| Age Bracket | Male | Female |
| Under 5 Years | 79 (9.4%) | 23 (2.9%) |
| 5 to 9 Years | 86 (10.2%) | 72 (9.0%) |
| 10 to 14 Years | 20 (2.4%) | 11 (1.4%) |
| 15 to 19 Years | 87 (10.3%) | 46 (5.7%) |
| 20 to 24 Years | 101 (12.0%) | 97 (12.1%) |
| 25 to 29 Years | 50 (5.9%) | 63 (7.9%) |
| 30 to 34 Years | 30 (3.6%) | 13 (1.6%) |
| 35 to 39 Years | 42 (5.0%) | 61 (7.6%) |
| 40 to 44 Years | 77 (9.1%) | 18 (2.2%) |
| 45 to 49 Years | 94 (11.2%) | 17 (2.1%) |
| 50 to 54 Years | 33 (3.9%) | 39 (4.9%) |
| 55 to 59 Years | 18 (2.1%) | 32 (4.0%) |
| 60 to 64 Years | 31 (3.7%) | 25 (3.1%) |
| 65 to 69 Years | 17 (2.0%) | 47 (5.9%) |
| 70 to 74 Years | 29 (3.4%) | 38 (4.7%) |
| 75 to 79 Years | 15 (1.8%) | 139 (17.3%) |
| 80 to 84 Years | 6 (0.7%) | 33 (4.1%) |
| 85 Years and over | 28 (3.3%) | 28 (3.5%) |
| Total | 843 (100.0%) | 802 (100.0%) |
Families and Households in Auburn
Median Family Size in Auburn
The median family size in Auburn is 3.27 persons per family, with married-couple families (185 | 55.4%) accounting for the largest median family size of 3.38 persons per family. On the other hand, single female/mother families (57 | 17.1%) represent the smallest median family size with 2.98 persons per family.
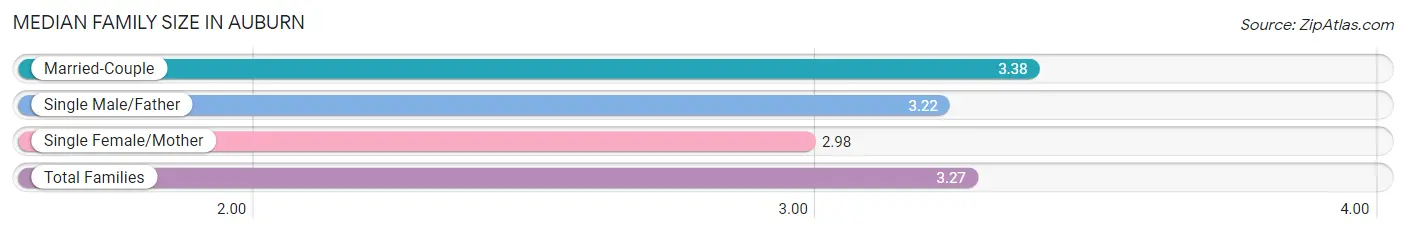
| Family Type | # Families | Family Size |
| Married-Couple | 185 (55.4%) | 3.38 |
| Single Male/Father | 92 (27.5%) | 3.22 |
| Single Female/Mother | 57 (17.1%) | 2.98 |
| Total Families | 334 (100.0%) | 3.27 |
Median Household Size in Auburn
The median household size in Auburn is 2.22 persons per household, with single male/father households (92 | 12.9%) accounting for the largest median household size of 3.51 persons per household. non-family households (382 | 53.3%) represent the smallest median household size with 1.12 persons per household.
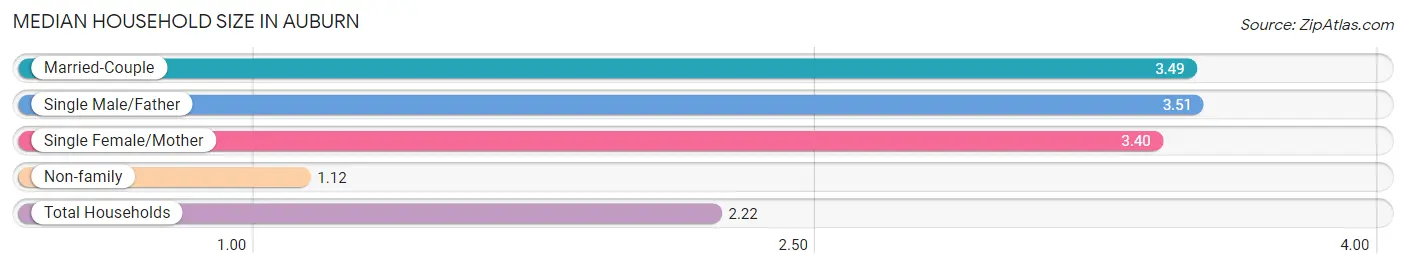
| Household Type | # Households | Household Size |
| Married-Couple | 185 (25.8%) | 3.49 |
| Single Male/Father | 92 (12.9%) | 3.51 |
| Single Female/Mother | 57 (8.0%) | 3.40 |
| Non-family | 382 (53.3%) | 1.12 |
| Total Households | 716 (100.0%) | 2.22 |
Household Size by Marriage Status in Auburn
Out of a total of 716 households in Auburn, 334 (46.7%) are family households, while 382 (53.3%) are nonfamily households. The most numerous type of family households are 2-person households, comprising 144, and the most common type of nonfamily households are 1-person households, comprising 344.
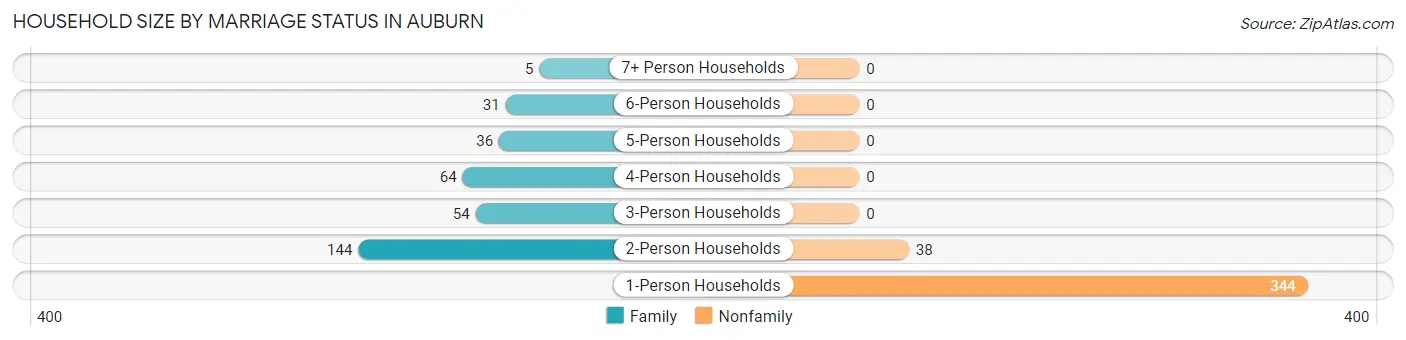
| Household Size | Family Households | Nonfamily Households |
| 1-Person Households | - | 344 (48.0%) |
| 2-Person Households | 144 (20.1%) | 38 (5.3%) |
| 3-Person Households | 54 (7.5%) | 0 (0.0%) |
| 4-Person Households | 64 (8.9%) | 0 (0.0%) |
| 5-Person Households | 36 (5.0%) | 0 (0.0%) |
| 6-Person Households | 31 (4.3%) | 0 (0.0%) |
| 7+ Person Households | 5 (0.7%) | 0 (0.0%) |
| Total | 334 (46.7%) | 382 (53.3%) |
Female Fertility in Auburn
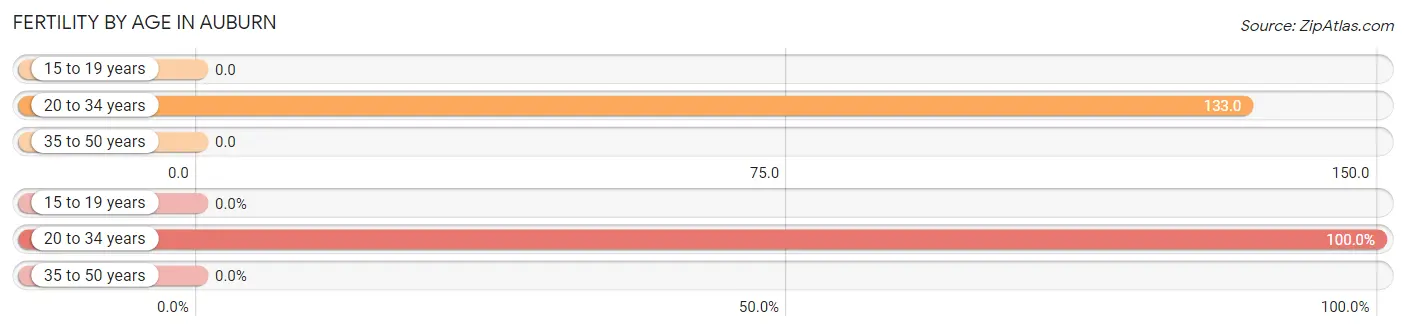
Fertility by Age in Auburn
Average fertility rate in Auburn is 71.0 births per 1,000 women. Women in the age bracket of 20 to 34 years have the highest fertility rate with 133.0 births per 1,000 women. Women in the age bracket of 20 to 34 years acount for 100.0% of all women with births.
| Age Bracket | Women with Births | Births / 1,000 Women |
| 15 to 19 years | 0 (0.0%) | 0.0 |
| 20 to 34 years | 23 (100.0%) | 133.0 |
| 35 to 50 years | 0 (0.0%) | 0.0 |
| Total | 23 (100.0%) | 71.0 |
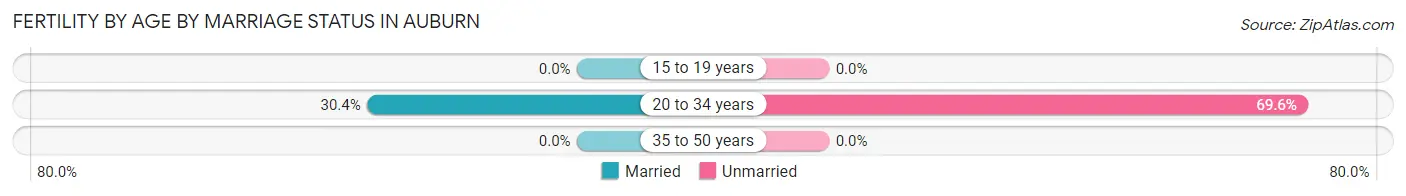
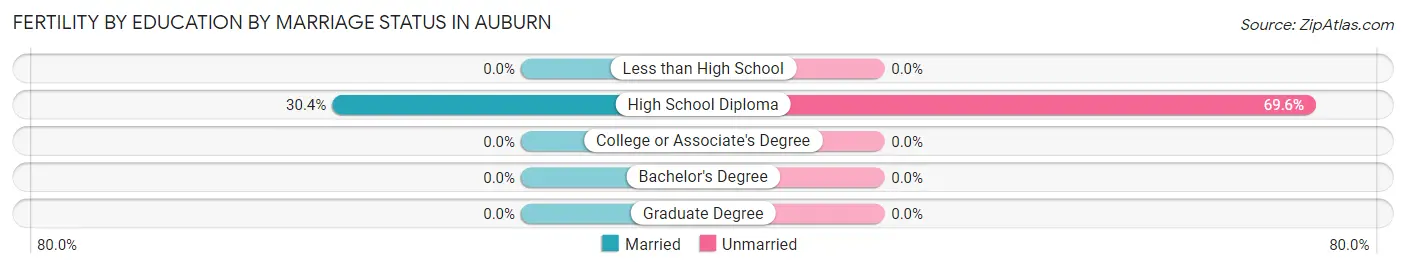
Fertility by Age by Marriage Status in Auburn
30.4% of women with births (23) in Auburn are married. The highest percentage of unmarried women with births falls into 20 to 34 years age bracket with 69.6% of them unmarried at the time of birth, while the lowest percentage of unmarried women with births belong to 20 to 34 years age bracket with 69.6% of them unmarried.
| Age Bracket | Married | Unmarried |
| 15 to 19 years | 0 (0.0%) | 0 (0.0%) |
| 20 to 34 years | 7 (30.4%) | 16 (69.6%) |
| 35 to 50 years | 0 (0.0%) | 0 (0.0%) |
| Total | 7 (30.4%) | 16 (69.6%) |
Fertility by Education in Auburn
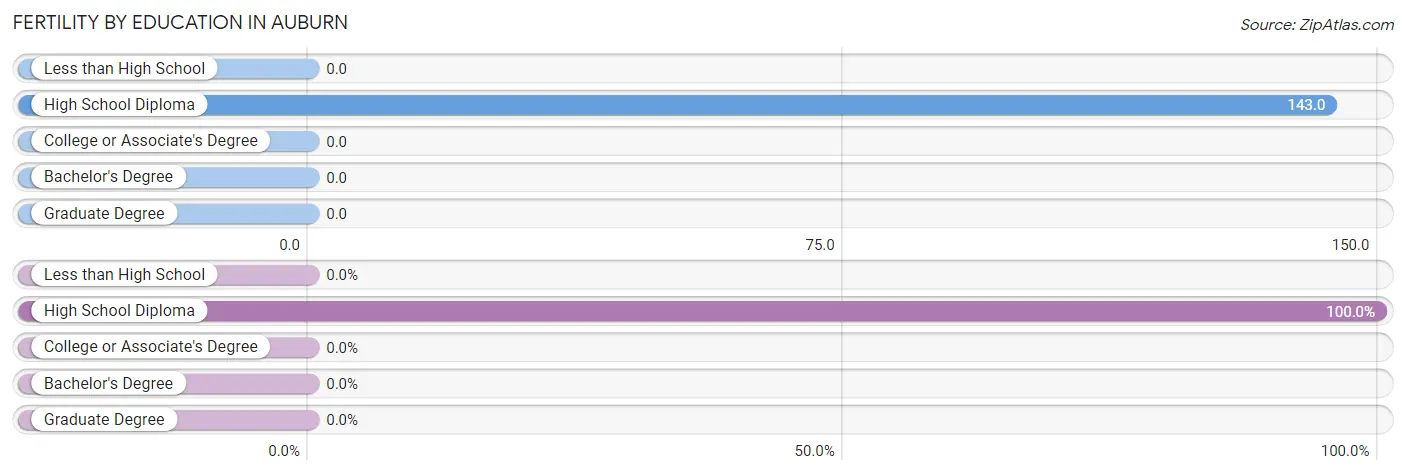
| Educational Attainment | Women with Births | Births / 1,000 Women |
| Less than High School | 0 (0.0%) | 0.0 |
| High School Diploma | 23 (100.0%) | 143.0 |
| College or Associate's Degree | 0 (0.0%) | 0.0 |
| Bachelor's Degree | 0 (0.0%) | 0.0 |
| Graduate Degree | 0 (0.0%) | 0.0 |
| Total | 23 (100.0%) | 71.0 |
Fertility by Education by Marriage Status in Auburn
69.6% of women with births in Auburn are unmarried. Women with the educational attainment of high school diploma are most likely to be married with 30.4% of them married at childbirth, while women with the educational attainment of high school diploma are least likely to be married with 69.6% of them unmarried at childbirth.
| Educational Attainment | Married | Unmarried |
| Less than High School | 0 (0.0%) | 0 (0.0%) |
| High School Diploma | 7 (30.4%) | 16 (69.6%) |
| College or Associate's Degree | 0 (0.0%) | 0 (0.0%) |
| Bachelor's Degree | 0 (0.0%) | 0 (0.0%) |
| Graduate Degree | 0 (0.0%) | 0 (0.0%) |
| Total | 7 (30.4%) | 16 (69.6%) |
Employment Characteristics in Auburn
Employment by Class of Employer in Auburn
Among the 707 employed individuals in Auburn, private company employees (584 | 82.6%), not-for-profit organizations (43 | 6.1%), and local government employees (29 | 4.1%) make up the most common classes of employment.
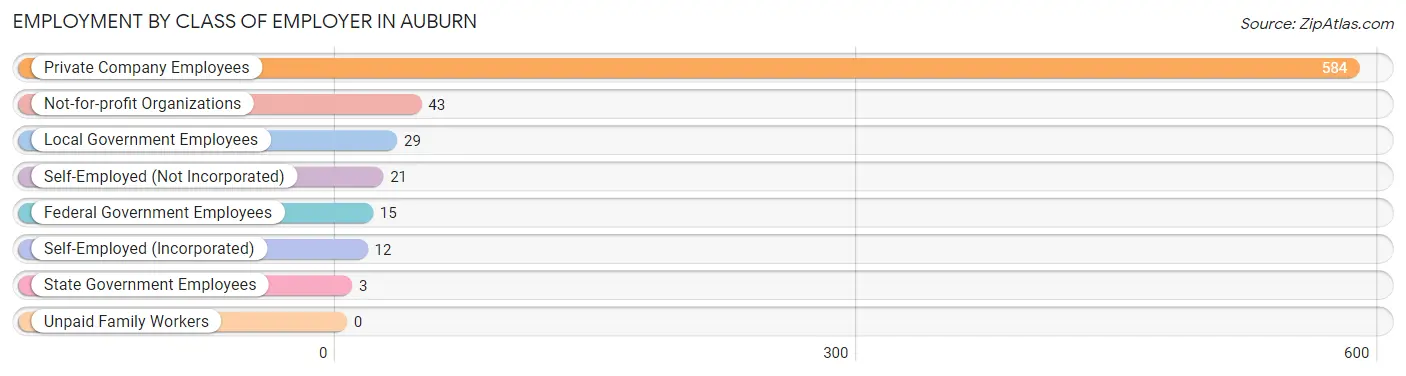
| Employer Class | # Employees | % Employees |
| Private Company Employees | 584 | 82.6% |
| Self-Employed (Incorporated) | 12 | 1.7% |
| Self-Employed (Not Incorporated) | 21 | 3.0% |
| Not-for-profit Organizations | 43 | 6.1% |
| Local Government Employees | 29 | 4.1% |
| State Government Employees | 3 | 0.4% |
| Federal Government Employees | 15 | 2.1% |
| Unpaid Family Workers | 0 | 0.0% |
| Total | 707 | 100.0% |
Employment Status by Age in Auburn
According to the labor force statistics for Auburn, out of the total population over 16 years of age (1,343), 58.7% or 788 individuals are in the labor force, with 8.8% or 69 of them unemployed. The age group with the highest labor force participation rate is 30 to 34 years, with 100.0% or 43 individuals in the labor force. Within the labor force, the 35 to 44 years age range has the highest percentage of unemployed individuals, with 28.2% or 48 of them being unemployed.
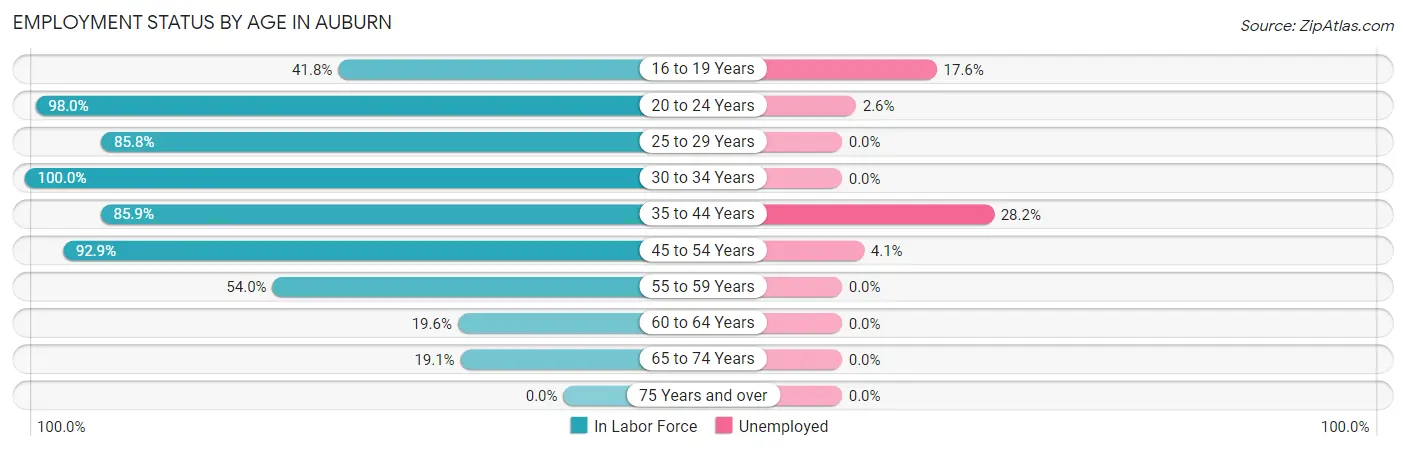
| Age Bracket | In Labor Force | Unemployed |
| 16 to 19 Years | 51 (41.8%) | 9 (17.6%) |
| 20 to 24 Years | 194 (98.0%) | 5 (2.6%) |
| 25 to 29 Years | 97 (85.8%) | 0 (0.0%) |
| 30 to 34 Years | 43 (100.0%) | 0 (0.0%) |
| 35 to 44 Years | 170 (85.9%) | 48 (28.2%) |
| 45 to 54 Years | 170 (92.9%) | 7 (4.1%) |
| 55 to 59 Years | 27 (54.0%) | 0 (0.0%) |
| 60 to 64 Years | 11 (19.6%) | 0 (0.0%) |
| 65 to 74 Years | 25 (19.1%) | 0 (0.0%) |
| 75 Years and over | 0 (0.0%) | 0 (0.0%) |
| Total | 788 (58.7%) | 69 (8.8%) |
Employment Status by Educational Attainment in Auburn
According to labor force statistics for Auburn, 80.6% of individuals (518) out of the total population between 25 and 64 years of age (643) are in the labor force, with 10.6% or 55 of them being unemployed. The group with the highest labor force participation rate are those with the educational attainment of less than high school, with 100.0% or 20 individuals in the labor force. Within the labor force, individuals with high school diploma education have the highest percentage of unemployment, with 24.5% or 48 of them being unemployed.
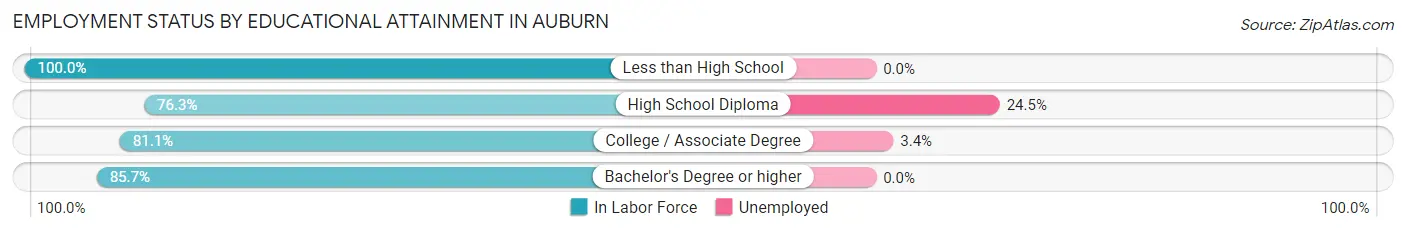
| Educational Attainment | In Labor Force | Unemployed |
| Less than High School | 20 (100.0%) | 0 (0.0%) |
| High School Diploma | 196 (76.3%) | 63 (24.5%) |
| College / Associate Degree | 206 (81.1%) | 9 (3.4%) |
| Bachelor's Degree or higher | 96 (85.7%) | 0 (0.0%) |
| Total | 518 (80.6%) | 68 (10.6%) |
Employment Occupations by Sex in Auburn
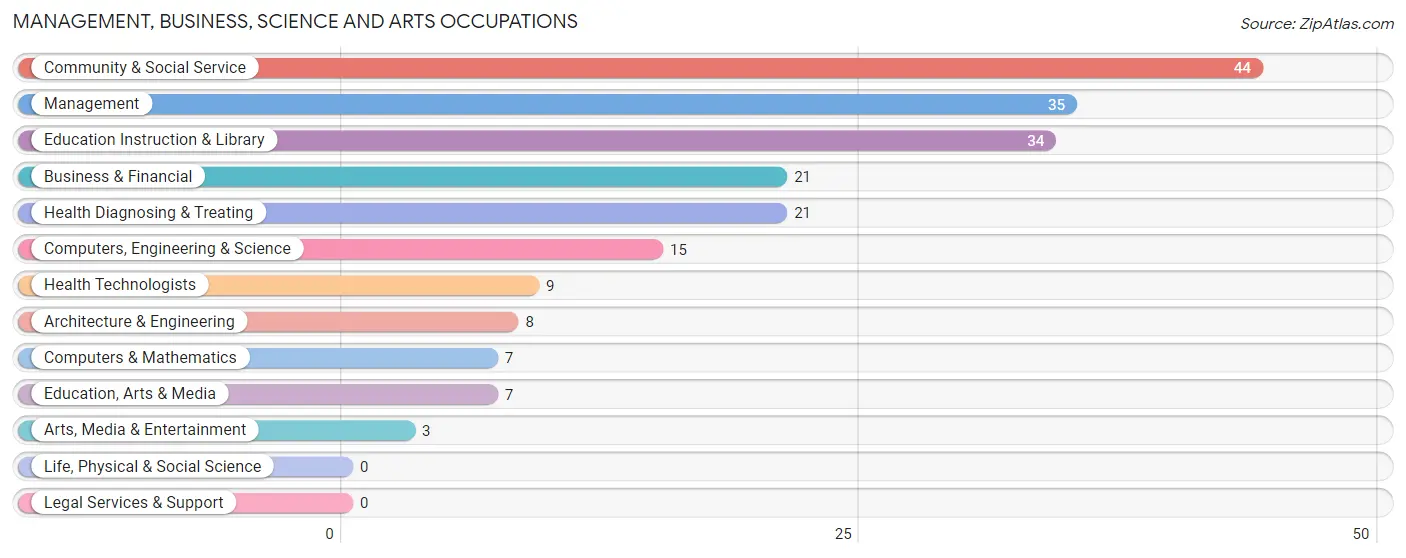
Management, Business, Science and Arts Occupations
The most common Management, Business, Science and Arts occupations in Auburn are Community & Social Service (44 | 6.1%), Management (35 | 4.9%), Education Instruction & Library (34 | 4.7%), Business & Financial (21 | 2.9%), and Health Diagnosing & Treating (21 | 2.9%).
Management, Business, Science and Arts Occupations by Sex
Within the Management, Business, Science and Arts occupations in Auburn, the most male-oriented occupations are Arts, Media & Entertainment (100.0%), Business & Financial (90.5%), and Architecture & Engineering (62.5%), while the most female-oriented occupations are Education, Arts & Media (100.0%), Health Diagnosing & Treating (76.2%), and Management (65.7%).
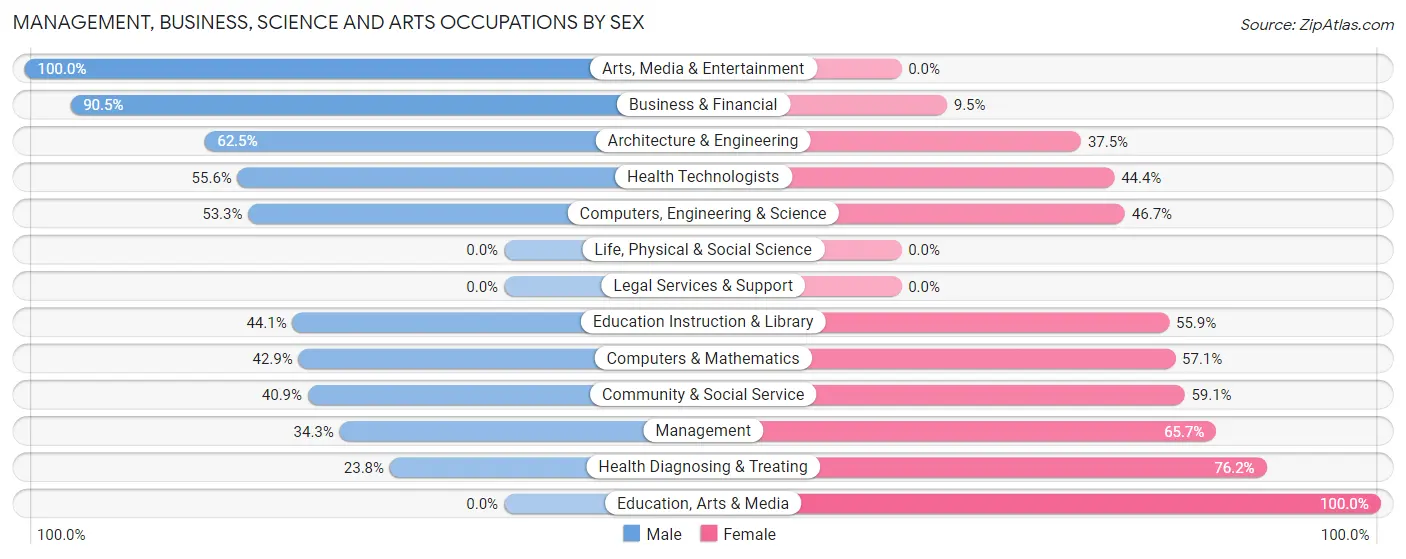
| Occupation | Male | Female |
| Management | 12 (34.3%) | 23 (65.7%) |
| Business & Financial | 19 (90.5%) | 2 (9.5%) |
| Computers, Engineering & Science | 8 (53.3%) | 7 (46.7%) |
| Computers & Mathematics | 3 (42.9%) | 4 (57.1%) |
| Architecture & Engineering | 5 (62.5%) | 3 (37.5%) |
| Life, Physical & Social Science | 0 (0.0%) | 0 (0.0%) |
| Community & Social Service | 18 (40.9%) | 26 (59.1%) |
| Education, Arts & Media | 0 (0.0%) | 7 (100.0%) |
| Legal Services & Support | 0 (0.0%) | 0 (0.0%) |
| Education Instruction & Library | 15 (44.1%) | 19 (55.9%) |
| Arts, Media & Entertainment | 3 (100.0%) | 0 (0.0%) |
| Health Diagnosing & Treating | 5 (23.8%) | 16 (76.2%) |
| Health Technologists | 5 (55.6%) | 4 (44.4%) |
| Total (Category) | 62 (45.6%) | 74 (54.4%) |
| Total (Overall) | 404 (56.2%) | 315 (43.8%) |
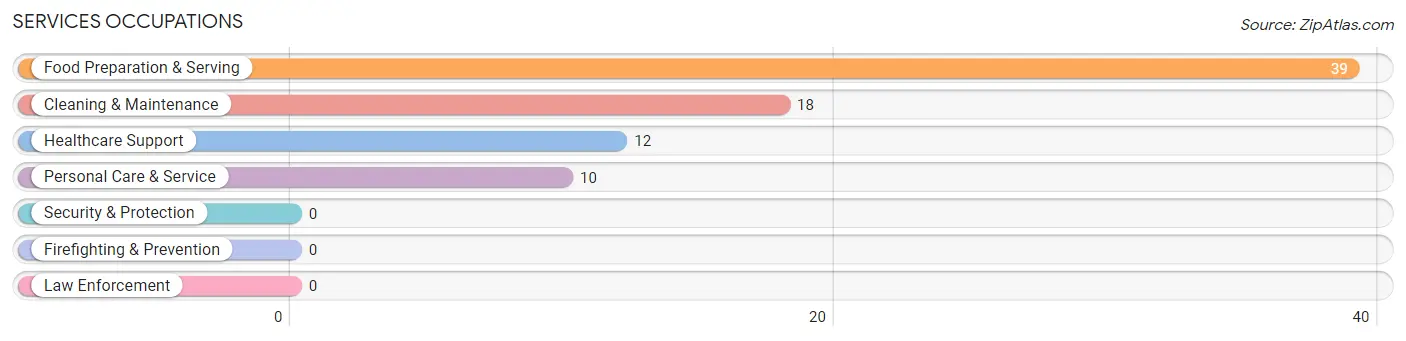
Services Occupations
The most common Services occupations in Auburn are Food Preparation & Serving (39 | 5.4%), Cleaning & Maintenance (18 | 2.5%), Healthcare Support (12 | 1.7%), and Personal Care & Service (10 | 1.4%).
Services Occupations by Sex
Within the Services occupations in Auburn, the most male-oriented occupations are Cleaning & Maintenance (83.3%), and Food Preparation & Serving (43.6%), while the most female-oriented occupations are Healthcare Support (100.0%), Personal Care & Service (100.0%), and Food Preparation & Serving (56.4%).
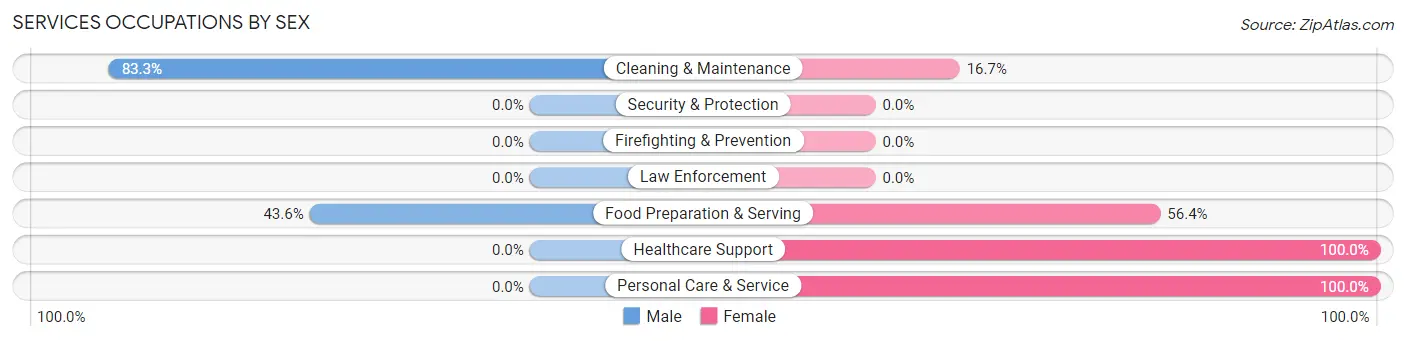
| Occupation | Male | Female |
| Healthcare Support | 0 (0.0%) | 12 (100.0%) |
| Security & Protection | 0 (0.0%) | 0 (0.0%) |
| Firefighting & Prevention | 0 (0.0%) | 0 (0.0%) |
| Law Enforcement | 0 (0.0%) | 0 (0.0%) |
| Food Preparation & Serving | 17 (43.6%) | 22 (56.4%) |
| Cleaning & Maintenance | 15 (83.3%) | 3 (16.7%) |
| Personal Care & Service | 0 (0.0%) | 10 (100.0%) |
| Total (Category) | 32 (40.5%) | 47 (59.5%) |
| Total (Overall) | 404 (56.2%) | 315 (43.8%) |
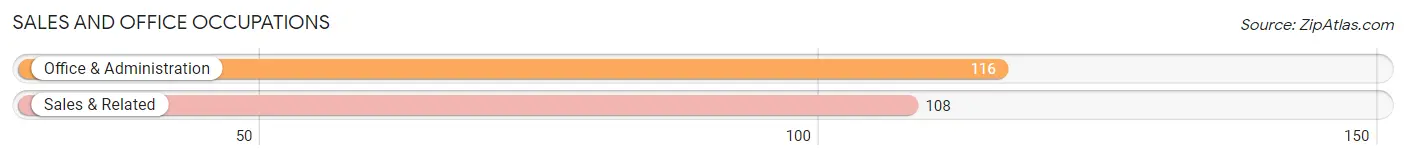
Sales and Office Occupations
The most common Sales and Office occupations in Auburn are Office & Administration (116 | 16.1%), and Sales & Related (108 | 15.0%).
Sales and Office Occupations by Sex
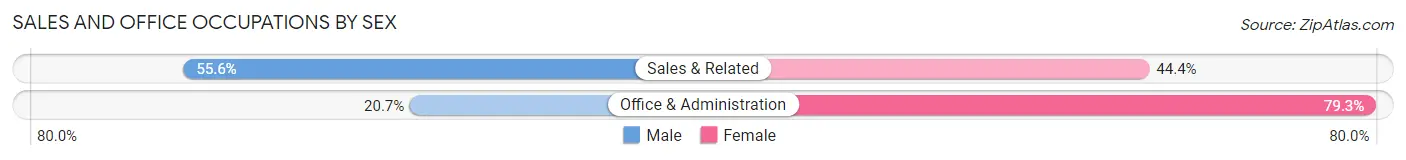
| Occupation | Male | Female |
| Sales & Related | 60 (55.6%) | 48 (44.4%) |
| Office & Administration | 24 (20.7%) | 92 (79.3%) |
| Total (Category) | 84 (37.5%) | 140 (62.5%) |
| Total (Overall) | 404 (56.2%) | 315 (43.8%) |
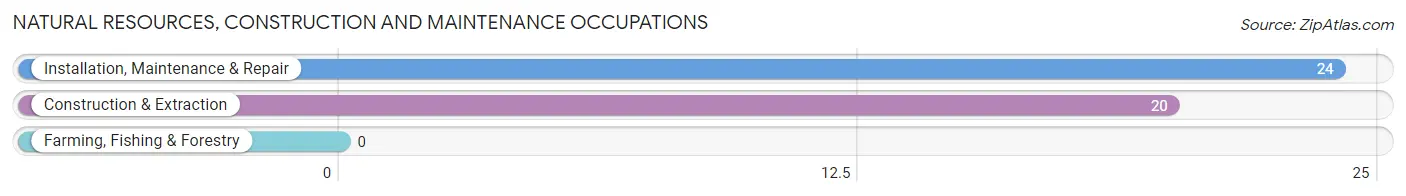
Natural Resources, Construction and Maintenance Occupations
The most common Natural Resources, Construction and Maintenance occupations in Auburn are Installation, Maintenance & Repair (24 | 3.3%), and Construction & Extraction (20 | 2.8%).
Natural Resources, Construction and Maintenance Occupations by Sex
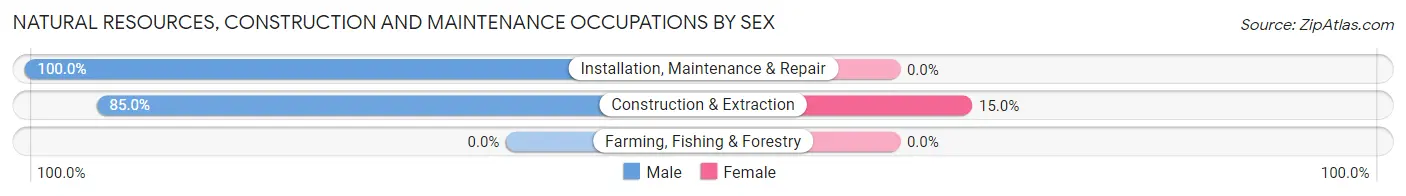
| Occupation | Male | Female |
| Farming, Fishing & Forestry | 0 (0.0%) | 0 (0.0%) |
| Construction & Extraction | 17 (85.0%) | 3 (15.0%) |
| Installation, Maintenance & Repair | 24 (100.0%) | 0 (0.0%) |
| Total (Category) | 41 (93.2%) | 3 (6.8%) |
| Total (Overall) | 404 (56.2%) | 315 (43.8%) |
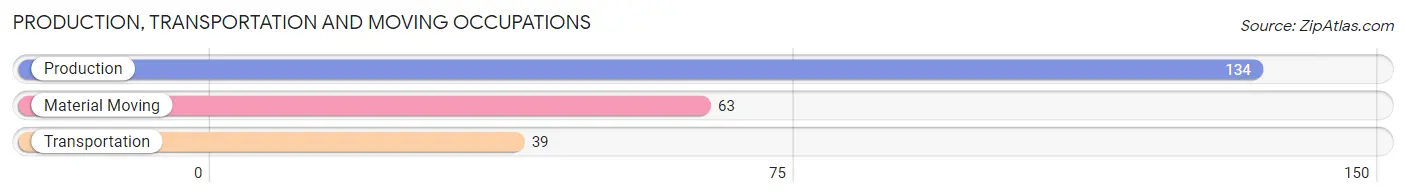
Production, Transportation and Moving Occupations
The most common Production, Transportation and Moving occupations in Auburn are Production (134 | 18.6%), Material Moving (63 | 8.8%), and Transportation (39 | 5.4%).
Production, Transportation and Moving Occupations by Sex
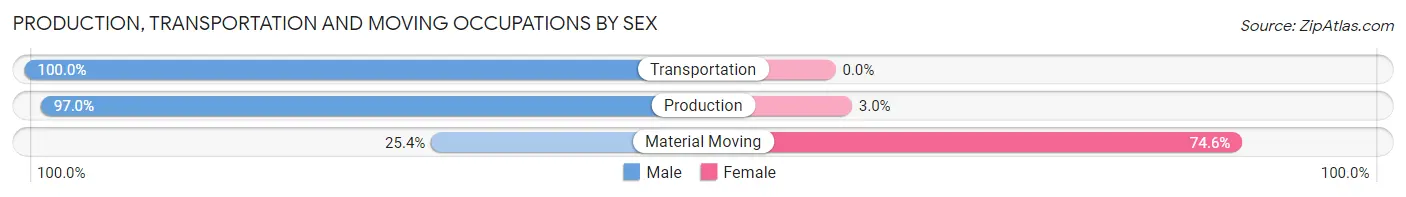
| Occupation | Male | Female |
| Production | 130 (97.0%) | 4 (3.0%) |
| Transportation | 39 (100.0%) | 0 (0.0%) |
| Material Moving | 16 (25.4%) | 47 (74.6%) |
| Total (Category) | 185 (78.4%) | 51 (21.6%) |
| Total (Overall) | 404 (56.2%) | 315 (43.8%) |
Employment Industries by Sex in Auburn
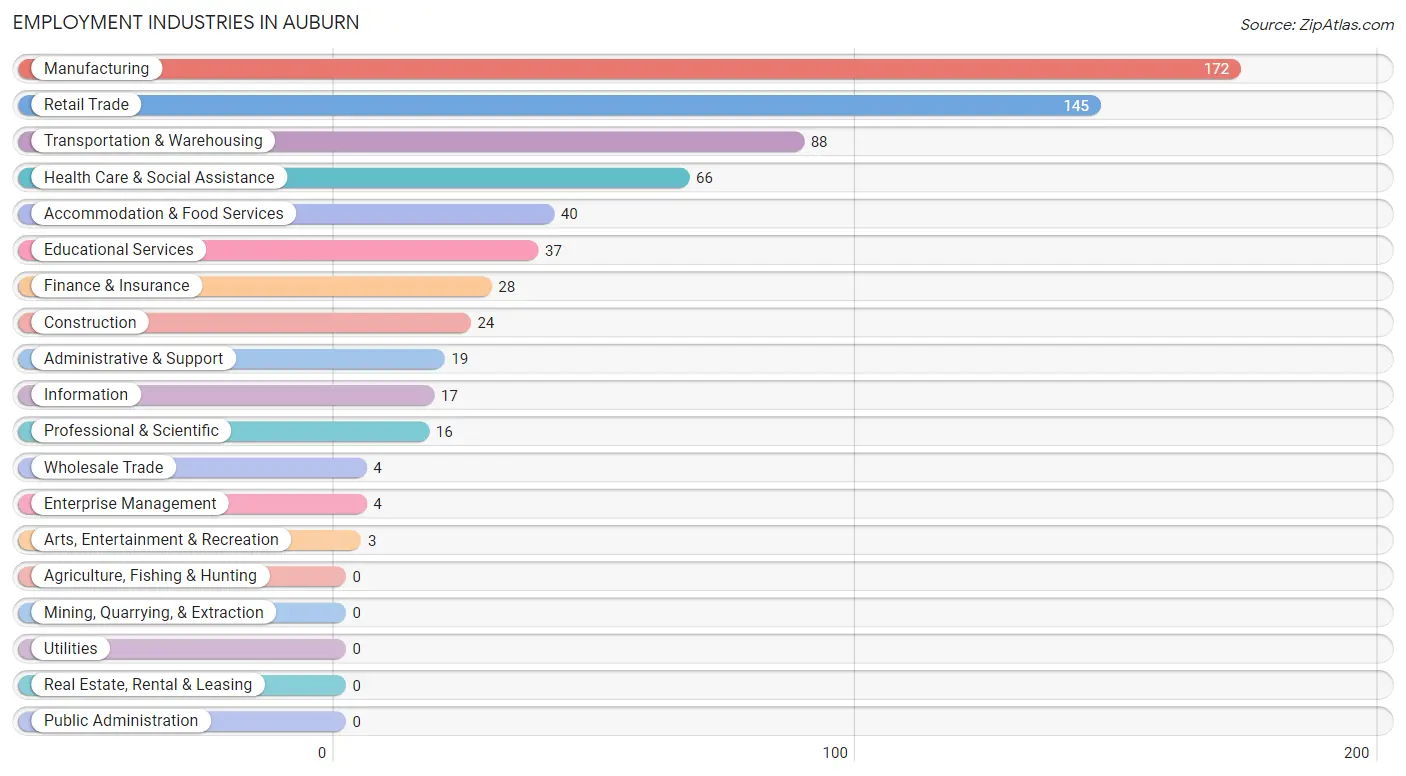
Employment Industries in Auburn
The major employment industries in Auburn include Manufacturing (172 | 23.9%), Retail Trade (145 | 20.2%), Transportation & Warehousing (88 | 12.2%), Health Care & Social Assistance (66 | 9.2%), and Accommodation & Food Services (40 | 5.6%).
Employment Industries by Sex in Auburn
The Auburn industries that see more men than women are Wholesale Trade (100.0%), Enterprise Management (100.0%), and Arts, Entertainment & Recreation (100.0%), whereas the industries that tend to have a higher number of women are Finance & Insurance (100.0%), Health Care & Social Assistance (81.8%), and Professional & Scientific (81.2%).
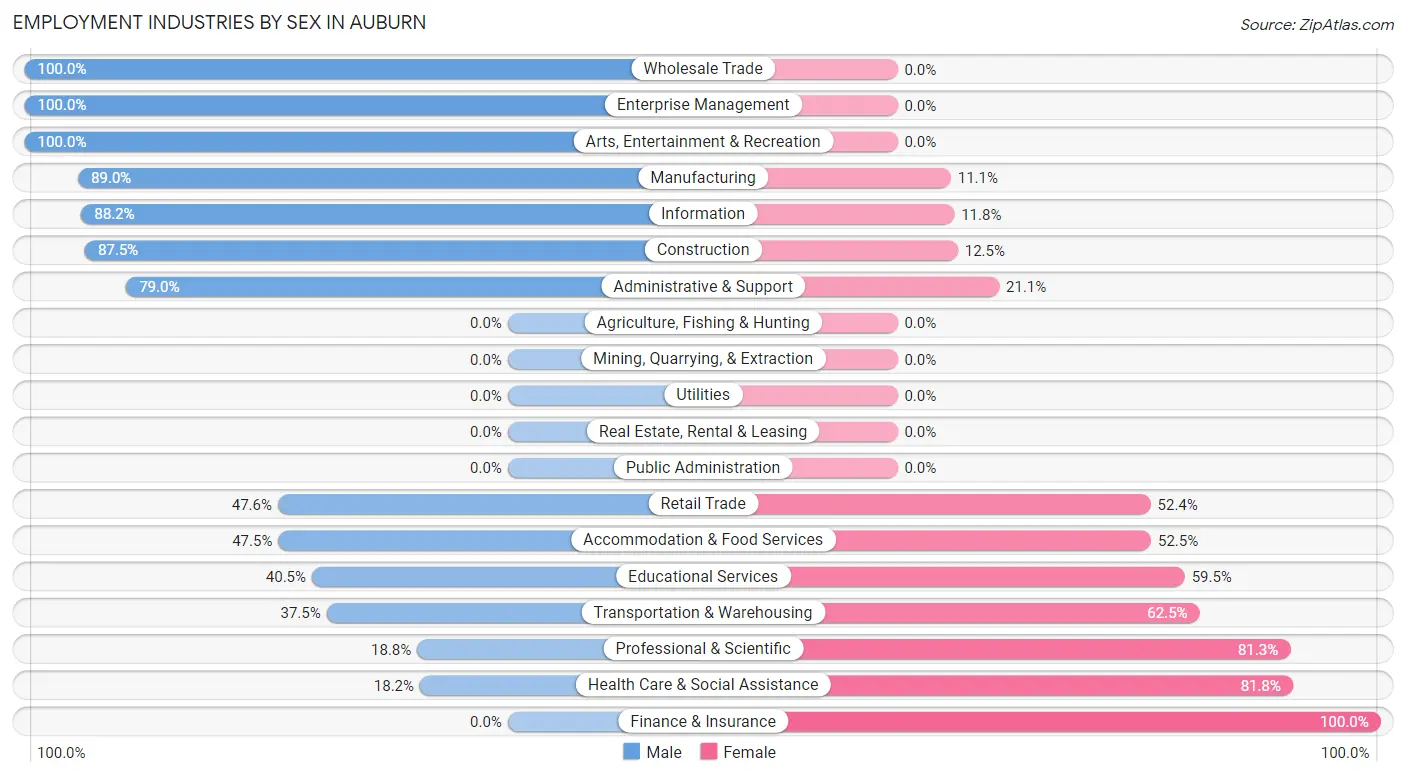
| Industry | Male | Female |
| Agriculture, Fishing & Hunting | 0 (0.0%) | 0 (0.0%) |
| Mining, Quarrying, & Extraction | 0 (0.0%) | 0 (0.0%) |
| Construction | 21 (87.5%) | 3 (12.5%) |
| Manufacturing | 153 (88.9%) | 19 (11.1%) |
| Wholesale Trade | 4 (100.0%) | 0 (0.0%) |
| Retail Trade | 69 (47.6%) | 76 (52.4%) |
| Transportation & Warehousing | 33 (37.5%) | 55 (62.5%) |
| Utilities | 0 (0.0%) | 0 (0.0%) |
| Information | 15 (88.2%) | 2 (11.8%) |
| Finance & Insurance | 0 (0.0%) | 28 (100.0%) |
| Real Estate, Rental & Leasing | 0 (0.0%) | 0 (0.0%) |
| Professional & Scientific | 3 (18.8%) | 13 (81.2%) |
| Enterprise Management | 4 (100.0%) | 0 (0.0%) |
| Administrative & Support | 15 (78.9%) | 4 (21.0%) |
| Educational Services | 15 (40.5%) | 22 (59.5%) |
| Health Care & Social Assistance | 12 (18.2%) | 54 (81.8%) |
| Arts, Entertainment & Recreation | 3 (100.0%) | 0 (0.0%) |
| Accommodation & Food Services | 19 (47.5%) | 21 (52.5%) |
| Public Administration | 0 (0.0%) | 0 (0.0%) |
| Total | 404 (56.2%) | 315 (43.8%) |
Education in Auburn
School Enrollment in Auburn
The most common levels of schooling among the 245 students in Auburn are elementary school (121 | 49.4%), high school (34 | 13.9%), and kindergarten (30 | 12.2%).
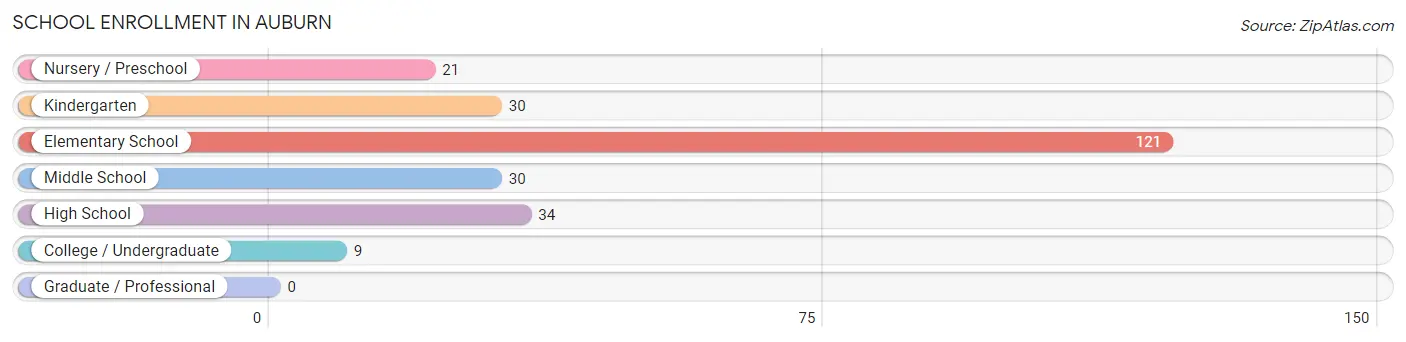
| School Level | # Students | % Students |
| Nursery / Preschool | 21 | 8.6% |
| Kindergarten | 30 | 12.2% |
| Elementary School | 121 | 49.4% |
| Middle School | 30 | 12.2% |
| High School | 34 | 13.9% |
| College / Undergraduate | 9 | 3.7% |
| Graduate / Professional | 0 | 0.0% |
| Total | 245 | 100.0% |
School Enrollment by Age by Funding Source in Auburn
Out of a total of 245 students who are enrolled in schools in Auburn, 13 (5.3%) attend a private institution, while the remaining 232 (94.7%) are enrolled in public schools. The age group of 20 to 24 year olds has the highest likelihood of being enrolled in private schools, with 9 (100.0% in the age bracket) enrolled. Conversely, the age group of 3 to 4 year olds has the lowest likelihood of being enrolled in a private school, with 21 (100.0% in the age bracket) attending a public institution.
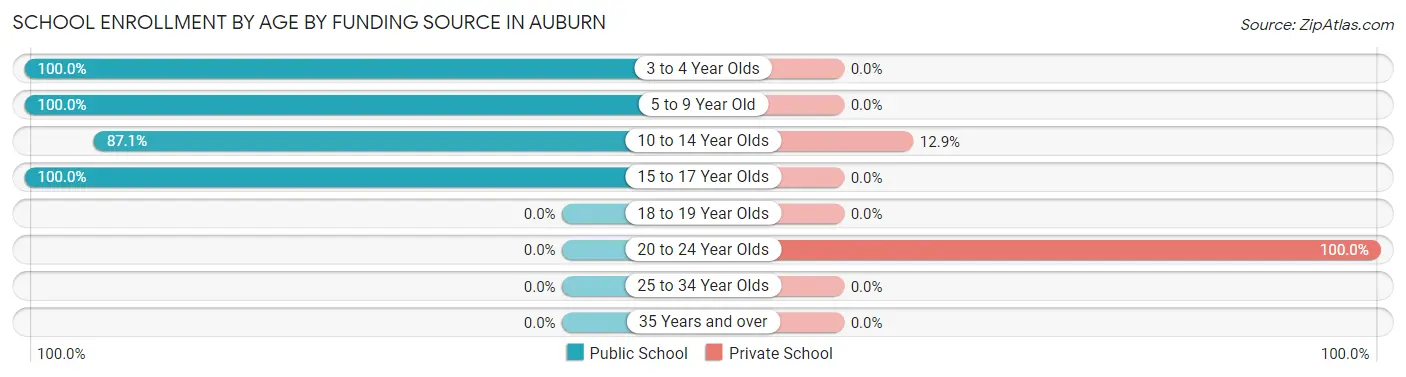
| Age Bracket | Public School | Private School |
| 3 to 4 Year Olds | 21 (100.0%) | 0 (0.0%) |
| 5 to 9 Year Old | 151 (100.0%) | 0 (0.0%) |
| 10 to 14 Year Olds | 27 (87.1%) | 4 (12.9%) |
| 15 to 17 Year Olds | 33 (100.0%) | 0 (0.0%) |
| 18 to 19 Year Olds | 0 (0.0%) | 0 (0.0%) |
| 20 to 24 Year Olds | 0 (0.0%) | 9 (100.0%) |
| 25 to 34 Year Olds | 0 (0.0%) | 0 (0.0%) |
| 35 Years and over | 0 (0.0%) | 0 (0.0%) |
| Total | 232 (94.7%) | 13 (5.3%) |
Educational Attainment by Field of Study in Auburn
Education (60 | 31.1%), bio, nature & agricultural (36 | 18.6%), business (22 | 11.4%), arts & humanities (22 | 11.4%), and visual & performing arts (17 | 8.8%) are the most common fields of study among 193 individuals in Auburn who have obtained a bachelor's degree or higher.
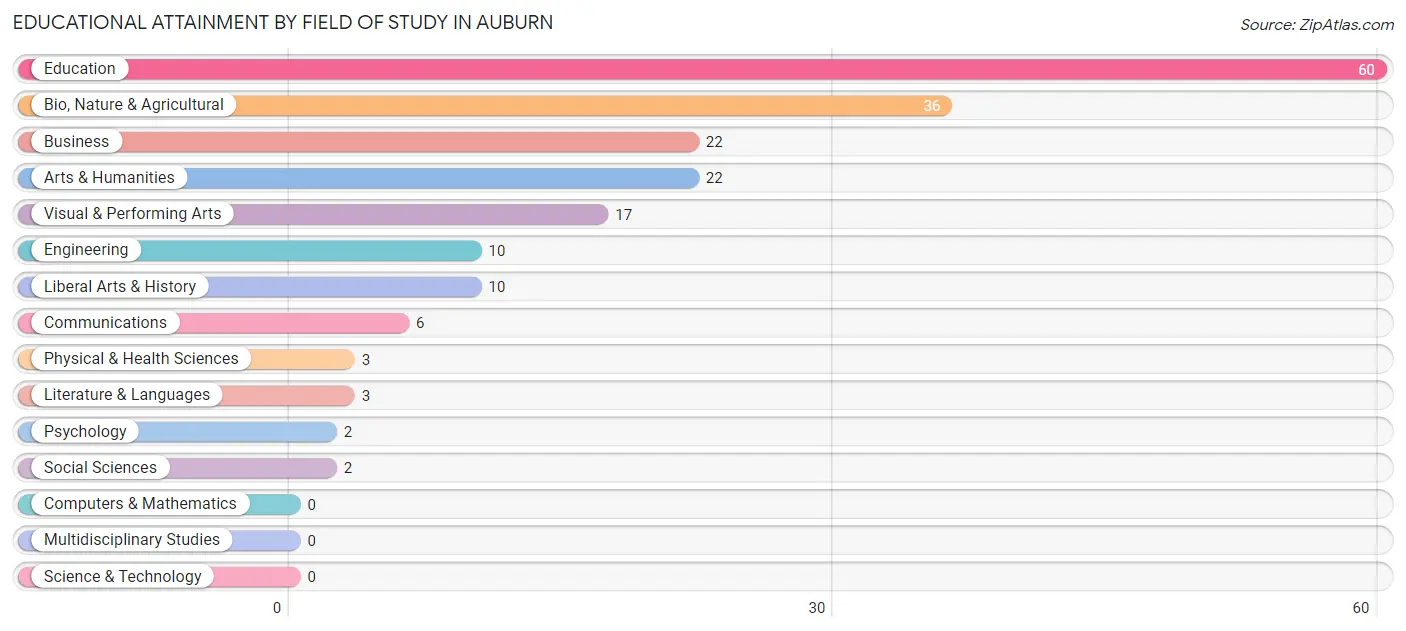
| Field of Study | # Graduates | % Graduates |
| Computers & Mathematics | 0 | 0.0% |
| Bio, Nature & Agricultural | 36 | 18.6% |
| Physical & Health Sciences | 3 | 1.5% |
| Psychology | 2 | 1.0% |
| Social Sciences | 2 | 1.0% |
| Engineering | 10 | 5.2% |
| Multidisciplinary Studies | 0 | 0.0% |
| Science & Technology | 0 | 0.0% |
| Business | 22 | 11.4% |
| Education | 60 | 31.1% |
| Literature & Languages | 3 | 1.5% |
| Liberal Arts & History | 10 | 5.2% |
| Visual & Performing Arts | 17 | 8.8% |
| Communications | 6 | 3.1% |
| Arts & Humanities | 22 | 11.4% |
| Total | 193 | 100.0% |
Transportation & Commute in Auburn
Vehicle Availability by Sex in Auburn
The most prevalent vehicle ownership categories in Auburn are males with 2 vehicles (250, accounting for 63.4%) and females with 2 vehicles (148, making up 79.9%).
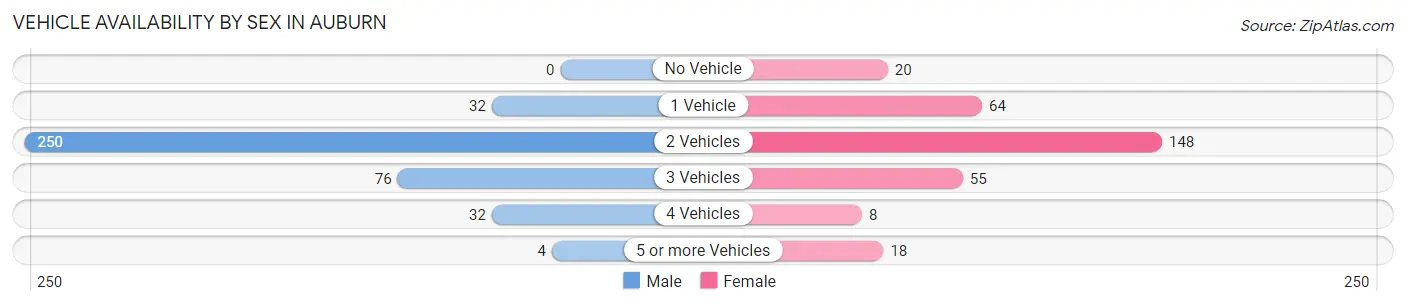
| Vehicles Available | Male | Female |
| No Vehicle | 0 (0.0%) | 20 (6.4%) |
| 1 Vehicle | 32 (8.1%) | 64 (20.4%) |
| 2 Vehicles | 250 (63.4%) | 148 (47.3%) |
| 3 Vehicles | 76 (19.3%) | 55 (17.6%) |
| 4 Vehicles | 32 (8.1%) | 8 (2.6%) |
| 5 or more Vehicles | 4 (1.0%) | 18 (5.8%) |
| Total | 394 (100.0%) | 313 (100.0%) |
Commute Time in Auburn
The most frequently occuring commute durations in Auburn are 30 to 34 minutes (233 commuters, 33.7%), 20 to 24 minutes (102 commuters, 14.8%), and 15 to 19 minutes (91 commuters, 13.2%).
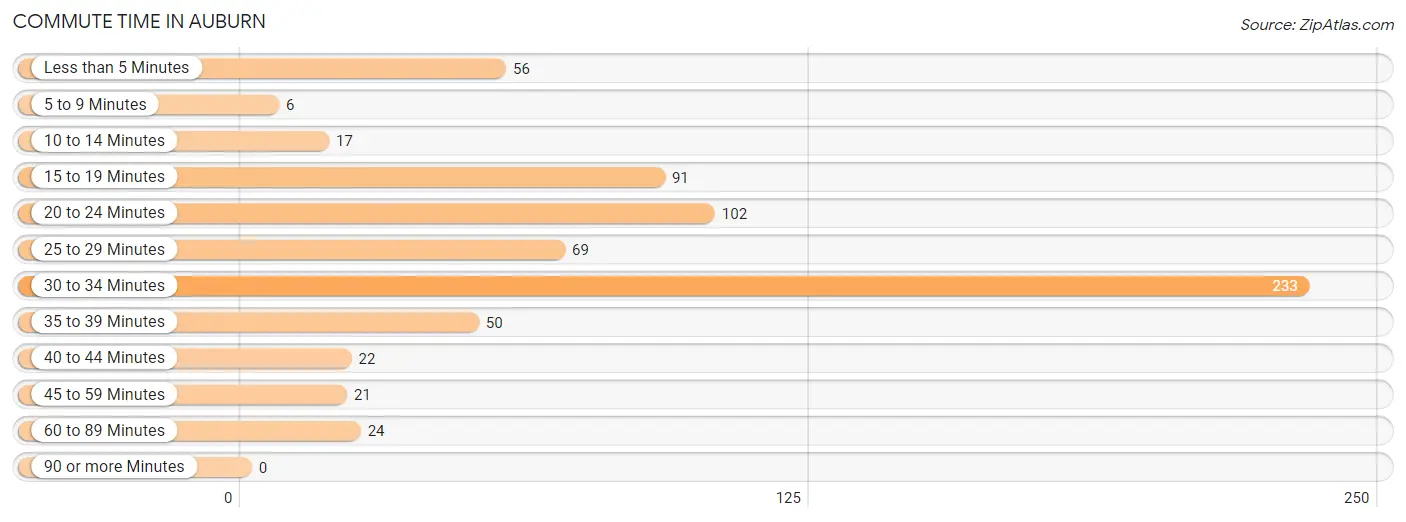
| Commute Time | # Commuters | % Commuters |
| Less than 5 Minutes | 56 | 8.1% |
| 5 to 9 Minutes | 6 | 0.9% |
| 10 to 14 Minutes | 17 | 2.5% |
| 15 to 19 Minutes | 91 | 13.2% |
| 20 to 24 Minutes | 102 | 14.8% |
| 25 to 29 Minutes | 69 | 10.0% |
| 30 to 34 Minutes | 233 | 33.7% |
| 35 to 39 Minutes | 50 | 7.2% |
| 40 to 44 Minutes | 22 | 3.2% |
| 45 to 59 Minutes | 21 | 3.0% |
| 60 to 89 Minutes | 24 | 3.5% |
| 90 or more Minutes | 0 | 0.0% |
Commute Time by Sex in Auburn
The most common commute times in Auburn are 30 to 34 minutes (159 commuters, 40.7%) for males and 30 to 34 minutes (74 commuters, 24.7%) for females.
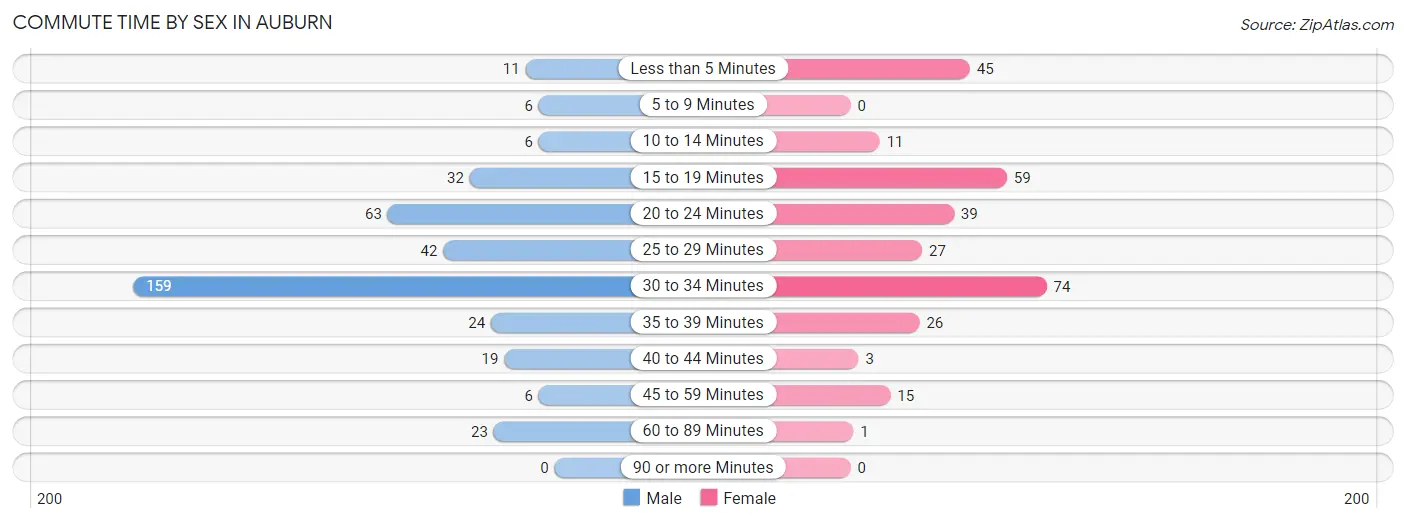
| Commute Time | Male | Female |
| Less than 5 Minutes | 11 (2.8%) | 45 (15.0%) |
| 5 to 9 Minutes | 6 (1.5%) | 0 (0.0%) |
| 10 to 14 Minutes | 6 (1.5%) | 11 (3.7%) |
| 15 to 19 Minutes | 32 (8.2%) | 59 (19.7%) |
| 20 to 24 Minutes | 63 (16.1%) | 39 (13.0%) |
| 25 to 29 Minutes | 42 (10.7%) | 27 (9.0%) |
| 30 to 34 Minutes | 159 (40.7%) | 74 (24.7%) |
| 35 to 39 Minutes | 24 (6.1%) | 26 (8.7%) |
| 40 to 44 Minutes | 19 (4.9%) | 3 (1.0%) |
| 45 to 59 Minutes | 6 (1.5%) | 15 (5.0%) |
| 60 to 89 Minutes | 23 (5.9%) | 1 (0.3%) |
| 90 or more Minutes | 0 (0.0%) | 0 (0.0%) |
Time of Departure to Work by Sex in Auburn
The most frequent times of departure to work in Auburn are 7:00 AM to 7:29 AM (127, 32.5%) for males and 7:00 AM to 7:29 AM (63, 21.0%) for females.
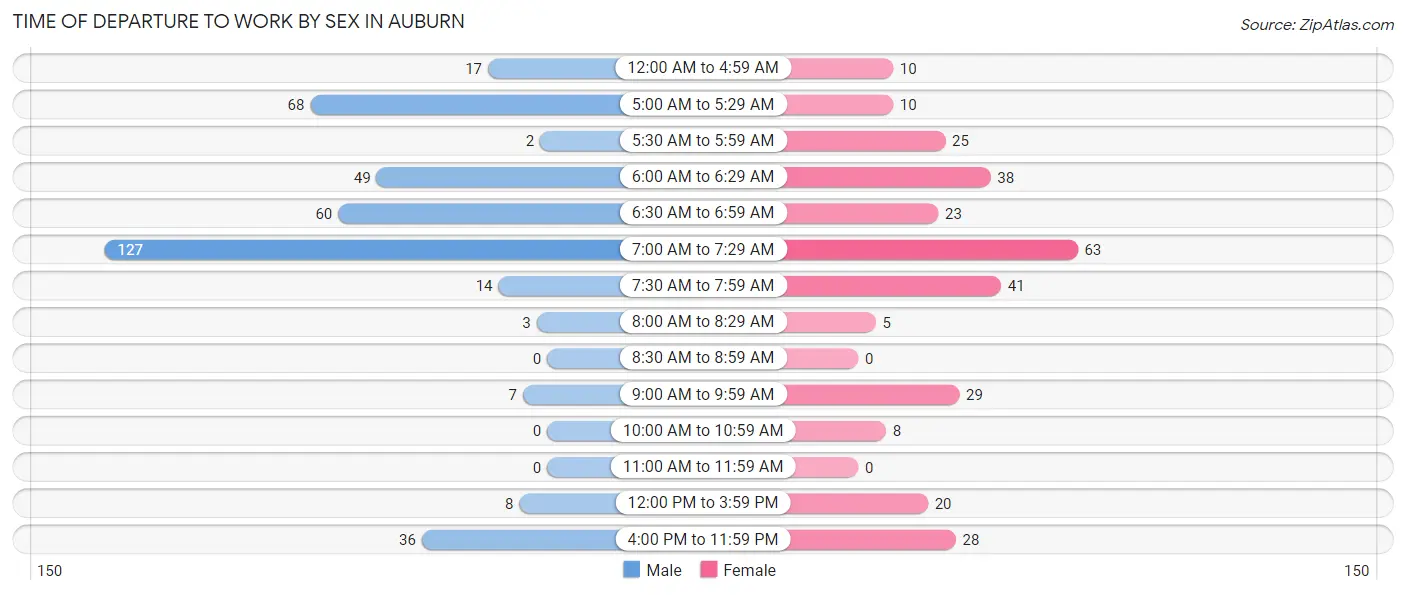
| Time of Departure | Male | Female |
| 12:00 AM to 4:59 AM | 17 (4.3%) | 10 (3.3%) |
| 5:00 AM to 5:29 AM | 68 (17.4%) | 10 (3.3%) |
| 5:30 AM to 5:59 AM | 2 (0.5%) | 25 (8.3%) |
| 6:00 AM to 6:29 AM | 49 (12.5%) | 38 (12.7%) |
| 6:30 AM to 6:59 AM | 60 (15.3%) | 23 (7.7%) |
| 7:00 AM to 7:29 AM | 127 (32.5%) | 63 (21.0%) |
| 7:30 AM to 7:59 AM | 14 (3.6%) | 41 (13.7%) |
| 8:00 AM to 8:29 AM | 3 (0.8%) | 5 (1.7%) |
| 8:30 AM to 8:59 AM | 0 (0.0%) | 0 (0.0%) |
| 9:00 AM to 9:59 AM | 7 (1.8%) | 29 (9.7%) |
| 10:00 AM to 10:59 AM | 0 (0.0%) | 8 (2.7%) |
| 11:00 AM to 11:59 AM | 0 (0.0%) | 0 (0.0%) |
| 12:00 PM to 3:59 PM | 8 (2.1%) | 20 (6.7%) |
| 4:00 PM to 11:59 PM | 36 (9.2%) | 28 (9.3%) |
| Total | 391 (100.0%) | 300 (100.0%) |
Housing Occupancy in Auburn
Occupancy by Ownership in Auburn
Of the total 716 dwellings in Auburn, owner-occupied units account for 525 (73.3%), while renter-occupied units make up 191 (26.7%).
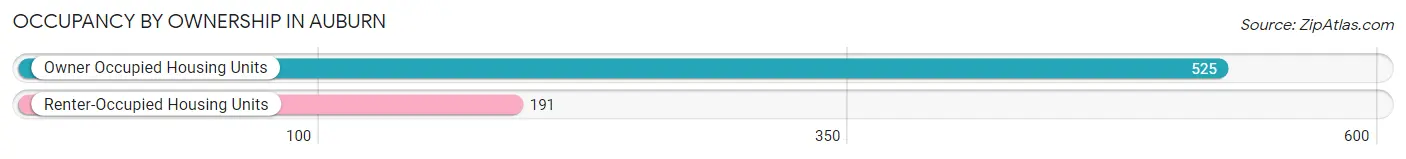
| Occupancy | # Housing Units | % Housing Units |
| Owner Occupied Housing Units | 525 | 73.3% |
| Renter-Occupied Housing Units | 191 | 26.7% |
| Total Occupied Housing Units | 716 | 100.0% |
Occupancy by Household Size in Auburn
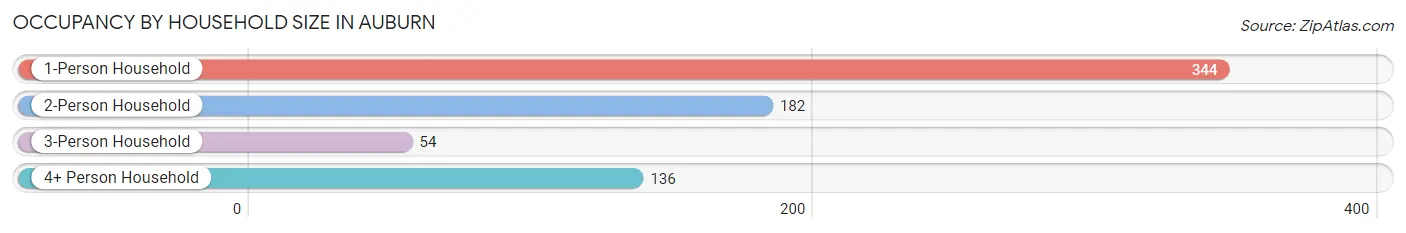
| Household Size | # Housing Units | % Housing Units |
| 1-Person Household | 344 | 48.0% |
| 2-Person Household | 182 | 25.4% |
| 3-Person Household | 54 | 7.5% |
| 4+ Person Household | 136 | 19.0% |
| Total Housing Units | 716 | 100.0% |
Occupancy by Ownership by Household Size in Auburn
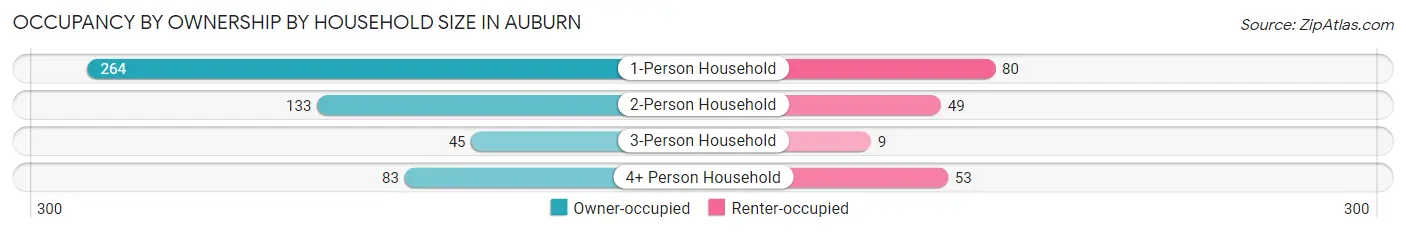
| Household Size | Owner-occupied | Renter-occupied |
| 1-Person Household | 264 (76.7%) | 80 (23.3%) |
| 2-Person Household | 133 (73.1%) | 49 (26.9%) |
| 3-Person Household | 45 (83.3%) | 9 (16.7%) |
| 4+ Person Household | 83 (61.0%) | 53 (39.0%) |
| Total Housing Units | 525 (73.3%) | 191 (26.7%) |
Occupancy by Educational Attainment in Auburn
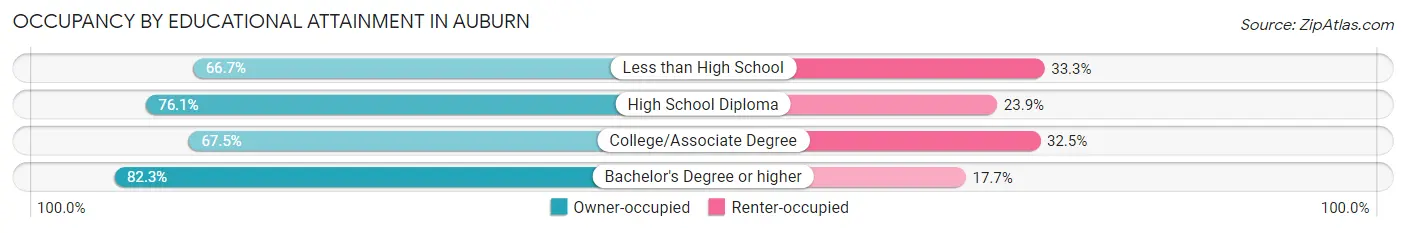
| Household Size | Owner-occupied | Renter-occupied |
| Less than High School | 30 (66.7%) | 15 (33.3%) |
| High School Diploma | 270 (76.1%) | 85 (23.9%) |
| College/Associate Degree | 160 (67.5%) | 77 (32.5%) |
| Bachelor's Degree or higher | 65 (82.3%) | 14 (17.7%) |
Occupancy by Age of Householder in Auburn
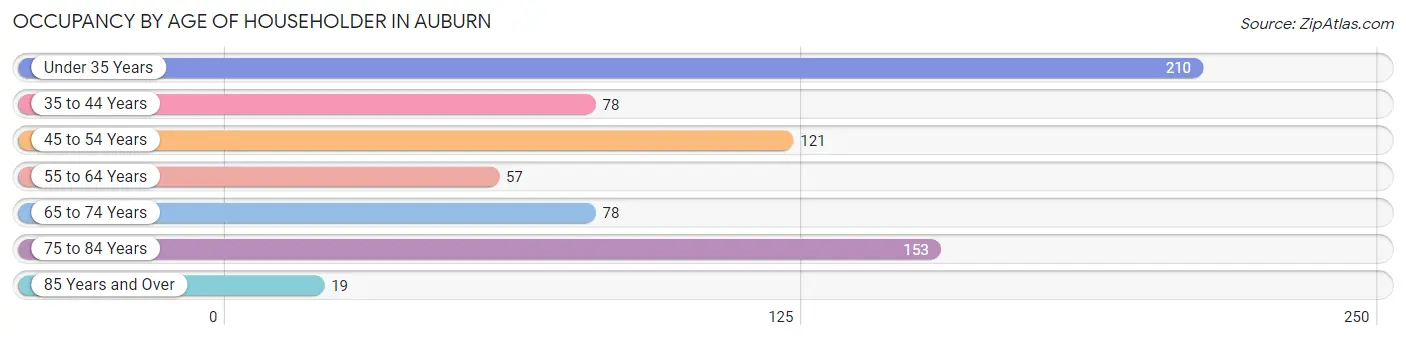
| Age Bracket | # Households | % Households |
| Under 35 Years | 210 | 29.3% |
| 35 to 44 Years | 78 | 10.9% |
| 45 to 54 Years | 121 | 16.9% |
| 55 to 64 Years | 57 | 8.0% |
| 65 to 74 Years | 78 | 10.9% |
| 75 to 84 Years | 153 | 21.4% |
| 85 Years and Over | 19 | 2.6% |
| Total | 716 | 100.0% |
Housing Finances in Auburn
Median Income by Occupancy in Auburn
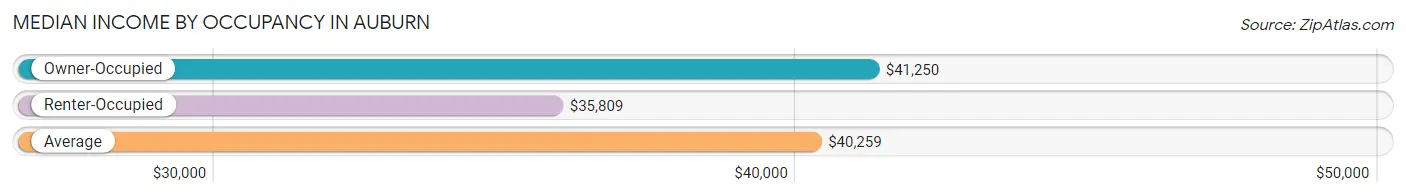
| Occupancy Type | # Households | Median Income |
| Owner-Occupied | 525 (73.3%) | $41,250 |
| Renter-Occupied | 191 (26.7%) | $35,809 |
| Average | 716 (100.0%) | $40,259 |
Occupancy by Householder Income Bracket in Auburn
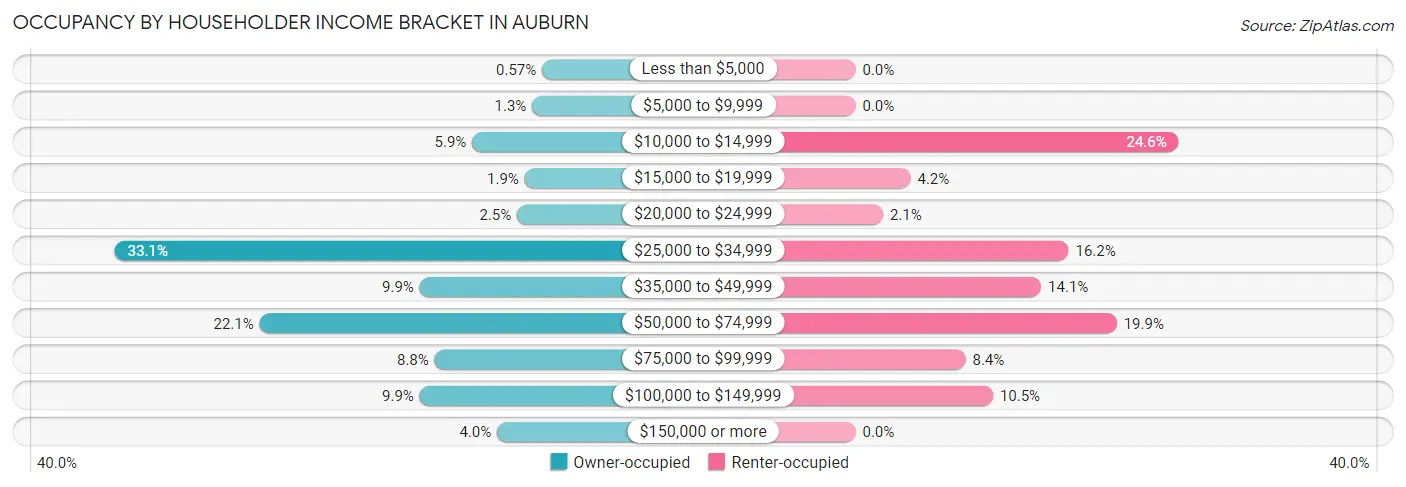
| Income Bracket | Owner-occupied | Renter-occupied |
| Less than $5,000 | 3 (0.6%) | 0 (0.0%) |
| $5,000 to $9,999 | 7 (1.3%) | 0 (0.0%) |
| $10,000 to $14,999 | 31 (5.9%) | 47 (24.6%) |
| $15,000 to $19,999 | 10 (1.9%) | 8 (4.2%) |
| $20,000 to $24,999 | 13 (2.5%) | 4 (2.1%) |
| $25,000 to $34,999 | 174 (33.1%) | 31 (16.2%) |
| $35,000 to $49,999 | 52 (9.9%) | 27 (14.1%) |
| $50,000 to $74,999 | 116 (22.1%) | 38 (19.9%) |
| $75,000 to $99,999 | 46 (8.8%) | 16 (8.4%) |
| $100,000 to $149,999 | 52 (9.9%) | 20 (10.5%) |
| $150,000 or more | 21 (4.0%) | 0 (0.0%) |
| Total | 525 (100.0%) | 191 (100.0%) |
Monthly Housing Cost Tiers in Auburn
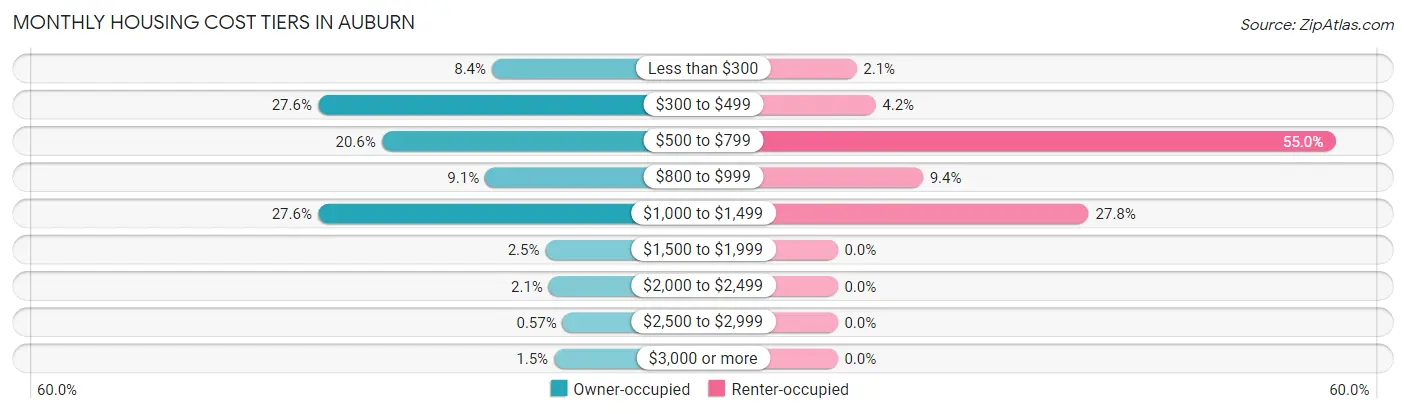
| Monthly Cost | Owner-occupied | Renter-occupied |
| Less than $300 | 44 (8.4%) | 4 (2.1%) |
| $300 to $499 | 145 (27.6%) | 8 (4.2%) |
| $500 to $799 | 108 (20.6%) | 105 (55.0%) |
| $800 to $999 | 48 (9.1%) | 18 (9.4%) |
| $1,000 to $1,499 | 145 (27.6%) | 53 (27.8%) |
| $1,500 to $1,999 | 13 (2.5%) | 0 (0.0%) |
| $2,000 to $2,499 | 11 (2.1%) | 0 (0.0%) |
| $2,500 to $2,999 | 3 (0.6%) | 0 (0.0%) |
| $3,000 or more | 8 (1.5%) | 0 (0.0%) |
| Total | 525 (100.0%) | 191 (100.0%) |
Physical Housing Characteristics in Auburn
Housing Structures in Auburn
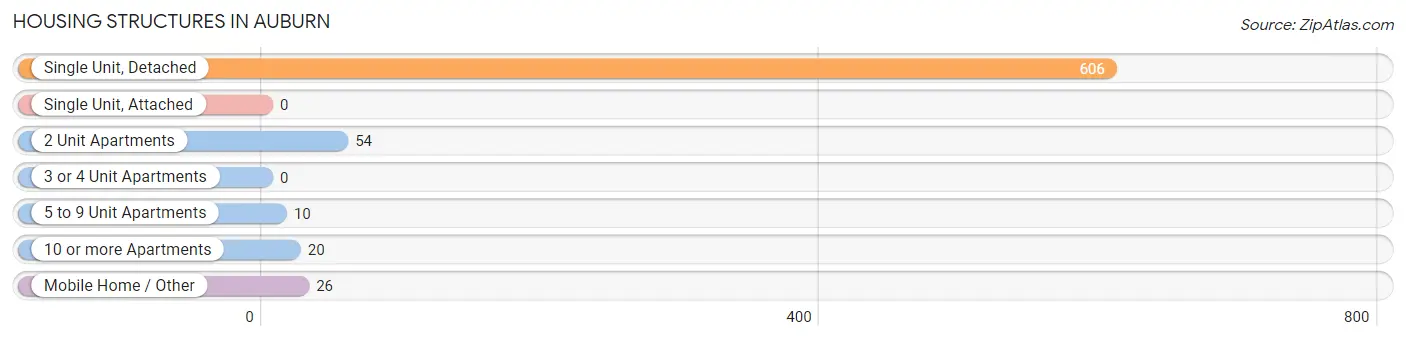
| Structure Type | # Housing Units | % Housing Units |
| Single Unit, Detached | 606 | 84.6% |
| Single Unit, Attached | 0 | 0.0% |
| 2 Unit Apartments | 54 | 7.5% |
| 3 or 4 Unit Apartments | 0 | 0.0% |
| 5 to 9 Unit Apartments | 10 | 1.4% |
| 10 or more Apartments | 20 | 2.8% |
| Mobile Home / Other | 26 | 3.6% |
| Total | 716 | 100.0% |
Housing Structures by Occupancy in Auburn
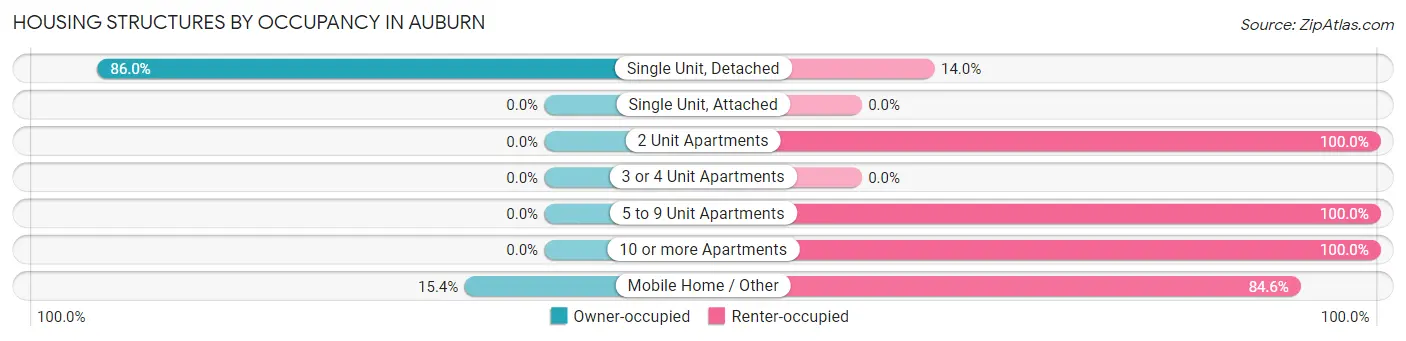
| Structure Type | Owner-occupied | Renter-occupied |
| Single Unit, Detached | 521 (86.0%) | 85 (14.0%) |
| Single Unit, Attached | 0 (0.0%) | 0 (0.0%) |
| 2 Unit Apartments | 0 (0.0%) | 54 (100.0%) |
| 3 or 4 Unit Apartments | 0 (0.0%) | 0 (0.0%) |
| 5 to 9 Unit Apartments | 0 (0.0%) | 10 (100.0%) |
| 10 or more Apartments | 0 (0.0%) | 20 (100.0%) |
| Mobile Home / Other | 4 (15.4%) | 22 (84.6%) |
| Total | 525 (73.3%) | 191 (26.7%) |
Housing Structures by Number of Rooms in Auburn
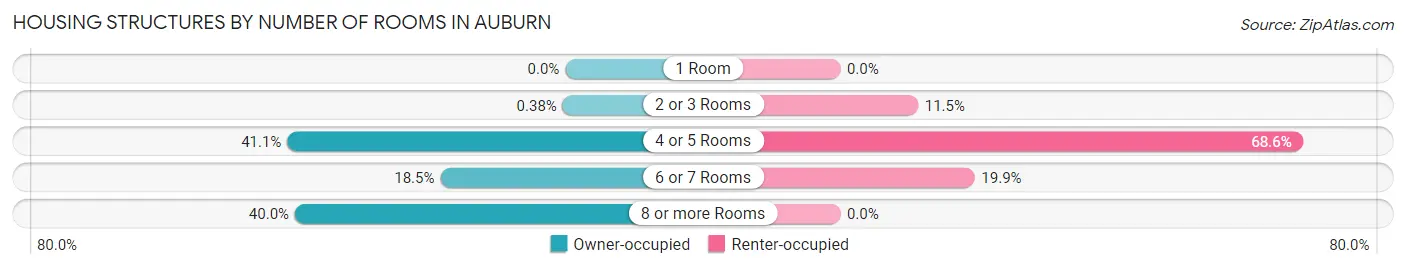
| Number of Rooms | Owner-occupied | Renter-occupied |
| 1 Room | 0 (0.0%) | 0 (0.0%) |
| 2 or 3 Rooms | 2 (0.4%) | 22 (11.5%) |
| 4 or 5 Rooms | 216 (41.1%) | 131 (68.6%) |
| 6 or 7 Rooms | 97 (18.5%) | 38 (19.9%) |
| 8 or more Rooms | 210 (40.0%) | 0 (0.0%) |
| Total | 525 (100.0%) | 191 (100.0%) |
Housing Structure by Heating Type in Auburn
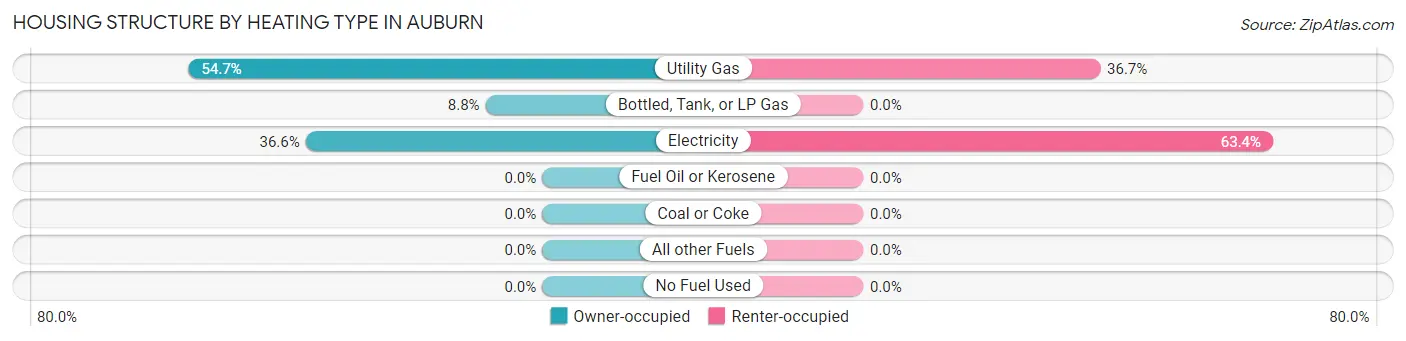
| Heating Type | Owner-occupied | Renter-occupied |
| Utility Gas | 287 (54.7%) | 70 (36.6%) |
| Bottled, Tank, or LP Gas | 46 (8.8%) | 0 (0.0%) |
| Electricity | 192 (36.6%) | 121 (63.3%) |
| Fuel Oil or Kerosene | 0 (0.0%) | 0 (0.0%) |
| Coal or Coke | 0 (0.0%) | 0 (0.0%) |
| All other Fuels | 0 (0.0%) | 0 (0.0%) |
| No Fuel Used | 0 (0.0%) | 0 (0.0%) |
| Total | 525 (100.0%) | 191 (100.0%) |
Household Vehicle Usage in Auburn
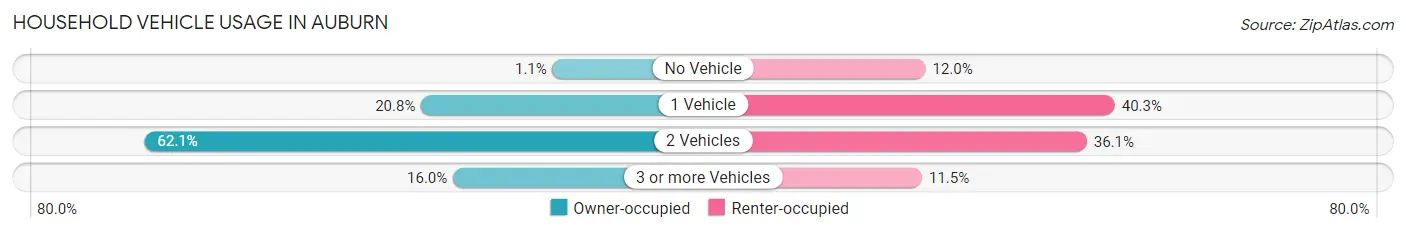
| Vehicles per Household | Owner-occupied | Renter-occupied |
| No Vehicle | 6 (1.1%) | 23 (12.0%) |
| 1 Vehicle | 109 (20.8%) | 77 (40.3%) |
| 2 Vehicles | 326 (62.1%) | 69 (36.1%) |
| 3 or more Vehicles | 84 (16.0%) | 22 (11.5%) |
| Total | 525 (100.0%) | 191 (100.0%) |
Real Estate & Mortgages in Auburn
Real Estate and Mortgage Overview in Auburn
| Characteristic | Without Mortgage | With Mortgage |
| Housing Units | 200 | 325 |
| Median Property Value | $112,900 | $116,300 |
| Median Household Income | $26,495 | $18 |
| Monthly Housing Costs | $369 | $8 |
| Real Estate Taxes | $199 | $10 |
Property Value by Mortgage Status in Auburn
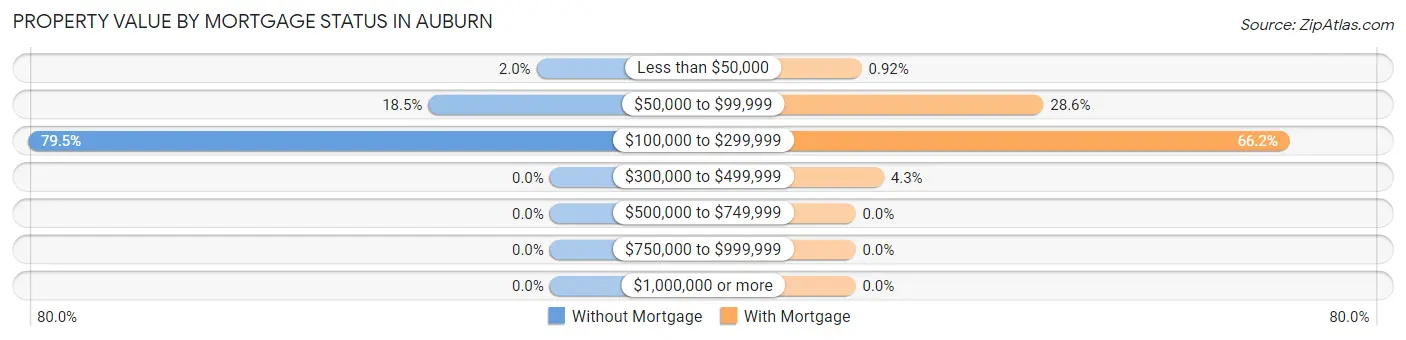
| Property Value | Without Mortgage | With Mortgage |
| Less than $50,000 | 4 (2.0%) | 3 (0.9%) |
| $50,000 to $99,999 | 37 (18.5%) | 93 (28.6%) |
| $100,000 to $299,999 | 159 (79.5%) | 215 (66.1%) |
| $300,000 to $499,999 | 0 (0.0%) | 14 (4.3%) |
| $500,000 to $749,999 | 0 (0.0%) | 0 (0.0%) |
| $750,000 to $999,999 | 0 (0.0%) | 0 (0.0%) |
| $1,000,000 or more | 0 (0.0%) | 0 (0.0%) |
| Total | 200 (100.0%) | 325 (100.0%) |
Household Income by Mortgage Status in Auburn
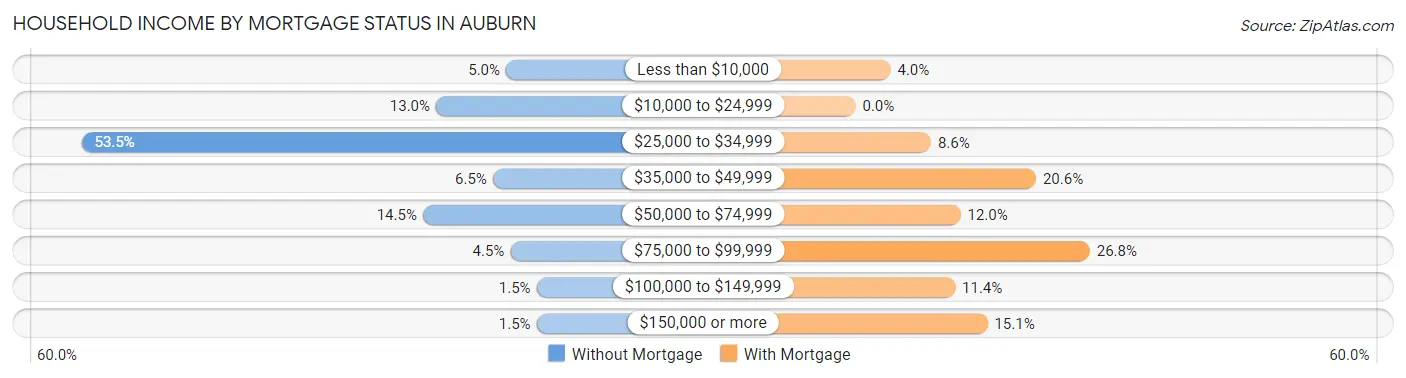
| Household Income | Without Mortgage | With Mortgage |
| Less than $10,000 | 10 (5.0%) | 13 (4.0%) |
| $10,000 to $24,999 | 26 (13.0%) | 0 (0.0%) |
| $25,000 to $34,999 | 107 (53.5%) | 28 (8.6%) |
| $35,000 to $49,999 | 13 (6.5%) | 67 (20.6%) |
| $50,000 to $74,999 | 29 (14.5%) | 39 (12.0%) |
| $75,000 to $99,999 | 9 (4.5%) | 87 (26.8%) |
| $100,000 to $149,999 | 3 (1.5%) | 37 (11.4%) |
| $150,000 or more | 3 (1.5%) | 49 (15.1%) |
| Total | 200 (100.0%) | 325 (100.0%) |
Property Value to Household Income Ratio in Auburn
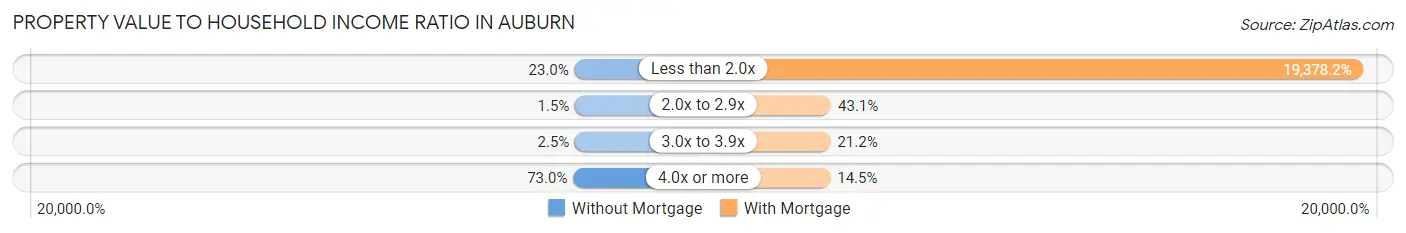
| Value-to-Income Ratio | Without Mortgage | With Mortgage |
| Less than 2.0x | 46 (23.0%) | 62,979 (19,378.1%) |
| 2.0x to 2.9x | 3 (1.5%) | 140 (43.1%) |
| 3.0x to 3.9x | 5 (2.5%) | 69 (21.2%) |
| 4.0x or more | 146 (73.0%) | 47 (14.5%) |
| Total | 200 (100.0%) | 325 (100.0%) |
Real Estate Taxes by Mortgage Status in Auburn
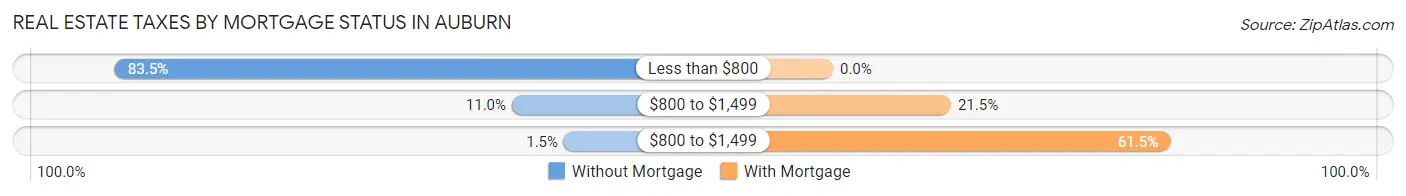
| Property Taxes | Without Mortgage | With Mortgage |
| Less than $800 | 167 (83.5%) | 0 (0.0%) |
| $800 to $1,499 | 22 (11.0%) | 70 (21.5%) |
| $800 to $1,499 | 3 (1.5%) | 200 (61.5%) |
| Total | 200 (100.0%) | 325 (100.0%) |
Health & Disability in Auburn
Health Insurance Coverage by Age in Auburn
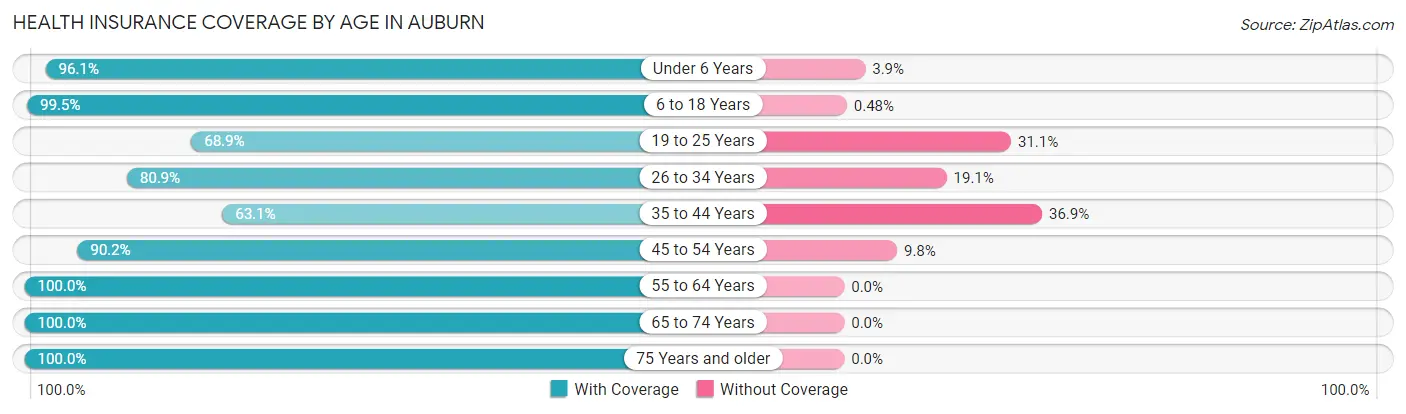
| Age Bracket | With Coverage | Without Coverage |
| Under 6 Years | 123 (96.1%) | 5 (3.9%) |
| 6 to 18 Years | 206 (99.5%) | 1 (0.5%) |
| 19 to 25 Years | 215 (68.9%) | 97 (31.1%) |
| 26 to 34 Years | 106 (80.9%) | 25 (19.1%) |
| 35 to 44 Years | 125 (63.1%) | 73 (36.9%) |
| 45 to 54 Years | 165 (90.2%) | 18 (9.8%) |
| 55 to 64 Years | 95 (100.0%) | 0 (0.0%) |
| 65 to 74 Years | 109 (100.0%) | 0 (0.0%) |
| 75 Years and older | 226 (100.0%) | 0 (0.0%) |
| Total | 1,370 (86.2%) | 219 (13.8%) |
Health Insurance Coverage by Citizenship Status in Auburn
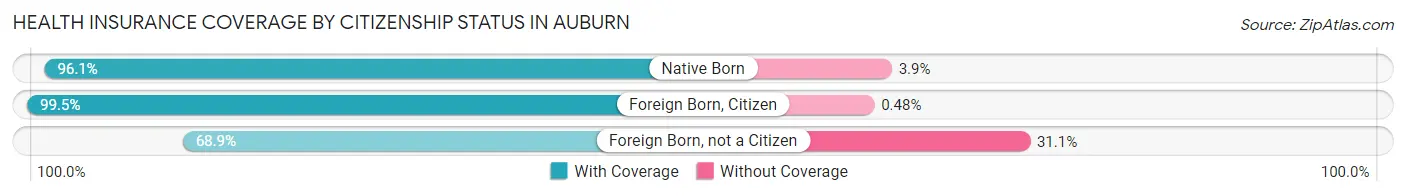
| Citizenship Status | With Coverage | Without Coverage |
| Native Born | 123 (96.1%) | 5 (3.9%) |
| Foreign Born, Citizen | 206 (99.5%) | 1 (0.5%) |
| Foreign Born, not a Citizen | 215 (68.9%) | 97 (31.1%) |
Health Insurance Coverage by Household Income in Auburn
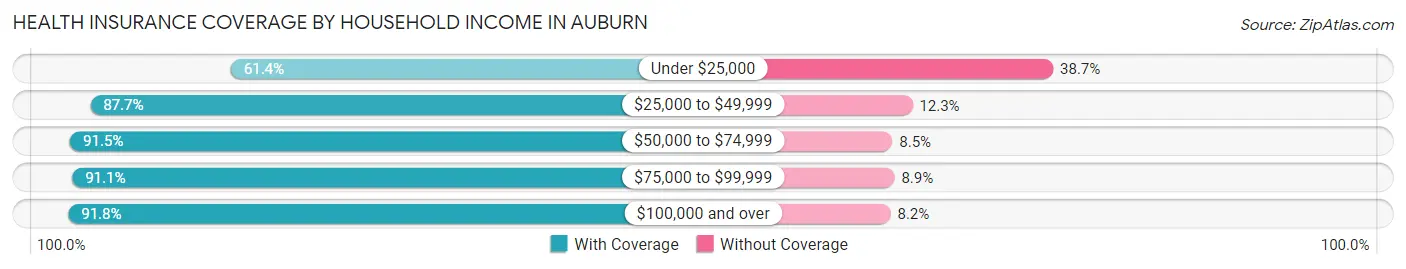
| Household Income | With Coverage | Without Coverage |
| Under $25,000 | 127 (61.4%) | 80 (38.7%) |
| $25,000 to $49,999 | 499 (87.7%) | 70 (12.3%) |
| $50,000 to $74,999 | 311 (91.5%) | 29 (8.5%) |
| $75,000 to $99,999 | 153 (91.1%) | 15 (8.9%) |
| $100,000 and over | 280 (91.8%) | 25 (8.2%) |
Public vs Private Health Insurance Coverage by Age in Auburn
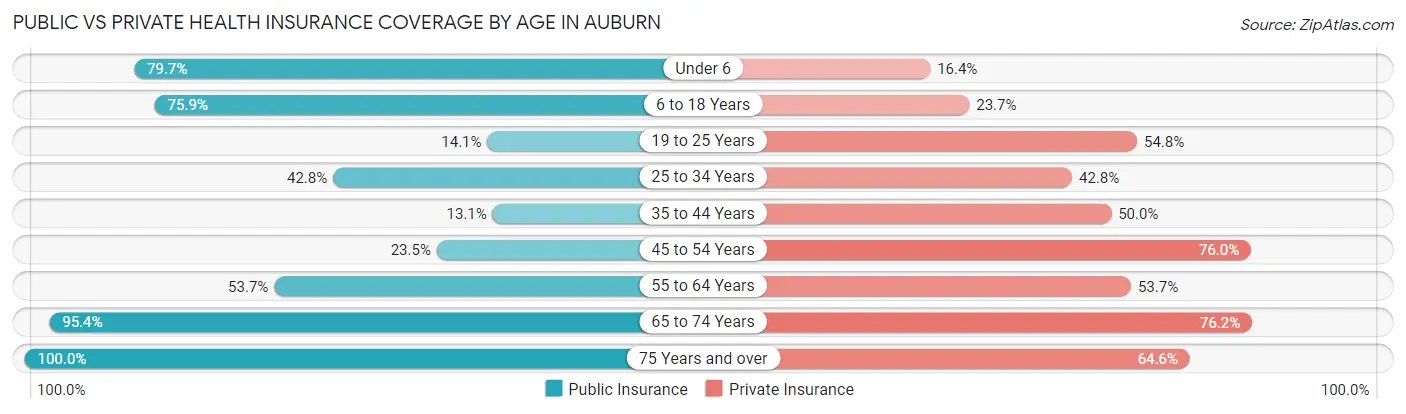
| Age Bracket | Public Insurance | Private Insurance |
| Under 6 | 102 (79.7%) | 21 (16.4%) |
| 6 to 18 Years | 157 (75.8%) | 49 (23.7%) |
| 19 to 25 Years | 44 (14.1%) | 171 (54.8%) |
| 25 to 34 Years | 56 (42.7%) | 56 (42.7%) |
| 35 to 44 Years | 26 (13.1%) | 99 (50.0%) |
| 45 to 54 Years | 43 (23.5%) | 139 (76.0%) |
| 55 to 64 Years | 51 (53.7%) | 51 (53.7%) |
| 65 to 74 Years | 104 (95.4%) | 83 (76.1%) |
| 75 Years and over | 226 (100.0%) | 146 (64.6%) |
| Total | 809 (50.9%) | 815 (51.3%) |
Disability Status by Sex by Age in Auburn
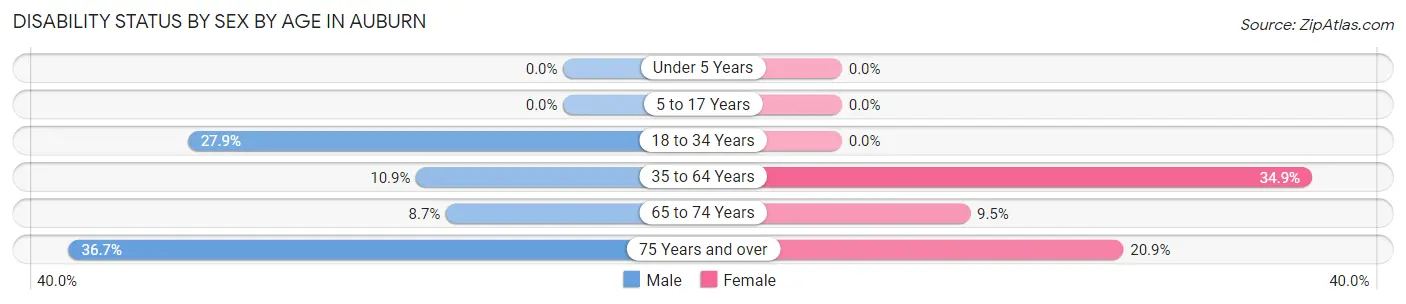
| Age Bracket | Male | Female |
| Under 5 Years | 0 (0.0%) | 0 (0.0%) |
| 5 to 17 Years | 0 (0.0%) | 0 (0.0%) |
| 18 to 34 Years | 70 (27.9%) | 0 (0.0%) |
| 35 to 64 Years | 31 (10.9%) | 67 (34.9%) |
| 65 to 74 Years | 4 (8.7%) | 6 (9.5%) |
| 75 Years and over | 18 (36.7%) | 37 (20.9%) |
Disability Class by Sex by Age in Auburn
Disability Class: Hearing Difficulty
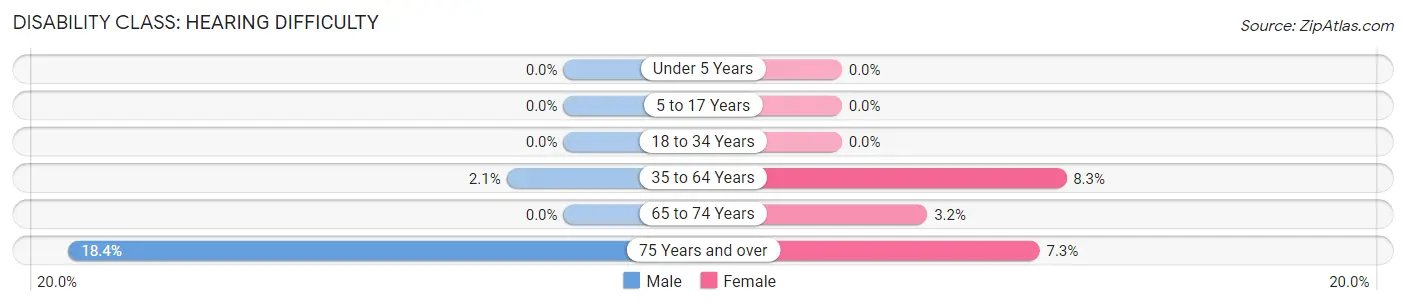
| Age Bracket | Male | Female |
| Under 5 Years | 0 (0.0%) | 0 (0.0%) |
| 5 to 17 Years | 0 (0.0%) | 0 (0.0%) |
| 18 to 34 Years | 0 (0.0%) | 0 (0.0%) |
| 35 to 64 Years | 6 (2.1%) | 16 (8.3%) |
| 65 to 74 Years | 0 (0.0%) | 2 (3.2%) |
| 75 Years and over | 9 (18.4%) | 13 (7.3%) |
Disability Class: Vision Difficulty
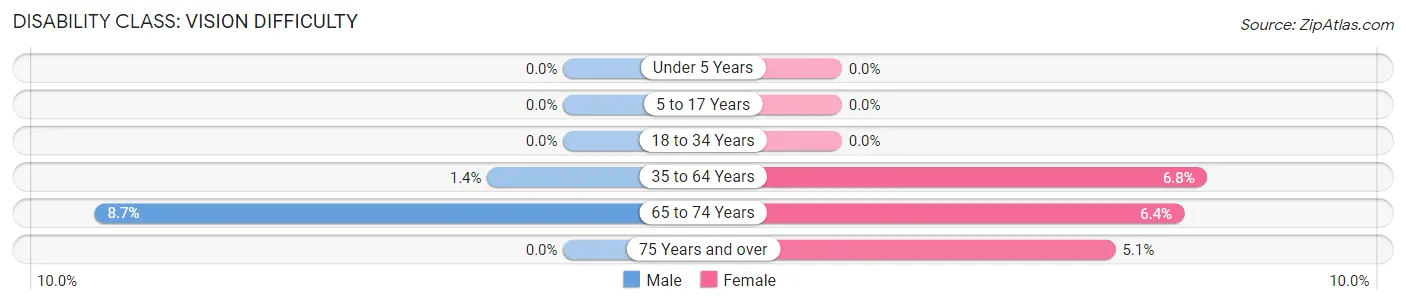
| Age Bracket | Male | Female |
| Under 5 Years | 0 (0.0%) | 0 (0.0%) |
| 5 to 17 Years | 0 (0.0%) | 0 (0.0%) |
| 18 to 34 Years | 0 (0.0%) | 0 (0.0%) |
| 35 to 64 Years | 4 (1.4%) | 13 (6.8%) |
| 65 to 74 Years | 4 (8.7%) | 4 (6.4%) |
| 75 Years and over | 0 (0.0%) | 9 (5.1%) |
Disability Class: Cognitive Difficulty
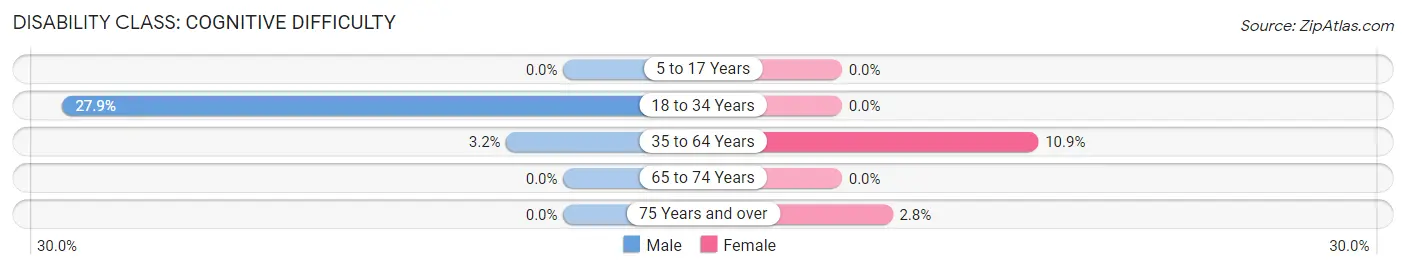
| Age Bracket | Male | Female |
| 5 to 17 Years | 0 (0.0%) | 0 (0.0%) |
| 18 to 34 Years | 70 (27.9%) | 0 (0.0%) |
| 35 to 64 Years | 9 (3.2%) | 21 (10.9%) |
| 65 to 74 Years | 0 (0.0%) | 0 (0.0%) |
| 75 Years and over | 0 (0.0%) | 5 (2.8%) |
Disability Class: Ambulatory Difficulty
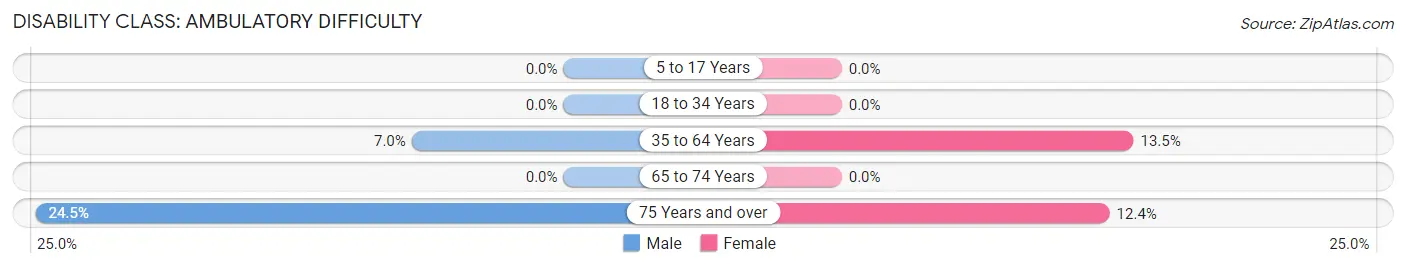
| Age Bracket | Male | Female |
| 5 to 17 Years | 0 (0.0%) | 0 (0.0%) |
| 18 to 34 Years | 0 (0.0%) | 0 (0.0%) |
| 35 to 64 Years | 20 (7.0%) | 26 (13.5%) |
| 65 to 74 Years | 0 (0.0%) | 0 (0.0%) |
| 75 Years and over | 12 (24.5%) | 22 (12.4%) |
Disability Class: Self-Care Difficulty
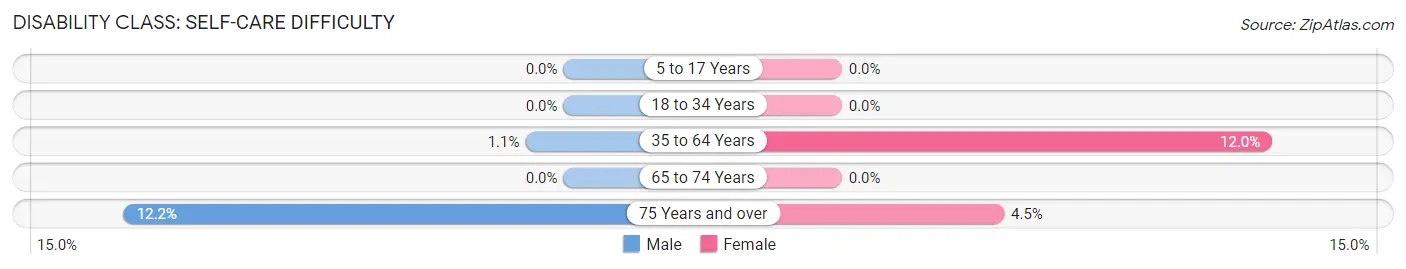
| Age Bracket | Male | Female |
| 5 to 17 Years | 0 (0.0%) | 0 (0.0%) |
| 18 to 34 Years | 0 (0.0%) | 0 (0.0%) |
| 35 to 64 Years | 3 (1.1%) | 23 (12.0%) |
| 65 to 74 Years | 0 (0.0%) | 0 (0.0%) |
| 75 Years and over | 6 (12.2%) | 8 (4.5%) |
Technology Access in Auburn
Computing Device Access in Auburn
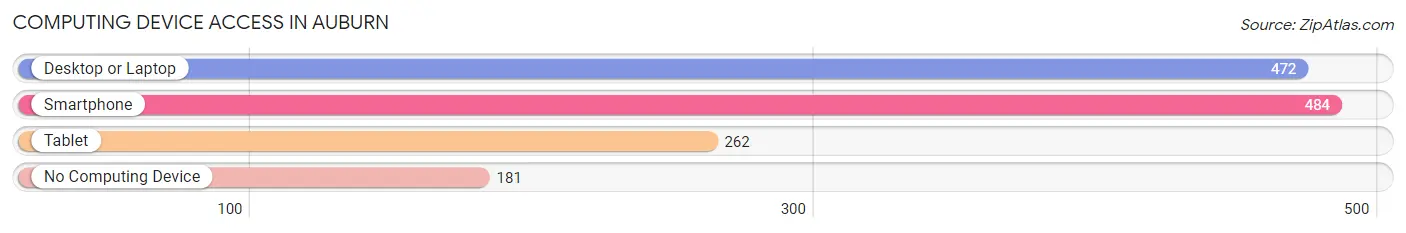
| Device Type | # Households | % Households |
| Desktop or Laptop | 472 | 65.9% |
| Smartphone | 484 | 67.6% |
| Tablet | 262 | 36.6% |
| No Computing Device | 181 | 25.3% |
| Total | 716 | 100.0% |
Internet Access in Auburn
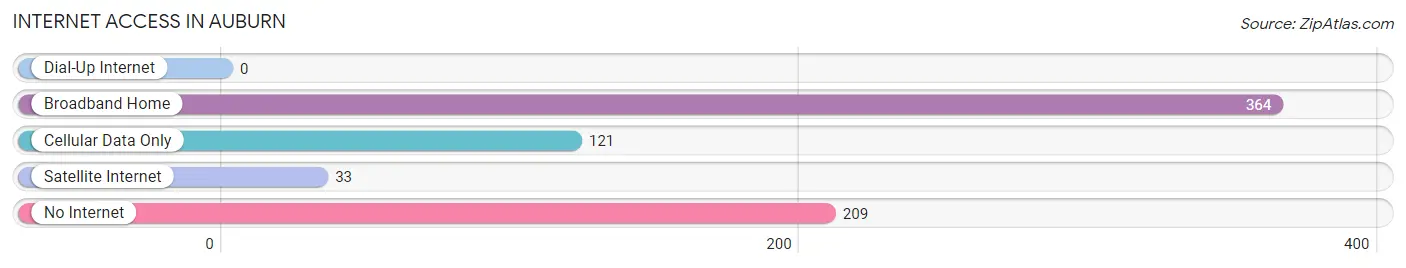
| Internet Type | # Households | % Households |
| Dial-Up Internet | 0 | 0.0% |
| Broadband Home | 364 | 50.8% |
| Cellular Data Only | 121 | 16.9% |
| Satellite Internet | 33 | 4.6% |
| No Internet | 209 | 29.2% |
| Total | 716 | 100.0% |
Auburn Summary
Auburn, Kentucky is a small city located in Logan County, Kentucky. It is situated in the south-central part of the state, approximately 40 miles south of Bowling Green and 70 miles north of Nashville, Tennessee. The city has a population of approximately 1,500 people and is the county seat of Logan County.
History
Auburn was founded in 1819 by a group of settlers from Virginia and North Carolina. The city was named after the Auburn Plantation, which was owned by one of the settlers. The city was incorporated in 1837 and was the county seat of Logan County.
In the late 19th century, Auburn was a thriving agricultural center, with tobacco, corn, and wheat being the main crops. The city also had a number of manufacturing businesses, including a furniture factory, a brickyard, and a canning factory.
In the early 20th century, Auburn experienced a period of growth and prosperity. The city was home to a number of businesses, including a bank, a hotel, a movie theater, and a number of stores. The city also had a number of churches, schools, and other civic organizations.
Geography
Auburn is located in the south-central part of Kentucky, approximately 40 miles south of Bowling Green and 70 miles north of Nashville, Tennessee. The city is situated in the western part of Logan County, on the banks of the Green River. The city has a total area of 1.3 square miles, all of which is land.
The climate in Auburn is humid subtropical, with hot, humid summers and mild winters. The average annual temperature is around 60 degrees Fahrenheit, with an average high of around 80 degrees in the summer and an average low of around 40 degrees in the winter.
Economy
Auburn’s economy is largely based on agriculture and manufacturing. The city is home to a number of agricultural businesses, including a feed mill, a grain elevator, and a number of farms. The city also has a number of manufacturing businesses, including a furniture factory, a brickyard, and a canning factory.
The city also has a number of retail businesses, including a grocery store, a hardware store, and a number of restaurants. The city also has a number of service businesses, including a bank, a hotel, and a movie theater.
Demographics
As of the 2010 census, Auburn had a population of 1,500 people. The racial makeup of the city was 97.3% White, 0.7% African American, 0.3% Native American, 0.3% Asian, and 1.3% from other races. The median household income was $31,250, and the median family income was $37,500.
Conclusion
Auburn, Kentucky is a small city located in Logan County, Kentucky. It is situated in the south-central part of the state, approximately 40 miles south of Bowling Green and 70 miles north of Nashville, Tennessee. The city has a population of approximately 1,500 people and is the county seat of Logan County. The city’s economy is largely based on agriculture and manufacturing, and the city has a number of retail and service businesses. The racial makeup of the city is 97.3% White, 0.7% African American, 0.3% Native American, 0.3% Asian, and 1.3% from other races. The median household income was $31,250, and the median family income was $37,500.
Common Questions
What is Per Capita Income in Auburn?
Per Capita income in Auburn is $24,570.
What is the Median Family Income in Auburn?
Median Family Income in Auburn is $53,056.
What is the Median Household income in Auburn?
Median Household Income in Auburn is $40,259.
What is Income or Wage Gap in Auburn?
Income or Wage Gap in Auburn is 30.1%.
Women in Auburn earn 69.9 cents for every dollar earned by a man.
What is Inequality or Gini Index in Auburn?
Inequality or Gini Index in Auburn is 0.40.
What is the Total Population of Auburn?
Total Population of Auburn is 1,645.
What is the Total Male Population of Auburn?
Total Male Population of Auburn is 843.
What is the Total Female Population of Auburn?
Total Female Population of Auburn is 802.
What is the Ratio of Males per 100 Females in Auburn?
There are 105.11 Males per 100 Females in Auburn.
What is the Ratio of Females per 100 Males in Auburn?
There are 95.14 Females per 100 Males in Auburn.
What is the Median Population Age in Auburn?
Median Population Age in Auburn is 36.3 Years.
What is the Average Family Size in Auburn
Average Family Size in Auburn is 3.3 People.
What is the Average Household Size in Auburn
Average Household Size in Auburn is 2.2 People.
How Large is the Labor Force in Auburn?
There are 788 People in the Labor Forcein in Auburn.
What is the Percentage of People in the Labor Force in Auburn?
58.7% of People are in the Labor Force in Auburn.
What is the Unemployment Rate in Auburn?
Unemployment Rate in Auburn is 8.8%.