Lewisburg, KY Map & Demographics
Lewisburg Map
Lewisburg Overview
$20,097
PER CAPITA INCOME
$50,104
AVG FAMILY INCOME
$35,469
AVG HOUSEHOLD INCOME
31.3%
WAGE / INCOME GAP [ % ]
68.7¢/ $1
WAGE / INCOME GAP [ $ ]
0.46
INEQUALITY / GINI INDEX
1,084
TOTAL POPULATION
605
MALE POPULATION
479
FEMALE POPULATION
126.30
MALES / 100 FEMALES
79.17
FEMALES / 100 MALES
48.0
MEDIAN AGE
3.4
AVG FAMILY SIZE
2.4
AVG HOUSEHOLD SIZE
306
LABOR FORCE [ PEOPLE ]
36.4%
PERCENT IN LABOR FORCE
9.5%
UNEMPLOYMENT RATE
Lewisburg Zip Codes
Lewisburg Area Codes
Income in Lewisburg
Income Overview in Lewisburg
Per Capita Income in Lewisburg is $20,097, while median incomes of families and households are $50,104 and $35,469 respectively.
| Characteristic | Number | Measure |
| Per Capita Income | 1,084 | $20,097 |
| Median Family Income | 245 | $50,104 |
| Mean Family Income | 245 | $60,180 |
| Median Household Income | 456 | $35,469 |
| Mean Household Income | 456 | $46,178 |
| Income Deficit | 245 | $0 |
| Wage / Income Gap (%) | 1,084 | 31.26% |
| Wage / Income Gap ($) | 1,084 | 68.74¢ per $1 |
| Gini / Inequality Index | 1,084 | 0.46 |
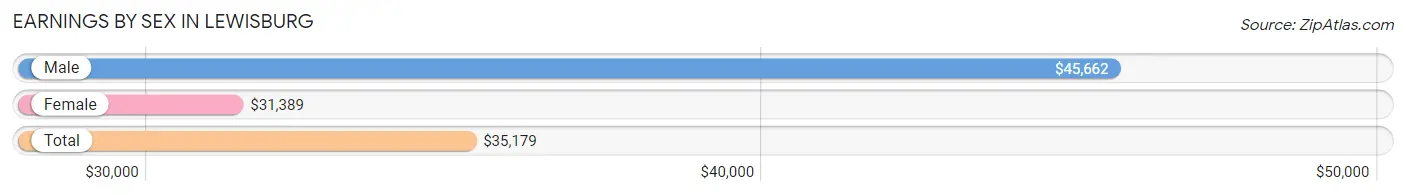
Earnings by Sex in Lewisburg
Average Earnings in Lewisburg are $35,179, $45,662 for men and $31,389 for women, a difference of 31.3%.
| Sex | Number | Average Earnings |
| Male | 167 (55.8%) | $45,662 |
| Female | 132 (44.2%) | $31,389 |
| Total | 299 (100.0%) | $35,179 |
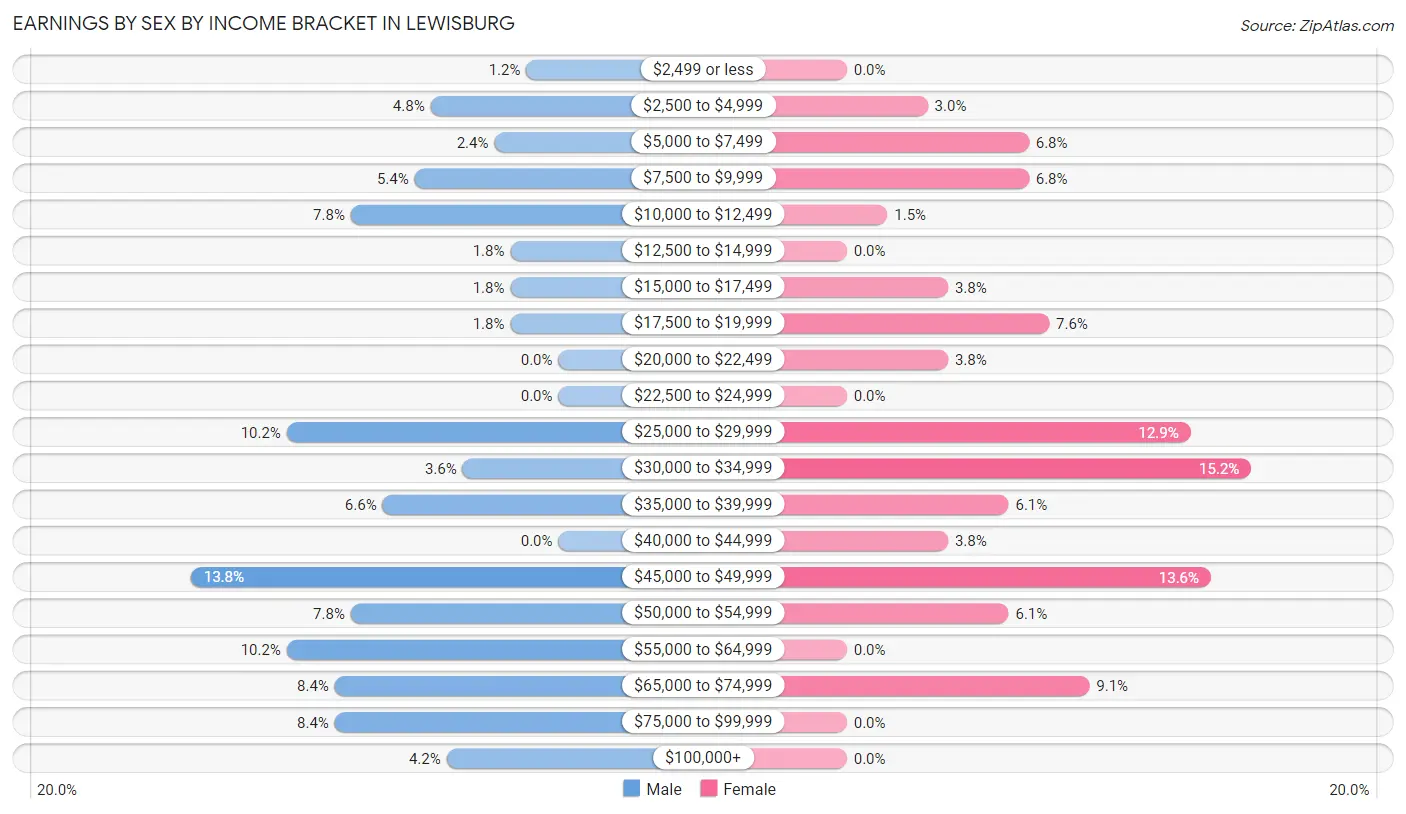
Earnings by Sex by Income Bracket in Lewisburg
The most common earnings brackets in Lewisburg are $45,000 to $49,999 for men (23 | 13.8%) and $30,000 to $34,999 for women (20 | 15.1%).
| Income | Male | Female |
| $2,499 or less | 2 (1.2%) | 0 (0.0%) |
| $2,500 to $4,999 | 8 (4.8%) | 4 (3.0%) |
| $5,000 to $7,499 | 4 (2.4%) | 9 (6.8%) |
| $7,500 to $9,999 | 9 (5.4%) | 9 (6.8%) |
| $10,000 to $12,499 | 13 (7.8%) | 2 (1.5%) |
| $12,500 to $14,999 | 3 (1.8%) | 0 (0.0%) |
| $15,000 to $17,499 | 3 (1.8%) | 5 (3.8%) |
| $17,500 to $19,999 | 3 (1.8%) | 10 (7.6%) |
| $20,000 to $22,499 | 0 (0.0%) | 5 (3.8%) |
| $22,500 to $24,999 | 0 (0.0%) | 0 (0.0%) |
| $25,000 to $29,999 | 17 (10.2%) | 17 (12.9%) |
| $30,000 to $34,999 | 6 (3.6%) | 20 (15.1%) |
| $35,000 to $39,999 | 11 (6.6%) | 8 (6.1%) |
| $40,000 to $44,999 | 0 (0.0%) | 5 (3.8%) |
| $45,000 to $49,999 | 23 (13.8%) | 18 (13.6%) |
| $50,000 to $54,999 | 13 (7.8%) | 8 (6.1%) |
| $55,000 to $64,999 | 17 (10.2%) | 0 (0.0%) |
| $65,000 to $74,999 | 14 (8.4%) | 12 (9.1%) |
| $75,000 to $99,999 | 14 (8.4%) | 0 (0.0%) |
| $100,000+ | 7 (4.2%) | 0 (0.0%) |
| Total | 167 (100.0%) | 132 (100.0%) |
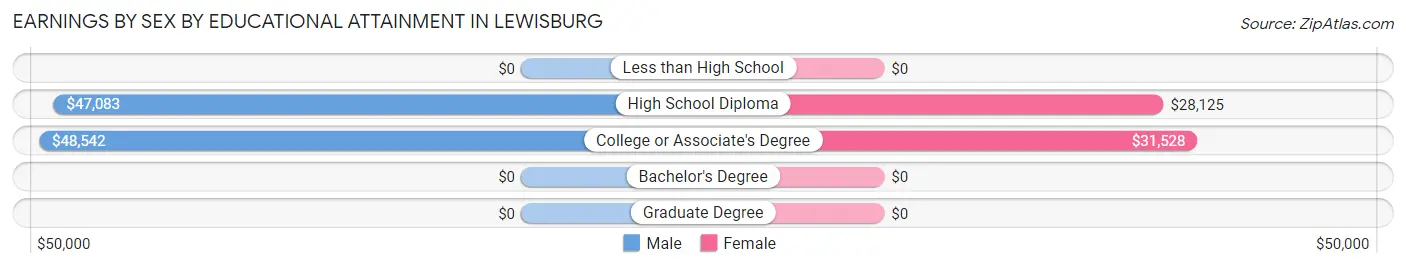
Earnings by Sex by Educational Attainment in Lewisburg
Average earnings in Lewisburg are $47,059 for men and $31,806 for women, a difference of 32.4%. Men with an educational attainment of college or associate's degree enjoy the highest average annual earnings of $48,542, while those with high school diploma education earn the least with $47,083. Women with an educational attainment of college or associate's degree earn the most with the average annual earnings of $31,528, while those with high school diploma education have the smallest earnings of $28,125.
| Educational Attainment | Male Income | Female Income |
| Less than High School | - | - |
| High School Diploma | $47,083 | $28,125 |
| College or Associate's Degree | $48,542 | $31,528 |
| Bachelor's Degree | - | - |
| Graduate Degree | - | - |
| Total | $47,059 | $31,806 |
Family Income in Lewisburg
Family Income Brackets in Lewisburg
According to the Lewisburg family income data, there are 70 families falling into the $35,000 to $49,999 income range, which is the most common income bracket and makes up 28.6% of all families.
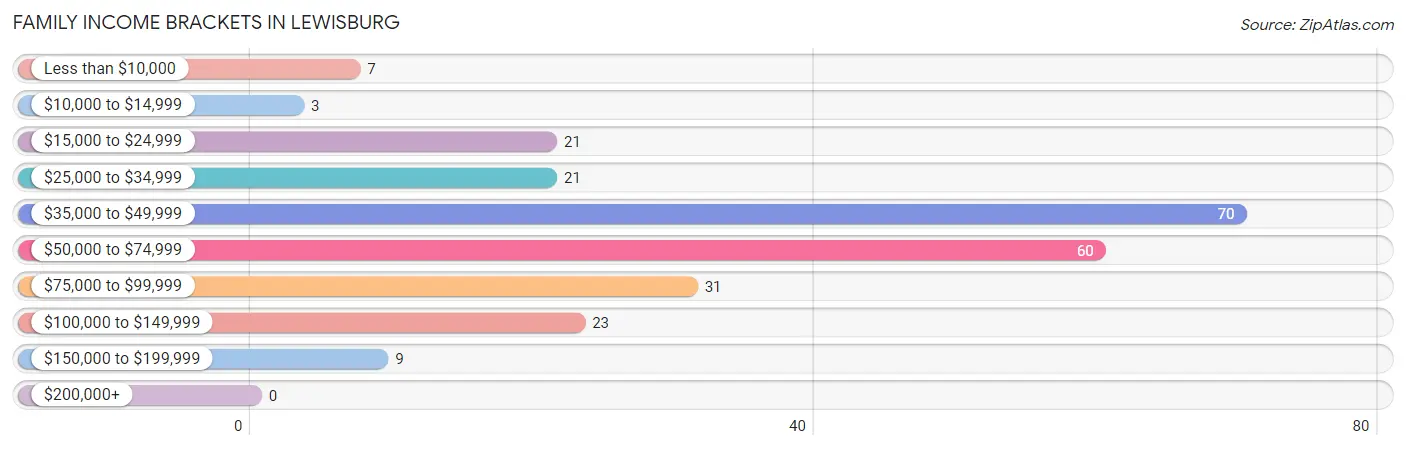
| Income Bracket | # Families | % Families |
| Less than $10,000 | 7 | 2.9% |
| $10,000 to $14,999 | 3 | 1.2% |
| $15,000 to $24,999 | 21 | 8.6% |
| $25,000 to $34,999 | 21 | 8.6% |
| $35,000 to $49,999 | 70 | 28.6% |
| $50,000 to $74,999 | 60 | 24.5% |
| $75,000 to $99,999 | 31 | 12.7% |
| $100,000 to $149,999 | 23 | 9.4% |
| $150,000 to $199,999 | 9 | 3.7% |
| $200,000+ | 0 | 0.0% |
Family Income by Famaliy Size in Lewisburg
5-person families (32 | 13.1%) account for the highest median family income in Lewisburg with $58,750 per family, while 2-person families (122 | 49.8%) have the highest median income of $28,750 per family member.
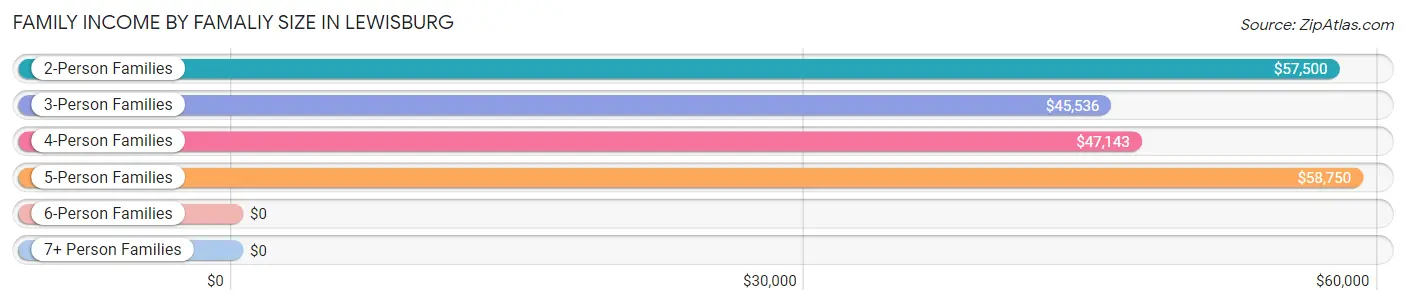
| Income Bracket | # Families | Median Income |
| 2-Person Families | 122 (49.8%) | $57,500 |
| 3-Person Families | 44 (18.0%) | $45,536 |
| 4-Person Families | 42 (17.1%) | $47,143 |
| 5-Person Families | 32 (13.1%) | $58,750 |
| 6-Person Families | 0 (0.0%) | $0 |
| 7+ Person Families | 5 (2.0%) | $0 |
| Total | 245 (100.0%) | $50,104 |
Family Income by Number of Earners in Lewisburg
The median family income in Lewisburg is $50,104, with families comprising 3+ earners (12) having the highest median family income of $148,750, while families with no earners (52) have the lowest median family income of $35,833, accounting for 4.9% and 21.2% of families, respectively.
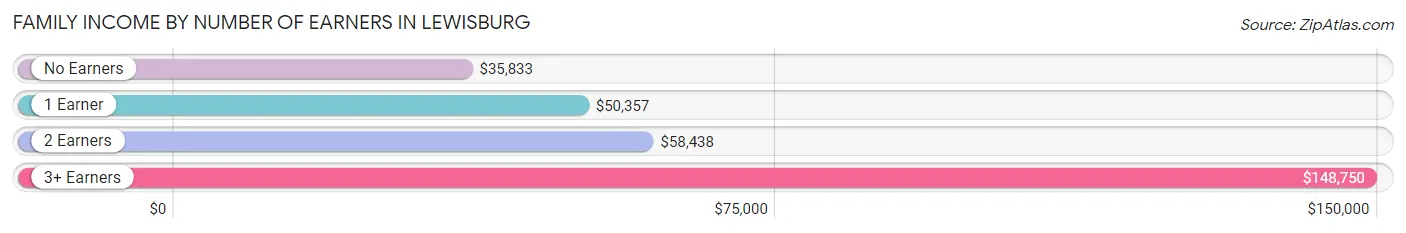
| Number of Earners | # Families | Median Income |
| No Earners | 52 (21.2%) | $35,833 |
| 1 Earner | 130 (53.1%) | $50,357 |
| 2 Earners | 51 (20.8%) | $58,438 |
| 3+ Earners | 12 (4.9%) | $148,750 |
| Total | 245 (100.0%) | $50,104 |
Household Income in Lewisburg
Household Income Brackets in Lewisburg
With 87 households falling in the category, the $10,000 to $14,999 income range is the most frequent in Lewisburg, accounting for 19.1% of all households. In contrast, only 2 households (0.4%) fall into the $200,000+ income bracket, making it the least populous group.
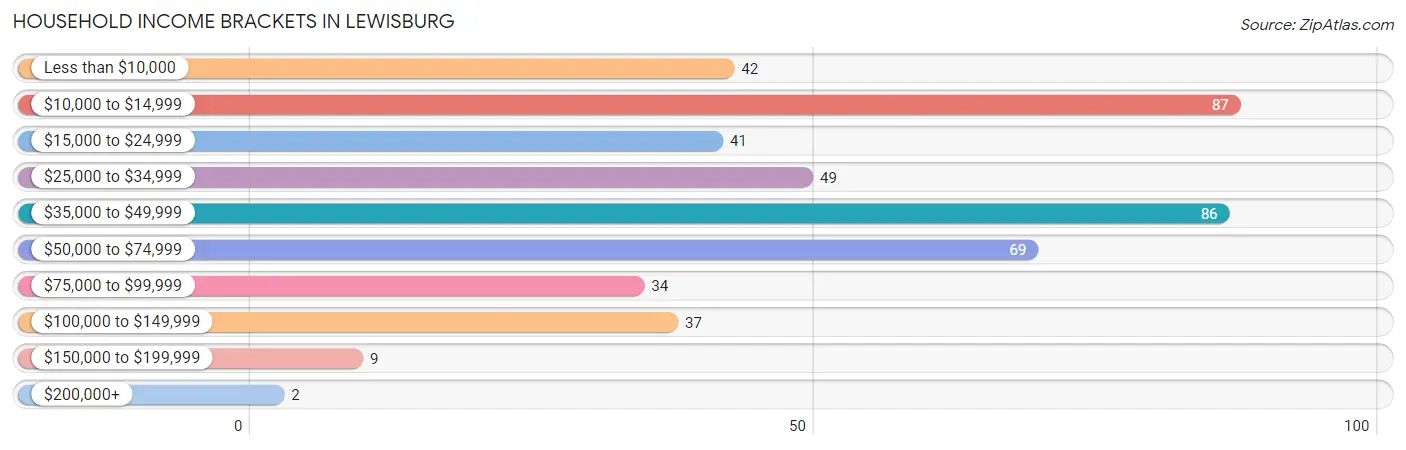
| Income Bracket | # Households | % Households |
| Less than $10,000 | 42 | 9.2% |
| $10,000 to $14,999 | 87 | 19.1% |
| $15,000 to $24,999 | 41 | 9.0% |
| $25,000 to $34,999 | 49 | 10.7% |
| $35,000 to $49,999 | 86 | 18.9% |
| $50,000 to $74,999 | 69 | 15.1% |
| $75,000 to $99,999 | 34 | 7.5% |
| $100,000 to $149,999 | 37 | 8.1% |
| $150,000 to $199,999 | 9 | 2.0% |
| $200,000+ | 2 | 0.4% |
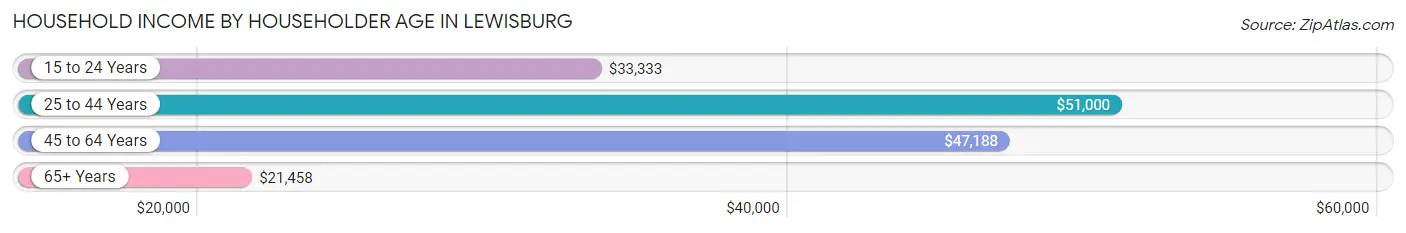
Household Income by Householder Age in Lewisburg
The median household income in Lewisburg is $35,469, with the highest median household income of $51,000 found in the 25 to 44 years age bracket for the primary householder. A total of 114 households (25.0%) fall into this category. Meanwhile, the 65+ years age bracket for the primary householder has the lowest median household income of $21,458, with 173 households (37.9%) in this group.
| Income Bracket | # Households | Median Income |
| 15 to 24 Years | 12 (2.6%) | $33,333 |
| 25 to 44 Years | 114 (25.0%) | $51,000 |
| 45 to 64 Years | 157 (34.4%) | $47,188 |
| 65+ Years | 173 (37.9%) | $21,458 |
| Total | 456 (100.0%) | $35,469 |
Poverty in Lewisburg
Income Below Poverty by Sex and Age in Lewisburg
With 22.2% poverty level for males and 30.9% for females among the residents of Lewisburg, 5 year old males and 15 year old females are the most vulnerable to poverty, with 10 males (100.0%) and 3 females (100.0%) in their respective age groups living below the poverty level.
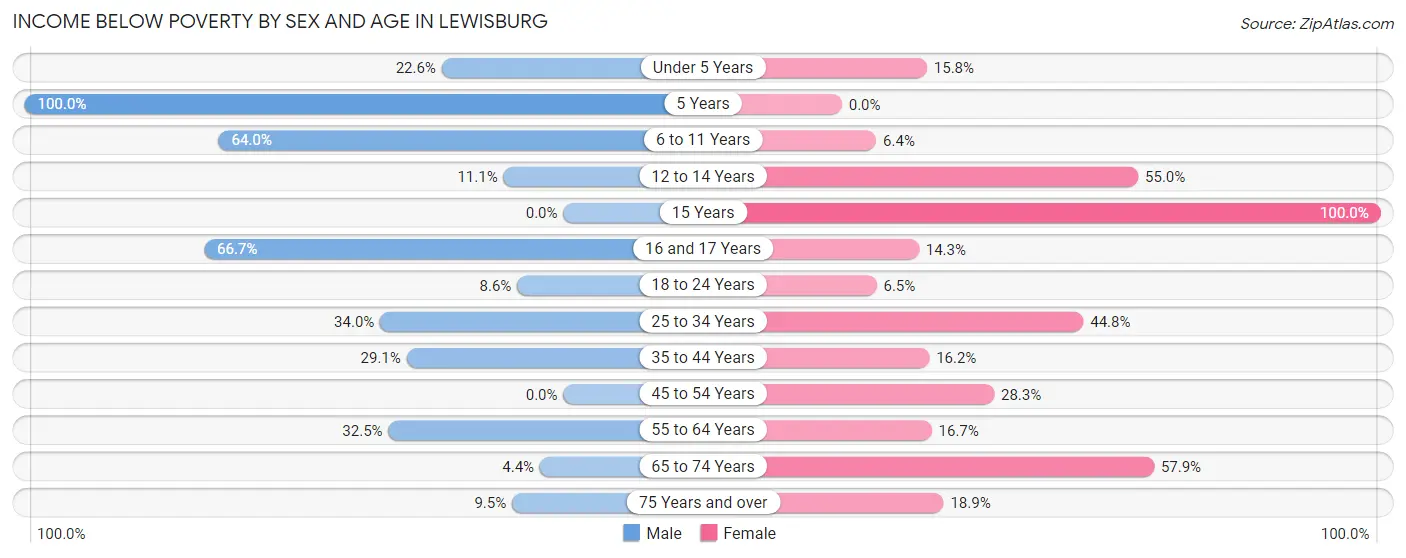
| Age Bracket | Male | Female |
| Under 5 Years | 14 (22.6%) | 3 (15.8%) |
| 5 Years | 10 (100.0%) | 0 (0.0%) |
| 6 to 11 Years | 32 (64.0%) | 3 (6.4%) |
| 12 to 14 Years | 1 (11.1%) | 11 (55.0%) |
| 15 Years | 0 (0.0%) | 3 (100.0%) |
| 16 and 17 Years | 10 (66.7%) | 1 (14.3%) |
| 18 to 24 Years | 3 (8.6%) | 2 (6.5%) |
| 25 to 34 Years | 17 (34.0%) | 26 (44.8%) |
| 35 to 44 Years | 16 (29.1%) | 6 (16.2%) |
| 45 to 54 Years | 0 (0.0%) | 13 (28.3%) |
| 55 to 64 Years | 25 (32.5%) | 8 (16.7%) |
| 65 to 74 Years | 2 (4.3%) | 62 (57.9%) |
| 75 Years and over | 4 (9.5%) | 10 (18.9%) |
| Total | 134 (22.2%) | 148 (30.9%) |
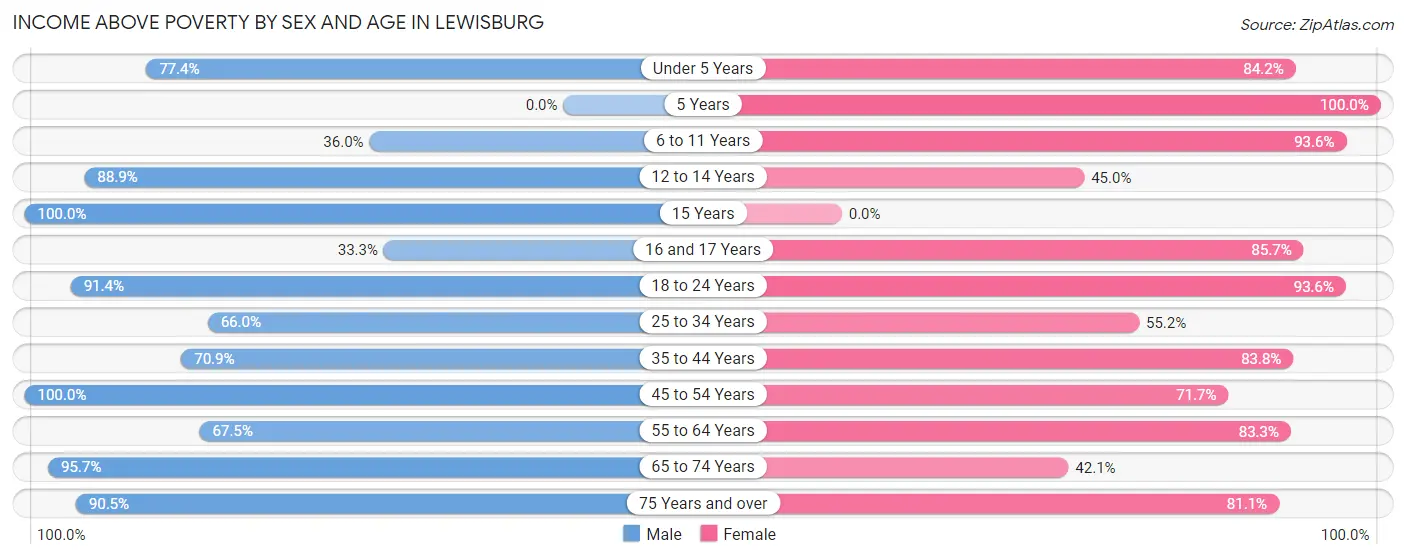
Income Above Poverty by Sex and Age in Lewisburg
According to the poverty statistics in Lewisburg, males aged 15 years and females aged 5 years are the age groups that are most secure financially, with 100.0% of males and 100.0% of females in these age groups living above the poverty line.
| Age Bracket | Male | Female |
| Under 5 Years | 48 (77.4%) | 16 (84.2%) |
| 5 Years | 0 (0.0%) | 3 (100.0%) |
| 6 to 11 Years | 18 (36.0%) | 44 (93.6%) |
| 12 to 14 Years | 8 (88.9%) | 9 (45.0%) |
| 15 Years | 20 (100.0%) | 0 (0.0%) |
| 16 and 17 Years | 5 (33.3%) | 6 (85.7%) |
| 18 to 24 Years | 32 (91.4%) | 29 (93.5%) |
| 25 to 34 Years | 33 (66.0%) | 32 (55.2%) |
| 35 to 44 Years | 39 (70.9%) | 31 (83.8%) |
| 45 to 54 Years | 134 (100.0%) | 33 (71.7%) |
| 55 to 64 Years | 52 (67.5%) | 40 (83.3%) |
| 65 to 74 Years | 44 (95.7%) | 45 (42.1%) |
| 75 Years and over | 38 (90.5%) | 43 (81.1%) |
| Total | 471 (77.8%) | 331 (69.1%) |
Income Below Poverty Among Married-Couple Families in Lewisburg
The poverty statistics for married-couple families in Lewisburg show that 14.7% or 25 of the total 170 families live below the poverty line. Families with 5 or more children have the highest poverty rate of 100.0%, comprising of 1 families. On the other hand, families with no children have the lowest poverty rate of 6.2%, which includes 6 families.
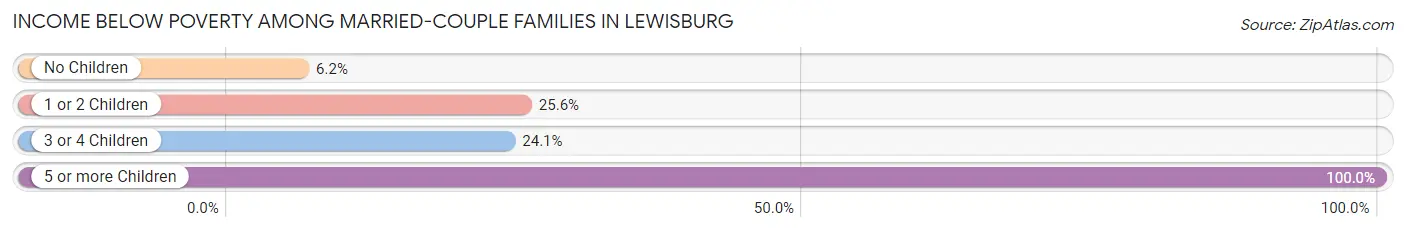
| Children | Above Poverty | Below Poverty |
| No Children | 91 (93.8%) | 6 (6.2%) |
| 1 or 2 Children | 32 (74.4%) | 11 (25.6%) |
| 3 or 4 Children | 22 (75.9%) | 7 (24.1%) |
| 5 or more Children | 0 (0.0%) | 1 (100.0%) |
| Total | 145 (85.3%) | 25 (14.7%) |
Income Below Poverty Among Single-Parent Households in Lewisburg
According to the poverty data in Lewisburg, 15.8% or 3 single-father households and 12.5% or 7 single-mother households are living below the poverty line. Among single-father households, those with 3 or 4 children have the highest poverty rate, with 3 households (100.0%) experiencing poverty. Likewise, among single-mother households, those with 1 or 2 children have the highest poverty rate, with 7 households (24.1%) falling below the poverty line.
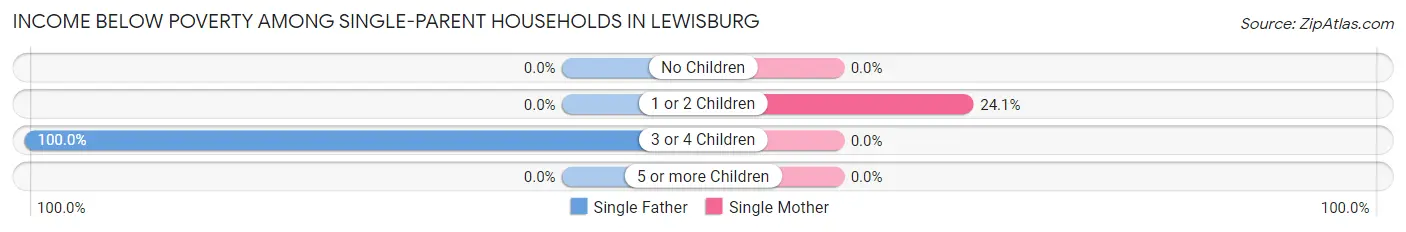
| Children | Single Father | Single Mother |
| No Children | 0 (0.0%) | 0 (0.0%) |
| 1 or 2 Children | 0 (0.0%) | 7 (24.1%) |
| 3 or 4 Children | 3 (100.0%) | 0 (0.0%) |
| 5 or more Children | 0 (0.0%) | 0 (0.0%) |
| Total | 3 (15.8%) | 7 (12.5%) |
Income Below Poverty Among Married-Couple vs Single-Parent Households in Lewisburg
The poverty data for Lewisburg shows that 25 of the married-couple family households (14.7%) and 10 of the single-parent households (13.3%) are living below the poverty level. Within the married-couple family households, those with 5 or more children have the highest poverty rate, with 1 households (100.0%) falling below the poverty line. Among the single-parent households, those with 3 or 4 children have the highest poverty rate, with 3 household (100.0%) living below poverty.
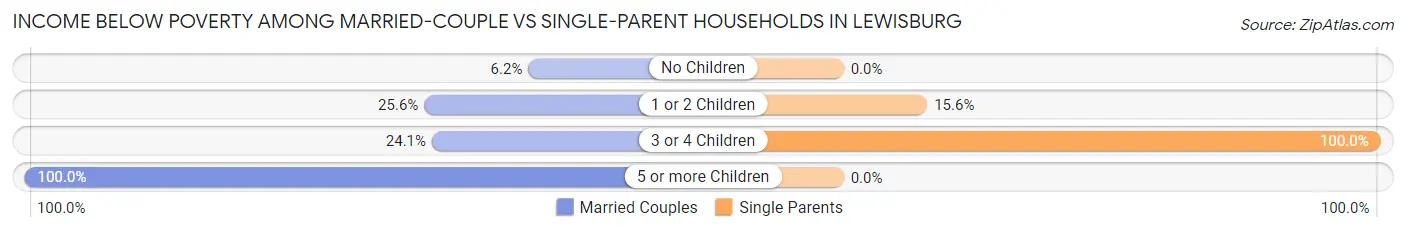
| Children | Married-Couple Families | Single-Parent Households |
| No Children | 6 (6.2%) | 0 (0.0%) |
| 1 or 2 Children | 11 (25.6%) | 7 (15.6%) |
| 3 or 4 Children | 7 (24.1%) | 3 (100.0%) |
| 5 or more Children | 1 (100.0%) | 0 (0.0%) |
| Total | 25 (14.7%) | 10 (13.3%) |
Race in Lewisburg
The most populous races in Lewisburg are White / Caucasian (1,036 | 95.6%), Two or more Races (20 | 1.8%), and Asian (10 | 0.9%).

| Race | # Population | % Population |
| Asian | 10 | 0.9% |
| Black / African American | 7 | 0.6% |
| Hawaiian / Pacific | 0 | 0.0% |
| Hispanic or Latino | 5 | 0.5% |
| Native / Alaskan | 9 | 0.8% |
| White / Caucasian | 1,036 | 95.6% |
| Two or more Races | 20 | 1.8% |
| Some other Race | 2 | 0.2% |
| Total | 1,084 | 100.0% |
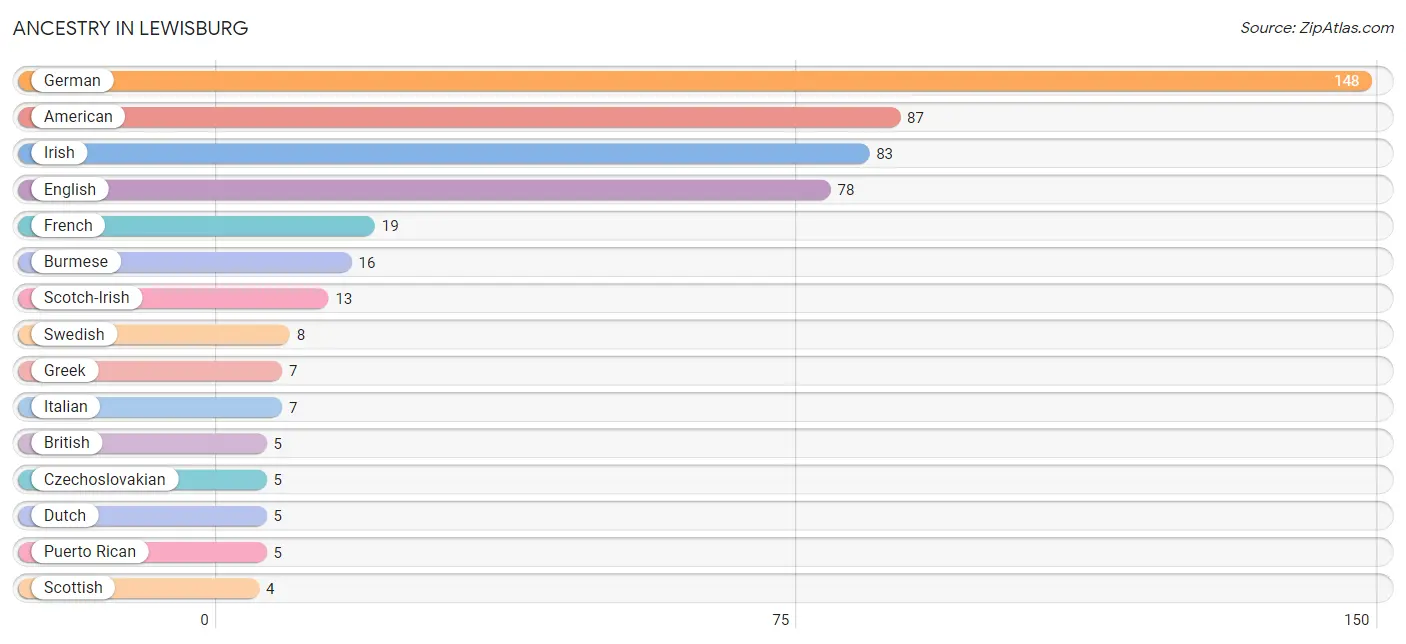
Ancestry in Lewisburg
The most populous ancestries reported in Lewisburg are German (148 | 13.7%), American (87 | 8.0%), Irish (83 | 7.7%), English (78 | 7.2%), and French (19 | 1.8%), together accounting for 38.3% of all Lewisburg residents.
| Ancestry | # Population | % Population |
| American | 87 | 8.0% |
| British | 5 | 0.5% |
| Burmese | 16 | 1.5% |
| Czech | 3 | 0.3% |
| Czechoslovakian | 5 | 0.5% |
| Dutch | 5 | 0.5% |
| English | 78 | 7.2% |
| French | 19 | 1.8% |
| German | 148 | 13.7% |
| Greek | 7 | 0.6% |
| Irish | 83 | 7.7% |
| Italian | 7 | 0.6% |
| Mexican American Indian | 2 | 0.2% |
| Puerto Rican | 5 | 0.5% |
| Scotch-Irish | 13 | 1.2% |
| Scottish | 4 | 0.4% |
| Swedish | 8 | 0.7% | View All 17 Rows |
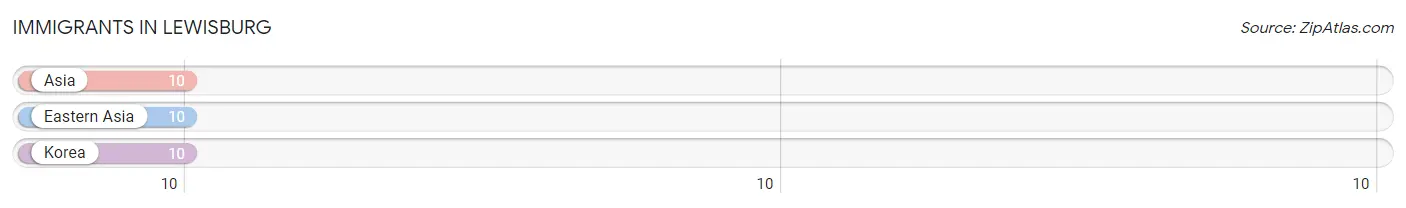
Immigrants in Lewisburg
The most numerous immigrant groups reported in Lewisburg came from Asia (10 | 0.9%), Eastern Asia (10 | 0.9%), and Korea (10 | 0.9%), together accounting for 2.8% of all Lewisburg residents.
| Immigration Origin | # Population | % Population |
| Asia | 10 | 0.9% |
| Eastern Asia | 10 | 0.9% |
| Korea | 10 | 0.9% | View All 3 Rows |
Sex and Age in Lewisburg
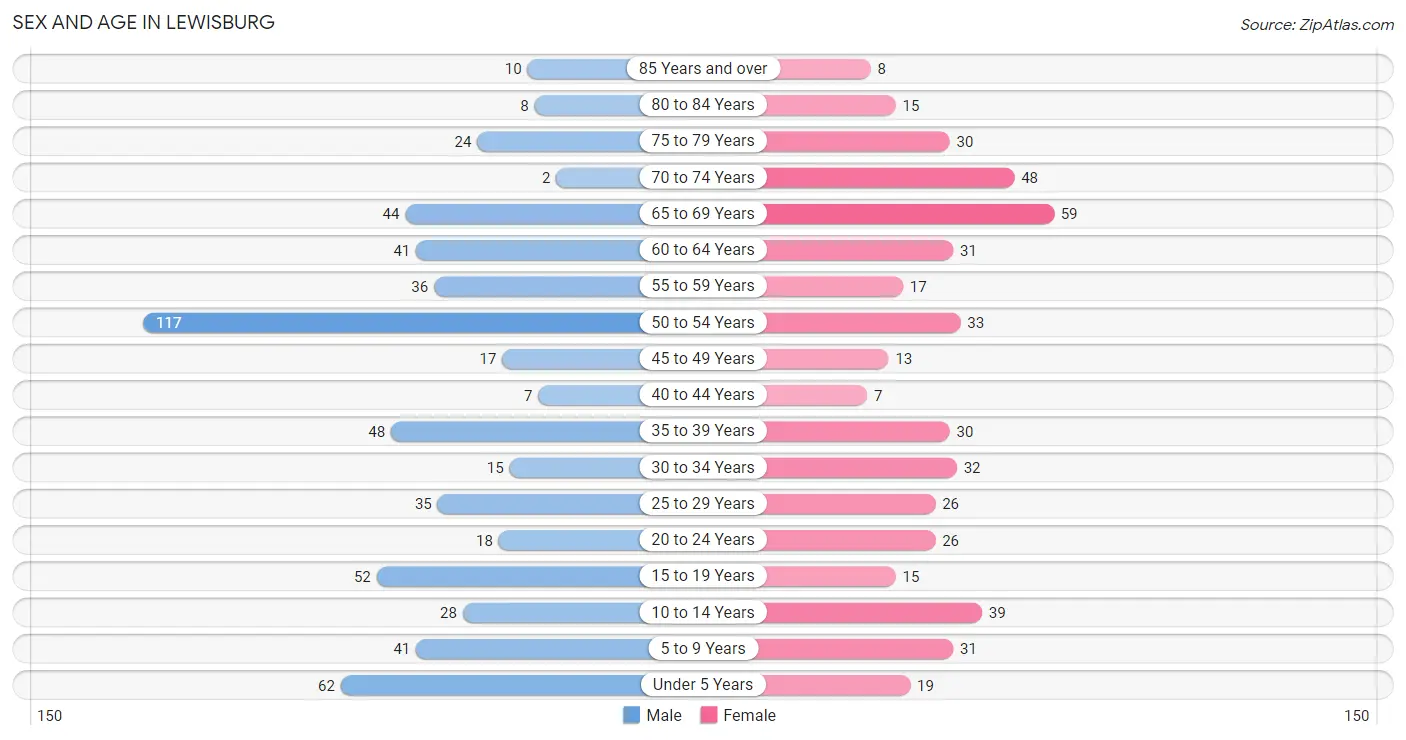
Sex and Age in Lewisburg
The most populous age groups in Lewisburg are 50 to 54 Years (117 | 19.3%) for men and 65 to 69 Years (59 | 12.3%) for women.
| Age Bracket | Male | Female |
| Under 5 Years | 62 (10.2%) | 19 (4.0%) |
| 5 to 9 Years | 41 (6.8%) | 31 (6.5%) |
| 10 to 14 Years | 28 (4.6%) | 39 (8.1%) |
| 15 to 19 Years | 52 (8.6%) | 15 (3.1%) |
| 20 to 24 Years | 18 (3.0%) | 26 (5.4%) |
| 25 to 29 Years | 35 (5.8%) | 26 (5.4%) |
| 30 to 34 Years | 15 (2.5%) | 32 (6.7%) |
| 35 to 39 Years | 48 (7.9%) | 30 (6.3%) |
| 40 to 44 Years | 7 (1.2%) | 7 (1.5%) |
| 45 to 49 Years | 17 (2.8%) | 13 (2.7%) |
| 50 to 54 Years | 117 (19.3%) | 33 (6.9%) |
| 55 to 59 Years | 36 (5.9%) | 17 (3.5%) |
| 60 to 64 Years | 41 (6.8%) | 31 (6.5%) |
| 65 to 69 Years | 44 (7.3%) | 59 (12.3%) |
| 70 to 74 Years | 2 (0.3%) | 48 (10.0%) |
| 75 to 79 Years | 24 (4.0%) | 30 (6.3%) |
| 80 to 84 Years | 8 (1.3%) | 15 (3.1%) |
| 85 Years and over | 10 (1.7%) | 8 (1.7%) |
| Total | 605 (100.0%) | 479 (100.0%) |
Families and Households in Lewisburg
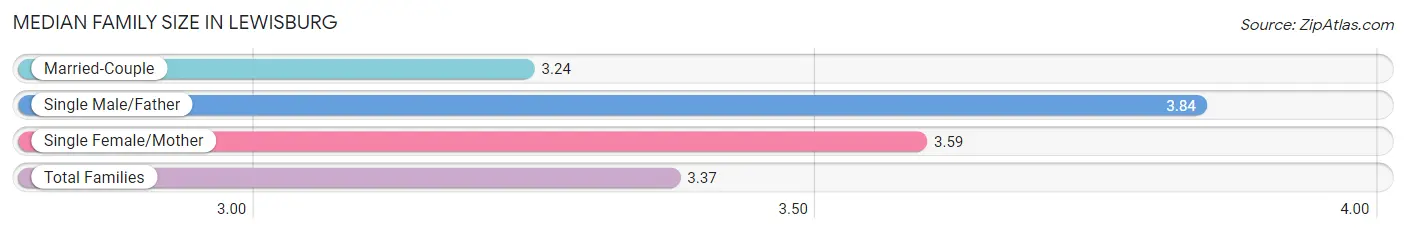
Median Family Size in Lewisburg
The median family size in Lewisburg is 3.37 persons per family, with single male/father families (19 | 7.8%) accounting for the largest median family size of 3.84 persons per family. On the other hand, married-couple families (170 | 69.4%) represent the smallest median family size with 3.24 persons per family.
| Family Type | # Families | Family Size |
| Married-Couple | 170 (69.4%) | 3.24 |
| Single Male/Father | 19 (7.8%) | 3.84 |
| Single Female/Mother | 56 (22.9%) | 3.59 |
| Total Families | 245 (100.0%) | 3.37 |
Median Household Size in Lewisburg
The median household size in Lewisburg is 2.38 persons per household, with single male/father households (19 | 4.2%) accounting for the largest median household size of 4 persons per household. non-family households (211 | 46.3%) represent the smallest median household size with 1.13 persons per household.

| Household Type | # Households | Household Size |
| Married-Couple | 170 (37.3%) | 3.24 |
| Single Male/Father | 19 (4.2%) | 4.00 |
| Single Female/Mother | 56 (12.3%) | 3.89 |
| Non-family | 211 (46.3%) | 1.13 |
| Total Households | 456 (100.0%) | 2.38 |
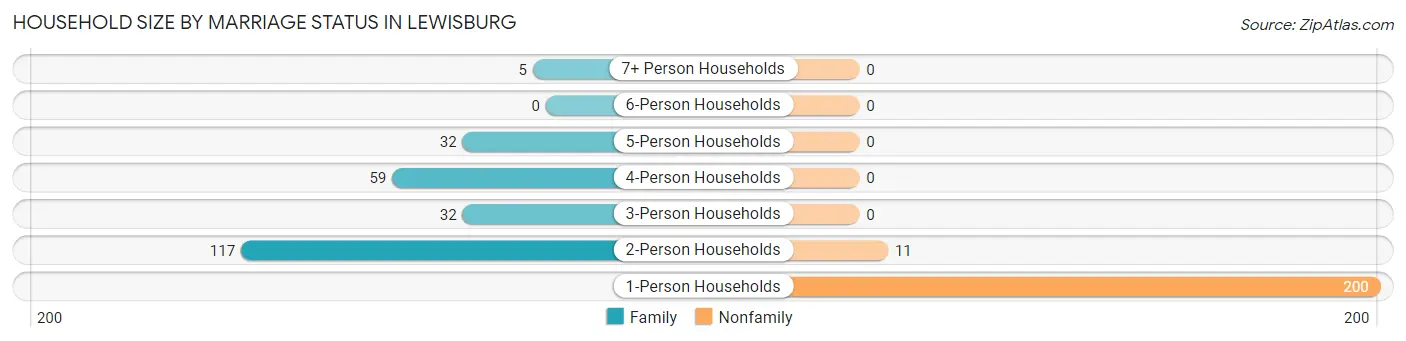
Household Size by Marriage Status in Lewisburg
Out of a total of 456 households in Lewisburg, 245 (53.7%) are family households, while 211 (46.3%) are nonfamily households. The most numerous type of family households are 2-person households, comprising 117, and the most common type of nonfamily households are 1-person households, comprising 200.
| Household Size | Family Households | Nonfamily Households |
| 1-Person Households | - | 200 (43.9%) |
| 2-Person Households | 117 (25.7%) | 11 (2.4%) |
| 3-Person Households | 32 (7.0%) | 0 (0.0%) |
| 4-Person Households | 59 (12.9%) | 0 (0.0%) |
| 5-Person Households | 32 (7.0%) | 0 (0.0%) |
| 6-Person Households | 0 (0.0%) | 0 (0.0%) |
| 7+ Person Households | 5 (1.1%) | 0 (0.0%) |
| Total | 245 (53.7%) | 211 (46.3%) |
Female Fertility in Lewisburg
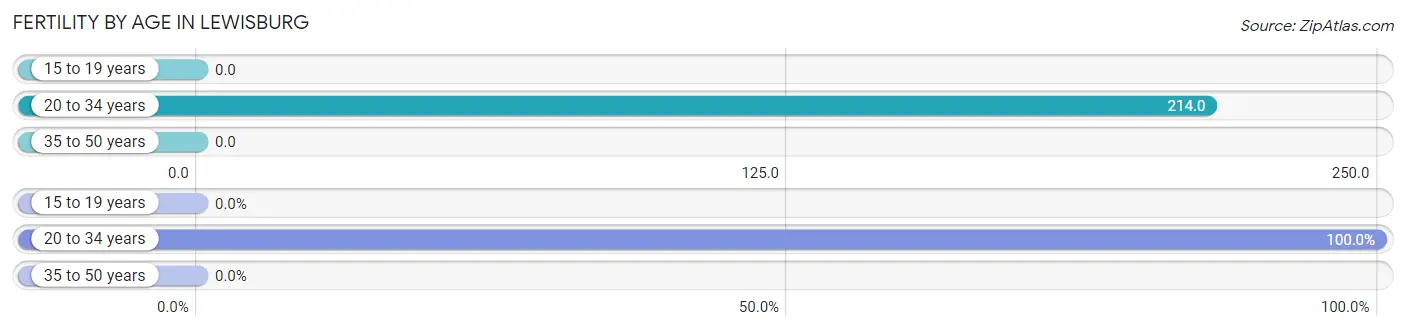
Fertility by Age in Lewisburg
Average fertility rate in Lewisburg is 121.0 births per 1,000 women. Women in the age bracket of 20 to 34 years have the highest fertility rate with 214.0 births per 1,000 women. Women in the age bracket of 20 to 34 years acount for 100.0% of all women with births.
| Age Bracket | Women with Births | Births / 1,000 Women |
| 15 to 19 years | 0 (0.0%) | 0.0 |
| 20 to 34 years | 18 (100.0%) | 214.0 |
| 35 to 50 years | 0 (0.0%) | 0.0 |
| Total | 18 (100.0%) | 121.0 |
Fertility by Age by Marriage Status in Lewisburg
83.3% of women with births (18) in Lewisburg are married. The highest percentage of unmarried women with births falls into 20 to 34 years age bracket with 16.7% of them unmarried at the time of birth, while the lowest percentage of unmarried women with births belong to 20 to 34 years age bracket with 16.7% of them unmarried.
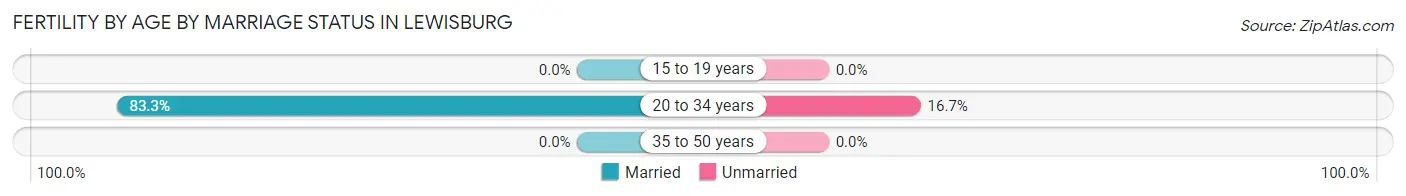
| Age Bracket | Married | Unmarried |
| 15 to 19 years | 0 (0.0%) | 0 (0.0%) |
| 20 to 34 years | 15 (83.3%) | 3 (16.7%) |
| 35 to 50 years | 0 (0.0%) | 0 (0.0%) |
| Total | 15 (83.3%) | 3 (16.7%) |
Fertility by Education in Lewisburg
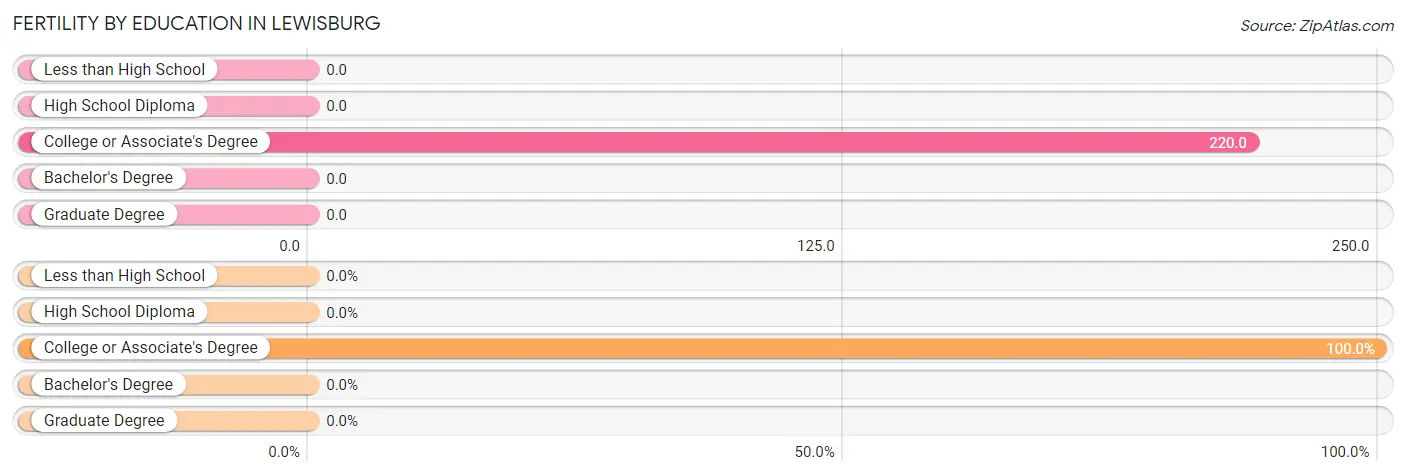
| Educational Attainment | Women with Births | Births / 1,000 Women |
| Less than High School | 0 (0.0%) | 0.0 |
| High School Diploma | 0 (0.0%) | 0.0 |
| College or Associate's Degree | 18 (100.0%) | 220.0 |
| Bachelor's Degree | 0 (0.0%) | 0.0 |
| Graduate Degree | 0 (0.0%) | 0.0 |
| Total | 18 (100.0%) | 121.0 |
Fertility by Education by Marriage Status in Lewisburg
16.7% of women with births in Lewisburg are unmarried. Women with the educational attainment of college or associate's degree are most likely to be married with 83.3% of them married at childbirth, while women with the educational attainment of college or associate's degree are least likely to be married with 16.7% of them unmarried at childbirth.
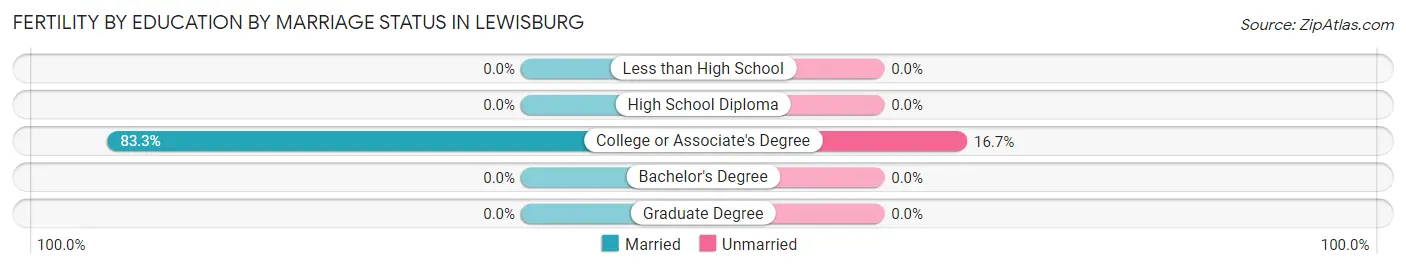
| Educational Attainment | Married | Unmarried |
| Less than High School | 0 (0.0%) | 0 (0.0%) |
| High School Diploma | 0 (0.0%) | 0 (0.0%) |
| College or Associate's Degree | 15 (83.3%) | 3 (16.7%) |
| Bachelor's Degree | 0 (0.0%) | 0 (0.0%) |
| Graduate Degree | 0 (0.0%) | 0 (0.0%) |
| Total | 15 (83.3%) | 3 (16.7%) |
Employment Characteristics in Lewisburg
Employment by Class of Employer in Lewisburg
Among the 275 employed individuals in Lewisburg, private company employees (223 | 81.1%), local government employees (17 | 6.2%), and not-for-profit organizations (15 | 5.4%) make up the most common classes of employment.
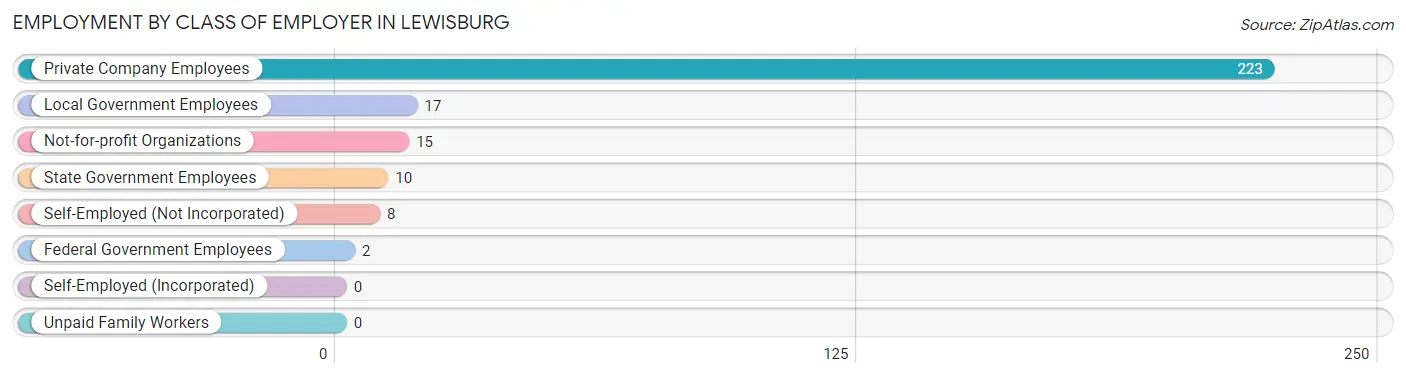
| Employer Class | # Employees | % Employees |
| Private Company Employees | 223 | 81.1% |
| Self-Employed (Incorporated) | 0 | 0.0% |
| Self-Employed (Not Incorporated) | 8 | 2.9% |
| Not-for-profit Organizations | 15 | 5.4% |
| Local Government Employees | 17 | 6.2% |
| State Government Employees | 10 | 3.6% |
| Federal Government Employees | 2 | 0.7% |
| Unpaid Family Workers | 0 | 0.0% |
| Total | 275 | 100.0% |
Employment Status by Age in Lewisburg
According to the labor force statistics for Lewisburg, out of the total population over 16 years of age (841), 36.4% or 306 individuals are in the labor force, with 9.5% or 29 of them unemployed. The age group with the highest labor force participation rate is 35 to 44 years, with 85.9% or 79 individuals in the labor force. Within the labor force, the 25 to 29 years age range has the highest percentage of unemployed individuals, with 26.7% or 12 of them being unemployed.
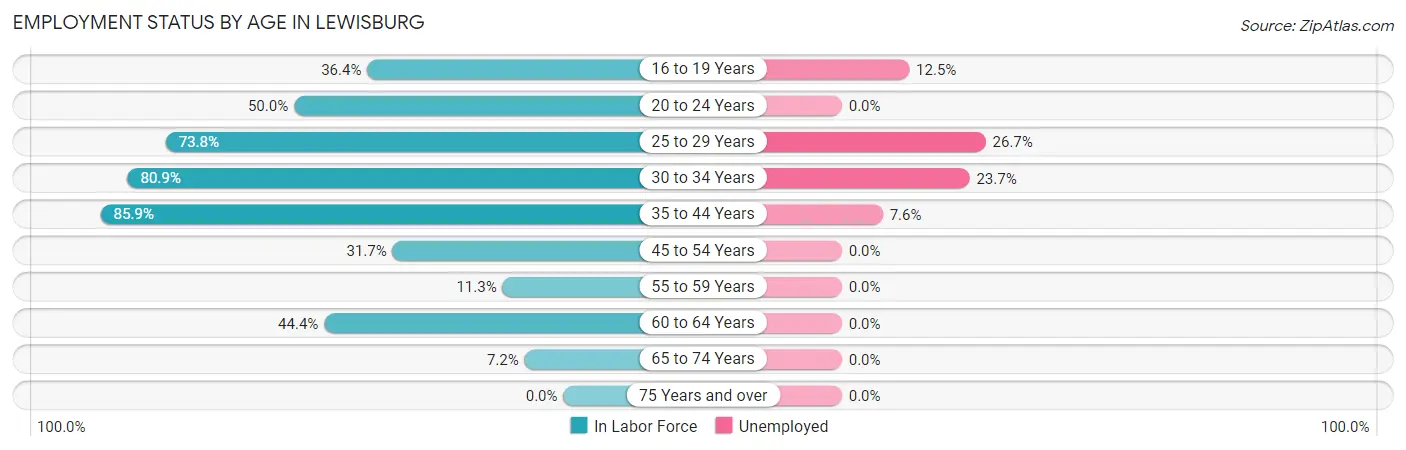
| Age Bracket | In Labor Force | Unemployed |
| 16 to 19 Years | 16 (36.4%) | 2 (12.5%) |
| 20 to 24 Years | 22 (50.0%) | 0 (0.0%) |
| 25 to 29 Years | 45 (73.8%) | 12 (26.7%) |
| 30 to 34 Years | 38 (80.9%) | 9 (23.7%) |
| 35 to 44 Years | 79 (85.9%) | 6 (7.6%) |
| 45 to 54 Years | 57 (31.7%) | 0 (0.0%) |
| 55 to 59 Years | 6 (11.3%) | 0 (0.0%) |
| 60 to 64 Years | 32 (44.4%) | 0 (0.0%) |
| 65 to 74 Years | 11 (7.2%) | 0 (0.0%) |
| 75 Years and over | 0 (0.0%) | 0 (0.0%) |
| Total | 306 (36.4%) | 29 (9.5%) |
Employment Status by Educational Attainment in Lewisburg
According to labor force statistics for Lewisburg, 50.9% of individuals (257) out of the total population between 25 and 64 years of age (505) are in the labor force, with 10.5% or 27 of them being unemployed. The group with the highest labor force participation rate are those with the educational attainment of college / associate degree, with 82.2% or 106 individuals in the labor force. Within the labor force, individuals with college / associate degree education have the highest percentage of unemployment, with 17.0% or 18 of them being unemployed.
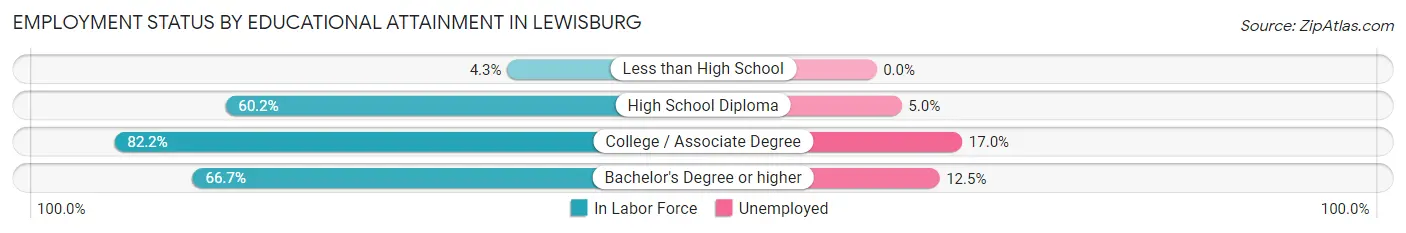
| Educational Attainment | In Labor Force | Unemployed |
| Less than High School | 6 (4.3%) | 0 (0.0%) |
| High School Diploma | 121 (60.2%) | 10 (5.0%) |
| College / Associate Degree | 106 (82.2%) | 22 (17.0%) |
| Bachelor's Degree or higher | 24 (66.7%) | 4 (12.5%) |
| Total | 257 (50.9%) | 53 (10.5%) |
Employment Occupations by Sex in Lewisburg
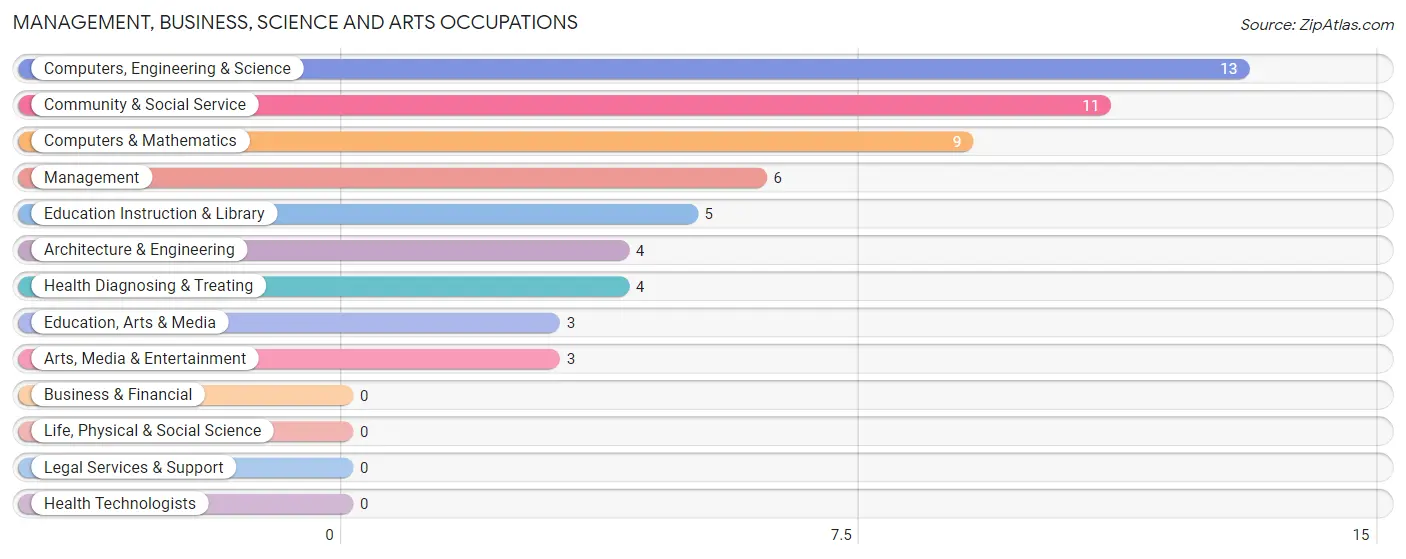
Management, Business, Science and Arts Occupations
The most common Management, Business, Science and Arts occupations in Lewisburg are Computers, Engineering & Science (13 | 4.7%), Community & Social Service (11 | 4.0%), Computers & Mathematics (9 | 3.3%), Management (6 | 2.2%), and Education Instruction & Library (5 | 1.8%).
Management, Business, Science and Arts Occupations by Sex
Within the Management, Business, Science and Arts occupations in Lewisburg, the most male-oriented occupations are Management (100.0%), Architecture & Engineering (100.0%), and Education Instruction & Library (100.0%), while the most female-oriented occupations are Education, Arts & Media (100.0%), Health Diagnosing & Treating (100.0%), and Computers & Mathematics (77.8%).
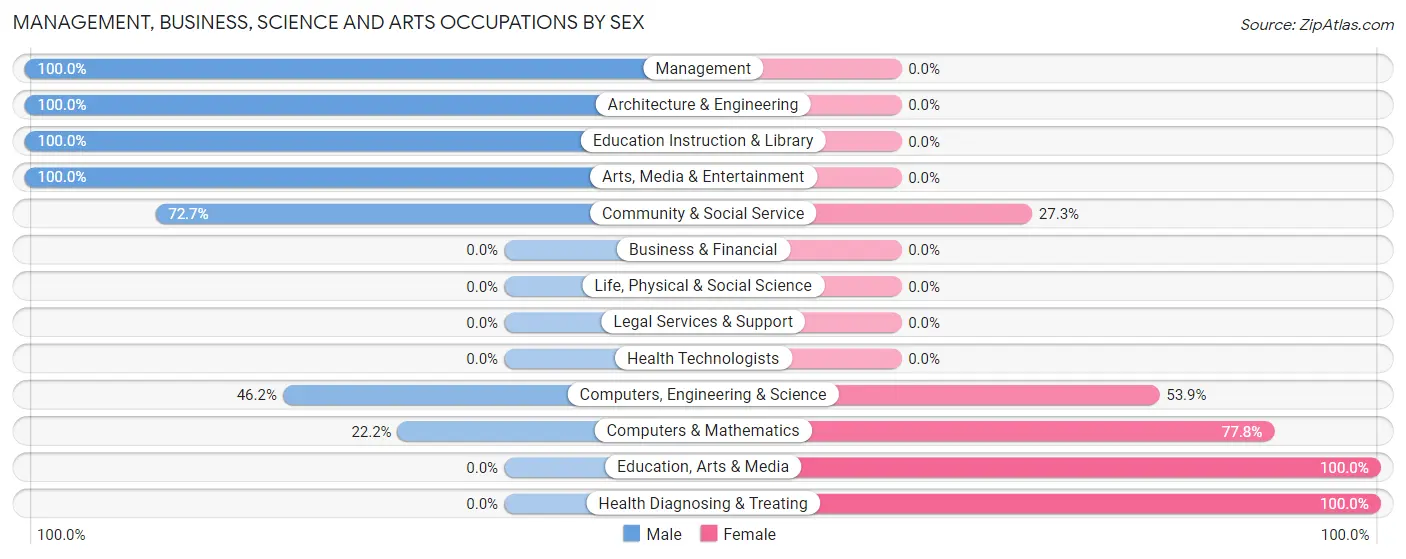
| Occupation | Male | Female |
| Management | 6 (100.0%) | 0 (0.0%) |
| Business & Financial | 0 (0.0%) | 0 (0.0%) |
| Computers, Engineering & Science | 6 (46.2%) | 7 (53.8%) |
| Computers & Mathematics | 2 (22.2%) | 7 (77.8%) |
| Architecture & Engineering | 4 (100.0%) | 0 (0.0%) |
| Life, Physical & Social Science | 0 (0.0%) | 0 (0.0%) |
| Community & Social Service | 8 (72.7%) | 3 (27.3%) |
| Education, Arts & Media | 0 (0.0%) | 3 (100.0%) |
| Legal Services & Support | 0 (0.0%) | 0 (0.0%) |
| Education Instruction & Library | 5 (100.0%) | 0 (0.0%) |
| Arts, Media & Entertainment | 3 (100.0%) | 0 (0.0%) |
| Health Diagnosing & Treating | 0 (0.0%) | 4 (100.0%) |
| Health Technologists | 0 (0.0%) | 0 (0.0%) |
| Total (Category) | 20 (58.8%) | 14 (41.2%) |
| Total (Overall) | 154 (55.6%) | 123 (44.4%) |
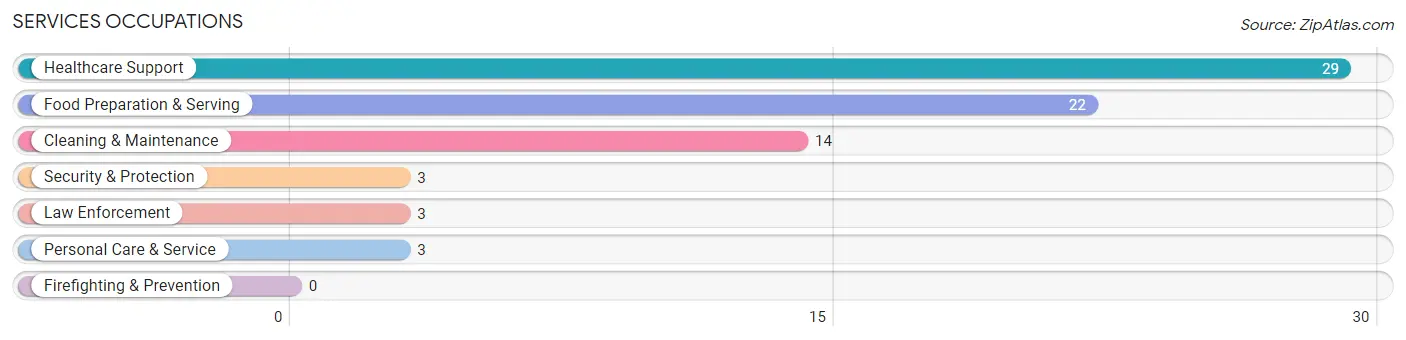
Services Occupations
The most common Services occupations in Lewisburg are Healthcare Support (29 | 10.5%), Food Preparation & Serving (22 | 7.9%), Cleaning & Maintenance (14 | 5.1%), Security & Protection (3 | 1.1%), and Law Enforcement (3 | 1.1%).
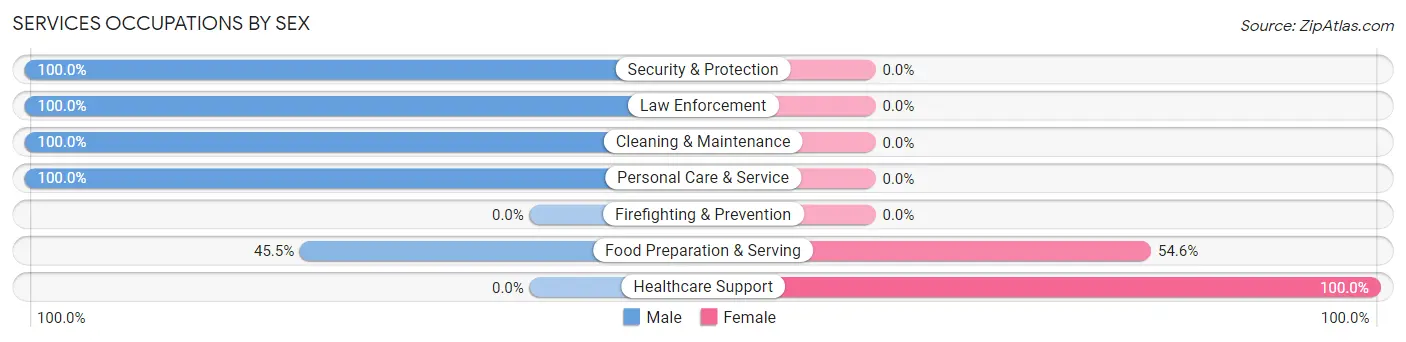
Services Occupations by Sex
Within the Services occupations in Lewisburg, the most male-oriented occupations are Security & Protection (100.0%), Law Enforcement (100.0%), and Cleaning & Maintenance (100.0%), while the most female-oriented occupations are Healthcare Support (100.0%), and Food Preparation & Serving (54.5%).
| Occupation | Male | Female |
| Healthcare Support | 0 (0.0%) | 29 (100.0%) |
| Security & Protection | 3 (100.0%) | 0 (0.0%) |
| Firefighting & Prevention | 0 (0.0%) | 0 (0.0%) |
| Law Enforcement | 3 (100.0%) | 0 (0.0%) |
| Food Preparation & Serving | 10 (45.5%) | 12 (54.5%) |
| Cleaning & Maintenance | 14 (100.0%) | 0 (0.0%) |
| Personal Care & Service | 3 (100.0%) | 0 (0.0%) |
| Total (Category) | 30 (42.2%) | 41 (57.8%) |
| Total (Overall) | 154 (55.6%) | 123 (44.4%) |
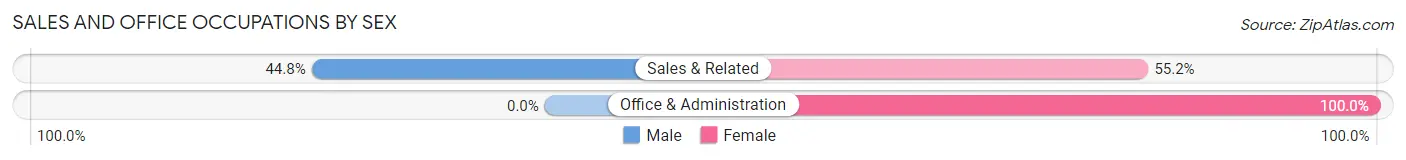
Sales and Office Occupations
The most common Sales and Office occupations in Lewisburg are Office & Administration (35 | 12.6%), and Sales & Related (29 | 10.5%).

Sales and Office Occupations by Sex
| Occupation | Male | Female |
| Sales & Related | 13 (44.8%) | 16 (55.2%) |
| Office & Administration | 0 (0.0%) | 35 (100.0%) |
| Total (Category) | 13 (20.3%) | 51 (79.7%) |
| Total (Overall) | 154 (55.6%) | 123 (44.4%) |
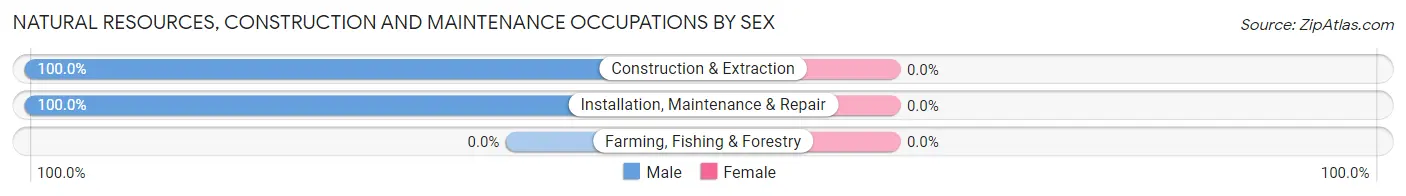
Natural Resources, Construction and Maintenance Occupations
The most common Natural Resources, Construction and Maintenance occupations in Lewisburg are Installation, Maintenance & Repair (15 | 5.4%), and Construction & Extraction (11 | 4.0%).

Natural Resources, Construction and Maintenance Occupations by Sex
| Occupation | Male | Female |
| Farming, Fishing & Forestry | 0 (0.0%) | 0 (0.0%) |
| Construction & Extraction | 11 (100.0%) | 0 (0.0%) |
| Installation, Maintenance & Repair | 15 (100.0%) | 0 (0.0%) |
| Total (Category) | 26 (100.0%) | 0 (0.0%) |
| Total (Overall) | 154 (55.6%) | 123 (44.4%) |
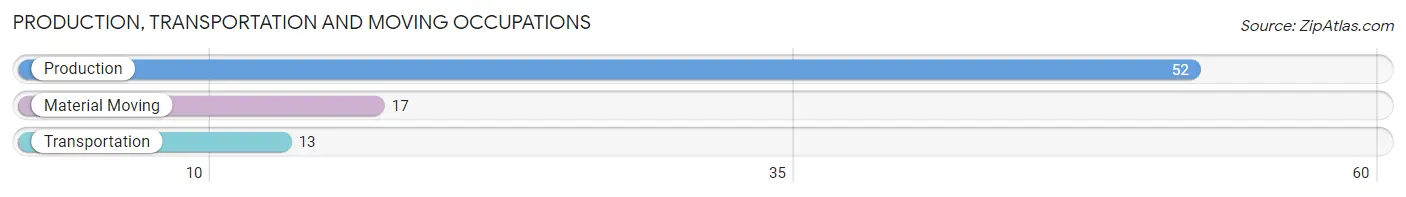
Production, Transportation and Moving Occupations
The most common Production, Transportation and Moving occupations in Lewisburg are Production (52 | 18.8%), Material Moving (17 | 6.1%), and Transportation (13 | 4.7%).
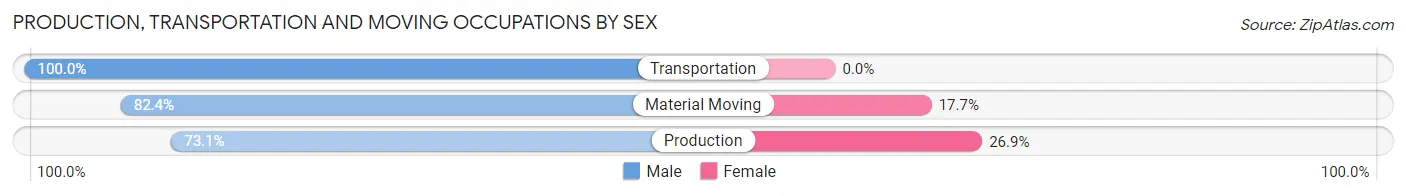
Production, Transportation and Moving Occupations by Sex
| Occupation | Male | Female |
| Production | 38 (73.1%) | 14 (26.9%) |
| Transportation | 13 (100.0%) | 0 (0.0%) |
| Material Moving | 14 (82.4%) | 3 (17.6%) |
| Total (Category) | 65 (79.3%) | 17 (20.7%) |
| Total (Overall) | 154 (55.6%) | 123 (44.4%) |
Employment Industries by Sex in Lewisburg
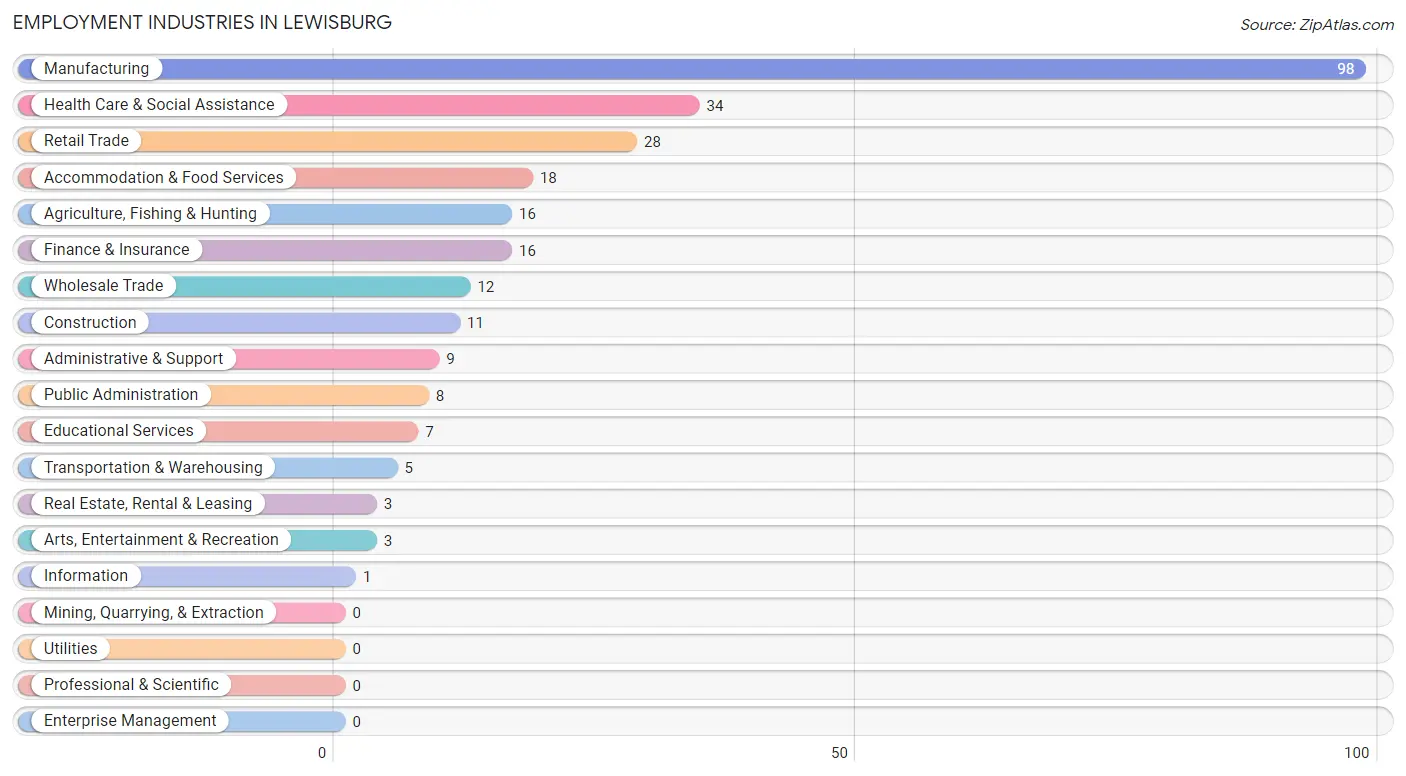
Employment Industries in Lewisburg
The major employment industries in Lewisburg include Manufacturing (98 | 35.4%), Health Care & Social Assistance (34 | 12.3%), Retail Trade (28 | 10.1%), Accommodation & Food Services (18 | 6.5%), and Agriculture, Fishing & Hunting (16 | 5.8%).
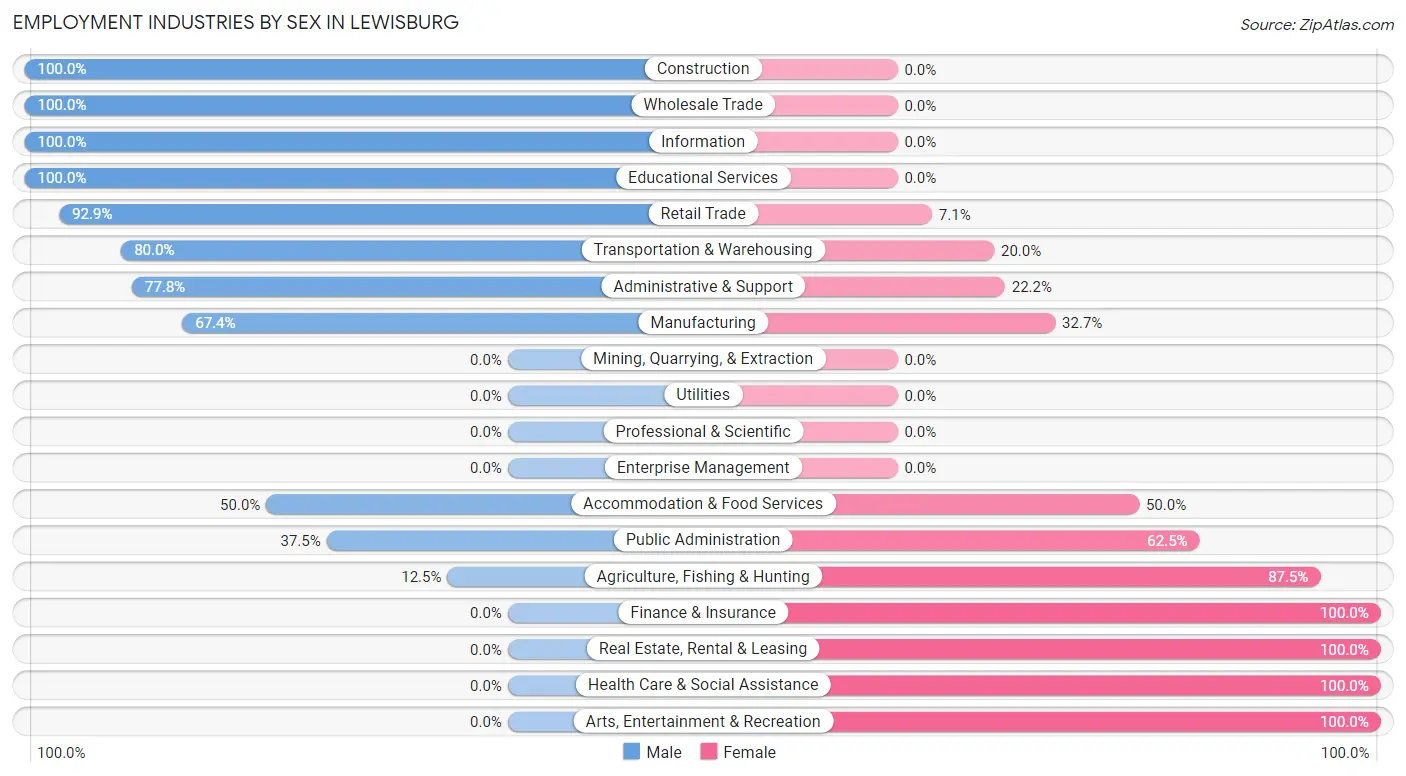
Employment Industries by Sex in Lewisburg
The Lewisburg industries that see more men than women are Construction (100.0%), Wholesale Trade (100.0%), and Information (100.0%), whereas the industries that tend to have a higher number of women are Finance & Insurance (100.0%), Real Estate, Rental & Leasing (100.0%), and Health Care & Social Assistance (100.0%).
| Industry | Male | Female |
| Agriculture, Fishing & Hunting | 2 (12.5%) | 14 (87.5%) |
| Mining, Quarrying, & Extraction | 0 (0.0%) | 0 (0.0%) |
| Construction | 11 (100.0%) | 0 (0.0%) |
| Manufacturing | 66 (67.3%) | 32 (32.7%) |
| Wholesale Trade | 12 (100.0%) | 0 (0.0%) |
| Retail Trade | 26 (92.9%) | 2 (7.1%) |
| Transportation & Warehousing | 4 (80.0%) | 1 (20.0%) |
| Utilities | 0 (0.0%) | 0 (0.0%) |
| Information | 1 (100.0%) | 0 (0.0%) |
| Finance & Insurance | 0 (0.0%) | 16 (100.0%) |
| Real Estate, Rental & Leasing | 0 (0.0%) | 3 (100.0%) |
| Professional & Scientific | 0 (0.0%) | 0 (0.0%) |
| Enterprise Management | 0 (0.0%) | 0 (0.0%) |
| Administrative & Support | 7 (77.8%) | 2 (22.2%) |
| Educational Services | 7 (100.0%) | 0 (0.0%) |
| Health Care & Social Assistance | 0 (0.0%) | 34 (100.0%) |
| Arts, Entertainment & Recreation | 0 (0.0%) | 3 (100.0%) |
| Accommodation & Food Services | 9 (50.0%) | 9 (50.0%) |
| Public Administration | 3 (37.5%) | 5 (62.5%) |
| Total | 154 (55.6%) | 123 (44.4%) |
Education in Lewisburg
School Enrollment in Lewisburg
The most common levels of schooling among the 219 students in Lewisburg are elementary school (72 | 32.9%), high school (45 | 20.5%), and middle school (37 | 16.9%).
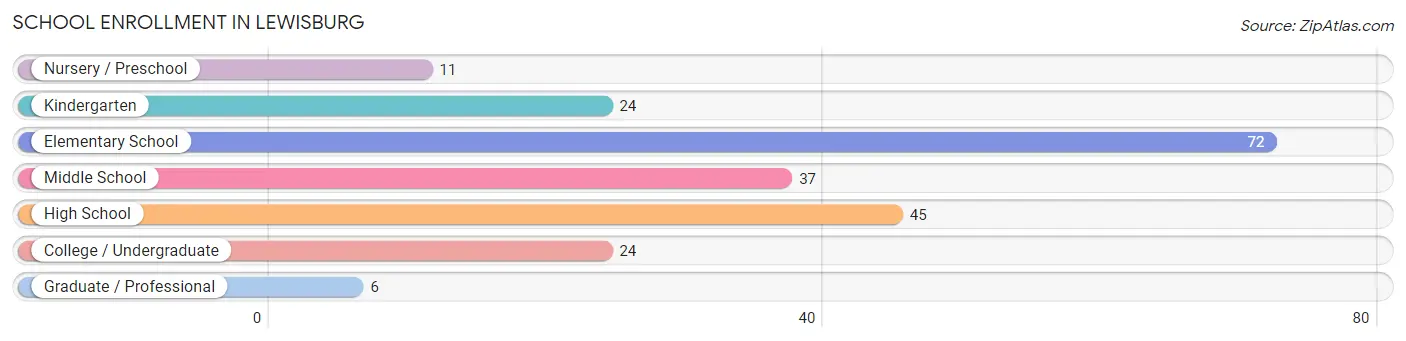
| School Level | # Students | % Students |
| Nursery / Preschool | 11 | 5.0% |
| Kindergarten | 24 | 11.0% |
| Elementary School | 72 | 32.9% |
| Middle School | 37 | 16.9% |
| High School | 45 | 20.5% |
| College / Undergraduate | 24 | 11.0% |
| Graduate / Professional | 6 | 2.7% |
| Total | 219 | 100.0% |
School Enrollment by Age by Funding Source in Lewisburg
Out of a total of 219 students who are enrolled in schools in Lewisburg, 13 (5.9%) attend a private institution, while the remaining 206 (94.1%) are enrolled in public schools. The age group of 10 to 14 year olds has the highest likelihood of being enrolled in private schools, with 9 (13.4% in the age bracket) enrolled. Conversely, the age group of 3 to 4 year olds has the lowest likelihood of being enrolled in a private school, with 8 (100.0% in the age bracket) attending a public institution.
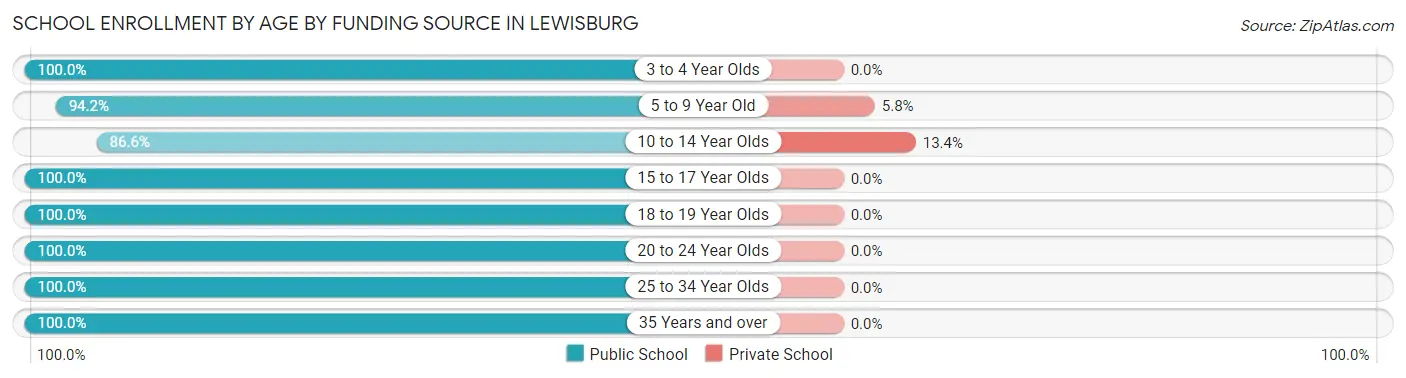
| Age Bracket | Public School | Private School |
| 3 to 4 Year Olds | 8 (100.0%) | 0 (0.0%) |
| 5 to 9 Year Old | 65 (94.2%) | 4 (5.8%) |
| 10 to 14 Year Olds | 58 (86.6%) | 9 (13.4%) |
| 15 to 17 Year Olds | 45 (100.0%) | 0 (0.0%) |
| 18 to 19 Year Olds | 3 (100.0%) | 0 (0.0%) |
| 20 to 24 Year Olds | 2 (100.0%) | 0 (0.0%) |
| 25 to 34 Year Olds | 14 (100.0%) | 0 (0.0%) |
| 35 Years and over | 11 (100.0%) | 0 (0.0%) |
| Total | 206 (94.1%) | 13 (5.9%) |
Educational Attainment by Field of Study in Lewisburg
Arts & humanities (18 | 26.1%), business (13 | 18.8%), liberal arts & history (12 | 17.4%), education (10 | 14.5%), and bio, nature & agricultural (8 | 11.6%) are the most common fields of study among 69 individuals in Lewisburg who have obtained a bachelor's degree or higher.
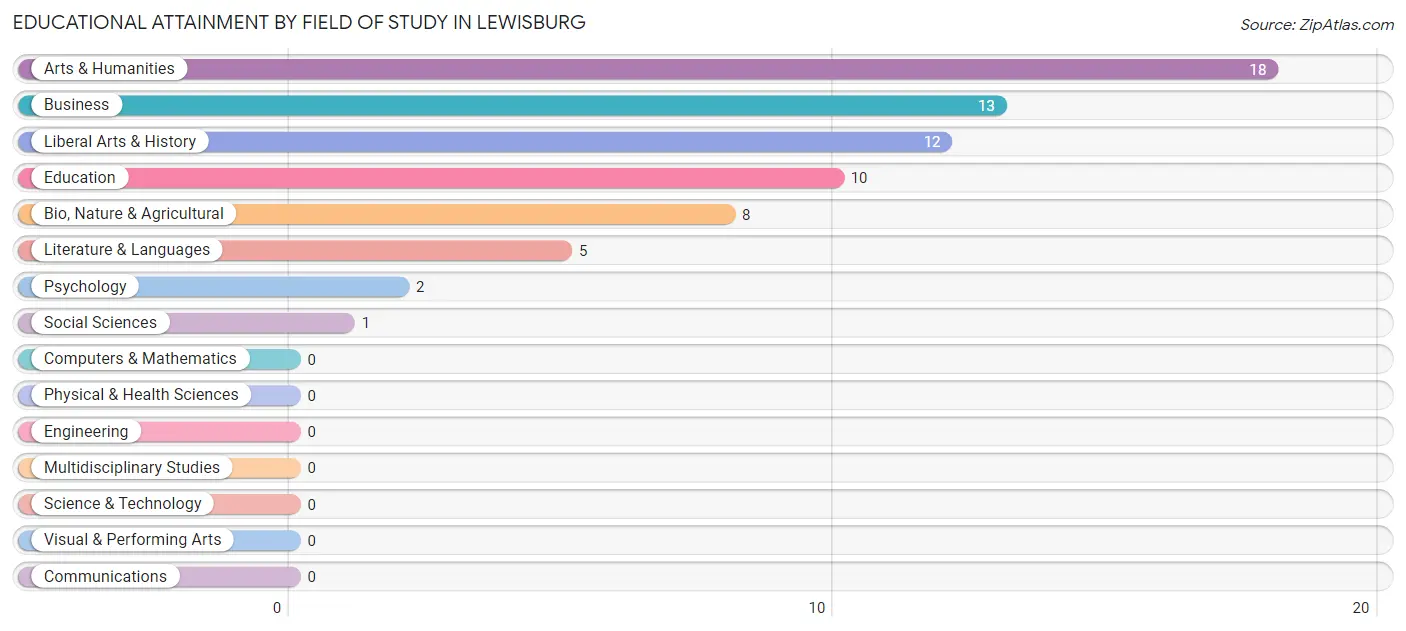
| Field of Study | # Graduates | % Graduates |
| Computers & Mathematics | 0 | 0.0% |
| Bio, Nature & Agricultural | 8 | 11.6% |
| Physical & Health Sciences | 0 | 0.0% |
| Psychology | 2 | 2.9% |
| Social Sciences | 1 | 1.5% |
| Engineering | 0 | 0.0% |
| Multidisciplinary Studies | 0 | 0.0% |
| Science & Technology | 0 | 0.0% |
| Business | 13 | 18.8% |
| Education | 10 | 14.5% |
| Literature & Languages | 5 | 7.2% |
| Liberal Arts & History | 12 | 17.4% |
| Visual & Performing Arts | 0 | 0.0% |
| Communications | 0 | 0.0% |
| Arts & Humanities | 18 | 26.1% |
| Total | 69 | 100.0% |
Transportation & Commute in Lewisburg
Vehicle Availability by Sex in Lewisburg
The most prevalent vehicle ownership categories in Lewisburg are males with 2 vehicles (60, accounting for 39.5%) and females with 2 vehicles (48, making up 48.8%).
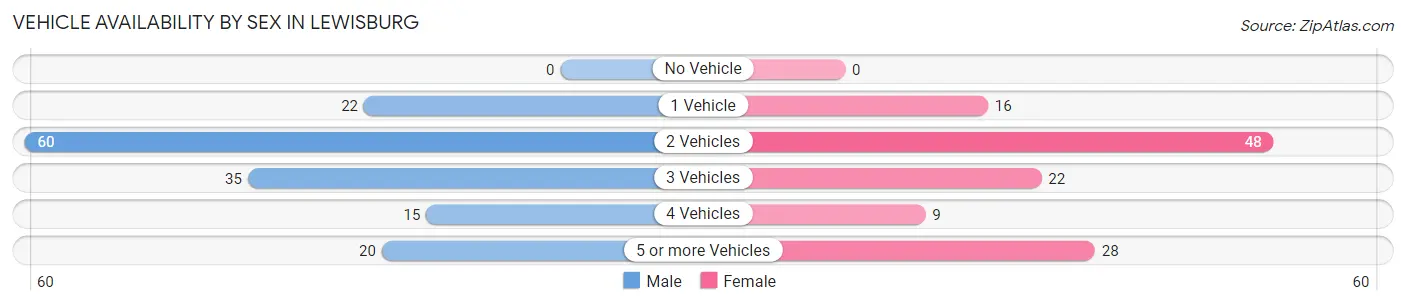
| Vehicles Available | Male | Female |
| No Vehicle | 0 (0.0%) | 0 (0.0%) |
| 1 Vehicle | 22 (14.5%) | 16 (13.0%) |
| 2 Vehicles | 60 (39.5%) | 48 (39.0%) |
| 3 Vehicles | 35 (23.0%) | 22 (17.9%) |
| 4 Vehicles | 15 (9.9%) | 9 (7.3%) |
| 5 or more Vehicles | 20 (13.2%) | 28 (22.8%) |
| Total | 152 (100.0%) | 123 (100.0%) |
Commute Time in Lewisburg
The most frequently occuring commute durations in Lewisburg are 15 to 19 minutes (64 commuters, 23.9%), 5 to 9 minutes (53 commuters, 19.8%), and 20 to 24 minutes (46 commuters, 17.2%).
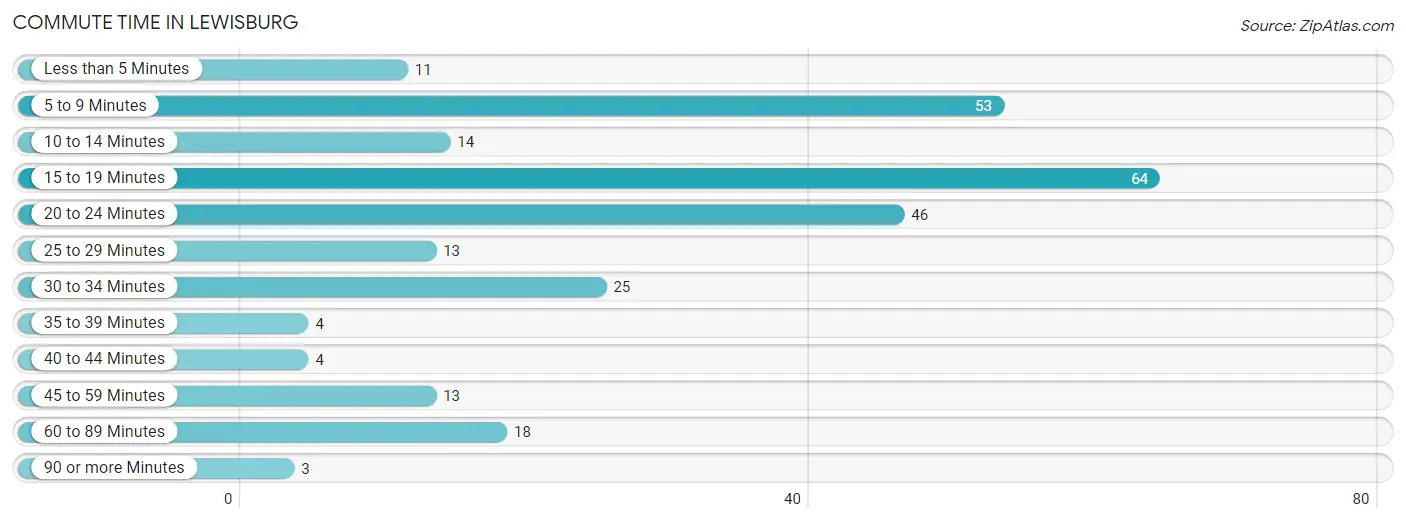
| Commute Time | # Commuters | % Commuters |
| Less than 5 Minutes | 11 | 4.1% |
| 5 to 9 Minutes | 53 | 19.8% |
| 10 to 14 Minutes | 14 | 5.2% |
| 15 to 19 Minutes | 64 | 23.9% |
| 20 to 24 Minutes | 46 | 17.2% |
| 25 to 29 Minutes | 13 | 4.9% |
| 30 to 34 Minutes | 25 | 9.3% |
| 35 to 39 Minutes | 4 | 1.5% |
| 40 to 44 Minutes | 4 | 1.5% |
| 45 to 59 Minutes | 13 | 4.9% |
| 60 to 89 Minutes | 18 | 6.7% |
| 90 or more Minutes | 3 | 1.1% |
Commute Time by Sex in Lewisburg
The most common commute times in Lewisburg are 5 to 9 minutes (40 commuters, 26.7%) for males and 15 to 19 minutes (34 commuters, 28.8%) for females.
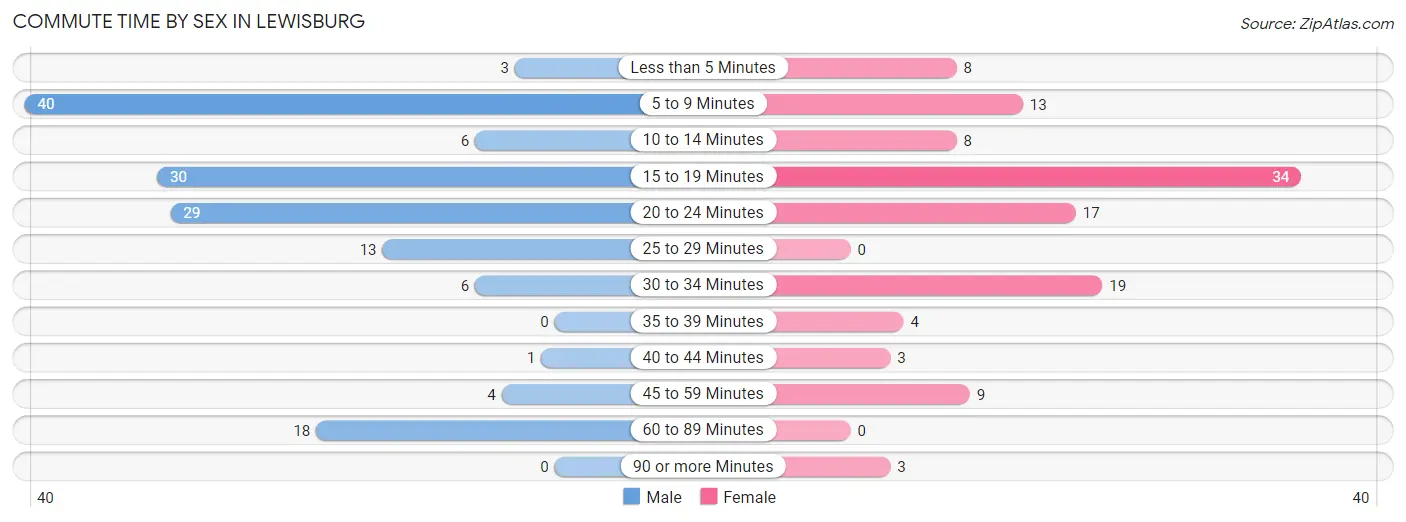
| Commute Time | Male | Female |
| Less than 5 Minutes | 3 (2.0%) | 8 (6.8%) |
| 5 to 9 Minutes | 40 (26.7%) | 13 (11.0%) |
| 10 to 14 Minutes | 6 (4.0%) | 8 (6.8%) |
| 15 to 19 Minutes | 30 (20.0%) | 34 (28.8%) |
| 20 to 24 Minutes | 29 (19.3%) | 17 (14.4%) |
| 25 to 29 Minutes | 13 (8.7%) | 0 (0.0%) |
| 30 to 34 Minutes | 6 (4.0%) | 19 (16.1%) |
| 35 to 39 Minutes | 0 (0.0%) | 4 (3.4%) |
| 40 to 44 Minutes | 1 (0.7%) | 3 (2.5%) |
| 45 to 59 Minutes | 4 (2.7%) | 9 (7.6%) |
| 60 to 89 Minutes | 18 (12.0%) | 0 (0.0%) |
| 90 or more Minutes | 0 (0.0%) | 3 (2.5%) |
Time of Departure to Work by Sex in Lewisburg
The most frequent times of departure to work in Lewisburg are 6:30 AM to 6:59 AM (31, 20.7%) for males and 7:00 AM to 7:29 AM (19, 16.1%) for females.
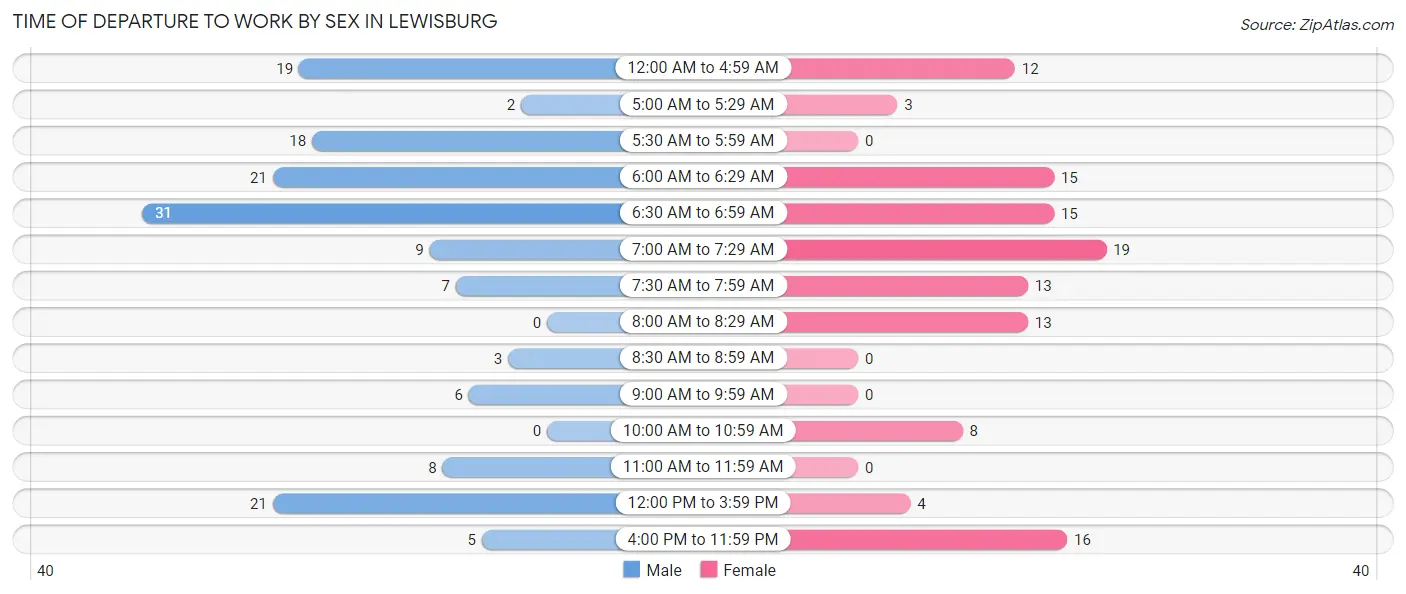
| Time of Departure | Male | Female |
| 12:00 AM to 4:59 AM | 19 (12.7%) | 12 (10.2%) |
| 5:00 AM to 5:29 AM | 2 (1.3%) | 3 (2.5%) |
| 5:30 AM to 5:59 AM | 18 (12.0%) | 0 (0.0%) |
| 6:00 AM to 6:29 AM | 21 (14.0%) | 15 (12.7%) |
| 6:30 AM to 6:59 AM | 31 (20.7%) | 15 (12.7%) |
| 7:00 AM to 7:29 AM | 9 (6.0%) | 19 (16.1%) |
| 7:30 AM to 7:59 AM | 7 (4.7%) | 13 (11.0%) |
| 8:00 AM to 8:29 AM | 0 (0.0%) | 13 (11.0%) |
| 8:30 AM to 8:59 AM | 3 (2.0%) | 0 (0.0%) |
| 9:00 AM to 9:59 AM | 6 (4.0%) | 0 (0.0%) |
| 10:00 AM to 10:59 AM | 0 (0.0%) | 8 (6.8%) |
| 11:00 AM to 11:59 AM | 8 (5.3%) | 0 (0.0%) |
| 12:00 PM to 3:59 PM | 21 (14.0%) | 4 (3.4%) |
| 4:00 PM to 11:59 PM | 5 (3.3%) | 16 (13.6%) |
| Total | 150 (100.0%) | 118 (100.0%) |
Housing Occupancy in Lewisburg
Occupancy by Ownership in Lewisburg
Of the total 456 dwellings in Lewisburg, owner-occupied units account for 325 (71.3%), while renter-occupied units make up 131 (28.7%).
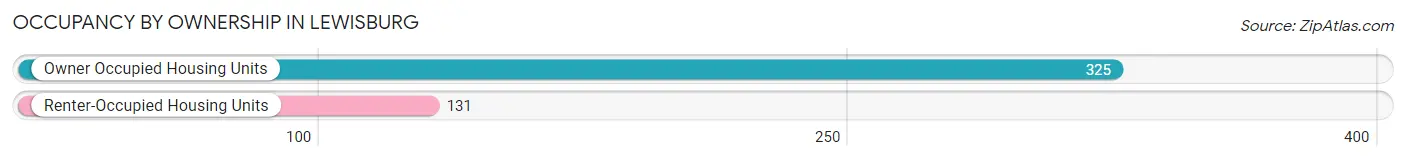
| Occupancy | # Housing Units | % Housing Units |
| Owner Occupied Housing Units | 325 | 71.3% |
| Renter-Occupied Housing Units | 131 | 28.7% |
| Total Occupied Housing Units | 456 | 100.0% |
Occupancy by Household Size in Lewisburg
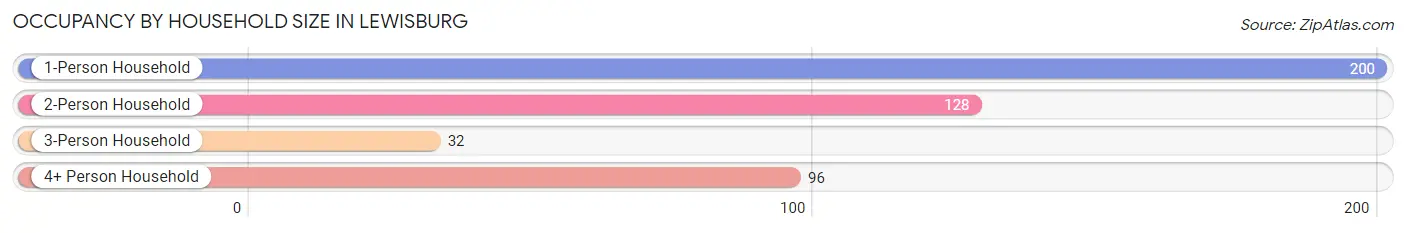
| Household Size | # Housing Units | % Housing Units |
| 1-Person Household | 200 | 43.9% |
| 2-Person Household | 128 | 28.1% |
| 3-Person Household | 32 | 7.0% |
| 4+ Person Household | 96 | 21.0% |
| Total Housing Units | 456 | 100.0% |
Occupancy by Ownership by Household Size in Lewisburg
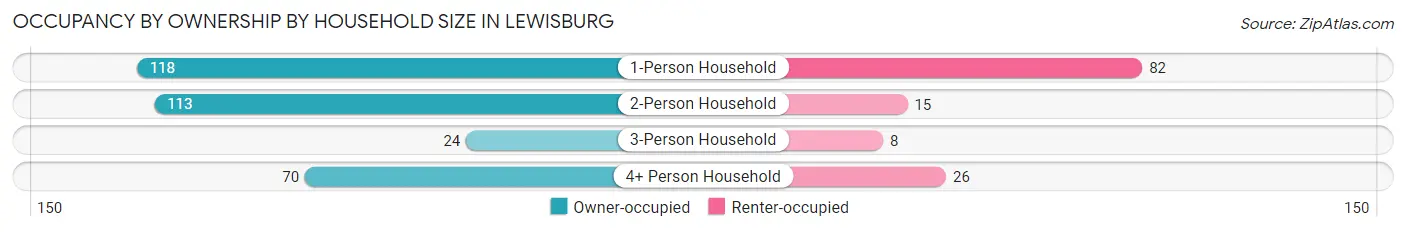
| Household Size | Owner-occupied | Renter-occupied |
| 1-Person Household | 118 (59.0%) | 82 (41.0%) |
| 2-Person Household | 113 (88.3%) | 15 (11.7%) |
| 3-Person Household | 24 (75.0%) | 8 (25.0%) |
| 4+ Person Household | 70 (72.9%) | 26 (27.1%) |
| Total Housing Units | 325 (71.3%) | 131 (28.7%) |
Occupancy by Educational Attainment in Lewisburg
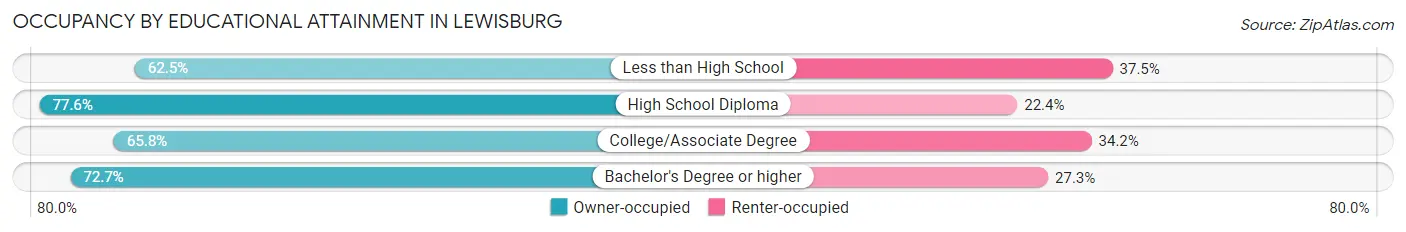
| Household Size | Owner-occupied | Renter-occupied |
| Less than High School | 50 (62.5%) | 30 (37.5%) |
| High School Diploma | 156 (77.6%) | 45 (22.4%) |
| College/Associate Degree | 79 (65.8%) | 41 (34.2%) |
| Bachelor's Degree or higher | 40 (72.7%) | 15 (27.3%) |
Occupancy by Age of Householder in Lewisburg
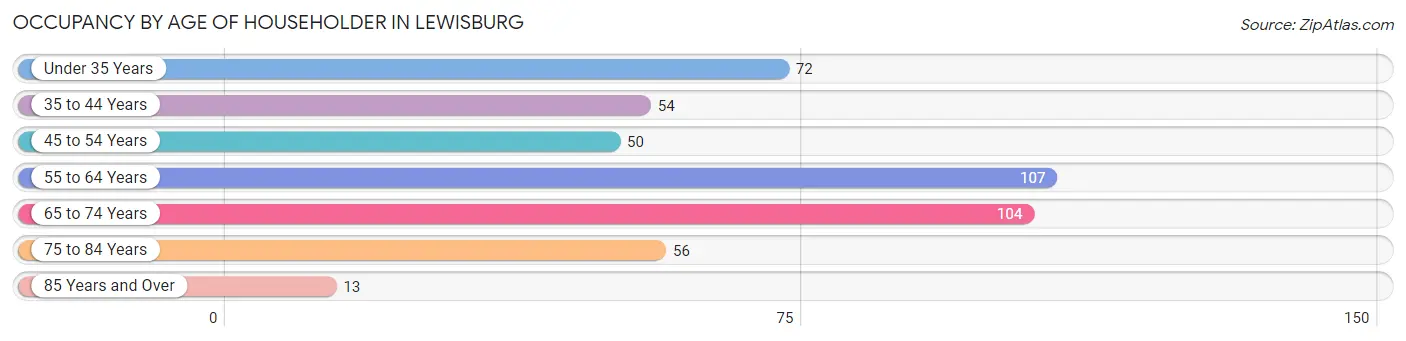
| Age Bracket | # Households | % Households |
| Under 35 Years | 72 | 15.8% |
| 35 to 44 Years | 54 | 11.8% |
| 45 to 54 Years | 50 | 11.0% |
| 55 to 64 Years | 107 | 23.5% |
| 65 to 74 Years | 104 | 22.8% |
| 75 to 84 Years | 56 | 12.3% |
| 85 Years and Over | 13 | 2.9% |
| Total | 456 | 100.0% |
Housing Finances in Lewisburg
Median Income by Occupancy in Lewisburg
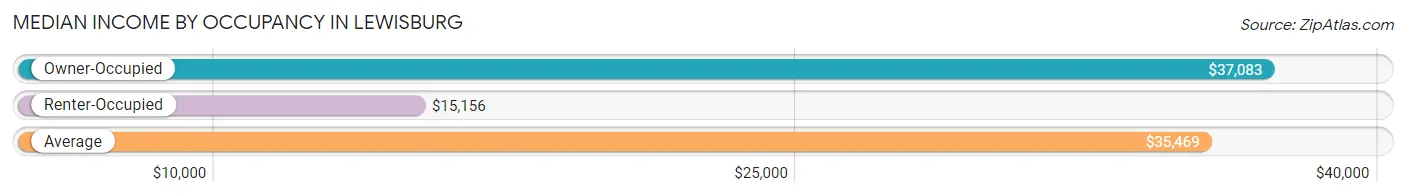
| Occupancy Type | # Households | Median Income |
| Owner-Occupied | 325 (71.3%) | $37,083 |
| Renter-Occupied | 131 (28.7%) | $15,156 |
| Average | 456 (100.0%) | $35,469 |
Occupancy by Householder Income Bracket in Lewisburg
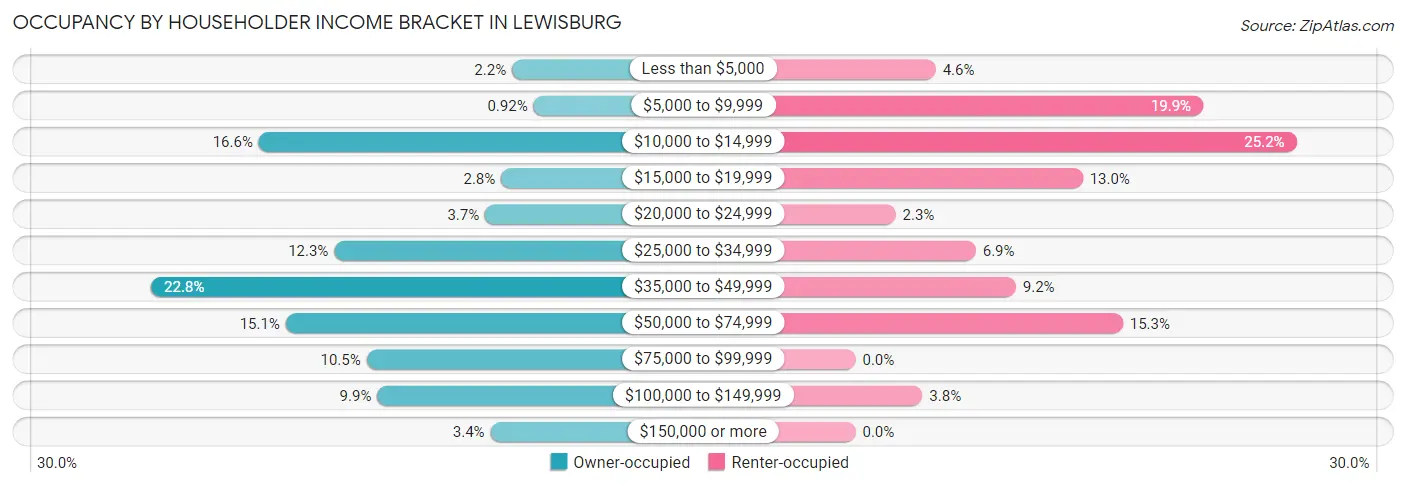
| Income Bracket | Owner-occupied | Renter-occupied |
| Less than $5,000 | 7 (2.1%) | 6 (4.6%) |
| $5,000 to $9,999 | 3 (0.9%) | 26 (19.9%) |
| $10,000 to $14,999 | 54 (16.6%) | 33 (25.2%) |
| $15,000 to $19,999 | 9 (2.8%) | 17 (13.0%) |
| $20,000 to $24,999 | 12 (3.7%) | 3 (2.3%) |
| $25,000 to $34,999 | 40 (12.3%) | 9 (6.9%) |
| $35,000 to $49,999 | 74 (22.8%) | 12 (9.2%) |
| $50,000 to $74,999 | 49 (15.1%) | 20 (15.3%) |
| $75,000 to $99,999 | 34 (10.5%) | 0 (0.0%) |
| $100,000 to $149,999 | 32 (9.9%) | 5 (3.8%) |
| $150,000 or more | 11 (3.4%) | 0 (0.0%) |
| Total | 325 (100.0%) | 131 (100.0%) |
Monthly Housing Cost Tiers in Lewisburg
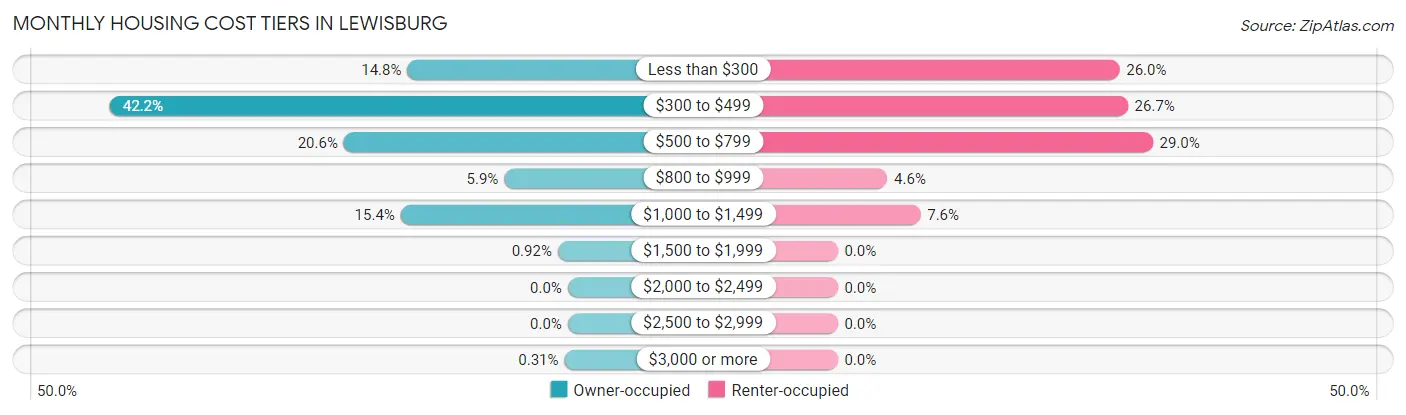
| Monthly Cost | Owner-occupied | Renter-occupied |
| Less than $300 | 48 (14.8%) | 34 (26.0%) |
| $300 to $499 | 137 (42.1%) | 35 (26.7%) |
| $500 to $799 | 67 (20.6%) | 38 (29.0%) |
| $800 to $999 | 19 (5.9%) | 6 (4.6%) |
| $1,000 to $1,499 | 50 (15.4%) | 10 (7.6%) |
| $1,500 to $1,999 | 3 (0.9%) | 0 (0.0%) |
| $2,000 to $2,499 | 0 (0.0%) | 0 (0.0%) |
| $2,500 to $2,999 | 0 (0.0%) | 0 (0.0%) |
| $3,000 or more | 1 (0.3%) | 0 (0.0%) |
| Total | 325 (100.0%) | 131 (100.0%) |
Physical Housing Characteristics in Lewisburg
Housing Structures in Lewisburg
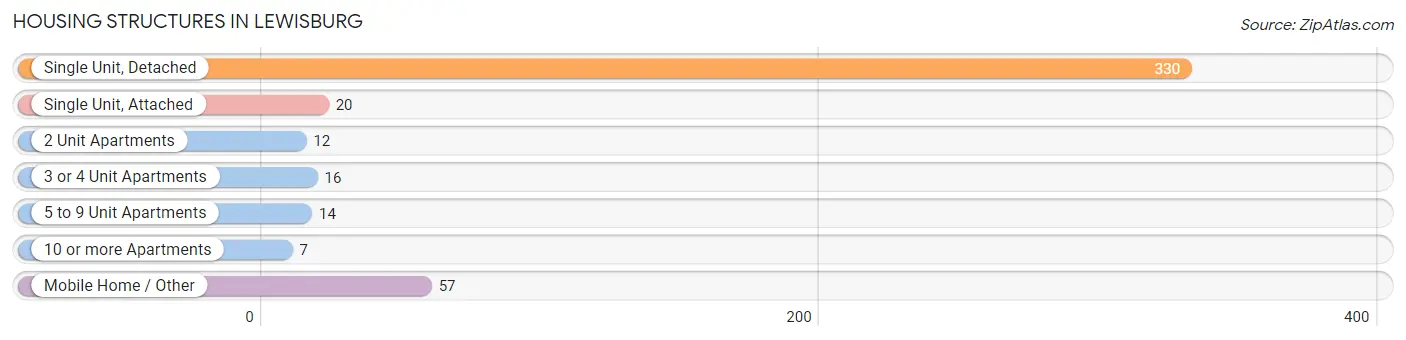
| Structure Type | # Housing Units | % Housing Units |
| Single Unit, Detached | 330 | 72.4% |
| Single Unit, Attached | 20 | 4.4% |
| 2 Unit Apartments | 12 | 2.6% |
| 3 or 4 Unit Apartments | 16 | 3.5% |
| 5 to 9 Unit Apartments | 14 | 3.1% |
| 10 or more Apartments | 7 | 1.5% |
| Mobile Home / Other | 57 | 12.5% |
| Total | 456 | 100.0% |
Housing Structures by Occupancy in Lewisburg
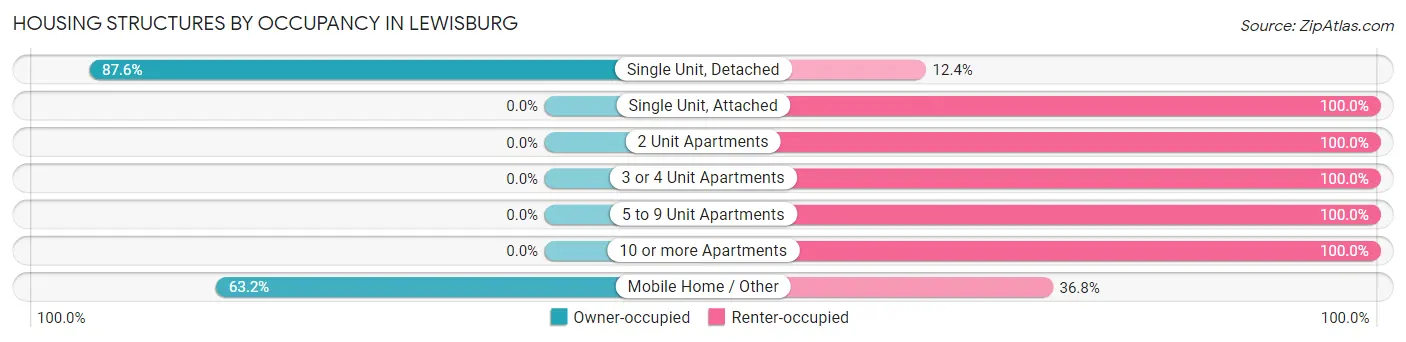
| Structure Type | Owner-occupied | Renter-occupied |
| Single Unit, Detached | 289 (87.6%) | 41 (12.4%) |
| Single Unit, Attached | 0 (0.0%) | 20 (100.0%) |
| 2 Unit Apartments | 0 (0.0%) | 12 (100.0%) |
| 3 or 4 Unit Apartments | 0 (0.0%) | 16 (100.0%) |
| 5 to 9 Unit Apartments | 0 (0.0%) | 14 (100.0%) |
| 10 or more Apartments | 0 (0.0%) | 7 (100.0%) |
| Mobile Home / Other | 36 (63.2%) | 21 (36.8%) |
| Total | 325 (71.3%) | 131 (28.7%) |
Housing Structures by Number of Rooms in Lewisburg
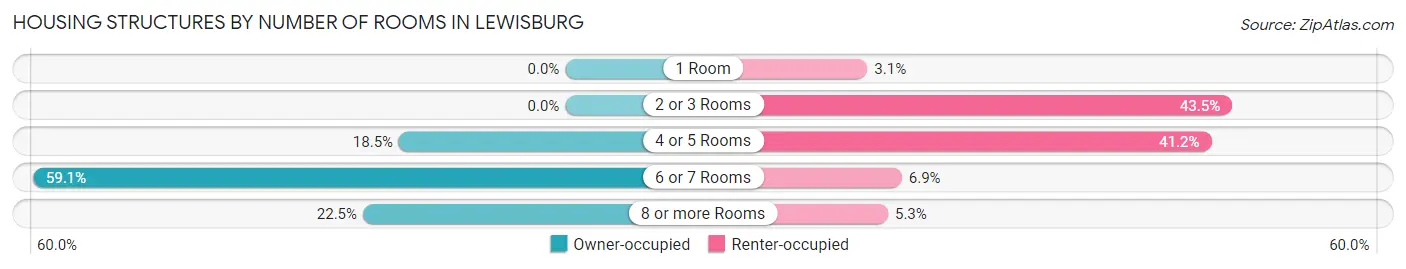
| Number of Rooms | Owner-occupied | Renter-occupied |
| 1 Room | 0 (0.0%) | 4 (3.0%) |
| 2 or 3 Rooms | 0 (0.0%) | 57 (43.5%) |
| 4 or 5 Rooms | 60 (18.5%) | 54 (41.2%) |
| 6 or 7 Rooms | 192 (59.1%) | 9 (6.9%) |
| 8 or more Rooms | 73 (22.5%) | 7 (5.3%) |
| Total | 325 (100.0%) | 131 (100.0%) |
Housing Structure by Heating Type in Lewisburg
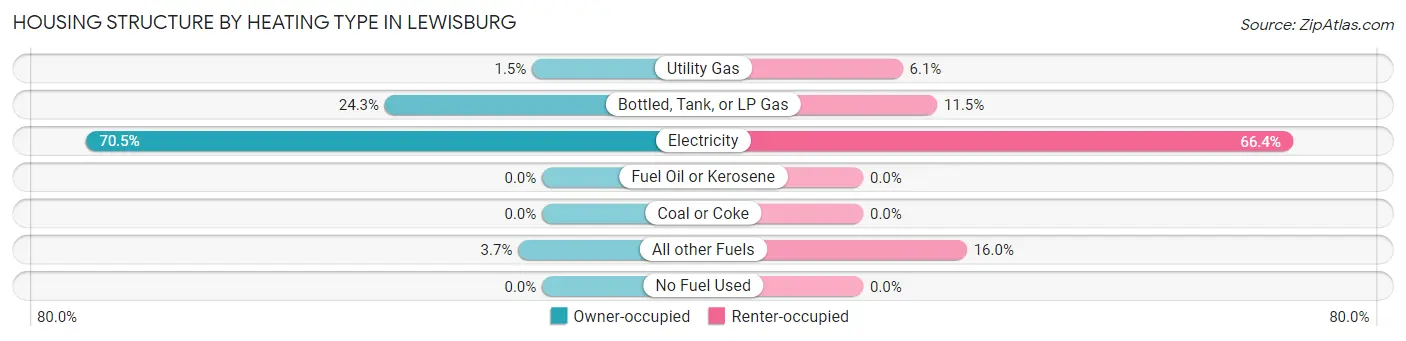
| Heating Type | Owner-occupied | Renter-occupied |
| Utility Gas | 5 (1.5%) | 8 (6.1%) |
| Bottled, Tank, or LP Gas | 79 (24.3%) | 15 (11.5%) |
| Electricity | 229 (70.5%) | 87 (66.4%) |
| Fuel Oil or Kerosene | 0 (0.0%) | 0 (0.0%) |
| Coal or Coke | 0 (0.0%) | 0 (0.0%) |
| All other Fuels | 12 (3.7%) | 21 (16.0%) |
| No Fuel Used | 0 (0.0%) | 0 (0.0%) |
| Total | 325 (100.0%) | 131 (100.0%) |
Household Vehicle Usage in Lewisburg
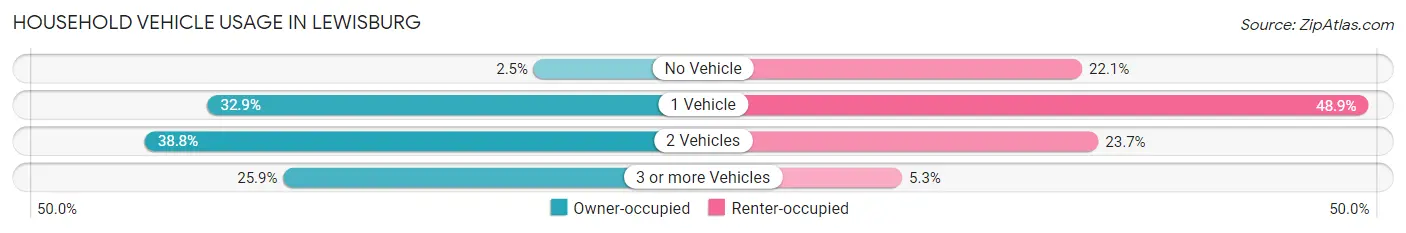
| Vehicles per Household | Owner-occupied | Renter-occupied |
| No Vehicle | 8 (2.5%) | 29 (22.1%) |
| 1 Vehicle | 107 (32.9%) | 64 (48.8%) |
| 2 Vehicles | 126 (38.8%) | 31 (23.7%) |
| 3 or more Vehicles | 84 (25.9%) | 7 (5.3%) |
| Total | 325 (100.0%) | 131 (100.0%) |
Real Estate & Mortgages in Lewisburg
Real Estate and Mortgage Overview in Lewisburg
| Characteristic | Without Mortgage | With Mortgage |
| Housing Units | 192 | 133 |
| Median Property Value | $83,300 | $114,700 |
| Median Household Income | $37,132 | $9 |
| Monthly Housing Costs | $429 | $1 |
| Real Estate Taxes | $573 | $14 |
Property Value by Mortgage Status in Lewisburg
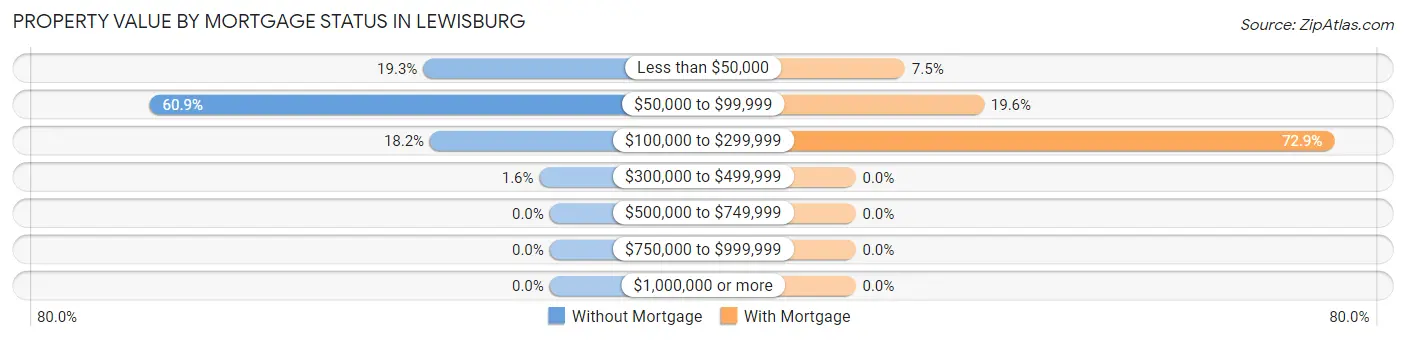
| Property Value | Without Mortgage | With Mortgage |
| Less than $50,000 | 37 (19.3%) | 10 (7.5%) |
| $50,000 to $99,999 | 117 (60.9%) | 26 (19.6%) |
| $100,000 to $299,999 | 35 (18.2%) | 97 (72.9%) |
| $300,000 to $499,999 | 3 (1.6%) | 0 (0.0%) |
| $500,000 to $749,999 | 0 (0.0%) | 0 (0.0%) |
| $750,000 to $999,999 | 0 (0.0%) | 0 (0.0%) |
| $1,000,000 or more | 0 (0.0%) | 0 (0.0%) |
| Total | 192 (100.0%) | 133 (100.0%) |
Household Income by Mortgage Status in Lewisburg
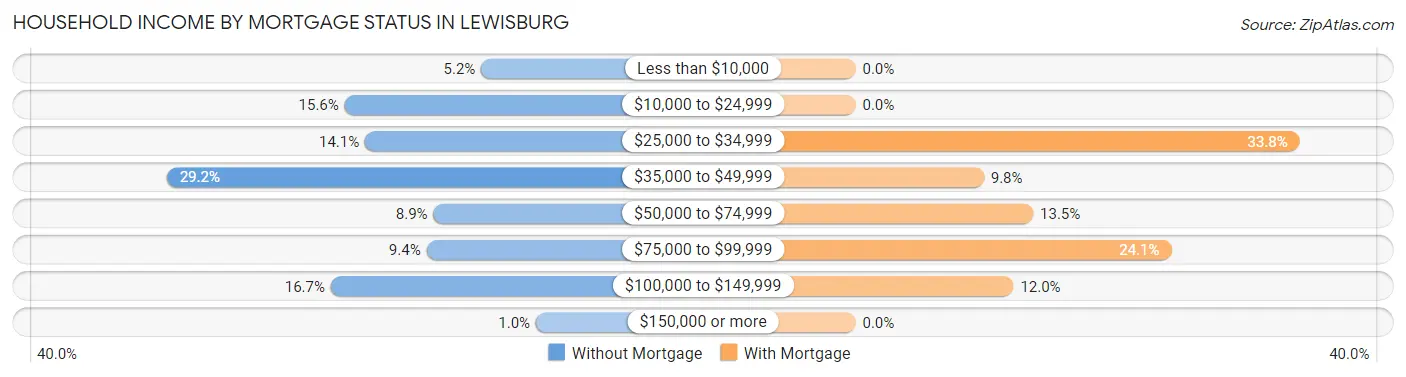
| Household Income | Without Mortgage | With Mortgage |
| Less than $10,000 | 10 (5.2%) | 0 (0.0%) |
| $10,000 to $24,999 | 30 (15.6%) | 0 (0.0%) |
| $25,000 to $34,999 | 27 (14.1%) | 45 (33.8%) |
| $35,000 to $49,999 | 56 (29.2%) | 13 (9.8%) |
| $50,000 to $74,999 | 17 (8.8%) | 18 (13.5%) |
| $75,000 to $99,999 | 18 (9.4%) | 32 (24.1%) |
| $100,000 to $149,999 | 32 (16.7%) | 16 (12.0%) |
| $150,000 or more | 2 (1.0%) | 0 (0.0%) |
| Total | 192 (100.0%) | 133 (100.0%) |
Property Value to Household Income Ratio in Lewisburg
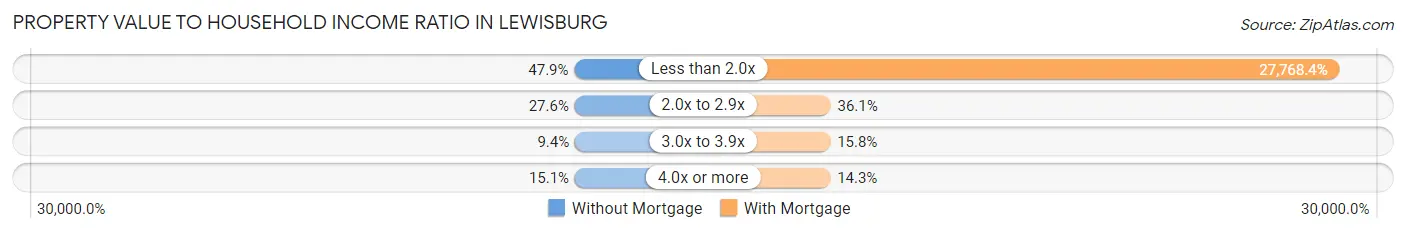
| Value-to-Income Ratio | Without Mortgage | With Mortgage |
| Less than 2.0x | 92 (47.9%) | 36,932 (27,768.4%) |
| 2.0x to 2.9x | 53 (27.6%) | 48 (36.1%) |
| 3.0x to 3.9x | 18 (9.4%) | 21 (15.8%) |
| 4.0x or more | 29 (15.1%) | 19 (14.3%) |
| Total | 192 (100.0%) | 133 (100.0%) |
Real Estate Taxes by Mortgage Status in Lewisburg
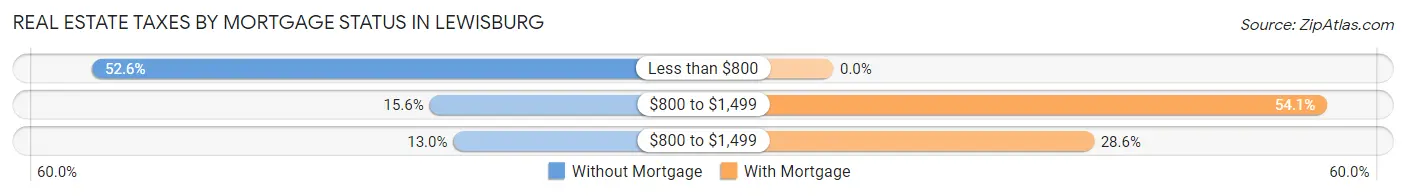
| Property Taxes | Without Mortgage | With Mortgage |
| Less than $800 | 101 (52.6%) | 0 (0.0%) |
| $800 to $1,499 | 30 (15.6%) | 72 (54.1%) |
| $800 to $1,499 | 25 (13.0%) | 38 (28.6%) |
| Total | 192 (100.0%) | 133 (100.0%) |
Health & Disability in Lewisburg
Health Insurance Coverage by Age in Lewisburg
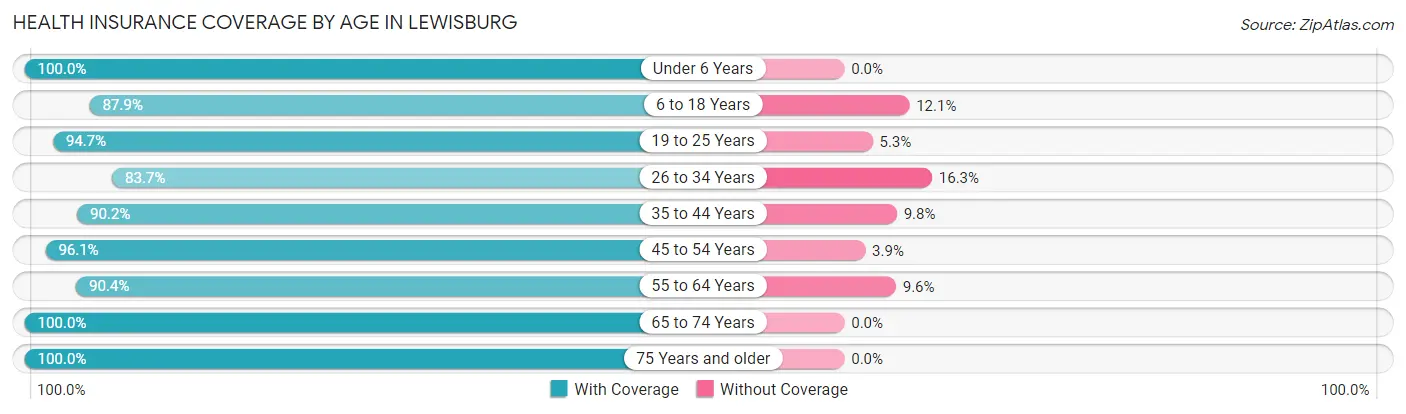
| Age Bracket | With Coverage | Without Coverage |
| Under 6 Years | 94 (100.0%) | 0 (0.0%) |
| 6 to 18 Years | 167 (87.9%) | 23 (12.1%) |
| 19 to 25 Years | 54 (94.7%) | 3 (5.3%) |
| 26 to 34 Years | 82 (83.7%) | 16 (16.3%) |
| 35 to 44 Years | 83 (90.2%) | 9 (9.8%) |
| 45 to 54 Years | 173 (96.1%) | 7 (3.9%) |
| 55 to 64 Years | 113 (90.4%) | 12 (9.6%) |
| 65 to 74 Years | 153 (100.0%) | 0 (0.0%) |
| 75 Years and older | 95 (100.0%) | 0 (0.0%) |
| Total | 1,014 (93.5%) | 70 (6.5%) |
Health Insurance Coverage by Citizenship Status in Lewisburg
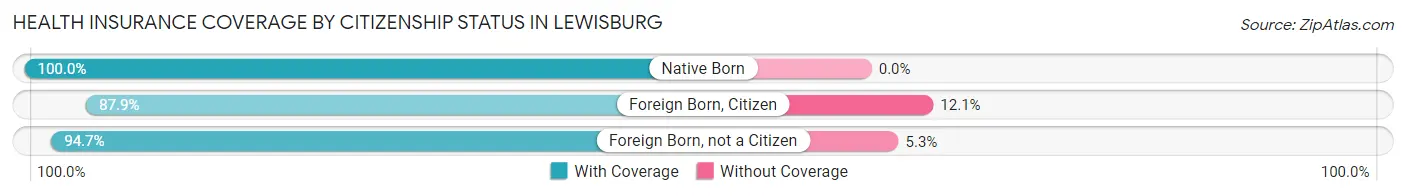
| Citizenship Status | With Coverage | Without Coverage |
| Native Born | 94 (100.0%) | 0 (0.0%) |
| Foreign Born, Citizen | 167 (87.9%) | 23 (12.1%) |
| Foreign Born, not a Citizen | 54 (94.7%) | 3 (5.3%) |
Health Insurance Coverage by Household Income in Lewisburg
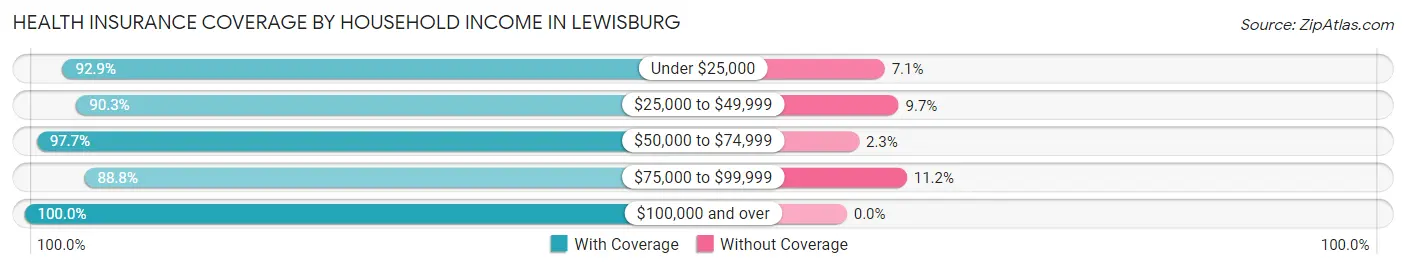
| Household Income | With Coverage | Without Coverage |
| Under $25,000 | 235 (92.9%) | 18 (7.1%) |
| $25,000 to $49,999 | 344 (90.3%) | 37 (9.7%) |
| $50,000 to $74,999 | 213 (97.7%) | 5 (2.3%) |
| $75,000 to $99,999 | 79 (88.8%) | 10 (11.2%) |
| $100,000 and over | 143 (100.0%) | 0 (0.0%) |
Public vs Private Health Insurance Coverage by Age in Lewisburg
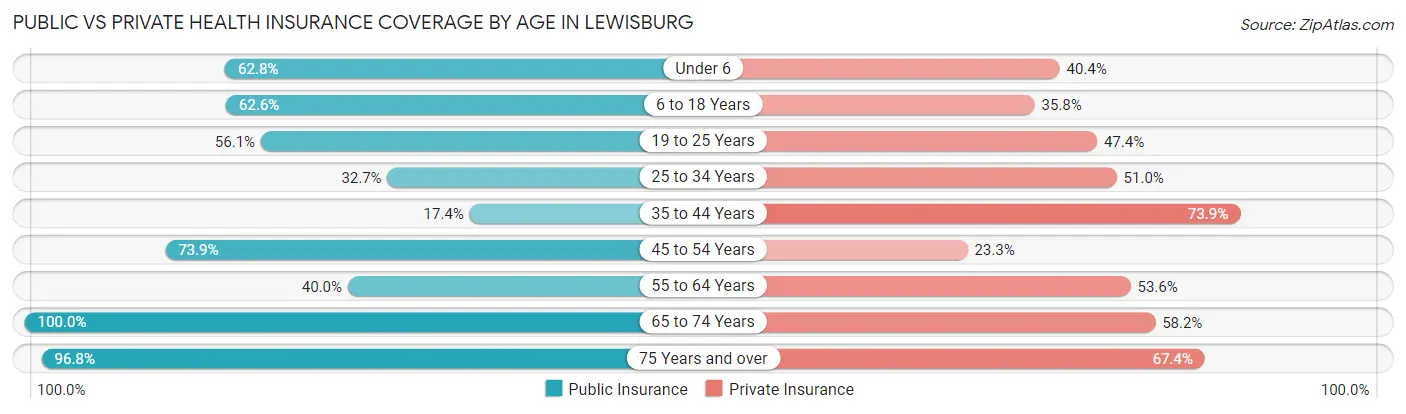
| Age Bracket | Public Insurance | Private Insurance |
| Under 6 | 59 (62.8%) | 38 (40.4%) |
| 6 to 18 Years | 119 (62.6%) | 68 (35.8%) |
| 19 to 25 Years | 32 (56.1%) | 27 (47.4%) |
| 25 to 34 Years | 32 (32.7%) | 50 (51.0%) |
| 35 to 44 Years | 16 (17.4%) | 68 (73.9%) |
| 45 to 54 Years | 133 (73.9%) | 42 (23.3%) |
| 55 to 64 Years | 50 (40.0%) | 67 (53.6%) |
| 65 to 74 Years | 153 (100.0%) | 89 (58.2%) |
| 75 Years and over | 92 (96.8%) | 64 (67.4%) |
| Total | 686 (63.3%) | 513 (47.3%) |
Disability Status by Sex by Age in Lewisburg
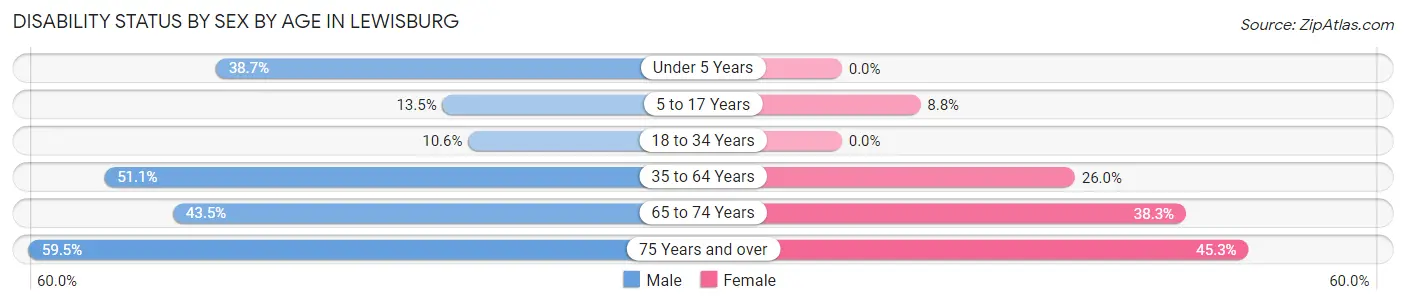
| Age Bracket | Male | Female |
| Under 5 Years | 24 (38.7%) | 0 (0.0%) |
| 5 to 17 Years | 14 (13.5%) | 7 (8.7%) |
| 18 to 34 Years | 9 (10.6%) | 0 (0.0%) |
| 35 to 64 Years | 136 (51.1%) | 34 (26.0%) |
| 65 to 74 Years | 20 (43.5%) | 41 (38.3%) |
| 75 Years and over | 25 (59.5%) | 24 (45.3%) |
Disability Class by Sex by Age in Lewisburg
Disability Class: Hearing Difficulty
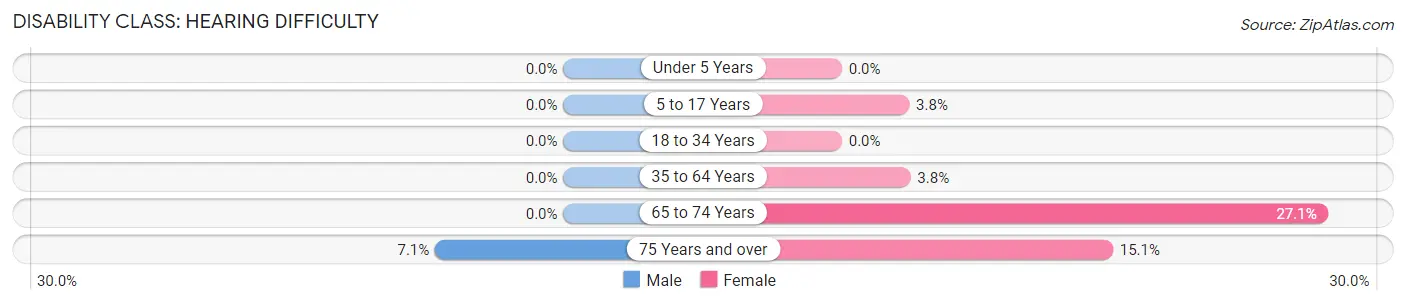
| Age Bracket | Male | Female |
| Under 5 Years | 0 (0.0%) | 0 (0.0%) |
| 5 to 17 Years | 0 (0.0%) | 3 (3.7%) |
| 18 to 34 Years | 0 (0.0%) | 0 (0.0%) |
| 35 to 64 Years | 0 (0.0%) | 5 (3.8%) |
| 65 to 74 Years | 0 (0.0%) | 29 (27.1%) |
| 75 Years and over | 3 (7.1%) | 8 (15.1%) |
Disability Class: Vision Difficulty
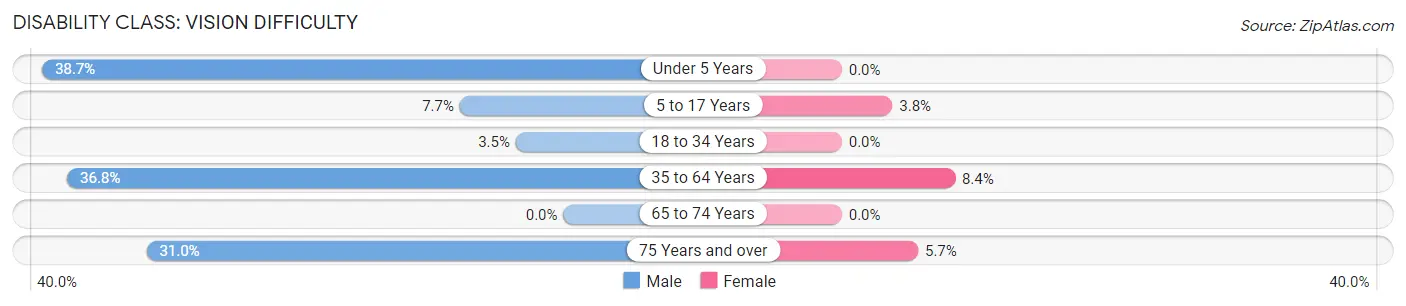
| Age Bracket | Male | Female |
| Under 5 Years | 24 (38.7%) | 0 (0.0%) |
| 5 to 17 Years | 8 (7.7%) | 3 (3.7%) |
| 18 to 34 Years | 3 (3.5%) | 0 (0.0%) |
| 35 to 64 Years | 98 (36.8%) | 11 (8.4%) |
| 65 to 74 Years | 0 (0.0%) | 0 (0.0%) |
| 75 Years and over | 13 (30.9%) | 3 (5.7%) |
Disability Class: Cognitive Difficulty
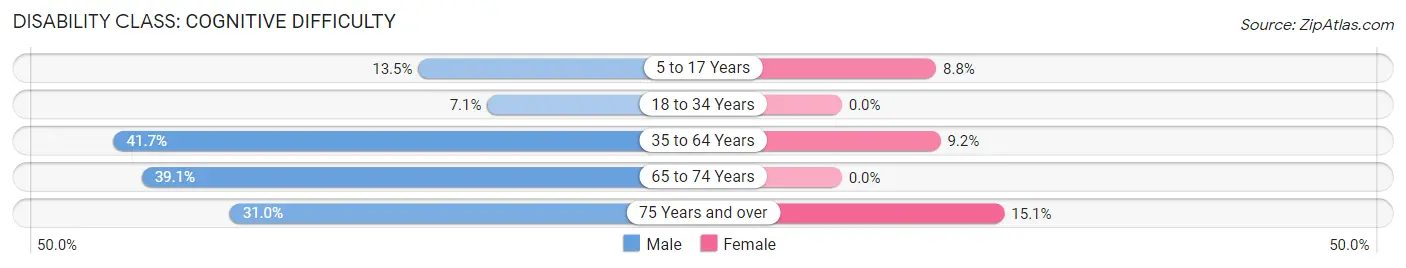
| Age Bracket | Male | Female |
| 5 to 17 Years | 14 (13.5%) | 7 (8.7%) |
| 18 to 34 Years | 6 (7.1%) | 0 (0.0%) |
| 35 to 64 Years | 111 (41.7%) | 12 (9.2%) |
| 65 to 74 Years | 18 (39.1%) | 0 (0.0%) |
| 75 Years and over | 13 (30.9%) | 8 (15.1%) |
Disability Class: Ambulatory Difficulty
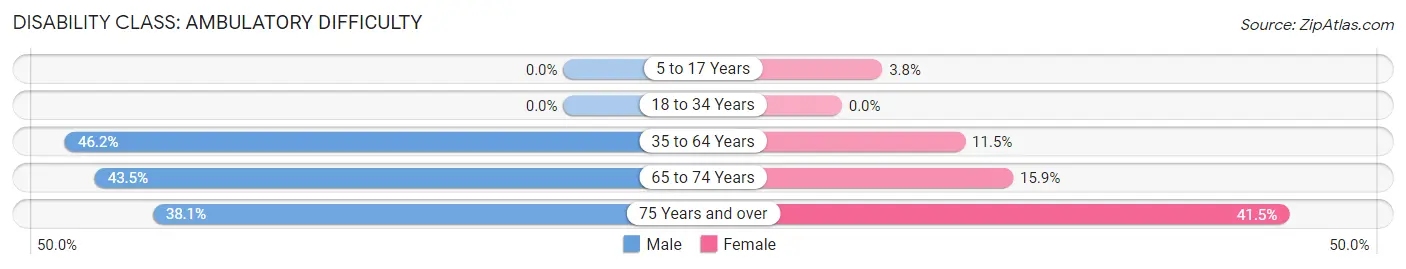
| Age Bracket | Male | Female |
| 5 to 17 Years | 0 (0.0%) | 3 (3.7%) |
| 18 to 34 Years | 0 (0.0%) | 0 (0.0%) |
| 35 to 64 Years | 123 (46.2%) | 15 (11.5%) |
| 65 to 74 Years | 20 (43.5%) | 17 (15.9%) |
| 75 Years and over | 16 (38.1%) | 22 (41.5%) |
Disability Class: Self-Care Difficulty
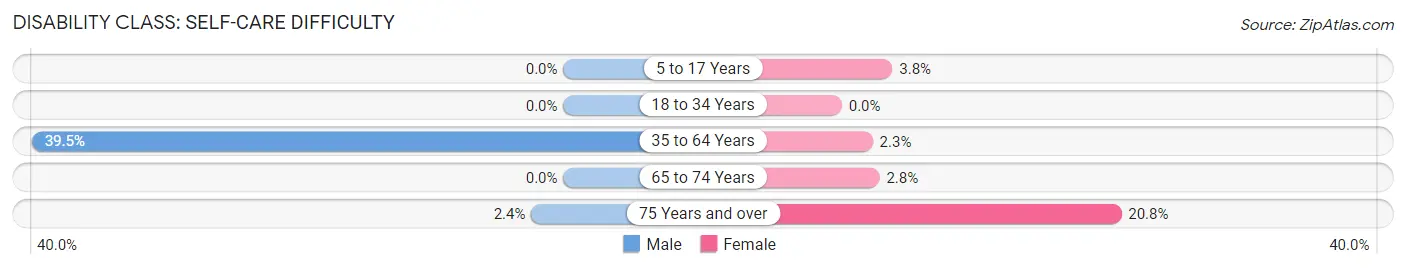
| Age Bracket | Male | Female |
| 5 to 17 Years | 0 (0.0%) | 3 (3.7%) |
| 18 to 34 Years | 0 (0.0%) | 0 (0.0%) |
| 35 to 64 Years | 105 (39.5%) | 3 (2.3%) |
| 65 to 74 Years | 0 (0.0%) | 3 (2.8%) |
| 75 Years and over | 1 (2.4%) | 11 (20.7%) |
Technology Access in Lewisburg
Computing Device Access in Lewisburg
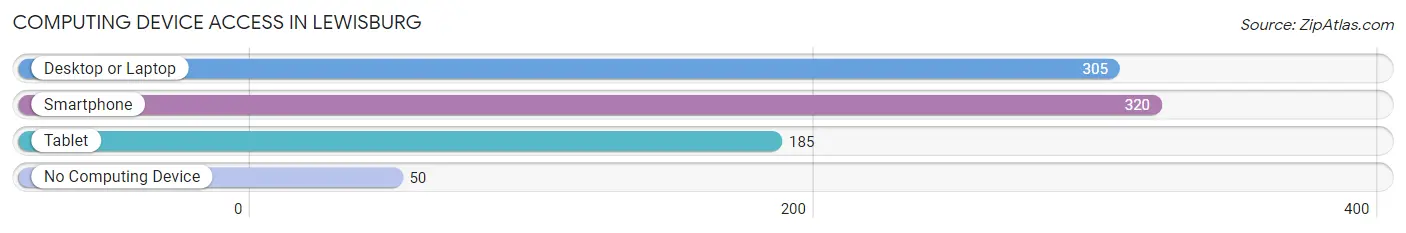
| Device Type | # Households | % Households |
| Desktop or Laptop | 305 | 66.9% |
| Smartphone | 320 | 70.2% |
| Tablet | 185 | 40.6% |
| No Computing Device | 50 | 11.0% |
| Total | 456 | 100.0% |
Internet Access in Lewisburg
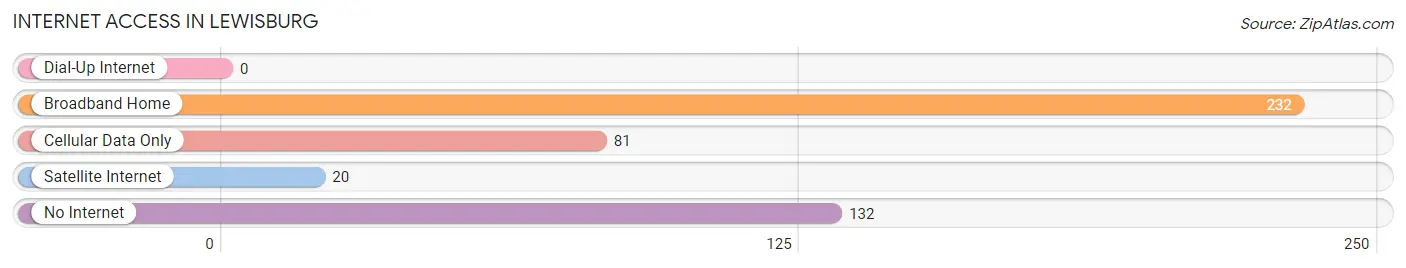
| Internet Type | # Households | % Households |
| Dial-Up Internet | 0 | 0.0% |
| Broadband Home | 232 | 50.9% |
| Cellular Data Only | 81 | 17.8% |
| Satellite Internet | 20 | 4.4% |
| No Internet | 132 | 28.9% |
| Total | 456 | 100.0% |
Lewisburg Summary
Lewisburg, Kentucky is a small city located in Logan County, Kentucky. It is situated in the western part of the state, about 30 miles north of Bowling Green and about 90 miles south of Louisville. The city has a population of approximately 1,800 people and is the county seat of Logan County.
History
Lewisburg was founded in 1817 by William Lewis, a Revolutionary War veteran. The city was named after him and was originally known as Lewis’s Station. The city was incorporated in 1820 and was the first city in Logan County. In the early 19th century, Lewisburg was a major stop on the stagecoach route between Louisville and Nashville. The city was also a major stop on the Louisville and Nashville Railroad, which was completed in 1859.
In the late 19th century, Lewisburg was a major center for the tobacco industry. The city was home to several tobacco warehouses and factories, and the city’s economy was largely dependent on the tobacco industry. In the early 20th century, the tobacco industry began to decline and the city’s economy shifted to other industries, such as manufacturing and agriculture.
Geography
Lewisburg is located in western Kentucky, about 30 miles north of Bowling Green and about 90 miles south of Louisville. The city is situated in the Pennyrile region of the state, which is characterized by rolling hills and fertile farmland. The city is located on the banks of the Green River, which is a major tributary of the Ohio River. The city is surrounded by the communities of Russellville, Auburn, and Adairville.
Economy
The economy of Lewisburg is largely based on agriculture and manufacturing. The city is home to several large farms, which produce a variety of crops, including corn, soybeans, and tobacco. The city is also home to several manufacturing companies, which produce a variety of products, including furniture, automotive parts, and textiles.
Demographics
As of the 2010 census, the population of Lewisburg was 1,817. The racial makeup of the city was 95.3% White, 2.2% African American, 0.3% Native American, 0.2% Asian, 0.1% Pacific Islander, 0.7% from other races, and 1.2% from two or more races. Hispanic or Latino of any race were 1.7% of the population.
The median household income in Lewisburg was $35,938, and the median family income was $41,944. The per capita income for the city was $17,845. About 17.2% of families and 20.2% of the population were below the poverty line, including 28.2% of those under age 18 and 11.2% of those age 65 or over.
Lewisburg is served by the Logan County School District, which includes two elementary schools, one middle school, and one high school. The city is also home to a branch of the Southcentral Kentucky Community and Technical College.
Common Questions
What is Per Capita Income in Lewisburg?
Per Capita income in Lewisburg is $20,097.
What is the Median Family Income in Lewisburg?
Median Family Income in Lewisburg is $50,104.
What is the Median Household income in Lewisburg?
Median Household Income in Lewisburg is $35,469.
What is Income or Wage Gap in Lewisburg?
Income or Wage Gap in Lewisburg is 31.3%.
Women in Lewisburg earn 68.7 cents for every dollar earned by a man.
What is Inequality or Gini Index in Lewisburg?
Inequality or Gini Index in Lewisburg is 0.46.
What is the Total Population of Lewisburg?
Total Population of Lewisburg is 1,084.
What is the Total Male Population of Lewisburg?
Total Male Population of Lewisburg is 605.
What is the Total Female Population of Lewisburg?
Total Female Population of Lewisburg is 479.
What is the Ratio of Males per 100 Females in Lewisburg?
There are 126.30 Males per 100 Females in Lewisburg.
What is the Ratio of Females per 100 Males in Lewisburg?
There are 79.17 Females per 100 Males in Lewisburg.
What is the Median Population Age in Lewisburg?
Median Population Age in Lewisburg is 48.0 Years.
What is the Average Family Size in Lewisburg
Average Family Size in Lewisburg is 3.4 People.
What is the Average Household Size in Lewisburg
Average Household Size in Lewisburg is 2.4 People.
How Large is the Labor Force in Lewisburg?
There are 306 People in the Labor Forcein in Lewisburg.
What is the Percentage of People in the Labor Force in Lewisburg?
36.4% of People are in the Labor Force in Lewisburg.
What is the Unemployment Rate in Lewisburg?
Unemployment Rate in Lewisburg is 9.5%.