Berea, KY Map & Demographics
Berea Map
Berea Overview
$25,747
PER CAPITA INCOME
$61,591
AVG FAMILY INCOME
$54,481
AVG HOUSEHOLD INCOME
32.3%
WAGE / INCOME GAP [ % ]
67.7¢/ $1
WAGE / INCOME GAP [ $ ]
$12,686
FAMILY INCOME DEFICIT
0.45
INEQUALITY / GINI INDEX
15,404
TOTAL POPULATION
7,271
MALE POPULATION
8,133
FEMALE POPULATION
89.40
MALES / 100 FEMALES
111.86
FEMALES / 100 MALES
32.4
MEDIAN AGE
2.8
AVG FAMILY SIZE
2.5
AVG HOUSEHOLD SIZE
7,085
LABOR FORCE [ PEOPLE ]
56.8%
PERCENT IN LABOR FORCE
2.4%
UNEMPLOYMENT RATE
Berea Area Codes
Income in Berea
Income Overview in Berea
Per Capita Income in Berea is $25,747, while median incomes of families and households are $61,591 and $54,481 respectively.
| Characteristic | Number | Measure |
| Per Capita Income | 15,404 | $25,747 |
| Median Family Income | 3,858 | $61,591 |
| Mean Family Income | 3,858 | $73,094 |
| Median Household Income | 5,573 | $54,481 |
| Mean Household Income | 5,573 | $68,796 |
| Income Deficit | 3,858 | $12,686 |
| Wage / Income Gap (%) | 15,404 | 32.31% |
| Wage / Income Gap ($) | 15,404 | 67.69¢ per $1 |
| Gini / Inequality Index | 15,404 | 0.45 |
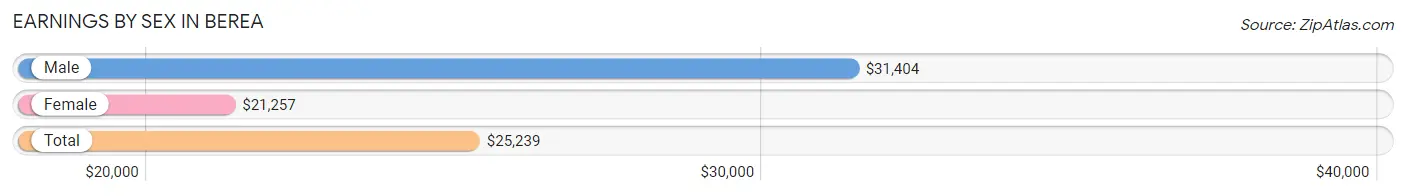
Earnings by Sex in Berea
Average Earnings in Berea are $25,239, $31,404 for men and $21,257 for women, a difference of 32.3%.
| Sex | Number | Average Earnings |
| Male | 3,777 (47.4%) | $31,404 |
| Female | 4,190 (52.6%) | $21,257 |
| Total | 7,967 (100.0%) | $25,239 |
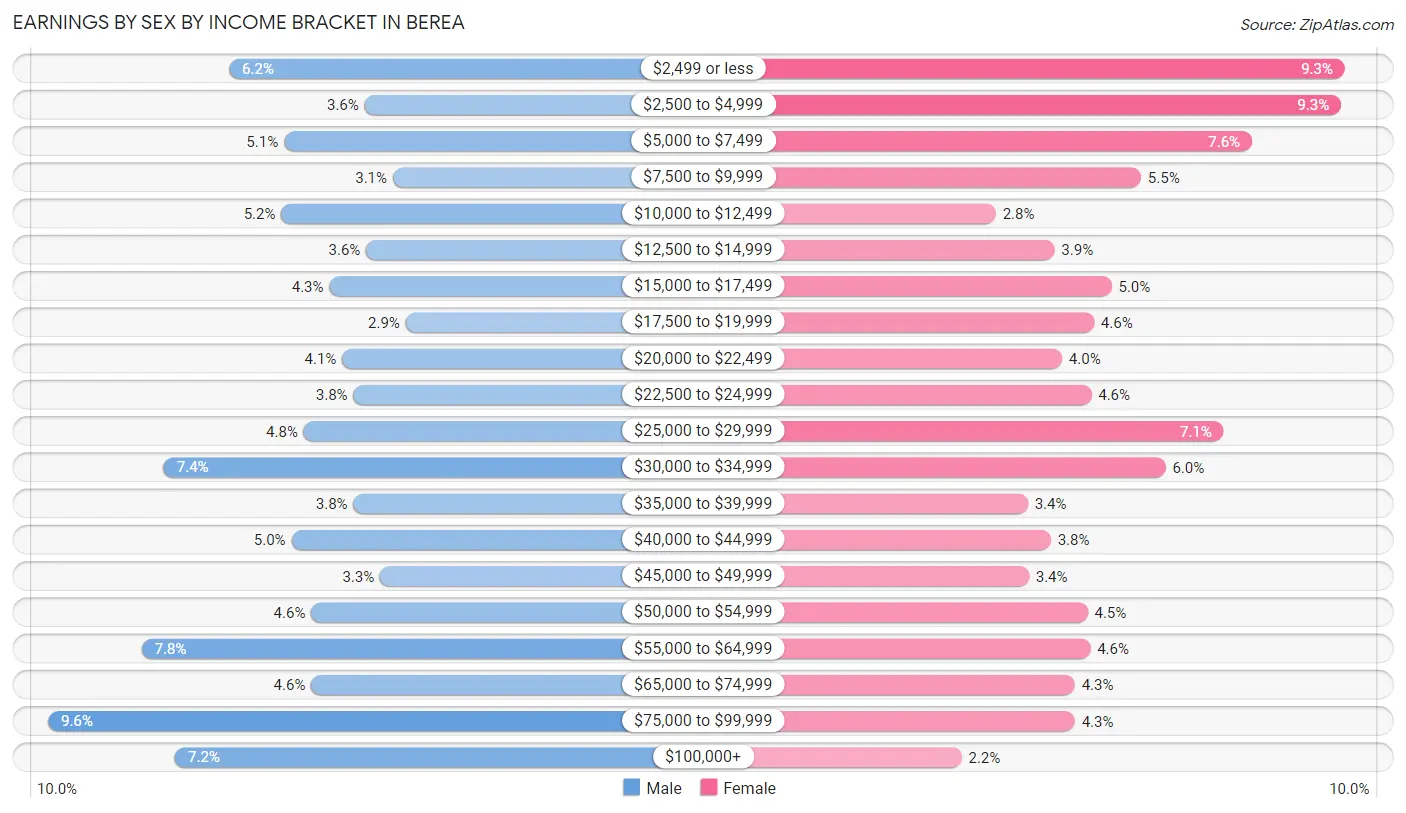
Earnings by Sex by Income Bracket in Berea
The most common earnings brackets in Berea are $75,000 to $99,999 for men (361 | 9.6%) and $2,499 or less for women (391 | 9.3%).
| Income | Male | Female |
| $2,499 or less | 233 (6.2%) | 391 (9.3%) |
| $2,500 to $4,999 | 137 (3.6%) | 388 (9.3%) |
| $5,000 to $7,499 | 194 (5.1%) | 318 (7.6%) |
| $7,500 to $9,999 | 117 (3.1%) | 231 (5.5%) |
| $10,000 to $12,499 | 196 (5.2%) | 117 (2.8%) |
| $12,500 to $14,999 | 136 (3.6%) | 163 (3.9%) |
| $15,000 to $17,499 | 162 (4.3%) | 208 (5.0%) |
| $17,500 to $19,999 | 108 (2.9%) | 194 (4.6%) |
| $20,000 to $22,499 | 153 (4.1%) | 169 (4.0%) |
| $22,500 to $24,999 | 145 (3.8%) | 192 (4.6%) |
| $25,000 to $29,999 | 180 (4.8%) | 296 (7.1%) |
| $30,000 to $34,999 | 279 (7.4%) | 250 (6.0%) |
| $35,000 to $39,999 | 145 (3.8%) | 142 (3.4%) |
| $40,000 to $44,999 | 189 (5.0%) | 160 (3.8%) |
| $45,000 to $49,999 | 126 (3.3%) | 143 (3.4%) |
| $50,000 to $54,999 | 175 (4.6%) | 189 (4.5%) |
| $55,000 to $64,999 | 295 (7.8%) | 191 (4.6%) |
| $65,000 to $74,999 | 175 (4.6%) | 179 (4.3%) |
| $75,000 to $99,999 | 361 (9.6%) | 179 (4.3%) |
| $100,000+ | 271 (7.2%) | 90 (2.1%) |
| Total | 3,777 (100.0%) | 4,190 (100.0%) |
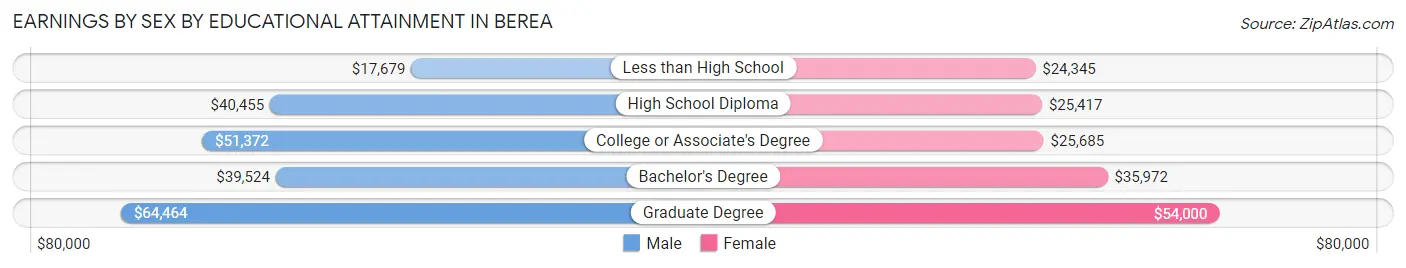
Earnings by Sex by Educational Attainment in Berea
Average earnings in Berea are $41,970 for men and $31,875 for women, a difference of 24.0%. Men with an educational attainment of graduate degree enjoy the highest average annual earnings of $64,464, while those with less than high school education earn the least with $17,679. Women with an educational attainment of graduate degree earn the most with the average annual earnings of $54,000, while those with less than high school education have the smallest earnings of $24,345.
| Educational Attainment | Male Income | Female Income |
| Less than High School | $17,679 | $24,345 |
| High School Diploma | $40,455 | $25,417 |
| College or Associate's Degree | $51,372 | $25,685 |
| Bachelor's Degree | $39,524 | $35,972 |
| Graduate Degree | $64,464 | $54,000 |
| Total | $41,970 | $31,875 |
Family Income in Berea
Family Income Brackets in Berea
According to the Berea family income data, there are 775 families falling into the $50,000 to $74,999 income range, which is the most common income bracket and makes up 20.1% of all families. Conversely, the $10,000 to $14,999 income bracket is the least frequent group with only 54 families (1.4%) belonging to this category.
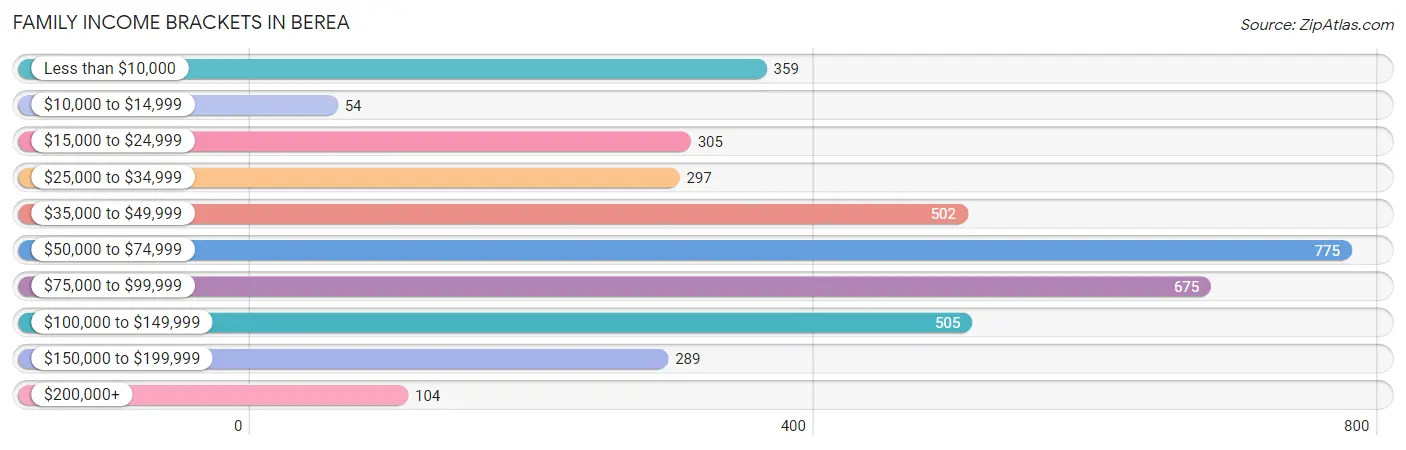
| Income Bracket | # Families | % Families |
| Less than $10,000 | 359 | 9.3% |
| $10,000 to $14,999 | 54 | 1.4% |
| $15,000 to $24,999 | 305 | 7.9% |
| $25,000 to $34,999 | 297 | 7.7% |
| $35,000 to $49,999 | 502 | 13.0% |
| $50,000 to $74,999 | 775 | 20.1% |
| $75,000 to $99,999 | 675 | 17.5% |
| $100,000 to $149,999 | 505 | 13.1% |
| $150,000 to $199,999 | 289 | 7.5% |
| $200,000+ | 104 | 2.7% |
Family Income by Famaliy Size in Berea
6-person families (97 | 2.5%) account for the highest median family income in Berea with $94,261 per family, while 3-person families (705 | 18.3%) have the highest median income of $28,514 per family member.
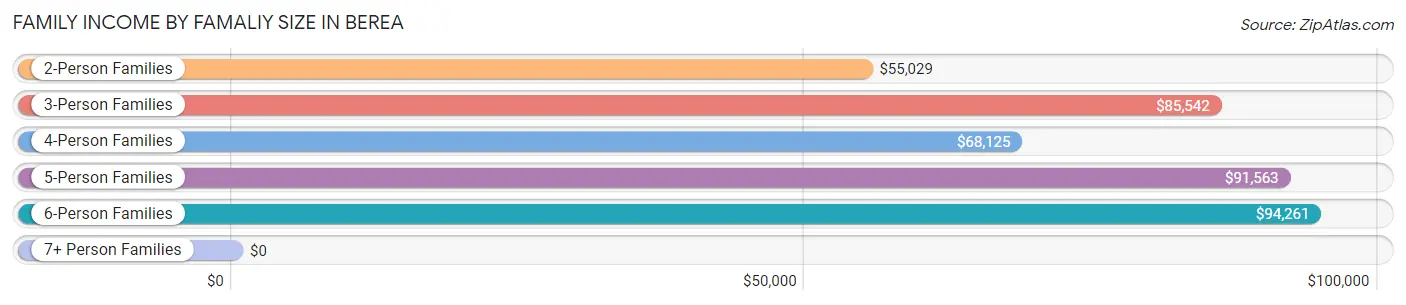
| Income Bracket | # Families | Median Income |
| 2-Person Families | 2,216 (57.4%) | $55,029 |
| 3-Person Families | 705 (18.3%) | $85,542 |
| 4-Person Families | 664 (17.2%) | $68,125 |
| 5-Person Families | 167 (4.3%) | $91,563 |
| 6-Person Families | 97 (2.5%) | $94,261 |
| 7+ Person Families | 9 (0.2%) | $0 |
| Total | 3,858 (100.0%) | $61,591 |
Family Income by Number of Earners in Berea
The median family income in Berea is $61,591, with families comprising 3+ earners (289) having the highest median family income of $114,844, while families with no earners (842) have the lowest median family income of $23,929, accounting for 7.5% and 21.8% of families, respectively.
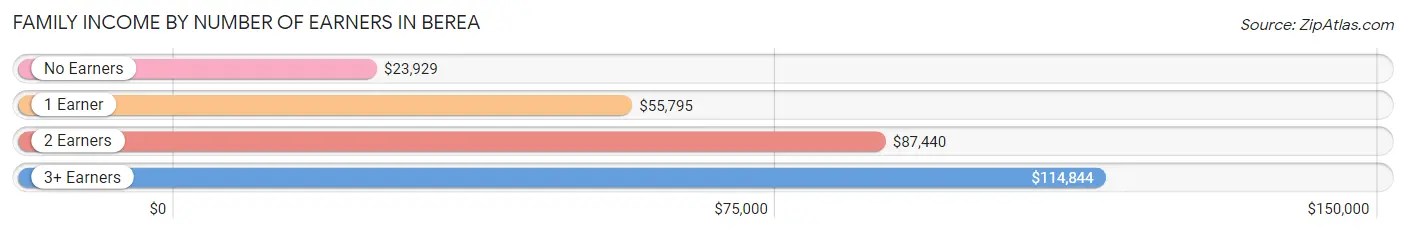
| Number of Earners | # Families | Median Income |
| No Earners | 842 (21.8%) | $23,929 |
| 1 Earner | 1,338 (34.7%) | $55,795 |
| 2 Earners | 1,389 (36.0%) | $87,440 |
| 3+ Earners | 289 (7.5%) | $114,844 |
| Total | 3,858 (100.0%) | $61,591 |
Household Income in Berea
Household Income Brackets in Berea
With 1,232 households falling in the category, the $50,000 to $74,999 income range is the most frequent in Berea, accounting for 22.1% of all households. In contrast, only 123 households (2.2%) fall into the $200,000+ income bracket, making it the least populous group.
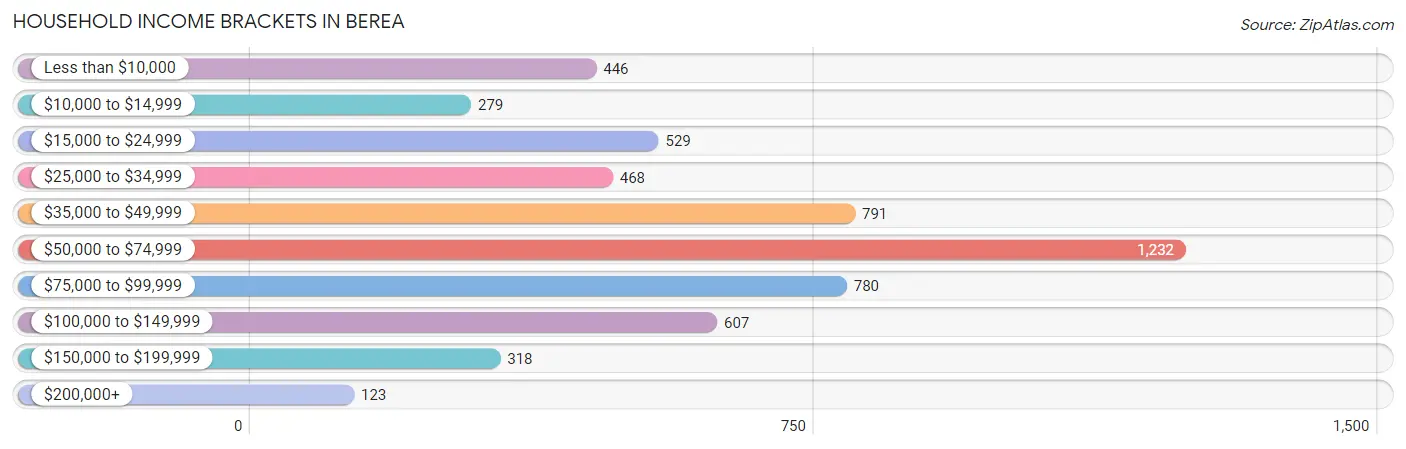
| Income Bracket | # Households | % Households |
| Less than $10,000 | 446 | 8.0% |
| $10,000 to $14,999 | 279 | 5.0% |
| $15,000 to $24,999 | 529 | 9.5% |
| $25,000 to $34,999 | 468 | 8.4% |
| $35,000 to $49,999 | 791 | 14.2% |
| $50,000 to $74,999 | 1,232 | 22.1% |
| $75,000 to $99,999 | 780 | 14.0% |
| $100,000 to $149,999 | 607 | 10.9% |
| $150,000 to $199,999 | 318 | 5.7% |
| $200,000+ | 123 | 2.2% |
Household Income by Householder Age in Berea
The median household income in Berea is $54,481, with the highest median household income of $63,548 found in the 25 to 44 years age bracket for the primary householder. A total of 1,956 households (35.1%) fall into this category. Meanwhile, the 45 to 64 years age bracket for the primary householder has the lowest median household income of $49,239, with 1,899 households (34.1%) in this group.
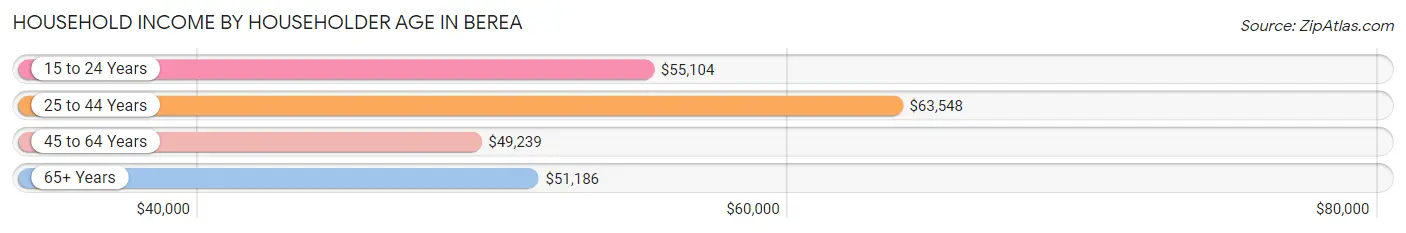
| Income Bracket | # Households | Median Income |
| 15 to 24 Years | 401 (7.2%) | $55,104 |
| 25 to 44 Years | 1,956 (35.1%) | $63,548 |
| 45 to 64 Years | 1,899 (34.1%) | $49,239 |
| 65+ Years | 1,317 (23.6%) | $51,186 |
| Total | 5,573 (100.0%) | $54,481 |
Poverty in Berea
Income Below Poverty by Sex and Age in Berea
With 17.3% poverty level for males and 21.4% for females among the residents of Berea, 5 year old males and 5 year old females are the most vulnerable to poverty, with 83 males (49.1%) and 92 females (69.2%) in their respective age groups living below the poverty level.
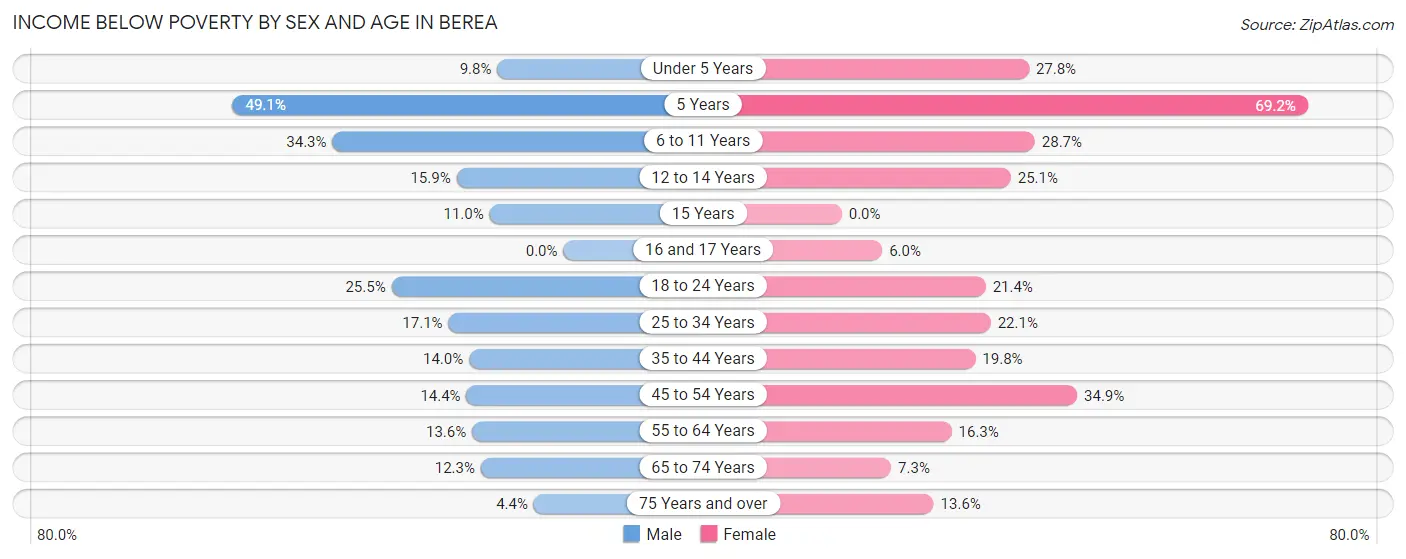
| Age Bracket | Male | Female |
| Under 5 Years | 42 (9.8%) | 112 (27.8%) |
| 5 Years | 83 (49.1%) | 92 (69.2%) |
| 6 to 11 Years | 201 (34.3%) | 129 (28.7%) |
| 12 to 14 Years | 40 (15.9%) | 67 (25.1%) |
| 15 Years | 8 (11.0%) | 0 (0.0%) |
| 16 and 17 Years | 0 (0.0%) | 9 (6.0%) |
| 18 to 24 Years | 207 (25.5%) | 137 (21.4%) |
| 25 to 34 Years | 171 (17.1%) | 261 (22.1%) |
| 35 to 44 Years | 118 (14.0%) | 169 (19.8%) |
| 45 to 54 Years | 116 (14.4%) | 246 (34.9%) |
| 55 to 64 Years | 117 (13.6%) | 167 (16.3%) |
| 65 to 74 Years | 70 (12.3%) | 48 (7.3%) |
| 75 Years and over | 13 (4.4%) | 60 (13.6%) |
| Total | 1,186 (17.3%) | 1,497 (21.4%) |
Income Above Poverty by Sex and Age in Berea
According to the poverty statistics in Berea, males aged 16 and 17 years and females aged 15 years are the age groups that are most secure financially, with 100.0% of males and 100.0% of females in these age groups living above the poverty line.
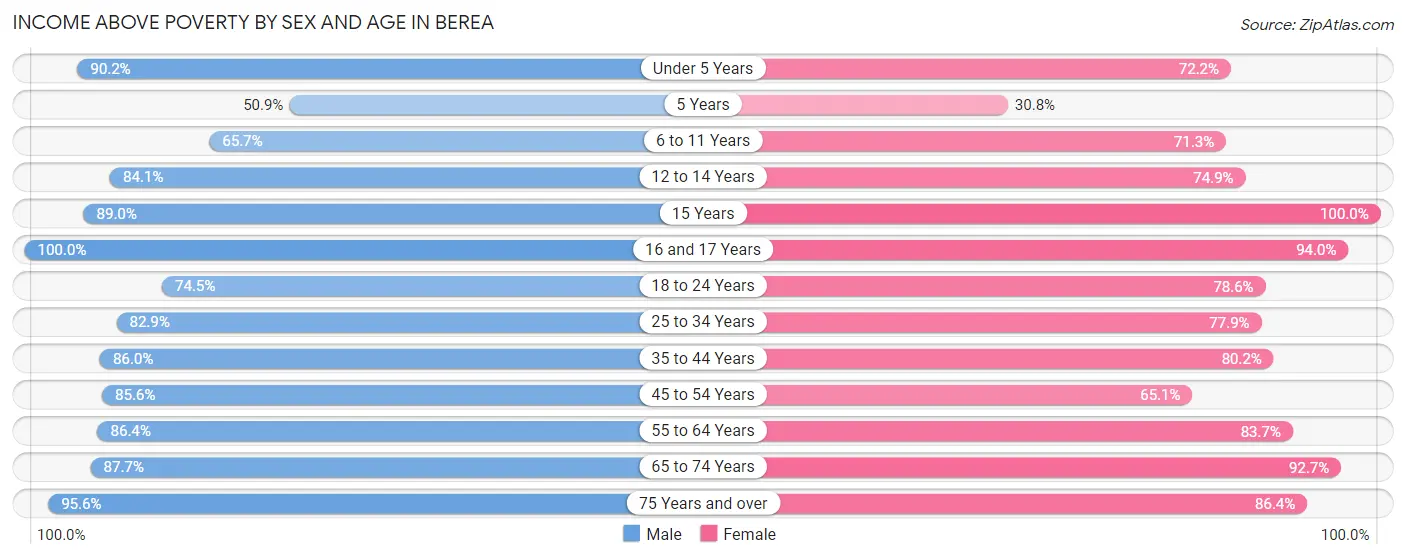
| Age Bracket | Male | Female |
| Under 5 Years | 386 (90.2%) | 291 (72.2%) |
| 5 Years | 86 (50.9%) | 41 (30.8%) |
| 6 to 11 Years | 385 (65.7%) | 321 (71.3%) |
| 12 to 14 Years | 212 (84.1%) | 200 (74.9%) |
| 15 Years | 65 (89.0%) | 110 (100.0%) |
| 16 and 17 Years | 141 (100.0%) | 141 (94.0%) |
| 18 to 24 Years | 604 (74.5%) | 504 (78.6%) |
| 25 to 34 Years | 831 (82.9%) | 919 (77.9%) |
| 35 to 44 Years | 725 (86.0%) | 683 (80.2%) |
| 45 to 54 Years | 690 (85.6%) | 458 (65.1%) |
| 55 to 64 Years | 746 (86.4%) | 857 (83.7%) |
| 65 to 74 Years | 501 (87.7%) | 607 (92.7%) |
| 75 Years and over | 283 (95.6%) | 380 (86.4%) |
| Total | 5,655 (82.7%) | 5,512 (78.6%) |
Income Below Poverty Among Married-Couple Families in Berea
The poverty statistics for married-couple families in Berea show that 5.3% or 139 of the total 2,599 families live below the poverty line. Families with 1 or 2 children have the highest poverty rate of 7.4%, comprising of 60 families. On the other hand, families with no children have the lowest poverty rate of 4.4%, which includes 72 families.
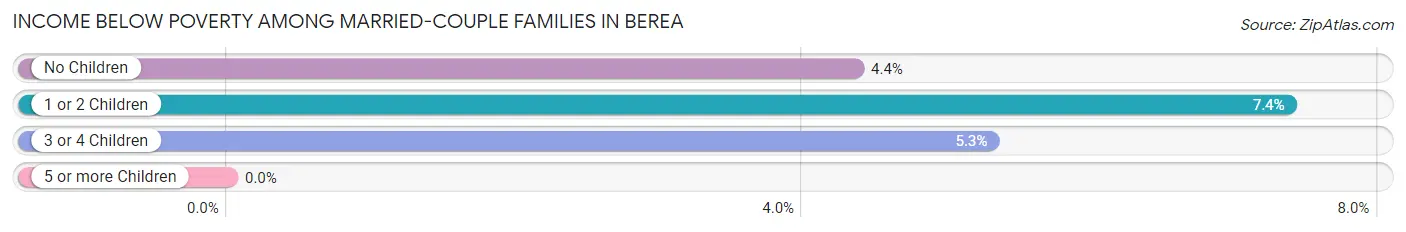
| Children | Above Poverty | Below Poverty |
| No Children | 1,581 (95.6%) | 72 (4.4%) |
| 1 or 2 Children | 754 (92.6%) | 60 (7.4%) |
| 3 or 4 Children | 125 (94.7%) | 7 (5.3%) |
| 5 or more Children | 0 (0.0%) | 0 (0.0%) |
| Total | 2,460 (94.7%) | 139 (5.3%) |
Income Below Poverty Among Single-Parent Households in Berea
According to the poverty data in Berea, 19.0% or 54 single-father households and 47.6% or 464 single-mother households are living below the poverty line. Among single-father households, those with 3 or 4 children have the highest poverty rate, with 6 households (35.3%) experiencing poverty. Likewise, among single-mother households, those with 5 or more children have the highest poverty rate, with 2 households (100.0%) falling below the poverty line.
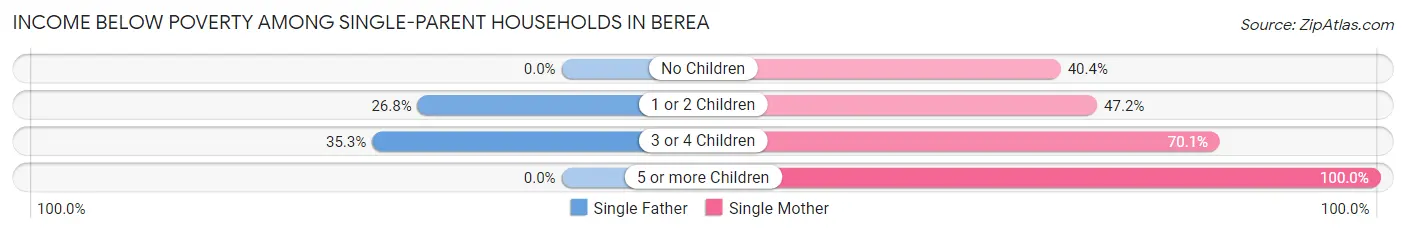
| Children | Single Father | Single Mother |
| No Children | 0 (0.0%) | 171 (40.4%) |
| 1 or 2 Children | 48 (26.8%) | 195 (47.2%) |
| 3 or 4 Children | 6 (35.3%) | 96 (70.1%) |
| 5 or more Children | 0 (0.0%) | 2 (100.0%) |
| Total | 54 (19.0%) | 464 (47.6%) |
Income Below Poverty Among Married-Couple vs Single-Parent Households in Berea
The poverty data for Berea shows that 139 of the married-couple family households (5.3%) and 518 of the single-parent households (41.1%) are living below the poverty level. Within the married-couple family households, those with 1 or 2 children have the highest poverty rate, with 60 households (7.4%) falling below the poverty line. Among the single-parent households, those with 5 or more children have the highest poverty rate, with 2 household (100.0%) living below poverty.
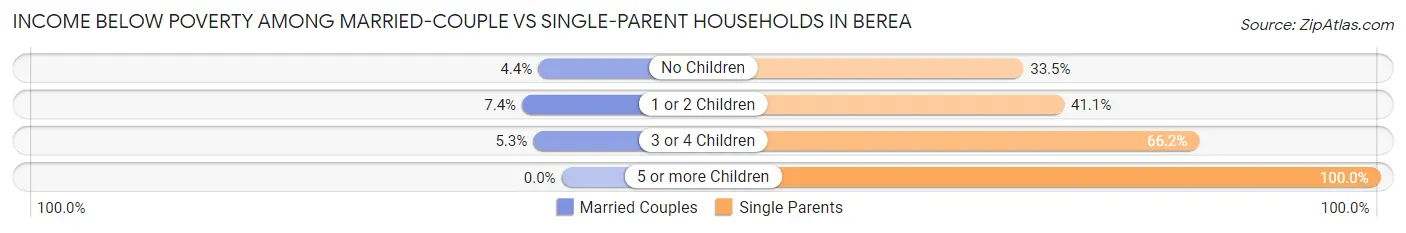
| Children | Married-Couple Families | Single-Parent Households |
| No Children | 72 (4.4%) | 171 (33.5%) |
| 1 or 2 Children | 60 (7.4%) | 243 (41.0%) |
| 3 or 4 Children | 7 (5.3%) | 102 (66.2%) |
| 5 or more Children | 0 (0.0%) | 2 (100.0%) |
| Total | 139 (5.3%) | 518 (41.1%) |
Race in Berea
The most populous races in Berea are White / Caucasian (13,956 | 90.6%), Hispanic or Latino (685 | 4.4%), and Two or more Races (513 | 3.3%).
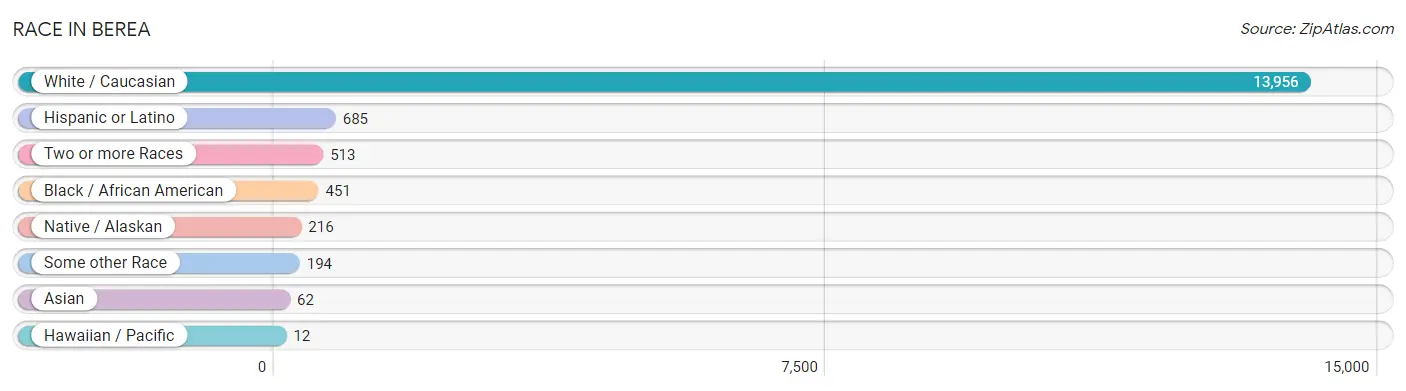
| Race | # Population | % Population |
| Asian | 62 | 0.4% |
| Black / African American | 451 | 2.9% |
| Hawaiian / Pacific | 12 | 0.1% |
| Hispanic or Latino | 685 | 4.4% |
| Native / Alaskan | 216 | 1.4% |
| White / Caucasian | 13,956 | 90.6% |
| Two or more Races | 513 | 3.3% |
| Some other Race | 194 | 1.3% |
| Total | 15,404 | 100.0% |
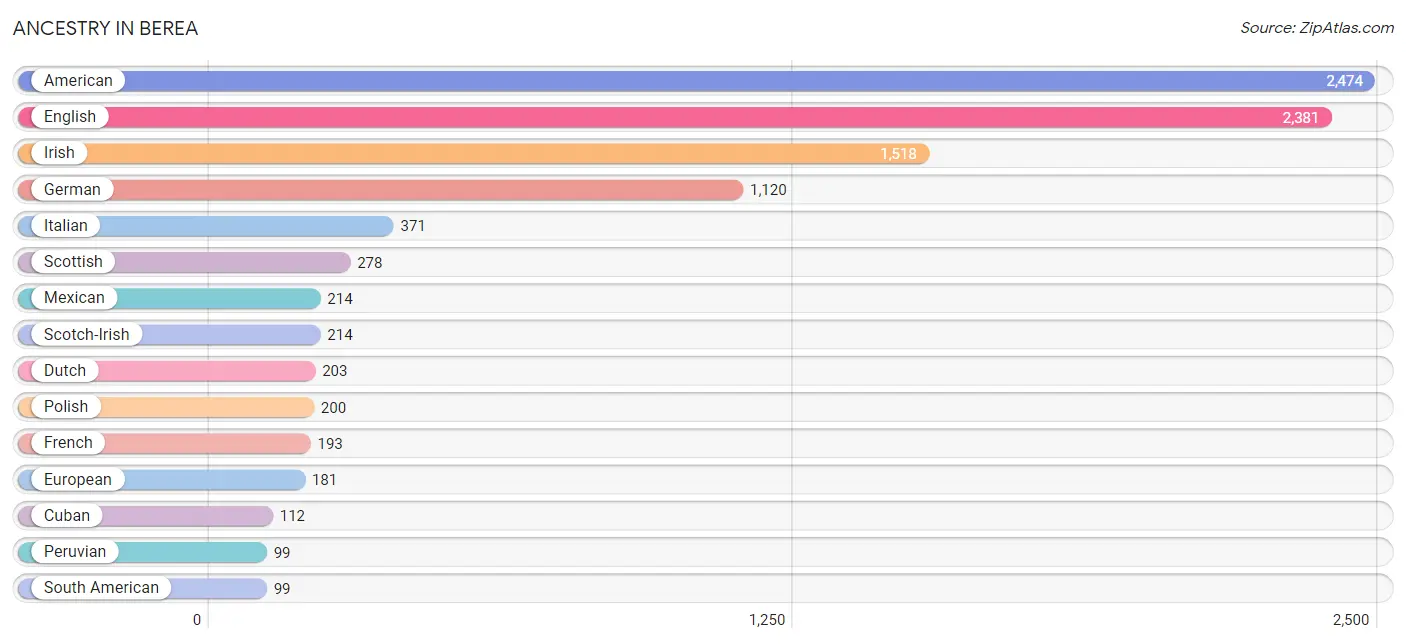
Ancestry in Berea
The most populous ancestries reported in Berea are American (2,474 | 16.1%), English (2,381 | 15.5%), Irish (1,518 | 9.9%), German (1,120 | 7.3%), and Italian (371 | 2.4%), together accounting for 51.0% of all Berea residents.
| Ancestry | # Population | % Population |
| African | 81 | 0.5% |
| American | 2,474 | 16.1% |
| Arab | 5 | 0.0% |
| Bahamian | 31 | 0.2% |
| Belgian | 11 | 0.1% |
| Bhutanese | 13 | 0.1% |
| Blackfeet | 29 | 0.2% |
| British | 29 | 0.2% |
| Celtic | 3 | 0.0% |
| Central American | 81 | 0.5% |
| Central American Indian | 31 | 0.2% |
| Cherokee | 52 | 0.3% |
| Cuban | 112 | 0.7% |
| Danish | 11 | 0.1% |
| Dutch | 203 | 1.3% |
| Eastern European | 6 | 0.0% |
| English | 2,381 | 15.5% |
| European | 181 | 1.2% |
| Filipino | 5 | 0.0% |
| French | 193 | 1.3% |
| French Canadian | 78 | 0.5% |
| German | 1,120 | 7.3% |
| Greek | 8 | 0.1% |
| Guatemalan | 31 | 0.2% |
| Honduran | 50 | 0.3% |
| Hungarian | 41 | 0.3% |
| Indian (Asian) | 25 | 0.2% |
| Iranian | 4 | 0.0% |
| Irish | 1,518 | 9.9% |
| Italian | 371 | 2.4% |
| Korean | 44 | 0.3% |
| Lebanese | 5 | 0.0% |
| Lithuanian | 32 | 0.2% |
| Mexican | 214 | 1.4% |
| Mexican American Indian | 78 | 0.5% |
| Native Hawaiian | 12 | 0.1% |
| Nigerian | 2 | 0.0% |
| Norwegian | 63 | 0.4% |
| Ottawa | 43 | 0.3% |
| Pakistani | 7 | 0.1% |
| Peruvian | 99 | 0.6% |
| Polish | 200 | 1.3% |
| Portuguese | 6 | 0.0% |
| Puerto Rican | 58 | 0.4% |
| Russian | 72 | 0.5% |
| Scandinavian | 12 | 0.1% |
| Scotch-Irish | 214 | 1.4% |
| Scottish | 278 | 1.8% |
| South American | 99 | 0.6% |
| Spaniard | 37 | 0.2% |
| Spanish | 37 | 0.2% |
| Subsaharan African | 83 | 0.5% |
| Swedish | 46 | 0.3% |
| Thai | 38 | 0.3% |
| Welsh | 79 | 0.5% | View All 55 Rows |
Immigrants in Berea
The most numerous immigrant groups reported in Berea came from Latin America (212 | 1.4%), Central America (181 | 1.2%), Asia (146 | 0.9%), Mexico (78 | 0.5%), and South Central Asia (68 | 0.4%), together accounting for 4.5% of all Berea residents.
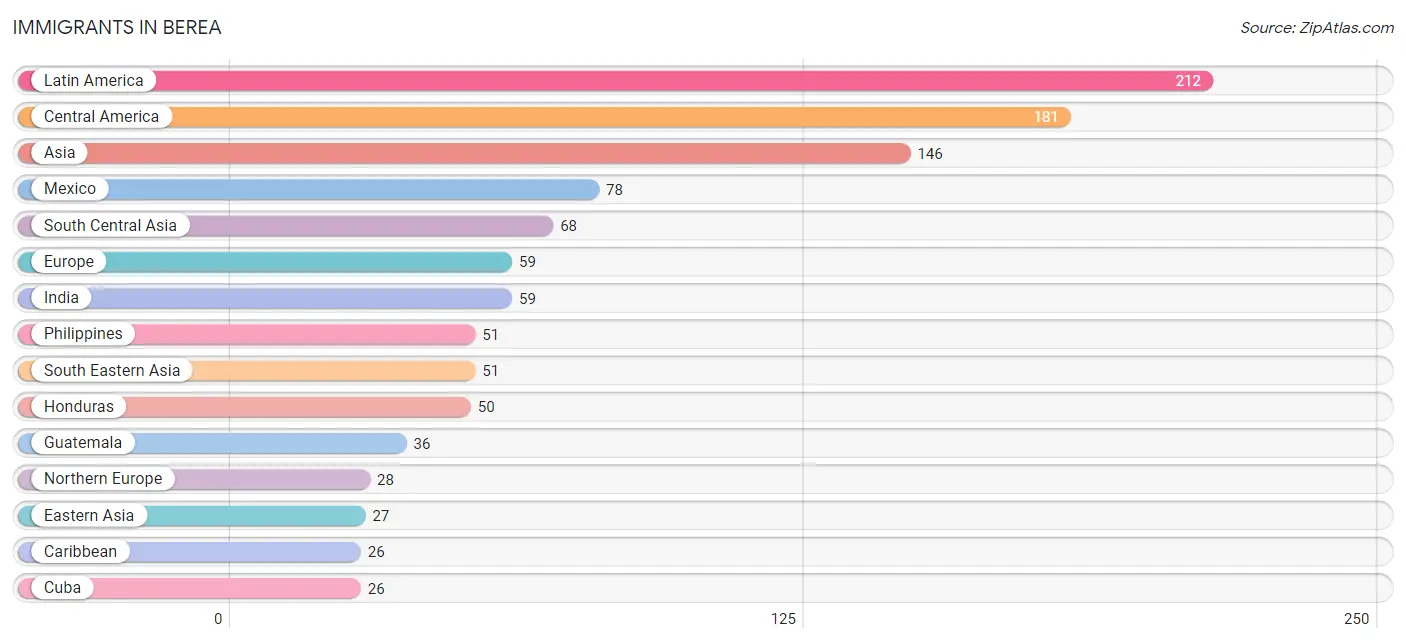
| Immigration Origin | # Population | % Population |
| Afghanistan | 4 | 0.0% |
| Africa | 16 | 0.1% |
| Asia | 146 | 0.9% |
| Canada | 7 | 0.1% |
| Caribbean | 26 | 0.2% |
| Central America | 181 | 1.2% |
| China | 25 | 0.2% |
| Cuba | 26 | 0.2% |
| Eastern Asia | 27 | 0.2% |
| Eastern Europe | 16 | 0.1% |
| Europe | 59 | 0.4% |
| France | 9 | 0.1% |
| Germany | 6 | 0.0% |
| Guatemala | 36 | 0.2% |
| Honduras | 50 | 0.3% |
| India | 59 | 0.4% |
| Ireland | 16 | 0.1% |
| Japan | 2 | 0.0% |
| Latin America | 212 | 1.4% |
| Latvia | 11 | 0.1% |
| Mexico | 78 | 0.5% |
| Nigeria | 7 | 0.1% |
| Northern Europe | 28 | 0.2% |
| Oceania | 4 | 0.0% |
| Panama | 17 | 0.1% |
| Philippines | 51 | 0.3% |
| Russia | 5 | 0.0% |
| South Africa | 9 | 0.1% |
| South America | 5 | 0.0% |
| South Central Asia | 68 | 0.4% |
| South Eastern Asia | 51 | 0.3% |
| Venezuela | 5 | 0.0% |
| Western Africa | 7 | 0.1% |
| Western Europe | 15 | 0.1% | View All 34 Rows |
Sex and Age in Berea
Sex and Age in Berea
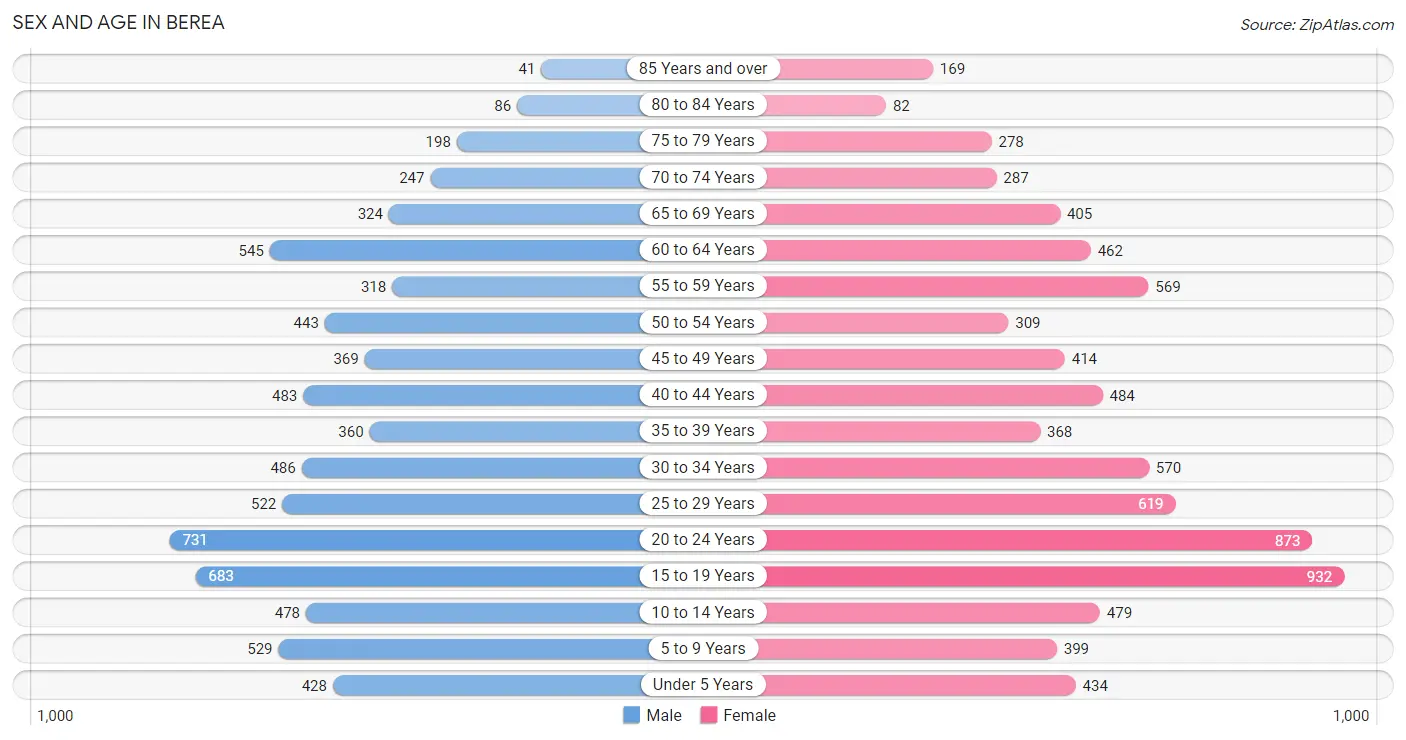
The most populous age groups in Berea are 20 to 24 Years (731 | 10.1%) for men and 15 to 19 Years (932 | 11.5%) for women.
| Age Bracket | Male | Female |
| Under 5 Years | 428 (5.9%) | 434 (5.3%) |
| 5 to 9 Years | 529 (7.3%) | 399 (4.9%) |
| 10 to 14 Years | 478 (6.6%) | 479 (5.9%) |
| 15 to 19 Years | 683 (9.4%) | 932 (11.5%) |
| 20 to 24 Years | 731 (10.1%) | 873 (10.7%) |
| 25 to 29 Years | 522 (7.2%) | 619 (7.6%) |
| 30 to 34 Years | 486 (6.7%) | 570 (7.0%) |
| 35 to 39 Years | 360 (5.0%) | 368 (4.5%) |
| 40 to 44 Years | 483 (6.6%) | 484 (5.9%) |
| 45 to 49 Years | 369 (5.1%) | 414 (5.1%) |
| 50 to 54 Years | 443 (6.1%) | 309 (3.8%) |
| 55 to 59 Years | 318 (4.4%) | 569 (7.0%) |
| 60 to 64 Years | 545 (7.5%) | 462 (5.7%) |
| 65 to 69 Years | 324 (4.5%) | 405 (5.0%) |
| 70 to 74 Years | 247 (3.4%) | 287 (3.5%) |
| 75 to 79 Years | 198 (2.7%) | 278 (3.4%) |
| 80 to 84 Years | 86 (1.2%) | 82 (1.0%) |
| 85 Years and over | 41 (0.6%) | 169 (2.1%) |
| Total | 7,271 (100.0%) | 8,133 (100.0%) |
Families and Households in Berea
Median Family Size in Berea
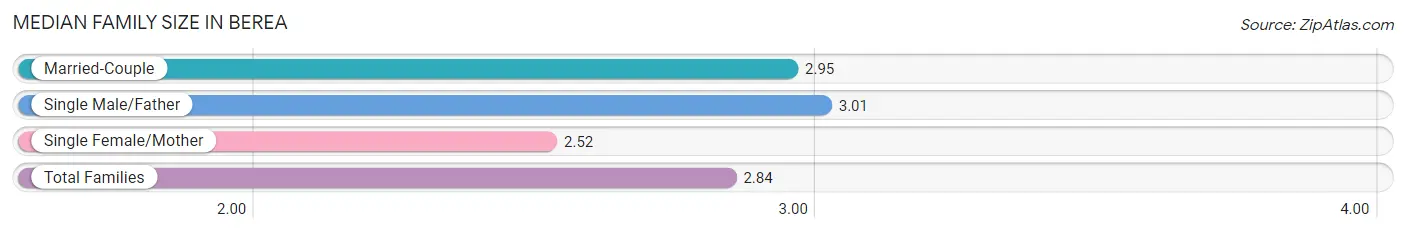
The median family size in Berea is 2.84 persons per family, with single male/father families (284 | 7.4%) accounting for the largest median family size of 3.01 persons per family. On the other hand, single female/mother families (975 | 25.3%) represent the smallest median family size with 2.52 persons per family.
| Family Type | # Families | Family Size |
| Married-Couple | 2,599 (67.4%) | 2.95 |
| Single Male/Father | 284 (7.4%) | 3.01 |
| Single Female/Mother | 975 (25.3%) | 2.52 |
| Total Families | 3,858 (100.0%) | 2.84 |
Median Household Size in Berea
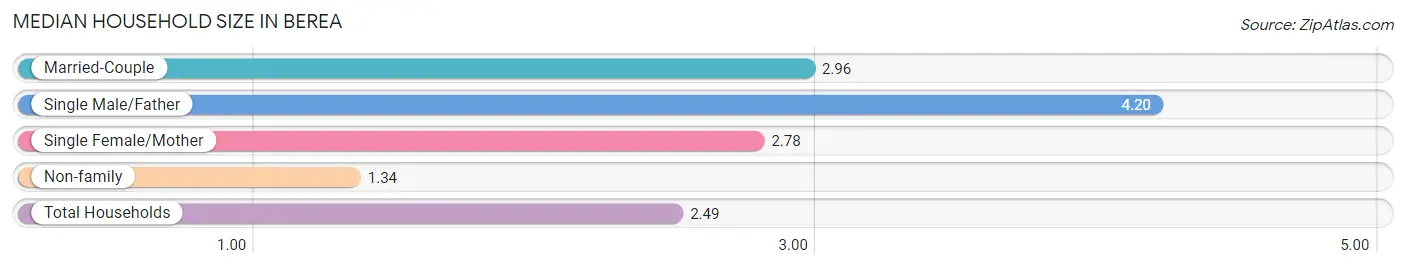
The median household size in Berea is 2.49 persons per household, with single male/father households (284 | 5.1%) accounting for the largest median household size of 4.2 persons per household. non-family households (1,715 | 30.8%) represent the smallest median household size with 1.34 persons per household.
| Household Type | # Households | Household Size |
| Married-Couple | 2,599 (46.6%) | 2.96 |
| Single Male/Father | 284 (5.1%) | 4.20 |
| Single Female/Mother | 975 (17.5%) | 2.78 |
| Non-family | 1,715 (30.8%) | 1.34 |
| Total Households | 5,573 (100.0%) | 2.49 |
Household Size by Marriage Status in Berea
Out of a total of 5,573 households in Berea, 3,858 (69.2%) are family households, while 1,715 (30.8%) are nonfamily households. The most numerous type of family households are 2-person households, comprising 1,950, and the most common type of nonfamily households are 1-person households, comprising 1,254.
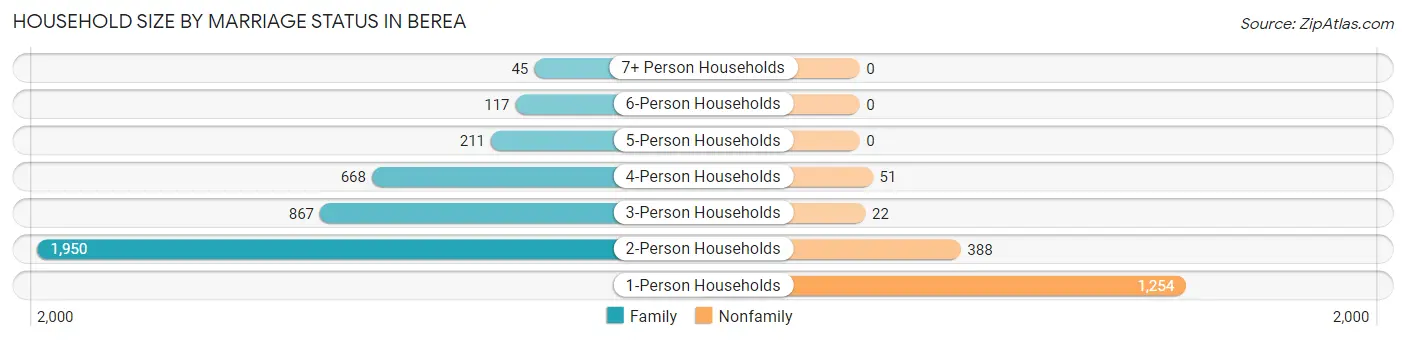
| Household Size | Family Households | Nonfamily Households |
| 1-Person Households | - | 1,254 (22.5%) |
| 2-Person Households | 1,950 (35.0%) | 388 (7.0%) |
| 3-Person Households | 867 (15.6%) | 22 (0.4%) |
| 4-Person Households | 668 (12.0%) | 51 (0.9%) |
| 5-Person Households | 211 (3.8%) | 0 (0.0%) |
| 6-Person Households | 117 (2.1%) | 0 (0.0%) |
| 7+ Person Households | 45 (0.8%) | 0 (0.0%) |
| Total | 3,858 (69.2%) | 1,715 (30.8%) |
Female Fertility in Berea
Fertility by Age in Berea
Average fertility rate in Berea is 68.0 births per 1,000 women. Women in the age bracket of 20 to 34 years have the highest fertility rate with 124.0 births per 1,000 women. Women in the age bracket of 20 to 34 years acount for 87.4% of all women with births.
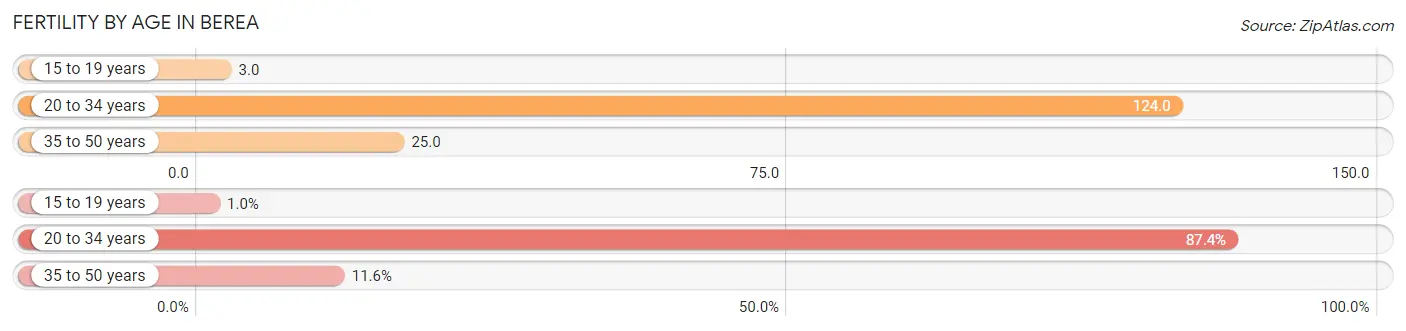
| Age Bracket | Women with Births | Births / 1,000 Women |
| 15 to 19 years | 3 (1.0%) | 3.0 |
| 20 to 34 years | 256 (87.4%) | 124.0 |
| 35 to 50 years | 34 (11.6%) | 25.0 |
| Total | 293 (100.0%) | 68.0 |
Fertility by Age by Marriage Status in Berea
82.3% of women with births (293) in Berea are married. The highest percentage of unmarried women with births falls into 15 to 19 years age bracket with 100.0% of them unmarried at the time of birth, while the lowest percentage of unmarried women with births belong to 35 to 50 years age bracket with 0.0% of them unmarried.
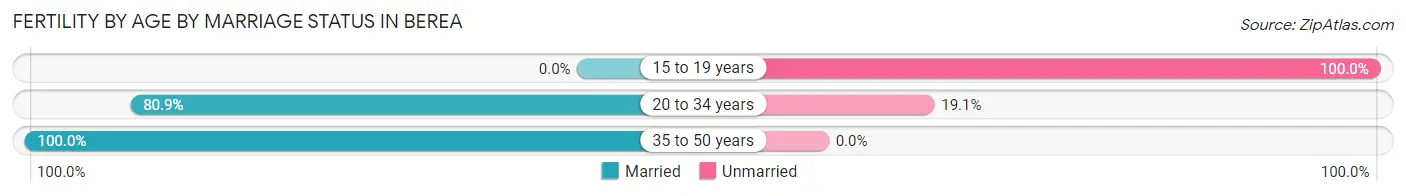
| Age Bracket | Married | Unmarried |
| 15 to 19 years | 0 (0.0%) | 3 (100.0%) |
| 20 to 34 years | 207 (80.9%) | 49 (19.1%) |
| 35 to 50 years | 34 (100.0%) | 0 (0.0%) |
| Total | 241 (82.3%) | 52 (17.7%) |
Fertility by Education in Berea
Average fertility rate in Berea is 68.0 births per 1,000 women. Women with the education attainment of graduate degree have the highest fertility rate of 88.0 births per 1,000 women, while women with the education attainment of less than high school have the lowest fertility at 28.0 births per 1,000 women. Women with the education attainment of college or associate's degree represent 36.2% of all women with births.
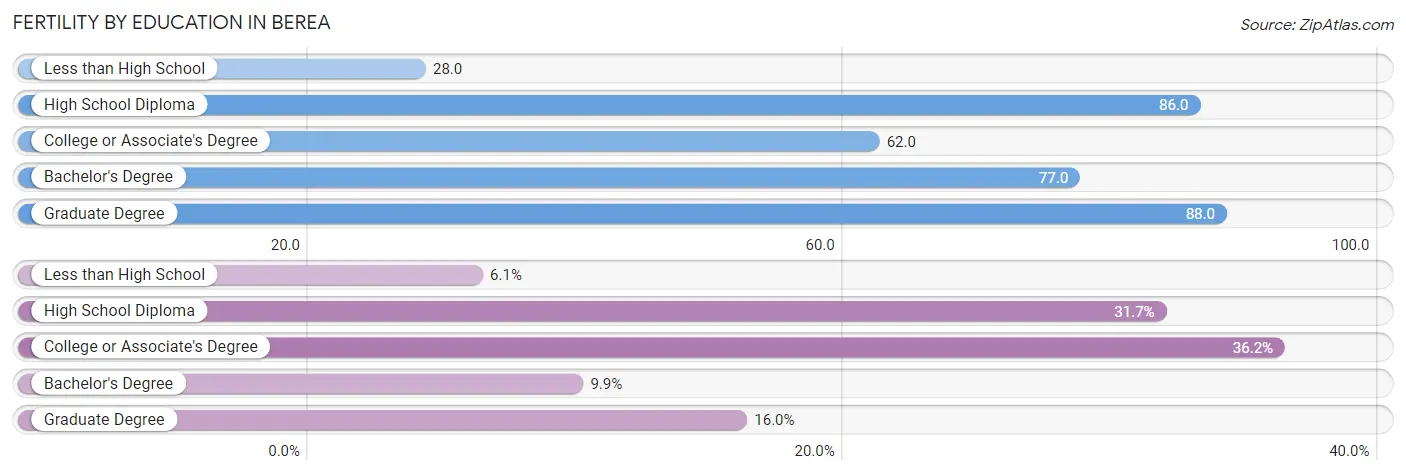
| Educational Attainment | Women with Births | Births / 1,000 Women |
| Less than High School | 18 (6.1%) | 28.0 |
| High School Diploma | 93 (31.7%) | 86.0 |
| College or Associate's Degree | 106 (36.2%) | 62.0 |
| Bachelor's Degree | 29 (9.9%) | 77.0 |
| Graduate Degree | 47 (16.0%) | 88.0 |
| Total | 293 (100.0%) | 68.0 |
Fertility by Education by Marriage Status in Berea
17.7% of women with births in Berea are unmarried. Women with the educational attainment of less than high school are most likely to be married with 100.0% of them married at childbirth, while women with the educational attainment of bachelor's degree are least likely to be married with 27.6% of them unmarried at childbirth.
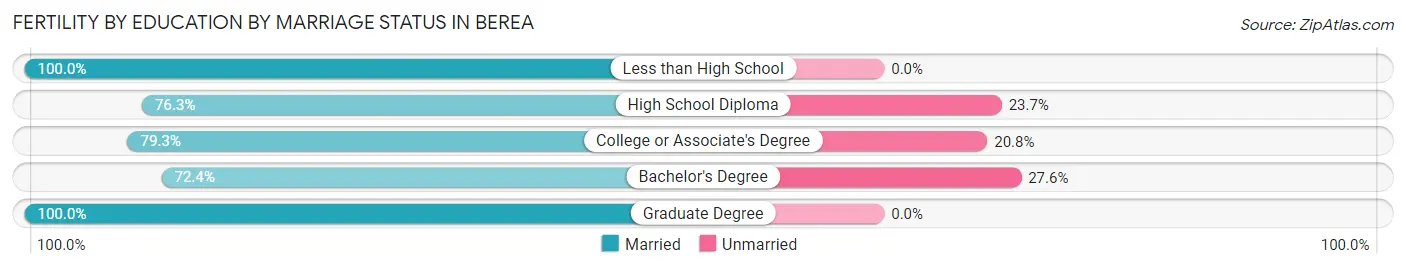
| Educational Attainment | Married | Unmarried |
| Less than High School | 18 (100.0%) | 0 (0.0%) |
| High School Diploma | 71 (76.3%) | 22 (23.7%) |
| College or Associate's Degree | 84 (79.2%) | 22 (20.7%) |
| Bachelor's Degree | 21 (72.4%) | 8 (27.6%) |
| Graduate Degree | 47 (100.0%) | 0 (0.0%) |
| Total | 241 (82.3%) | 52 (17.7%) |
Employment Characteristics in Berea
Employment by Class of Employer in Berea
Among the 6,721 employed individuals in Berea, private company employees (4,509 | 67.1%), not-for-profit organizations (1,021 | 15.2%), and self-employed (not incorporated) (331 | 4.9%) make up the most common classes of employment.
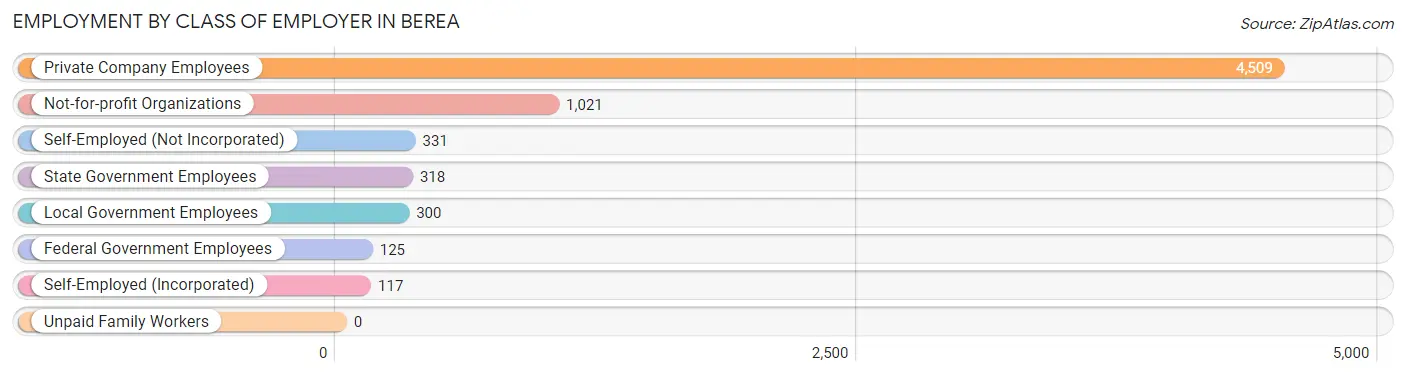
| Employer Class | # Employees | % Employees |
| Private Company Employees | 4,509 | 67.1% |
| Self-Employed (Incorporated) | 117 | 1.7% |
| Self-Employed (Not Incorporated) | 331 | 4.9% |
| Not-for-profit Organizations | 1,021 | 15.2% |
| Local Government Employees | 300 | 4.5% |
| State Government Employees | 318 | 4.7% |
| Federal Government Employees | 125 | 1.9% |
| Unpaid Family Workers | 0 | 0.0% |
| Total | 6,721 | 100.0% |
Employment Status by Age in Berea
According to the labor force statistics for Berea, out of the total population over 16 years of age (12,474), 56.8% or 7,085 individuals are in the labor force, with 2.4% or 170 of them unemployed. The age group with the highest labor force participation rate is 35 to 44 years, with 85.6% or 1,451 individuals in the labor force. Within the labor force, the 16 to 19 years age range has the highest percentage of unemployed individuals, with 4.2% or 23 of them being unemployed.
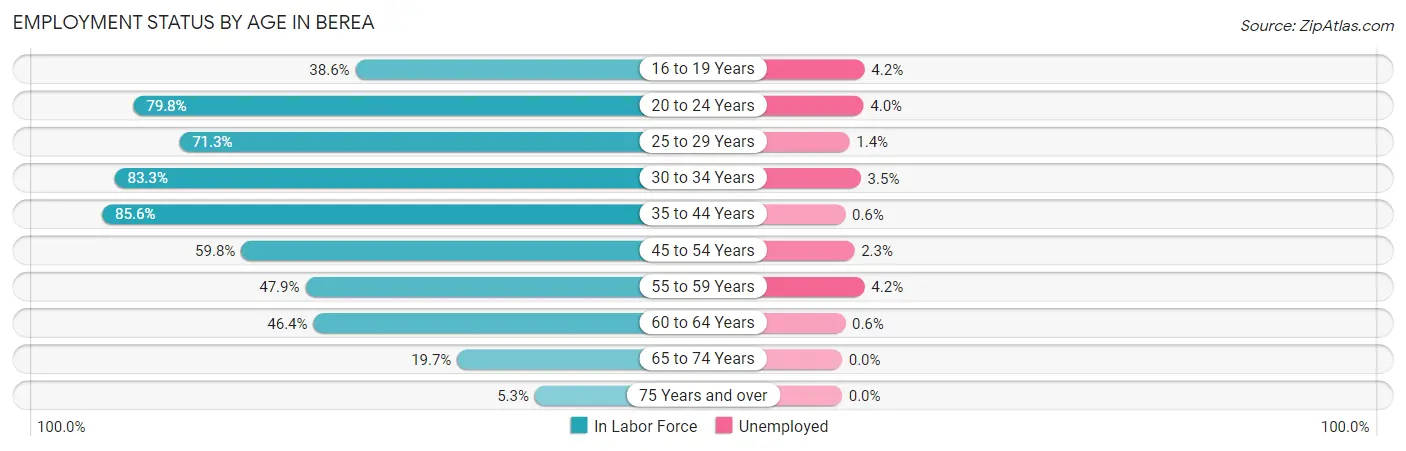
| Age Bracket | In Labor Force | Unemployed |
| 16 to 19 Years | 553 (38.6%) | 23 (4.2%) |
| 20 to 24 Years | 1,280 (79.8%) | 51 (4.0%) |
| 25 to 29 Years | 814 (71.3%) | 11 (1.4%) |
| 30 to 34 Years | 880 (83.3%) | 31 (3.5%) |
| 35 to 44 Years | 1,451 (85.6%) | 9 (0.6%) |
| 45 to 54 Years | 918 (59.8%) | 21 (2.3%) |
| 55 to 59 Years | 425 (47.9%) | 18 (4.2%) |
| 60 to 64 Years | 467 (46.4%) | 3 (0.6%) |
| 65 to 74 Years | 249 (19.7%) | 0 (0.0%) |
| 75 Years and over | 45 (5.3%) | 0 (0.0%) |
| Total | 7,085 (56.8%) | 170 (2.4%) |
Employment Status by Educational Attainment in Berea
According to labor force statistics for Berea, 67.7% of individuals (4,956) out of the total population between 25 and 64 years of age (7,321) are in the labor force, with 1.9% or 94 of them being unemployed. The group with the highest labor force participation rate are those with the educational attainment of bachelor's degree or higher, with 78.7% or 1,407 individuals in the labor force. Within the labor force, individuals with college / associate degree education have the highest percentage of unemployment, with 2.3% or 36 of them being unemployed.
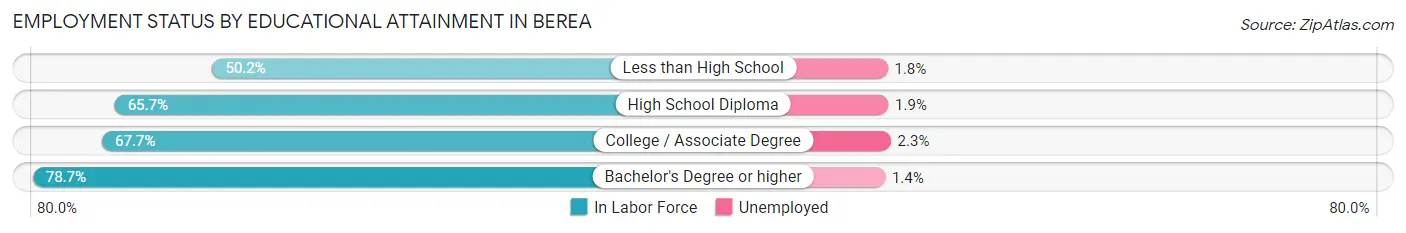
| Educational Attainment | In Labor Force | Unemployed |
| Less than High School | 434 (50.2%) | 16 (1.8%) |
| High School Diploma | 1,567 (65.7%) | 45 (1.9%) |
| College / Associate Degree | 1,546 (67.7%) | 53 (2.3%) |
| Bachelor's Degree or higher | 1,407 (78.7%) | 25 (1.4%) |
| Total | 4,956 (67.7%) | 139 (1.9%) |
Employment Occupations by Sex in Berea
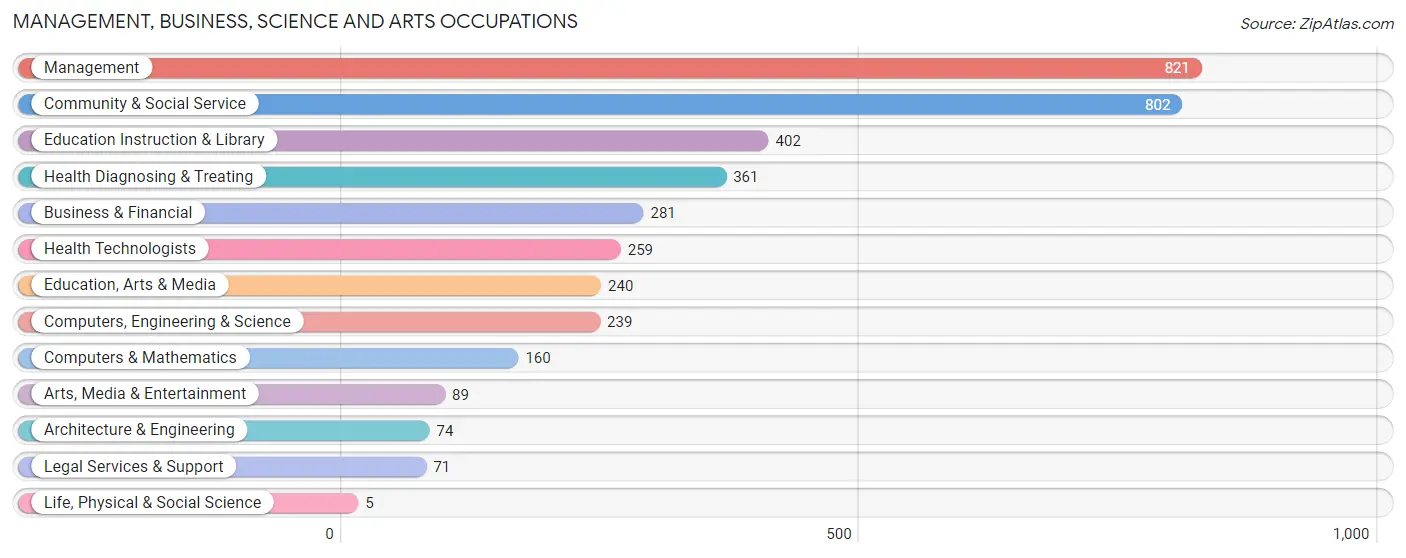
Management, Business, Science and Arts Occupations
The most common Management, Business, Science and Arts occupations in Berea are Management (821 | 11.9%), Community & Social Service (802 | 11.6%), Education Instruction & Library (402 | 5.8%), Health Diagnosing & Treating (361 | 5.2%), and Business & Financial (281 | 4.1%).
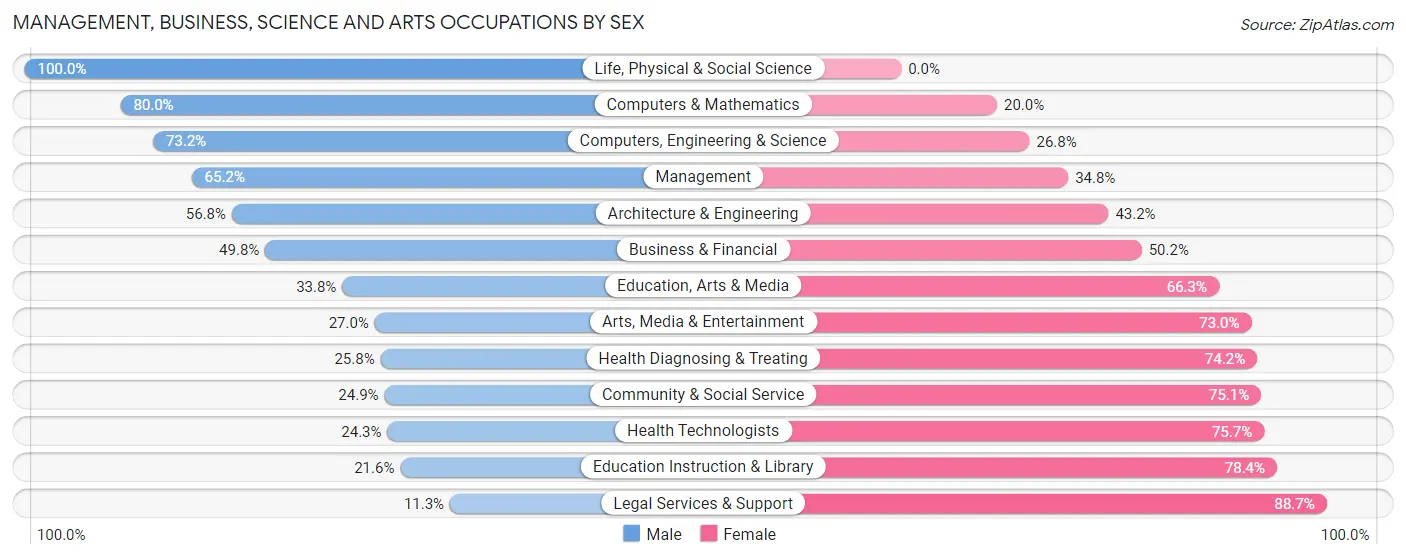
Management, Business, Science and Arts Occupations by Sex
Within the Management, Business, Science and Arts occupations in Berea, the most male-oriented occupations are Life, Physical & Social Science (100.0%), Computers & Mathematics (80.0%), and Computers, Engineering & Science (73.2%), while the most female-oriented occupations are Legal Services & Support (88.7%), Education Instruction & Library (78.4%), and Health Technologists (75.7%).
| Occupation | Male | Female |
| Management | 535 (65.2%) | 286 (34.8%) |
| Business & Financial | 140 (49.8%) | 141 (50.2%) |
| Computers, Engineering & Science | 175 (73.2%) | 64 (26.8%) |
| Computers & Mathematics | 128 (80.0%) | 32 (20.0%) |
| Architecture & Engineering | 42 (56.8%) | 32 (43.2%) |
| Life, Physical & Social Science | 5 (100.0%) | 0 (0.0%) |
| Community & Social Service | 200 (24.9%) | 602 (75.1%) |
| Education, Arts & Media | 81 (33.8%) | 159 (66.2%) |
| Legal Services & Support | 8 (11.3%) | 63 (88.7%) |
| Education Instruction & Library | 87 (21.6%) | 315 (78.4%) |
| Arts, Media & Entertainment | 24 (27.0%) | 65 (73.0%) |
| Health Diagnosing & Treating | 93 (25.8%) | 268 (74.2%) |
| Health Technologists | 63 (24.3%) | 196 (75.7%) |
| Total (Category) | 1,143 (45.7%) | 1,361 (54.3%) |
| Total (Overall) | 3,372 (48.8%) | 3,542 (51.2%) |
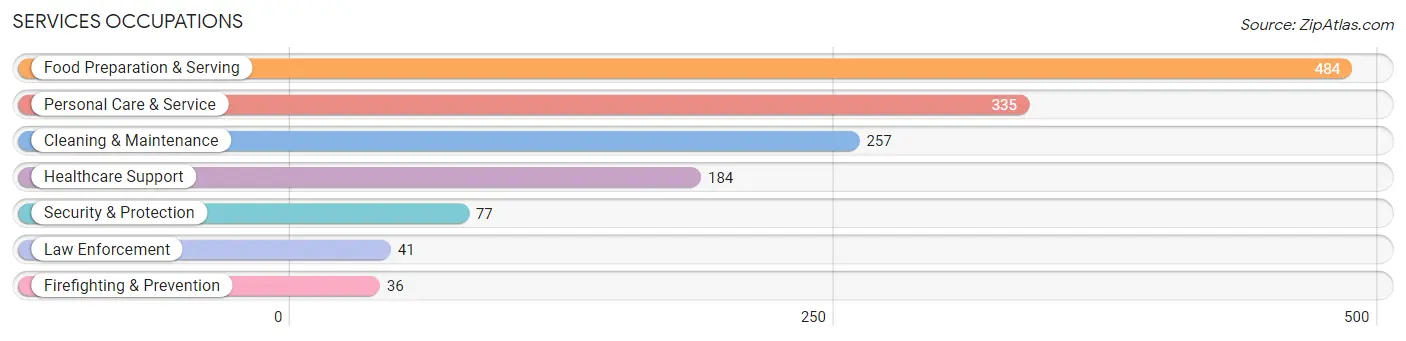
Services Occupations
The most common Services occupations in Berea are Food Preparation & Serving (484 | 7.0%), Personal Care & Service (335 | 4.9%), Cleaning & Maintenance (257 | 3.7%), Healthcare Support (184 | 2.7%), and Security & Protection (77 | 1.1%).
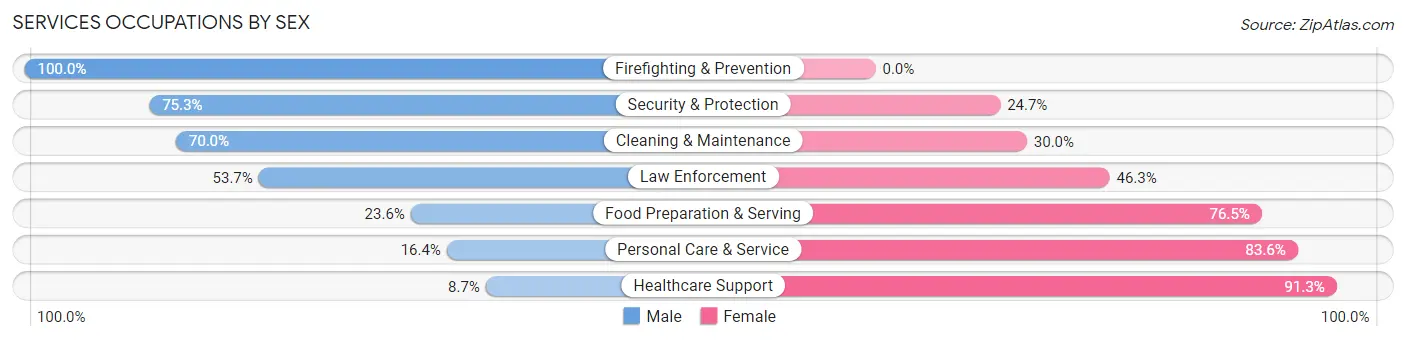
Services Occupations by Sex
Within the Services occupations in Berea, the most male-oriented occupations are Firefighting & Prevention (100.0%), Security & Protection (75.3%), and Cleaning & Maintenance (70.0%), while the most female-oriented occupations are Healthcare Support (91.3%), Personal Care & Service (83.6%), and Food Preparation & Serving (76.4%).
| Occupation | Male | Female |
| Healthcare Support | 16 (8.7%) | 168 (91.3%) |
| Security & Protection | 58 (75.3%) | 19 (24.7%) |
| Firefighting & Prevention | 36 (100.0%) | 0 (0.0%) |
| Law Enforcement | 22 (53.7%) | 19 (46.3%) |
| Food Preparation & Serving | 114 (23.5%) | 370 (76.4%) |
| Cleaning & Maintenance | 180 (70.0%) | 77 (30.0%) |
| Personal Care & Service | 55 (16.4%) | 280 (83.6%) |
| Total (Category) | 423 (31.6%) | 914 (68.4%) |
| Total (Overall) | 3,372 (48.8%) | 3,542 (51.2%) |
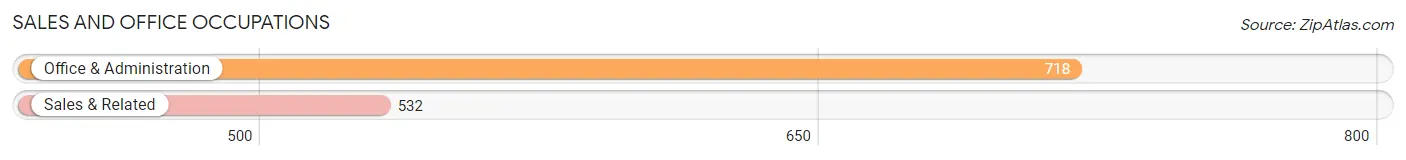
Sales and Office Occupations
The most common Sales and Office occupations in Berea are Office & Administration (718 | 10.4%), and Sales & Related (532 | 7.7%).
Sales and Office Occupations by Sex
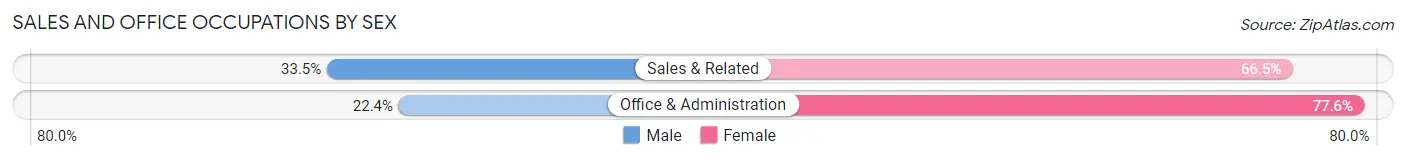
| Occupation | Male | Female |
| Sales & Related | 178 (33.5%) | 354 (66.5%) |
| Office & Administration | 161 (22.4%) | 557 (77.6%) |
| Total (Category) | 339 (27.1%) | 911 (72.9%) |
| Total (Overall) | 3,372 (48.8%) | 3,542 (51.2%) |
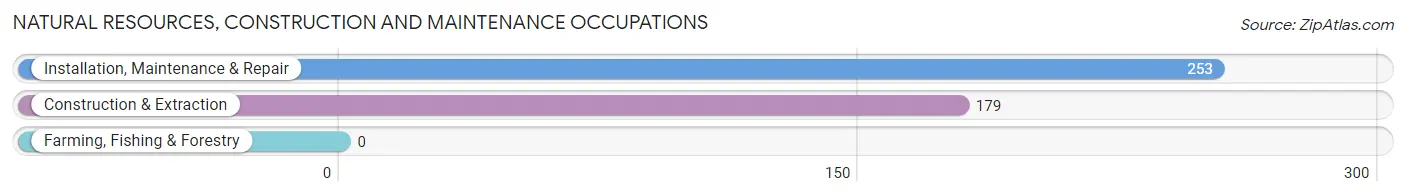
Natural Resources, Construction and Maintenance Occupations
The most common Natural Resources, Construction and Maintenance occupations in Berea are Installation, Maintenance & Repair (253 | 3.7%), and Construction & Extraction (179 | 2.6%).
Natural Resources, Construction and Maintenance Occupations by Sex
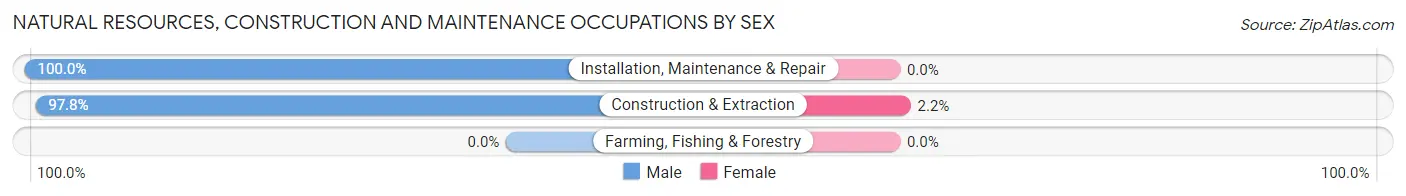
| Occupation | Male | Female |
| Farming, Fishing & Forestry | 0 (0.0%) | 0 (0.0%) |
| Construction & Extraction | 175 (97.8%) | 4 (2.2%) |
| Installation, Maintenance & Repair | 253 (100.0%) | 0 (0.0%) |
| Total (Category) | 428 (99.1%) | 4 (0.9%) |
| Total (Overall) | 3,372 (48.8%) | 3,542 (51.2%) |
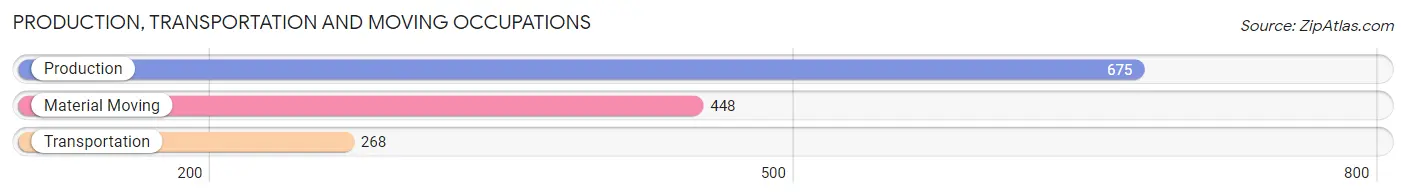
Production, Transportation and Moving Occupations
The most common Production, Transportation and Moving occupations in Berea are Production (675 | 9.8%), Material Moving (448 | 6.5%), and Transportation (268 | 3.9%).
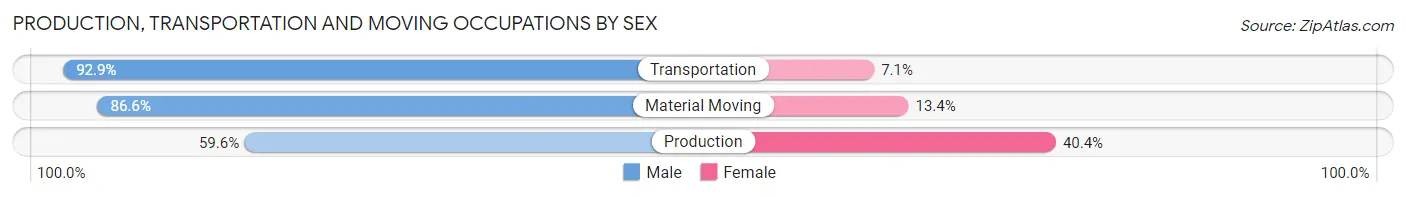
Production, Transportation and Moving Occupations by Sex
| Occupation | Male | Female |
| Production | 402 (59.6%) | 273 (40.4%) |
| Transportation | 249 (92.9%) | 19 (7.1%) |
| Material Moving | 388 (86.6%) | 60 (13.4%) |
| Total (Category) | 1,039 (74.7%) | 352 (25.3%) |
| Total (Overall) | 3,372 (48.8%) | 3,542 (51.2%) |
Employment Industries by Sex in Berea
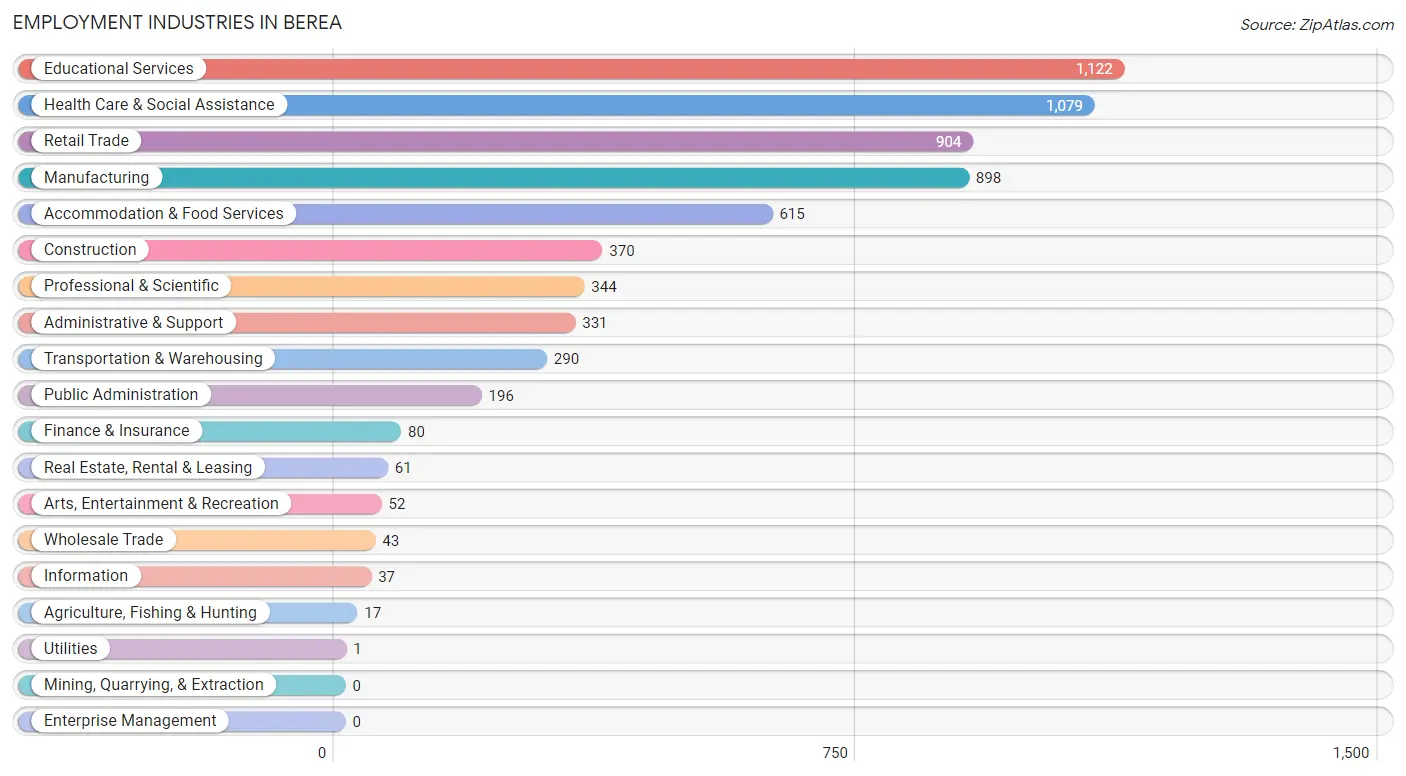
Employment Industries in Berea
The major employment industries in Berea include Educational Services (1,122 | 16.2%), Health Care & Social Assistance (1,079 | 15.6%), Retail Trade (904 | 13.1%), Manufacturing (898 | 13.0%), and Accommodation & Food Services (615 | 8.9%).
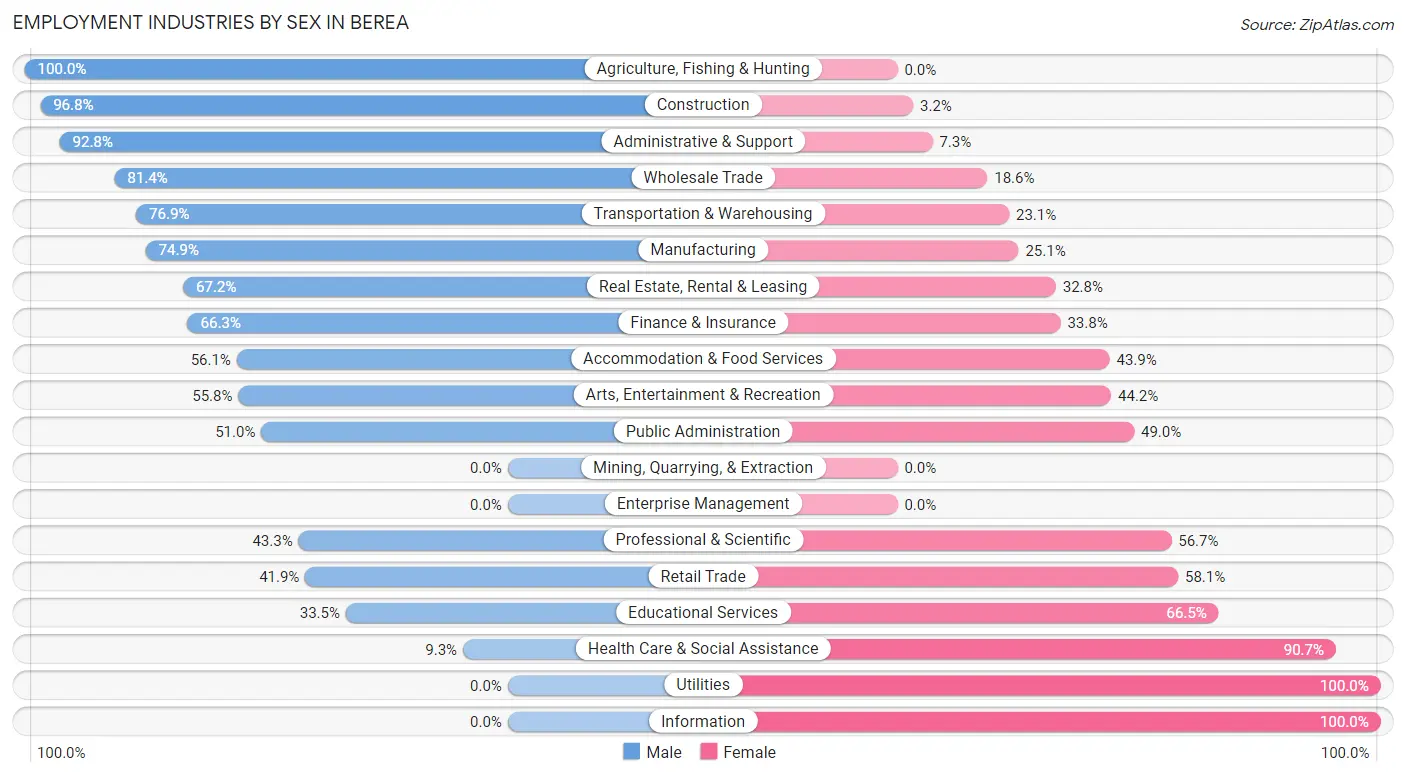
Employment Industries by Sex in Berea
The Berea industries that see more men than women are Agriculture, Fishing & Hunting (100.0%), Construction (96.8%), and Administrative & Support (92.7%), whereas the industries that tend to have a higher number of women are Utilities (100.0%), Information (100.0%), and Health Care & Social Assistance (90.7%).
| Industry | Male | Female |
| Agriculture, Fishing & Hunting | 17 (100.0%) | 0 (0.0%) |
| Mining, Quarrying, & Extraction | 0 (0.0%) | 0 (0.0%) |
| Construction | 358 (96.8%) | 12 (3.2%) |
| Manufacturing | 673 (74.9%) | 225 (25.1%) |
| Wholesale Trade | 35 (81.4%) | 8 (18.6%) |
| Retail Trade | 379 (41.9%) | 525 (58.1%) |
| Transportation & Warehousing | 223 (76.9%) | 67 (23.1%) |
| Utilities | 0 (0.0%) | 1 (100.0%) |
| Information | 0 (0.0%) | 37 (100.0%) |
| Finance & Insurance | 53 (66.2%) | 27 (33.8%) |
| Real Estate, Rental & Leasing | 41 (67.2%) | 20 (32.8%) |
| Professional & Scientific | 149 (43.3%) | 195 (56.7%) |
| Enterprise Management | 0 (0.0%) | 0 (0.0%) |
| Administrative & Support | 307 (92.7%) | 24 (7.2%) |
| Educational Services | 376 (33.5%) | 746 (66.5%) |
| Health Care & Social Assistance | 100 (9.3%) | 979 (90.7%) |
| Arts, Entertainment & Recreation | 29 (55.8%) | 23 (44.2%) |
| Accommodation & Food Services | 345 (56.1%) | 270 (43.9%) |
| Public Administration | 100 (51.0%) | 96 (49.0%) |
| Total | 3,372 (48.8%) | 3,542 (51.2%) |
Education in Berea
School Enrollment in Berea
The most common levels of schooling among the 4,822 students in Berea are college / undergraduate (2,160 | 44.8%), middle school (847 | 17.6%), and elementary school (596 | 12.4%).
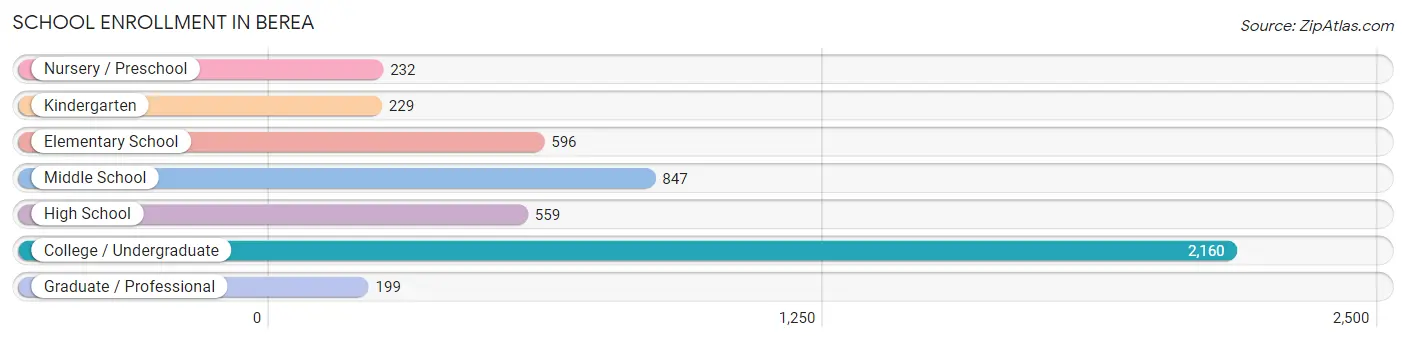
| School Level | # Students | % Students |
| Nursery / Preschool | 232 | 4.8% |
| Kindergarten | 229 | 4.8% |
| Elementary School | 596 | 12.4% |
| Middle School | 847 | 17.6% |
| High School | 559 | 11.6% |
| College / Undergraduate | 2,160 | 44.8% |
| Graduate / Professional | 199 | 4.1% |
| Total | 4,822 | 100.0% |
School Enrollment by Age by Funding Source in Berea
Out of a total of 4,822 students who are enrolled in schools in Berea, 921 (19.1%) attend a private institution, while the remaining 3,901 (80.9%) are enrolled in public schools. The age group of 25 to 34 year olds has the highest likelihood of being enrolled in private schools, with 131 (38.2% in the age bracket) enrolled. Conversely, the age group of 10 to 14 year olds has the lowest likelihood of being enrolled in a private school, with 914 (95.5% in the age bracket) attending a public institution.
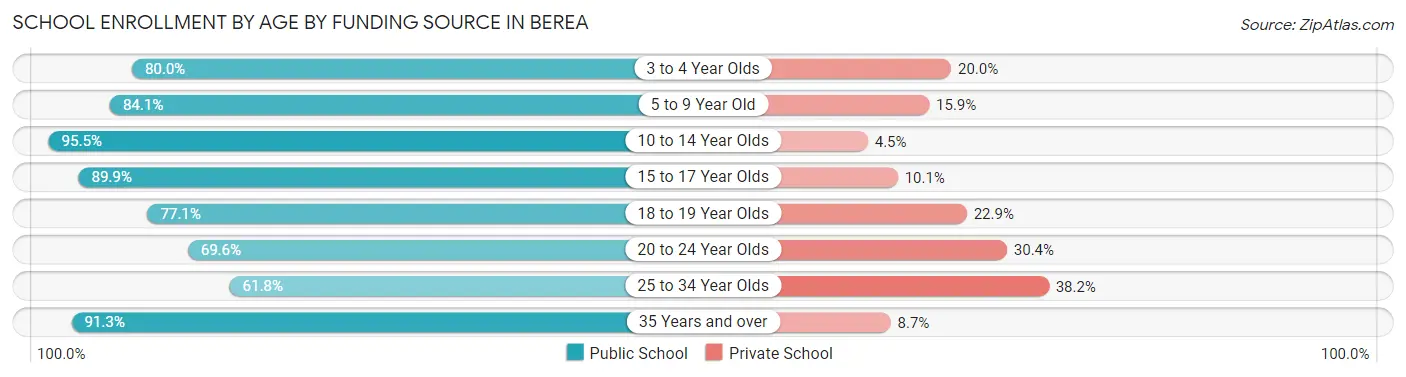
| Age Bracket | Public School | Private School |
| 3 to 4 Year Olds | 80 (80.0%) | 20 (20.0%) |
| 5 to 9 Year Old | 719 (84.1%) | 136 (15.9%) |
| 10 to 14 Year Olds | 914 (95.5%) | 43 (4.5%) |
| 15 to 17 Year Olds | 420 (89.9%) | 47 (10.1%) |
| 18 to 19 Year Olds | 733 (77.1%) | 218 (22.9%) |
| 20 to 24 Year Olds | 728 (69.6%) | 318 (30.4%) |
| 25 to 34 Year Olds | 212 (61.8%) | 131 (38.2%) |
| 35 Years and over | 94 (91.3%) | 9 (8.7%) |
| Total | 3,901 (80.9%) | 921 (19.1%) |
Educational Attainment by Field of Study in Berea
Education (466 | 16.8%), science & technology (412 | 14.8%), business (292 | 10.5%), arts & humanities (275 | 9.9%), and social sciences (272 | 9.8%) are the most common fields of study among 2,780 individuals in Berea who have obtained a bachelor's degree or higher.
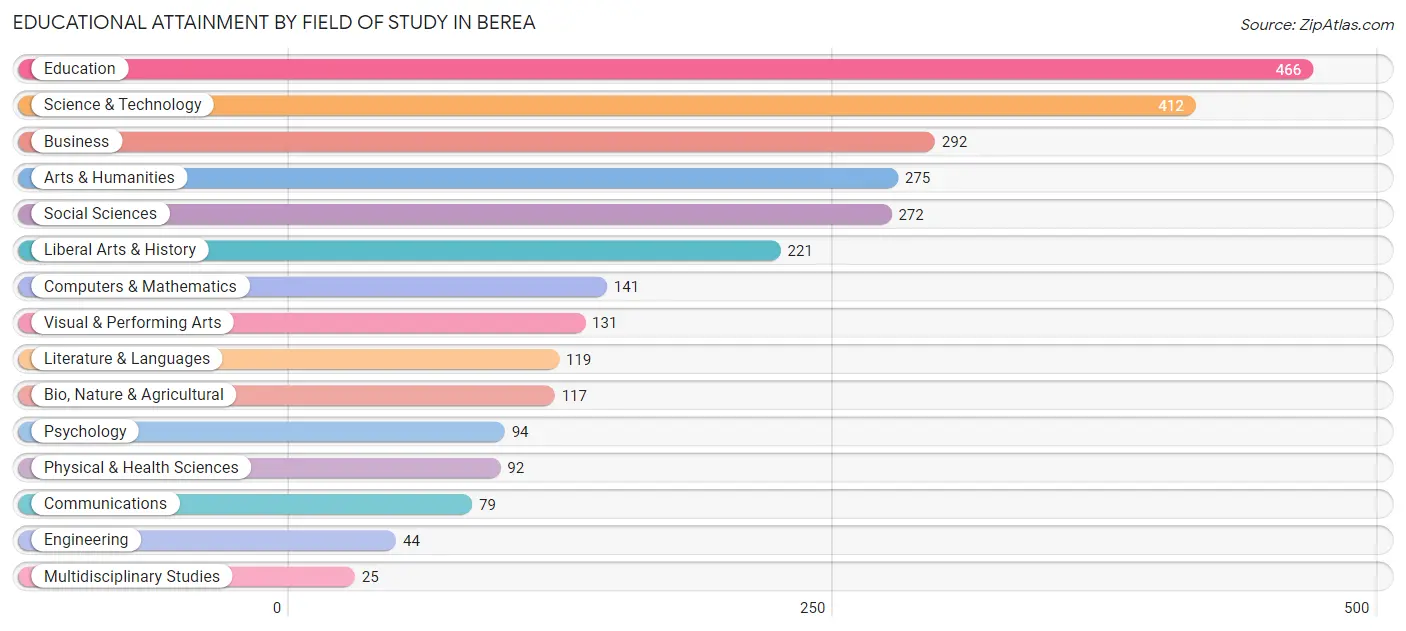
| Field of Study | # Graduates | % Graduates |
| Computers & Mathematics | 141 | 5.1% |
| Bio, Nature & Agricultural | 117 | 4.2% |
| Physical & Health Sciences | 92 | 3.3% |
| Psychology | 94 | 3.4% |
| Social Sciences | 272 | 9.8% |
| Engineering | 44 | 1.6% |
| Multidisciplinary Studies | 25 | 0.9% |
| Science & Technology | 412 | 14.8% |
| Business | 292 | 10.5% |
| Education | 466 | 16.8% |
| Literature & Languages | 119 | 4.3% |
| Liberal Arts & History | 221 | 8.0% |
| Visual & Performing Arts | 131 | 4.7% |
| Communications | 79 | 2.8% |
| Arts & Humanities | 275 | 9.9% |
| Total | 2,780 | 100.0% |
Transportation & Commute in Berea
Vehicle Availability by Sex in Berea
The most prevalent vehicle ownership categories in Berea are males with 2 vehicles (1,296, accounting for 40.9%) and females with 2 vehicles (1,218, making up 43.7%).
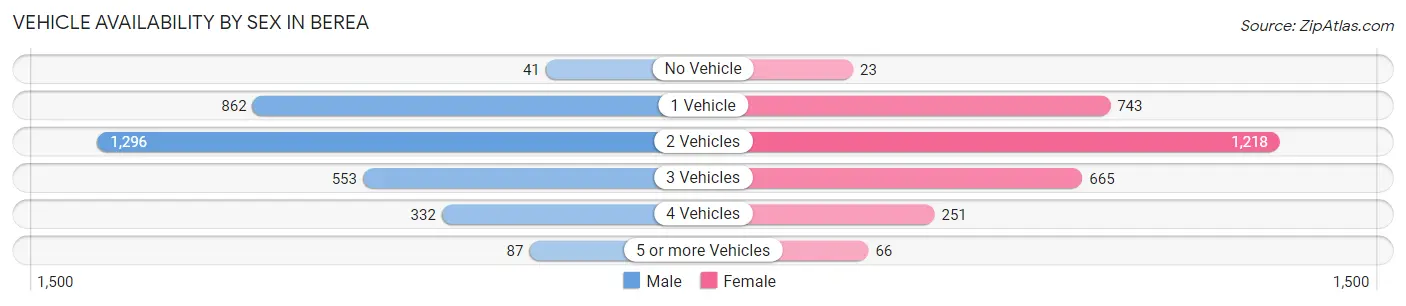
| Vehicles Available | Male | Female |
| No Vehicle | 41 (1.3%) | 23 (0.8%) |
| 1 Vehicle | 862 (27.2%) | 743 (25.1%) |
| 2 Vehicles | 1,296 (40.9%) | 1,218 (41.1%) |
| 3 Vehicles | 553 (17.4%) | 665 (22.4%) |
| 4 Vehicles | 332 (10.5%) | 251 (8.5%) |
| 5 or more Vehicles | 87 (2.7%) | 66 (2.2%) |
| Total | 3,171 (100.0%) | 2,966 (100.0%) |
Commute Time in Berea
The most frequently occuring commute durations in Berea are 10 to 14 minutes (1,281 commuters, 20.8%), 5 to 9 minutes (1,213 commuters, 19.7%), and 15 to 19 minutes (742 commuters, 12.1%).
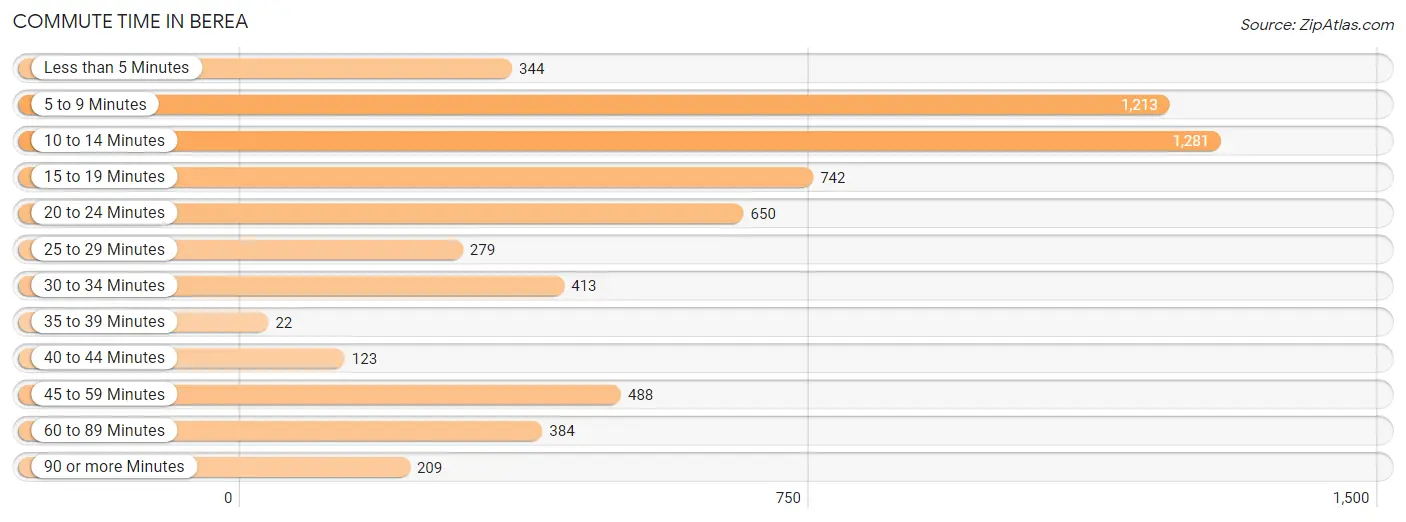
| Commute Time | # Commuters | % Commuters |
| Less than 5 Minutes | 344 | 5.6% |
| 5 to 9 Minutes | 1,213 | 19.7% |
| 10 to 14 Minutes | 1,281 | 20.8% |
| 15 to 19 Minutes | 742 | 12.1% |
| 20 to 24 Minutes | 650 | 10.6% |
| 25 to 29 Minutes | 279 | 4.5% |
| 30 to 34 Minutes | 413 | 6.7% |
| 35 to 39 Minutes | 22 | 0.4% |
| 40 to 44 Minutes | 123 | 2.0% |
| 45 to 59 Minutes | 488 | 7.9% |
| 60 to 89 Minutes | 384 | 6.2% |
| 90 or more Minutes | 209 | 3.4% |
Commute Time by Sex in Berea
The most common commute times in Berea are 10 to 14 minutes (678 commuters, 21.8%) for males and 5 to 9 minutes (679 commuters, 22.4%) for females.
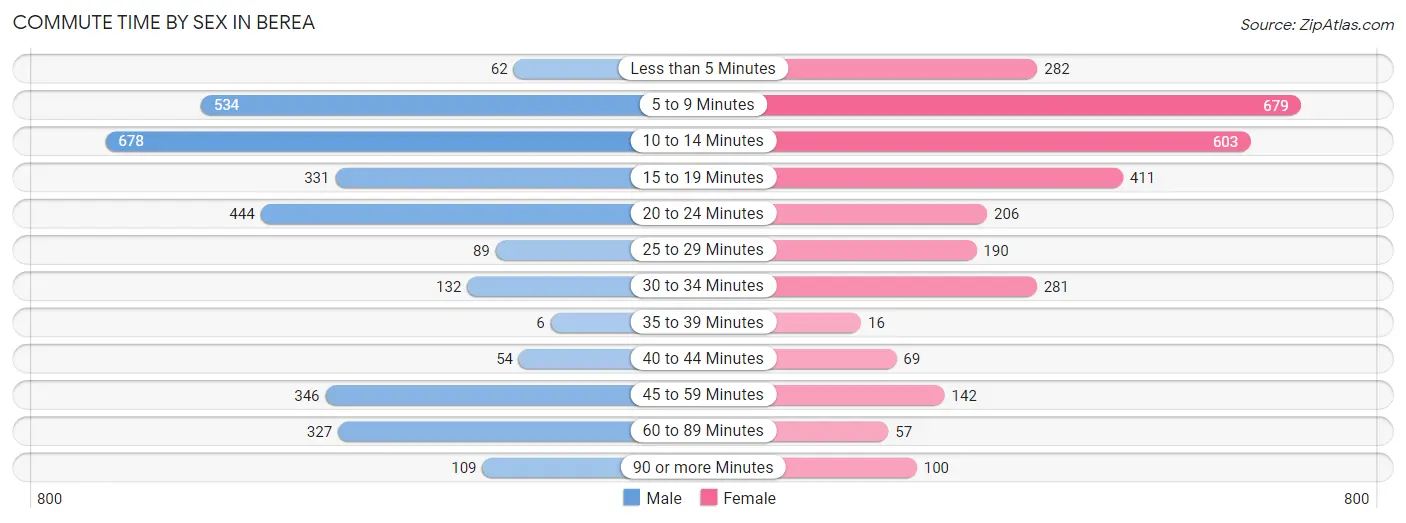
| Commute Time | Male | Female |
| Less than 5 Minutes | 62 (2.0%) | 282 (9.3%) |
| 5 to 9 Minutes | 534 (17.2%) | 679 (22.4%) |
| 10 to 14 Minutes | 678 (21.8%) | 603 (19.9%) |
| 15 to 19 Minutes | 331 (10.6%) | 411 (13.5%) |
| 20 to 24 Minutes | 444 (14.3%) | 206 (6.8%) |
| 25 to 29 Minutes | 89 (2.9%) | 190 (6.3%) |
| 30 to 34 Minutes | 132 (4.2%) | 281 (9.3%) |
| 35 to 39 Minutes | 6 (0.2%) | 16 (0.5%) |
| 40 to 44 Minutes | 54 (1.7%) | 69 (2.3%) |
| 45 to 59 Minutes | 346 (11.1%) | 142 (4.7%) |
| 60 to 89 Minutes | 327 (10.5%) | 57 (1.9%) |
| 90 or more Minutes | 109 (3.5%) | 100 (3.3%) |
Time of Departure to Work by Sex in Berea
The most frequent times of departure to work in Berea are 6:30 AM to 6:59 AM (398, 12.8%) for males and 7:30 AM to 7:59 AM (492, 16.2%) for females.
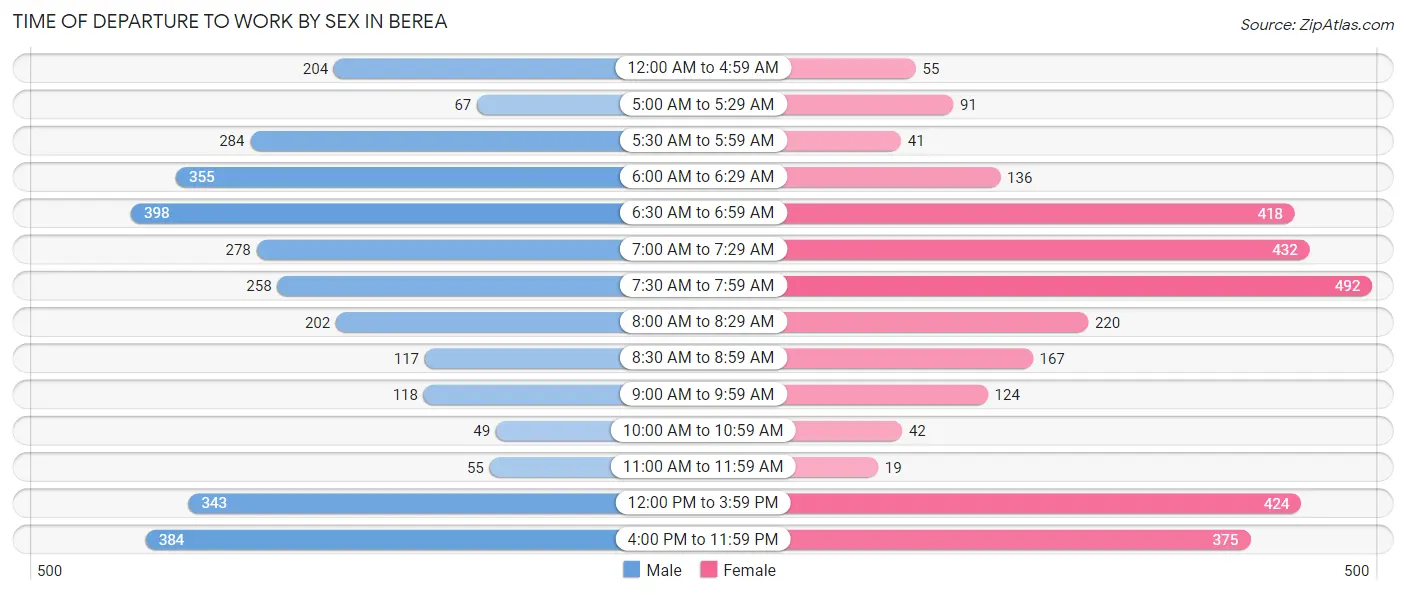
| Time of Departure | Male | Female |
| 12:00 AM to 4:59 AM | 204 (6.6%) | 55 (1.8%) |
| 5:00 AM to 5:29 AM | 67 (2.1%) | 91 (3.0%) |
| 5:30 AM to 5:59 AM | 284 (9.1%) | 41 (1.3%) |
| 6:00 AM to 6:29 AM | 355 (11.4%) | 136 (4.5%) |
| 6:30 AM to 6:59 AM | 398 (12.8%) | 418 (13.8%) |
| 7:00 AM to 7:29 AM | 278 (8.9%) | 432 (14.2%) |
| 7:30 AM to 7:59 AM | 258 (8.3%) | 492 (16.2%) |
| 8:00 AM to 8:29 AM | 202 (6.5%) | 220 (7.2%) |
| 8:30 AM to 8:59 AM | 117 (3.8%) | 167 (5.5%) |
| 9:00 AM to 9:59 AM | 118 (3.8%) | 124 (4.1%) |
| 10:00 AM to 10:59 AM | 49 (1.6%) | 42 (1.4%) |
| 11:00 AM to 11:59 AM | 55 (1.8%) | 19 (0.6%) |
| 12:00 PM to 3:59 PM | 343 (11.0%) | 424 (14.0%) |
| 4:00 PM to 11:59 PM | 384 (12.3%) | 375 (12.3%) |
| Total | 3,112 (100.0%) | 3,036 (100.0%) |
Housing Occupancy in Berea
Occupancy by Ownership in Berea
Of the total 5,573 dwellings in Berea, owner-occupied units account for 3,105 (55.7%), while renter-occupied units make up 2,468 (44.3%).
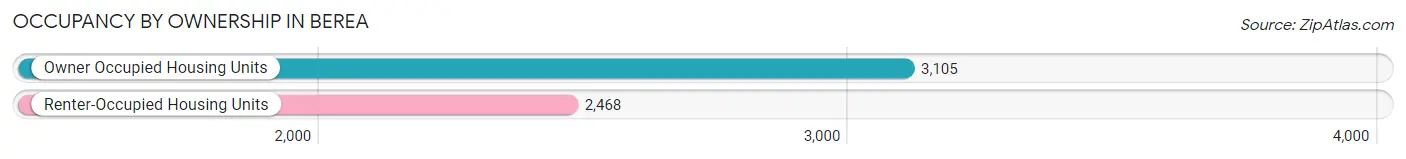
| Occupancy | # Housing Units | % Housing Units |
| Owner Occupied Housing Units | 3,105 | 55.7% |
| Renter-Occupied Housing Units | 2,468 | 44.3% |
| Total Occupied Housing Units | 5,573 | 100.0% |
Occupancy by Household Size in Berea
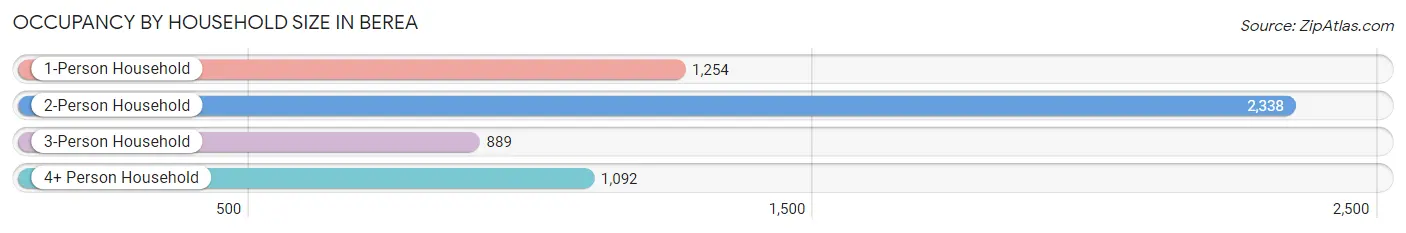
| Household Size | # Housing Units | % Housing Units |
| 1-Person Household | 1,254 | 22.5% |
| 2-Person Household | 2,338 | 41.9% |
| 3-Person Household | 889 | 16.0% |
| 4+ Person Household | 1,092 | 19.6% |
| Total Housing Units | 5,573 | 100.0% |
Occupancy by Ownership by Household Size in Berea
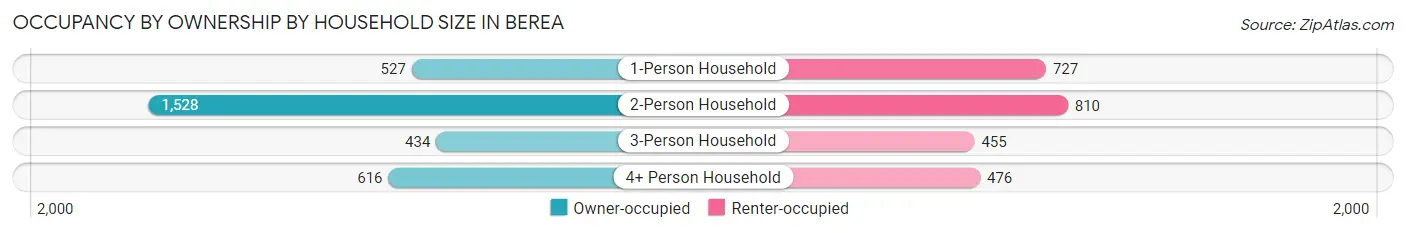
| Household Size | Owner-occupied | Renter-occupied |
| 1-Person Household | 527 (42.0%) | 727 (58.0%) |
| 2-Person Household | 1,528 (65.4%) | 810 (34.6%) |
| 3-Person Household | 434 (48.8%) | 455 (51.2%) |
| 4+ Person Household | 616 (56.4%) | 476 (43.6%) |
| Total Housing Units | 3,105 (55.7%) | 2,468 (44.3%) |
Occupancy by Educational Attainment in Berea
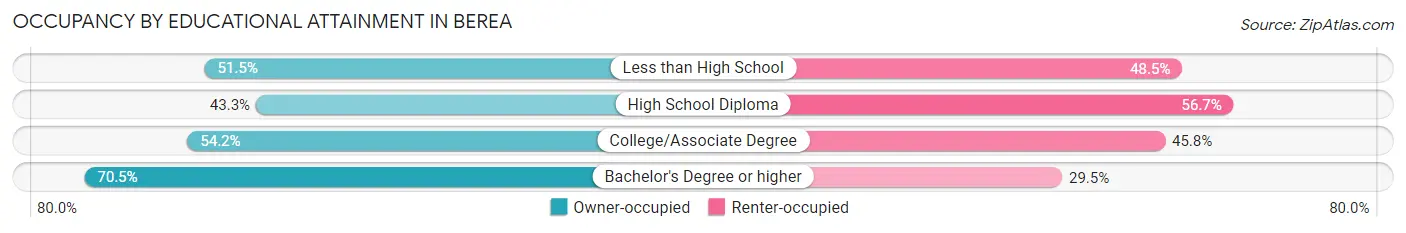
| Household Size | Owner-occupied | Renter-occupied |
| Less than High School | 247 (51.5%) | 233 (48.5%) |
| High School Diploma | 660 (43.3%) | 864 (56.7%) |
| College/Associate Degree | 1,057 (54.2%) | 894 (45.8%) |
| Bachelor's Degree or higher | 1,141 (70.5%) | 477 (29.5%) |
Occupancy by Age of Householder in Berea
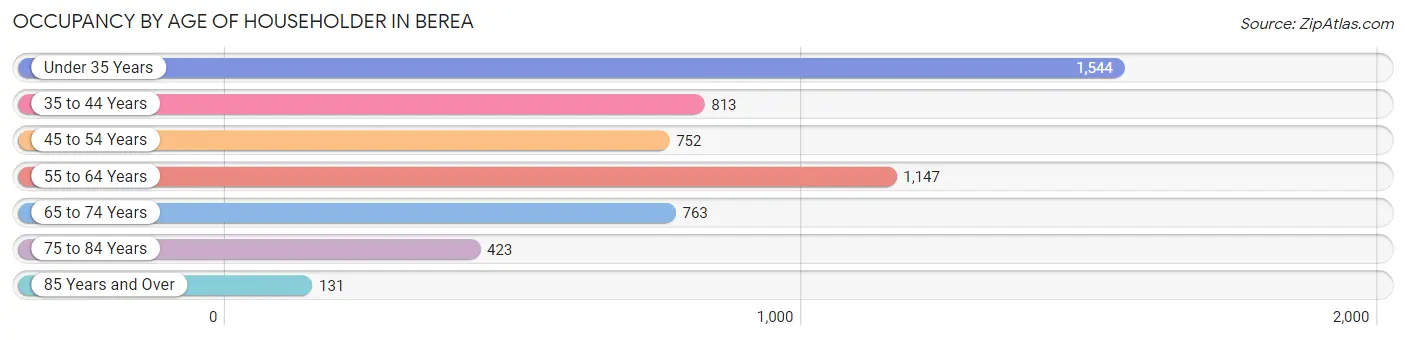
| Age Bracket | # Households | % Households |
| Under 35 Years | 1,544 | 27.7% |
| 35 to 44 Years | 813 | 14.6% |
| 45 to 54 Years | 752 | 13.5% |
| 55 to 64 Years | 1,147 | 20.6% |
| 65 to 74 Years | 763 | 13.7% |
| 75 to 84 Years | 423 | 7.6% |
| 85 Years and Over | 131 | 2.4% |
| Total | 5,573 | 100.0% |
Housing Finances in Berea
Median Income by Occupancy in Berea
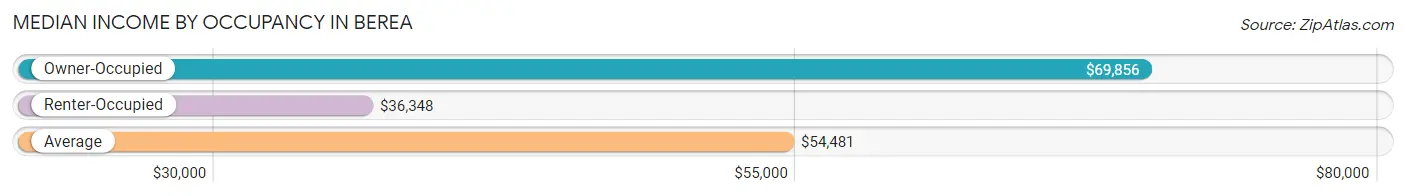
| Occupancy Type | # Households | Median Income |
| Owner-Occupied | 3,105 (55.7%) | $69,856 |
| Renter-Occupied | 2,468 (44.3%) | $36,348 |
| Average | 5,573 (100.0%) | $54,481 |
Occupancy by Householder Income Bracket in Berea
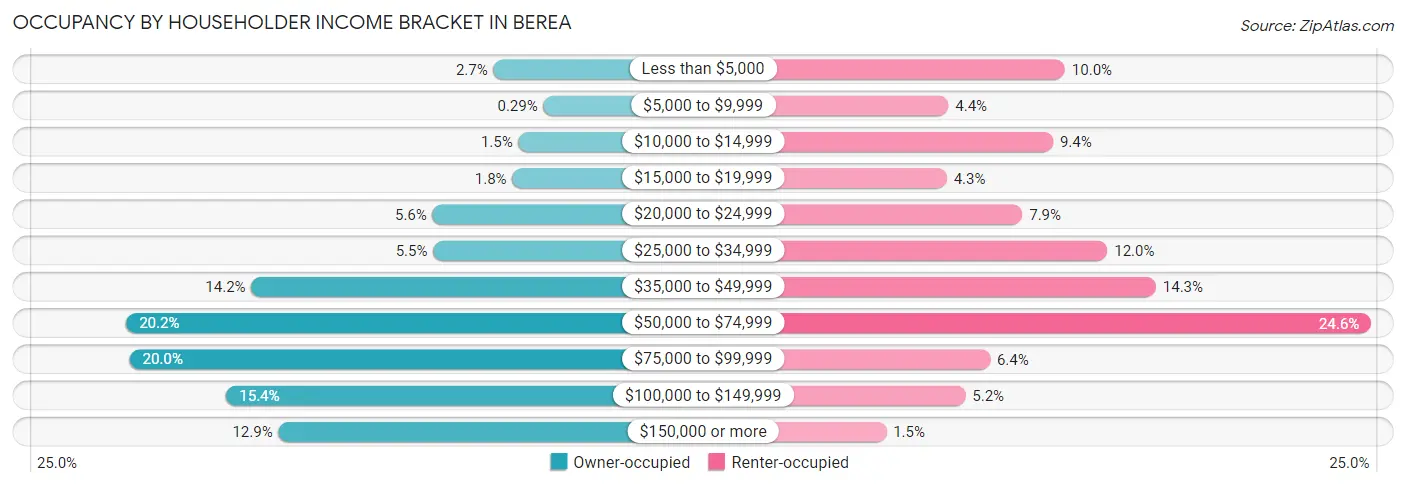
| Income Bracket | Owner-occupied | Renter-occupied |
| Less than $5,000 | 83 (2.7%) | 246 (10.0%) |
| $5,000 to $9,999 | 9 (0.3%) | 109 (4.4%) |
| $10,000 to $14,999 | 46 (1.5%) | 232 (9.4%) |
| $15,000 to $19,999 | 55 (1.8%) | 107 (4.3%) |
| $20,000 to $24,999 | 173 (5.6%) | 196 (7.9%) |
| $25,000 to $34,999 | 172 (5.5%) | 296 (12.0%) |
| $35,000 to $49,999 | 441 (14.2%) | 353 (14.3%) |
| $50,000 to $74,999 | 626 (20.2%) | 606 (24.5%) |
| $75,000 to $99,999 | 621 (20.0%) | 158 (6.4%) |
| $100,000 to $149,999 | 478 (15.4%) | 129 (5.2%) |
| $150,000 or more | 401 (12.9%) | 36 (1.5%) |
| Total | 3,105 (100.0%) | 2,468 (100.0%) |
Monthly Housing Cost Tiers in Berea
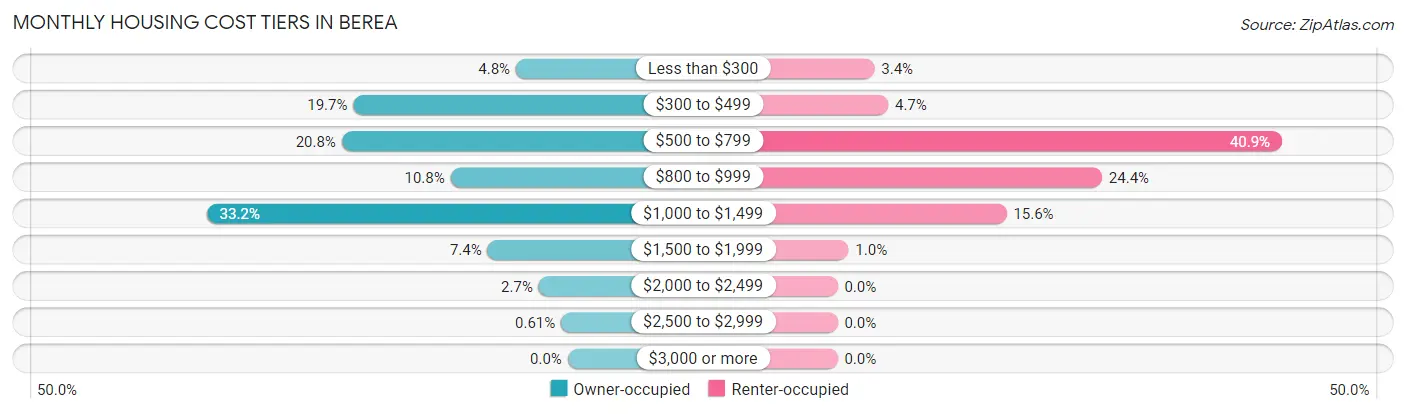
| Monthly Cost | Owner-occupied | Renter-occupied |
| Less than $300 | 148 (4.8%) | 84 (3.4%) |
| $300 to $499 | 613 (19.7%) | 115 (4.7%) |
| $500 to $799 | 646 (20.8%) | 1,010 (40.9%) |
| $800 to $999 | 335 (10.8%) | 601 (24.3%) |
| $1,000 to $1,499 | 1,032 (33.2%) | 384 (15.6%) |
| $1,500 to $1,999 | 229 (7.4%) | 25 (1.0%) |
| $2,000 to $2,499 | 83 (2.7%) | 0 (0.0%) |
| $2,500 to $2,999 | 19 (0.6%) | 0 (0.0%) |
| $3,000 or more | 0 (0.0%) | 0 (0.0%) |
| Total | 3,105 (100.0%) | 2,468 (100.0%) |
Physical Housing Characteristics in Berea
Housing Structures in Berea
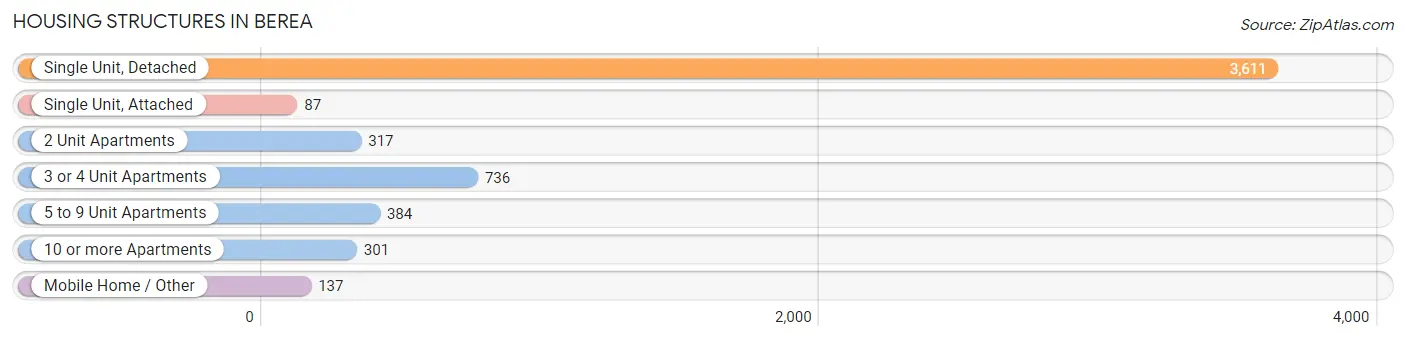
| Structure Type | # Housing Units | % Housing Units |
| Single Unit, Detached | 3,611 | 64.8% |
| Single Unit, Attached | 87 | 1.6% |
| 2 Unit Apartments | 317 | 5.7% |
| 3 or 4 Unit Apartments | 736 | 13.2% |
| 5 to 9 Unit Apartments | 384 | 6.9% |
| 10 or more Apartments | 301 | 5.4% |
| Mobile Home / Other | 137 | 2.5% |
| Total | 5,573 | 100.0% |
Housing Structures by Occupancy in Berea
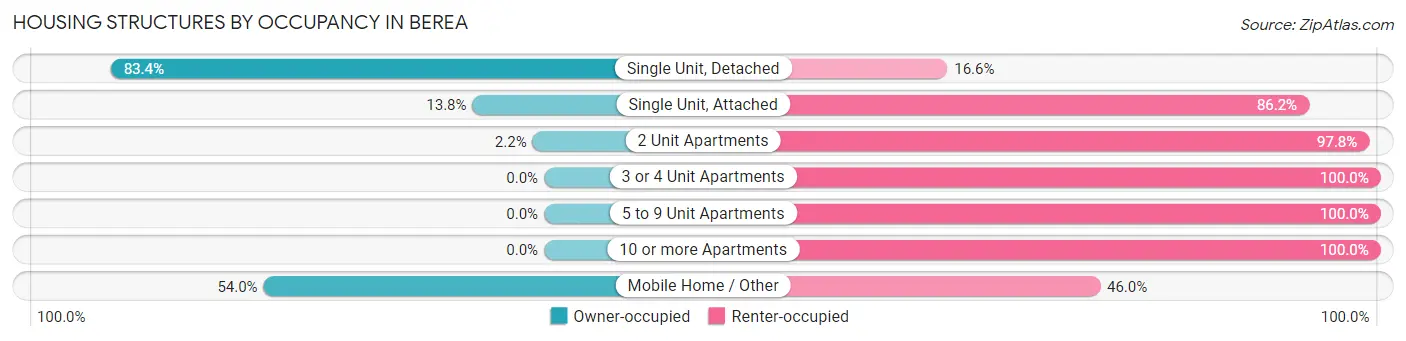
| Structure Type | Owner-occupied | Renter-occupied |
| Single Unit, Detached | 3,012 (83.4%) | 599 (16.6%) |
| Single Unit, Attached | 12 (13.8%) | 75 (86.2%) |
| 2 Unit Apartments | 7 (2.2%) | 310 (97.8%) |
| 3 or 4 Unit Apartments | 0 (0.0%) | 736 (100.0%) |
| 5 to 9 Unit Apartments | 0 (0.0%) | 384 (100.0%) |
| 10 or more Apartments | 0 (0.0%) | 301 (100.0%) |
| Mobile Home / Other | 74 (54.0%) | 63 (46.0%) |
| Total | 3,105 (55.7%) | 2,468 (44.3%) |
Housing Structures by Number of Rooms in Berea
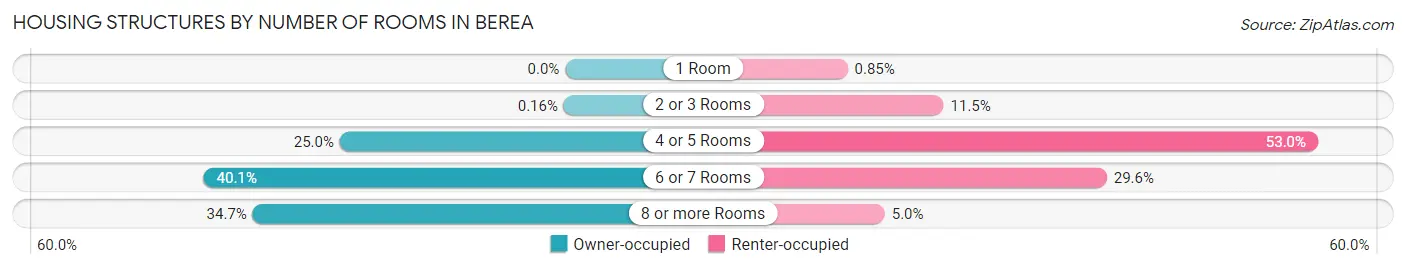
| Number of Rooms | Owner-occupied | Renter-occupied |
| 1 Room | 0 (0.0%) | 21 (0.9%) |
| 2 or 3 Rooms | 5 (0.2%) | 284 (11.5%) |
| 4 or 5 Rooms | 777 (25.0%) | 1,309 (53.0%) |
| 6 or 7 Rooms | 1,246 (40.1%) | 731 (29.6%) |
| 8 or more Rooms | 1,077 (34.7%) | 123 (5.0%) |
| Total | 3,105 (100.0%) | 2,468 (100.0%) |
Housing Structure by Heating Type in Berea
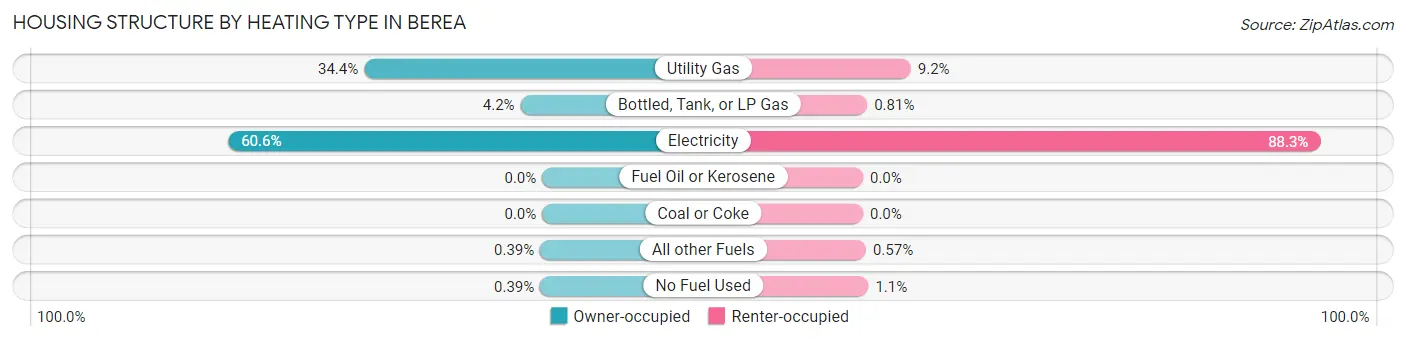
| Heating Type | Owner-occupied | Renter-occupied |
| Utility Gas | 1,068 (34.4%) | 228 (9.2%) |
| Bottled, Tank, or LP Gas | 130 (4.2%) | 20 (0.8%) |
| Electricity | 1,883 (60.6%) | 2,180 (88.3%) |
| Fuel Oil or Kerosene | 0 (0.0%) | 0 (0.0%) |
| Coal or Coke | 0 (0.0%) | 0 (0.0%) |
| All other Fuels | 12 (0.4%) | 14 (0.6%) |
| No Fuel Used | 12 (0.4%) | 26 (1.1%) |
| Total | 3,105 (100.0%) | 2,468 (100.0%) |
Household Vehicle Usage in Berea
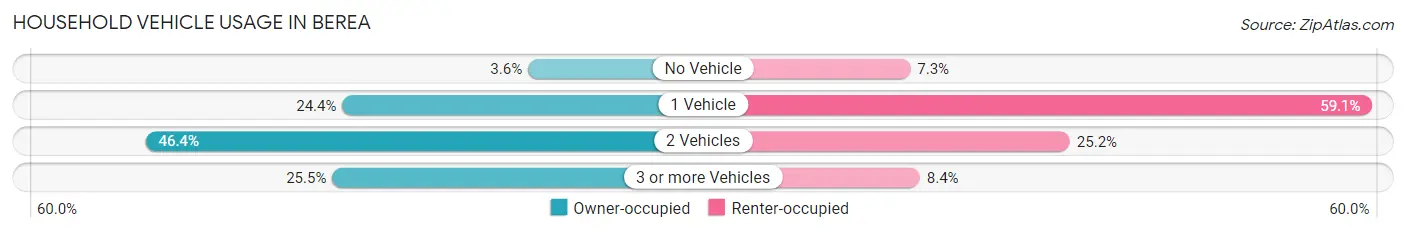
| Vehicles per Household | Owner-occupied | Renter-occupied |
| No Vehicle | 112 (3.6%) | 181 (7.3%) |
| 1 Vehicle | 758 (24.4%) | 1,458 (59.1%) |
| 2 Vehicles | 1,442 (46.4%) | 622 (25.2%) |
| 3 or more Vehicles | 793 (25.5%) | 207 (8.4%) |
| Total | 3,105 (100.0%) | 2,468 (100.0%) |
Real Estate & Mortgages in Berea
Real Estate and Mortgage Overview in Berea
| Characteristic | Without Mortgage | With Mortgage |
| Housing Units | 1,048 | 2,057 |
| Median Property Value | $160,700 | $172,700 |
| Median Household Income | $58,500 | $319 |
| Monthly Housing Costs | $438 | $0 |
| Real Estate Taxes | $1,233 | $111 |
Property Value by Mortgage Status in Berea
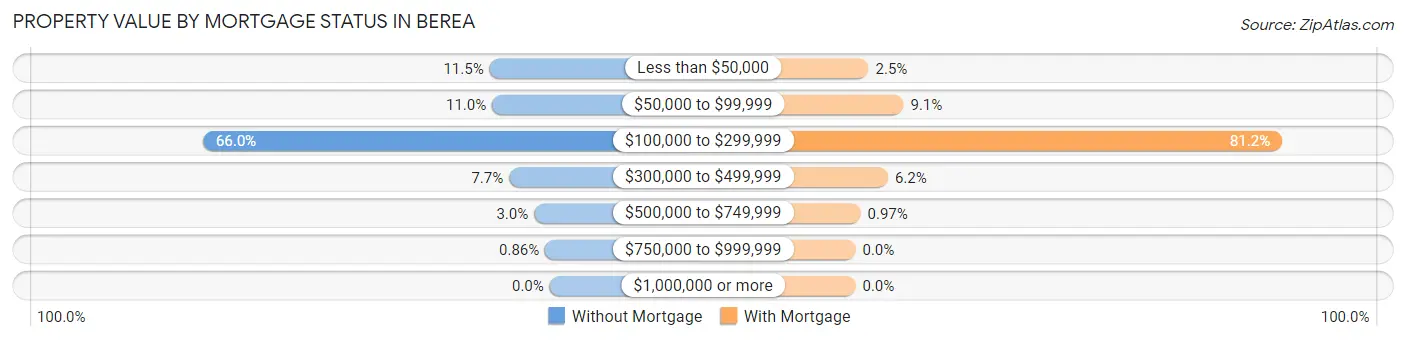
| Property Value | Without Mortgage | With Mortgage |
| Less than $50,000 | 120 (11.5%) | 51 (2.5%) |
| $50,000 to $99,999 | 115 (11.0%) | 188 (9.1%) |
| $100,000 to $299,999 | 692 (66.0%) | 1,671 (81.2%) |
| $300,000 to $499,999 | 81 (7.7%) | 127 (6.2%) |
| $500,000 to $749,999 | 31 (3.0%) | 20 (1.0%) |
| $750,000 to $999,999 | 9 (0.9%) | 0 (0.0%) |
| $1,000,000 or more | 0 (0.0%) | 0 (0.0%) |
| Total | 1,048 (100.0%) | 2,057 (100.0%) |
Household Income by Mortgage Status in Berea
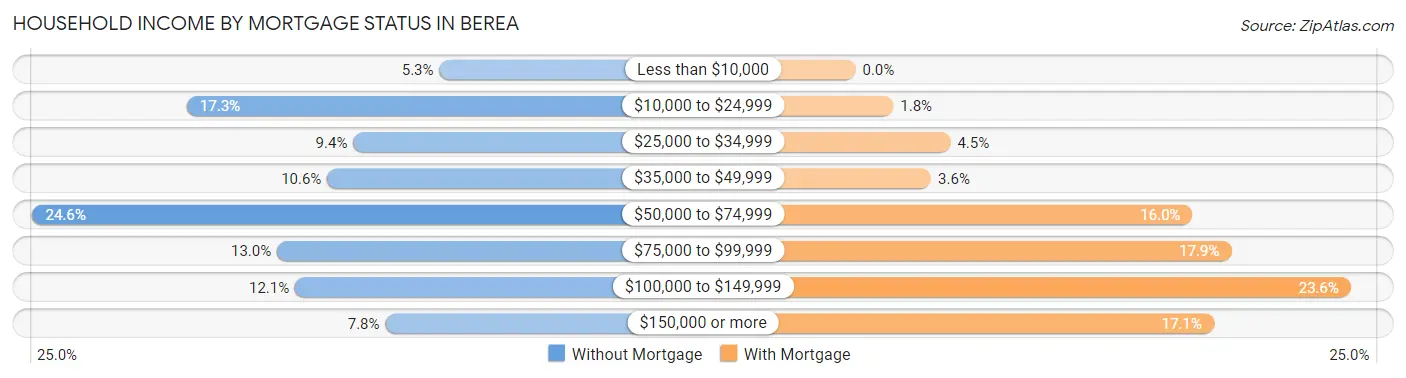
| Household Income | Without Mortgage | With Mortgage |
| Less than $10,000 | 55 (5.2%) | 0 (0.0%) |
| $10,000 to $24,999 | 181 (17.3%) | 37 (1.8%) |
| $25,000 to $34,999 | 98 (9.3%) | 93 (4.5%) |
| $35,000 to $49,999 | 111 (10.6%) | 74 (3.6%) |
| $50,000 to $74,999 | 258 (24.6%) | 330 (16.0%) |
| $75,000 to $99,999 | 136 (13.0%) | 368 (17.9%) |
| $100,000 to $149,999 | 127 (12.1%) | 485 (23.6%) |
| $150,000 or more | 82 (7.8%) | 351 (17.1%) |
| Total | 1,048 (100.0%) | 2,057 (100.0%) |
Property Value to Household Income Ratio in Berea
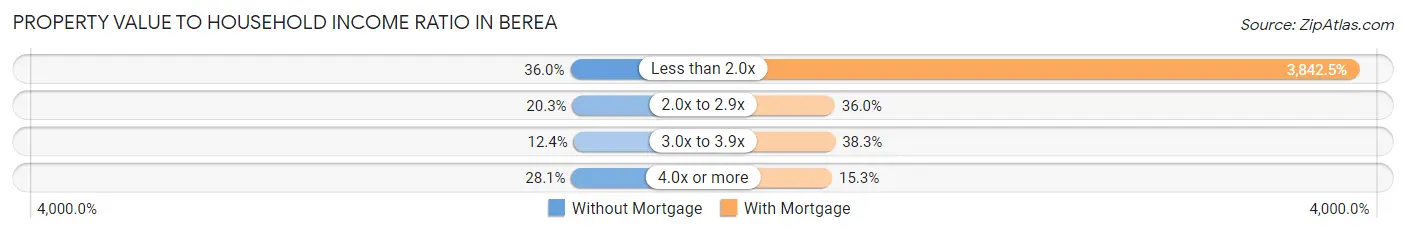
| Value-to-Income Ratio | Without Mortgage | With Mortgage |
| Less than 2.0x | 377 (36.0%) | 79,040 (3,842.5%) |
| 2.0x to 2.9x | 213 (20.3%) | 741 (36.0%) |
| 3.0x to 3.9x | 130 (12.4%) | 788 (38.3%) |
| 4.0x or more | 294 (28.1%) | 314 (15.3%) |
| Total | 1,048 (100.0%) | 2,057 (100.0%) |
Real Estate Taxes by Mortgage Status in Berea
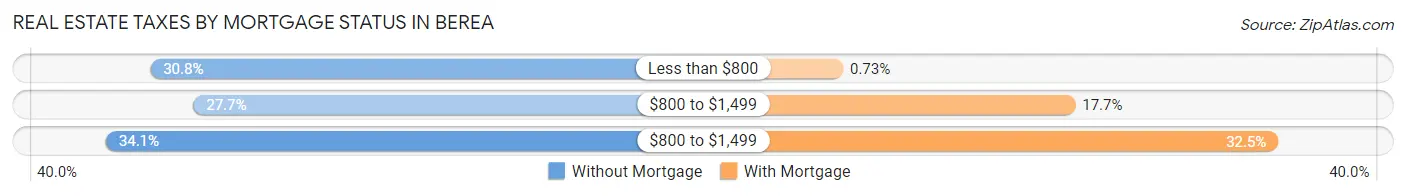
| Property Taxes | Without Mortgage | With Mortgage |
| Less than $800 | 323 (30.8%) | 15 (0.7%) |
| $800 to $1,499 | 290 (27.7%) | 364 (17.7%) |
| $800 to $1,499 | 357 (34.1%) | 669 (32.5%) |
| Total | 1,048 (100.0%) | 2,057 (100.0%) |
Health & Disability in Berea
Health Insurance Coverage by Age in Berea
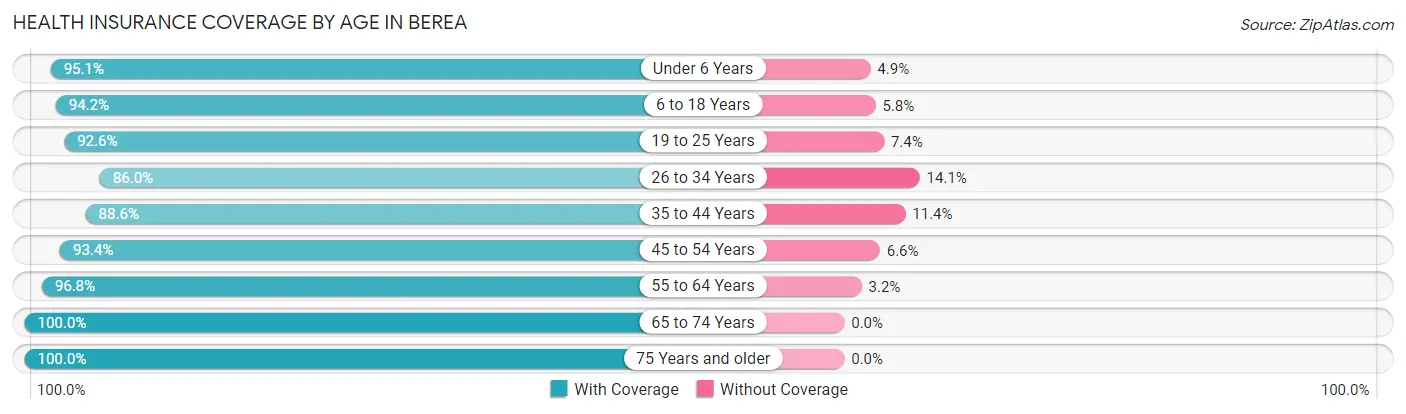
| Age Bracket | With Coverage | Without Coverage |
| Under 6 Years | 1,134 (95.1%) | 58 (4.9%) |
| 6 to 18 Years | 2,444 (94.2%) | 151 (5.8%) |
| 19 to 25 Years | 2,115 (92.6%) | 169 (7.4%) |
| 26 to 34 Years | 1,798 (86.0%) | 294 (14.1%) |
| 35 to 44 Years | 1,502 (88.6%) | 193 (11.4%) |
| 45 to 54 Years | 1,410 (93.4%) | 100 (6.6%) |
| 55 to 64 Years | 1,826 (96.8%) | 61 (3.2%) |
| 65 to 74 Years | 1,226 (100.0%) | 0 (0.0%) |
| 75 Years and older | 736 (100.0%) | 0 (0.0%) |
| Total | 14,191 (93.3%) | 1,026 (6.7%) |
Health Insurance Coverage by Citizenship Status in Berea
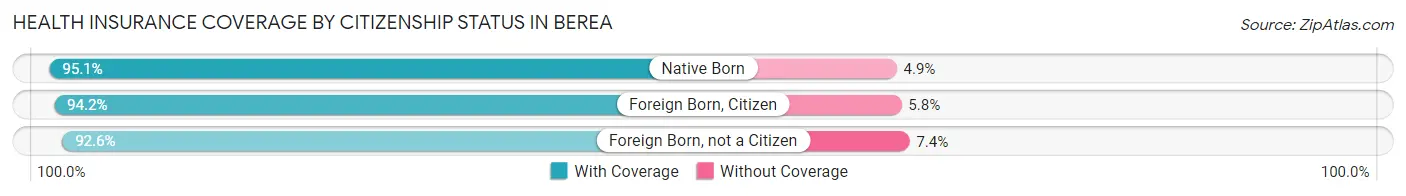
| Citizenship Status | With Coverage | Without Coverage |
| Native Born | 1,134 (95.1%) | 58 (4.9%) |
| Foreign Born, Citizen | 2,444 (94.2%) | 151 (5.8%) |
| Foreign Born, not a Citizen | 2,115 (92.6%) | 169 (7.4%) |
Health Insurance Coverage by Household Income in Berea
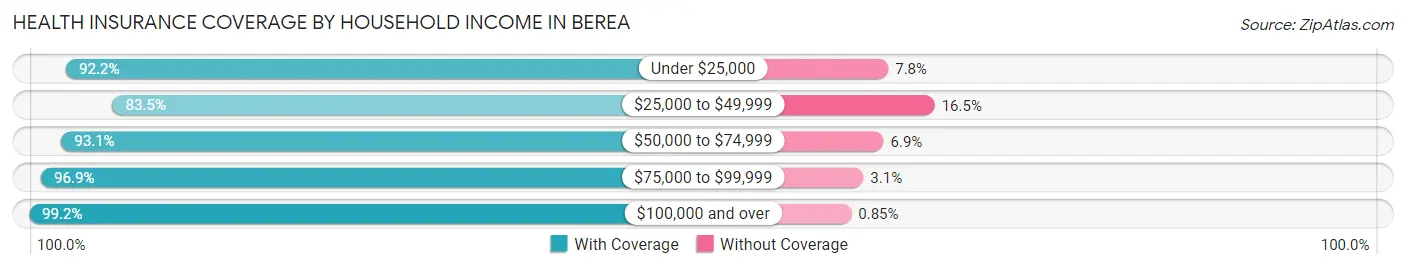
| Household Income | With Coverage | Without Coverage |
| Under $25,000 | 1,947 (92.2%) | 164 (7.8%) |
| $25,000 to $49,999 | 2,479 (83.5%) | 489 (16.5%) |
| $50,000 to $74,999 | 3,173 (93.1%) | 235 (6.9%) |
| $75,000 to $99,999 | 2,152 (96.9%) | 69 (3.1%) |
| $100,000 and over | 3,156 (99.2%) | 27 (0.9%) |
Public vs Private Health Insurance Coverage by Age in Berea
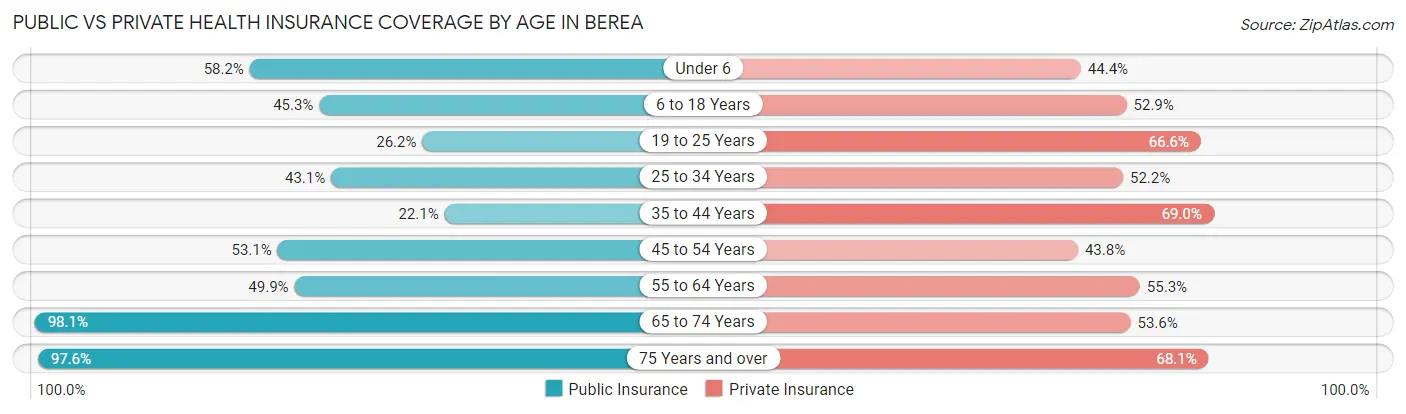
| Age Bracket | Public Insurance | Private Insurance |
| Under 6 | 694 (58.2%) | 529 (44.4%) |
| 6 to 18 Years | 1,176 (45.3%) | 1,372 (52.9%) |
| 19 to 25 Years | 598 (26.2%) | 1,522 (66.6%) |
| 25 to 34 Years | 902 (43.1%) | 1,092 (52.2%) |
| 35 to 44 Years | 374 (22.1%) | 1,170 (69.0%) |
| 45 to 54 Years | 801 (53.0%) | 662 (43.8%) |
| 55 to 64 Years | 942 (49.9%) | 1,044 (55.3%) |
| 65 to 74 Years | 1,203 (98.1%) | 657 (53.6%) |
| 75 Years and over | 718 (97.6%) | 501 (68.1%) |
| Total | 7,408 (48.7%) | 8,549 (56.2%) |
Disability Status by Sex by Age in Berea
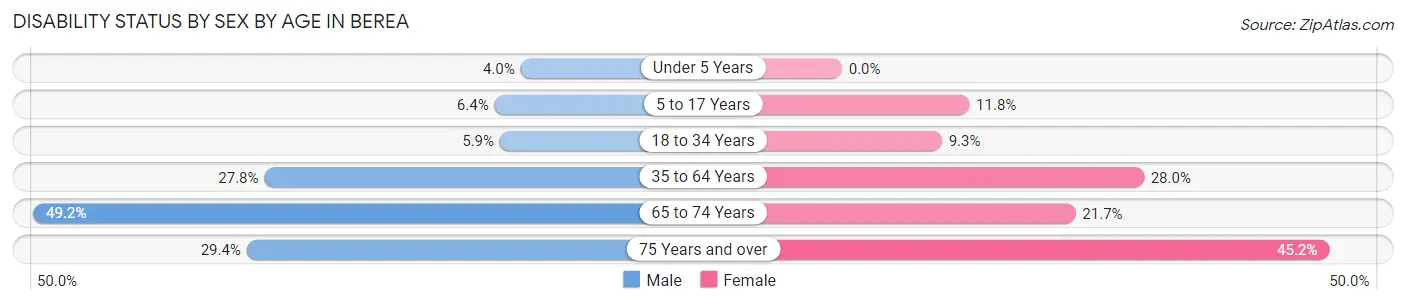
| Age Bracket | Male | Female |
| Under 5 Years | 17 (4.0%) | 0 (0.0%) |
| 5 to 17 Years | 78 (6.4%) | 135 (11.8%) |
| 18 to 34 Years | 130 (5.9%) | 253 (9.3%) |
| 35 to 64 Years | 697 (27.8%) | 723 (28.0%) |
| 65 to 74 Years | 281 (49.2%) | 142 (21.7%) |
| 75 Years and over | 87 (29.4%) | 199 (45.2%) |
Disability Class by Sex by Age in Berea
Disability Class: Hearing Difficulty
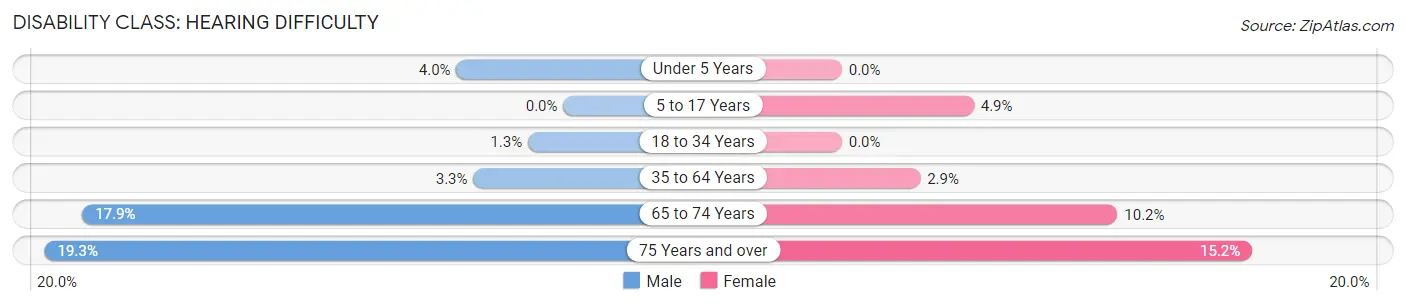
| Age Bracket | Male | Female |
| Under 5 Years | 17 (4.0%) | 0 (0.0%) |
| 5 to 17 Years | 0 (0.0%) | 56 (4.9%) |
| 18 to 34 Years | 29 (1.3%) | 0 (0.0%) |
| 35 to 64 Years | 84 (3.3%) | 75 (2.9%) |
| 65 to 74 Years | 102 (17.9%) | 67 (10.2%) |
| 75 Years and over | 57 (19.3%) | 67 (15.2%) |
Disability Class: Vision Difficulty
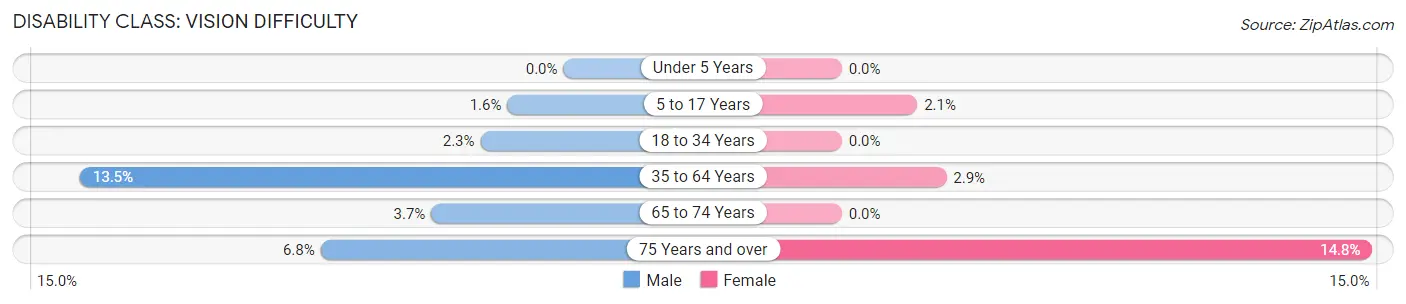
| Age Bracket | Male | Female |
| Under 5 Years | 0 (0.0%) | 0 (0.0%) |
| 5 to 17 Years | 19 (1.6%) | 24 (2.1%) |
| 18 to 34 Years | 51 (2.3%) | 0 (0.0%) |
| 35 to 64 Years | 338 (13.5%) | 75 (2.9%) |
| 65 to 74 Years | 21 (3.7%) | 0 (0.0%) |
| 75 Years and over | 20 (6.8%) | 65 (14.8%) |
Disability Class: Cognitive Difficulty
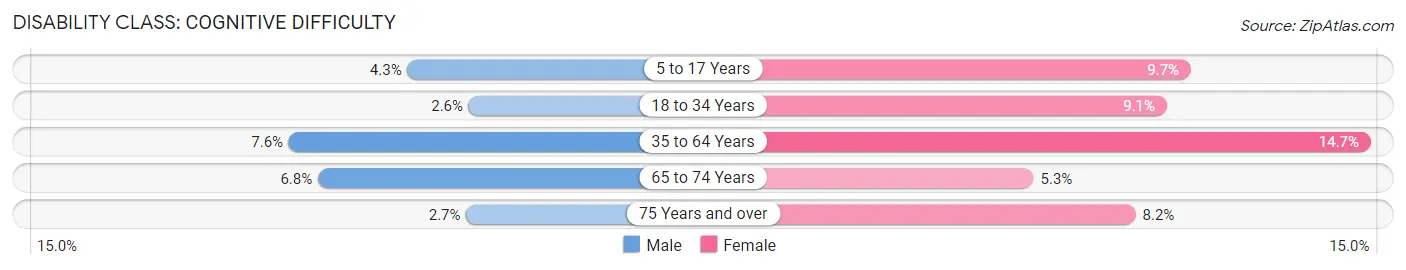
| Age Bracket | Male | Female |
| 5 to 17 Years | 53 (4.3%) | 111 (9.7%) |
| 18 to 34 Years | 58 (2.6%) | 247 (9.0%) |
| 35 to 64 Years | 192 (7.6%) | 380 (14.7%) |
| 65 to 74 Years | 39 (6.8%) | 35 (5.3%) |
| 75 Years and over | 8 (2.7%) | 36 (8.2%) |
Disability Class: Ambulatory Difficulty
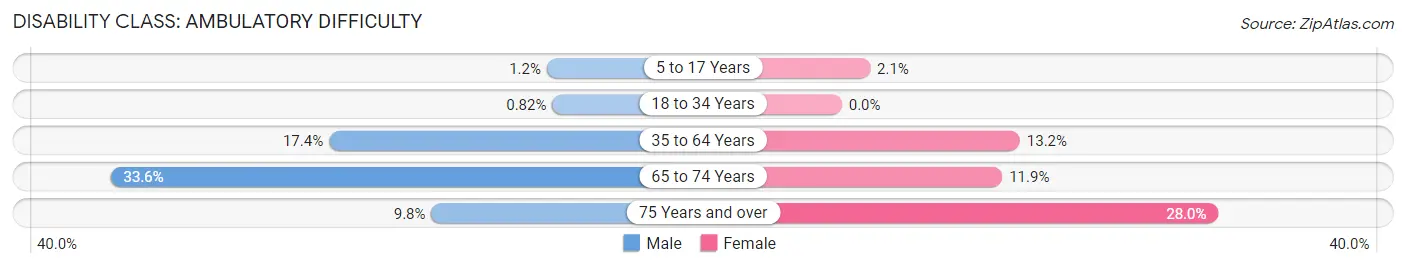
| Age Bracket | Male | Female |
| 5 to 17 Years | 15 (1.2%) | 24 (2.1%) |
| 18 to 34 Years | 18 (0.8%) | 0 (0.0%) |
| 35 to 64 Years | 437 (17.4%) | 341 (13.2%) |
| 65 to 74 Years | 192 (33.6%) | 78 (11.9%) |
| 75 Years and over | 29 (9.8%) | 123 (28.0%) |
Disability Class: Self-Care Difficulty
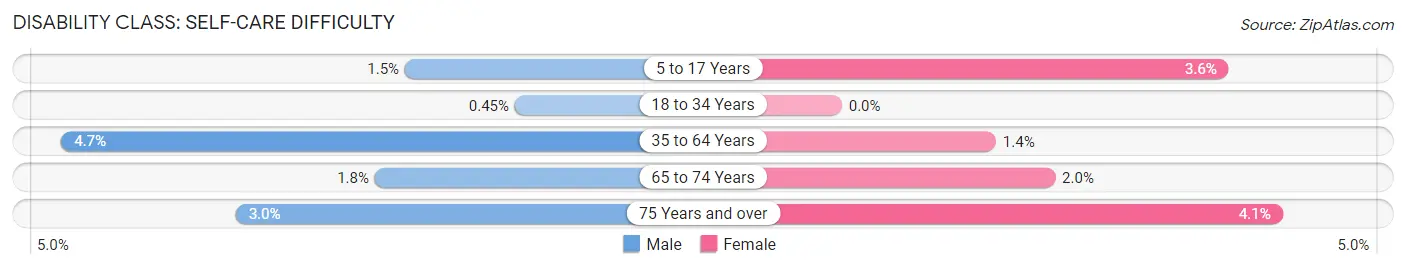
| Age Bracket | Male | Female |
| 5 to 17 Years | 18 (1.5%) | 41 (3.6%) |
| 18 to 34 Years | 10 (0.4%) | 0 (0.0%) |
| 35 to 64 Years | 117 (4.7%) | 37 (1.4%) |
| 65 to 74 Years | 10 (1.8%) | 13 (2.0%) |
| 75 Years and over | 9 (3.0%) | 18 (4.1%) |
Technology Access in Berea
Computing Device Access in Berea
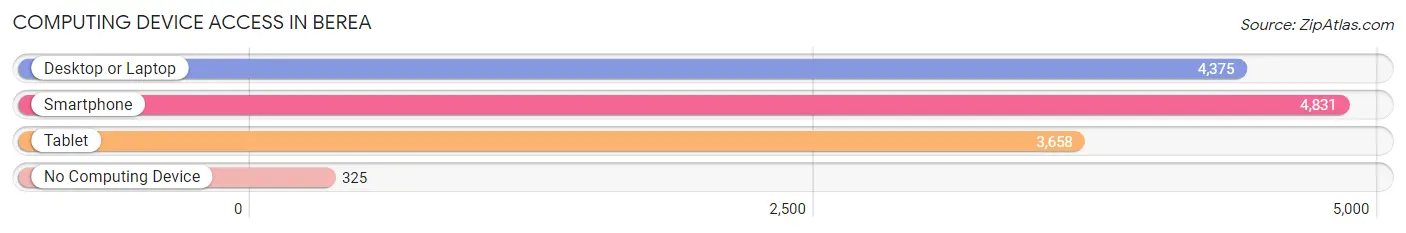
| Device Type | # Households | % Households |
| Desktop or Laptop | 4,375 | 78.5% |
| Smartphone | 4,831 | 86.7% |
| Tablet | 3,658 | 65.6% |
| No Computing Device | 325 | 5.8% |
| Total | 5,573 | 100.0% |
Internet Access in Berea
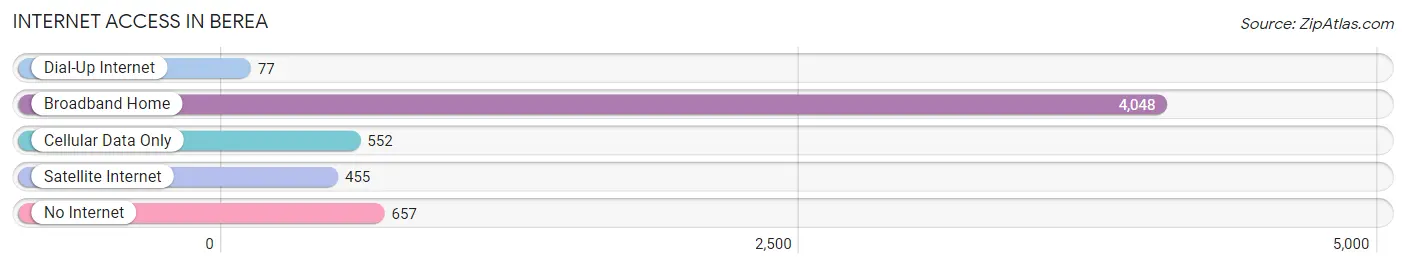
| Internet Type | # Households | % Households |
| Dial-Up Internet | 77 | 1.4% |
| Broadband Home | 4,048 | 72.6% |
| Cellular Data Only | 552 | 9.9% |
| Satellite Internet | 455 | 8.2% |
| No Internet | 657 | 11.8% |
| Total | 5,573 | 100.0% |
Berea Summary
Berea, Kentucky is a small city located in Madison County, Kentucky. It is situated in the foothills of the Appalachian Mountains and is part of the Bluegrass region of the state. The city has a population of approximately 14,000 people and is the home of Berea College, a private liberal arts college.
History
Berea was founded in 1853 by a group of abolitionists from the nearby town of Madison. The town was named after the biblical city of Berea, which was known for its commitment to education and religious freedom. The founders of Berea wanted to create a community that was free from slavery and open to all races and religions.
In 1855, the Berea College was founded by the town's founders. The college was the first interracial and coeducational college in the South. The college was also the first to offer free tuition to all students, regardless of race or gender.
In the late 19th century, Berea became a center of industry and manufacturing. The town was home to several factories, including a woolen mill, a tobacco factory, and a furniture factory. The town also had a thriving agricultural industry, with many farms in the surrounding area.
Geography
Berea is located in the foothills of the Appalachian Mountains in Madison County, Kentucky. The city is situated at an elevation of 890 feet above sea level. The city is located approximately 30 miles south of Lexington and is part of the Bluegrass region of the state.
The city is surrounded by rolling hills and is home to several creeks and streams. The city is also home to several parks, including Berea College Woods, which is a popular spot for hiking and camping.
Economy
Berea's economy is largely based on education and manufacturing. The city is home to Berea College, which is a major employer in the area. The college also provides a large number of jobs in the service industry.
The city is also home to several manufacturing companies, including a furniture factory, a tobacco factory, and a woolen mill. The city also has a thriving agricultural industry, with many farms in the surrounding area.
Demographics
As of the 2010 census, the population of Berea was 14,099. The racial makeup of the city was 90.3% White, 5.2% African American, 0.3% Native American, 0.7% Asian, 0.1% Pacific Islander, and 2.4% from other races. Hispanic or Latino of any race were 2.7% of the population.
The median household income in Berea was $31,919, and the median family income was $41,919. The per capita income for the city was $17,845. About 16.2% of families and 20.2% of the population were below the poverty line, including 28.2% of those under age 18 and 11.2% of those age 65 or over.
Conclusion
Berea, Kentucky is a small city located in Madison County, Kentucky. It is situated in the foothills of the Appalachian Mountains and is part of the Bluegrass region of the state. The city has a population of approximately 14,000 people and is the home of Berea College, a private liberal arts college. The city's economy is largely based on education and manufacturing, and the city is home to several parks and creeks. The racial makeup of the city is 90.3% White, 5.2% African American, 0.3% Native American, 0.7% Asian, 0.1% Pacific Islander, and 2.4% from other races. The median household income in Berea was $31,919, and the median family income was $41,919.
Common Questions
What is Per Capita Income in Berea?
Per Capita income in Berea is $25,747.
What is the Median Family Income in Berea?
Median Family Income in Berea is $61,591.
What is the Median Household income in Berea?
Median Household Income in Berea is $54,481.
What is Income or Wage Gap in Berea?
Income or Wage Gap in Berea is 32.3%.
Women in Berea earn 67.7 cents for every dollar earned by a man.
What is Family Income Deficit in Berea?
Family Income Deficit in Berea is $12,686.
Families that are below poverty line in Berea earn $12,686 less on average than the poverty threshold level.
What is Inequality or Gini Index in Berea?
Inequality or Gini Index in Berea is 0.45.
What is the Total Population of Berea?
Total Population of Berea is 15,404.
What is the Total Male Population of Berea?
Total Male Population of Berea is 7,271.
What is the Total Female Population of Berea?
Total Female Population of Berea is 8,133.
What is the Ratio of Males per 100 Females in Berea?
There are 89.40 Males per 100 Females in Berea.
What is the Ratio of Females per 100 Males in Berea?
There are 111.86 Females per 100 Males in Berea.
What is the Median Population Age in Berea?
Median Population Age in Berea is 32.4 Years.
What is the Average Family Size in Berea
Average Family Size in Berea is 2.8 People.
What is the Average Household Size in Berea
Average Household Size in Berea is 2.5 People.
How Large is the Labor Force in Berea?
There are 7,085 People in the Labor Forcein in Berea.
What is the Percentage of People in the Labor Force in Berea?
56.8% of People are in the Labor Force in Berea.
What is the Unemployment Rate in Berea?
Unemployment Rate in Berea is 2.4%.