Bellevue, KY Map & Demographics
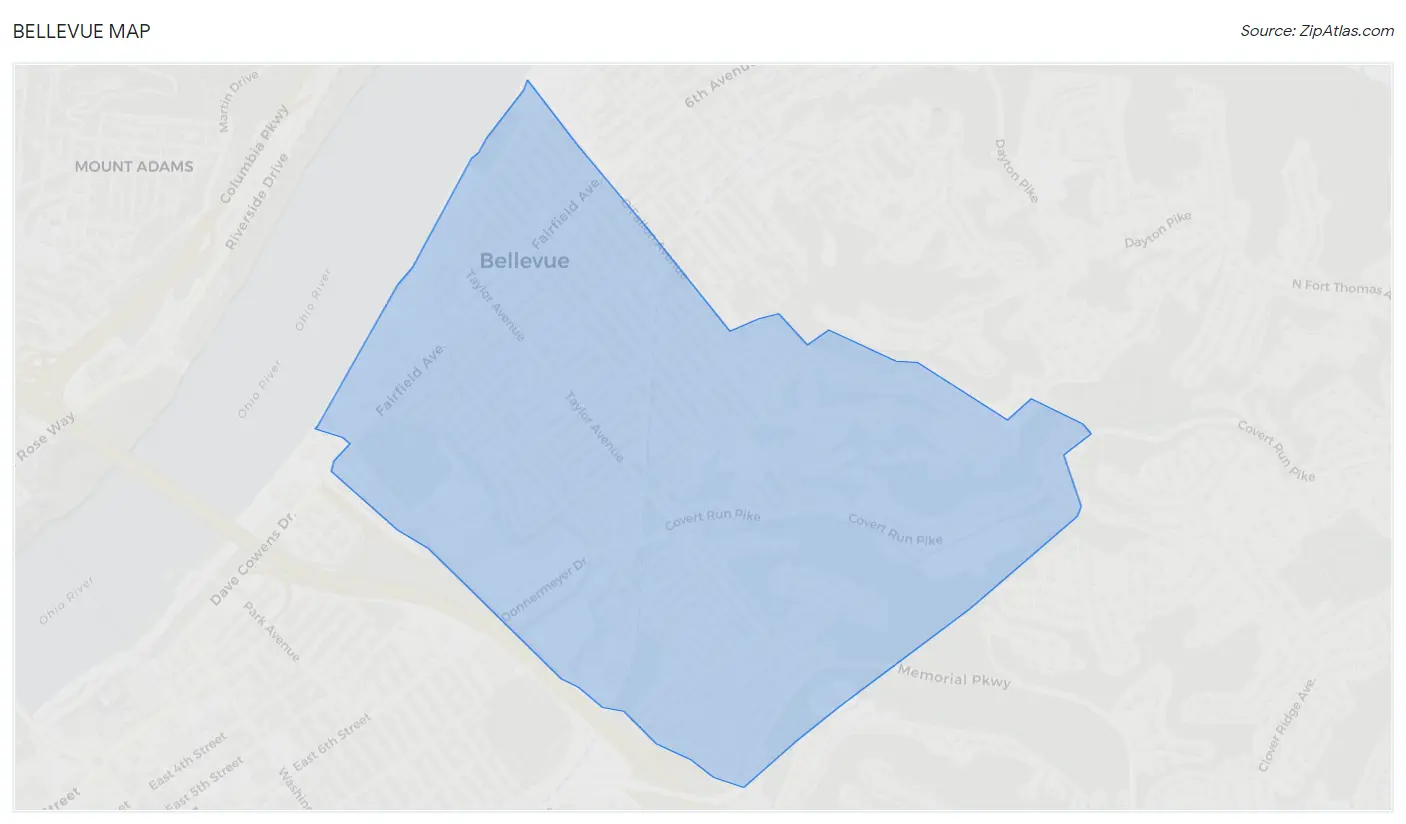
Bellevue Map
Bellevue Overview
$42,898
PER CAPITA INCOME
$90,292
AVG FAMILY INCOME
$66,741
AVG HOUSEHOLD INCOME
10.9%
WAGE / INCOME GAP [ % ]
89.1¢/ $1
WAGE / INCOME GAP [ $ ]
0.46
INEQUALITY / GINI INDEX
5,596
TOTAL POPULATION
2,848
MALE POPULATION
2,748
FEMALE POPULATION
103.64
MALES / 100 FEMALES
96.49
FEMALES / 100 MALES
36.6
MEDIAN AGE
2.8
AVG FAMILY SIZE
2.1
AVG HOUSEHOLD SIZE
3,272
LABOR FORCE [ PEOPLE ]
69.6%
PERCENT IN LABOR FORCE
1.5%
UNEMPLOYMENT RATE
Bellevue Zip Codes
Bellevue Area Codes
Income in Bellevue
Income Overview in Bellevue
Per Capita Income in Bellevue is $42,898, while median incomes of families and households are $90,292 and $66,741 respectively.
| Characteristic | Number | Measure |
| Per Capita Income | 5,596 | $42,898 |
| Median Family Income | 1,259 | $90,292 |
| Mean Family Income | 1,259 | $106,640 |
| Median Household Income | 2,716 | $66,741 |
| Mean Household Income | 2,716 | $87,467 |
| Income Deficit | 1,259 | $0 |
| Wage / Income Gap (%) | 5,596 | 10.92% |
| Wage / Income Gap ($) | 5,596 | 89.08¢ per $1 |
| Gini / Inequality Index | 5,596 | 0.46 |
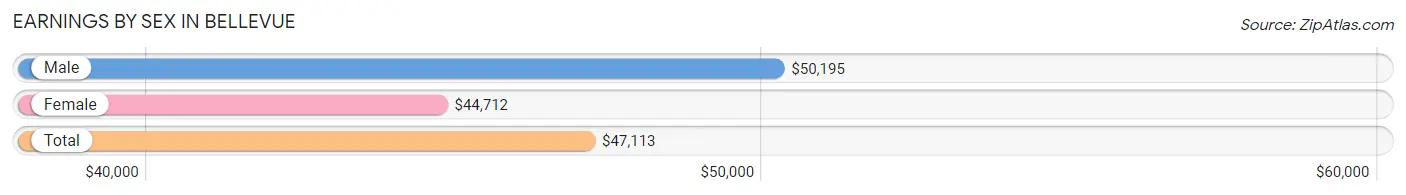
Earnings by Sex in Bellevue
Average Earnings in Bellevue are $47,113, $50,195 for men and $44,712 for women, a difference of 10.9%.
| Sex | Number | Average Earnings |
| Male | 1,766 (53.2%) | $50,195 |
| Female | 1,553 (46.8%) | $44,712 |
| Total | 3,319 (100.0%) | $47,113 |
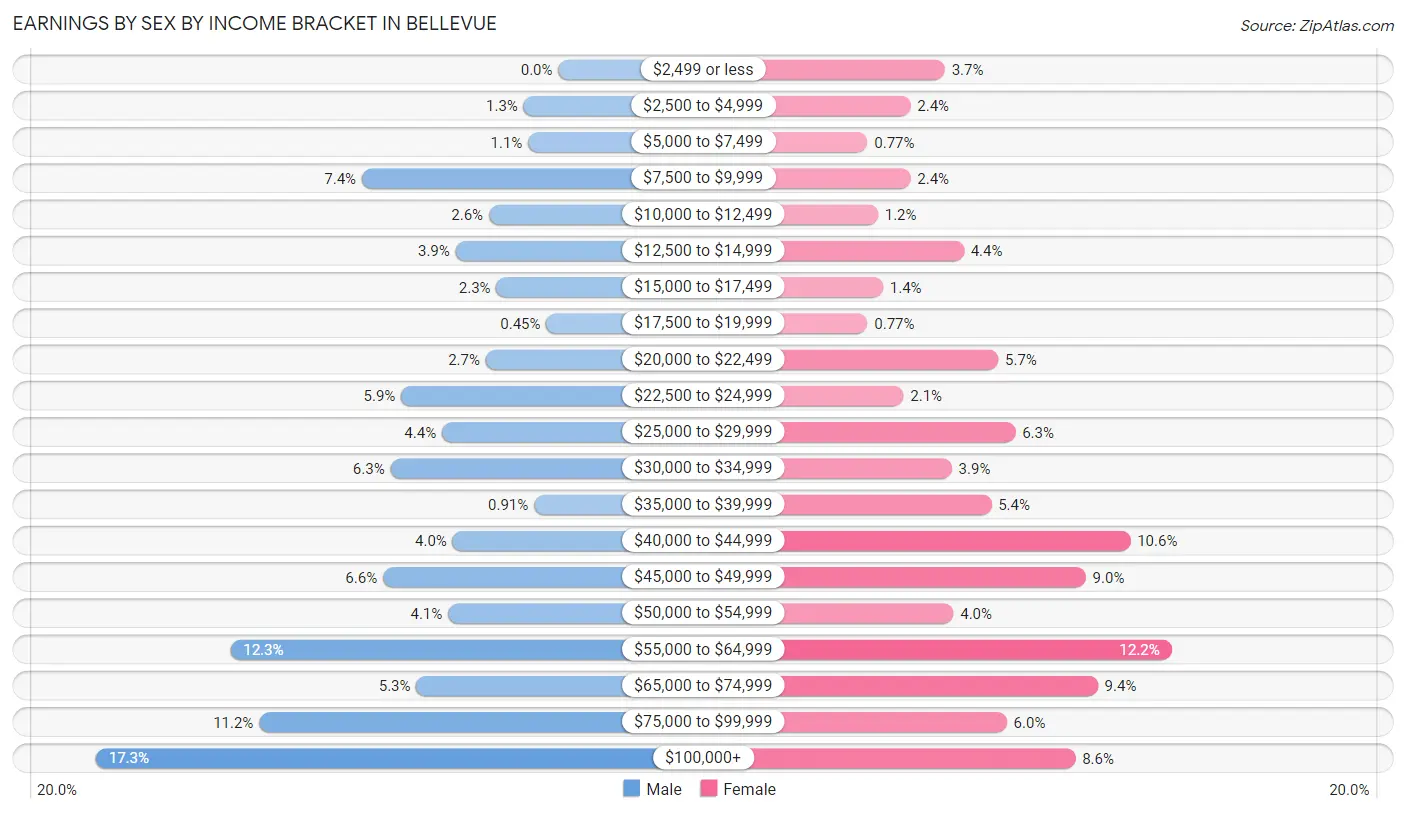
Earnings by Sex by Income Bracket in Bellevue
The most common earnings brackets in Bellevue are $100,000+ for men (306 | 17.3%) and $55,000 to $64,999 for women (189 | 12.2%).
| Income | Male | Female |
| $2,499 or less | 0 (0.0%) | 57 (3.7%) |
| $2,500 to $4,999 | 23 (1.3%) | 37 (2.4%) |
| $5,000 to $7,499 | 20 (1.1%) | 12 (0.8%) |
| $7,500 to $9,999 | 130 (7.4%) | 37 (2.4%) |
| $10,000 to $12,499 | 46 (2.6%) | 18 (1.2%) |
| $12,500 to $14,999 | 68 (3.8%) | 68 (4.4%) |
| $15,000 to $17,499 | 41 (2.3%) | 21 (1.3%) |
| $17,500 to $19,999 | 8 (0.4%) | 12 (0.8%) |
| $20,000 to $22,499 | 48 (2.7%) | 88 (5.7%) |
| $22,500 to $24,999 | 104 (5.9%) | 33 (2.1%) |
| $25,000 to $29,999 | 77 (4.4%) | 98 (6.3%) |
| $30,000 to $34,999 | 111 (6.3%) | 61 (3.9%) |
| $35,000 to $39,999 | 16 (0.9%) | 84 (5.4%) |
| $40,000 to $44,999 | 70 (4.0%) | 165 (10.6%) |
| $45,000 to $49,999 | 116 (6.6%) | 139 (8.9%) |
| $50,000 to $54,999 | 73 (4.1%) | 62 (4.0%) |
| $55,000 to $64,999 | 217 (12.3%) | 189 (12.2%) |
| $65,000 to $74,999 | 94 (5.3%) | 146 (9.4%) |
| $75,000 to $99,999 | 198 (11.2%) | 93 (6.0%) |
| $100,000+ | 306 (17.3%) | 133 (8.6%) |
| Total | 1,766 (100.0%) | 1,553 (100.0%) |
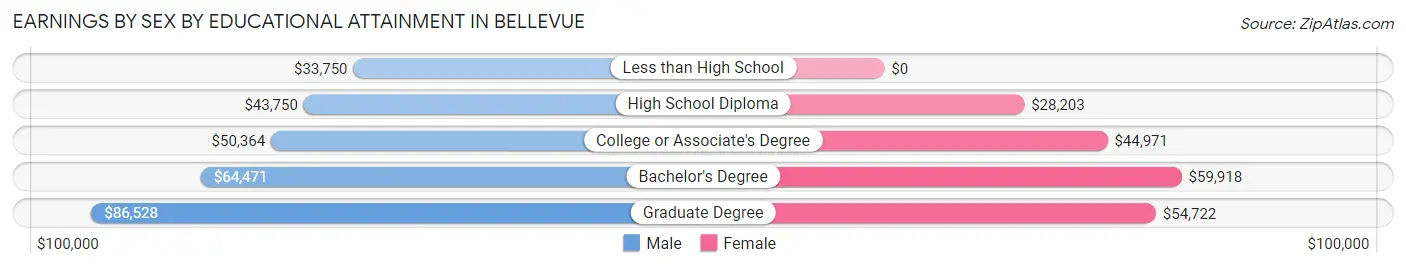
Earnings by Sex by Educational Attainment in Bellevue
Average earnings in Bellevue are $56,400 for men and $46,570 for women, a difference of 17.4%. Men with an educational attainment of graduate degree enjoy the highest average annual earnings of $86,528, while those with less than high school education earn the least with $33,750. Women with an educational attainment of bachelor's degree earn the most with the average annual earnings of $59,918, while those with high school diploma education have the smallest earnings of $28,203.
| Educational Attainment | Male Income | Female Income |
| Less than High School | $33,750 | $0 |
| High School Diploma | $43,750 | $28,203 |
| College or Associate's Degree | $50,364 | $44,971 |
| Bachelor's Degree | $64,471 | $59,918 |
| Graduate Degree | $86,528 | $54,722 |
| Total | $56,400 | $46,570 |
Family Income in Bellevue
Family Income Brackets in Bellevue
According to the Bellevue family income data, there are 371 families falling into the $100,000 to $149,999 income range, which is the most common income bracket and makes up 29.5% of all families. Conversely, the less than $10,000 income bracket is the least frequent group with only 37 families (2.9%) belonging to this category.
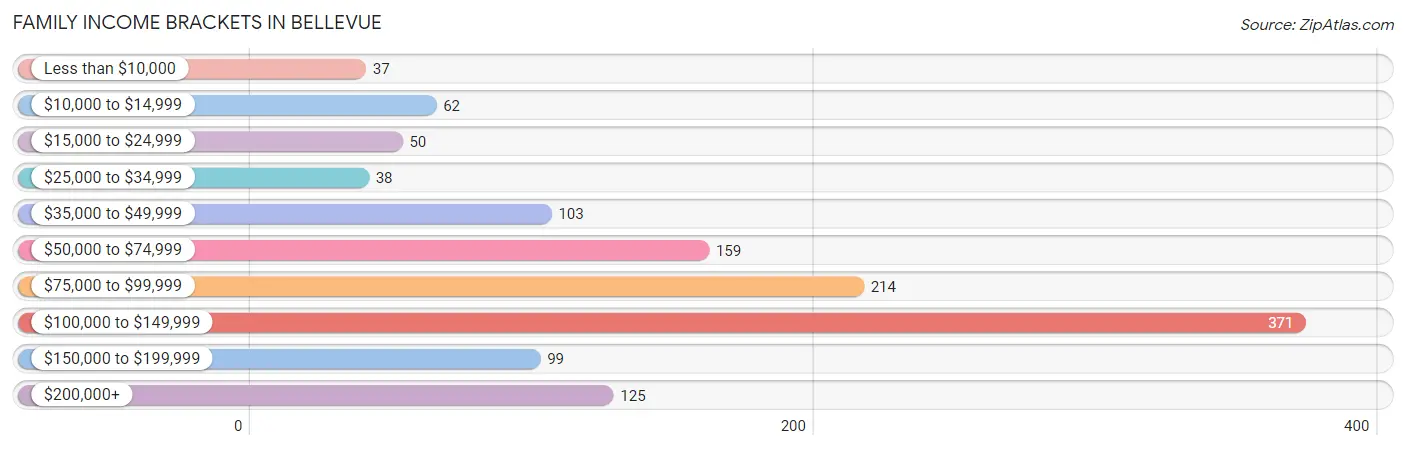
| Income Bracket | # Families | % Families |
| Less than $10,000 | 37 | 2.9% |
| $10,000 to $14,999 | 62 | 4.9% |
| $15,000 to $24,999 | 50 | 4.0% |
| $25,000 to $34,999 | 38 | 3.0% |
| $35,000 to $49,999 | 103 | 8.2% |
| $50,000 to $74,999 | 159 | 12.6% |
| $75,000 to $99,999 | 214 | 17.0% |
| $100,000 to $149,999 | 371 | 29.5% |
| $150,000 to $199,999 | 99 | 7.9% |
| $200,000+ | 125 | 9.9% |
Family Income by Famaliy Size in Bellevue
4-person families (321 | 25.5%) account for the highest median family income in Bellevue with $105,072 per family, while 2-person families (672 | 53.4%) have the highest median income of $50,169 per family member.
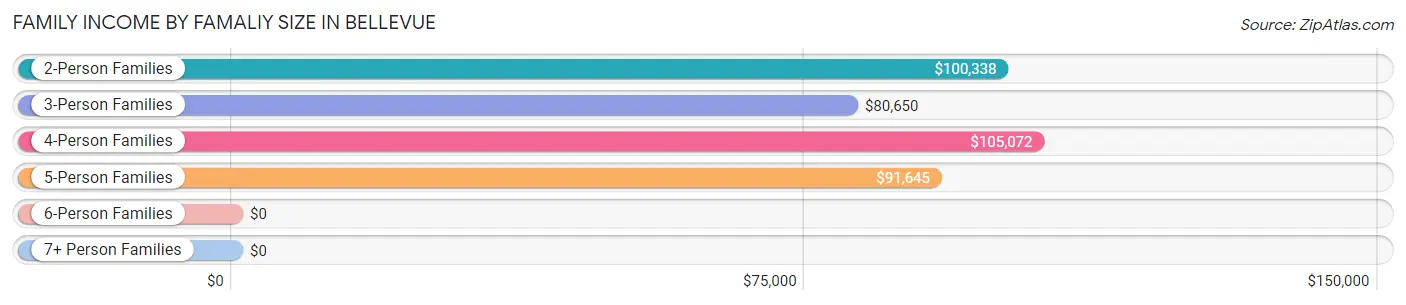
| Income Bracket | # Families | Median Income |
| 2-Person Families | 672 (53.4%) | $100,338 |
| 3-Person Families | 187 (14.8%) | $80,650 |
| 4-Person Families | 321 (25.5%) | $105,072 |
| 5-Person Families | 65 (5.2%) | $91,645 |
| 6-Person Families | 14 (1.1%) | $0 |
| 7+ Person Families | 0 (0.0%) | $0 |
| Total | 1,259 (100.0%) | $90,292 |
Family Income by Number of Earners in Bellevue
The median family income in Bellevue is $90,292, with families comprising 3+ earners (57) having the highest median family income of $165,139, while families with 1 earner (383) have the lowest median family income of $46,484, accounting for 4.5% and 30.4% of families, respectively.
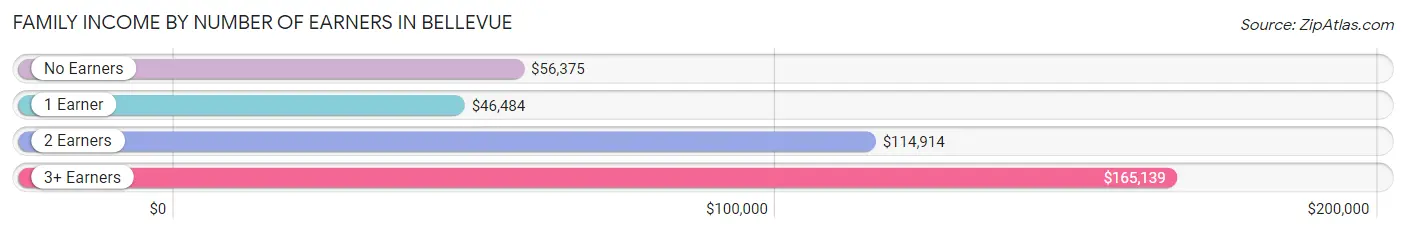
| Number of Earners | # Families | Median Income |
| No Earners | 147 (11.7%) | $56,375 |
| 1 Earner | 383 (30.4%) | $46,484 |
| 2 Earners | 672 (53.4%) | $114,914 |
| 3+ Earners | 57 (4.5%) | $165,139 |
| Total | 1,259 (100.0%) | $90,292 |
Household Income in Bellevue
Household Income Brackets in Bellevue
With 559 households falling in the category, the $50,000 to $74,999 income range is the most frequent in Bellevue, accounting for 20.6% of all households. In contrast, only 92 households (3.4%) fall into the $10,000 to $14,999 income bracket, making it the least populous group.
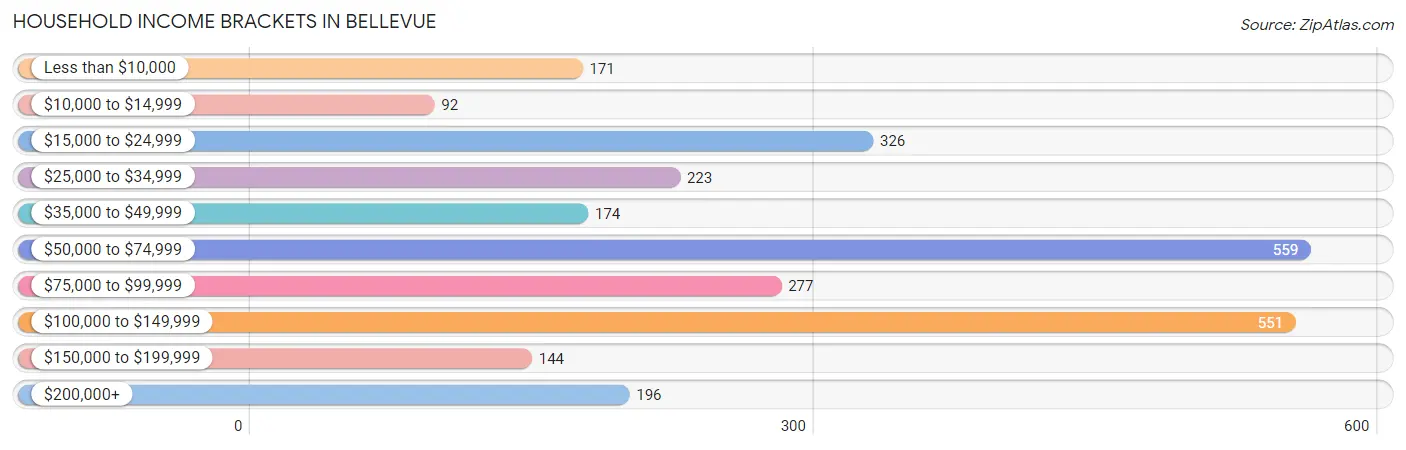
| Income Bracket | # Households | % Households |
| Less than $10,000 | 171 | 6.3% |
| $10,000 to $14,999 | 92 | 3.4% |
| $15,000 to $24,999 | 326 | 12.0% |
| $25,000 to $34,999 | 223 | 8.2% |
| $35,000 to $49,999 | 174 | 6.4% |
| $50,000 to $74,999 | 559 | 20.6% |
| $75,000 to $99,999 | 277 | 10.2% |
| $100,000 to $149,999 | 551 | 20.3% |
| $150,000 to $199,999 | 144 | 5.3% |
| $200,000+ | 196 | 7.2% |
Household Income by Householder Age in Bellevue
The median household income in Bellevue is $66,741, with the highest median household income of $88,850 found in the 25 to 44 years age bracket for the primary householder. A total of 1,119 households (41.2%) fall into this category. Meanwhile, the 15 to 24 years age bracket for the primary householder has the lowest median household income of $20,978, with 134 households (4.9%) in this group.
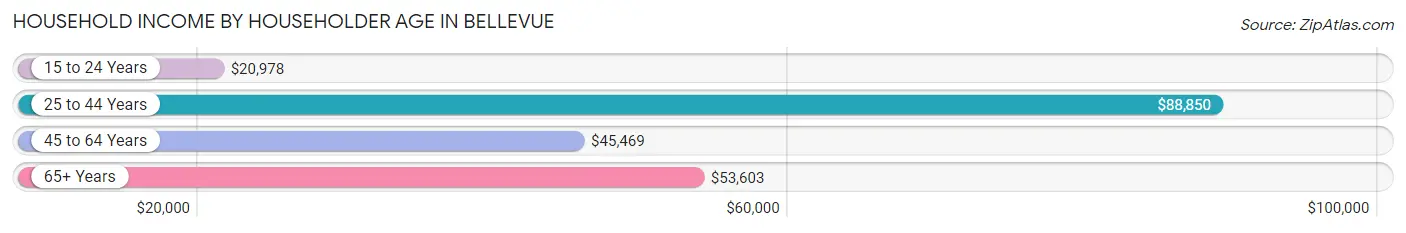
| Income Bracket | # Households | Median Income |
| 15 to 24 Years | 134 (4.9%) | $20,978 |
| 25 to 44 Years | 1,119 (41.2%) | $88,850 |
| 45 to 64 Years | 940 (34.6%) | $45,469 |
| 65+ Years | 523 (19.3%) | $53,603 |
| Total | 2,716 (100.0%) | $66,741 |
Poverty in Bellevue
Income Below Poverty by Sex and Age in Bellevue
With 17.7% poverty level for males and 13.0% for females among the residents of Bellevue, 16 and 17 year old males and 12 to 14 year old females are the most vulnerable to poverty, with 25 males (53.2%) and 63 females (52.5%) in their respective age groups living below the poverty level.
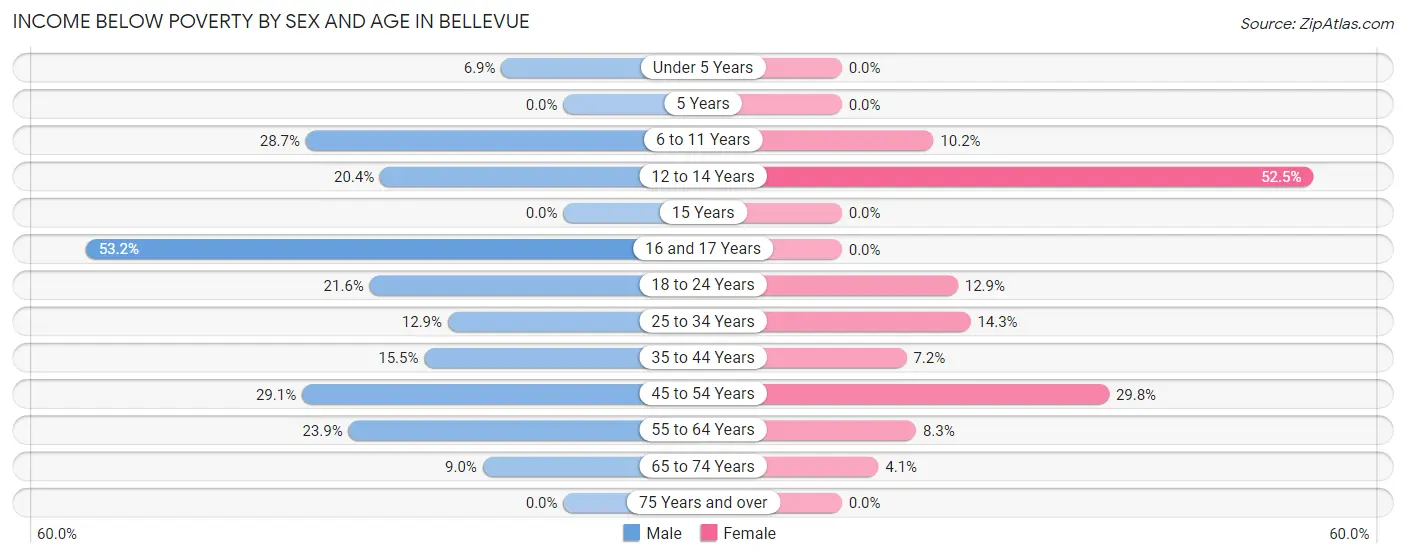
| Age Bracket | Male | Female |
| Under 5 Years | 12 (6.9%) | 0 (0.0%) |
| 5 Years | 0 (0.0%) | 0 (0.0%) |
| 6 to 11 Years | 39 (28.7%) | 10 (10.2%) |
| 12 to 14 Years | 10 (20.4%) | 63 (52.5%) |
| 15 Years | 0 (0.0%) | 0 (0.0%) |
| 16 and 17 Years | 25 (53.2%) | 0 (0.0%) |
| 18 to 24 Years | 44 (21.6%) | 23 (12.9%) |
| 25 to 34 Years | 76 (12.9%) | 98 (14.3%) |
| 35 to 44 Years | 70 (15.5%) | 26 (7.2%) |
| 45 to 54 Years | 92 (29.1%) | 97 (29.7%) |
| 55 to 64 Years | 101 (23.9%) | 27 (8.3%) |
| 65 to 74 Years | 22 (9.0%) | 10 (4.1%) |
| 75 Years and over | 0 (0.0%) | 0 (0.0%) |
| Total | 491 (17.7%) | 354 (13.0%) |
Income Above Poverty by Sex and Age in Bellevue
According to the poverty statistics in Bellevue, males aged 5 years and females aged under 5 years are the age groups that are most secure financially, with 100.0% of males and 100.0% of females in these age groups living above the poverty line.
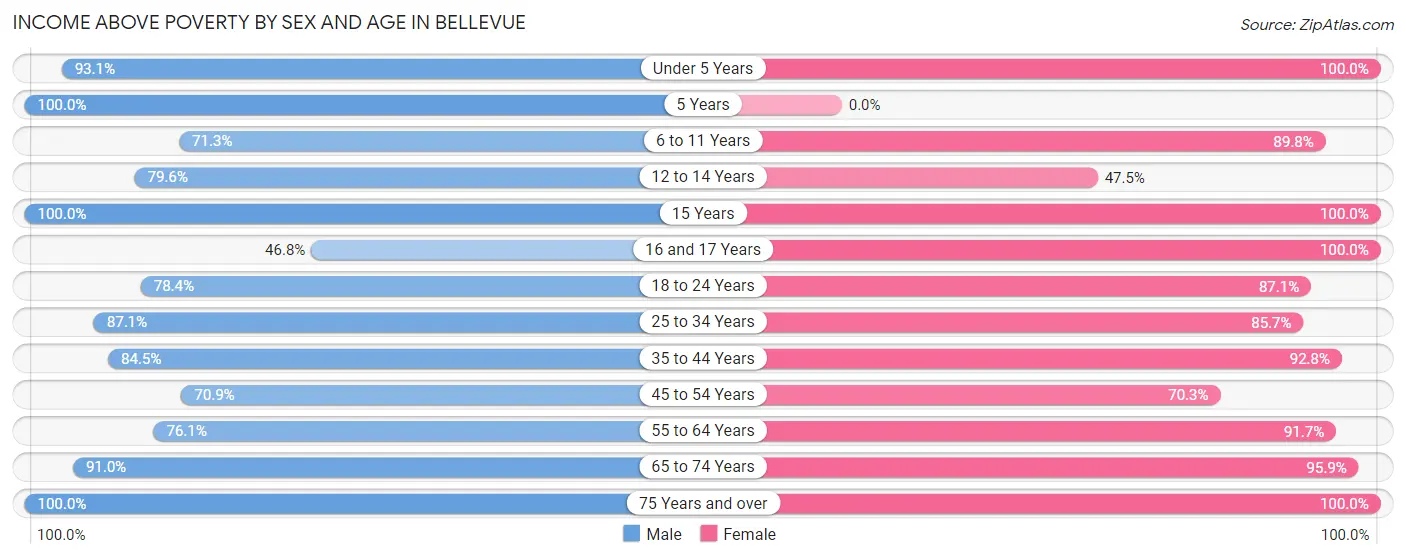
| Age Bracket | Male | Female |
| Under 5 Years | 162 (93.1%) | 165 (100.0%) |
| 5 Years | 40 (100.0%) | 0 (0.0%) |
| 6 to 11 Years | 97 (71.3%) | 88 (89.8%) |
| 12 to 14 Years | 39 (79.6%) | 57 (47.5%) |
| 15 Years | 8 (100.0%) | 12 (100.0%) |
| 16 and 17 Years | 22 (46.8%) | 25 (100.0%) |
| 18 to 24 Years | 160 (78.4%) | 155 (87.1%) |
| 25 to 34 Years | 515 (87.1%) | 586 (85.7%) |
| 35 to 44 Years | 382 (84.5%) | 335 (92.8%) |
| 45 to 54 Years | 224 (70.9%) | 229 (70.3%) |
| 55 to 64 Years | 321 (76.1%) | 300 (91.7%) |
| 65 to 74 Years | 223 (91.0%) | 236 (95.9%) |
| 75 Years and over | 93 (100.0%) | 184 (100.0%) |
| Total | 2,286 (82.3%) | 2,372 (87.0%) |
Income Below Poverty Among Married-Couple Families in Bellevue
The poverty statistics for married-couple families in Bellevue show that 8.8% or 85 of the total 969 families live below the poverty line. Families with 1 or 2 children have the highest poverty rate of 13.6%, comprising of 53 families. On the other hand, families with 3 or 4 children have the lowest poverty rate of 0.0%, which includes 0 families.
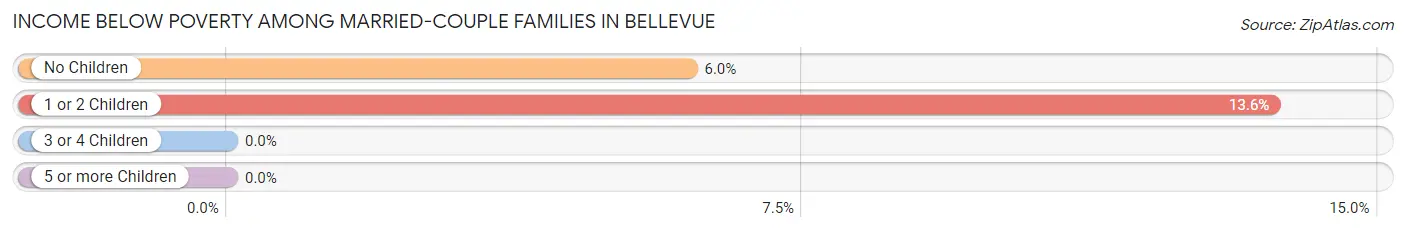
| Children | Above Poverty | Below Poverty |
| No Children | 501 (94.0%) | 32 (6.0%) |
| 1 or 2 Children | 336 (86.4%) | 53 (13.6%) |
| 3 or 4 Children | 47 (100.0%) | 0 (0.0%) |
| 5 or more Children | 0 (0.0%) | 0 (0.0%) |
| Total | 884 (91.2%) | 85 (8.8%) |
Income Below Poverty Among Single-Parent Households in Bellevue
According to the poverty data in Bellevue, 35.6% or 41 single-father households and 18.3% or 32 single-mother households are living below the poverty line. Among single-father households, those with 1 or 2 children have the highest poverty rate, with 41 households (67.2%) experiencing poverty. Likewise, among single-mother households, those with 1 or 2 children have the highest poverty rate, with 32 households (33.3%) falling below the poverty line.
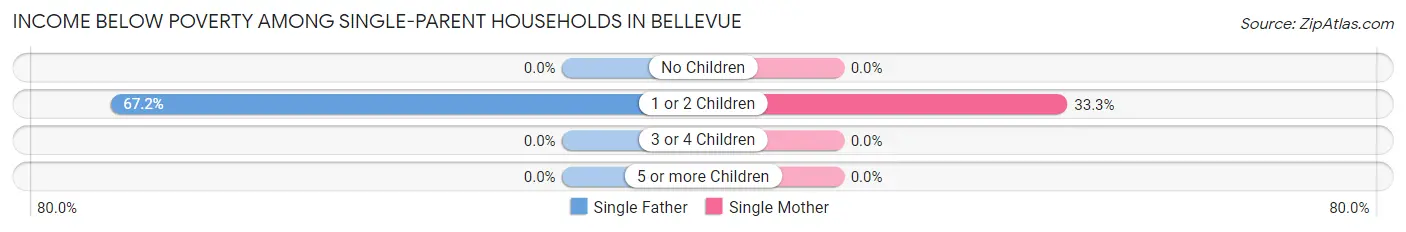
| Children | Single Father | Single Mother |
| No Children | 0 (0.0%) | 0 (0.0%) |
| 1 or 2 Children | 41 (67.2%) | 32 (33.3%) |
| 3 or 4 Children | 0 (0.0%) | 0 (0.0%) |
| 5 or more Children | 0 (0.0%) | 0 (0.0%) |
| Total | 41 (35.6%) | 32 (18.3%) |
Income Below Poverty Among Married-Couple vs Single-Parent Households in Bellevue
The poverty data for Bellevue shows that 85 of the married-couple family households (8.8%) and 73 of the single-parent households (25.2%) are living below the poverty level. Within the married-couple family households, those with 1 or 2 children have the highest poverty rate, with 53 households (13.6%) falling below the poverty line. Among the single-parent households, those with 1 or 2 children have the highest poverty rate, with 73 household (46.5%) living below poverty.
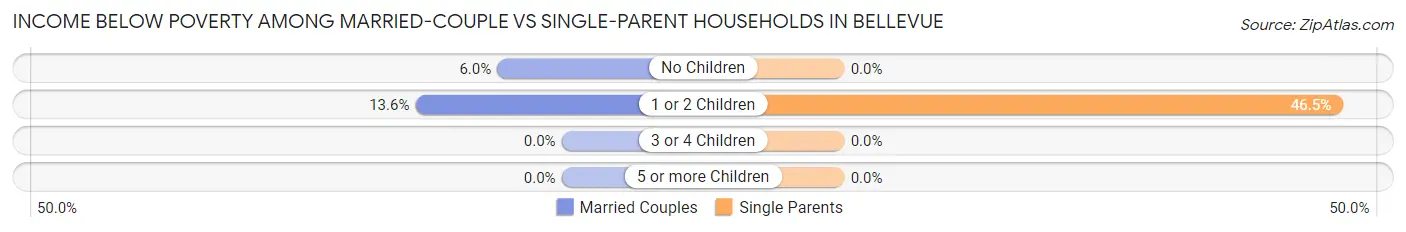
| Children | Married-Couple Families | Single-Parent Households |
| No Children | 32 (6.0%) | 0 (0.0%) |
| 1 or 2 Children | 53 (13.6%) | 73 (46.5%) |
| 3 or 4 Children | 0 (0.0%) | 0 (0.0%) |
| 5 or more Children | 0 (0.0%) | 0 (0.0%) |
| Total | 85 (8.8%) | 73 (25.2%) |
Race in Bellevue
The most populous races in Bellevue are White / Caucasian (5,259 | 94.0%), Hispanic or Latino (250 | 4.5%), and Two or more Races (183 | 3.3%).
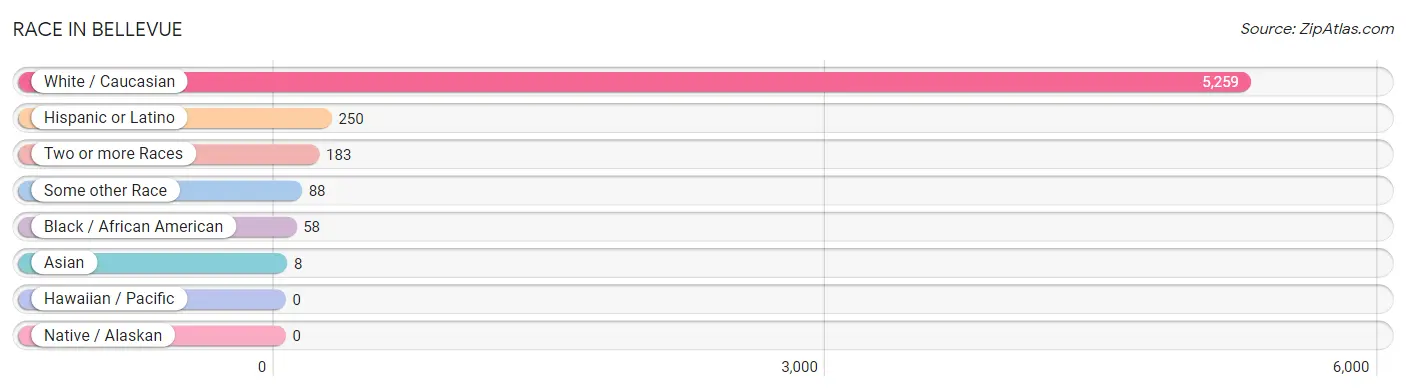
| Race | # Population | % Population |
| Asian | 8 | 0.1% |
| Black / African American | 58 | 1.0% |
| Hawaiian / Pacific | 0 | 0.0% |
| Hispanic or Latino | 250 | 4.5% |
| Native / Alaskan | 0 | 0.0% |
| White / Caucasian | 5,259 | 94.0% |
| Two or more Races | 183 | 3.3% |
| Some other Race | 88 | 1.6% |
| Total | 5,596 | 100.0% |
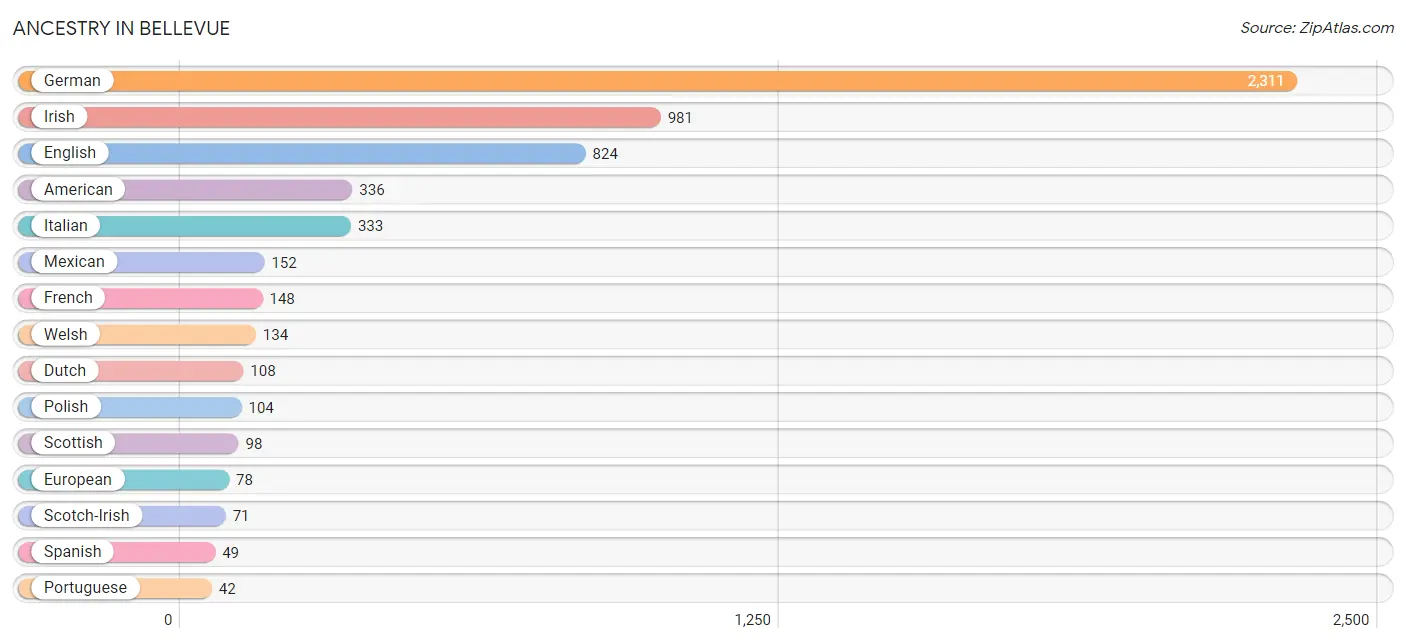
Ancestry in Bellevue
The most populous ancestries reported in Bellevue are German (2,311 | 41.3%), Irish (981 | 17.5%), English (824 | 14.7%), American (336 | 6.0%), and Italian (333 | 5.9%), together accounting for 85.5% of all Bellevue residents.
| Ancestry | # Population | % Population |
| African | 6 | 0.1% |
| American | 336 | 6.0% |
| Arab | 5 | 0.1% |
| Bhutanese | 14 | 0.3% |
| Canadian | 12 | 0.2% |
| Celtic | 7 | 0.1% |
| Cherokee | 39 | 0.7% |
| Colombian | 23 | 0.4% |
| Croatian | 7 | 0.1% |
| Dutch | 108 | 1.9% |
| English | 824 | 14.7% |
| European | 78 | 1.4% |
| French | 148 | 2.6% |
| German | 2,311 | 41.3% |
| Greek | 17 | 0.3% |
| Hungarian | 29 | 0.5% |
| Indian (Asian) | 25 | 0.4% |
| Irish | 981 | 17.5% |
| Italian | 333 | 5.9% |
| Lithuanian | 6 | 0.1% |
| Mexican | 152 | 2.7% |
| Northern European | 35 | 0.6% |
| Polish | 104 | 1.9% |
| Portuguese | 42 | 0.7% |
| Scandinavian | 26 | 0.5% |
| Scotch-Irish | 71 | 1.3% |
| Scottish | 98 | 1.8% |
| South American | 40 | 0.7% |
| Spaniard | 9 | 0.2% |
| Spanish | 49 | 0.9% |
| Subsaharan African | 6 | 0.1% |
| Swedish | 28 | 0.5% |
| Swiss | 6 | 0.1% |
| Venezuelan | 17 | 0.3% |
| Welsh | 134 | 2.4% | View All 35 Rows |
Immigrants in Bellevue
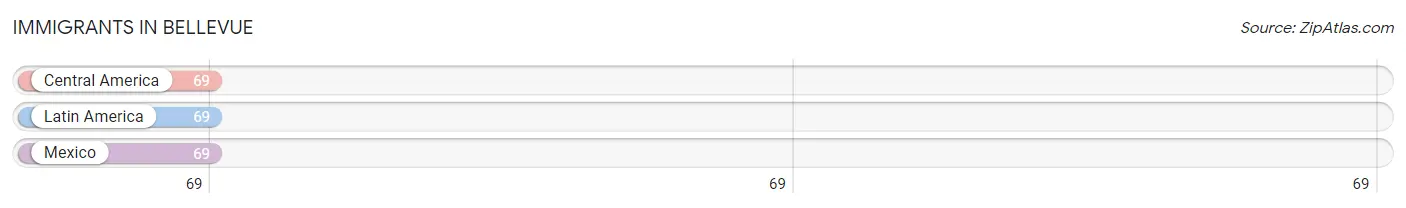
The most numerous immigrant groups reported in Bellevue came from Central America (69 | 1.2%), Latin America (69 | 1.2%), and Mexico (69 | 1.2%), together accounting for 3.7% of all Bellevue residents.
| Immigration Origin | # Population | % Population |
| Central America | 69 | 1.2% |
| Latin America | 69 | 1.2% |
| Mexico | 69 | 1.2% | View All 3 Rows |
Sex and Age in Bellevue
Sex and Age in Bellevue
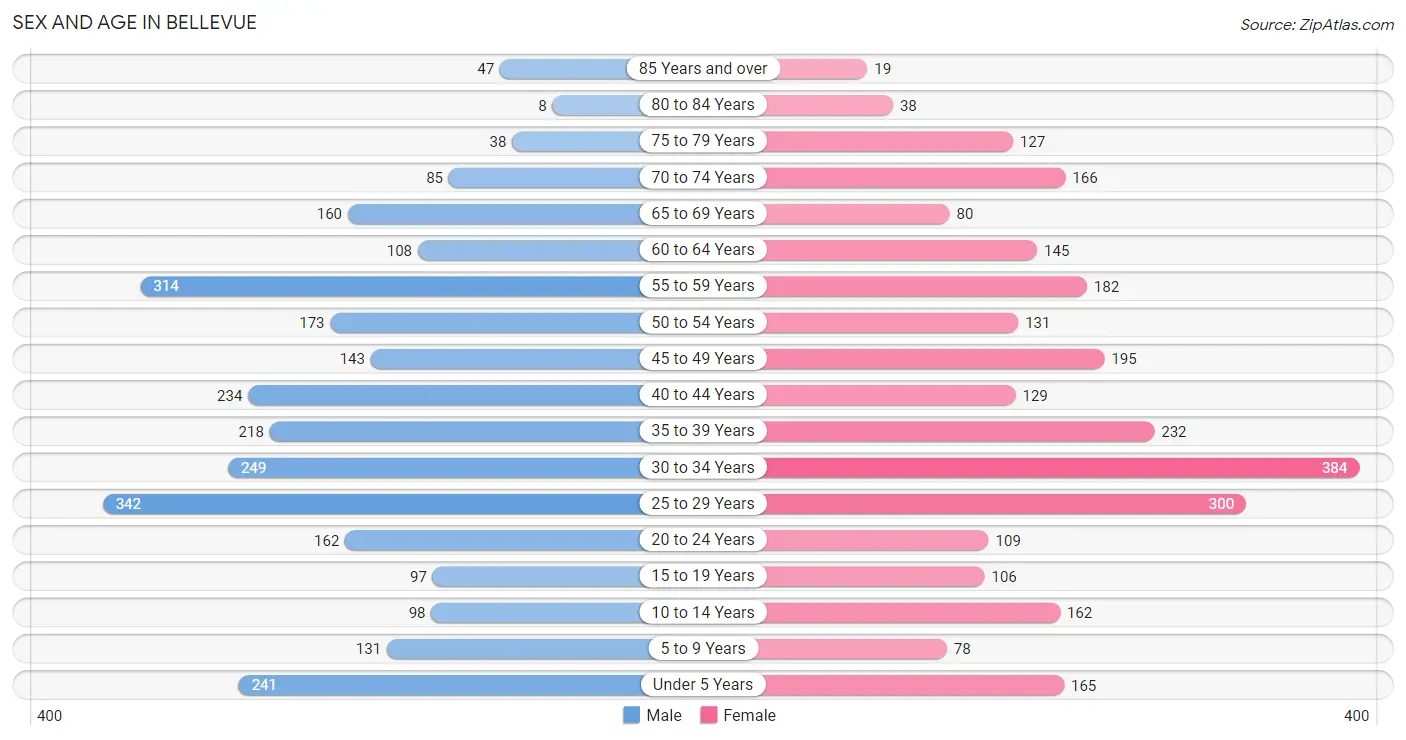
The most populous age groups in Bellevue are 25 to 29 Years (342 | 12.0%) for men and 30 to 34 Years (384 | 14.0%) for women.
| Age Bracket | Male | Female |
| Under 5 Years | 241 (8.5%) | 165 (6.0%) |
| 5 to 9 Years | 131 (4.6%) | 78 (2.8%) |
| 10 to 14 Years | 98 (3.4%) | 162 (5.9%) |
| 15 to 19 Years | 97 (3.4%) | 106 (3.9%) |
| 20 to 24 Years | 162 (5.7%) | 109 (4.0%) |
| 25 to 29 Years | 342 (12.0%) | 300 (10.9%) |
| 30 to 34 Years | 249 (8.7%) | 384 (14.0%) |
| 35 to 39 Years | 218 (7.6%) | 232 (8.4%) |
| 40 to 44 Years | 234 (8.2%) | 129 (4.7%) |
| 45 to 49 Years | 143 (5.0%) | 195 (7.1%) |
| 50 to 54 Years | 173 (6.1%) | 131 (4.8%) |
| 55 to 59 Years | 314 (11.0%) | 182 (6.6%) |
| 60 to 64 Years | 108 (3.8%) | 145 (5.3%) |
| 65 to 69 Years | 160 (5.6%) | 80 (2.9%) |
| 70 to 74 Years | 85 (3.0%) | 166 (6.0%) |
| 75 to 79 Years | 38 (1.3%) | 127 (4.6%) |
| 80 to 84 Years | 8 (0.3%) | 38 (1.4%) |
| 85 Years and over | 47 (1.7%) | 19 (0.7%) |
| Total | 2,848 (100.0%) | 2,748 (100.0%) |
Families and Households in Bellevue
Median Family Size in Bellevue
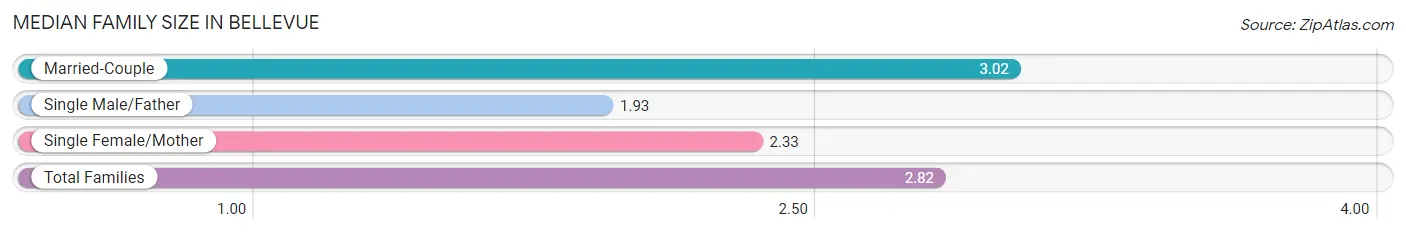
The median family size in Bellevue is 2.82 persons per family, with married-couple families (969 | 77.0%) accounting for the largest median family size of 3.02 persons per family. On the other hand, single male/father families (115 | 9.1%) represent the smallest median family size with 1.93 persons per family.
| Family Type | # Families | Family Size |
| Married-Couple | 969 (77.0%) | 3.02 |
| Single Male/Father | 115 (9.1%) | 1.93 |
| Single Female/Mother | 175 (13.9%) | 2.33 |
| Total Families | 1,259 (100.0%) | 2.82 |
Median Household Size in Bellevue
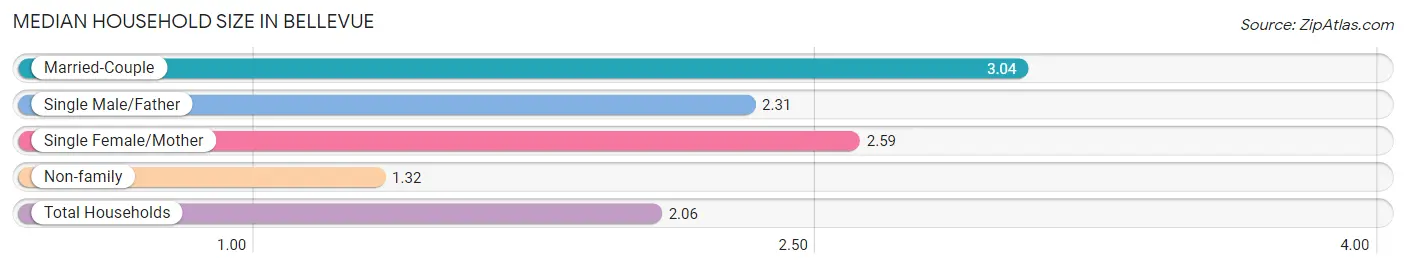
The median household size in Bellevue is 2.06 persons per household, with married-couple households (969 | 35.7%) accounting for the largest median household size of 3.04 persons per household. non-family households (1,457 | 53.6%) represent the smallest median household size with 1.32 persons per household.
| Household Type | # Households | Household Size |
| Married-Couple | 969 (35.7%) | 3.04 |
| Single Male/Father | 115 (4.2%) | 2.31 |
| Single Female/Mother | 175 (6.4%) | 2.59 |
| Non-family | 1,457 (53.6%) | 1.32 |
| Total Households | 2,716 (100.0%) | 2.06 |
Household Size by Marriage Status in Bellevue
Out of a total of 2,716 households in Bellevue, 1,259 (46.4%) are family households, while 1,457 (53.6%) are nonfamily households. The most numerous type of family households are 2-person households, comprising 620, and the most common type of nonfamily households are 1-person households, comprising 1,156.
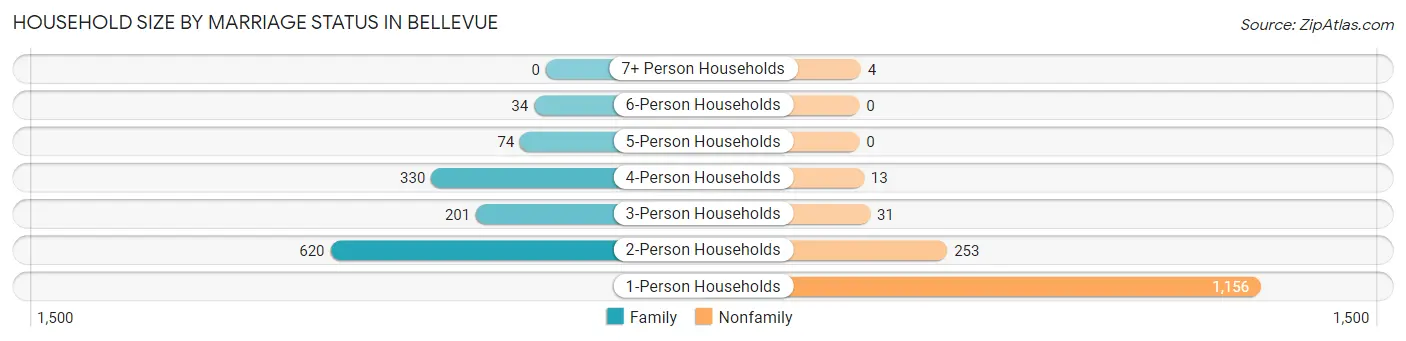
| Household Size | Family Households | Nonfamily Households |
| 1-Person Households | - | 1,156 (42.6%) |
| 2-Person Households | 620 (22.8%) | 253 (9.3%) |
| 3-Person Households | 201 (7.4%) | 31 (1.1%) |
| 4-Person Households | 330 (12.1%) | 13 (0.5%) |
| 5-Person Households | 74 (2.7%) | 0 (0.0%) |
| 6-Person Households | 34 (1.3%) | 0 (0.0%) |
| 7+ Person Households | 0 (0.0%) | 4 (0.2%) |
| Total | 1,259 (46.4%) | 1,457 (53.6%) |
Female Fertility in Bellevue
Fertility by Age in Bellevue
Average fertility rate in Bellevue is 61.0 births per 1,000 women. Women in the age bracket of 20 to 34 years have the highest fertility rate with 78.0 births per 1,000 women. Women in the age bracket of 20 to 34 years acount for 69.7% of all women with births.
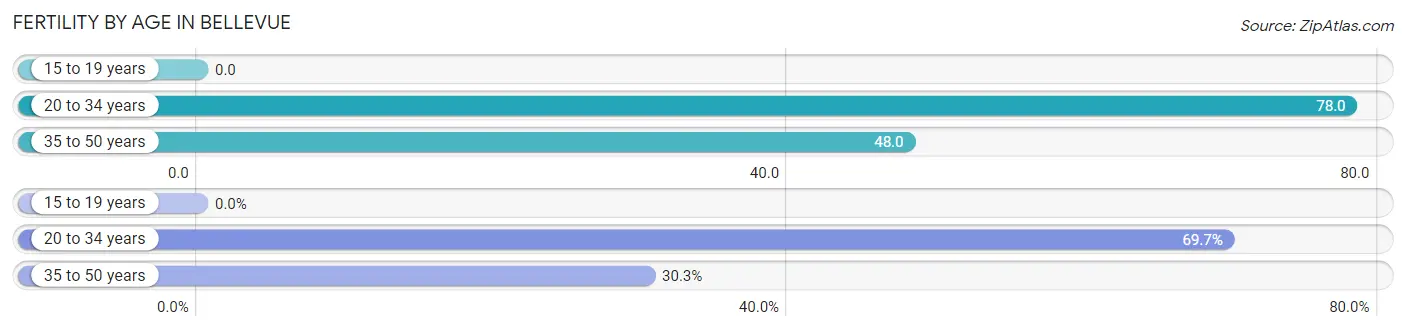
| Age Bracket | Women with Births | Births / 1,000 Women |
| 15 to 19 years | 0 (0.0%) | 0.0 |
| 20 to 34 years | 62 (69.7%) | 78.0 |
| 35 to 50 years | 27 (30.3%) | 48.0 |
| Total | 89 (100.0%) | 61.0 |
Fertility by Age by Marriage Status in Bellevue
80.9% of women with births (89) in Bellevue are married. The highest percentage of unmarried women with births falls into 20 to 34 years age bracket with 27.4% of them unmarried at the time of birth, while the lowest percentage of unmarried women with births belong to 35 to 50 years age bracket with 0.0% of them unmarried.
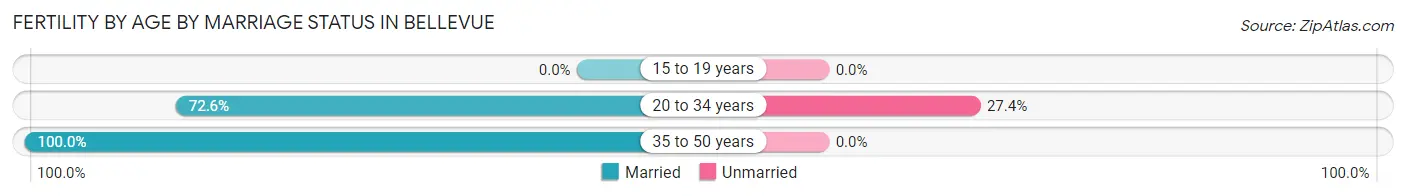
| Age Bracket | Married | Unmarried |
| 15 to 19 years | 0 (0.0%) | 0 (0.0%) |
| 20 to 34 years | 45 (72.6%) | 17 (27.4%) |
| 35 to 50 years | 27 (100.0%) | 0 (0.0%) |
| Total | 72 (80.9%) | 17 (19.1%) |
Fertility by Education in Bellevue
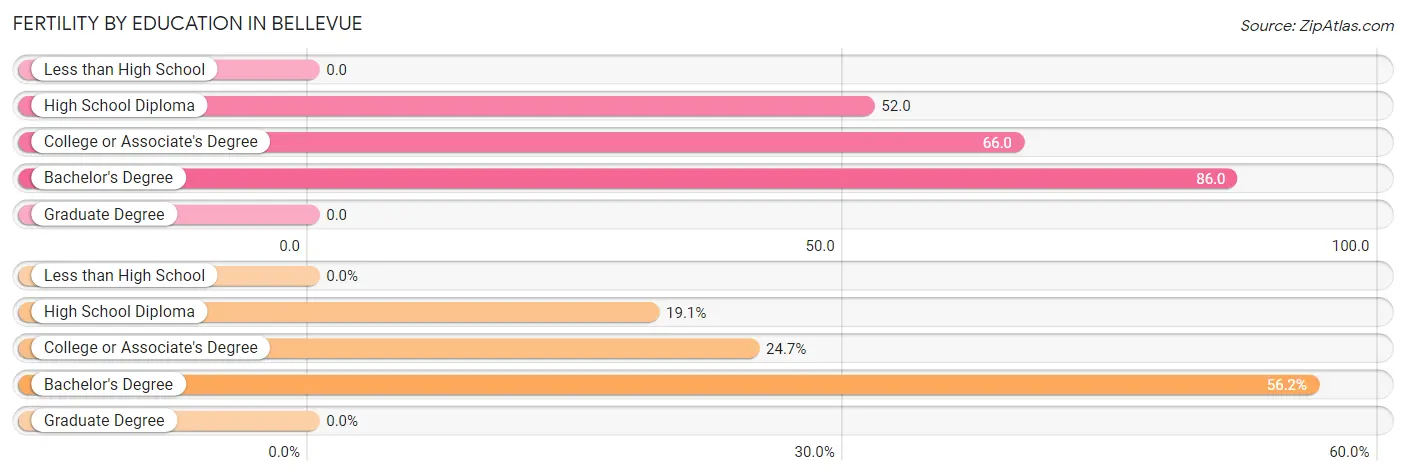
| Educational Attainment | Women with Births | Births / 1,000 Women |
| Less than High School | 0 (0.0%) | 0.0 |
| High School Diploma | 17 (19.1%) | 52.0 |
| College or Associate's Degree | 22 (24.7%) | 66.0 |
| Bachelor's Degree | 50 (56.2%) | 86.0 |
| Graduate Degree | 0 (0.0%) | 0.0 |
| Total | 89 (100.0%) | 61.0 |
Fertility by Education by Marriage Status in Bellevue
19.1% of women with births in Bellevue are unmarried. Women with the educational attainment of college or associate's degree are most likely to be married with 100.0% of them married at childbirth, while women with the educational attainment of high school diploma are least likely to be married with 100.0% of them unmarried at childbirth.
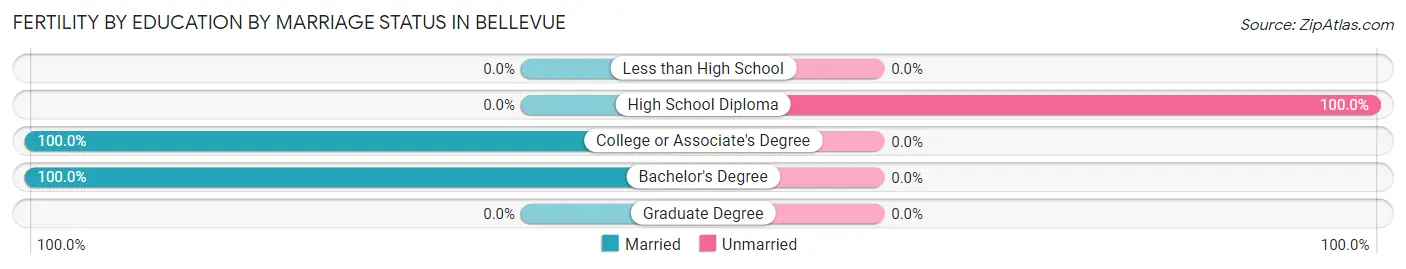
| Educational Attainment | Married | Unmarried |
| Less than High School | 0 (0.0%) | 0 (0.0%) |
| High School Diploma | 0 (0.0%) | 17 (100.0%) |
| College or Associate's Degree | 22 (100.0%) | 0 (0.0%) |
| Bachelor's Degree | 50 (100.0%) | 0 (0.0%) |
| Graduate Degree | 0 (0.0%) | 0 (0.0%) |
| Total | 72 (80.9%) | 17 (19.1%) |
Employment Characteristics in Bellevue
Employment by Class of Employer in Bellevue
Among the 3,223 employed individuals in Bellevue, private company employees (2,070 | 64.2%), not-for-profit organizations (590 | 18.3%), and self-employed (incorporated) (154 | 4.8%) make up the most common classes of employment.
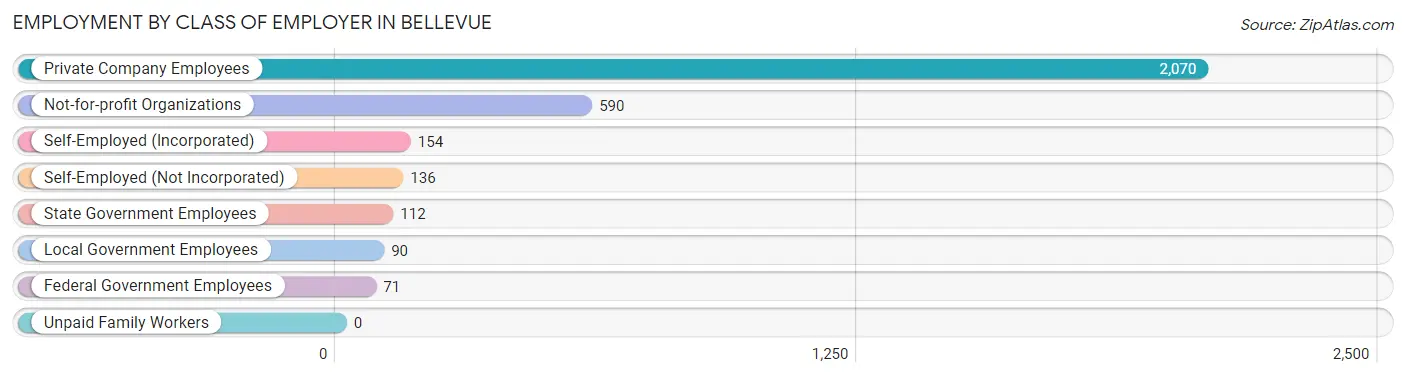
| Employer Class | # Employees | % Employees |
| Private Company Employees | 2,070 | 64.2% |
| Self-Employed (Incorporated) | 154 | 4.8% |
| Self-Employed (Not Incorporated) | 136 | 4.2% |
| Not-for-profit Organizations | 590 | 18.3% |
| Local Government Employees | 90 | 2.8% |
| State Government Employees | 112 | 3.5% |
| Federal Government Employees | 71 | 2.2% |
| Unpaid Family Workers | 0 | 0.0% |
| Total | 3,223 | 100.0% |
Employment Status by Age in Bellevue
According to the labor force statistics for Bellevue, out of the total population over 16 years of age (4,701), 69.6% or 3,272 individuals are in the labor force, with 1.5% or 49 of them unemployed. The age group with the highest labor force participation rate is 20 to 24 years, with 92.3% or 250 individuals in the labor force. Within the labor force, the 20 to 24 years age range has the highest percentage of unemployed individuals, with 7.2% or 18 of them being unemployed.
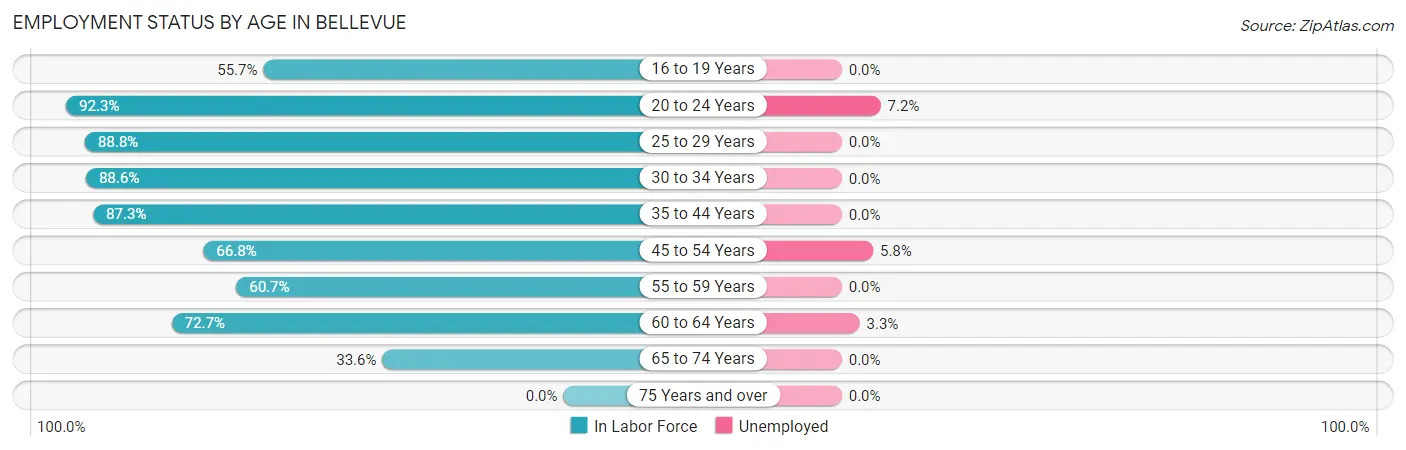
| Age Bracket | In Labor Force | Unemployed |
| 16 to 19 Years | 102 (55.7%) | 0 (0.0%) |
| 20 to 24 Years | 250 (92.3%) | 18 (7.2%) |
| 25 to 29 Years | 570 (88.8%) | 0 (0.0%) |
| 30 to 34 Years | 561 (88.6%) | 0 (0.0%) |
| 35 to 44 Years | 710 (87.3%) | 0 (0.0%) |
| 45 to 54 Years | 429 (66.8%) | 25 (5.8%) |
| 55 to 59 Years | 301 (60.7%) | 0 (0.0%) |
| 60 to 64 Years | 184 (72.7%) | 6 (3.3%) |
| 65 to 74 Years | 165 (33.6%) | 0 (0.0%) |
| 75 Years and over | 0 (0.0%) | 0 (0.0%) |
| Total | 3,272 (69.6%) | 49 (1.5%) |
Employment Status by Educational Attainment in Bellevue
According to labor force statistics for Bellevue, 79.2% of individuals (2,755) out of the total population between 25 and 64 years of age (3,479) are in the labor force, with 1.1% or 30 of them being unemployed. The group with the highest labor force participation rate are those with the educational attainment of bachelor's degree or higher, with 93.3% or 1,469 individuals in the labor force. Within the labor force, individuals with high school diploma education have the highest percentage of unemployment, with 5.5% or 31 of them being unemployed.
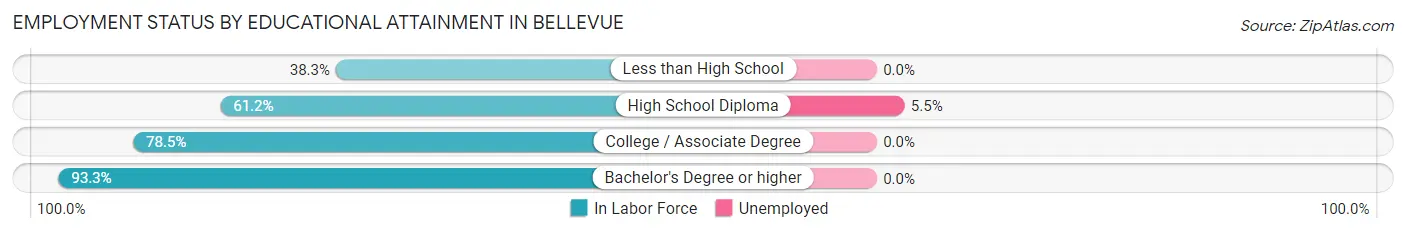
| Educational Attainment | In Labor Force | Unemployed |
| Less than High School | 49 (38.3%) | 0 (0.0%) |
| High School Diploma | 561 (61.2%) | 50 (5.5%) |
| College / Associate Degree | 675 (78.5%) | 0 (0.0%) |
| Bachelor's Degree or higher | 1,469 (93.3%) | 0 (0.0%) |
| Total | 2,755 (79.2%) | 38 (1.1%) |
Employment Occupations by Sex in Bellevue
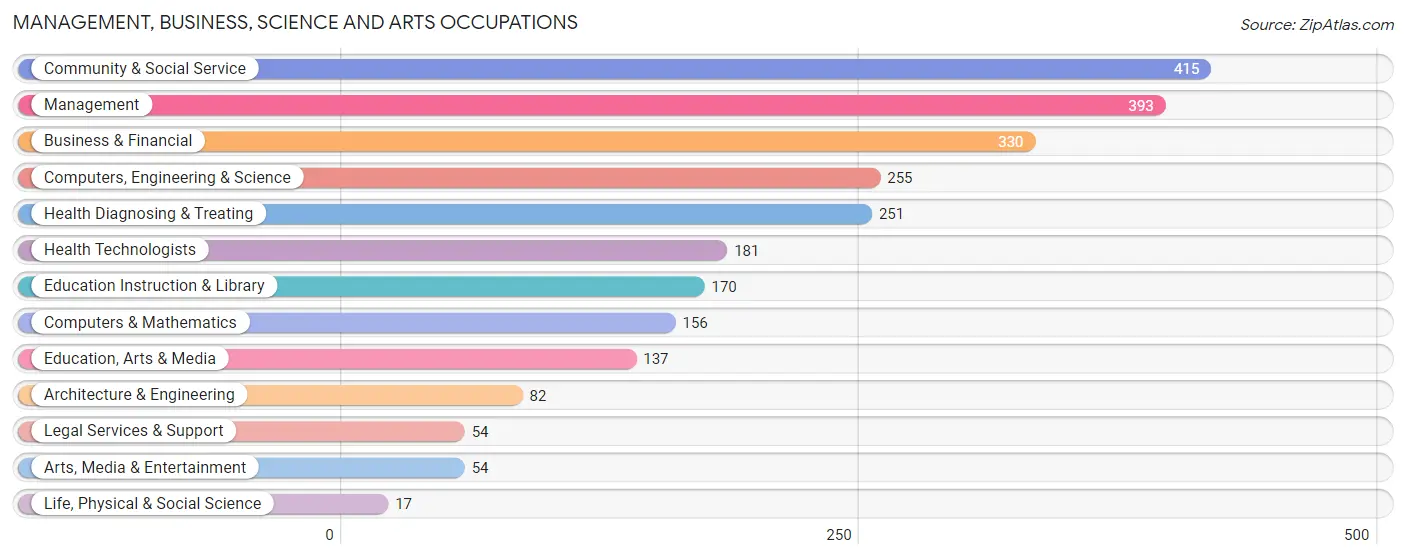
Management, Business, Science and Arts Occupations
The most common Management, Business, Science and Arts occupations in Bellevue are Community & Social Service (415 | 12.9%), Management (393 | 12.2%), Business & Financial (330 | 10.2%), Computers, Engineering & Science (255 | 7.9%), and Health Diagnosing & Treating (251 | 7.8%).
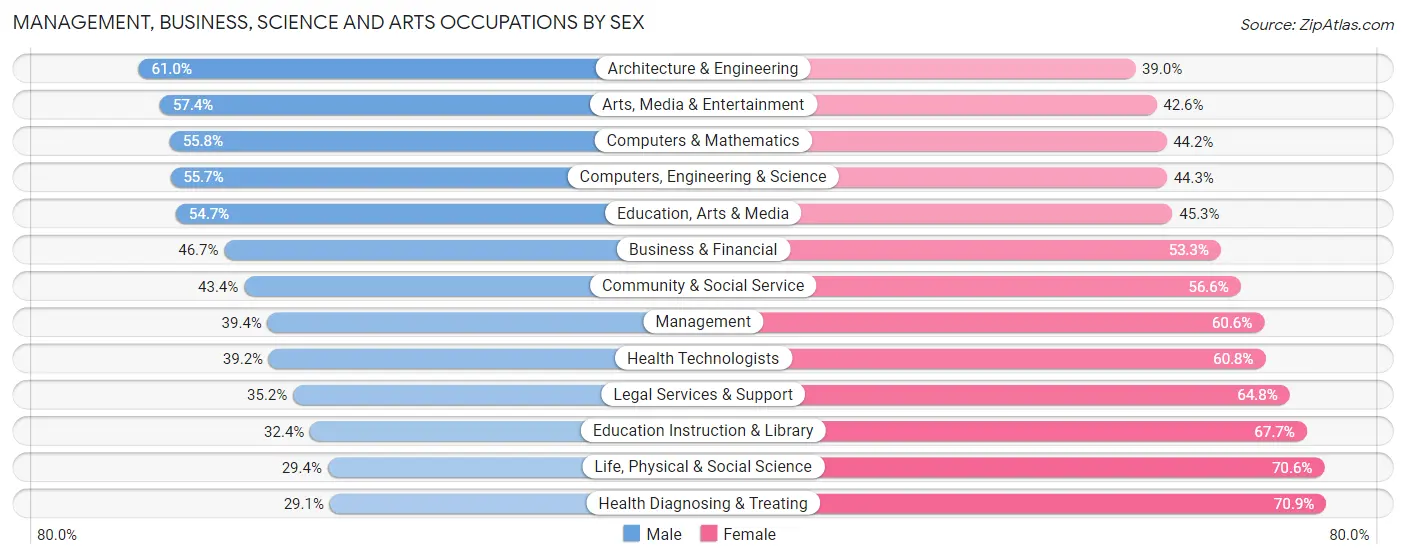
Management, Business, Science and Arts Occupations by Sex
Within the Management, Business, Science and Arts occupations in Bellevue, the most male-oriented occupations are Architecture & Engineering (61.0%), Arts, Media & Entertainment (57.4%), and Computers & Mathematics (55.8%), while the most female-oriented occupations are Health Diagnosing & Treating (70.9%), Life, Physical & Social Science (70.6%), and Education Instruction & Library (67.6%).
| Occupation | Male | Female |
| Management | 155 (39.4%) | 238 (60.6%) |
| Business & Financial | 154 (46.7%) | 176 (53.3%) |
| Computers, Engineering & Science | 142 (55.7%) | 113 (44.3%) |
| Computers & Mathematics | 87 (55.8%) | 69 (44.2%) |
| Architecture & Engineering | 50 (61.0%) | 32 (39.0%) |
| Life, Physical & Social Science | 5 (29.4%) | 12 (70.6%) |
| Community & Social Service | 180 (43.4%) | 235 (56.6%) |
| Education, Arts & Media | 75 (54.7%) | 62 (45.3%) |
| Legal Services & Support | 19 (35.2%) | 35 (64.8%) |
| Education Instruction & Library | 55 (32.4%) | 115 (67.6%) |
| Arts, Media & Entertainment | 31 (57.4%) | 23 (42.6%) |
| Health Diagnosing & Treating | 73 (29.1%) | 178 (70.9%) |
| Health Technologists | 71 (39.2%) | 110 (60.8%) |
| Total (Category) | 704 (42.8%) | 940 (57.2%) |
| Total (Overall) | 1,705 (52.9%) | 1,518 (47.1%) |
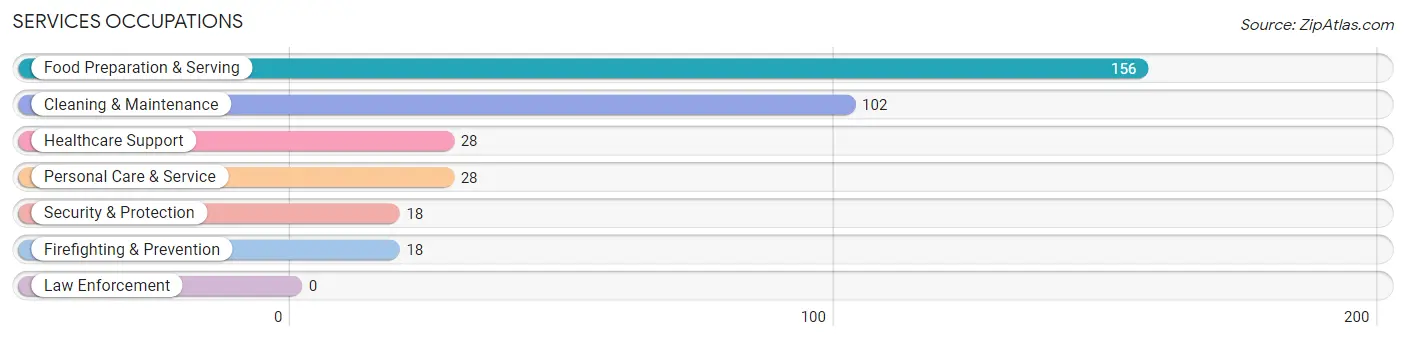
Services Occupations
The most common Services occupations in Bellevue are Food Preparation & Serving (156 | 4.8%), Cleaning & Maintenance (102 | 3.2%), Healthcare Support (28 | 0.9%), Personal Care & Service (28 | 0.9%), and Security & Protection (18 | 0.6%).
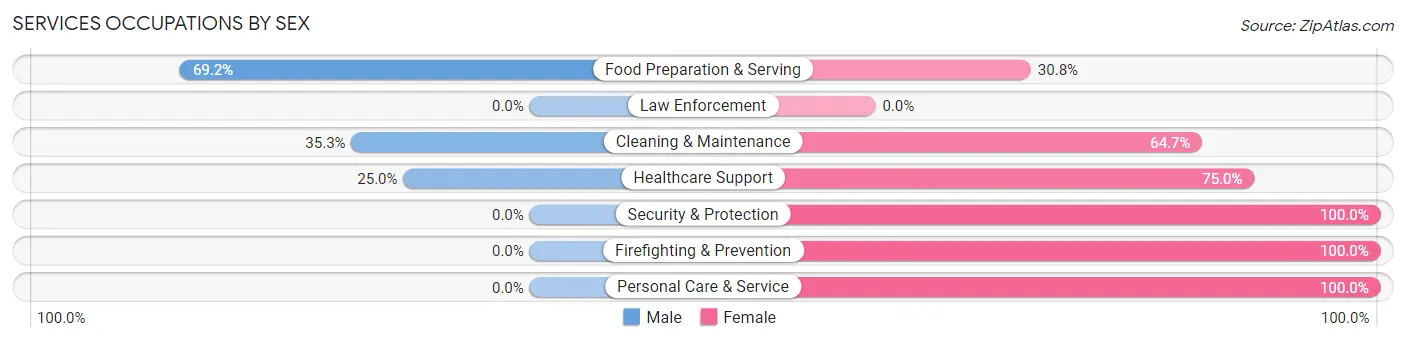
Services Occupations by Sex
Within the Services occupations in Bellevue, the most male-oriented occupations are Food Preparation & Serving (69.2%), Cleaning & Maintenance (35.3%), and Healthcare Support (25.0%), while the most female-oriented occupations are Security & Protection (100.0%), Firefighting & Prevention (100.0%), and Personal Care & Service (100.0%).
| Occupation | Male | Female |
| Healthcare Support | 7 (25.0%) | 21 (75.0%) |
| Security & Protection | 0 (0.0%) | 18 (100.0%) |
| Firefighting & Prevention | 0 (0.0%) | 18 (100.0%) |
| Law Enforcement | 0 (0.0%) | 0 (0.0%) |
| Food Preparation & Serving | 108 (69.2%) | 48 (30.8%) |
| Cleaning & Maintenance | 36 (35.3%) | 66 (64.7%) |
| Personal Care & Service | 0 (0.0%) | 28 (100.0%) |
| Total (Category) | 151 (45.5%) | 181 (54.5%) |
| Total (Overall) | 1,705 (52.9%) | 1,518 (47.1%) |
Sales and Office Occupations
The most common Sales and Office occupations in Bellevue are Sales & Related (315 | 9.8%), and Office & Administration (248 | 7.7%).

Sales and Office Occupations by Sex
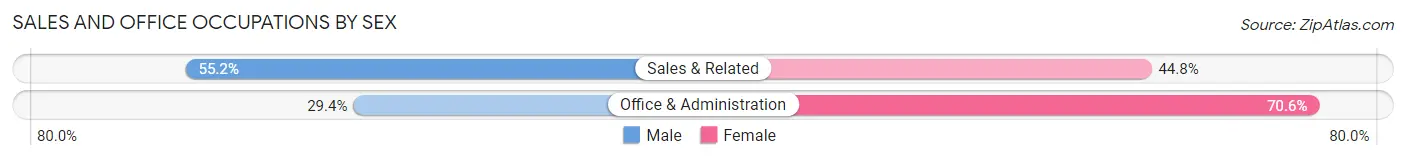
| Occupation | Male | Female |
| Sales & Related | 174 (55.2%) | 141 (44.8%) |
| Office & Administration | 73 (29.4%) | 175 (70.6%) |
| Total (Category) | 247 (43.9%) | 316 (56.1%) |
| Total (Overall) | 1,705 (52.9%) | 1,518 (47.1%) |
Natural Resources, Construction and Maintenance Occupations
The most common Natural Resources, Construction and Maintenance occupations in Bellevue are Construction & Extraction (111 | 3.4%), and Installation, Maintenance & Repair (96 | 3.0%).

Natural Resources, Construction and Maintenance Occupations by Sex
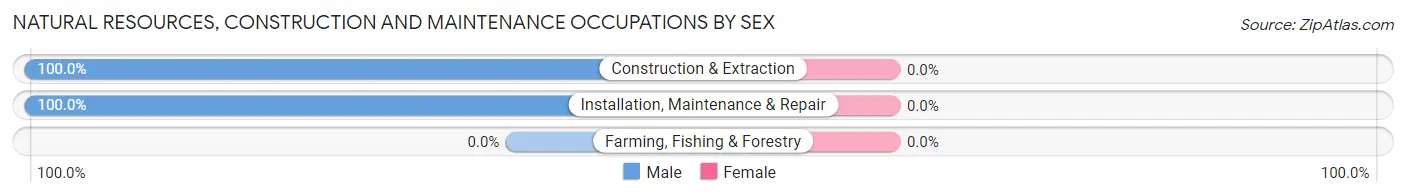
| Occupation | Male | Female |
| Farming, Fishing & Forestry | 0 (0.0%) | 0 (0.0%) |
| Construction & Extraction | 111 (100.0%) | 0 (0.0%) |
| Installation, Maintenance & Repair | 96 (100.0%) | 0 (0.0%) |
| Total (Category) | 207 (100.0%) | 0 (0.0%) |
| Total (Overall) | 1,705 (52.9%) | 1,518 (47.1%) |
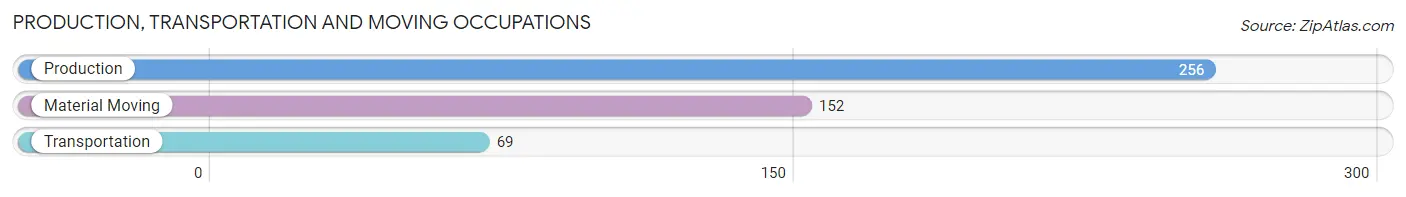
Production, Transportation and Moving Occupations
The most common Production, Transportation and Moving occupations in Bellevue are Production (256 | 7.9%), Material Moving (152 | 4.7%), and Transportation (69 | 2.1%).
Production, Transportation and Moving Occupations by Sex
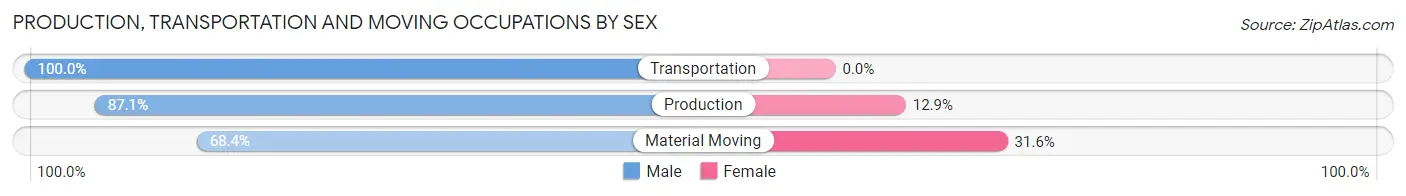
| Occupation | Male | Female |
| Production | 223 (87.1%) | 33 (12.9%) |
| Transportation | 69 (100.0%) | 0 (0.0%) |
| Material Moving | 104 (68.4%) | 48 (31.6%) |
| Total (Category) | 396 (83.0%) | 81 (17.0%) |
| Total (Overall) | 1,705 (52.9%) | 1,518 (47.1%) |
Employment Industries by Sex in Bellevue
Employment Industries in Bellevue
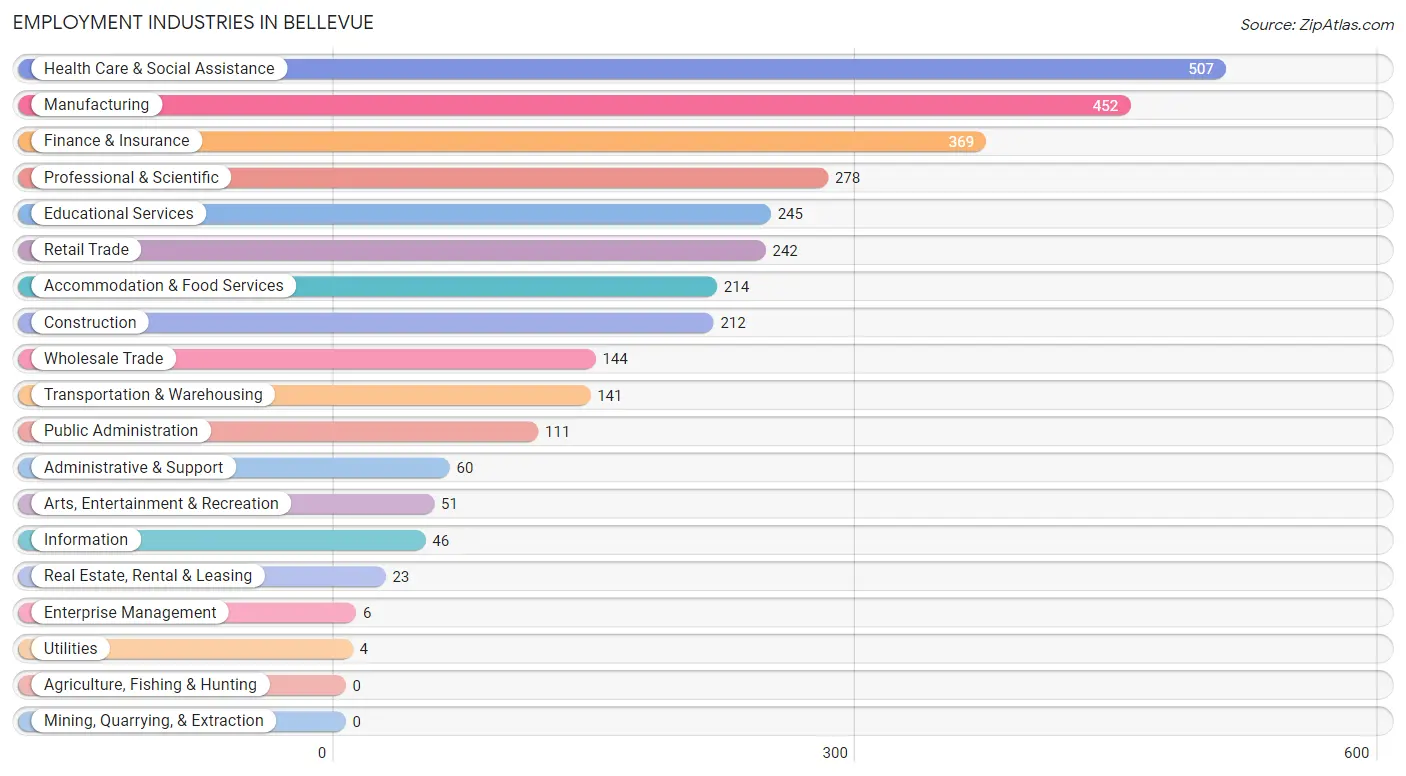
The major employment industries in Bellevue include Health Care & Social Assistance (507 | 15.7%), Manufacturing (452 | 14.0%), Finance & Insurance (369 | 11.5%), Professional & Scientific (278 | 8.6%), and Educational Services (245 | 7.6%).
Employment Industries by Sex in Bellevue
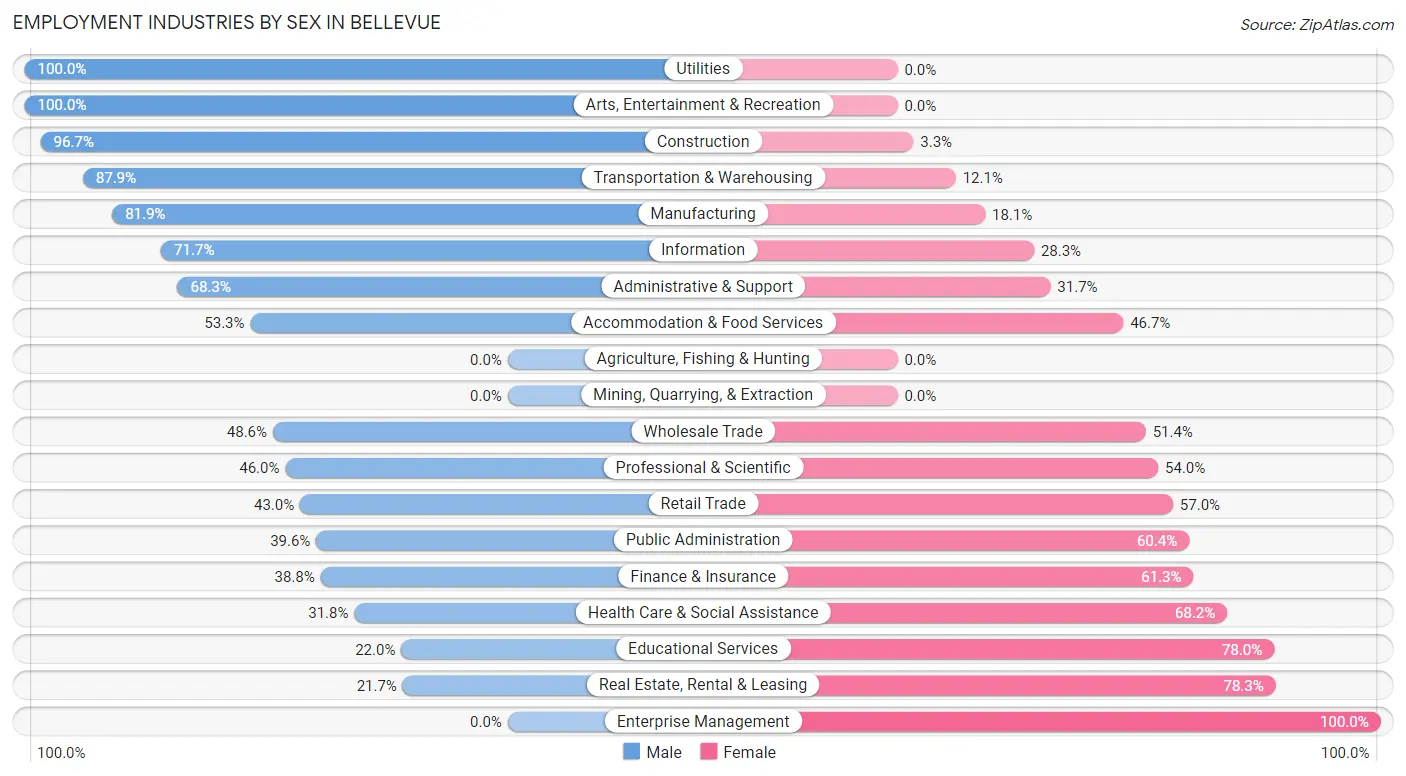
The Bellevue industries that see more men than women are Utilities (100.0%), Arts, Entertainment & Recreation (100.0%), and Construction (96.7%), whereas the industries that tend to have a higher number of women are Enterprise Management (100.0%), Real Estate, Rental & Leasing (78.3%), and Educational Services (78.0%).
| Industry | Male | Female |
| Agriculture, Fishing & Hunting | 0 (0.0%) | 0 (0.0%) |
| Mining, Quarrying, & Extraction | 0 (0.0%) | 0 (0.0%) |
| Construction | 205 (96.7%) | 7 (3.3%) |
| Manufacturing | 370 (81.9%) | 82 (18.1%) |
| Wholesale Trade | 70 (48.6%) | 74 (51.4%) |
| Retail Trade | 104 (43.0%) | 138 (57.0%) |
| Transportation & Warehousing | 124 (87.9%) | 17 (12.1%) |
| Utilities | 4 (100.0%) | 0 (0.0%) |
| Information | 33 (71.7%) | 13 (28.3%) |
| Finance & Insurance | 143 (38.8%) | 226 (61.3%) |
| Real Estate, Rental & Leasing | 5 (21.7%) | 18 (78.3%) |
| Professional & Scientific | 128 (46.0%) | 150 (54.0%) |
| Enterprise Management | 0 (0.0%) | 6 (100.0%) |
| Administrative & Support | 41 (68.3%) | 19 (31.7%) |
| Educational Services | 54 (22.0%) | 191 (78.0%) |
| Health Care & Social Assistance | 161 (31.8%) | 346 (68.2%) |
| Arts, Entertainment & Recreation | 51 (100.0%) | 0 (0.0%) |
| Accommodation & Food Services | 114 (53.3%) | 100 (46.7%) |
| Public Administration | 44 (39.6%) | 67 (60.4%) |
| Total | 1,705 (52.9%) | 1,518 (47.1%) |
Education in Bellevue
School Enrollment in Bellevue
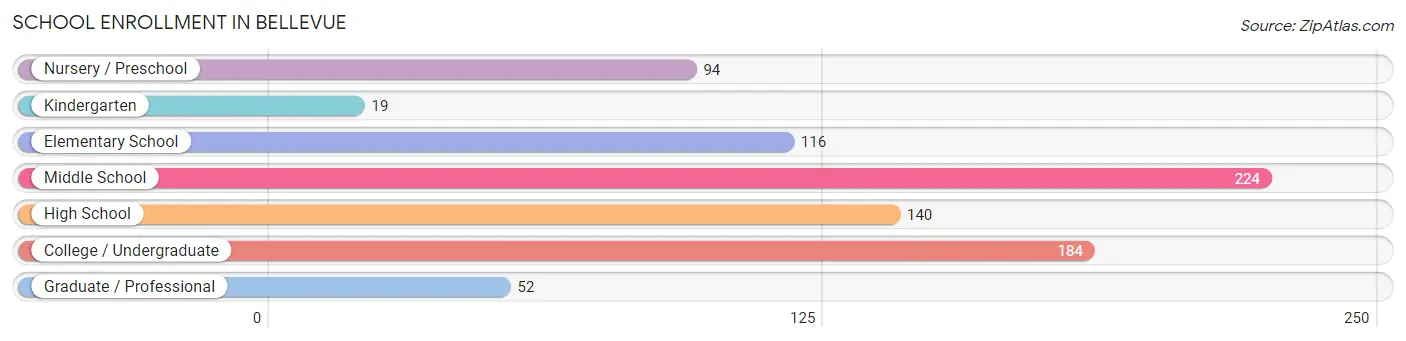
The most common levels of schooling among the 829 students in Bellevue are middle school (224 | 27.0%), college / undergraduate (184 | 22.2%), and high school (140 | 16.9%).
| School Level | # Students | % Students |
| Nursery / Preschool | 94 | 11.3% |
| Kindergarten | 19 | 2.3% |
| Elementary School | 116 | 14.0% |
| Middle School | 224 | 27.0% |
| High School | 140 | 16.9% |
| College / Undergraduate | 184 | 22.2% |
| Graduate / Professional | 52 | 6.3% |
| Total | 829 | 100.0% |
School Enrollment by Age by Funding Source in Bellevue
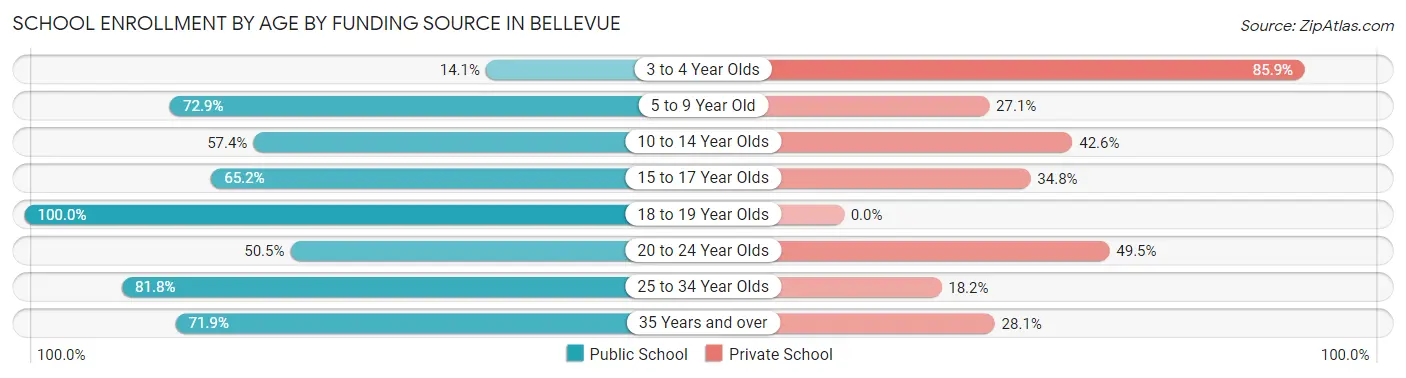
Out of a total of 829 students who are enrolled in schools in Bellevue, 316 (38.1%) attend a private institution, while the remaining 513 (61.9%) are enrolled in public schools. The age group of 3 to 4 year olds has the highest likelihood of being enrolled in private schools, with 67 (85.9% in the age bracket) enrolled. Conversely, the age group of 18 to 19 year olds has the lowest likelihood of being enrolled in a private school, with 73 (100.0% in the age bracket) attending a public institution.
| Age Bracket | Public School | Private School |
| 3 to 4 Year Olds | 11 (14.1%) | 67 (85.9%) |
| 5 to 9 Year Old | 113 (72.9%) | 42 (27.1%) |
| 10 to 14 Year Olds | 147 (57.4%) | 109 (42.6%) |
| 15 to 17 Year Olds | 60 (65.2%) | 32 (34.8%) |
| 18 to 19 Year Olds | 73 (100.0%) | 0 (0.0%) |
| 20 to 24 Year Olds | 50 (50.5%) | 49 (49.5%) |
| 25 to 34 Year Olds | 36 (81.8%) | 8 (18.2%) |
| 35 Years and over | 23 (71.9%) | 9 (28.1%) |
| Total | 513 (61.9%) | 316 (38.1%) |
Educational Attainment by Field of Study in Bellevue
Business (460 | 24.3%), visual & performing arts (189 | 10.0%), computers & mathematics (165 | 8.7%), science & technology (165 | 8.7%), and social sciences (156 | 8.3%) are the most common fields of study among 1,892 individuals in Bellevue who have obtained a bachelor's degree or higher.
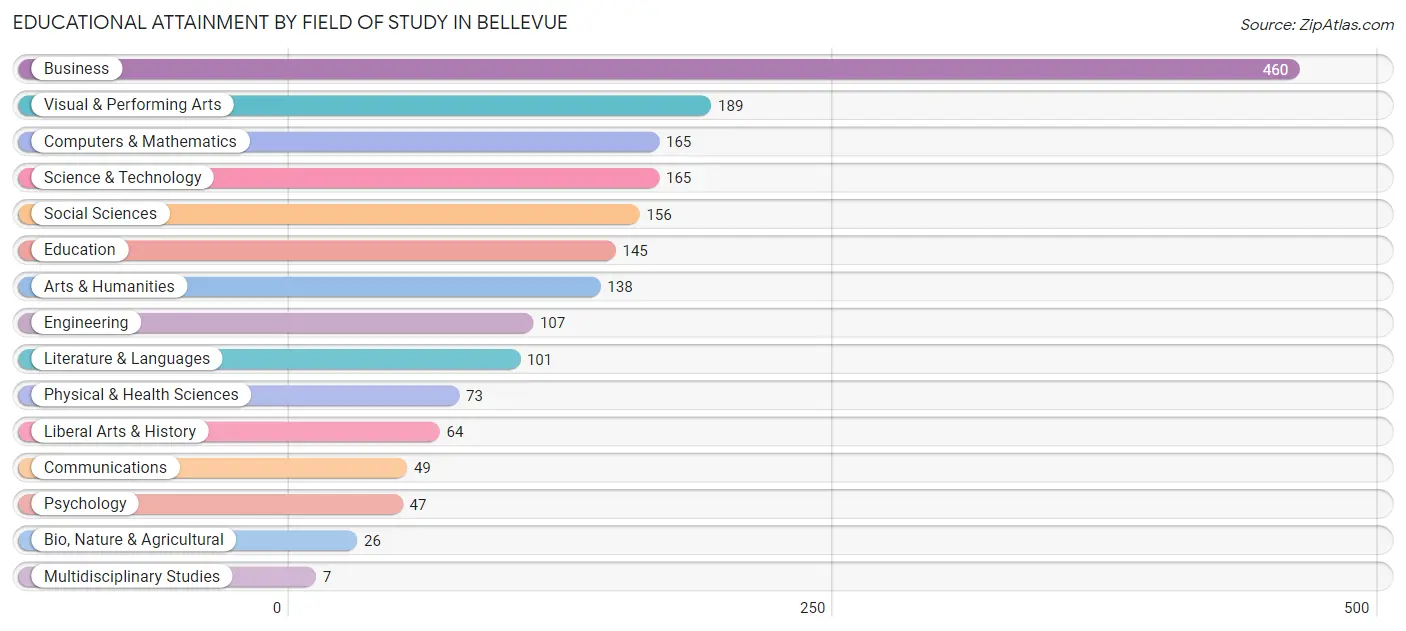
| Field of Study | # Graduates | % Graduates |
| Computers & Mathematics | 165 | 8.7% |
| Bio, Nature & Agricultural | 26 | 1.4% |
| Physical & Health Sciences | 73 | 3.9% |
| Psychology | 47 | 2.5% |
| Social Sciences | 156 | 8.3% |
| Engineering | 107 | 5.7% |
| Multidisciplinary Studies | 7 | 0.4% |
| Science & Technology | 165 | 8.7% |
| Business | 460 | 24.3% |
| Education | 145 | 7.7% |
| Literature & Languages | 101 | 5.3% |
| Liberal Arts & History | 64 | 3.4% |
| Visual & Performing Arts | 189 | 10.0% |
| Communications | 49 | 2.6% |
| Arts & Humanities | 138 | 7.3% |
| Total | 1,892 | 100.0% |
Transportation & Commute in Bellevue
Vehicle Availability by Sex in Bellevue
The most prevalent vehicle ownership categories in Bellevue are males with 2 vehicles (763, accounting for 44.8%) and females with 2 vehicles (835, making up 50.3%).
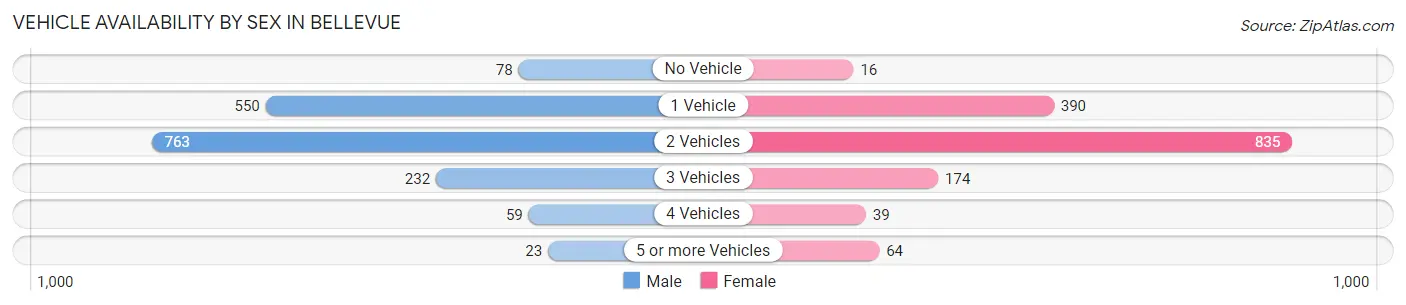
| Vehicles Available | Male | Female |
| No Vehicle | 78 (4.6%) | 16 (1.1%) |
| 1 Vehicle | 550 (32.3%) | 390 (25.7%) |
| 2 Vehicles | 763 (44.8%) | 835 (55.0%) |
| 3 Vehicles | 232 (13.6%) | 174 (11.5%) |
| 4 Vehicles | 59 (3.5%) | 39 (2.6%) |
| 5 or more Vehicles | 23 (1.3%) | 64 (4.2%) |
| Total | 1,705 (100.0%) | 1,518 (100.0%) |
Commute Time in Bellevue
The most frequently occuring commute durations in Bellevue are 10 to 14 minutes (536 commuters, 19.1%), 15 to 19 minutes (440 commuters, 15.7%), and 30 to 34 minutes (414 commuters, 14.7%).
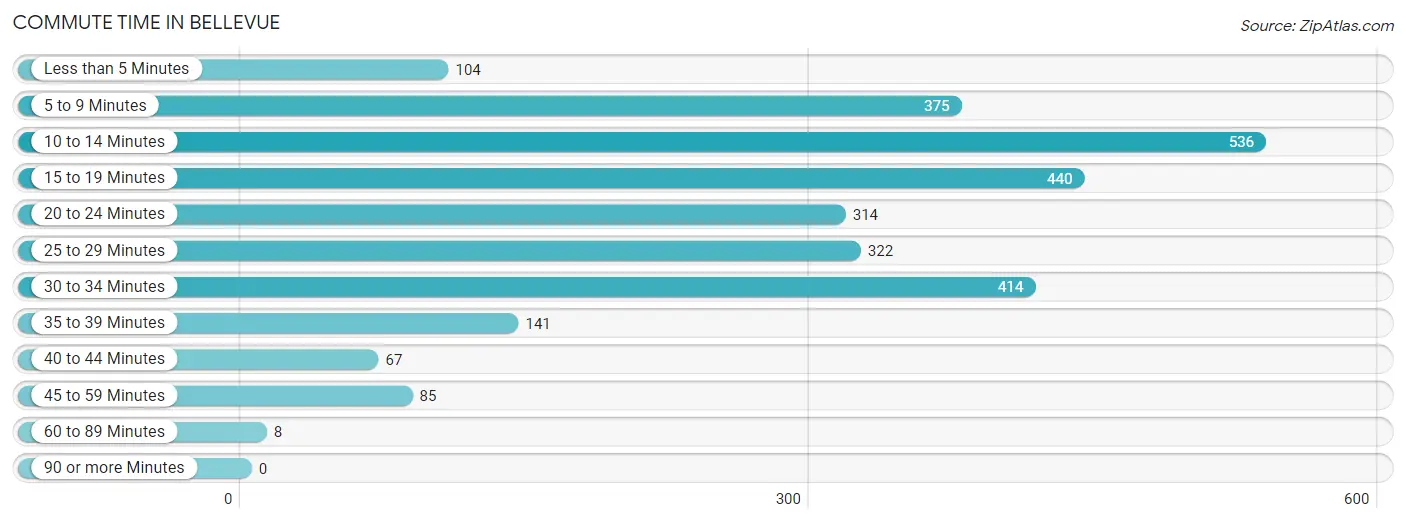
| Commute Time | # Commuters | % Commuters |
| Less than 5 Minutes | 104 | 3.7% |
| 5 to 9 Minutes | 375 | 13.4% |
| 10 to 14 Minutes | 536 | 19.1% |
| 15 to 19 Minutes | 440 | 15.7% |
| 20 to 24 Minutes | 314 | 11.2% |
| 25 to 29 Minutes | 322 | 11.5% |
| 30 to 34 Minutes | 414 | 14.7% |
| 35 to 39 Minutes | 141 | 5.0% |
| 40 to 44 Minutes | 67 | 2.4% |
| 45 to 59 Minutes | 85 | 3.0% |
| 60 to 89 Minutes | 8 | 0.3% |
| 90 or more Minutes | 0 | 0.0% |
Commute Time by Sex in Bellevue
The most common commute times in Bellevue are 30 to 34 minutes (302 commuters, 20.3%) for males and 10 to 14 minutes (362 commuters, 27.5%) for females.
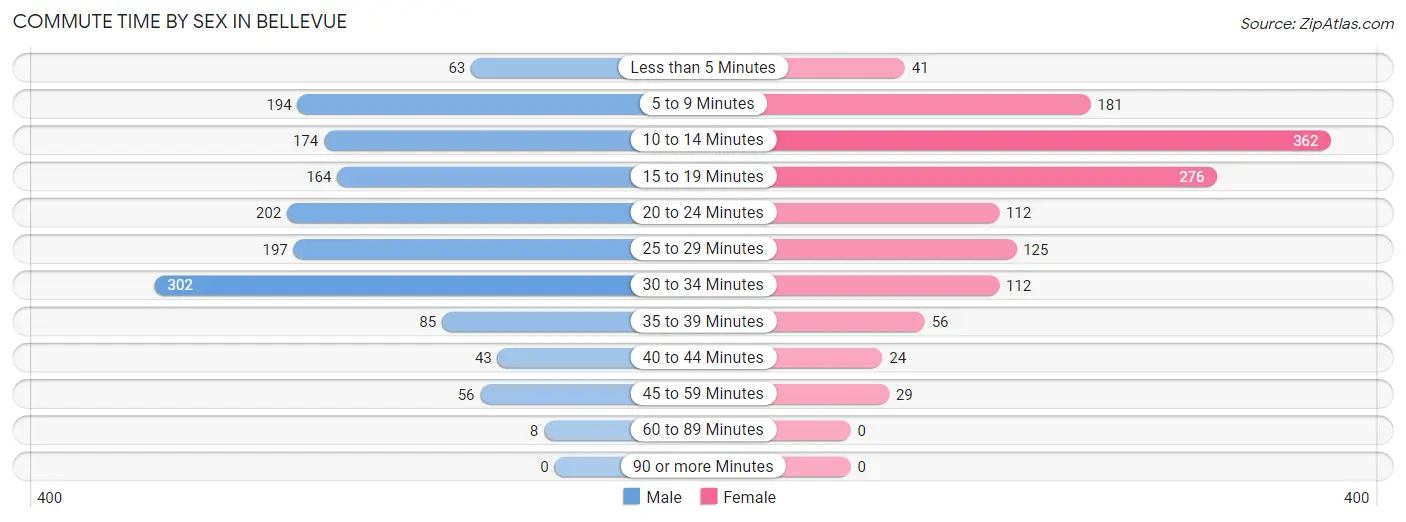
| Commute Time | Male | Female |
| Less than 5 Minutes | 63 (4.2%) | 41 (3.1%) |
| 5 to 9 Minutes | 194 (13.0%) | 181 (13.7%) |
| 10 to 14 Minutes | 174 (11.7%) | 362 (27.5%) |
| 15 to 19 Minutes | 164 (11.0%) | 276 (20.9%) |
| 20 to 24 Minutes | 202 (13.6%) | 112 (8.5%) |
| 25 to 29 Minutes | 197 (13.2%) | 125 (9.5%) |
| 30 to 34 Minutes | 302 (20.3%) | 112 (8.5%) |
| 35 to 39 Minutes | 85 (5.7%) | 56 (4.3%) |
| 40 to 44 Minutes | 43 (2.9%) | 24 (1.8%) |
| 45 to 59 Minutes | 56 (3.8%) | 29 (2.2%) |
| 60 to 89 Minutes | 8 (0.5%) | 0 (0.0%) |
| 90 or more Minutes | 0 (0.0%) | 0 (0.0%) |
Time of Departure to Work by Sex in Bellevue
The most frequent times of departure to work in Bellevue are 7:00 AM to 7:29 AM (307, 20.6%) for males and 7:00 AM to 7:29 AM (268, 20.3%) for females.
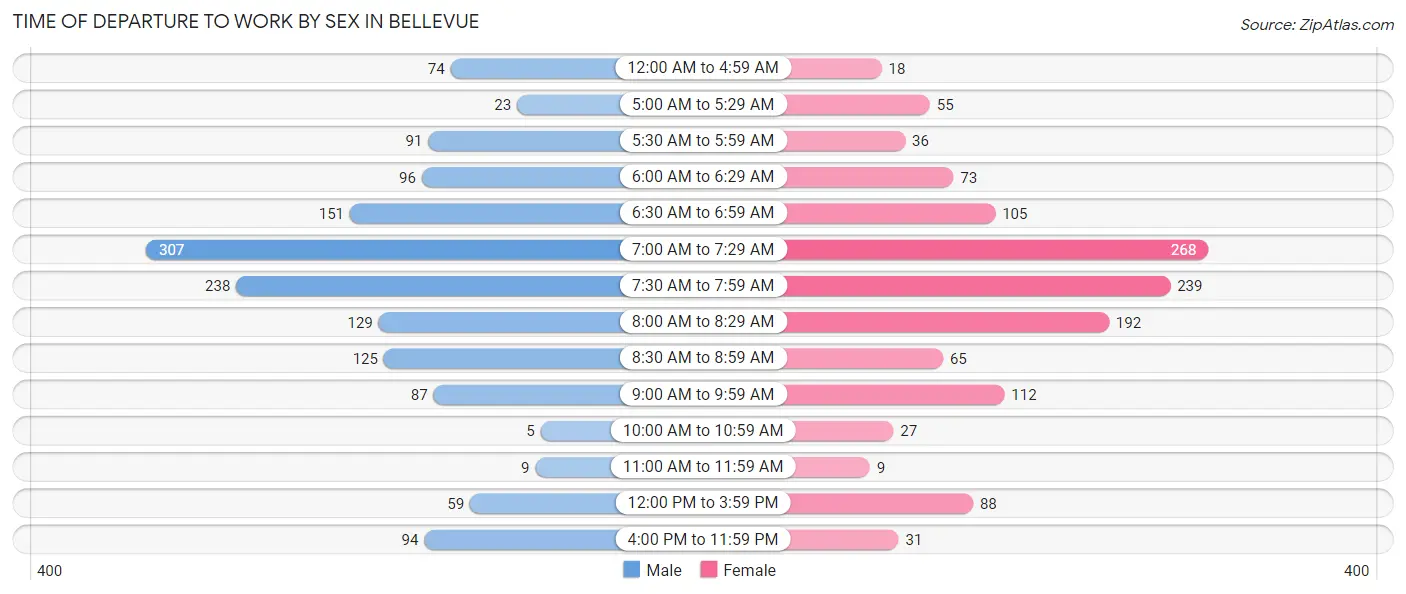
| Time of Departure | Male | Female |
| 12:00 AM to 4:59 AM | 74 (5.0%) | 18 (1.4%) |
| 5:00 AM to 5:29 AM | 23 (1.5%) | 55 (4.2%) |
| 5:30 AM to 5:59 AM | 91 (6.1%) | 36 (2.7%) |
| 6:00 AM to 6:29 AM | 96 (6.5%) | 73 (5.5%) |
| 6:30 AM to 6:59 AM | 151 (10.2%) | 105 (8.0%) |
| 7:00 AM to 7:29 AM | 307 (20.6%) | 268 (20.3%) |
| 7:30 AM to 7:59 AM | 238 (16.0%) | 239 (18.1%) |
| 8:00 AM to 8:29 AM | 129 (8.7%) | 192 (14.6%) |
| 8:30 AM to 8:59 AM | 125 (8.4%) | 65 (4.9%) |
| 9:00 AM to 9:59 AM | 87 (5.9%) | 112 (8.5%) |
| 10:00 AM to 10:59 AM | 5 (0.3%) | 27 (2.1%) |
| 11:00 AM to 11:59 AM | 9 (0.6%) | 9 (0.7%) |
| 12:00 PM to 3:59 PM | 59 (4.0%) | 88 (6.7%) |
| 4:00 PM to 11:59 PM | 94 (6.3%) | 31 (2.4%) |
| Total | 1,488 (100.0%) | 1,318 (100.0%) |
Housing Occupancy in Bellevue
Occupancy by Ownership in Bellevue
Of the total 2,716 dwellings in Bellevue, owner-occupied units account for 1,749 (64.4%), while renter-occupied units make up 967 (35.6%).
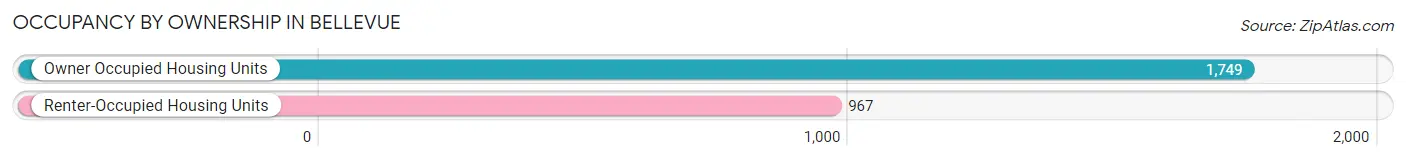
| Occupancy | # Housing Units | % Housing Units |
| Owner Occupied Housing Units | 1,749 | 64.4% |
| Renter-Occupied Housing Units | 967 | 35.6% |
| Total Occupied Housing Units | 2,716 | 100.0% |
Occupancy by Household Size in Bellevue
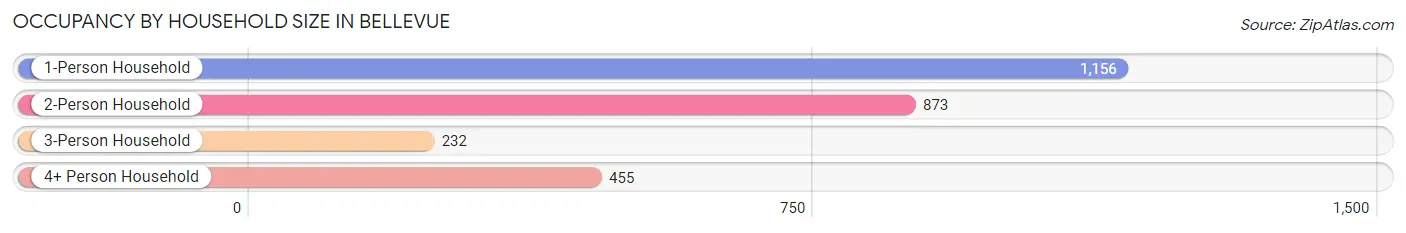
| Household Size | # Housing Units | % Housing Units |
| 1-Person Household | 1,156 | 42.6% |
| 2-Person Household | 873 | 32.1% |
| 3-Person Household | 232 | 8.5% |
| 4+ Person Household | 455 | 16.8% |
| Total Housing Units | 2,716 | 100.0% |
Occupancy by Ownership by Household Size in Bellevue
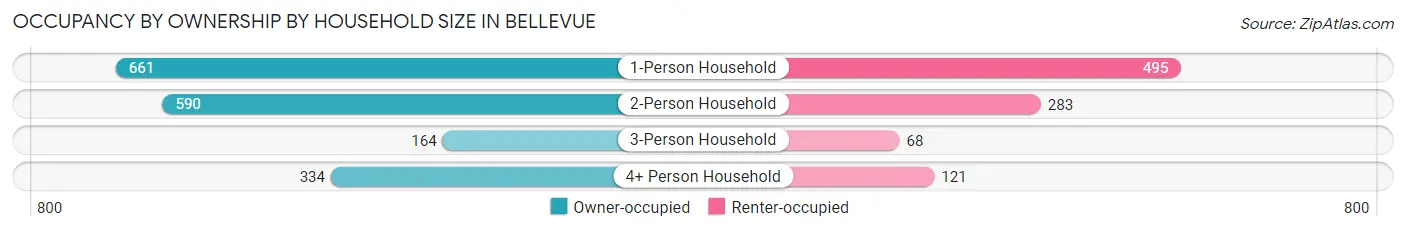
| Household Size | Owner-occupied | Renter-occupied |
| 1-Person Household | 661 (57.2%) | 495 (42.8%) |
| 2-Person Household | 590 (67.6%) | 283 (32.4%) |
| 3-Person Household | 164 (70.7%) | 68 (29.3%) |
| 4+ Person Household | 334 (73.4%) | 121 (26.6%) |
| Total Housing Units | 1,749 (64.4%) | 967 (35.6%) |
Occupancy by Educational Attainment in Bellevue
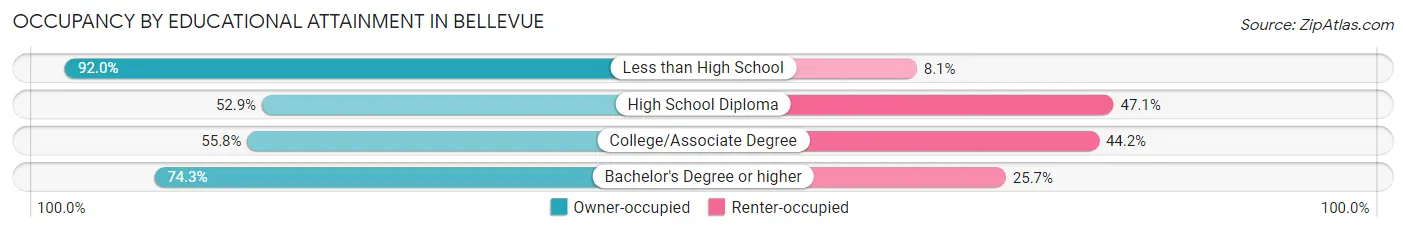
| Household Size | Owner-occupied | Renter-occupied |
| Less than High School | 80 (91.9%) | 7 (8.1%) |
| High School Diploma | 351 (52.9%) | 312 (47.1%) |
| College/Associate Degree | 431 (55.8%) | 341 (44.2%) |
| Bachelor's Degree or higher | 887 (74.3%) | 307 (25.7%) |
Occupancy by Age of Householder in Bellevue
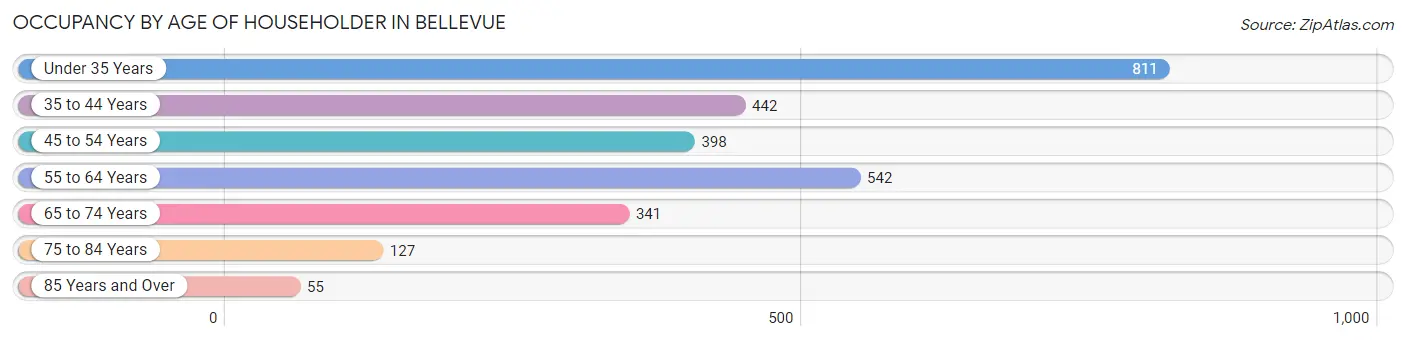
| Age Bracket | # Households | % Households |
| Under 35 Years | 811 | 29.9% |
| 35 to 44 Years | 442 | 16.3% |
| 45 to 54 Years | 398 | 14.6% |
| 55 to 64 Years | 542 | 20.0% |
| 65 to 74 Years | 341 | 12.6% |
| 75 to 84 Years | 127 | 4.7% |
| 85 Years and Over | 55 | 2.0% |
| Total | 2,716 | 100.0% |
Housing Finances in Bellevue
Median Income by Occupancy in Bellevue
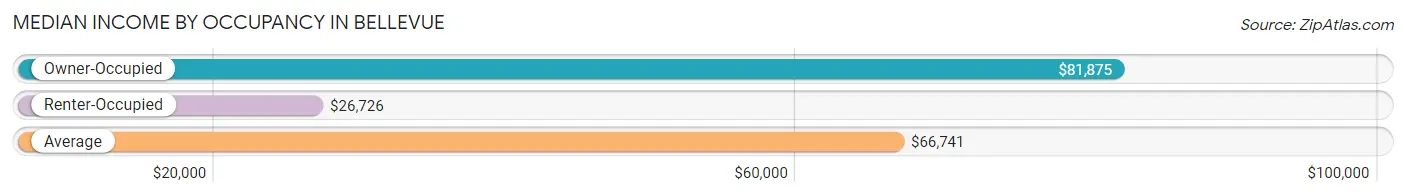
| Occupancy Type | # Households | Median Income |
| Owner-Occupied | 1,749 (64.4%) | $81,875 |
| Renter-Occupied | 967 (35.6%) | $26,726 |
| Average | 2,716 (100.0%) | $66,741 |
Occupancy by Householder Income Bracket in Bellevue
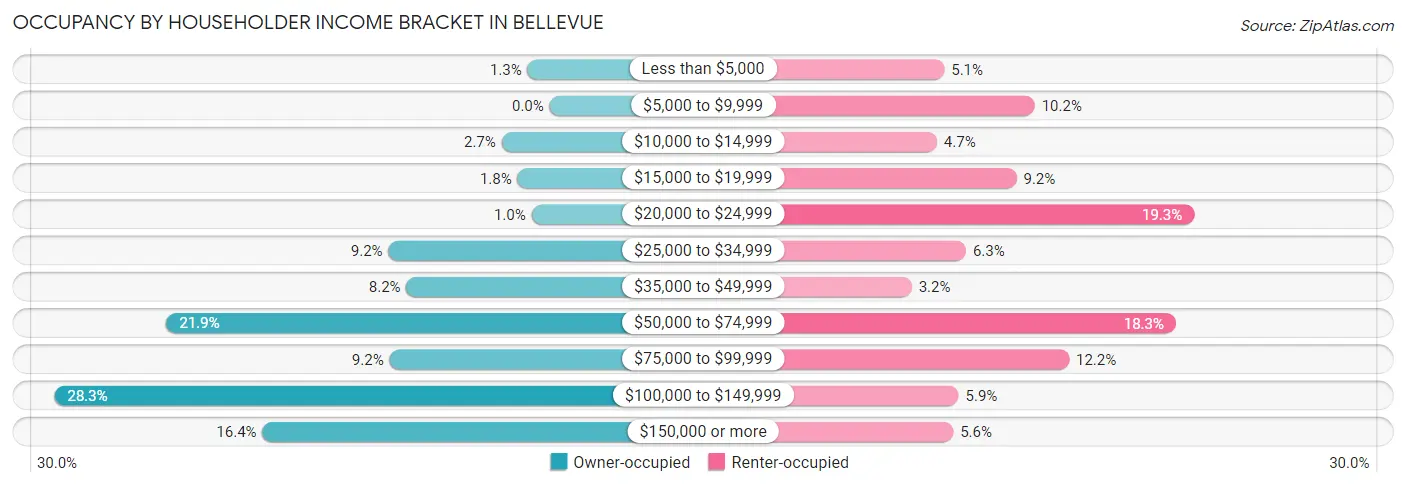
| Income Bracket | Owner-occupied | Renter-occupied |
| Less than $5,000 | 22 (1.3%) | 49 (5.1%) |
| $5,000 to $9,999 | 0 (0.0%) | 99 (10.2%) |
| $10,000 to $14,999 | 48 (2.7%) | 45 (4.6%) |
| $15,000 to $19,999 | 32 (1.8%) | 89 (9.2%) |
| $20,000 to $24,999 | 18 (1.0%) | 187 (19.3%) |
| $25,000 to $34,999 | 161 (9.2%) | 61 (6.3%) |
| $35,000 to $49,999 | 143 (8.2%) | 31 (3.2%) |
| $50,000 to $74,999 | 383 (21.9%) | 177 (18.3%) |
| $75,000 to $99,999 | 160 (9.1%) | 118 (12.2%) |
| $100,000 to $149,999 | 495 (28.3%) | 57 (5.9%) |
| $150,000 or more | 287 (16.4%) | 54 (5.6%) |
| Total | 1,749 (100.0%) | 967 (100.0%) |
Monthly Housing Cost Tiers in Bellevue
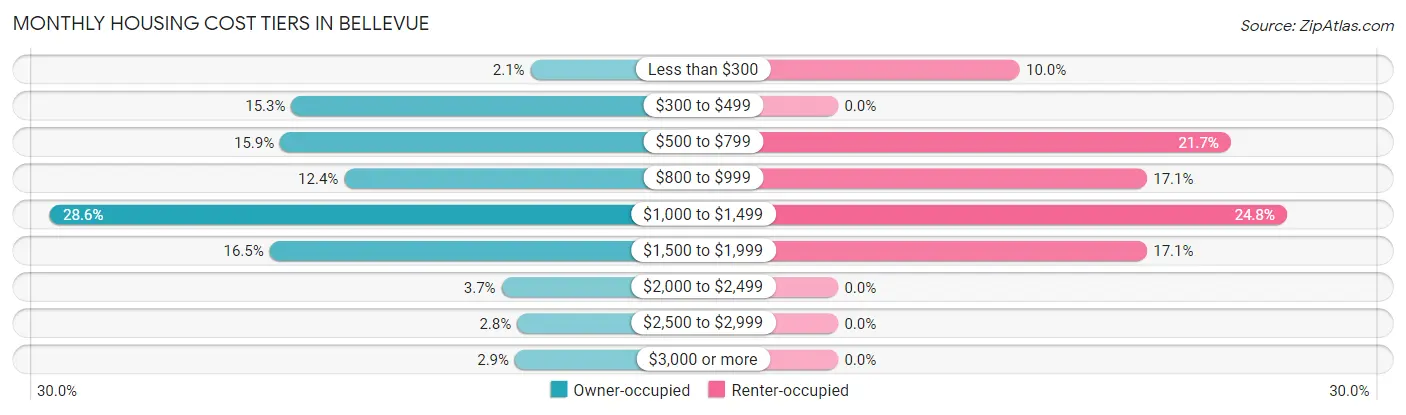
| Monthly Cost | Owner-occupied | Renter-occupied |
| Less than $300 | 36 (2.1%) | 97 (10.0%) |
| $300 to $499 | 267 (15.3%) | 0 (0.0%) |
| $500 to $799 | 278 (15.9%) | 210 (21.7%) |
| $800 to $999 | 216 (12.3%) | 165 (17.1%) |
| $1,000 to $1,499 | 500 (28.6%) | 240 (24.8%) |
| $1,500 to $1,999 | 288 (16.5%) | 165 (17.1%) |
| $2,000 to $2,499 | 64 (3.7%) | 0 (0.0%) |
| $2,500 to $2,999 | 49 (2.8%) | 0 (0.0%) |
| $3,000 or more | 51 (2.9%) | 0 (0.0%) |
| Total | 1,749 (100.0%) | 967 (100.0%) |
Physical Housing Characteristics in Bellevue
Housing Structures in Bellevue
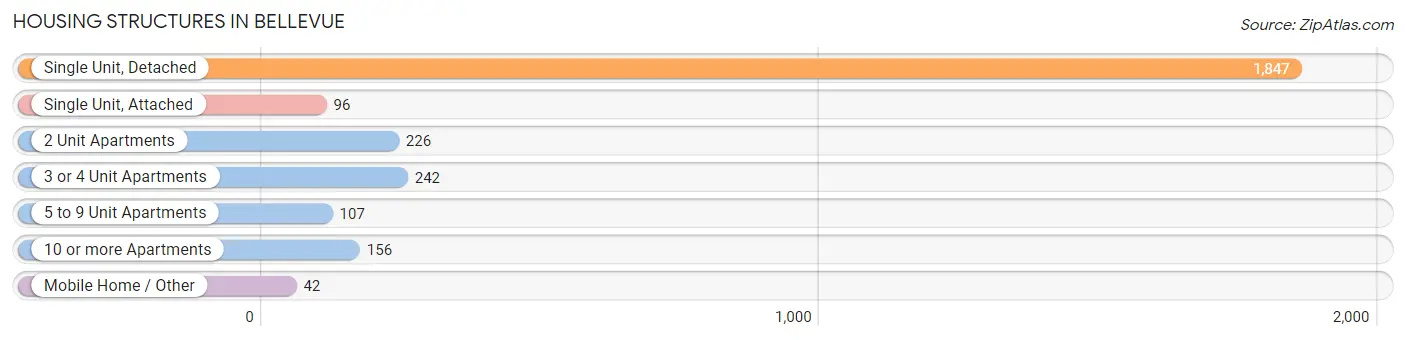
| Structure Type | # Housing Units | % Housing Units |
| Single Unit, Detached | 1,847 | 68.0% |
| Single Unit, Attached | 96 | 3.5% |
| 2 Unit Apartments | 226 | 8.3% |
| 3 or 4 Unit Apartments | 242 | 8.9% |
| 5 to 9 Unit Apartments | 107 | 3.9% |
| 10 or more Apartments | 156 | 5.7% |
| Mobile Home / Other | 42 | 1.5% |
| Total | 2,716 | 100.0% |
Housing Structures by Occupancy in Bellevue
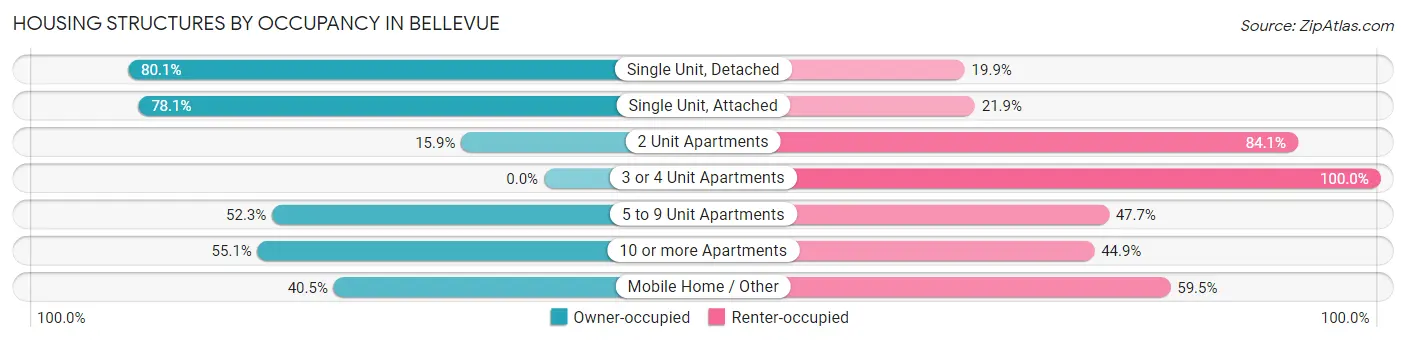
| Structure Type | Owner-occupied | Renter-occupied |
| Single Unit, Detached | 1,479 (80.1%) | 368 (19.9%) |
| Single Unit, Attached | 75 (78.1%) | 21 (21.9%) |
| 2 Unit Apartments | 36 (15.9%) | 190 (84.1%) |
| 3 or 4 Unit Apartments | 0 (0.0%) | 242 (100.0%) |
| 5 to 9 Unit Apartments | 56 (52.3%) | 51 (47.7%) |
| 10 or more Apartments | 86 (55.1%) | 70 (44.9%) |
| Mobile Home / Other | 17 (40.5%) | 25 (59.5%) |
| Total | 1,749 (64.4%) | 967 (35.6%) |
Housing Structures by Number of Rooms in Bellevue
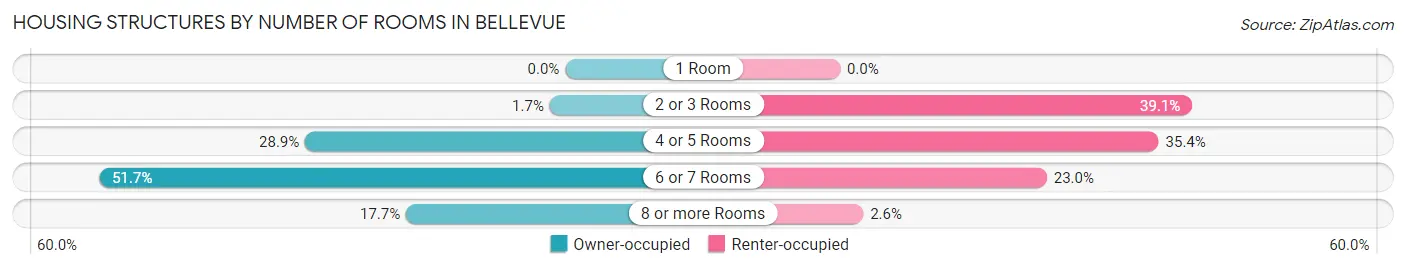
| Number of Rooms | Owner-occupied | Renter-occupied |
| 1 Room | 0 (0.0%) | 0 (0.0%) |
| 2 or 3 Rooms | 30 (1.7%) | 378 (39.1%) |
| 4 or 5 Rooms | 505 (28.9%) | 342 (35.4%) |
| 6 or 7 Rooms | 905 (51.7%) | 222 (23.0%) |
| 8 or more Rooms | 309 (17.7%) | 25 (2.6%) |
| Total | 1,749 (100.0%) | 967 (100.0%) |
Housing Structure by Heating Type in Bellevue
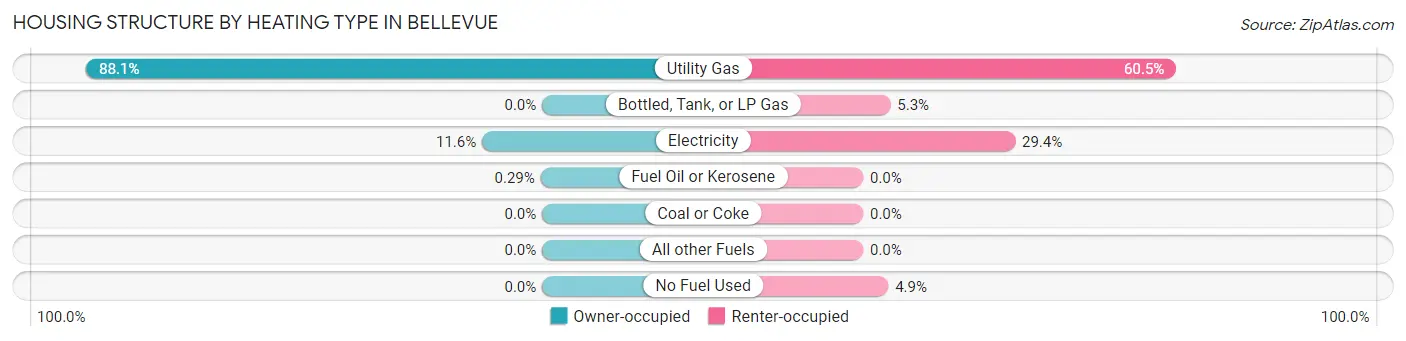
| Heating Type | Owner-occupied | Renter-occupied |
| Utility Gas | 1,541 (88.1%) | 585 (60.5%) |
| Bottled, Tank, or LP Gas | 0 (0.0%) | 51 (5.3%) |
| Electricity | 203 (11.6%) | 284 (29.4%) |
| Fuel Oil or Kerosene | 5 (0.3%) | 0 (0.0%) |
| Coal or Coke | 0 (0.0%) | 0 (0.0%) |
| All other Fuels | 0 (0.0%) | 0 (0.0%) |
| No Fuel Used | 0 (0.0%) | 47 (4.9%) |
| Total | 1,749 (100.0%) | 967 (100.0%) |
Household Vehicle Usage in Bellevue
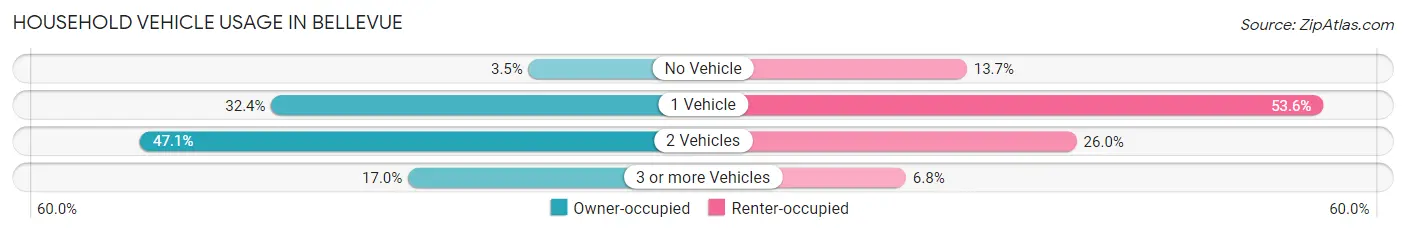
| Vehicles per Household | Owner-occupied | Renter-occupied |
| No Vehicle | 62 (3.5%) | 132 (13.7%) |
| 1 Vehicle | 566 (32.4%) | 518 (53.6%) |
| 2 Vehicles | 823 (47.1%) | 251 (26.0%) |
| 3 or more Vehicles | 298 (17.0%) | 66 (6.8%) |
| Total | 1,749 (100.0%) | 967 (100.0%) |
Real Estate & Mortgages in Bellevue
Real Estate and Mortgage Overview in Bellevue
| Characteristic | Without Mortgage | With Mortgage |
| Housing Units | 620 | 1,129 |
| Median Property Value | $116,700 | $193,600 |
| Median Household Income | $69,138 | $218 |
| Monthly Housing Costs | $507 | $51 |
| Real Estate Taxes | $1,838 | $7 |
Property Value by Mortgage Status in Bellevue
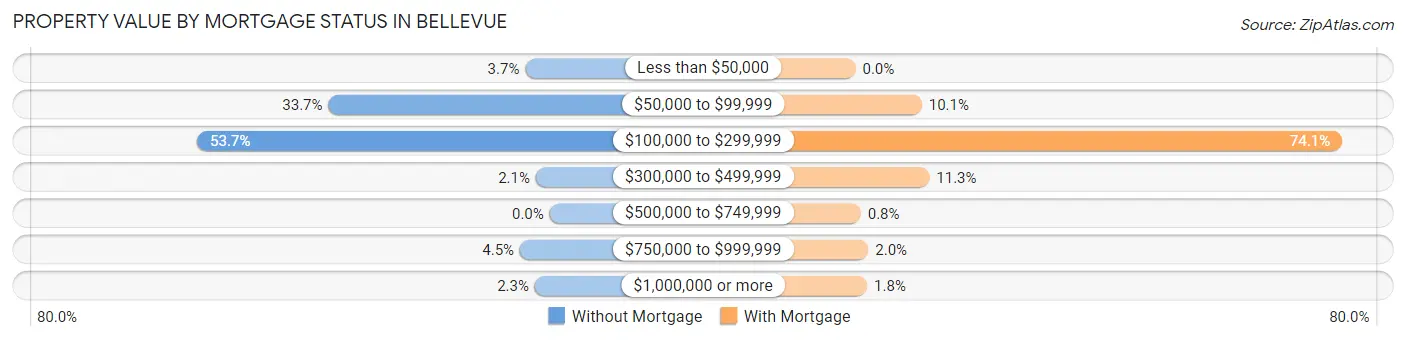
| Property Value | Without Mortgage | With Mortgage |
| Less than $50,000 | 23 (3.7%) | 0 (0.0%) |
| $50,000 to $99,999 | 209 (33.7%) | 114 (10.1%) |
| $100,000 to $299,999 | 333 (53.7%) | 837 (74.1%) |
| $300,000 to $499,999 | 13 (2.1%) | 127 (11.3%) |
| $500,000 to $749,999 | 0 (0.0%) | 9 (0.8%) |
| $750,000 to $999,999 | 28 (4.5%) | 22 (1.9%) |
| $1,000,000 or more | 14 (2.3%) | 20 (1.8%) |
| Total | 620 (100.0%) | 1,129 (100.0%) |
Household Income by Mortgage Status in Bellevue
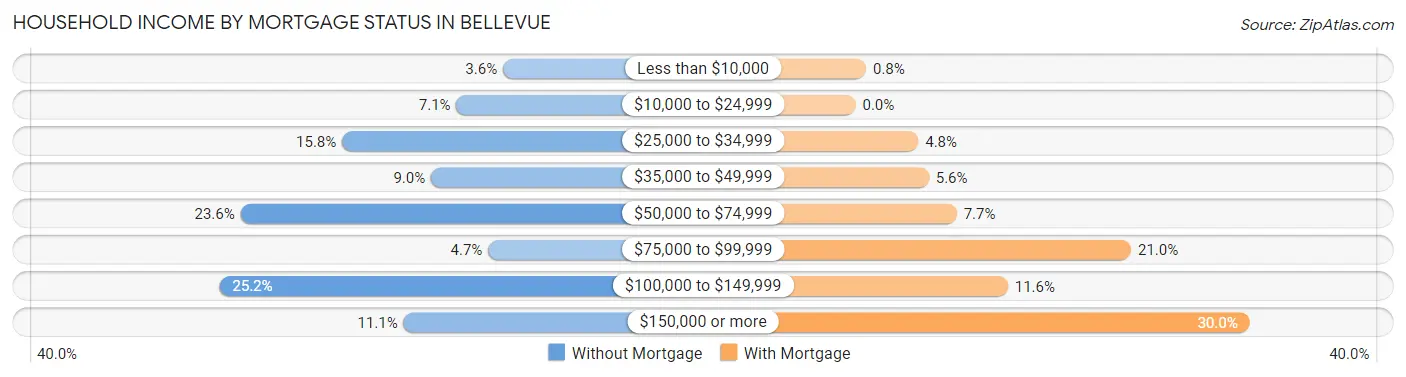
| Household Income | Without Mortgage | With Mortgage |
| Less than $10,000 | 22 (3.5%) | 9 (0.8%) |
| $10,000 to $24,999 | 44 (7.1%) | 0 (0.0%) |
| $25,000 to $34,999 | 98 (15.8%) | 54 (4.8%) |
| $35,000 to $49,999 | 56 (9.0%) | 63 (5.6%) |
| $50,000 to $74,999 | 146 (23.5%) | 87 (7.7%) |
| $75,000 to $99,999 | 29 (4.7%) | 237 (21.0%) |
| $100,000 to $149,999 | 156 (25.2%) | 131 (11.6%) |
| $150,000 or more | 69 (11.1%) | 339 (30.0%) |
| Total | 620 (100.0%) | 1,129 (100.0%) |
Property Value to Household Income Ratio in Bellevue
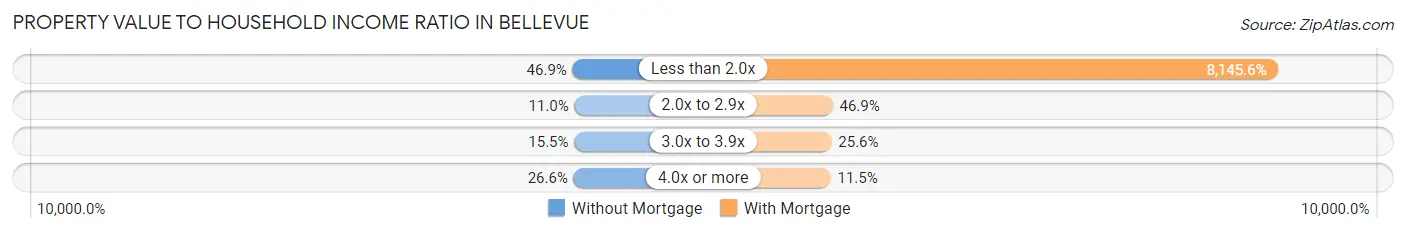
| Value-to-Income Ratio | Without Mortgage | With Mortgage |
| Less than 2.0x | 291 (46.9%) | 91,964 (8,145.6%) |
| 2.0x to 2.9x | 68 (11.0%) | 529 (46.9%) |
| 3.0x to 3.9x | 96 (15.5%) | 289 (25.6%) |
| 4.0x or more | 165 (26.6%) | 130 (11.5%) |
| Total | 620 (100.0%) | 1,129 (100.0%) |
Real Estate Taxes by Mortgage Status in Bellevue
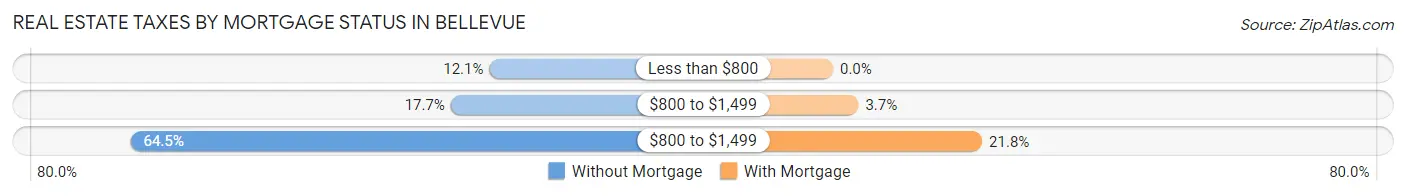
| Property Taxes | Without Mortgage | With Mortgage |
| Less than $800 | 75 (12.1%) | 0 (0.0%) |
| $800 to $1,499 | 110 (17.7%) | 42 (3.7%) |
| $800 to $1,499 | 400 (64.5%) | 246 (21.8%) |
| Total | 620 (100.0%) | 1,129 (100.0%) |
Health & Disability in Bellevue
Health Insurance Coverage by Age in Bellevue
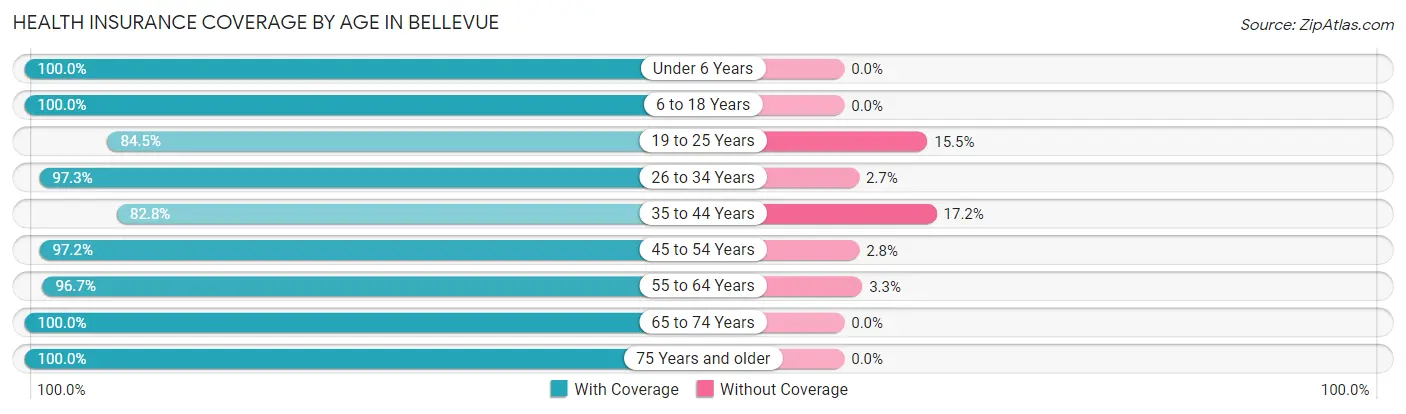
| Age Bracket | With Coverage | Without Coverage |
| Under 6 Years | 462 (100.0%) | 0 (0.0%) |
| 6 to 18 Years | 552 (100.0%) | 0 (0.0%) |
| 19 to 25 Years | 344 (84.5%) | 63 (15.5%) |
| 26 to 34 Years | 1,170 (97.3%) | 33 (2.7%) |
| 35 to 44 Years | 673 (82.8%) | 140 (17.2%) |
| 45 to 54 Years | 624 (97.2%) | 18 (2.8%) |
| 55 to 64 Years | 724 (96.7%) | 25 (3.3%) |
| 65 to 74 Years | 491 (100.0%) | 0 (0.0%) |
| 75 Years and older | 277 (100.0%) | 0 (0.0%) |
| Total | 5,317 (95.0%) | 279 (5.0%) |
Health Insurance Coverage by Citizenship Status in Bellevue
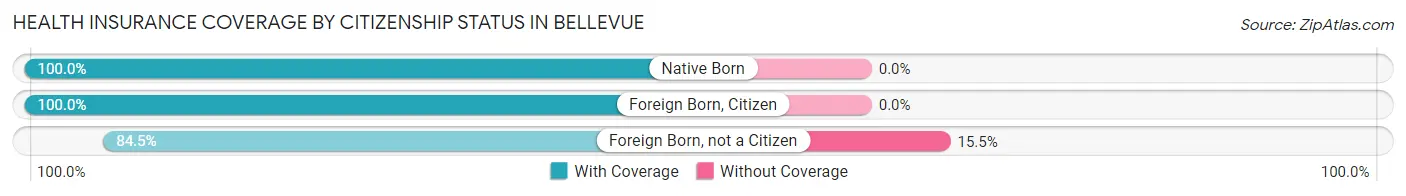
| Citizenship Status | With Coverage | Without Coverage |
| Native Born | 462 (100.0%) | 0 (0.0%) |
| Foreign Born, Citizen | 552 (100.0%) | 0 (0.0%) |
| Foreign Born, not a Citizen | 344 (84.5%) | 63 (15.5%) |
Health Insurance Coverage by Household Income in Bellevue
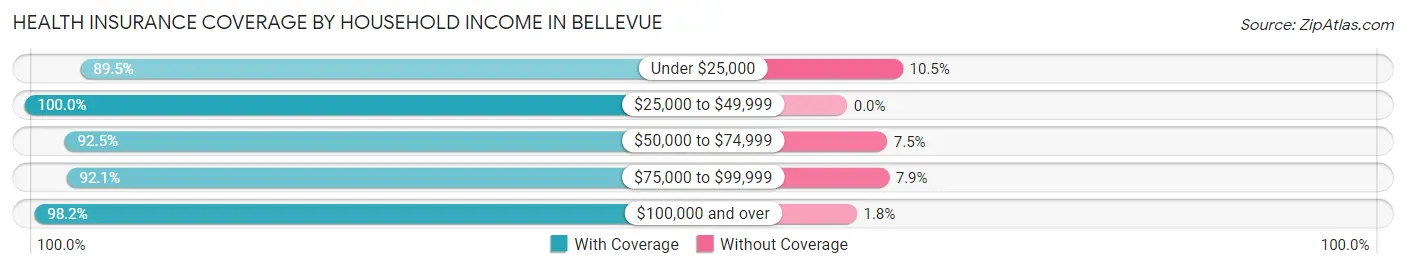
| Household Income | With Coverage | Without Coverage |
| Under $25,000 | 753 (89.5%) | 88 (10.5%) |
| $25,000 to $49,999 | 634 (100.0%) | 0 (0.0%) |
| $50,000 to $74,999 | 973 (92.5%) | 79 (7.5%) |
| $75,000 to $99,999 | 854 (92.1%) | 73 (7.9%) |
| $100,000 and over | 2,103 (98.2%) | 39 (1.8%) |
Public vs Private Health Insurance Coverage by Age in Bellevue
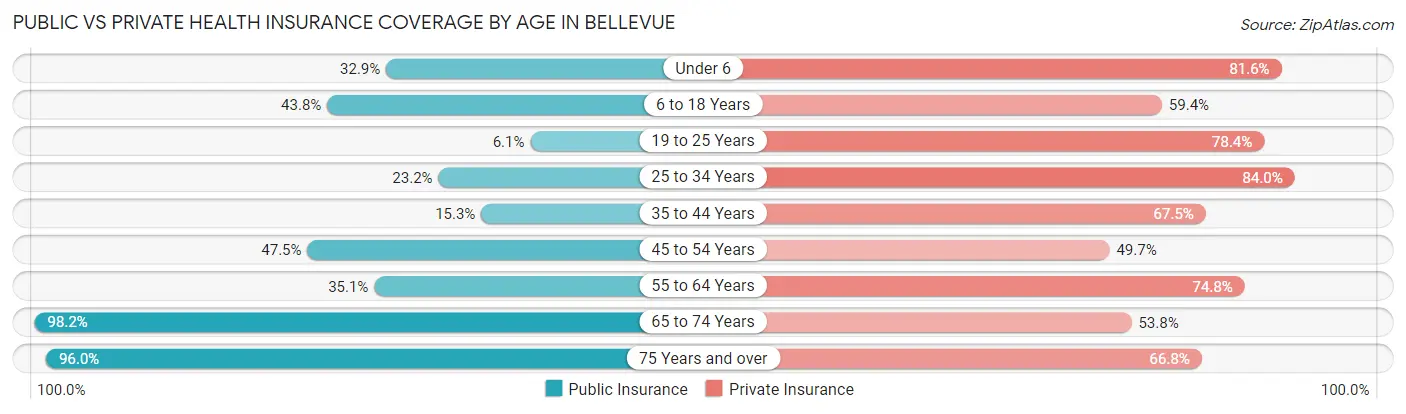
| Age Bracket | Public Insurance | Private Insurance |
| Under 6 | 152 (32.9%) | 377 (81.6%) |
| 6 to 18 Years | 242 (43.8%) | 328 (59.4%) |
| 19 to 25 Years | 25 (6.1%) | 319 (78.4%) |
| 25 to 34 Years | 279 (23.2%) | 1,011 (84.0%) |
| 35 to 44 Years | 124 (15.2%) | 549 (67.5%) |
| 45 to 54 Years | 305 (47.5%) | 319 (49.7%) |
| 55 to 64 Years | 263 (35.1%) | 560 (74.8%) |
| 65 to 74 Years | 482 (98.2%) | 264 (53.8%) |
| 75 Years and over | 266 (96.0%) | 185 (66.8%) |
| Total | 2,138 (38.2%) | 3,912 (69.9%) |
Disability Status by Sex by Age in Bellevue
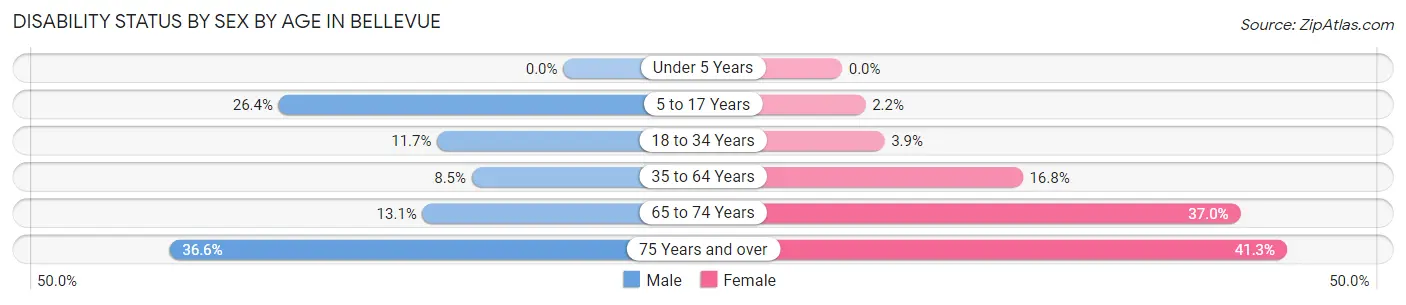
| Age Bracket | Male | Female |
| Under 5 Years | 0 (0.0%) | 0 (0.0%) |
| 5 to 17 Years | 75 (26.4%) | 6 (2.2%) |
| 18 to 34 Years | 93 (11.7%) | 34 (3.9%) |
| 35 to 64 Years | 101 (8.5%) | 170 (16.8%) |
| 65 to 74 Years | 32 (13.1%) | 91 (37.0%) |
| 75 Years and over | 34 (36.6%) | 76 (41.3%) |
Disability Class by Sex by Age in Bellevue
Disability Class: Hearing Difficulty
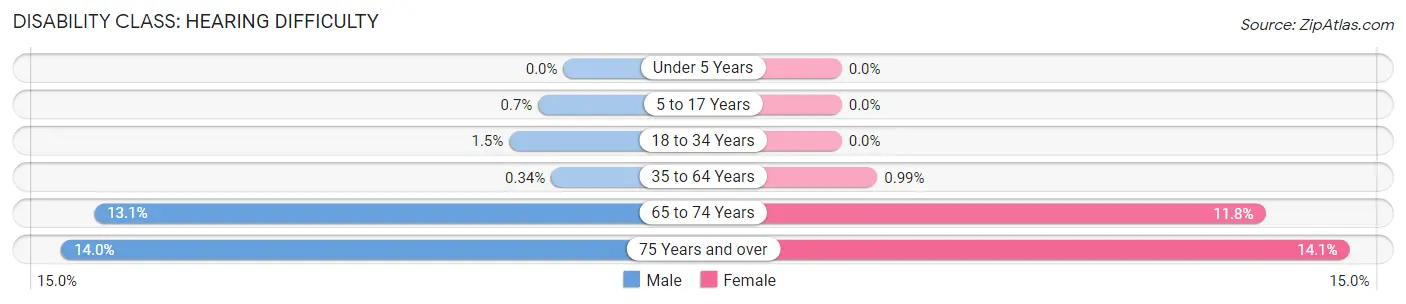
| Age Bracket | Male | Female |
| Under 5 Years | 0 (0.0%) | 0 (0.0%) |
| 5 to 17 Years | 2 (0.7%) | 0 (0.0%) |
| 18 to 34 Years | 12 (1.5%) | 0 (0.0%) |
| 35 to 64 Years | 4 (0.3%) | 10 (1.0%) |
| 65 to 74 Years | 32 (13.1%) | 29 (11.8%) |
| 75 Years and over | 13 (14.0%) | 26 (14.1%) |
Disability Class: Vision Difficulty
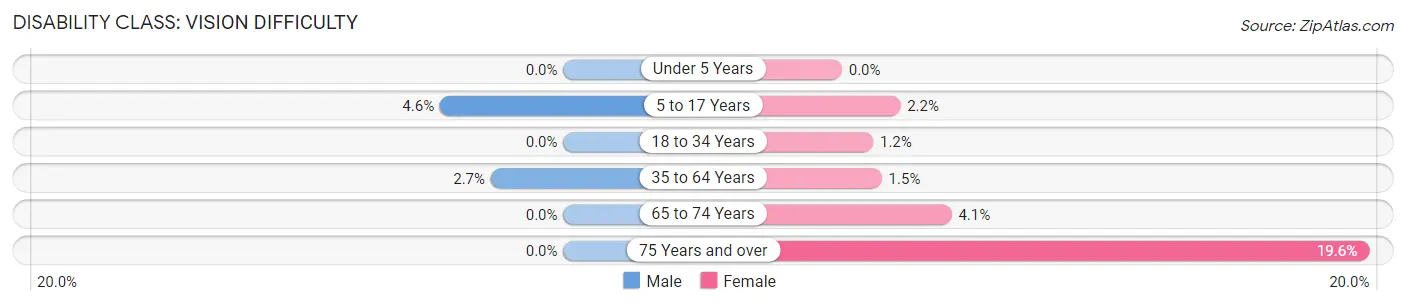
| Age Bracket | Male | Female |
| Under 5 Years | 0 (0.0%) | 0 (0.0%) |
| 5 to 17 Years | 13 (4.6%) | 6 (2.2%) |
| 18 to 34 Years | 0 (0.0%) | 10 (1.2%) |
| 35 to 64 Years | 32 (2.7%) | 15 (1.5%) |
| 65 to 74 Years | 0 (0.0%) | 10 (4.1%) |
| 75 Years and over | 0 (0.0%) | 36 (19.6%) |
Disability Class: Cognitive Difficulty
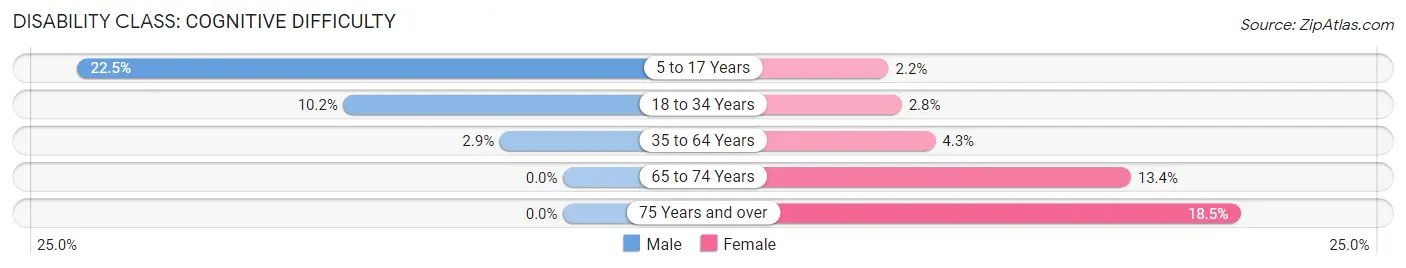
| Age Bracket | Male | Female |
| 5 to 17 Years | 64 (22.5%) | 6 (2.2%) |
| 18 to 34 Years | 81 (10.2%) | 24 (2.8%) |
| 35 to 64 Years | 35 (2.9%) | 44 (4.3%) |
| 65 to 74 Years | 0 (0.0%) | 33 (13.4%) |
| 75 Years and over | 0 (0.0%) | 34 (18.5%) |
Disability Class: Ambulatory Difficulty
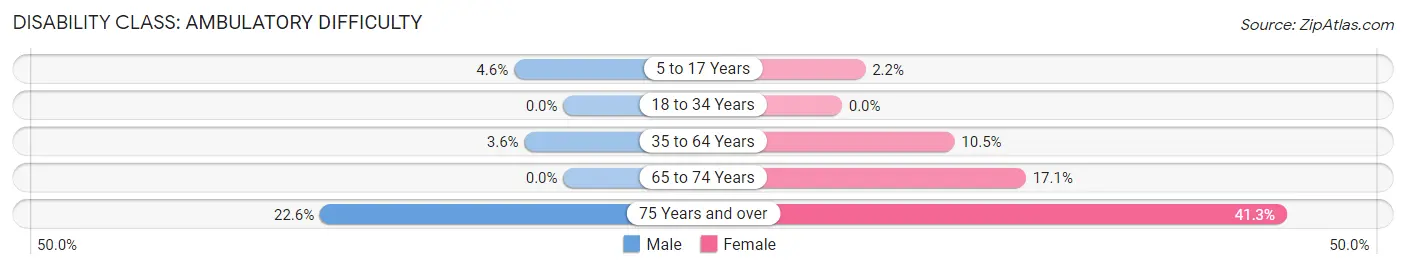
| Age Bracket | Male | Female |
| 5 to 17 Years | 13 (4.6%) | 6 (2.2%) |
| 18 to 34 Years | 0 (0.0%) | 0 (0.0%) |
| 35 to 64 Years | 43 (3.6%) | 106 (10.4%) |
| 65 to 74 Years | 0 (0.0%) | 42 (17.1%) |
| 75 Years and over | 21 (22.6%) | 76 (41.3%) |
Disability Class: Self-Care Difficulty
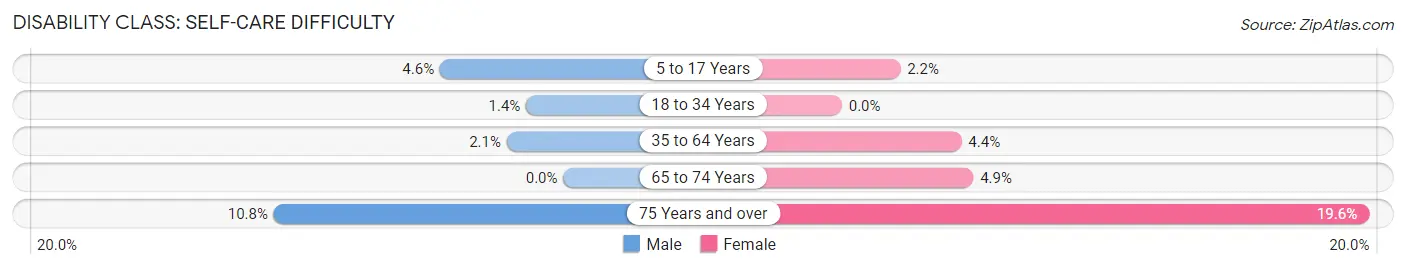
| Age Bracket | Male | Female |
| 5 to 17 Years | 13 (4.6%) | 6 (2.2%) |
| 18 to 34 Years | 11 (1.4%) | 0 (0.0%) |
| 35 to 64 Years | 25 (2.1%) | 45 (4.4%) |
| 65 to 74 Years | 0 (0.0%) | 12 (4.9%) |
| 75 Years and over | 10 (10.7%) | 36 (19.6%) |
Technology Access in Bellevue
Computing Device Access in Bellevue
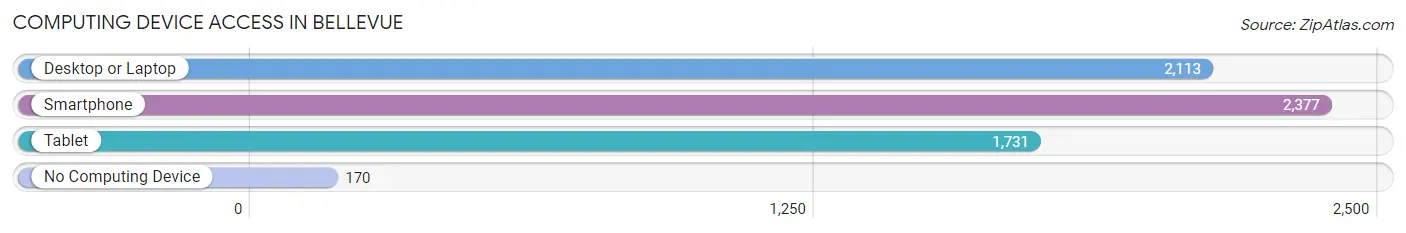
| Device Type | # Households | % Households |
| Desktop or Laptop | 2,113 | 77.8% |
| Smartphone | 2,377 | 87.5% |
| Tablet | 1,731 | 63.7% |
| No Computing Device | 170 | 6.3% |
| Total | 2,716 | 100.0% |
Internet Access in Bellevue
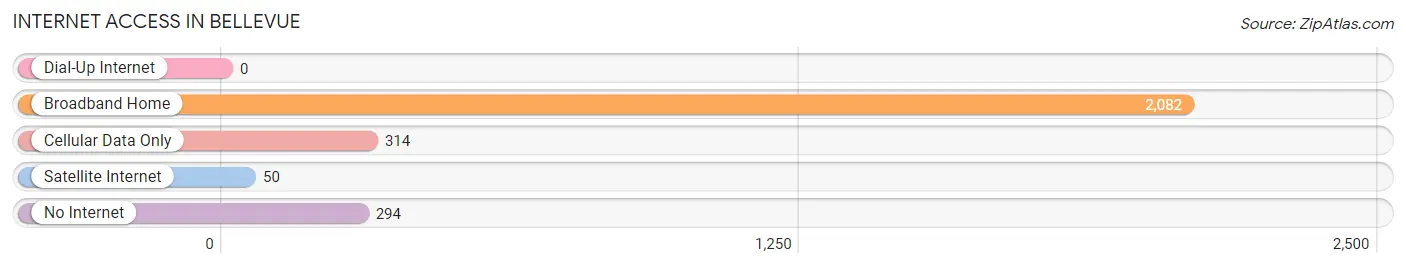
| Internet Type | # Households | % Households |
| Dial-Up Internet | 0 | 0.0% |
| Broadband Home | 2,082 | 76.7% |
| Cellular Data Only | 314 | 11.6% |
| Satellite Internet | 50 | 1.8% |
| No Internet | 294 | 10.8% |
| Total | 2,716 | 100.0% |
Bellevue Summary
Bellevue is a city located in Campbell County, Kentucky, United States. It is located along the Ohio River, directly across from Cincinnati, Ohio. The population was 5,955 at the 2010 census. It is one of the oldest cities in Northern Kentucky, having been founded in 1792.
History
Bellevue was founded in 1792 by a group of settlers from Pennsylvania. The city was named after the French term for “beautiful view” due to its location on a hill overlooking the Ohio River. The city was incorporated in 1815 and was the first city in Campbell County.
Bellevue was a major port city in the 19th century, with a large number of steamboats and ferries operating on the Ohio River. The city was also a major center for the production of whiskey and other spirits. In the late 19th century, Bellevue was a popular destination for wealthy Cincinnatians, who built large summer homes in the city.
In the early 20th century, Bellevue was a major center for the production of automobiles. The city was home to the Bellevue Motor Car Company, which produced cars from 1910 to 1915. The company was eventually bought out by the Ford Motor Company.
Geography
Bellevue is located at 39°2′25″N 84°31′17″W (39.040278, -84.521389). According to the United States Census Bureau, the city has a total area of 2.2 square miles (5.7 km2), of which 2.1 square miles (5.4 km2) is land and 0.1 square miles (0.3 km2) is water.
Economy
Bellevue’s economy is largely based on the service industry. The city is home to a number of restaurants, bars, and other businesses. The city is also home to a number of manufacturing companies, including the Bellevue Manufacturing Company, which produces automotive parts.
Demographics
As of the census of 2010, there were 5,955 people, 2,541 households, and 1,541 families residing in the city. The population density was 2,817.3 people per square mile (1,091.2/km2). There were 2,841 housing units at an average density of 1,346.2 per square mile (519.7/km2). The racial makeup of the city was 92.2% White, 4.2% African American, 0.3% Native American, 0.7% Asian, 0.1% Pacific Islander, 0.7% from other races, and 1.9% from two or more races. Hispanic or Latino of any race were 2.2% of the population.
There were 2,541 households, out of which 28.2% had children under the age of 18 living with them, 39.2% were married couples living together, 15.7% had a female householder with no husband present, and 40.2% were non-families. 34.2% of all households were made up of individuals, and 12.2% had someone living alone who was 65 years of age or older. The average household size was 2.30 and the average family size was 2.94.
In the city, the population was spread out, with 24.2% under the age of 18, 8.2% from 18 to 24, 30.2% from 25 to 44, 22.3% from 45 to 64, and 15.1% who were 65 years of age or older. The median age was 36 years. For every 100 females, there were 91.2 males. For every 100 females age 18 and over, there were 87.2 males.
The median income for a household in the city was $35,938, and the median income for a family was $45,938. Males had a median income of $35,938 versus $25,938 for females. The per capita income for the city was $19,938. About 8.2% of families and 10.2% of the population were below the poverty line, including 14.2% of those under age 18 and 8.2% of those age 65 or over.
Common Questions
What is Per Capita Income in Bellevue?
Per Capita income in Bellevue is $42,898.
What is the Median Family Income in Bellevue?
Median Family Income in Bellevue is $90,292.
What is the Median Household income in Bellevue?
Median Household Income in Bellevue is $66,741.
What is Income or Wage Gap in Bellevue?
Income or Wage Gap in Bellevue is 10.9%.
Women in Bellevue earn 89.1 cents for every dollar earned by a man.
What is Inequality or Gini Index in Bellevue?
Inequality or Gini Index in Bellevue is 0.46.
What is the Total Population of Bellevue?
Total Population of Bellevue is 5,596.
What is the Total Male Population of Bellevue?
Total Male Population of Bellevue is 2,848.
What is the Total Female Population of Bellevue?
Total Female Population of Bellevue is 2,748.
What is the Ratio of Males per 100 Females in Bellevue?
There are 103.64 Males per 100 Females in Bellevue.
What is the Ratio of Females per 100 Males in Bellevue?
There are 96.49 Females per 100 Males in Bellevue.
What is the Median Population Age in Bellevue?
Median Population Age in Bellevue is 36.6 Years.
What is the Average Family Size in Bellevue
Average Family Size in Bellevue is 2.8 People.
What is the Average Household Size in Bellevue
Average Household Size in Bellevue is 2.1 People.
How Large is the Labor Force in Bellevue?
There are 3,272 People in the Labor Forcein in Bellevue.
What is the Percentage of People in the Labor Force in Bellevue?
69.6% of People are in the Labor Force in Bellevue.
What is the Unemployment Rate in Bellevue?
Unemployment Rate in Bellevue is 1.5%.