Tompkinsville, KY Map & Demographics
Tompkinsville Map
Tompkinsville Overview
$23,418
PER CAPITA INCOME
$47,679
AVG FAMILY INCOME
$36,436
AVG HOUSEHOLD INCOME
3.9%
WAGE / INCOME GAP [ % ]
96.1¢/ $1
WAGE / INCOME GAP [ $ ]
0.47
INEQUALITY / GINI INDEX
2,699
TOTAL POPULATION
1,222
MALE POPULATION
1,477
FEMALE POPULATION
82.74
MALES / 100 FEMALES
120.87
FEMALES / 100 MALES
37.7
MEDIAN AGE
2.9
AVG FAMILY SIZE
2.2
AVG HOUSEHOLD SIZE
1,159
LABOR FORCE [ PEOPLE ]
57.2%
PERCENT IN LABOR FORCE
7.8%
UNEMPLOYMENT RATE
Tompkinsville Zip Codes
Tompkinsville Area Codes
Income in Tompkinsville
Income Overview in Tompkinsville
Per Capita Income in Tompkinsville is $23,418, while median incomes of families and households are $47,679 and $36,436 respectively.
| Characteristic | Number | Measure |
| Per Capita Income | 2,699 | $23,418 |
| Median Family Income | 663 | $47,679 |
| Mean Family Income | 663 | $65,736 |
| Median Household Income | 1,138 | $36,436 |
| Mean Household Income | 1,138 | $54,084 |
| Income Deficit | 663 | $0 |
| Wage / Income Gap (%) | 2,699 | 3.94% |
| Wage / Income Gap ($) | 2,699 | 96.06¢ per $1 |
| Gini / Inequality Index | 2,699 | 0.47 |
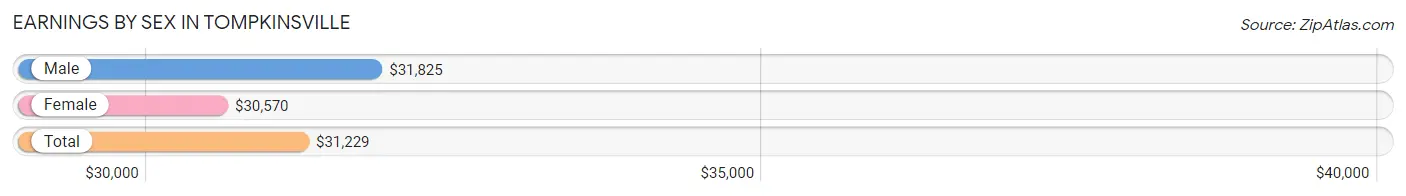
Earnings by Sex in Tompkinsville
Average Earnings in Tompkinsville are $31,229, $31,825 for men and $30,570 for women, a difference of 3.9%.
| Sex | Number | Average Earnings |
| Male | 524 (44.8%) | $31,825 |
| Female | 646 (55.2%) | $30,570 |
| Total | 1,170 (100.0%) | $31,229 |
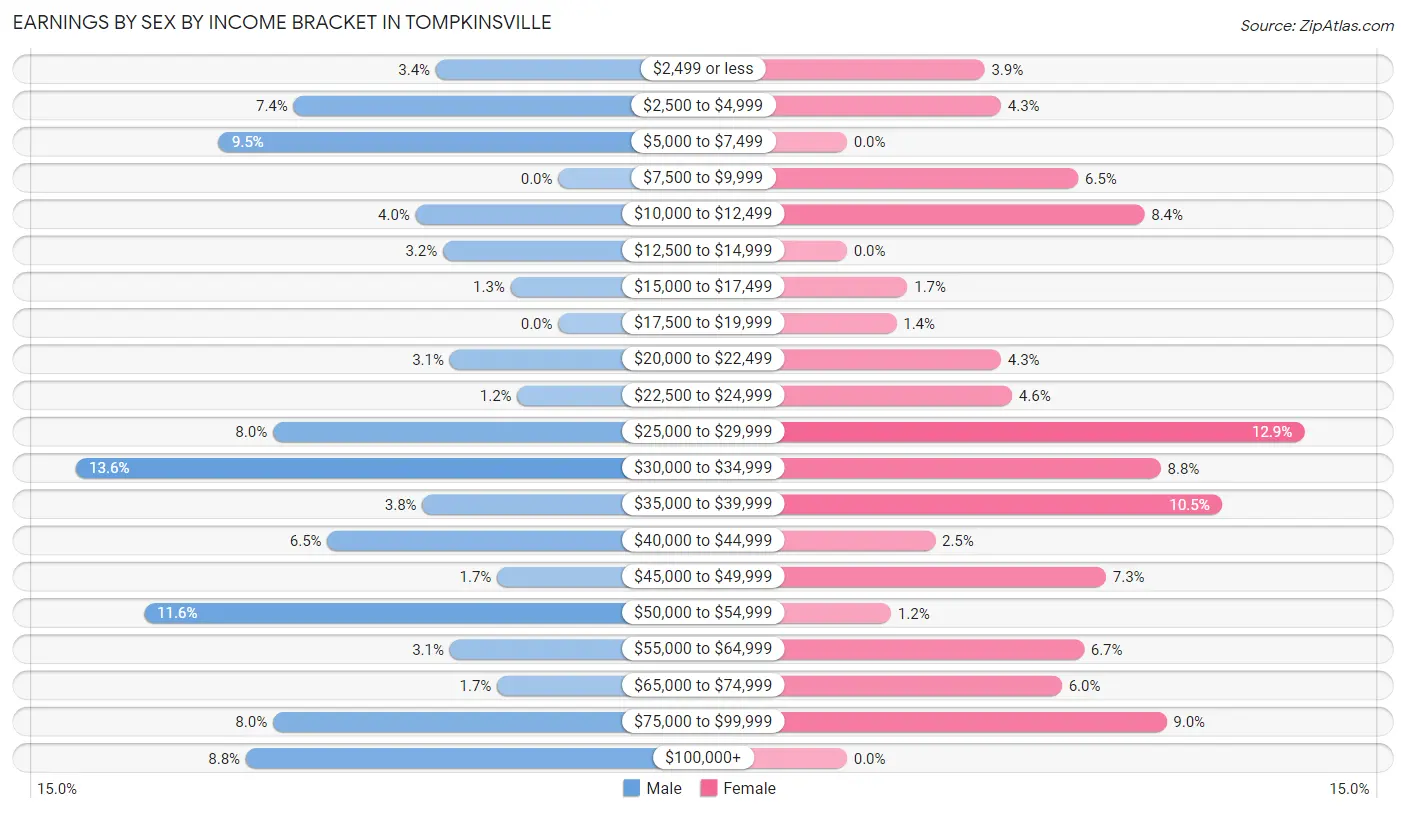
Earnings by Sex by Income Bracket in Tompkinsville
The most common earnings brackets in Tompkinsville are $30,000 to $34,999 for men (71 | 13.6%) and $25,000 to $29,999 for women (83 | 12.9%).
| Income | Male | Female |
| $2,499 or less | 18 (3.4%) | 25 (3.9%) |
| $2,500 to $4,999 | 39 (7.4%) | 28 (4.3%) |
| $5,000 to $7,499 | 50 (9.5%) | 0 (0.0%) |
| $7,500 to $9,999 | 0 (0.0%) | 42 (6.5%) |
| $10,000 to $12,499 | 21 (4.0%) | 54 (8.4%) |
| $12,500 to $14,999 | 17 (3.2%) | 0 (0.0%) |
| $15,000 to $17,499 | 7 (1.3%) | 11 (1.7%) |
| $17,500 to $19,999 | 0 (0.0%) | 9 (1.4%) |
| $20,000 to $22,499 | 16 (3.0%) | 28 (4.3%) |
| $22,500 to $24,999 | 6 (1.1%) | 30 (4.6%) |
| $25,000 to $29,999 | 42 (8.0%) | 83 (12.9%) |
| $30,000 to $34,999 | 71 (13.6%) | 57 (8.8%) |
| $35,000 to $39,999 | 20 (3.8%) | 68 (10.5%) |
| $40,000 to $44,999 | 34 (6.5%) | 16 (2.5%) |
| $45,000 to $49,999 | 9 (1.7%) | 47 (7.3%) |
| $50,000 to $54,999 | 61 (11.6%) | 8 (1.2%) |
| $55,000 to $64,999 | 16 (3.0%) | 43 (6.7%) |
| $65,000 to $74,999 | 9 (1.7%) | 39 (6.0%) |
| $75,000 to $99,999 | 42 (8.0%) | 58 (9.0%) |
| $100,000+ | 46 (8.8%) | 0 (0.0%) |
| Total | 524 (100.0%) | 646 (100.0%) |
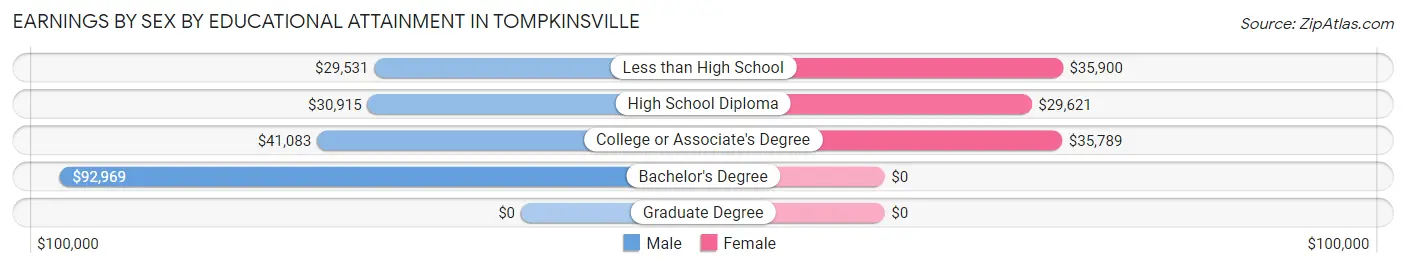
Earnings by Sex by Educational Attainment in Tompkinsville
Average earnings in Tompkinsville are $35,875 for men and $36,176 for women, a difference of 0.8%. Men with an educational attainment of bachelor's degree enjoy the highest average annual earnings of $92,969, while those with less than high school education earn the least with $29,531. Women with an educational attainment of less than high school earn the most with the average annual earnings of $35,900, while those with high school diploma education have the smallest earnings of $29,621.
| Educational Attainment | Male Income | Female Income |
| Less than High School | $29,531 | $35,900 |
| High School Diploma | $30,915 | $29,621 |
| College or Associate's Degree | $41,083 | $35,789 |
| Bachelor's Degree | $92,969 | $0 |
| Graduate Degree | - | - |
| Total | $35,875 | $36,176 |
Family Income in Tompkinsville
Family Income Brackets in Tompkinsville
According to the Tompkinsville family income data, there are 123 families falling into the $35,000 to $49,999 income range, which is the most common income bracket and makes up 18.5% of all families. Conversely, the $10,000 to $14,999 income bracket is the least frequent group with only 22 families (3.3%) belonging to this category.
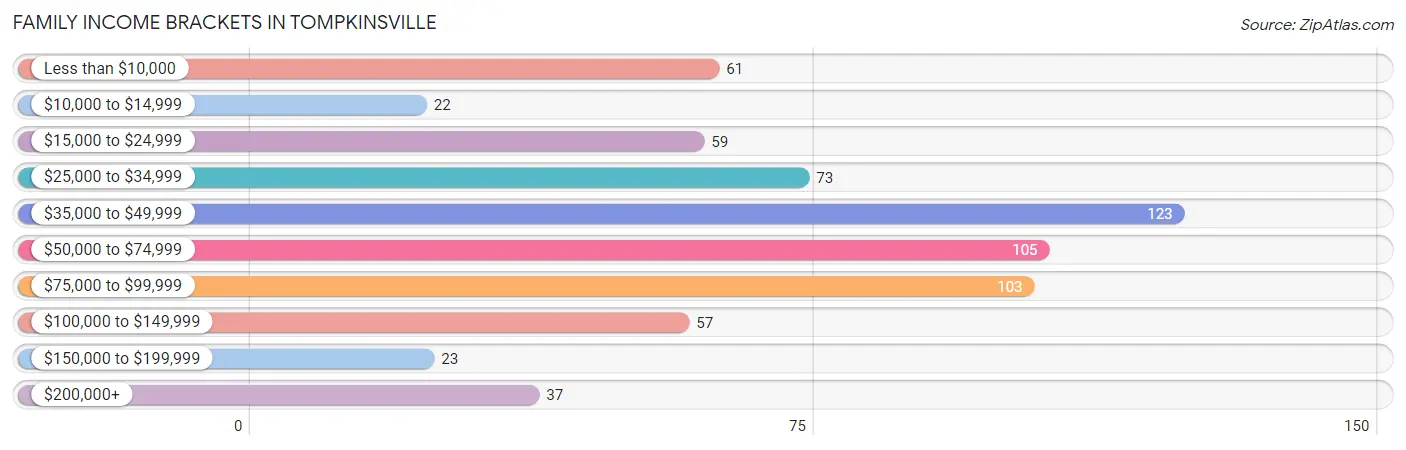
| Income Bracket | # Families | % Families |
| Less than $10,000 | 61 | 9.2% |
| $10,000 to $14,999 | 22 | 3.3% |
| $15,000 to $24,999 | 59 | 8.9% |
| $25,000 to $34,999 | 73 | 11.0% |
| $35,000 to $49,999 | 123 | 18.6% |
| $50,000 to $74,999 | 105 | 15.8% |
| $75,000 to $99,999 | 103 | 15.5% |
| $100,000 to $149,999 | 57 | 8.6% |
| $150,000 to $199,999 | 23 | 3.5% |
| $200,000+ | 37 | 5.6% |
Family Income by Famaliy Size in Tompkinsville
2-person families (298 | 45.0%) account for the highest median family income in Tompkinsville with $59,079 per family, while 2-person families (298 | 45.0%) have the highest median income of $29,540 per family member.
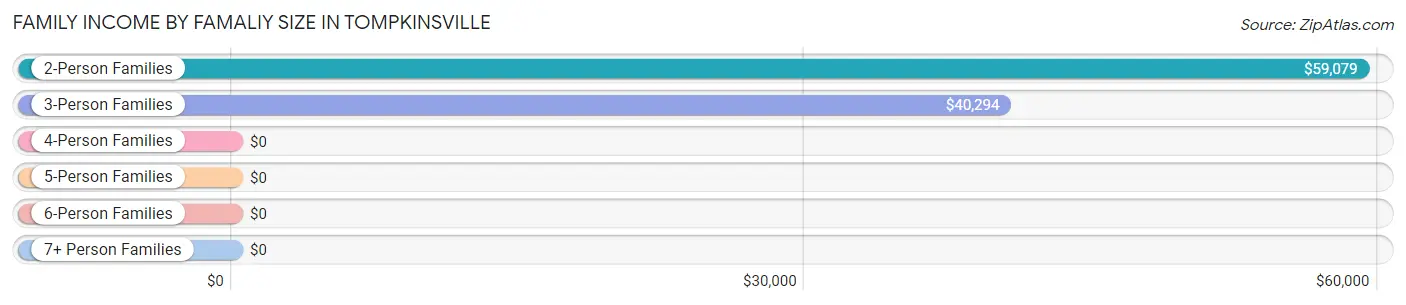
| Income Bracket | # Families | Median Income |
| 2-Person Families | 298 (45.0%) | $59,079 |
| 3-Person Families | 132 (19.9%) | $40,294 |
| 4-Person Families | 114 (17.2%) | $0 |
| 5-Person Families | 64 (9.7%) | $0 |
| 6-Person Families | 11 (1.7%) | $0 |
| 7+ Person Families | 44 (6.6%) | $0 |
| Total | 663 (100.0%) | $47,679 |
Family Income by Number of Earners in Tompkinsville
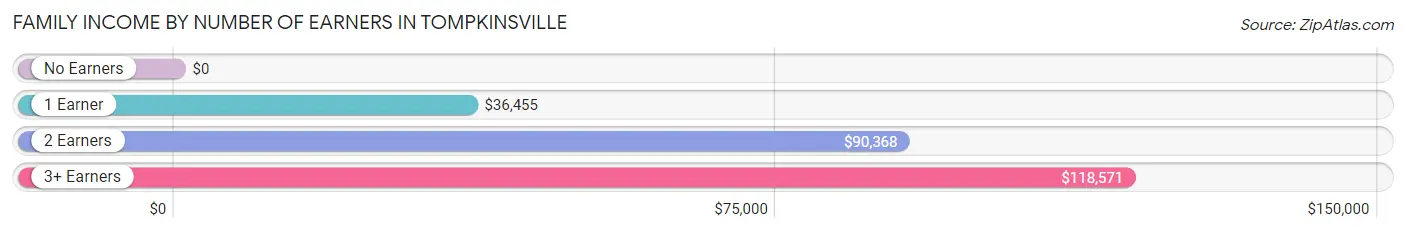
| Number of Earners | # Families | Median Income |
| No Earners | 91 (13.7%) | $0 |
| 1 Earner | 323 (48.7%) | $36,455 |
| 2 Earners | 207 (31.2%) | $90,368 |
| 3+ Earners | 42 (6.3%) | $118,571 |
| Total | 663 (100.0%) | $47,679 |
Household Income in Tompkinsville
Household Income Brackets in Tompkinsville
With 176 households falling in the category, the $75,000 to $99,999 income range is the most frequent in Tompkinsville, accounting for 15.5% of all households. In contrast, only 23 households (2.0%) fall into the $150,000 to $199,999 income bracket, making it the least populous group.
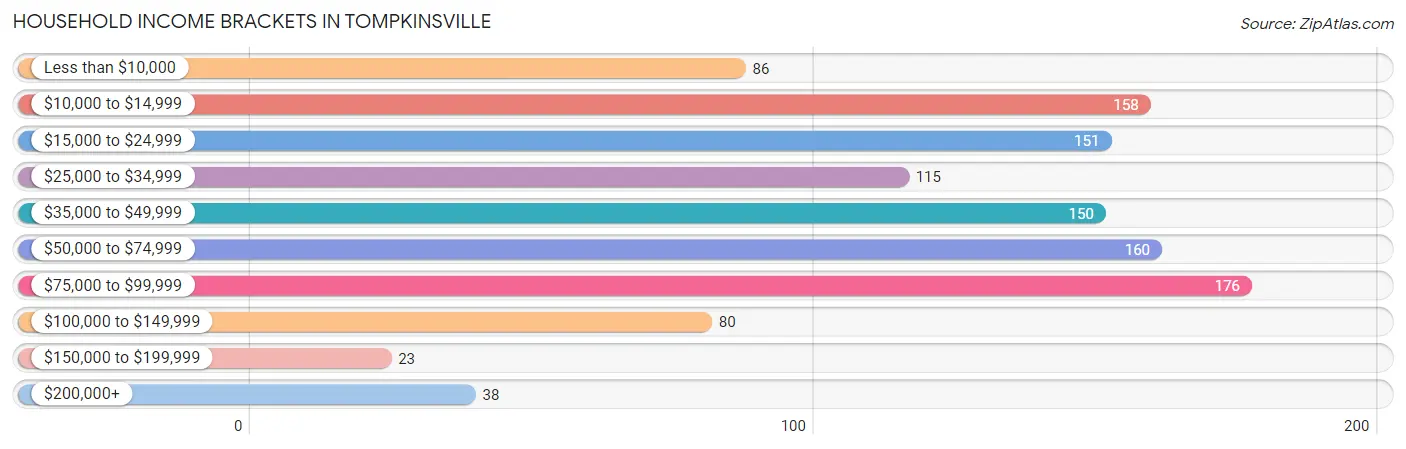
| Income Bracket | # Households | % Households |
| Less than $10,000 | 86 | 7.6% |
| $10,000 to $14,999 | 158 | 13.9% |
| $15,000 to $24,999 | 151 | 13.3% |
| $25,000 to $34,999 | 115 | 10.1% |
| $35,000 to $49,999 | 150 | 13.2% |
| $50,000 to $74,999 | 160 | 14.1% |
| $75,000 to $99,999 | 176 | 15.5% |
| $100,000 to $149,999 | 80 | 7.0% |
| $150,000 to $199,999 | 23 | 2.0% |
| $200,000+ | 38 | 3.3% |
Household Income by Householder Age in Tompkinsville
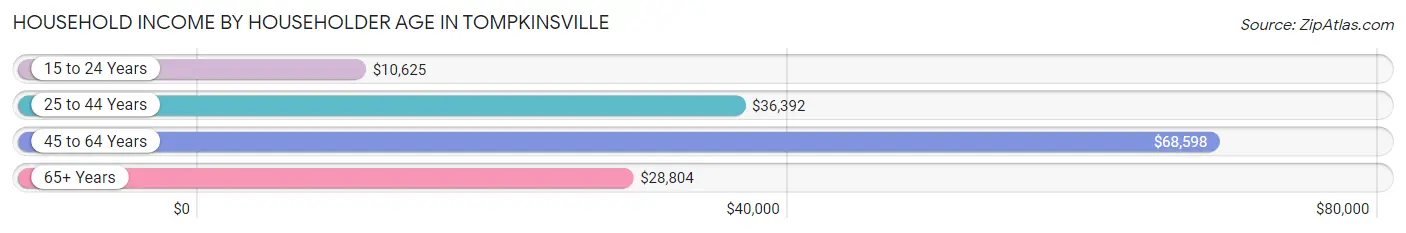
The median household income in Tompkinsville is $36,436, with the highest median household income of $68,598 found in the 45 to 64 years age bracket for the primary householder. A total of 479 households (42.1%) fall into this category. Meanwhile, the 15 to 24 years age bracket for the primary householder has the lowest median household income of $10,625, with 49 households (4.3%) in this group.
| Income Bracket | # Households | Median Income |
| 15 to 24 Years | 49 (4.3%) | $10,625 |
| 25 to 44 Years | 306 (26.9%) | $36,392 |
| 45 to 64 Years | 479 (42.1%) | $68,598 |
| 65+ Years | 304 (26.7%) | $28,804 |
| Total | 1,138 (100.0%) | $36,436 |
Poverty in Tompkinsville
Income Below Poverty by Sex and Age in Tompkinsville
With 26.1% poverty level for males and 27.8% for females among the residents of Tompkinsville, 16 and 17 year old males and 12 to 14 year old females are the most vulnerable to poverty, with 44 males (78.6%) and 38 females (63.3%) in their respective age groups living below the poverty level.
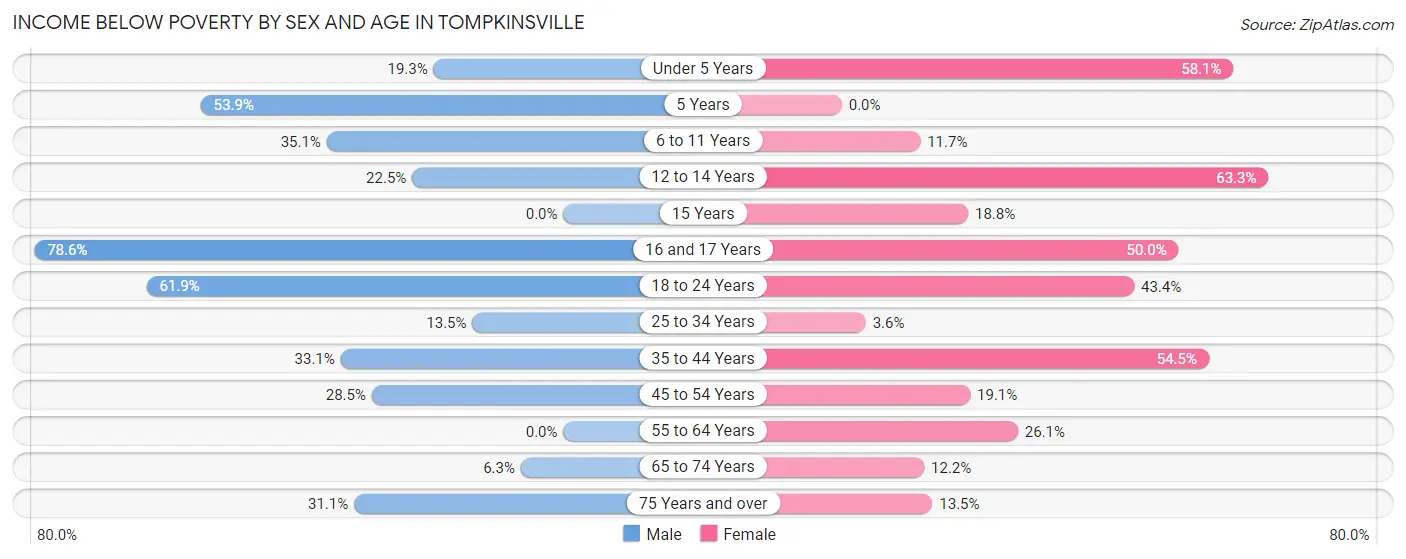
| Age Bracket | Male | Female |
| Under 5 Years | 16 (19.3%) | 50 (58.1%) |
| 5 Years | 21 (53.8%) | 0 (0.0%) |
| 6 to 11 Years | 39 (35.1%) | 12 (11.7%) |
| 12 to 14 Years | 22 (22.5%) | 38 (63.3%) |
| 15 Years | 0 (0.0%) | 12 (18.8%) |
| 16 and 17 Years | 44 (78.6%) | 21 (50.0%) |
| 18 to 24 Years | 39 (61.9%) | 46 (43.4%) |
| 25 to 34 Years | 10 (13.5%) | 6 (3.5%) |
| 35 to 44 Years | 44 (33.1%) | 85 (54.5%) |
| 45 to 54 Years | 33 (28.4%) | 32 (19.1%) |
| 55 to 64 Years | 0 (0.0%) | 63 (26.1%) |
| 65 to 74 Years | 6 (6.3%) | 11 (12.2%) |
| 75 Years and over | 23 (31.1%) | 16 (13.5%) |
| Total | 297 (26.1%) | 392 (27.8%) |
Income Above Poverty by Sex and Age in Tompkinsville
According to the poverty statistics in Tompkinsville, males aged 55 to 64 years and females aged 5 years are the age groups that are most secure financially, with 100.0% of males and 100.0% of females in these age groups living above the poverty line.
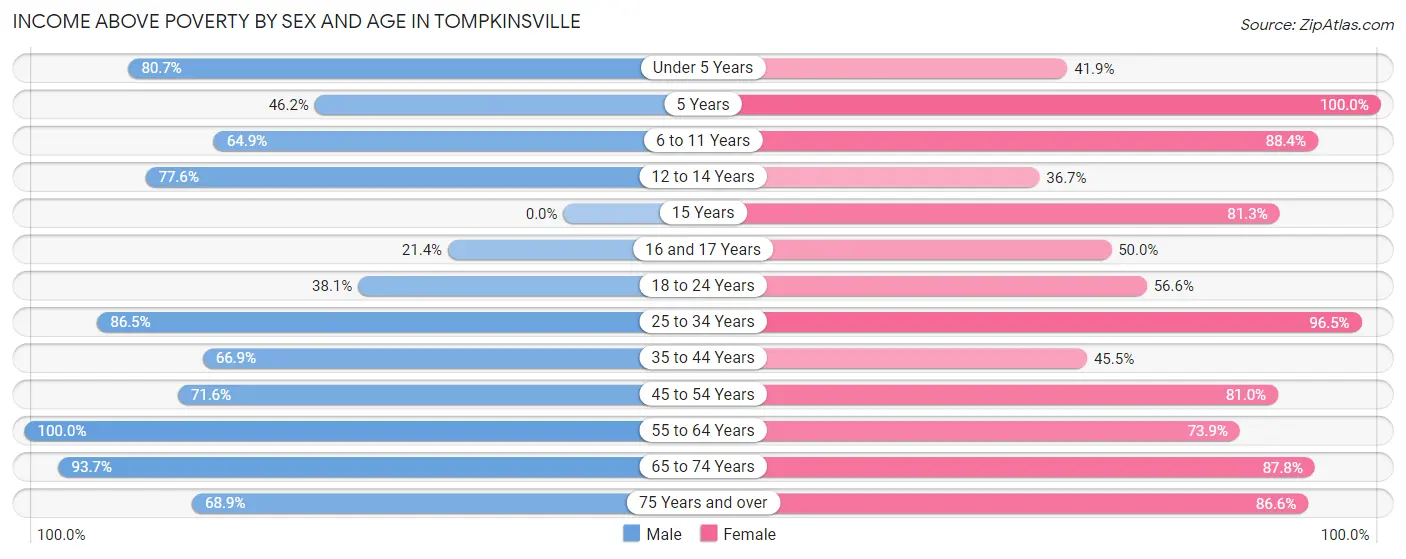
| Age Bracket | Male | Female |
| Under 5 Years | 67 (80.7%) | 36 (41.9%) |
| 5 Years | 18 (46.2%) | 6 (100.0%) |
| 6 to 11 Years | 72 (64.9%) | 91 (88.3%) |
| 12 to 14 Years | 76 (77.5%) | 22 (36.7%) |
| 15 Years | 0 (0.0%) | 52 (81.2%) |
| 16 and 17 Years | 12 (21.4%) | 21 (50.0%) |
| 18 to 24 Years | 24 (38.1%) | 60 (56.6%) |
| 25 to 34 Years | 64 (86.5%) | 163 (96.5%) |
| 35 to 44 Years | 89 (66.9%) | 71 (45.5%) |
| 45 to 54 Years | 83 (71.6%) | 136 (80.9%) |
| 55 to 64 Years | 196 (100.0%) | 178 (73.9%) |
| 65 to 74 Years | 89 (93.7%) | 79 (87.8%) |
| 75 Years and over | 51 (68.9%) | 103 (86.6%) |
| Total | 841 (73.9%) | 1,018 (72.2%) |
Income Below Poverty Among Married-Couple Families in Tompkinsville
The poverty statistics for married-couple families in Tompkinsville show that 4.6% or 13 of the total 285 families live below the poverty line. Families with 1 or 2 children have the highest poverty rate of 11.1%, comprising of 13 families. On the other hand, families with no children have the lowest poverty rate of 0.0%, which includes 0 families.
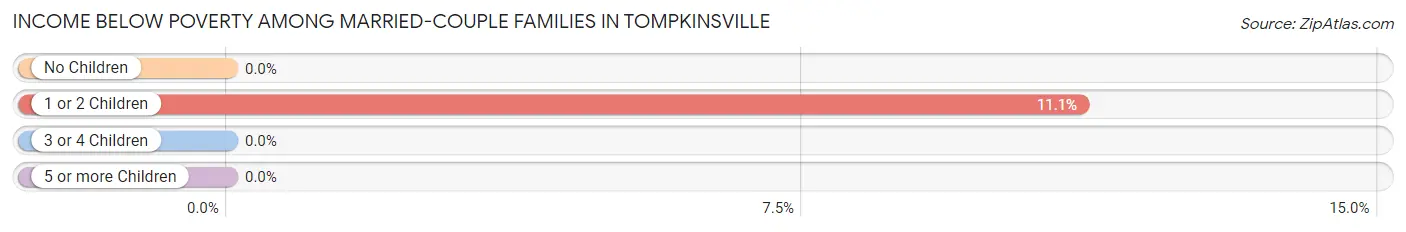
| Children | Above Poverty | Below Poverty |
| No Children | 155 (100.0%) | 0 (0.0%) |
| 1 or 2 Children | 104 (88.9%) | 13 (11.1%) |
| 3 or 4 Children | 0 (0.0%) | 0 (0.0%) |
| 5 or more Children | 13 (100.0%) | 0 (0.0%) |
| Total | 272 (95.4%) | 13 (4.6%) |
Income Below Poverty Among Single-Parent Households in Tompkinsville
According to the poverty data in Tompkinsville, 22.2% or 14 single-father households and 37.8% or 119 single-mother households are living below the poverty line. Among single-father households, those with 3 or 4 children have the highest poverty rate, with 4 households (80.0%) experiencing poverty. Likewise, among single-mother households, those with 5 or more children have the highest poverty rate, with 30 households (100.0%) falling below the poverty line.
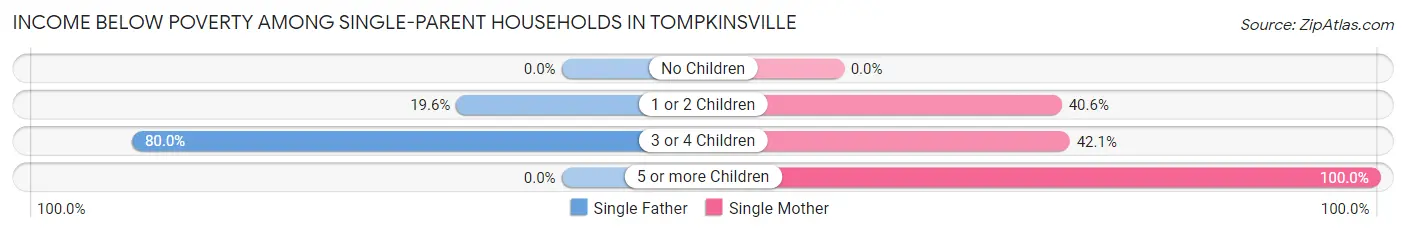
| Children | Single Father | Single Mother |
| No Children | 0 (0.0%) | 0 (0.0%) |
| 1 or 2 Children | 10 (19.6%) | 65 (40.6%) |
| 3 or 4 Children | 4 (80.0%) | 24 (42.1%) |
| 5 or more Children | 0 (0.0%) | 30 (100.0%) |
| Total | 14 (22.2%) | 119 (37.8%) |
Income Below Poverty Among Married-Couple vs Single-Parent Households in Tompkinsville
The poverty data for Tompkinsville shows that 13 of the married-couple family households (4.6%) and 133 of the single-parent households (35.2%) are living below the poverty level. Within the married-couple family households, those with 1 or 2 children have the highest poverty rate, with 13 households (11.1%) falling below the poverty line. Among the single-parent households, those with 5 or more children have the highest poverty rate, with 30 household (100.0%) living below poverty.
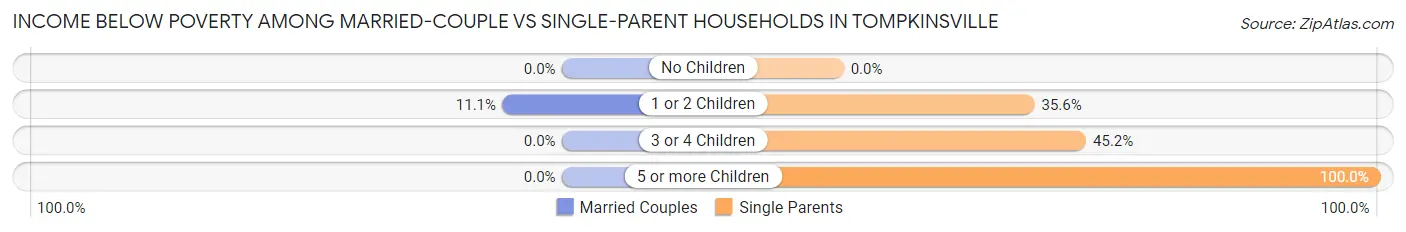
| Children | Married-Couple Families | Single-Parent Households |
| No Children | 0 (0.0%) | 0 (0.0%) |
| 1 or 2 Children | 13 (11.1%) | 75 (35.5%) |
| 3 or 4 Children | 0 (0.0%) | 28 (45.2%) |
| 5 or more Children | 0 (0.0%) | 30 (100.0%) |
| Total | 13 (4.6%) | 133 (35.2%) |
Race in Tompkinsville
The most populous races in Tompkinsville are White / Caucasian (2,270 | 84.1%), Black / African American (292 | 10.8%), and Hispanic or Latino (135 | 5.0%).
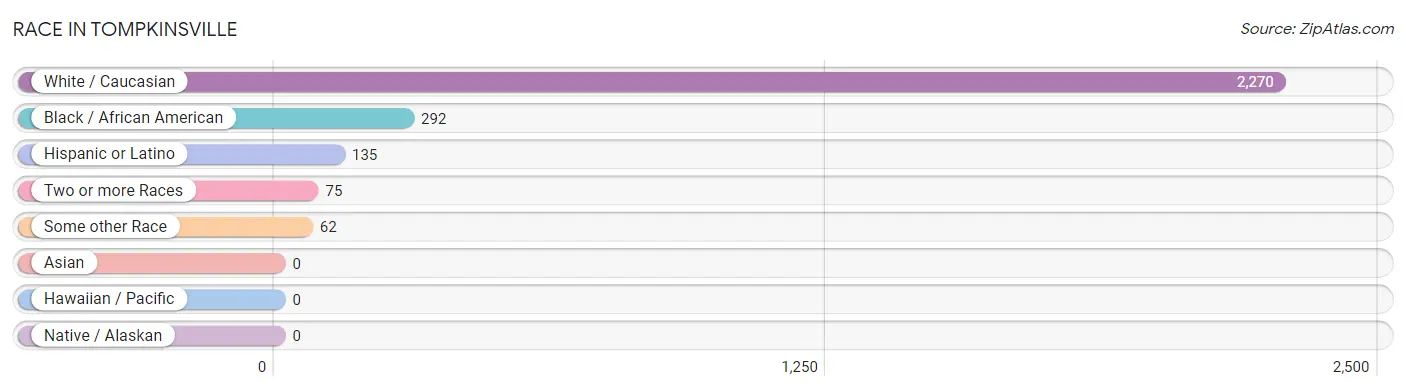
| Race | # Population | % Population |
| Asian | 0 | 0.0% |
| Black / African American | 292 | 10.8% |
| Hawaiian / Pacific | 0 | 0.0% |
| Hispanic or Latino | 135 | 5.0% |
| Native / Alaskan | 0 | 0.0% |
| White / Caucasian | 2,270 | 84.1% |
| Two or more Races | 75 | 2.8% |
| Some other Race | 62 | 2.3% |
| Total | 2,699 | 100.0% |
Ancestry in Tompkinsville
The most populous ancestries reported in Tompkinsville are American (704 | 26.1%), English (365 | 13.5%), Mexican (135 | 5.0%), German (128 | 4.7%), and Irish (114 | 4.2%), together accounting for 53.6% of all Tompkinsville residents.
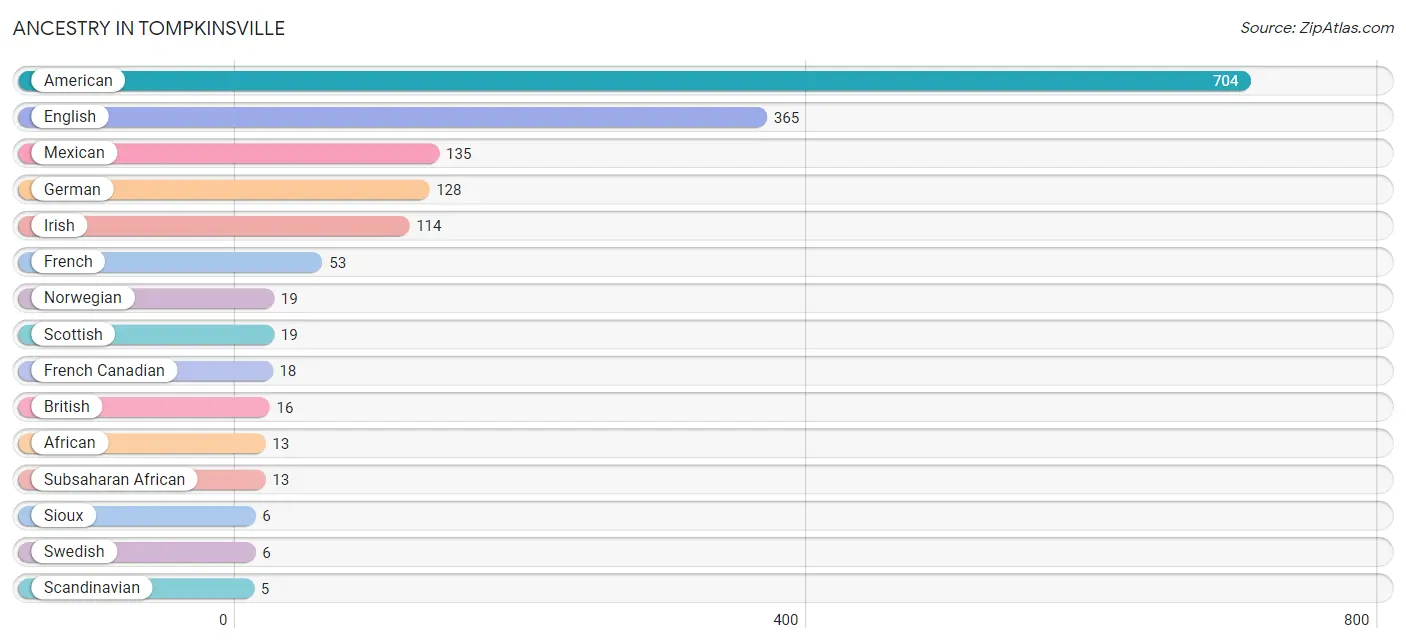
| Ancestry | # Population | % Population |
| African | 13 | 0.5% |
| American | 704 | 26.1% |
| British | 16 | 0.6% |
| Cherokee | 1 | 0.0% |
| English | 365 | 13.5% |
| French | 53 | 2.0% |
| French Canadian | 18 | 0.7% |
| German | 128 | 4.7% |
| Irish | 114 | 4.2% |
| Italian | 2 | 0.1% |
| Mexican | 135 | 5.0% |
| Norwegian | 19 | 0.7% |
| Scandinavian | 5 | 0.2% |
| Scottish | 19 | 0.7% |
| Sioux | 6 | 0.2% |
| Subsaharan African | 13 | 0.5% |
| Swedish | 6 | 0.2% | View All 17 Rows |
Immigrants in Tompkinsville
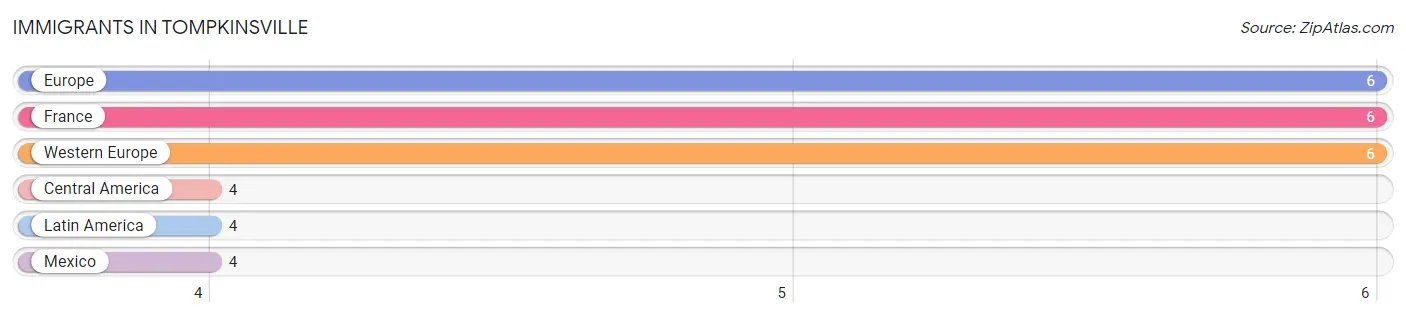
The most numerous immigrant groups reported in Tompkinsville came from Europe (6 | 0.2%), France (6 | 0.2%), Western Europe (6 | 0.2%), Central America (4 | 0.2%), and Latin America (4 | 0.2%), together accounting for 1.0% of all Tompkinsville residents.
| Immigration Origin | # Population | % Population |
| Central America | 4 | 0.2% |
| Europe | 6 | 0.2% |
| France | 6 | 0.2% |
| Latin America | 4 | 0.2% |
| Mexico | 4 | 0.2% |
| Western Europe | 6 | 0.2% | View All 6 Rows |
Sex and Age in Tompkinsville
Sex and Age in Tompkinsville
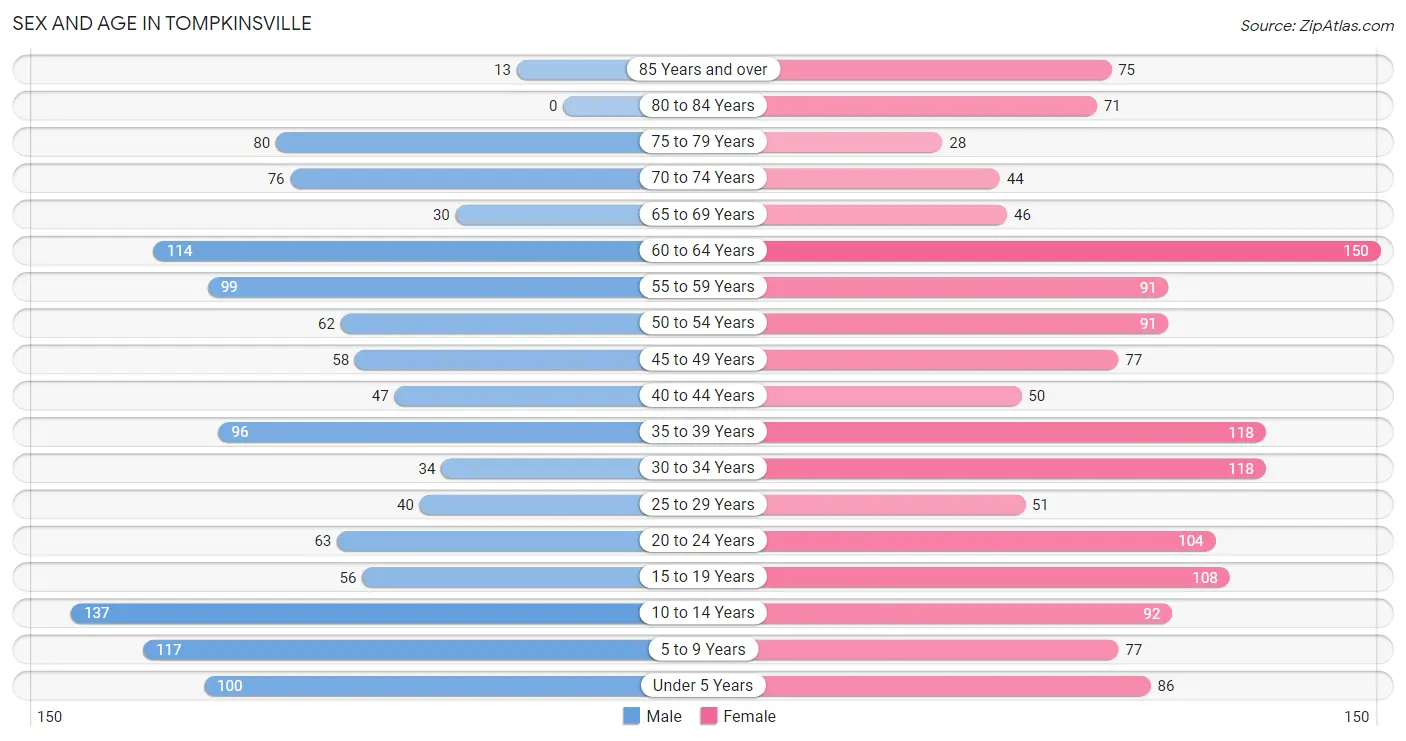
The most populous age groups in Tompkinsville are 10 to 14 Years (137 | 11.2%) for men and 60 to 64 Years (150 | 10.2%) for women.
| Age Bracket | Male | Female |
| Under 5 Years | 100 (8.2%) | 86 (5.8%) |
| 5 to 9 Years | 117 (9.6%) | 77 (5.2%) |
| 10 to 14 Years | 137 (11.2%) | 92 (6.2%) |
| 15 to 19 Years | 56 (4.6%) | 108 (7.3%) |
| 20 to 24 Years | 63 (5.2%) | 104 (7.0%) |
| 25 to 29 Years | 40 (3.3%) | 51 (3.5%) |
| 30 to 34 Years | 34 (2.8%) | 118 (8.0%) |
| 35 to 39 Years | 96 (7.9%) | 118 (8.0%) |
| 40 to 44 Years | 47 (3.8%) | 50 (3.4%) |
| 45 to 49 Years | 58 (4.8%) | 77 (5.2%) |
| 50 to 54 Years | 62 (5.1%) | 91 (6.2%) |
| 55 to 59 Years | 99 (8.1%) | 91 (6.2%) |
| 60 to 64 Years | 114 (9.3%) | 150 (10.2%) |
| 65 to 69 Years | 30 (2.5%) | 46 (3.1%) |
| 70 to 74 Years | 76 (6.2%) | 44 (3.0%) |
| 75 to 79 Years | 80 (6.6%) | 28 (1.9%) |
| 80 to 84 Years | 0 (0.0%) | 71 (4.8%) |
| 85 Years and over | 13 (1.1%) | 75 (5.1%) |
| Total | 1,222 (100.0%) | 1,477 (100.0%) |
Families and Households in Tompkinsville
Median Family Size in Tompkinsville
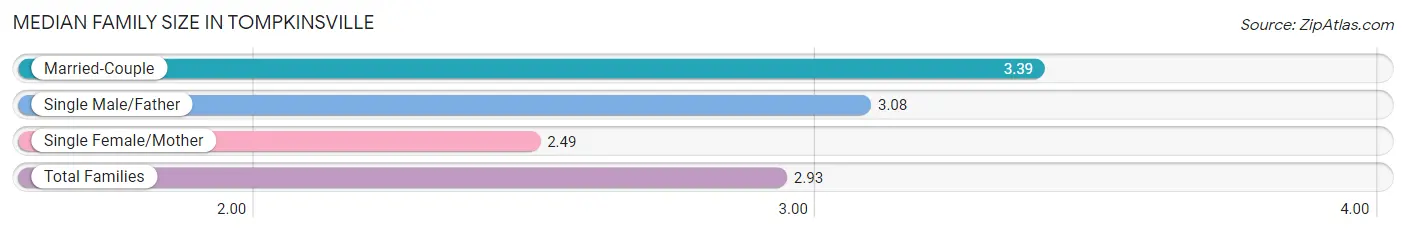
The median family size in Tompkinsville is 2.93 persons per family, with married-couple families (285 | 43.0%) accounting for the largest median family size of 3.39 persons per family. On the other hand, single female/mother families (315 | 47.5%) represent the smallest median family size with 2.49 persons per family.
| Family Type | # Families | Family Size |
| Married-Couple | 285 (43.0%) | 3.39 |
| Single Male/Father | 63 (9.5%) | 3.08 |
| Single Female/Mother | 315 (47.5%) | 2.49 |
| Total Families | 663 (100.0%) | 2.93 |
Median Household Size in Tompkinsville
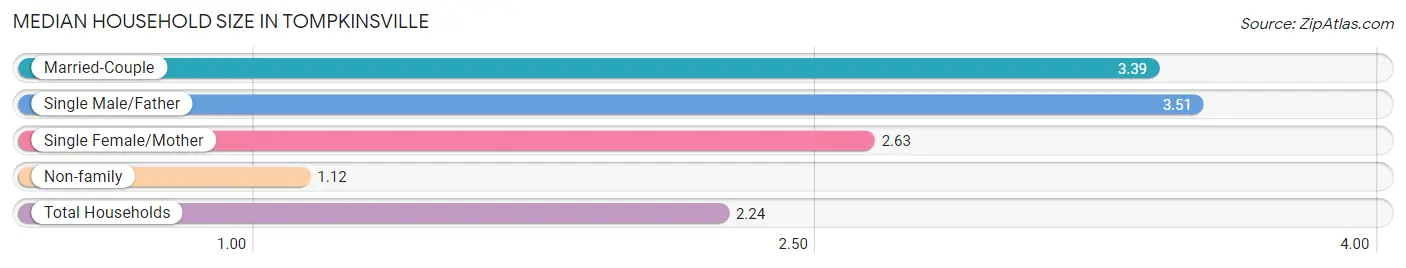
The median household size in Tompkinsville is 2.24 persons per household, with single male/father households (63 | 5.5%) accounting for the largest median household size of 3.51 persons per household. non-family households (475 | 41.7%) represent the smallest median household size with 1.12 persons per household.
| Household Type | # Households | Household Size |
| Married-Couple | 285 (25.0%) | 3.39 |
| Single Male/Father | 63 (5.5%) | 3.51 |
| Single Female/Mother | 315 (27.7%) | 2.63 |
| Non-family | 475 (41.7%) | 1.12 |
| Total Households | 1,138 (100.0%) | 2.24 |
Household Size by Marriage Status in Tompkinsville
Out of a total of 1,138 households in Tompkinsville, 663 (58.3%) are family households, while 475 (41.7%) are nonfamily households. The most numerous type of family households are 2-person households, comprising 279, and the most common type of nonfamily households are 1-person households, comprising 426.
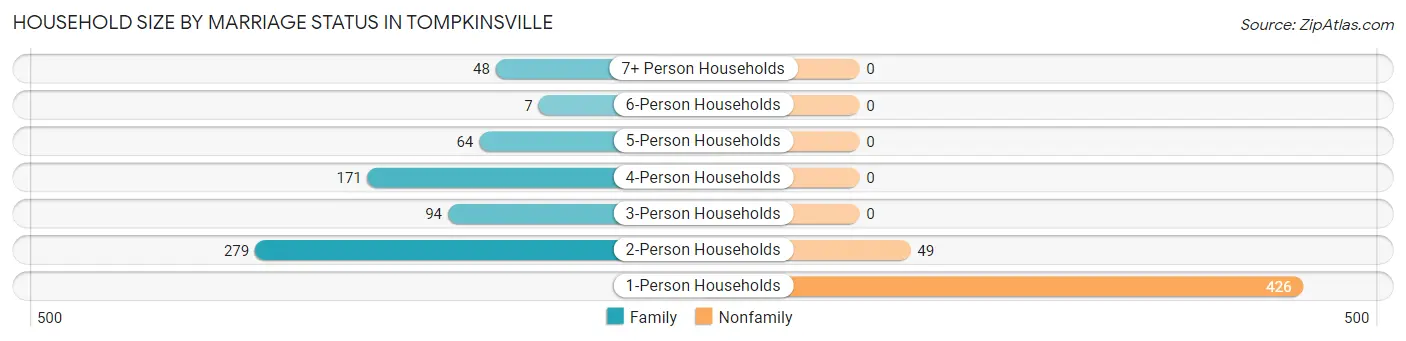
| Household Size | Family Households | Nonfamily Households |
| 1-Person Households | - | 426 (37.4%) |
| 2-Person Households | 279 (24.5%) | 49 (4.3%) |
| 3-Person Households | 94 (8.3%) | 0 (0.0%) |
| 4-Person Households | 171 (15.0%) | 0 (0.0%) |
| 5-Person Households | 64 (5.6%) | 0 (0.0%) |
| 6-Person Households | 7 (0.6%) | 0 (0.0%) |
| 7+ Person Households | 48 (4.2%) | 0 (0.0%) |
| Total | 663 (58.3%) | 475 (41.7%) |
Female Fertility in Tompkinsville
Fertility by Age in Tompkinsville
Average fertility rate in Tompkinsville is 38.0 births per 1,000 women. Women in the age bracket of 35 to 50 years have the highest fertility rate with 73.0 births per 1,000 women. Women in the age bracket of 35 to 50 years acount for 75.0% of all women with births.
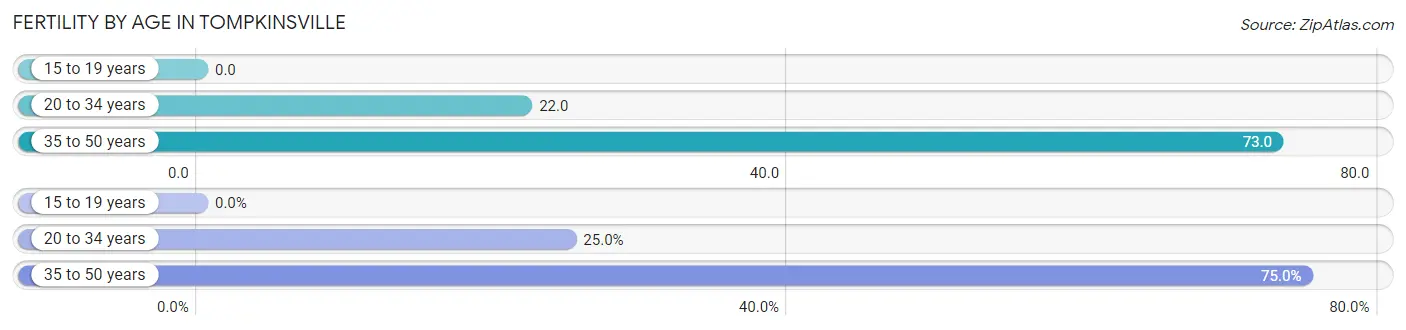
| Age Bracket | Women with Births | Births / 1,000 Women |
| 15 to 19 years | 0 (0.0%) | 0.0 |
| 20 to 34 years | 6 (25.0%) | 22.0 |
| 35 to 50 years | 18 (75.0%) | 73.0 |
| Total | 24 (100.0%) | 38.0 |
Fertility by Age by Marriage Status in Tompkinsville
75.0% of women with births (24) in Tompkinsville are married. The highest percentage of unmarried women with births falls into 20 to 34 years age bracket with 100.0% of them unmarried at the time of birth, while the lowest percentage of unmarried women with births belong to 35 to 50 years age bracket with 0.0% of them unmarried.
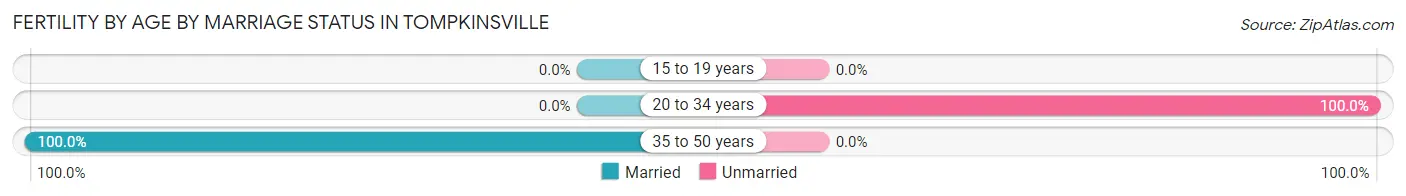
| Age Bracket | Married | Unmarried |
| 15 to 19 years | 0 (0.0%) | 0 (0.0%) |
| 20 to 34 years | 0 (0.0%) | 6 (100.0%) |
| 35 to 50 years | 18 (100.0%) | 0 (0.0%) |
| Total | 18 (75.0%) | 6 (25.0%) |
Fertility by Education in Tompkinsville
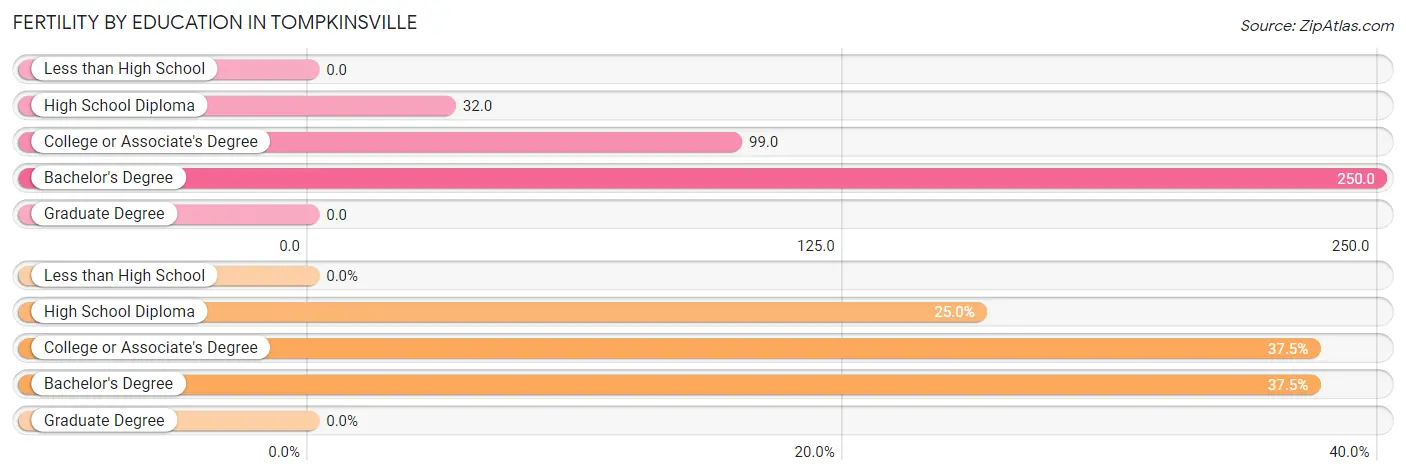
| Educational Attainment | Women with Births | Births / 1,000 Women |
| Less than High School | 0 (0.0%) | 0.0 |
| High School Diploma | 6 (25.0%) | 32.0 |
| College or Associate's Degree | 9 (37.5%) | 99.0 |
| Bachelor's Degree | 9 (37.5%) | 250.0 |
| Graduate Degree | 0 (0.0%) | 0.0 |
| Total | 24 (100.0%) | 38.0 |
Fertility by Education by Marriage Status in Tompkinsville
25.0% of women with births in Tompkinsville are unmarried. Women with the educational attainment of college or associate's degree are most likely to be married with 100.0% of them married at childbirth, while women with the educational attainment of high school diploma are least likely to be married with 100.0% of them unmarried at childbirth.
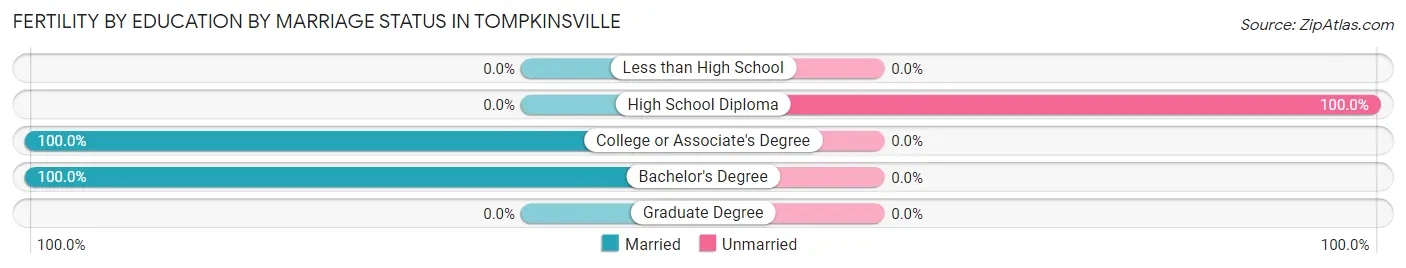
| Educational Attainment | Married | Unmarried |
| Less than High School | 0 (0.0%) | 0 (0.0%) |
| High School Diploma | 0 (0.0%) | 6 (100.0%) |
| College or Associate's Degree | 9 (100.0%) | 0 (0.0%) |
| Bachelor's Degree | 9 (100.0%) | 0 (0.0%) |
| Graduate Degree | 0 (0.0%) | 0 (0.0%) |
| Total | 18 (75.0%) | 6 (25.0%) |
Employment Characteristics in Tompkinsville
Employment by Class of Employer in Tompkinsville
Among the 1,025 employed individuals in Tompkinsville, private company employees (629 | 61.4%), local government employees (131 | 12.8%), and not-for-profit organizations (102 | 10.0%) make up the most common classes of employment.
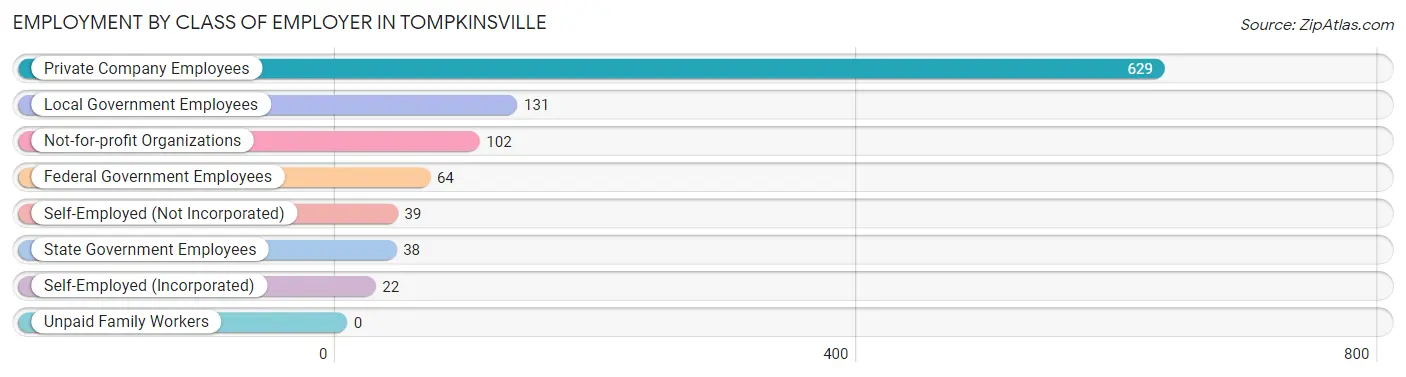
| Employer Class | # Employees | % Employees |
| Private Company Employees | 629 | 61.4% |
| Self-Employed (Incorporated) | 22 | 2.1% |
| Self-Employed (Not Incorporated) | 39 | 3.8% |
| Not-for-profit Organizations | 102 | 10.0% |
| Local Government Employees | 131 | 12.8% |
| State Government Employees | 38 | 3.7% |
| Federal Government Employees | 64 | 6.2% |
| Unpaid Family Workers | 0 | 0.0% |
| Total | 1,025 | 100.0% |
Employment Status by Age in Tompkinsville
According to the labor force statistics for Tompkinsville, out of the total population over 16 years of age (2,026), 57.2% or 1,159 individuals are in the labor force, with 7.8% or 90 of them unemployed. The age group with the highest labor force participation rate is 30 to 34 years, with 88.2% or 134 individuals in the labor force. Within the labor force, the 25 to 29 years age range has the highest percentage of unemployed individuals, with 38.0% or 30 of them being unemployed.
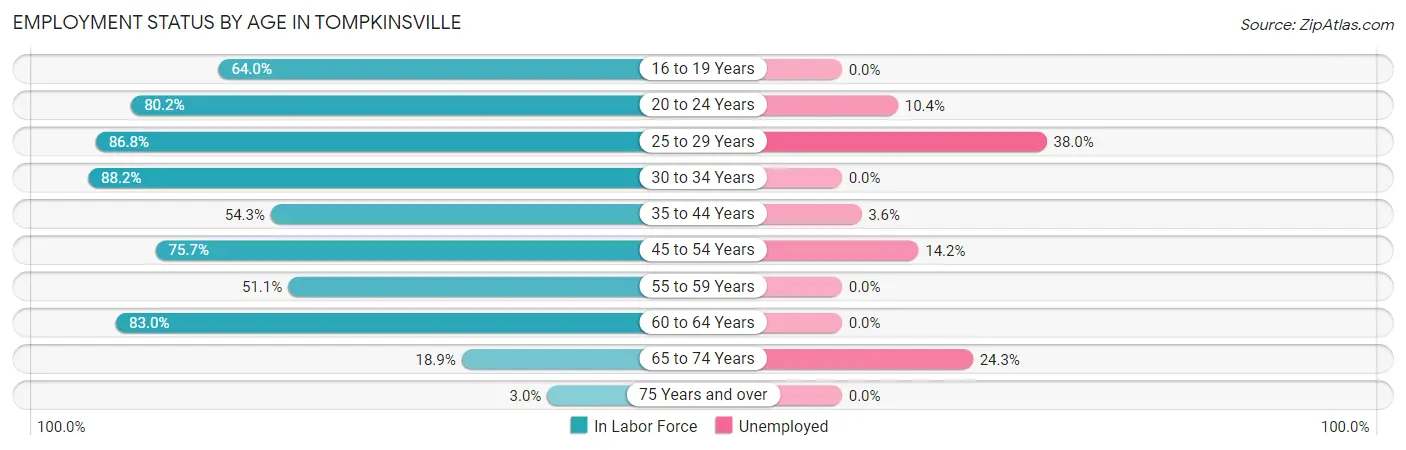
| Age Bracket | In Labor Force | Unemployed |
| 16 to 19 Years | 64 (64.0%) | 0 (0.0%) |
| 20 to 24 Years | 134 (80.2%) | 14 (10.4%) |
| 25 to 29 Years | 79 (86.8%) | 30 (38.0%) |
| 30 to 34 Years | 134 (88.2%) | 0 (0.0%) |
| 35 to 44 Years | 169 (54.3%) | 6 (3.6%) |
| 45 to 54 Years | 218 (75.7%) | 31 (14.2%) |
| 55 to 59 Years | 97 (51.1%) | 0 (0.0%) |
| 60 to 64 Years | 219 (83.0%) | 0 (0.0%) |
| 65 to 74 Years | 37 (18.9%) | 9 (24.3%) |
| 75 Years and over | 8 (3.0%) | 0 (0.0%) |
| Total | 1,159 (57.2%) | 90 (7.8%) |
Employment Status by Educational Attainment in Tompkinsville
According to labor force statistics for Tompkinsville, 70.7% of individuals (916) out of the total population between 25 and 64 years of age (1,296) are in the labor force, with 7.3% or 67 of them being unemployed. The group with the highest labor force participation rate are those with the educational attainment of bachelor's degree or higher, with 95.1% or 174 individuals in the labor force. Within the labor force, individuals with college / associate degree education have the highest percentage of unemployment, with 15.8% or 48 of them being unemployed.
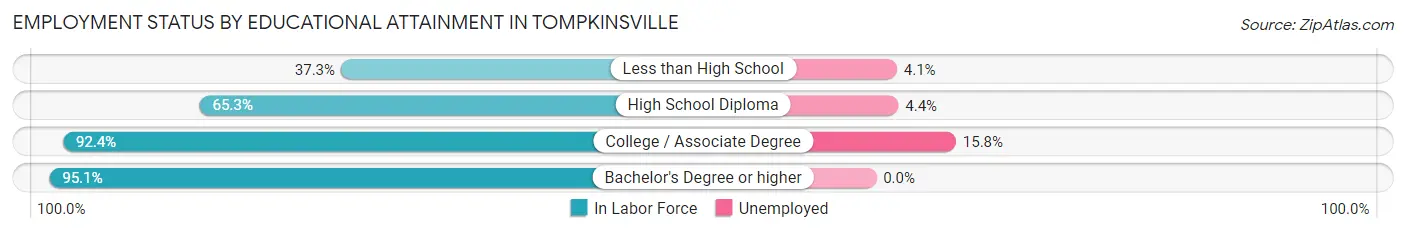
| Educational Attainment | In Labor Force | Unemployed |
| Less than High School | 98 (37.3%) | 11 (4.1%) |
| High School Diploma | 341 (65.3%) | 23 (4.4%) |
| College / Associate Degree | 303 (92.4%) | 52 (15.8%) |
| Bachelor's Degree or higher | 174 (95.1%) | 0 (0.0%) |
| Total | 916 (70.7%) | 95 (7.3%) |
Employment Occupations by Sex in Tompkinsville
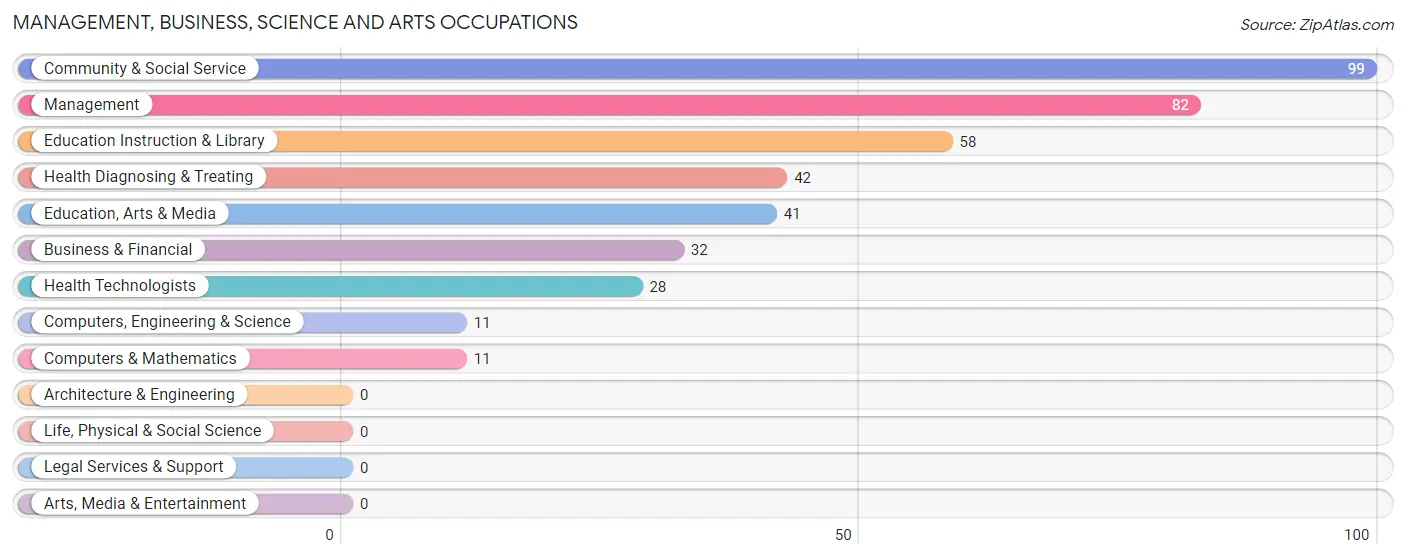
Management, Business, Science and Arts Occupations
The most common Management, Business, Science and Arts occupations in Tompkinsville are Community & Social Service (99 | 9.3%), Management (82 | 7.7%), Education Instruction & Library (58 | 5.4%), Health Diagnosing & Treating (42 | 3.9%), and Education, Arts & Media (41 | 3.8%).
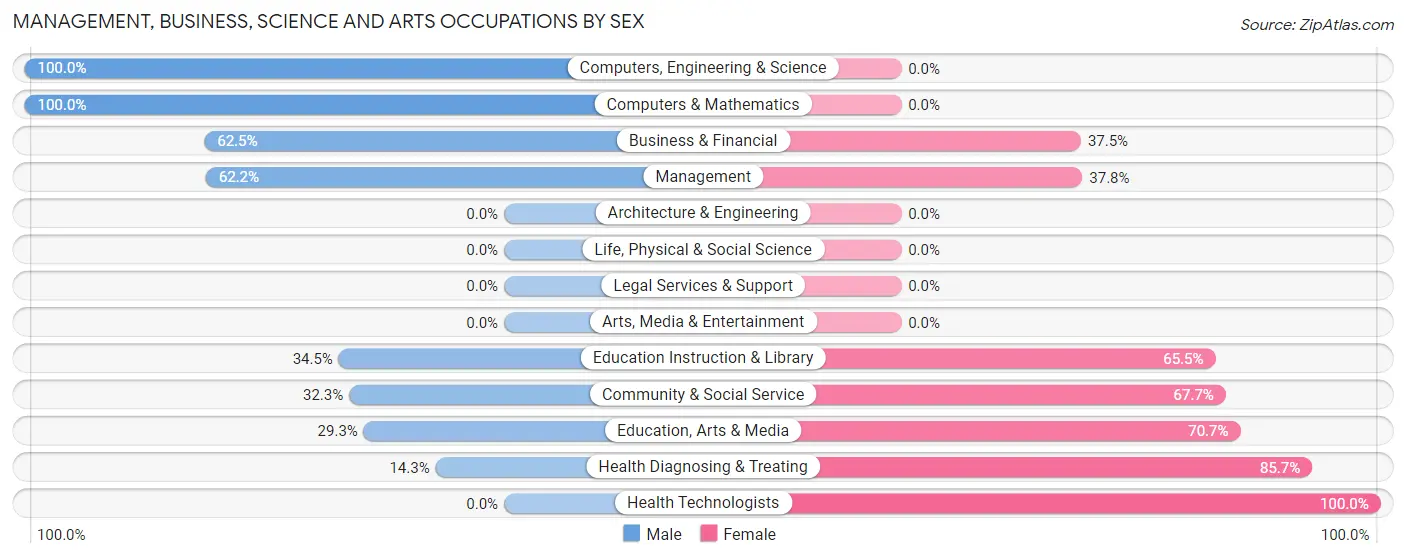
Management, Business, Science and Arts Occupations by Sex
Within the Management, Business, Science and Arts occupations in Tompkinsville, the most male-oriented occupations are Computers, Engineering & Science (100.0%), Computers & Mathematics (100.0%), and Business & Financial (62.5%), while the most female-oriented occupations are Health Technologists (100.0%), Health Diagnosing & Treating (85.7%), and Education, Arts & Media (70.7%).
| Occupation | Male | Female |
| Management | 51 (62.2%) | 31 (37.8%) |
| Business & Financial | 20 (62.5%) | 12 (37.5%) |
| Computers, Engineering & Science | 11 (100.0%) | 0 (0.0%) |
| Computers & Mathematics | 11 (100.0%) | 0 (0.0%) |
| Architecture & Engineering | 0 (0.0%) | 0 (0.0%) |
| Life, Physical & Social Science | 0 (0.0%) | 0 (0.0%) |
| Community & Social Service | 32 (32.3%) | 67 (67.7%) |
| Education, Arts & Media | 12 (29.3%) | 29 (70.7%) |
| Legal Services & Support | 0 (0.0%) | 0 (0.0%) |
| Education Instruction & Library | 20 (34.5%) | 38 (65.5%) |
| Arts, Media & Entertainment | 0 (0.0%) | 0 (0.0%) |
| Health Diagnosing & Treating | 6 (14.3%) | 36 (85.7%) |
| Health Technologists | 0 (0.0%) | 28 (100.0%) |
| Total (Category) | 120 (45.1%) | 146 (54.9%) |
| Total (Overall) | 471 (44.1%) | 598 (55.9%) |
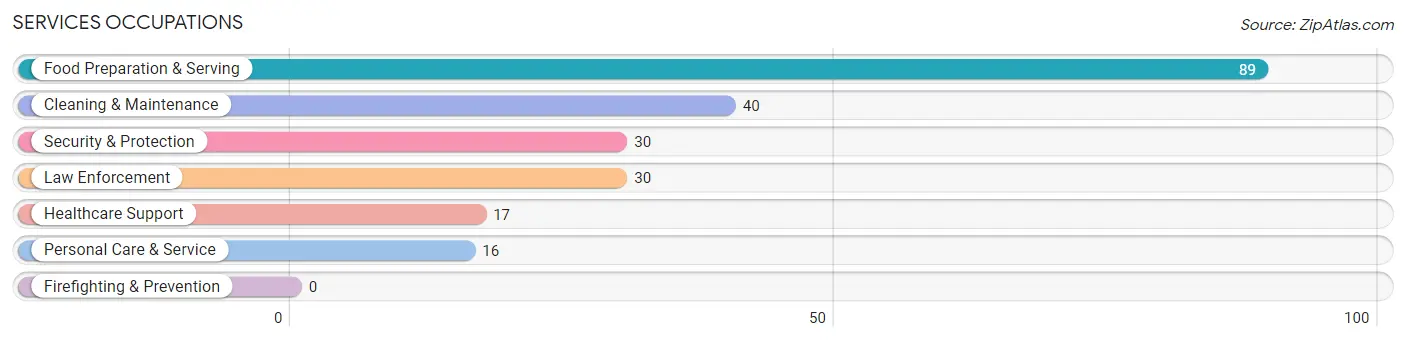
Services Occupations
The most common Services occupations in Tompkinsville are Food Preparation & Serving (89 | 8.3%), Cleaning & Maintenance (40 | 3.7%), Security & Protection (30 | 2.8%), Law Enforcement (30 | 2.8%), and Healthcare Support (17 | 1.6%).
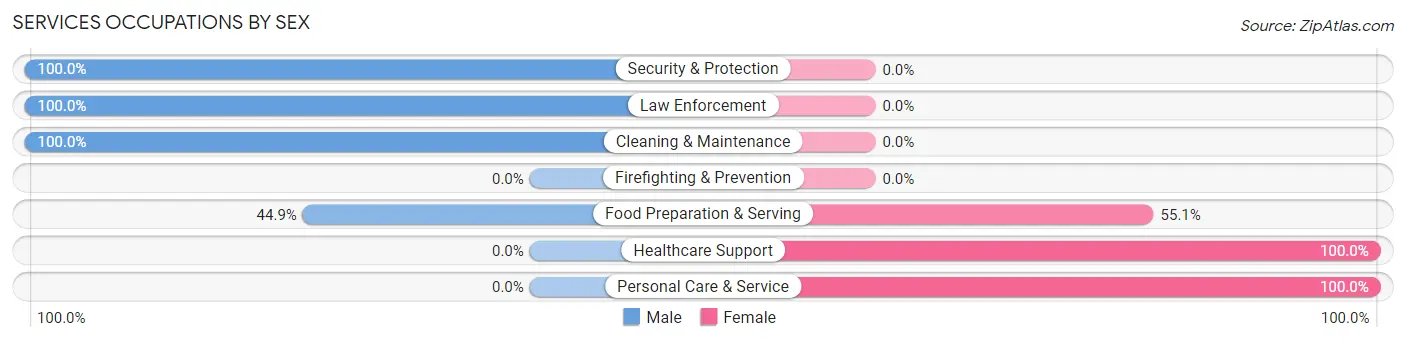
Services Occupations by Sex
Within the Services occupations in Tompkinsville, the most male-oriented occupations are Security & Protection (100.0%), Law Enforcement (100.0%), and Cleaning & Maintenance (100.0%), while the most female-oriented occupations are Healthcare Support (100.0%), Personal Care & Service (100.0%), and Food Preparation & Serving (55.1%).
| Occupation | Male | Female |
| Healthcare Support | 0 (0.0%) | 17 (100.0%) |
| Security & Protection | 30 (100.0%) | 0 (0.0%) |
| Firefighting & Prevention | 0 (0.0%) | 0 (0.0%) |
| Law Enforcement | 30 (100.0%) | 0 (0.0%) |
| Food Preparation & Serving | 40 (44.9%) | 49 (55.1%) |
| Cleaning & Maintenance | 40 (100.0%) | 0 (0.0%) |
| Personal Care & Service | 0 (0.0%) | 16 (100.0%) |
| Total (Category) | 110 (57.3%) | 82 (42.7%) |
| Total (Overall) | 471 (44.1%) | 598 (55.9%) |
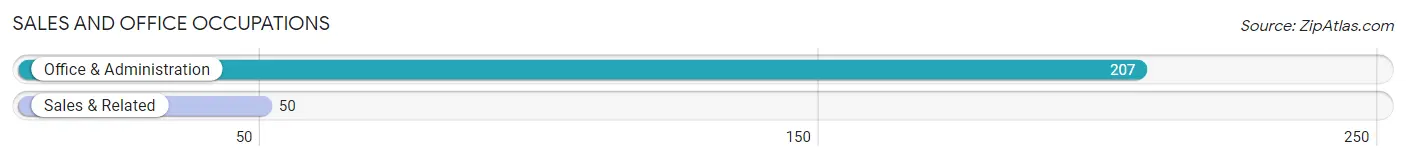
Sales and Office Occupations
The most common Sales and Office occupations in Tompkinsville are Office & Administration (207 | 19.4%), and Sales & Related (50 | 4.7%).
Sales and Office Occupations by Sex
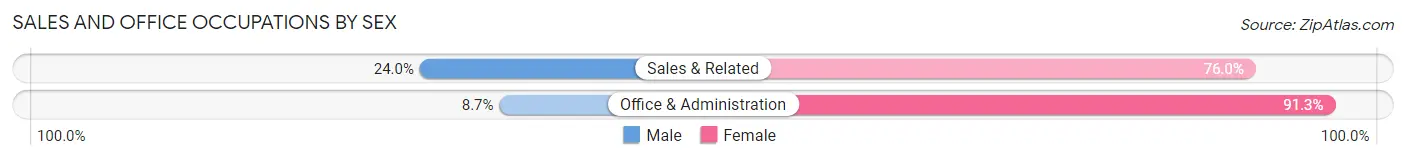
| Occupation | Male | Female |
| Sales & Related | 12 (24.0%) | 38 (76.0%) |
| Office & Administration | 18 (8.7%) | 189 (91.3%) |
| Total (Category) | 30 (11.7%) | 227 (88.3%) |
| Total (Overall) | 471 (44.1%) | 598 (55.9%) |
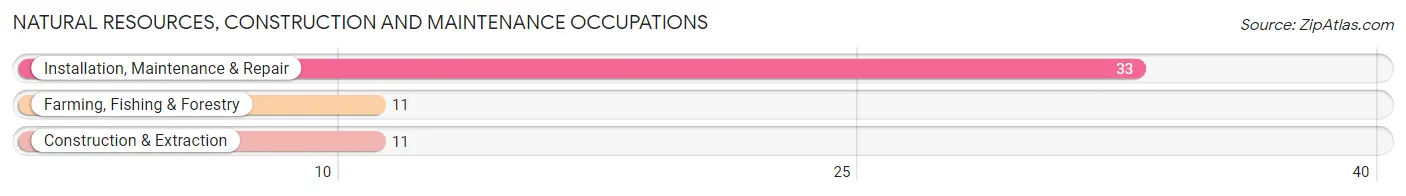
Natural Resources, Construction and Maintenance Occupations
The most common Natural Resources, Construction and Maintenance occupations in Tompkinsville are Installation, Maintenance & Repair (33 | 3.1%), Farming, Fishing & Forestry (11 | 1.0%), and Construction & Extraction (11 | 1.0%).
Natural Resources, Construction and Maintenance Occupations by Sex
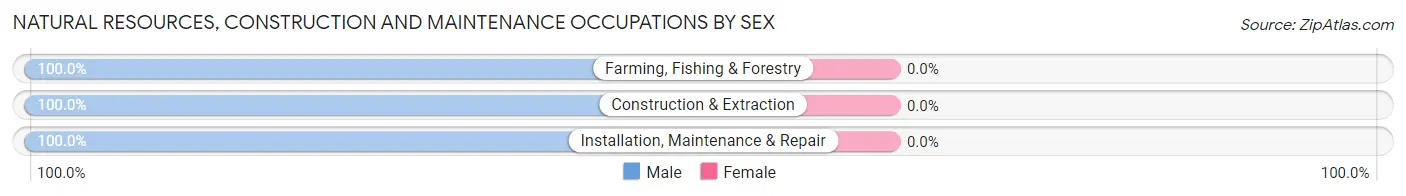
| Occupation | Male | Female |
| Farming, Fishing & Forestry | 11 (100.0%) | 0 (0.0%) |
| Construction & Extraction | 11 (100.0%) | 0 (0.0%) |
| Installation, Maintenance & Repair | 33 (100.0%) | 0 (0.0%) |
| Total (Category) | 55 (100.0%) | 0 (0.0%) |
| Total (Overall) | 471 (44.1%) | 598 (55.9%) |
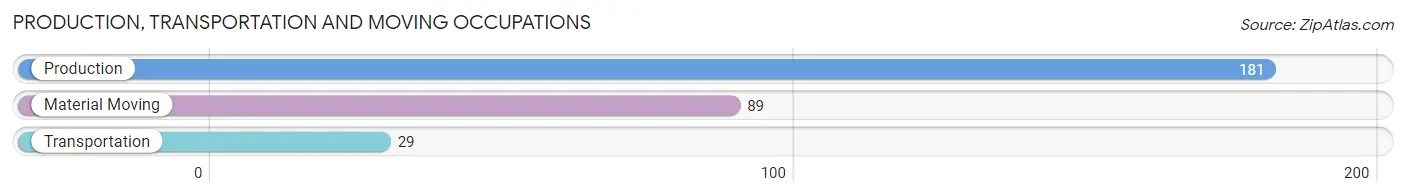
Production, Transportation and Moving Occupations
The most common Production, Transportation and Moving occupations in Tompkinsville are Production (181 | 16.9%), Material Moving (89 | 8.3%), and Transportation (29 | 2.7%).
Production, Transportation and Moving Occupations by Sex
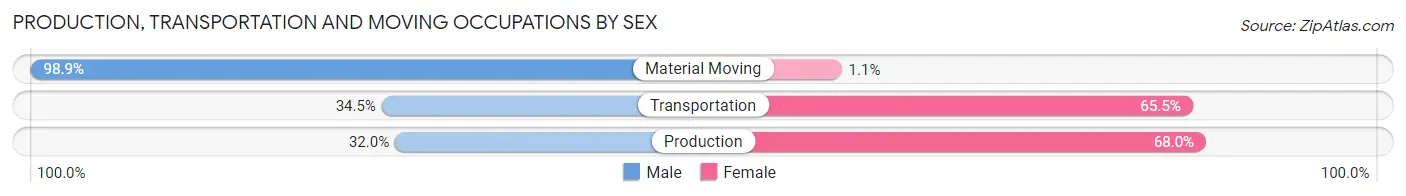
| Occupation | Male | Female |
| Production | 58 (32.0%) | 123 (68.0%) |
| Transportation | 10 (34.5%) | 19 (65.5%) |
| Material Moving | 88 (98.9%) | 1 (1.1%) |
| Total (Category) | 156 (52.2%) | 143 (47.8%) |
| Total (Overall) | 471 (44.1%) | 598 (55.9%) |
Employment Industries by Sex in Tompkinsville
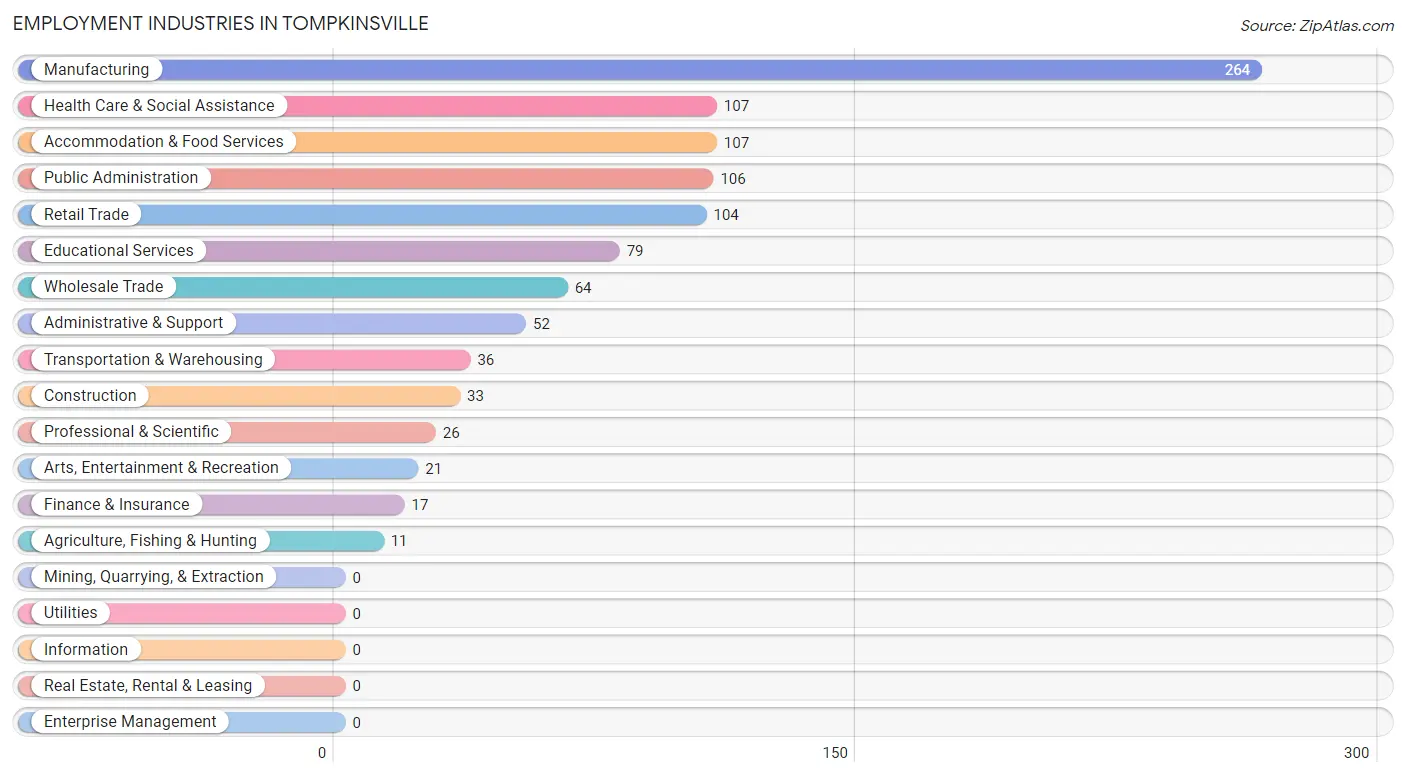
Employment Industries in Tompkinsville
The major employment industries in Tompkinsville include Manufacturing (264 | 24.7%), Health Care & Social Assistance (107 | 10.0%), Accommodation & Food Services (107 | 10.0%), Public Administration (106 | 9.9%), and Retail Trade (104 | 9.7%).
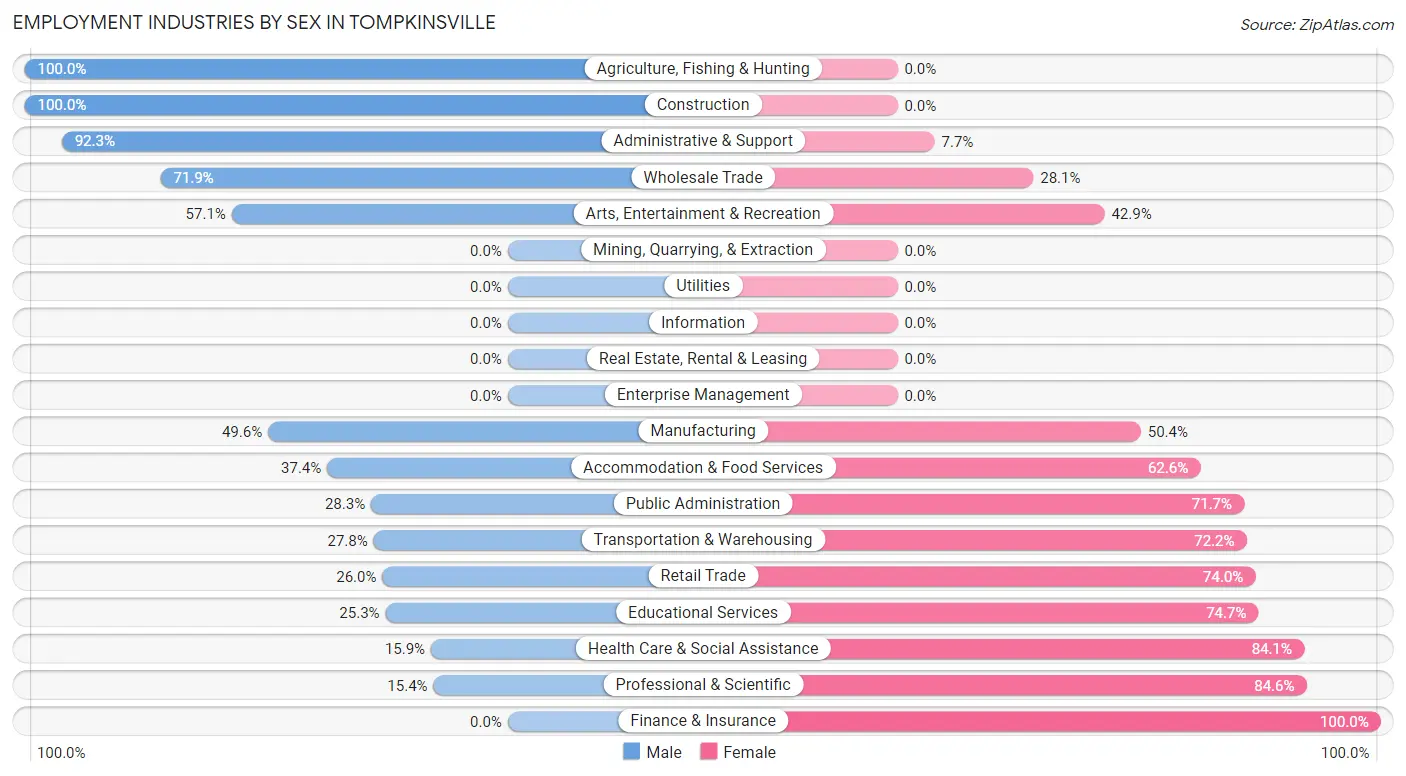
Employment Industries by Sex in Tompkinsville
The Tompkinsville industries that see more men than women are Agriculture, Fishing & Hunting (100.0%), Construction (100.0%), and Administrative & Support (92.3%), whereas the industries that tend to have a higher number of women are Finance & Insurance (100.0%), Professional & Scientific (84.6%), and Health Care & Social Assistance (84.1%).
| Industry | Male | Female |
| Agriculture, Fishing & Hunting | 11 (100.0%) | 0 (0.0%) |
| Mining, Quarrying, & Extraction | 0 (0.0%) | 0 (0.0%) |
| Construction | 33 (100.0%) | 0 (0.0%) |
| Manufacturing | 131 (49.6%) | 133 (50.4%) |
| Wholesale Trade | 46 (71.9%) | 18 (28.1%) |
| Retail Trade | 27 (26.0%) | 77 (74.0%) |
| Transportation & Warehousing | 10 (27.8%) | 26 (72.2%) |
| Utilities | 0 (0.0%) | 0 (0.0%) |
| Information | 0 (0.0%) | 0 (0.0%) |
| Finance & Insurance | 0 (0.0%) | 17 (100.0%) |
| Real Estate, Rental & Leasing | 0 (0.0%) | 0 (0.0%) |
| Professional & Scientific | 4 (15.4%) | 22 (84.6%) |
| Enterprise Management | 0 (0.0%) | 0 (0.0%) |
| Administrative & Support | 48 (92.3%) | 4 (7.7%) |
| Educational Services | 20 (25.3%) | 59 (74.7%) |
| Health Care & Social Assistance | 17 (15.9%) | 90 (84.1%) |
| Arts, Entertainment & Recreation | 12 (57.1%) | 9 (42.9%) |
| Accommodation & Food Services | 40 (37.4%) | 67 (62.6%) |
| Public Administration | 30 (28.3%) | 76 (71.7%) |
| Total | 471 (44.1%) | 598 (55.9%) |
Education in Tompkinsville
School Enrollment in Tompkinsville
The most common levels of schooling among the 656 students in Tompkinsville are elementary school (177 | 27.0%), high school (172 | 26.2%), and middle school (157 | 23.9%).
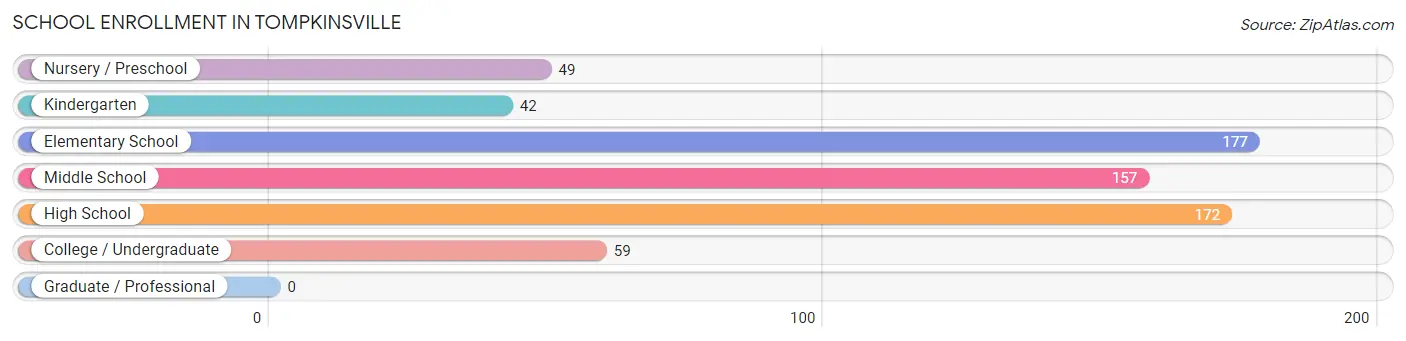
| School Level | # Students | % Students |
| Nursery / Preschool | 49 | 7.5% |
| Kindergarten | 42 | 6.4% |
| Elementary School | 177 | 27.0% |
| Middle School | 157 | 23.9% |
| High School | 172 | 26.2% |
| College / Undergraduate | 59 | 9.0% |
| Graduate / Professional | 0 | 0.0% |
| Total | 656 | 100.0% |
School Enrollment by Age by Funding Source in Tompkinsville
Out of a total of 656 students who are enrolled in schools in Tompkinsville, 29 (4.4%) attend a private institution, while the remaining 627 (95.6%) are enrolled in public schools. The age group of 5 to 9 year old has the highest likelihood of being enrolled in private schools, with 14 (7.8% in the age bracket) enrolled. Conversely, the age group of 3 to 4 year olds has the lowest likelihood of being enrolled in a private school, with 47 (100.0% in the age bracket) attending a public institution.
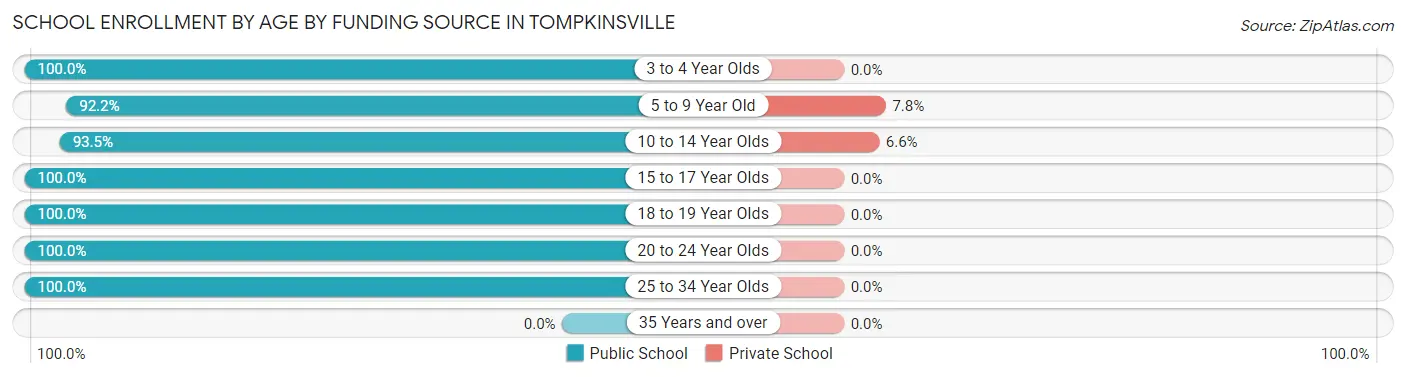
| Age Bracket | Public School | Private School |
| 3 to 4 Year Olds | 47 (100.0%) | 0 (0.0%) |
| 5 to 9 Year Old | 166 (92.2%) | 14 (7.8%) |
| 10 to 14 Year Olds | 214 (93.4%) | 15 (6.6%) |
| 15 to 17 Year Olds | 141 (100.0%) | 0 (0.0%) |
| 18 to 19 Year Olds | 2 (100.0%) | 0 (0.0%) |
| 20 to 24 Year Olds | 49 (100.0%) | 0 (0.0%) |
| 25 to 34 Year Olds | 8 (100.0%) | 0 (0.0%) |
| 35 Years and over | 0 (0.0%) | 0 (0.0%) |
| Total | 627 (95.6%) | 29 (4.4%) |
Educational Attainment by Field of Study in Tompkinsville
Education (69 | 28.6%), business (51 | 21.2%), social sciences (42 | 17.4%), arts & humanities (18 | 7.5%), and engineering (16 | 6.6%) are the most common fields of study among 241 individuals in Tompkinsville who have obtained a bachelor's degree or higher.
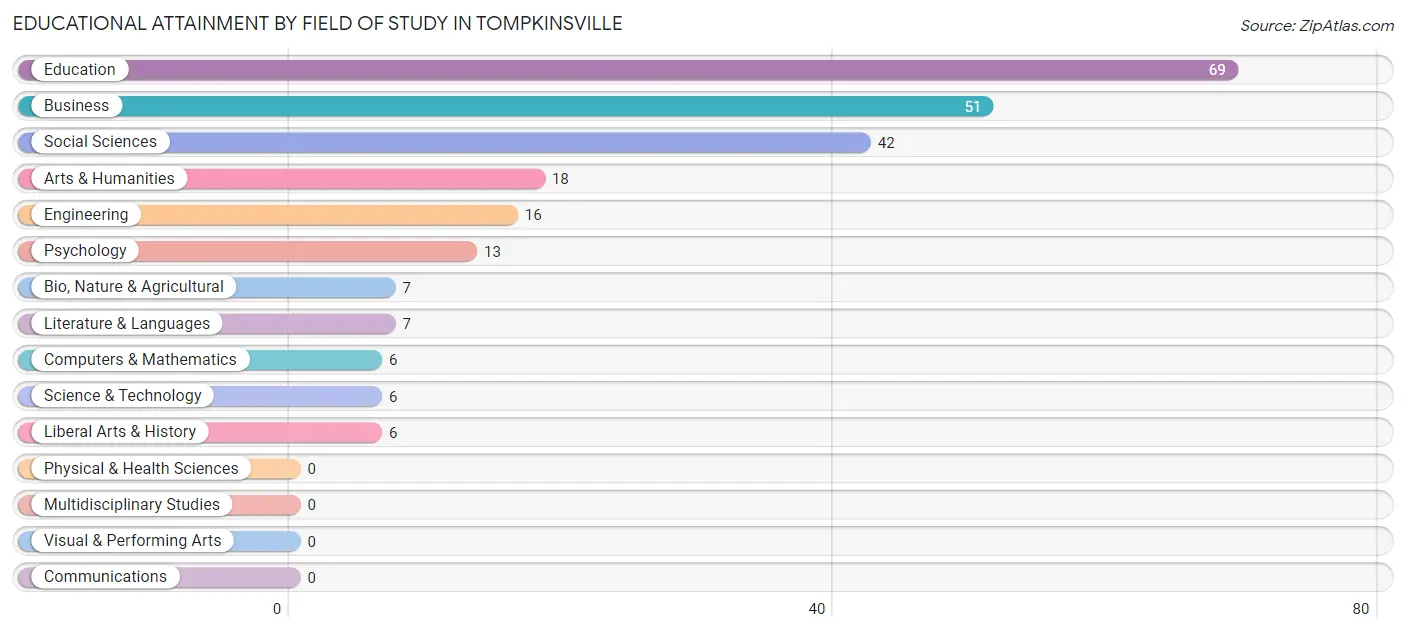
| Field of Study | # Graduates | % Graduates |
| Computers & Mathematics | 6 | 2.5% |
| Bio, Nature & Agricultural | 7 | 2.9% |
| Physical & Health Sciences | 0 | 0.0% |
| Psychology | 13 | 5.4% |
| Social Sciences | 42 | 17.4% |
| Engineering | 16 | 6.6% |
| Multidisciplinary Studies | 0 | 0.0% |
| Science & Technology | 6 | 2.5% |
| Business | 51 | 21.2% |
| Education | 69 | 28.6% |
| Literature & Languages | 7 | 2.9% |
| Liberal Arts & History | 6 | 2.5% |
| Visual & Performing Arts | 0 | 0.0% |
| Communications | 0 | 0.0% |
| Arts & Humanities | 18 | 7.5% |
| Total | 241 | 100.0% |
Transportation & Commute in Tompkinsville
Vehicle Availability by Sex in Tompkinsville
The most prevalent vehicle ownership categories in Tompkinsville are males with 2 vehicles (214, accounting for 47.1%) and females with 2 vehicles (166, making up 38.0%).
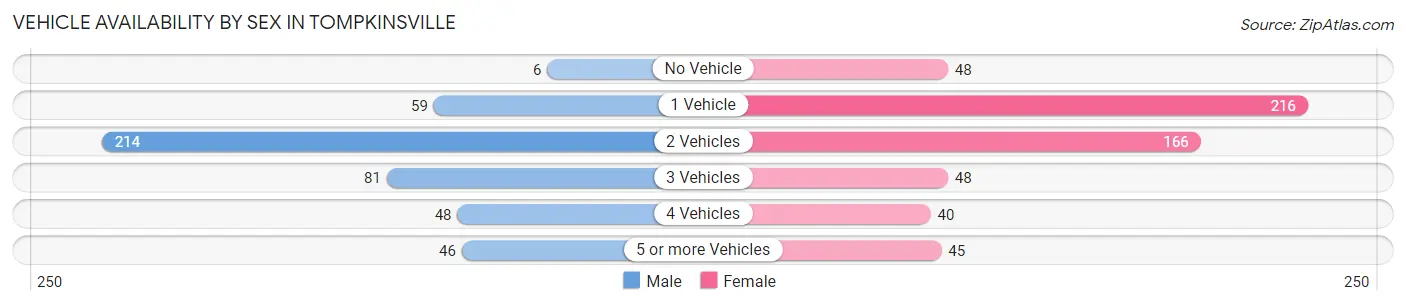
| Vehicles Available | Male | Female |
| No Vehicle | 6 (1.3%) | 48 (8.5%) |
| 1 Vehicle | 59 (13.0%) | 216 (38.4%) |
| 2 Vehicles | 214 (47.1%) | 166 (29.5%) |
| 3 Vehicles | 81 (17.8%) | 48 (8.5%) |
| 4 Vehicles | 48 (10.6%) | 40 (7.1%) |
| 5 or more Vehicles | 46 (10.1%) | 45 (8.0%) |
| Total | 454 (100.0%) | 563 (100.0%) |
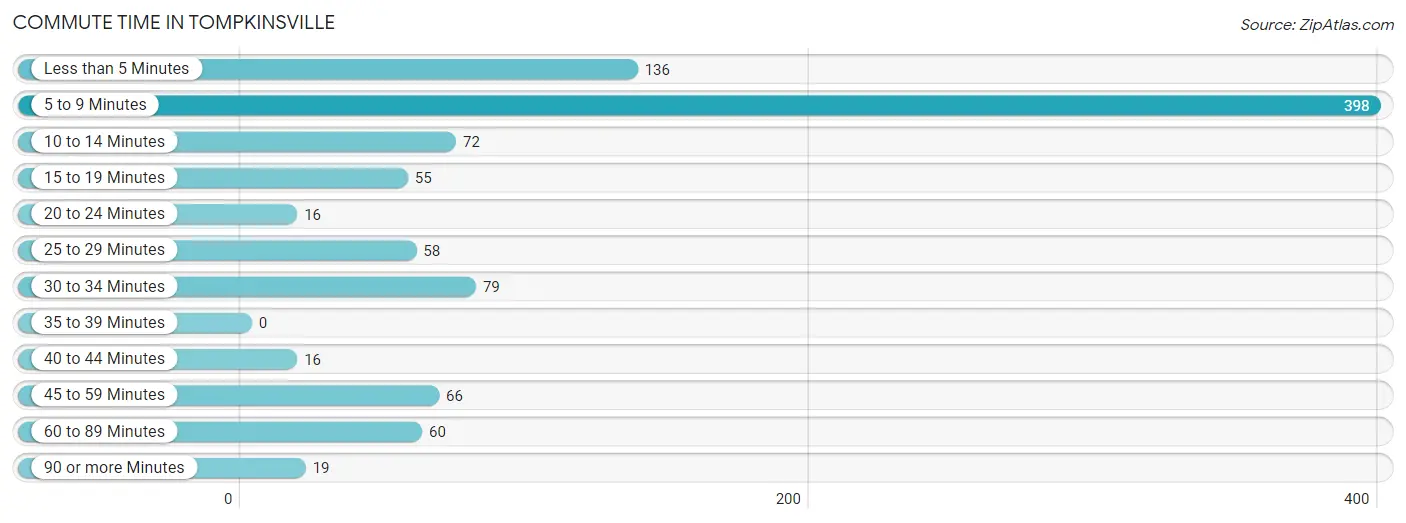
Commute Time in Tompkinsville
The most frequently occuring commute durations in Tompkinsville are 5 to 9 minutes (398 commuters, 40.8%), less than 5 minutes (136 commuters, 14.0%), and 30 to 34 minutes (79 commuters, 8.1%).
| Commute Time | # Commuters | % Commuters |
| Less than 5 Minutes | 136 | 14.0% |
| 5 to 9 Minutes | 398 | 40.8% |
| 10 to 14 Minutes | 72 | 7.4% |
| 15 to 19 Minutes | 55 | 5.6% |
| 20 to 24 Minutes | 16 | 1.6% |
| 25 to 29 Minutes | 58 | 5.9% |
| 30 to 34 Minutes | 79 | 8.1% |
| 35 to 39 Minutes | 0 | 0.0% |
| 40 to 44 Minutes | 16 | 1.6% |
| 45 to 59 Minutes | 66 | 6.8% |
| 60 to 89 Minutes | 60 | 6.1% |
| 90 or more Minutes | 19 | 1.9% |
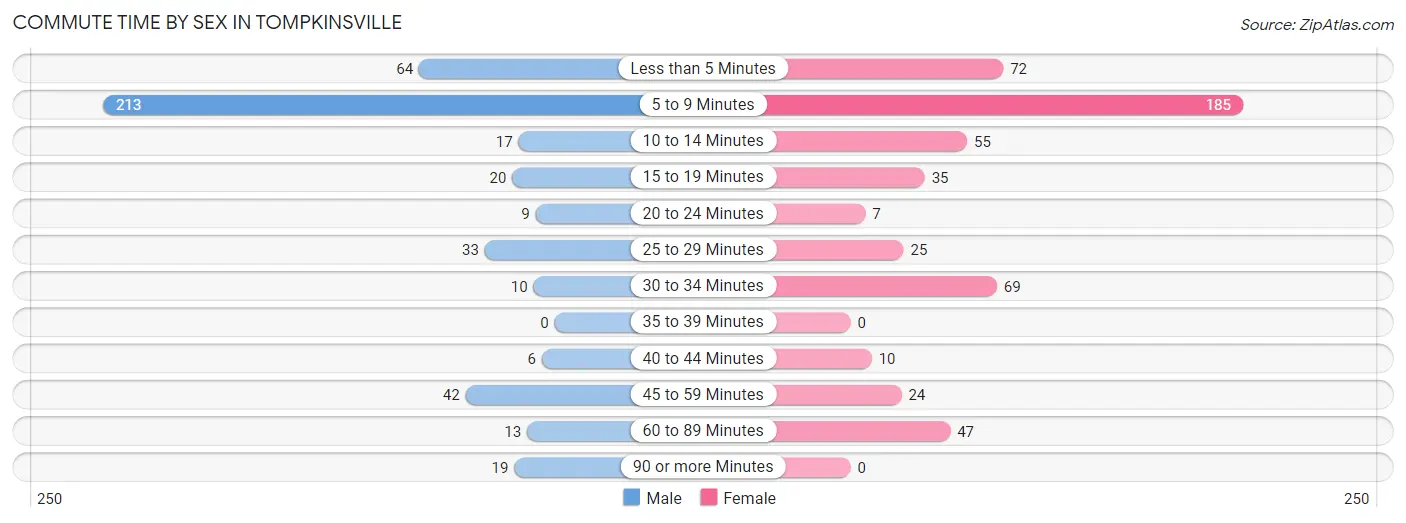
Commute Time by Sex in Tompkinsville
The most common commute times in Tompkinsville are 5 to 9 minutes (213 commuters, 47.8%) for males and 5 to 9 minutes (185 commuters, 35.0%) for females.
| Commute Time | Male | Female |
| Less than 5 Minutes | 64 (14.3%) | 72 (13.6%) |
| 5 to 9 Minutes | 213 (47.8%) | 185 (35.0%) |
| 10 to 14 Minutes | 17 (3.8%) | 55 (10.4%) |
| 15 to 19 Minutes | 20 (4.5%) | 35 (6.6%) |
| 20 to 24 Minutes | 9 (2.0%) | 7 (1.3%) |
| 25 to 29 Minutes | 33 (7.4%) | 25 (4.7%) |
| 30 to 34 Minutes | 10 (2.2%) | 69 (13.0%) |
| 35 to 39 Minutes | 0 (0.0%) | 0 (0.0%) |
| 40 to 44 Minutes | 6 (1.3%) | 10 (1.9%) |
| 45 to 59 Minutes | 42 (9.4%) | 24 (4.5%) |
| 60 to 89 Minutes | 13 (2.9%) | 47 (8.9%) |
| 90 or more Minutes | 19 (4.3%) | 0 (0.0%) |
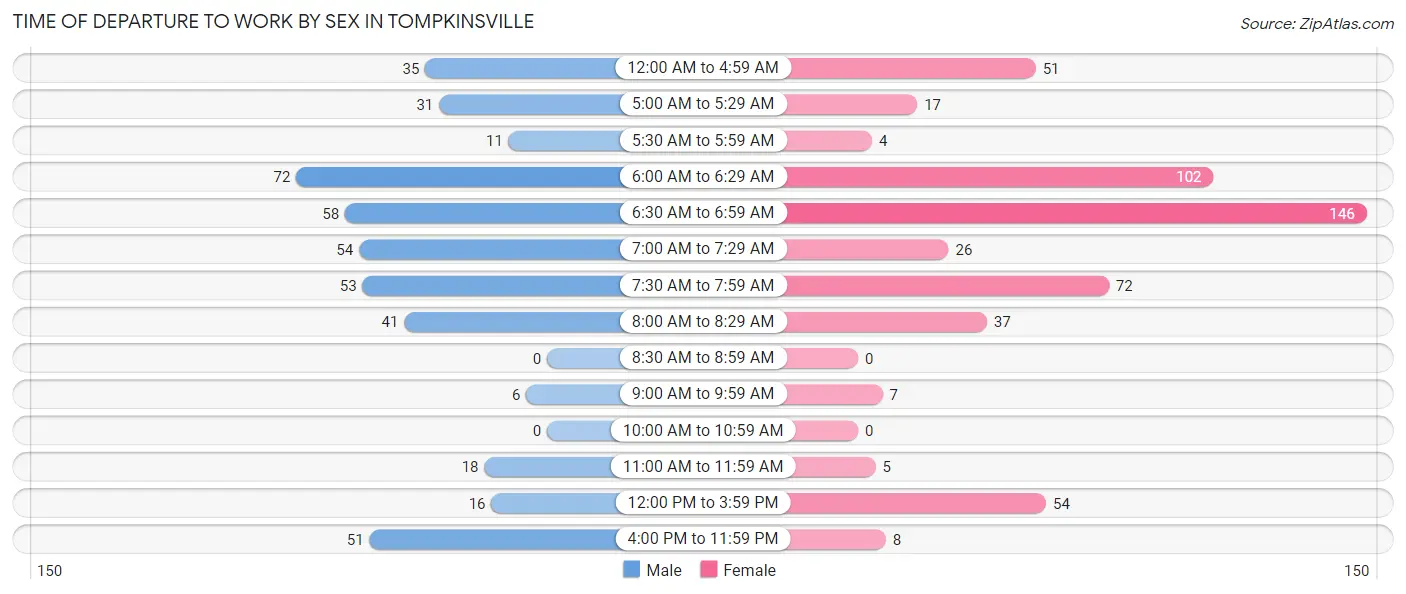
Time of Departure to Work by Sex in Tompkinsville
The most frequent times of departure to work in Tompkinsville are 6:00 AM to 6:29 AM (72, 16.1%) for males and 6:30 AM to 6:59 AM (146, 27.6%) for females.
| Time of Departure | Male | Female |
| 12:00 AM to 4:59 AM | 35 (7.9%) | 51 (9.6%) |
| 5:00 AM to 5:29 AM | 31 (7.0%) | 17 (3.2%) |
| 5:30 AM to 5:59 AM | 11 (2.5%) | 4 (0.8%) |
| 6:00 AM to 6:29 AM | 72 (16.1%) | 102 (19.3%) |
| 6:30 AM to 6:59 AM | 58 (13.0%) | 146 (27.6%) |
| 7:00 AM to 7:29 AM | 54 (12.1%) | 26 (4.9%) |
| 7:30 AM to 7:59 AM | 53 (11.9%) | 72 (13.6%) |
| 8:00 AM to 8:29 AM | 41 (9.2%) | 37 (7.0%) |
| 8:30 AM to 8:59 AM | 0 (0.0%) | 0 (0.0%) |
| 9:00 AM to 9:59 AM | 6 (1.3%) | 7 (1.3%) |
| 10:00 AM to 10:59 AM | 0 (0.0%) | 0 (0.0%) |
| 11:00 AM to 11:59 AM | 18 (4.0%) | 5 (0.9%) |
| 12:00 PM to 3:59 PM | 16 (3.6%) | 54 (10.2%) |
| 4:00 PM to 11:59 PM | 51 (11.4%) | 8 (1.5%) |
| Total | 446 (100.0%) | 529 (100.0%) |
Housing Occupancy in Tompkinsville
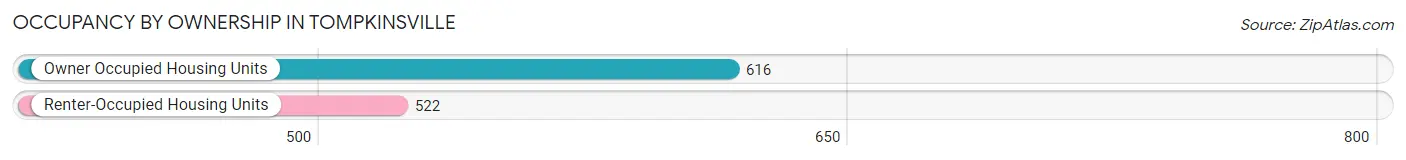
Occupancy by Ownership in Tompkinsville
Of the total 1,138 dwellings in Tompkinsville, owner-occupied units account for 616 (54.1%), while renter-occupied units make up 522 (45.9%).
| Occupancy | # Housing Units | % Housing Units |
| Owner Occupied Housing Units | 616 | 54.1% |
| Renter-Occupied Housing Units | 522 | 45.9% |
| Total Occupied Housing Units | 1,138 | 100.0% |
Occupancy by Household Size in Tompkinsville
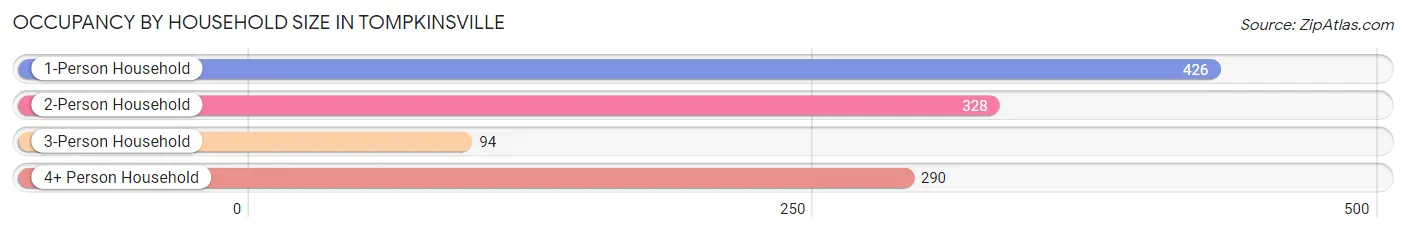
| Household Size | # Housing Units | % Housing Units |
| 1-Person Household | 426 | 37.4% |
| 2-Person Household | 328 | 28.8% |
| 3-Person Household | 94 | 8.3% |
| 4+ Person Household | 290 | 25.5% |
| Total Housing Units | 1,138 | 100.0% |
Occupancy by Ownership by Household Size in Tompkinsville
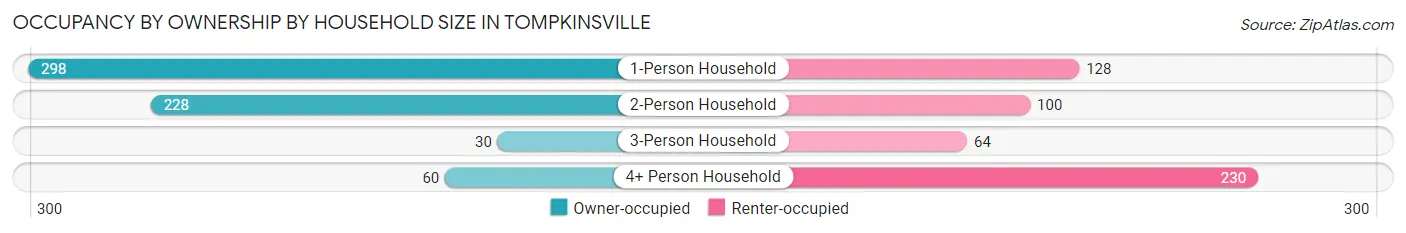
| Household Size | Owner-occupied | Renter-occupied |
| 1-Person Household | 298 (70.0%) | 128 (30.0%) |
| 2-Person Household | 228 (69.5%) | 100 (30.5%) |
| 3-Person Household | 30 (31.9%) | 64 (68.1%) |
| 4+ Person Household | 60 (20.7%) | 230 (79.3%) |
| Total Housing Units | 616 (54.1%) | 522 (45.9%) |
Occupancy by Educational Attainment in Tompkinsville
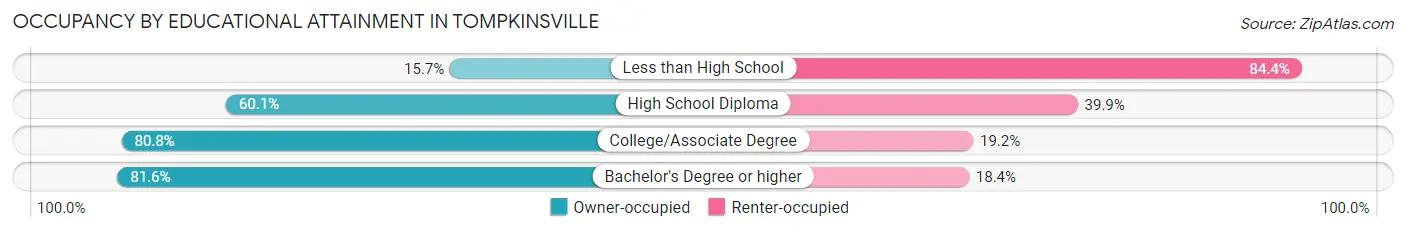
| Household Size | Owner-occupied | Renter-occupied |
| Less than High School | 49 (15.7%) | 264 (84.4%) |
| High School Diploma | 292 (60.1%) | 194 (39.9%) |
| College/Associate Degree | 164 (80.8%) | 39 (19.2%) |
| Bachelor's Degree or higher | 111 (81.6%) | 25 (18.4%) |
Occupancy by Age of Householder in Tompkinsville
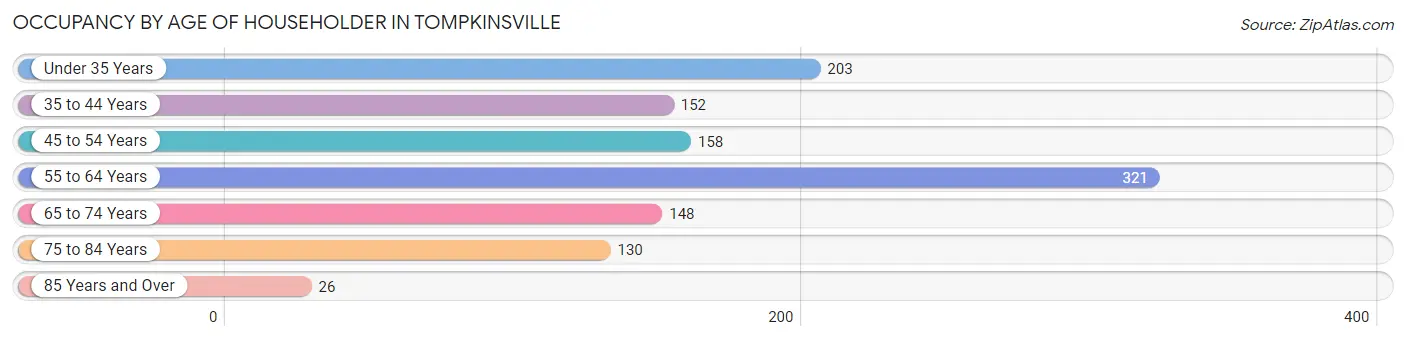
| Age Bracket | # Households | % Households |
| Under 35 Years | 203 | 17.8% |
| 35 to 44 Years | 152 | 13.4% |
| 45 to 54 Years | 158 | 13.9% |
| 55 to 64 Years | 321 | 28.2% |
| 65 to 74 Years | 148 | 13.0% |
| 75 to 84 Years | 130 | 11.4% |
| 85 Years and Over | 26 | 2.3% |
| Total | 1,138 | 100.0% |
Housing Finances in Tompkinsville
Median Income by Occupancy in Tompkinsville
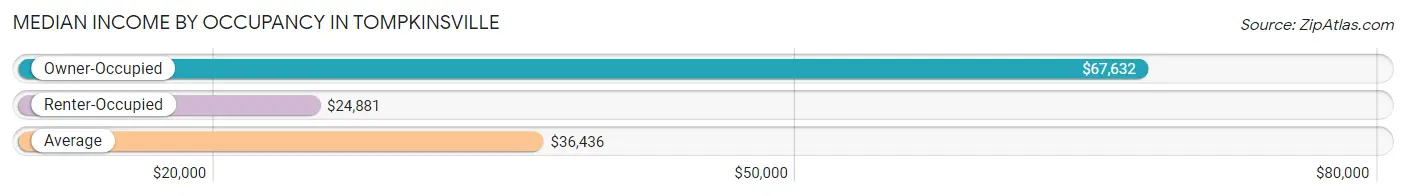
| Occupancy Type | # Households | Median Income |
| Owner-Occupied | 616 (54.1%) | $67,632 |
| Renter-Occupied | 522 (45.9%) | $24,881 |
| Average | 1,138 (100.0%) | $36,436 |
Occupancy by Householder Income Bracket in Tompkinsville
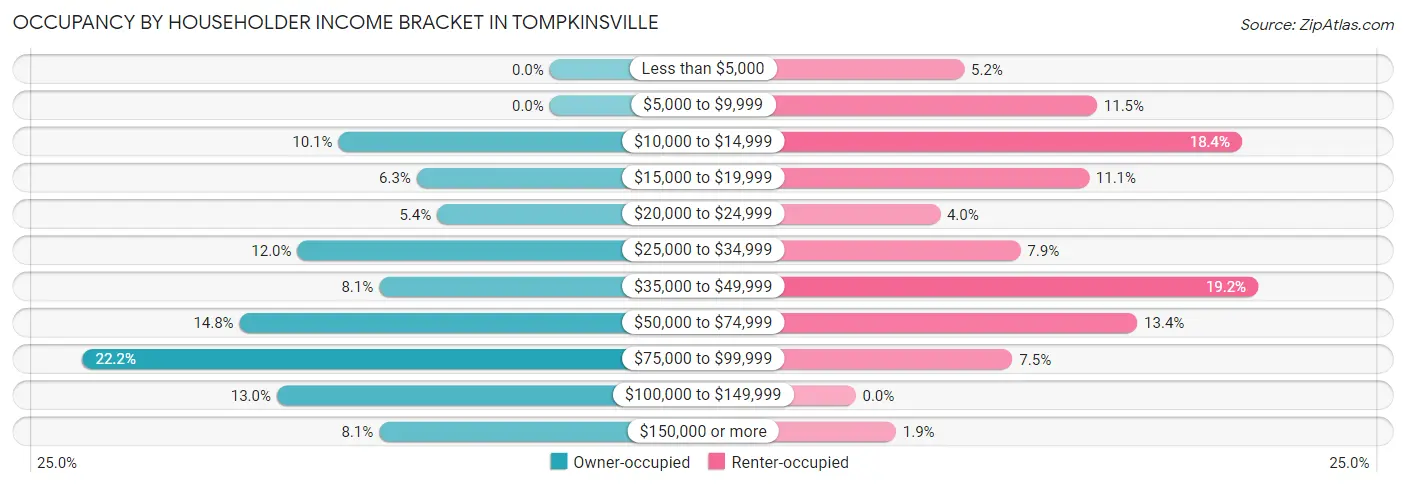
| Income Bracket | Owner-occupied | Renter-occupied |
| Less than $5,000 | 0 (0.0%) | 27 (5.2%) |
| $5,000 to $9,999 | 0 (0.0%) | 60 (11.5%) |
| $10,000 to $14,999 | 62 (10.1%) | 96 (18.4%) |
| $15,000 to $19,999 | 39 (6.3%) | 58 (11.1%) |
| $20,000 to $24,999 | 33 (5.4%) | 21 (4.0%) |
| $25,000 to $34,999 | 74 (12.0%) | 41 (7.9%) |
| $35,000 to $49,999 | 50 (8.1%) | 100 (19.2%) |
| $50,000 to $74,999 | 91 (14.8%) | 70 (13.4%) |
| $75,000 to $99,999 | 137 (22.2%) | 39 (7.5%) |
| $100,000 to $149,999 | 80 (13.0%) | 0 (0.0%) |
| $150,000 or more | 50 (8.1%) | 10 (1.9%) |
| Total | 616 (100.0%) | 522 (100.0%) |
Monthly Housing Cost Tiers in Tompkinsville
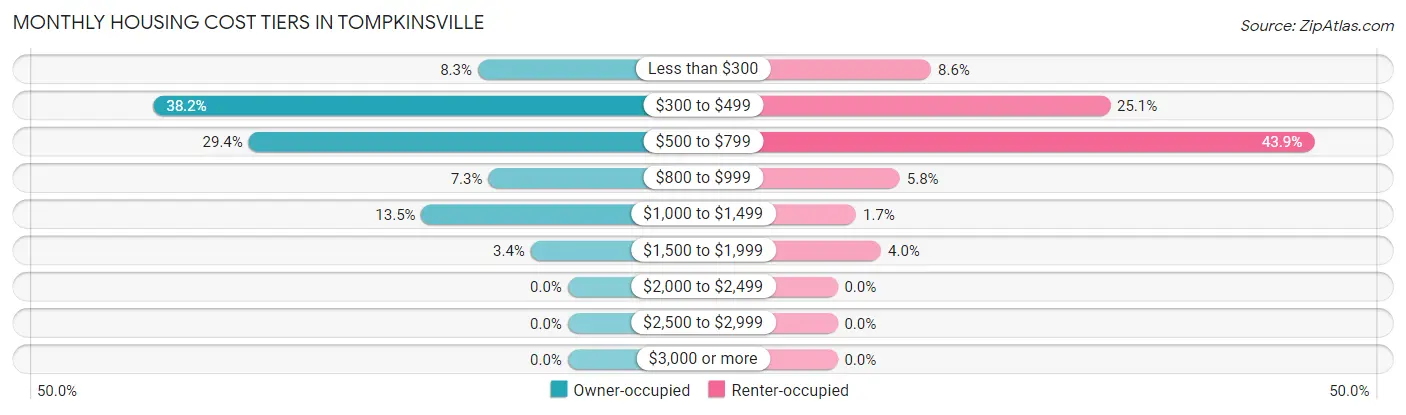
| Monthly Cost | Owner-occupied | Renter-occupied |
| Less than $300 | 51 (8.3%) | 45 (8.6%) |
| $300 to $499 | 235 (38.2%) | 131 (25.1%) |
| $500 to $799 | 181 (29.4%) | 229 (43.9%) |
| $800 to $999 | 45 (7.3%) | 30 (5.8%) |
| $1,000 to $1,499 | 83 (13.5%) | 9 (1.7%) |
| $1,500 to $1,999 | 21 (3.4%) | 21 (4.0%) |
| $2,000 to $2,499 | 0 (0.0%) | 0 (0.0%) |
| $2,500 to $2,999 | 0 (0.0%) | 0 (0.0%) |
| $3,000 or more | 0 (0.0%) | 0 (0.0%) |
| Total | 616 (100.0%) | 522 (100.0%) |
Physical Housing Characteristics in Tompkinsville
Housing Structures in Tompkinsville
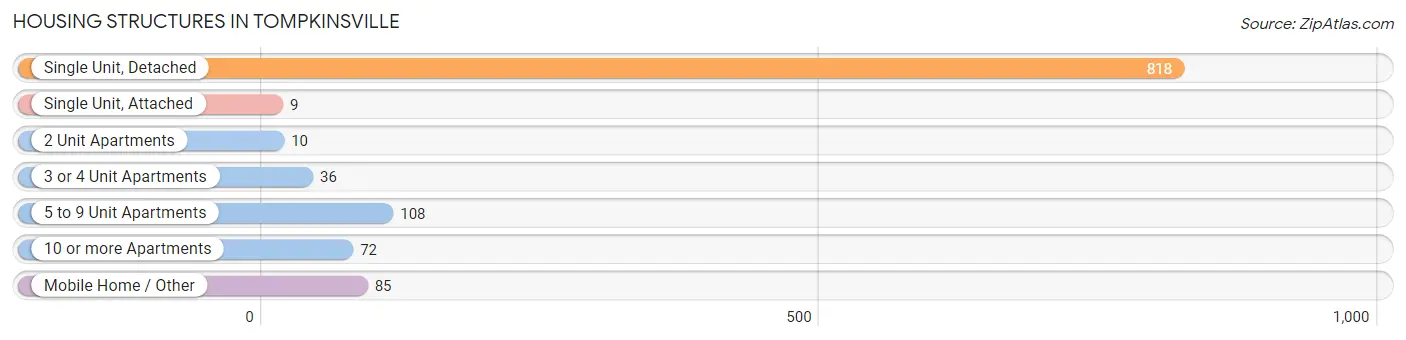
| Structure Type | # Housing Units | % Housing Units |
| Single Unit, Detached | 818 | 71.9% |
| Single Unit, Attached | 9 | 0.8% |
| 2 Unit Apartments | 10 | 0.9% |
| 3 or 4 Unit Apartments | 36 | 3.2% |
| 5 to 9 Unit Apartments | 108 | 9.5% |
| 10 or more Apartments | 72 | 6.3% |
| Mobile Home / Other | 85 | 7.5% |
| Total | 1,138 | 100.0% |
Housing Structures by Occupancy in Tompkinsville
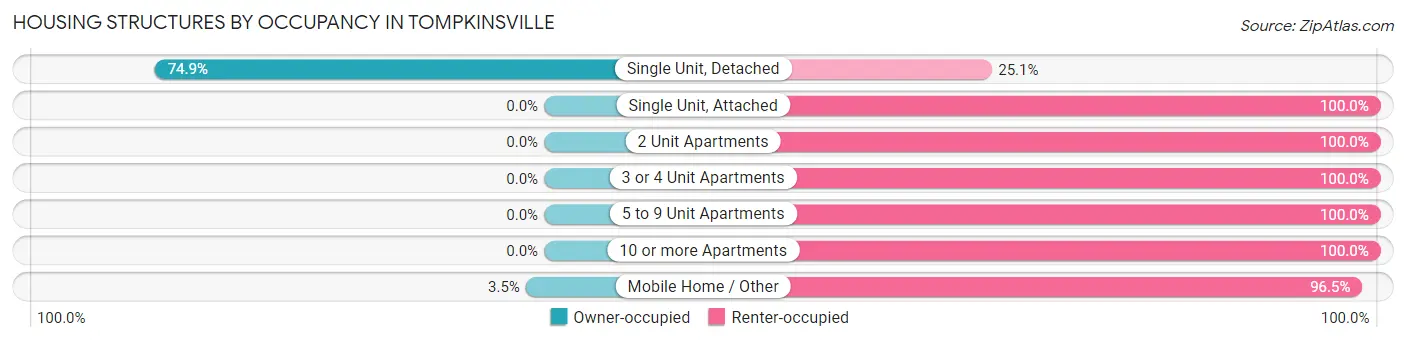
| Structure Type | Owner-occupied | Renter-occupied |
| Single Unit, Detached | 613 (74.9%) | 205 (25.1%) |
| Single Unit, Attached | 0 (0.0%) | 9 (100.0%) |
| 2 Unit Apartments | 0 (0.0%) | 10 (100.0%) |
| 3 or 4 Unit Apartments | 0 (0.0%) | 36 (100.0%) |
| 5 to 9 Unit Apartments | 0 (0.0%) | 108 (100.0%) |
| 10 or more Apartments | 0 (0.0%) | 72 (100.0%) |
| Mobile Home / Other | 3 (3.5%) | 82 (96.5%) |
| Total | 616 (54.1%) | 522 (45.9%) |
Housing Structures by Number of Rooms in Tompkinsville
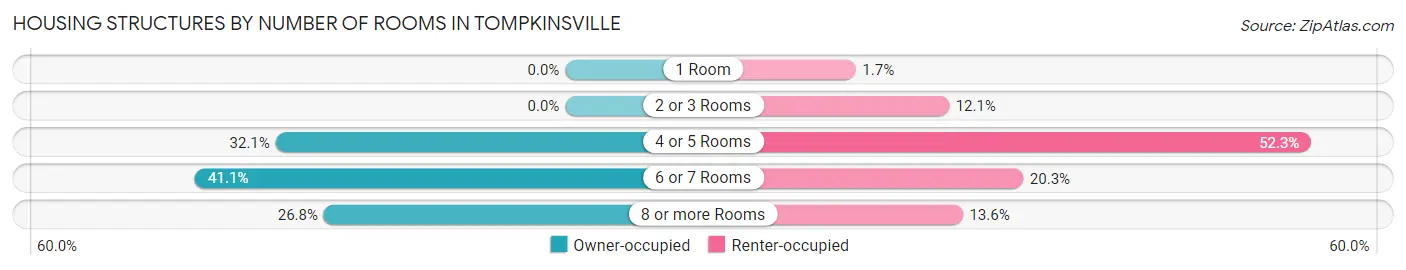
| Number of Rooms | Owner-occupied | Renter-occupied |
| 1 Room | 0 (0.0%) | 9 (1.7%) |
| 2 or 3 Rooms | 0 (0.0%) | 63 (12.1%) |
| 4 or 5 Rooms | 198 (32.1%) | 273 (52.3%) |
| 6 or 7 Rooms | 253 (41.1%) | 106 (20.3%) |
| 8 or more Rooms | 165 (26.8%) | 71 (13.6%) |
| Total | 616 (100.0%) | 522 (100.0%) |
Housing Structure by Heating Type in Tompkinsville
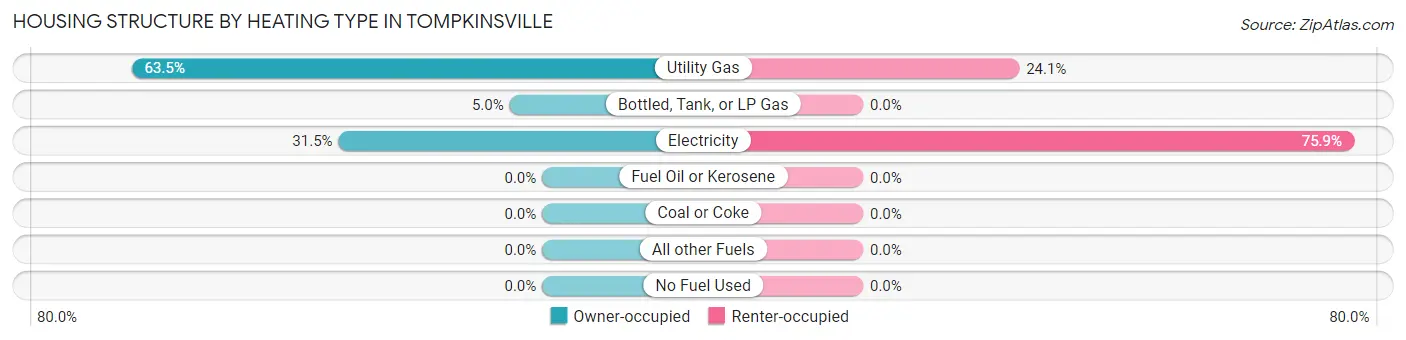
| Heating Type | Owner-occupied | Renter-occupied |
| Utility Gas | 391 (63.5%) | 126 (24.1%) |
| Bottled, Tank, or LP Gas | 31 (5.0%) | 0 (0.0%) |
| Electricity | 194 (31.5%) | 396 (75.9%) |
| Fuel Oil or Kerosene | 0 (0.0%) | 0 (0.0%) |
| Coal or Coke | 0 (0.0%) | 0 (0.0%) |
| All other Fuels | 0 (0.0%) | 0 (0.0%) |
| No Fuel Used | 0 (0.0%) | 0 (0.0%) |
| Total | 616 (100.0%) | 522 (100.0%) |
Household Vehicle Usage in Tompkinsville
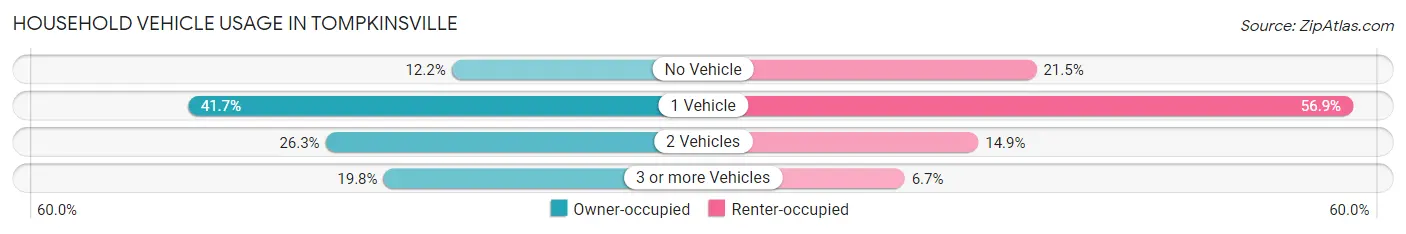
| Vehicles per Household | Owner-occupied | Renter-occupied |
| No Vehicle | 75 (12.2%) | 112 (21.5%) |
| 1 Vehicle | 257 (41.7%) | 297 (56.9%) |
| 2 Vehicles | 162 (26.3%) | 78 (14.9%) |
| 3 or more Vehicles | 122 (19.8%) | 35 (6.7%) |
| Total | 616 (100.0%) | 522 (100.0%) |
Real Estate & Mortgages in Tompkinsville
Real Estate and Mortgage Overview in Tompkinsville
| Characteristic | Without Mortgage | With Mortgage |
| Housing Units | 398 | 218 |
| Median Property Value | $117,000 | $91,700 |
| Median Household Income | $57,895 | $17 |
| Monthly Housing Costs | $434 | $0 |
| Real Estate Taxes | $818 | $0 |
Property Value by Mortgage Status in Tompkinsville
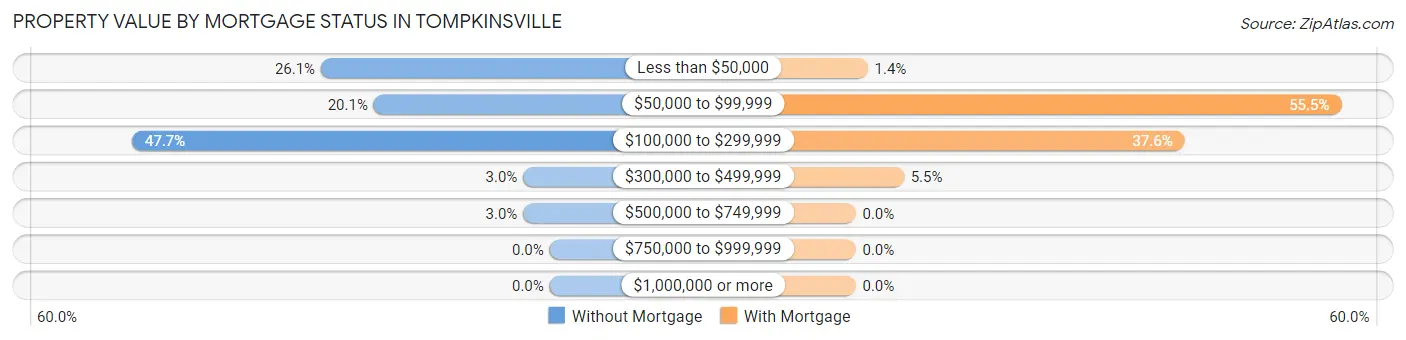
| Property Value | Without Mortgage | With Mortgage |
| Less than $50,000 | 104 (26.1%) | 3 (1.4%) |
| $50,000 to $99,999 | 80 (20.1%) | 121 (55.5%) |
| $100,000 to $299,999 | 190 (47.7%) | 82 (37.6%) |
| $300,000 to $499,999 | 12 (3.0%) | 12 (5.5%) |
| $500,000 to $749,999 | 12 (3.0%) | 0 (0.0%) |
| $750,000 to $999,999 | 0 (0.0%) | 0 (0.0%) |
| $1,000,000 or more | 0 (0.0%) | 0 (0.0%) |
| Total | 398 (100.0%) | 218 (100.0%) |
Household Income by Mortgage Status in Tompkinsville
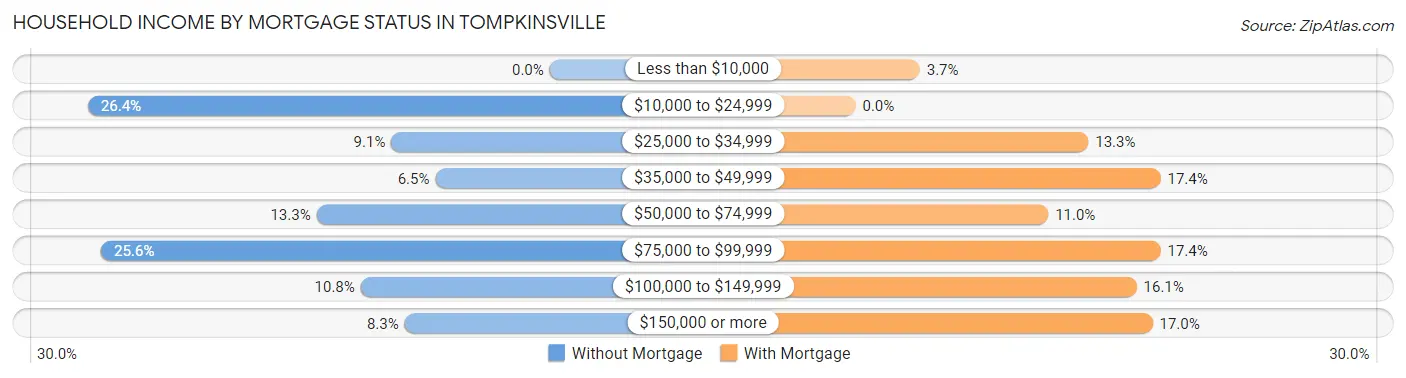
| Household Income | Without Mortgage | With Mortgage |
| Less than $10,000 | 0 (0.0%) | 8 (3.7%) |
| $10,000 to $24,999 | 105 (26.4%) | 0 (0.0%) |
| $25,000 to $34,999 | 36 (9.0%) | 29 (13.3%) |
| $35,000 to $49,999 | 26 (6.5%) | 38 (17.4%) |
| $50,000 to $74,999 | 53 (13.3%) | 24 (11.0%) |
| $75,000 to $99,999 | 102 (25.6%) | 38 (17.4%) |
| $100,000 to $149,999 | 43 (10.8%) | 35 (16.1%) |
| $150,000 or more | 33 (8.3%) | 37 (17.0%) |
| Total | 398 (100.0%) | 218 (100.0%) |
Property Value to Household Income Ratio in Tompkinsville
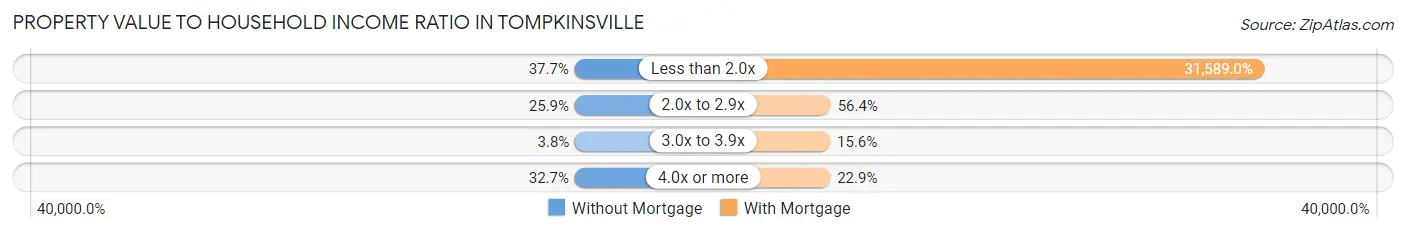
| Value-to-Income Ratio | Without Mortgage | With Mortgage |
| Less than 2.0x | 150 (37.7%) | 68,864 (31,589.0%) |
| 2.0x to 2.9x | 103 (25.9%) | 123 (56.4%) |
| 3.0x to 3.9x | 15 (3.8%) | 34 (15.6%) |
| 4.0x or more | 130 (32.7%) | 50 (22.9%) |
| Total | 398 (100.0%) | 218 (100.0%) |
Real Estate Taxes by Mortgage Status in Tompkinsville
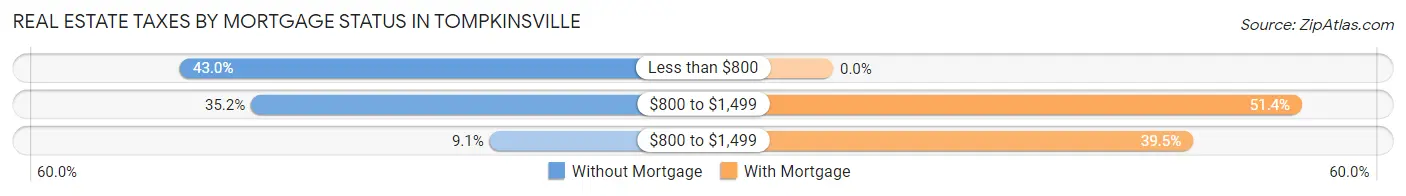
| Property Taxes | Without Mortgage | With Mortgage |
| Less than $800 | 171 (43.0%) | 0 (0.0%) |
| $800 to $1,499 | 140 (35.2%) | 112 (51.4%) |
| $800 to $1,499 | 36 (9.0%) | 86 (39.5%) |
| Total | 398 (100.0%) | 218 (100.0%) |
Health & Disability in Tompkinsville
Health Insurance Coverage by Age in Tompkinsville
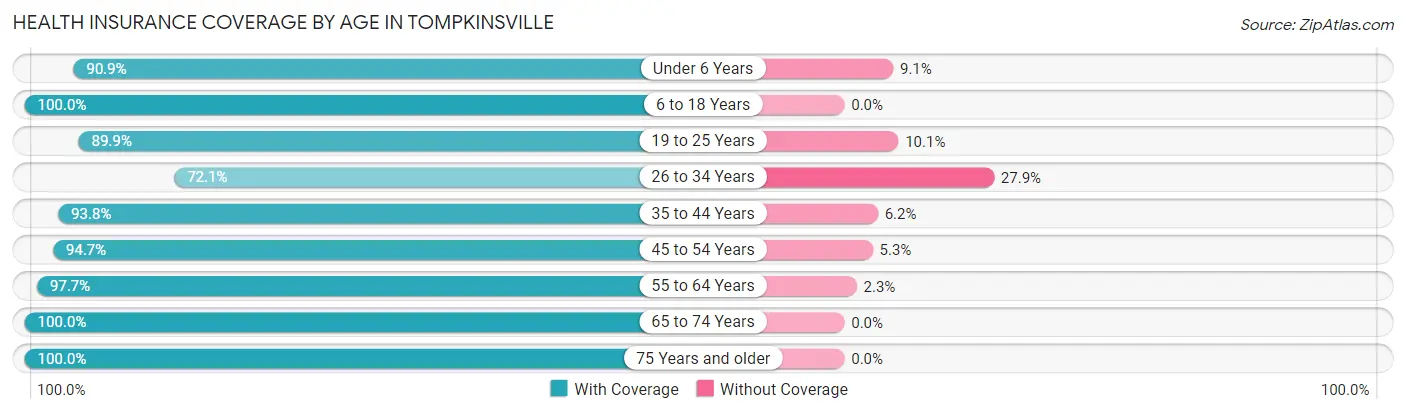
| Age Bracket | With Coverage | Without Coverage |
| Under 6 Years | 210 (90.9%) | 21 (9.1%) |
| 6 to 18 Years | 540 (100.0%) | 0 (0.0%) |
| 19 to 25 Years | 161 (89.9%) | 18 (10.1%) |
| 26 to 34 Years | 168 (72.1%) | 65 (27.9%) |
| 35 to 44 Years | 271 (93.8%) | 18 (6.2%) |
| 45 to 54 Years | 269 (94.7%) | 15 (5.3%) |
| 55 to 64 Years | 427 (97.7%) | 10 (2.3%) |
| 65 to 74 Years | 185 (100.0%) | 0 (0.0%) |
| 75 Years and older | 193 (100.0%) | 0 (0.0%) |
| Total | 2,424 (94.3%) | 147 (5.7%) |
Health Insurance Coverage by Citizenship Status in Tompkinsville
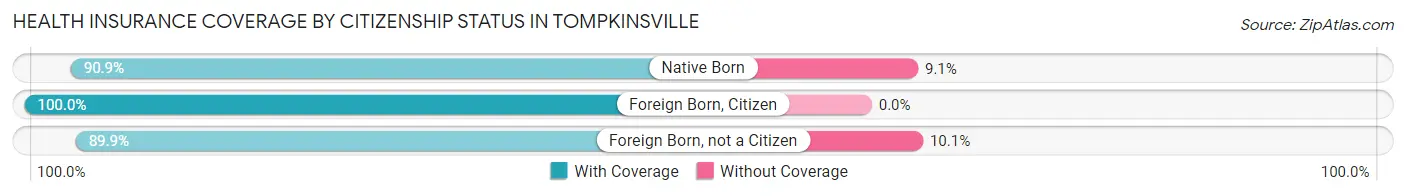
| Citizenship Status | With Coverage | Without Coverage |
| Native Born | 210 (90.9%) | 21 (9.1%) |
| Foreign Born, Citizen | 540 (100.0%) | 0 (0.0%) |
| Foreign Born, not a Citizen | 161 (89.9%) | 18 (10.1%) |
Health Insurance Coverage by Household Income in Tompkinsville
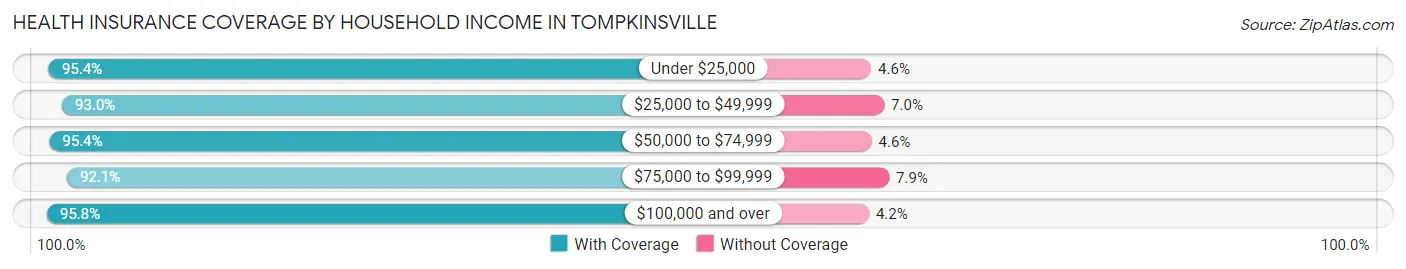
| Household Income | With Coverage | Without Coverage |
| Under $25,000 | 691 (95.4%) | 33 (4.6%) |
| $25,000 to $49,999 | 518 (93.0%) | 39 (7.0%) |
| $50,000 to $74,999 | 432 (95.4%) | 21 (4.6%) |
| $75,000 to $99,999 | 348 (92.1%) | 30 (7.9%) |
| $100,000 and over | 415 (95.8%) | 18 (4.2%) |
Public vs Private Health Insurance Coverage by Age in Tompkinsville
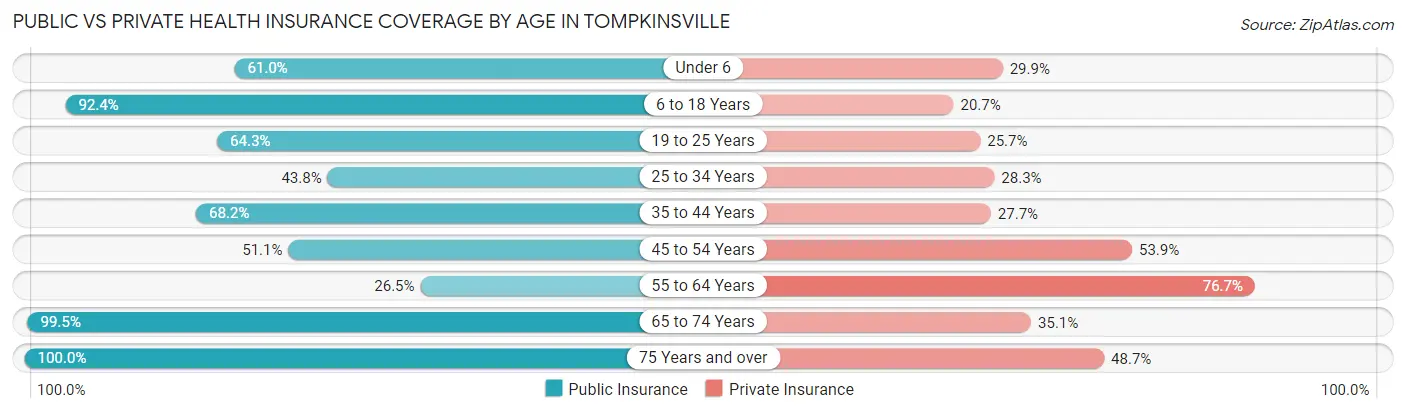
| Age Bracket | Public Insurance | Private Insurance |
| Under 6 | 141 (61.0%) | 69 (29.9%) |
| 6 to 18 Years | 499 (92.4%) | 112 (20.7%) |
| 19 to 25 Years | 115 (64.2%) | 46 (25.7%) |
| 25 to 34 Years | 102 (43.8%) | 66 (28.3%) |
| 35 to 44 Years | 197 (68.2%) | 80 (27.7%) |
| 45 to 54 Years | 145 (51.1%) | 153 (53.9%) |
| 55 to 64 Years | 116 (26.5%) | 335 (76.7%) |
| 65 to 74 Years | 184 (99.5%) | 65 (35.1%) |
| 75 Years and over | 193 (100.0%) | 94 (48.7%) |
| Total | 1,692 (65.8%) | 1,020 (39.7%) |
Disability Status by Sex by Age in Tompkinsville
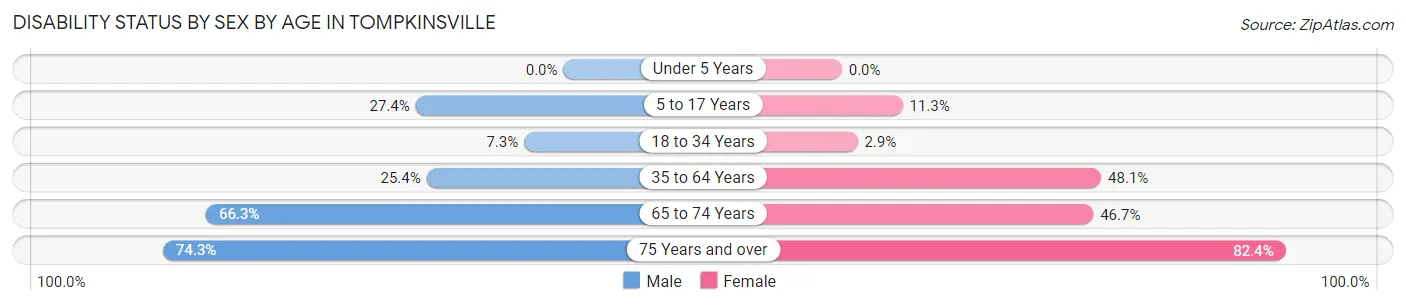
| Age Bracket | Male | Female |
| Under 5 Years | 0 (0.0%) | 0 (0.0%) |
| 5 to 17 Years | 85 (27.4%) | 31 (11.3%) |
| 18 to 34 Years | 10 (7.3%) | 8 (2.9%) |
| 35 to 64 Years | 113 (25.4%) | 272 (48.1%) |
| 65 to 74 Years | 63 (66.3%) | 42 (46.7%) |
| 75 Years and over | 55 (74.3%) | 98 (82.4%) |
Disability Class by Sex by Age in Tompkinsville
Disability Class: Hearing Difficulty
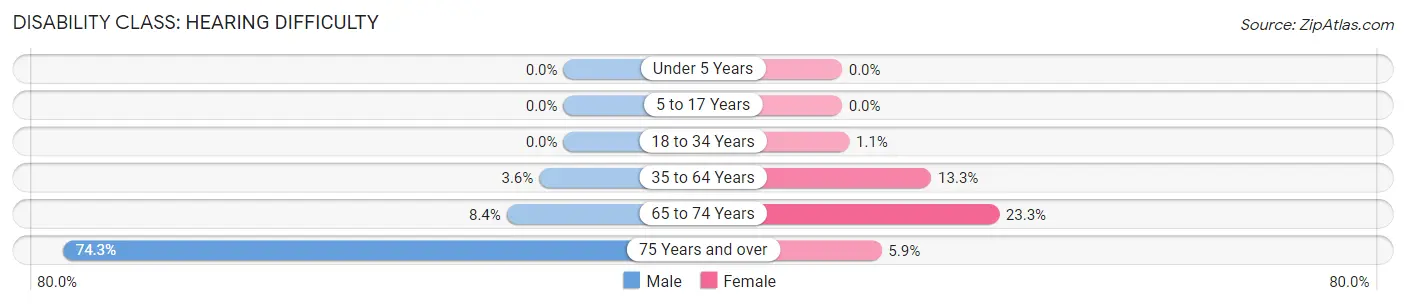
| Age Bracket | Male | Female |
| Under 5 Years | 0 (0.0%) | 0 (0.0%) |
| 5 to 17 Years | 0 (0.0%) | 0 (0.0%) |
| 18 to 34 Years | 0 (0.0%) | 3 (1.1%) |
| 35 to 64 Years | 16 (3.6%) | 75 (13.3%) |
| 65 to 74 Years | 8 (8.4%) | 21 (23.3%) |
| 75 Years and over | 55 (74.3%) | 7 (5.9%) |
Disability Class: Vision Difficulty
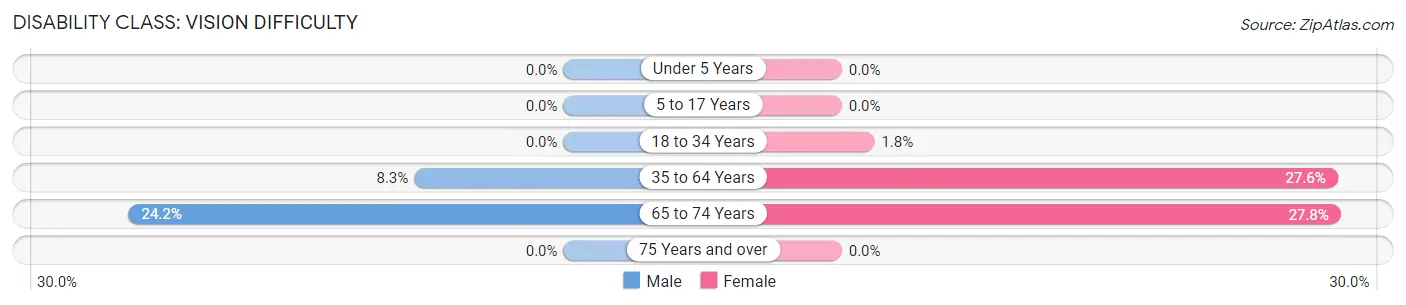
| Age Bracket | Male | Female |
| Under 5 Years | 0 (0.0%) | 0 (0.0%) |
| 5 to 17 Years | 0 (0.0%) | 0 (0.0%) |
| 18 to 34 Years | 0 (0.0%) | 5 (1.8%) |
| 35 to 64 Years | 37 (8.3%) | 156 (27.6%) |
| 65 to 74 Years | 23 (24.2%) | 25 (27.8%) |
| 75 Years and over | 0 (0.0%) | 0 (0.0%) |
Disability Class: Cognitive Difficulty
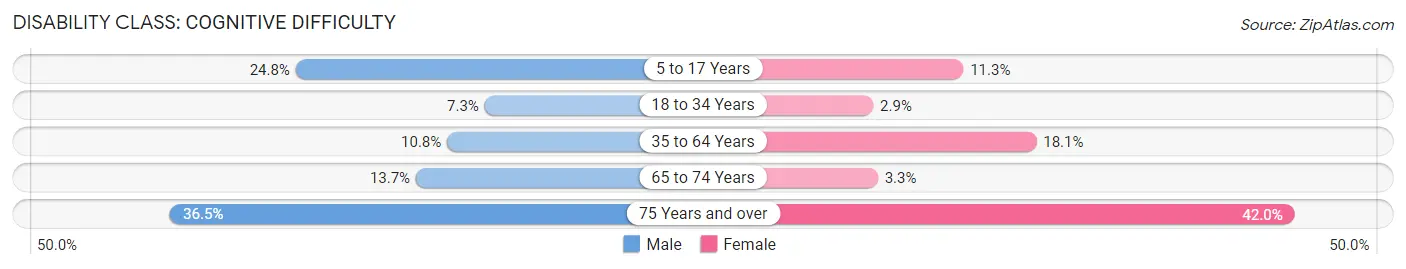
| Age Bracket | Male | Female |
| 5 to 17 Years | 77 (24.8%) | 31 (11.3%) |
| 18 to 34 Years | 10 (7.3%) | 8 (2.9%) |
| 35 to 64 Years | 48 (10.8%) | 102 (18.0%) |
| 65 to 74 Years | 13 (13.7%) | 3 (3.3%) |
| 75 Years and over | 27 (36.5%) | 50 (42.0%) |
Disability Class: Ambulatory Difficulty
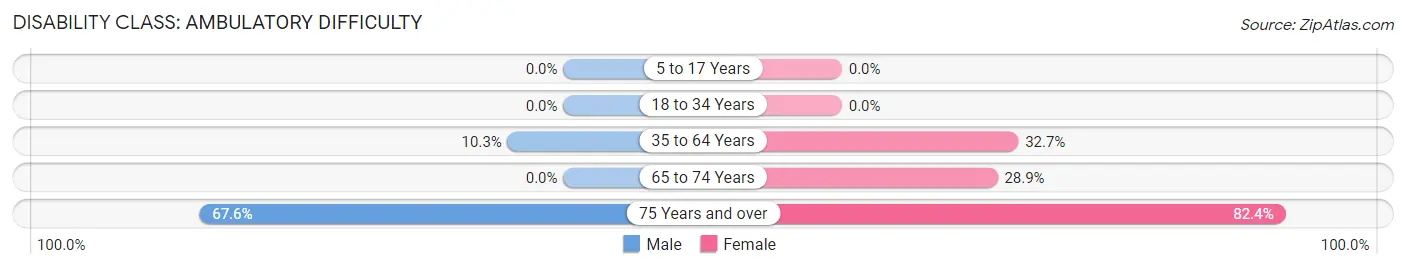
| Age Bracket | Male | Female |
| 5 to 17 Years | 0 (0.0%) | 0 (0.0%) |
| 18 to 34 Years | 0 (0.0%) | 0 (0.0%) |
| 35 to 64 Years | 46 (10.3%) | 185 (32.7%) |
| 65 to 74 Years | 0 (0.0%) | 26 (28.9%) |
| 75 Years and over | 50 (67.6%) | 98 (82.4%) |
Disability Class: Self-Care Difficulty
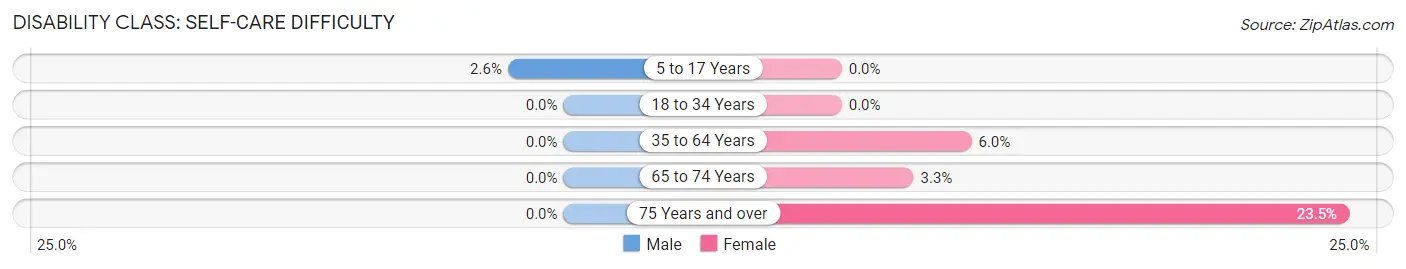
| Age Bracket | Male | Female |
| 5 to 17 Years | 8 (2.6%) | 0 (0.0%) |
| 18 to 34 Years | 0 (0.0%) | 0 (0.0%) |
| 35 to 64 Years | 0 (0.0%) | 34 (6.0%) |
| 65 to 74 Years | 0 (0.0%) | 3 (3.3%) |
| 75 Years and over | 0 (0.0%) | 28 (23.5%) |
Technology Access in Tompkinsville
Computing Device Access in Tompkinsville
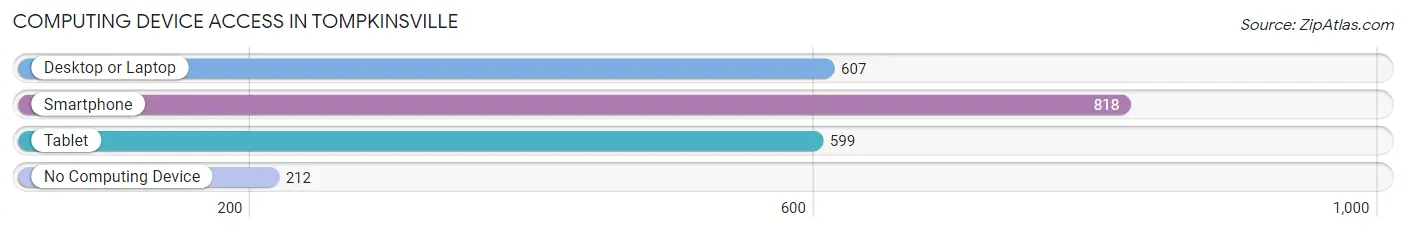
| Device Type | # Households | % Households |
| Desktop or Laptop | 607 | 53.3% |
| Smartphone | 818 | 71.9% |
| Tablet | 599 | 52.6% |
| No Computing Device | 212 | 18.6% |
| Total | 1,138 | 100.0% |
Internet Access in Tompkinsville
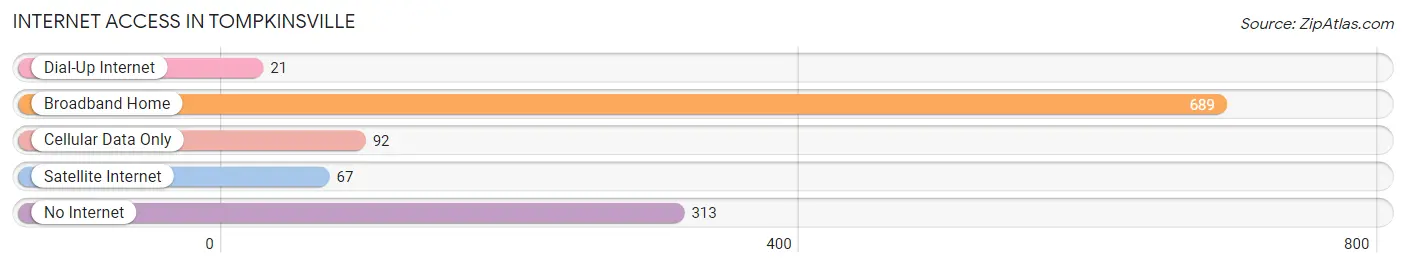
| Internet Type | # Households | % Households |
| Dial-Up Internet | 21 | 1.8% |
| Broadband Home | 689 | 60.5% |
| Cellular Data Only | 92 | 8.1% |
| Satellite Internet | 67 | 5.9% |
| No Internet | 313 | 27.5% |
| Total | 1,138 | 100.0% |
Tompkinsville Summary
Tompkinsville is a small town located in Monroe County, Kentucky, United States. It is the county seat of Monroe County and is located in the south-central part of the state. The population was 2,093 at the 2010 census.
History
Tompkinsville was founded in 1820 by William Tompkins, a Revolutionary War veteran. The town was named after him and was incorporated in 1837. The town was originally a trading post and was the first county seat of Monroe County.
Tompkinsville was the site of a Civil War battle in 1862. The Battle of Tompkinsville was fought between Confederate and Union forces. The Union forces were victorious and the town was occupied by Union troops for the remainder of the war.
Geography
Tompkinsville is located at 36°45'45"N 85°37'45"W (36.7625, -85.6292). It is situated in the south-central part of the state, about 20 miles (32 km) south of the Kentucky-Tennessee border. The town is located in the Cumberland Plateau region of Kentucky.
The town is situated on the banks of the Cumberland River and is surrounded by rolling hills and forests. The town is located in a rural area and is surrounded by farmland.
Economy
Tompkinsville's economy is largely based on agriculture and tourism. The town is home to several small businesses, including a grocery store, a hardware store, and a few restaurants.
The town is also home to several manufacturing companies, including a furniture factory and a plastics factory. The town is also home to a number of small farms, which produce a variety of crops, including corn, soybeans, and tobacco.
Demographics
As of the 2010 census, Tompkinsville had a population of 2,093. The racial makeup of the town was 95.3% White, 2.2% African American, 0.3% Native American, 0.2% Asian, 0.1% Pacific Islander, 0.7% from other races, and 1.3% from two or more races. Hispanic or Latino of any race were 1.7% of the population.
The median income for a household in Tompkinsville was $30,938, and the median income for a family was $37,917. The per capita income for the town was $15,945. About 17.2% of families and 20.2% of the population were below the poverty line, including 28.2% of those under age 18 and 16.2% of those age 65 or over.
Conclusion
Tompkinsville is a small town located in Monroe County, Kentucky. It was founded in 1820 and was the site of a Civil War battle in 1862. The town is situated on the banks of the Cumberland River and is surrounded by rolling hills and forests. The economy of Tompkinsville is largely based on agriculture and tourism. As of the 2010 census, the town had a population of 2,093. The median income for a household in Tompkinsville was $30,938, and the median income for a family was $37,917. The town is home to several small businesses, manufacturing companies, and farms.
Common Questions
What is Per Capita Income in Tompkinsville?
Per Capita income in Tompkinsville is $23,418.
What is the Median Family Income in Tompkinsville?
Median Family Income in Tompkinsville is $47,679.
What is the Median Household income in Tompkinsville?
Median Household Income in Tompkinsville is $36,436.
What is Income or Wage Gap in Tompkinsville?
Income or Wage Gap in Tompkinsville is 3.9%.
Women in Tompkinsville earn 96.1 cents for every dollar earned by a man.
What is Inequality or Gini Index in Tompkinsville?
Inequality or Gini Index in Tompkinsville is 0.47.
What is the Total Population of Tompkinsville?
Total Population of Tompkinsville is 2,699.
What is the Total Male Population of Tompkinsville?
Total Male Population of Tompkinsville is 1,222.
What is the Total Female Population of Tompkinsville?
Total Female Population of Tompkinsville is 1,477.
What is the Ratio of Males per 100 Females in Tompkinsville?
There are 82.74 Males per 100 Females in Tompkinsville.
What is the Ratio of Females per 100 Males in Tompkinsville?
There are 120.87 Females per 100 Males in Tompkinsville.
What is the Median Population Age in Tompkinsville?
Median Population Age in Tompkinsville is 37.7 Years.
What is the Average Family Size in Tompkinsville
Average Family Size in Tompkinsville is 2.9 People.
What is the Average Household Size in Tompkinsville
Average Household Size in Tompkinsville is 2.2 People.
How Large is the Labor Force in Tompkinsville?
There are 1,159 People in the Labor Forcein in Tompkinsville.
What is the Percentage of People in the Labor Force in Tompkinsville?
57.2% of People are in the Labor Force in Tompkinsville.
What is the Unemployment Rate in Tompkinsville?
Unemployment Rate in Tompkinsville is 7.8%.