West Buechel, KY Map & Demographics
West Buechel Map
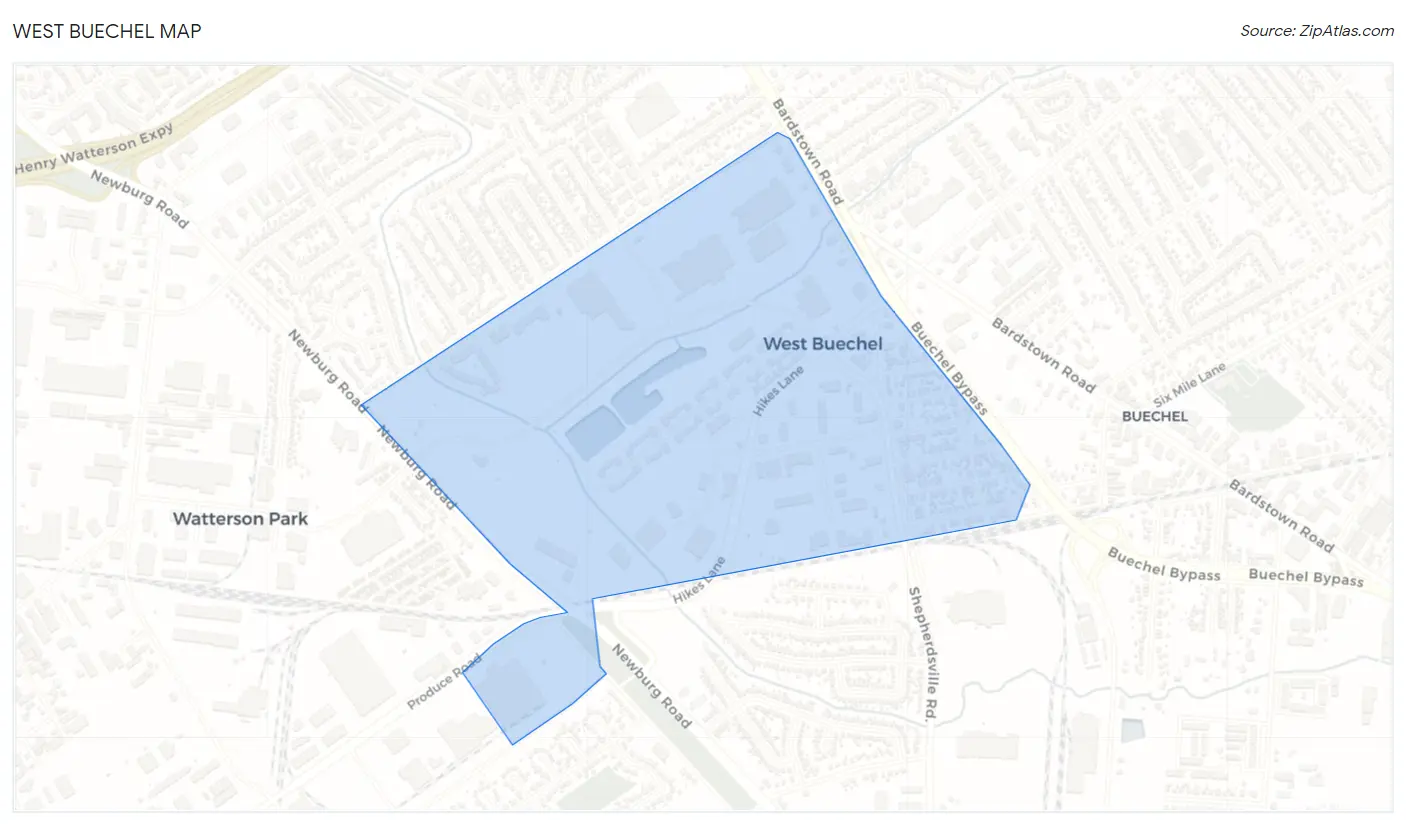
West Buechel Overview
$22,459
PER CAPITA INCOME
$49,167
AVG FAMILY INCOME
$48,750
AVG HOUSEHOLD INCOME
29.6%
WAGE / INCOME GAP [ % ]
70.4¢/ $1
WAGE / INCOME GAP [ $ ]
$12,523
FAMILY INCOME DEFICIT
0.37
INEQUALITY / GINI INDEX
1,936
TOTAL POPULATION
884
MALE POPULATION
1,052
FEMALE POPULATION
84.03
MALES / 100 FEMALES
119.00
FEMALES / 100 MALES
29.7
MEDIAN AGE
3.3
AVG FAMILY SIZE
2.8
AVG HOUSEHOLD SIZE
1,114
LABOR FORCE [ PEOPLE ]
80.0%
PERCENT IN LABOR FORCE
4.8%
UNEMPLOYMENT RATE
Income in West Buechel
Income Overview in West Buechel
Per Capita Income in West Buechel is $22,459, while median incomes of families and households are $49,167 and $48,750 respectively.
| Characteristic | Number | Measure |
| Per Capita Income | 1,936 | $22,459 |
| Median Family Income | 488 | $49,167 |
| Mean Family Income | 488 | $55,995 |
| Median Household Income | 705 | $48,750 |
| Mean Household Income | 705 | $59,767 |
| Income Deficit | 488 | $12,523 |
| Wage / Income Gap (%) | 1,936 | 29.64% |
| Wage / Income Gap ($) | 1,936 | 70.36¢ per $1 |
| Gini / Inequality Index | 1,936 | 0.37 |
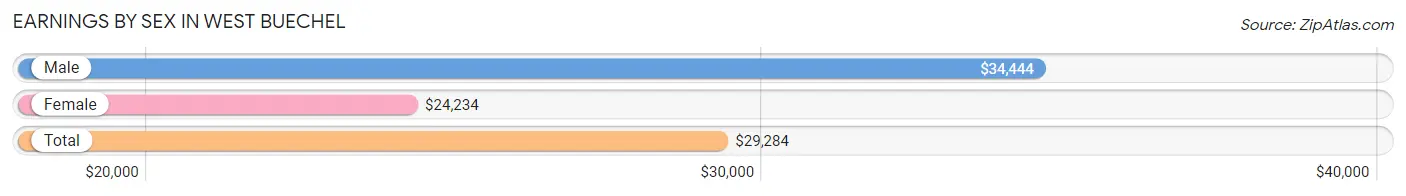
Earnings by Sex in West Buechel
Average Earnings in West Buechel are $29,284, $34,444 for men and $24,234 for women, a difference of 29.6%.
| Sex | Number | Average Earnings |
| Male | 584 (51.2%) | $34,444 |
| Female | 557 (48.8%) | $24,234 |
| Total | 1,141 (100.0%) | $29,284 |
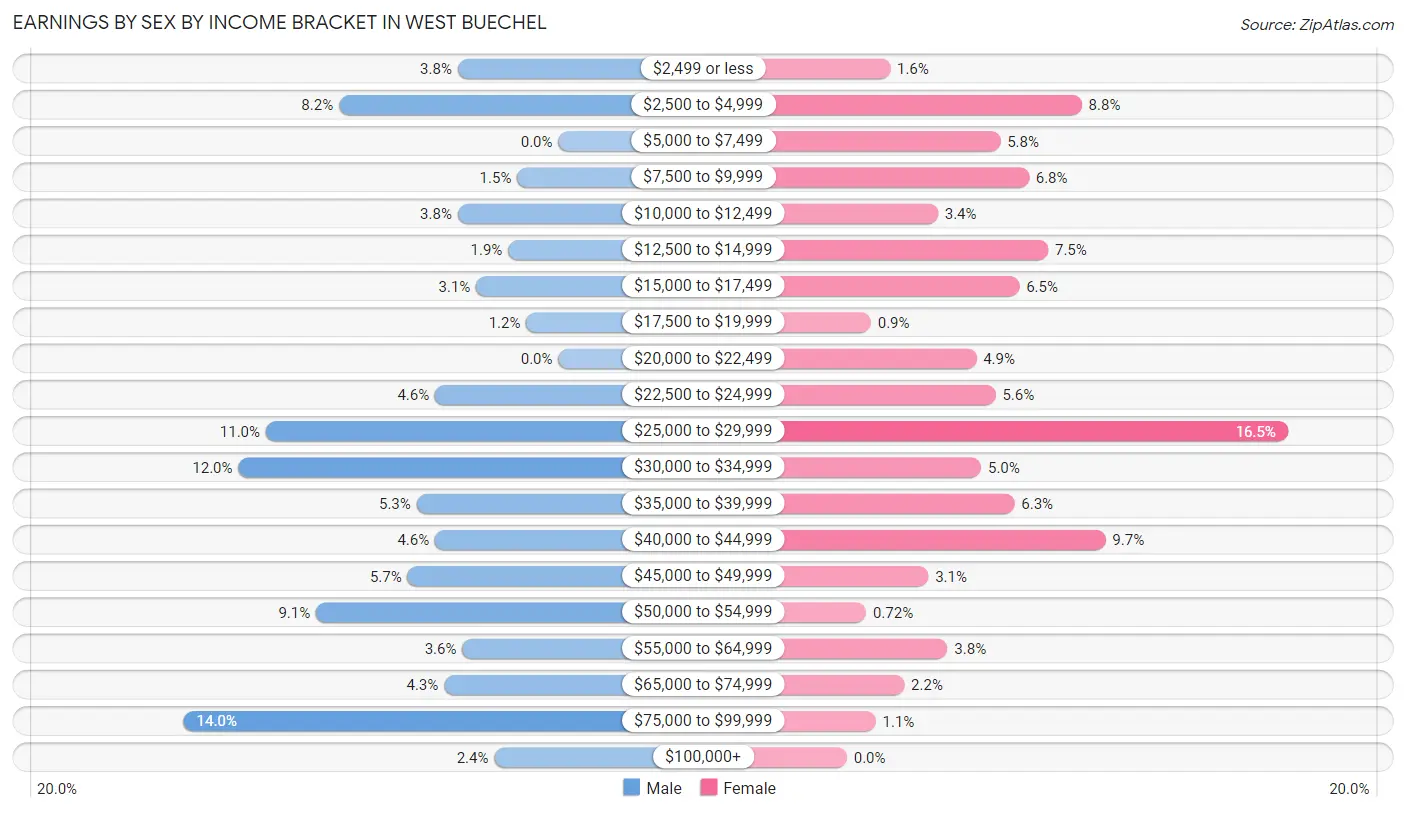
Earnings by Sex by Income Bracket in West Buechel
The most common earnings brackets in West Buechel are $75,000 to $99,999 for men (82 | 14.0%) and $25,000 to $29,999 for women (92 | 16.5%).
| Income | Male | Female |
| $2,499 or less | 22 (3.8%) | 9 (1.6%) |
| $2,500 to $4,999 | 48 (8.2%) | 49 (8.8%) |
| $5,000 to $7,499 | 0 (0.0%) | 32 (5.8%) |
| $7,500 to $9,999 | 9 (1.5%) | 38 (6.8%) |
| $10,000 to $12,499 | 22 (3.8%) | 19 (3.4%) |
| $12,500 to $14,999 | 11 (1.9%) | 42 (7.5%) |
| $15,000 to $17,499 | 18 (3.1%) | 36 (6.5%) |
| $17,500 to $19,999 | 7 (1.2%) | 5 (0.9%) |
| $20,000 to $22,499 | 0 (0.0%) | 27 (4.9%) |
| $22,500 to $24,999 | 27 (4.6%) | 31 (5.6%) |
| $25,000 to $29,999 | 64 (11.0%) | 92 (16.5%) |
| $30,000 to $34,999 | 70 (12.0%) | 28 (5.0%) |
| $35,000 to $39,999 | 31 (5.3%) | 35 (6.3%) |
| $40,000 to $44,999 | 27 (4.6%) | 54 (9.7%) |
| $45,000 to $49,999 | 33 (5.7%) | 17 (3.0%) |
| $50,000 to $54,999 | 53 (9.1%) | 4 (0.7%) |
| $55,000 to $64,999 | 21 (3.6%) | 21 (3.8%) |
| $65,000 to $74,999 | 25 (4.3%) | 12 (2.1%) |
| $75,000 to $99,999 | 82 (14.0%) | 6 (1.1%) |
| $100,000+ | 14 (2.4%) | 0 (0.0%) |
| Total | 584 (100.0%) | 557 (100.0%) |
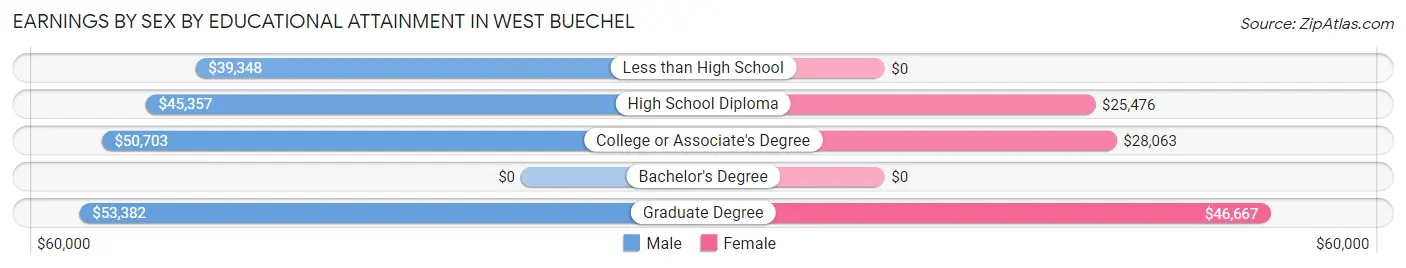
Earnings by Sex by Educational Attainment in West Buechel
Average earnings in West Buechel are $41,838 for men and $27,083 for women, a difference of 35.3%. Men with an educational attainment of graduate degree enjoy the highest average annual earnings of $53,382, while those with less than high school education earn the least with $39,348. Women with an educational attainment of graduate degree earn the most with the average annual earnings of $46,667, while those with high school diploma education have the smallest earnings of $25,476.
| Educational Attainment | Male Income | Female Income |
| Less than High School | $39,348 | $0 |
| High School Diploma | $45,357 | $25,476 |
| College or Associate's Degree | $50,703 | $28,063 |
| Bachelor's Degree | - | - |
| Graduate Degree | $53,382 | $46,667 |
| Total | $41,838 | $27,083 |
Family Income in West Buechel
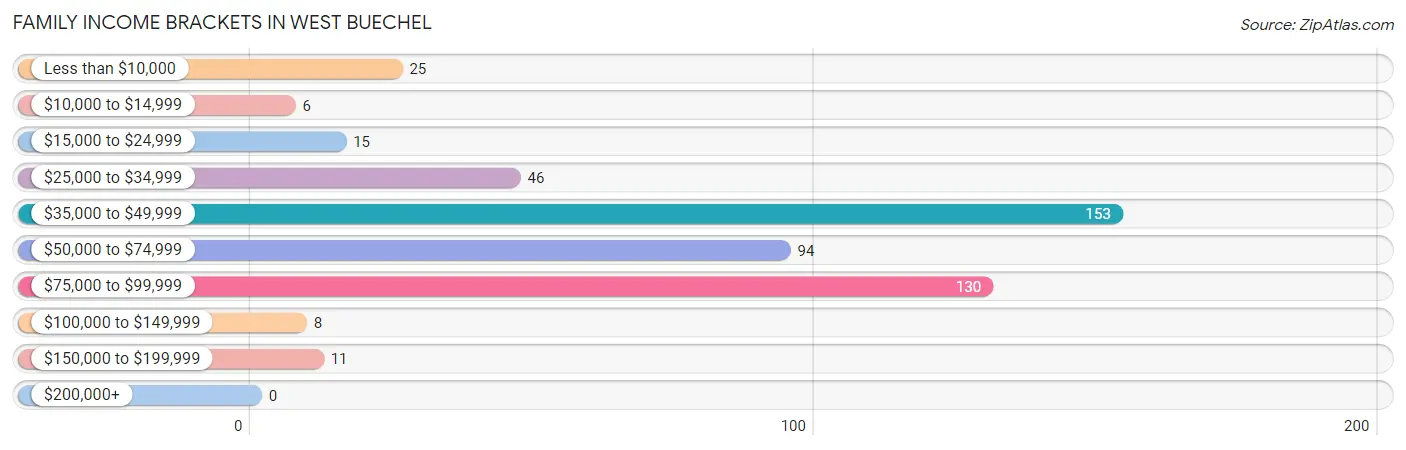
Family Income Brackets in West Buechel
According to the West Buechel family income data, there are 153 families falling into the $35,000 to $49,999 income range, which is the most common income bracket and makes up 31.4% of all families.
| Income Bracket | # Families | % Families |
| Less than $10,000 | 25 | 5.1% |
| $10,000 to $14,999 | 6 | 1.2% |
| $15,000 to $24,999 | 15 | 3.1% |
| $25,000 to $34,999 | 46 | 9.4% |
| $35,000 to $49,999 | 153 | 31.4% |
| $50,000 to $74,999 | 94 | 19.3% |
| $75,000 to $99,999 | 130 | 26.6% |
| $100,000 to $149,999 | 8 | 1.6% |
| $150,000 to $199,999 | 11 | 2.3% |
| $200,000+ | 0 | 0.0% |
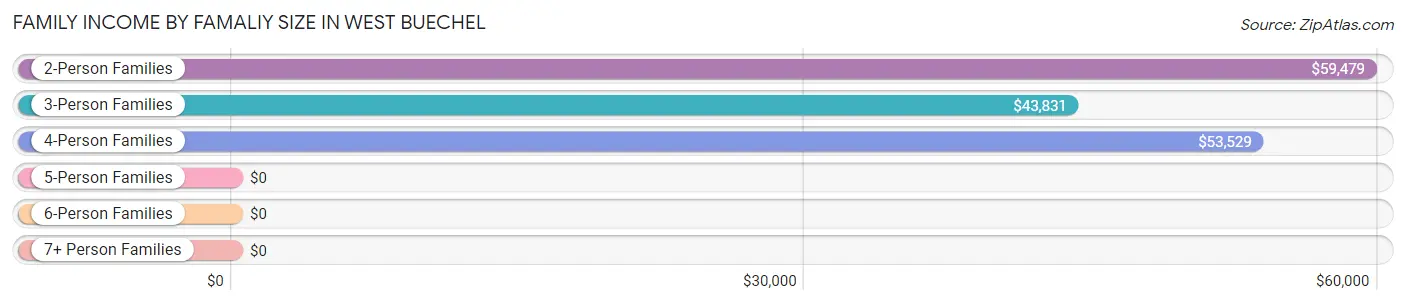
Family Income by Famaliy Size in West Buechel
2-person families (183 | 37.5%) account for the highest median family income in West Buechel with $59,479 per family, while 2-person families (183 | 37.5%) have the highest median income of $29,740 per family member.
| Income Bracket | # Families | Median Income |
| 2-Person Families | 183 (37.5%) | $59,479 |
| 3-Person Families | 151 (30.9%) | $43,831 |
| 4-Person Families | 94 (19.3%) | $53,529 |
| 5-Person Families | 41 (8.4%) | $0 |
| 6-Person Families | 19 (3.9%) | $0 |
| 7+ Person Families | 0 (0.0%) | $0 |
| Total | 488 (100.0%) | $49,167 |
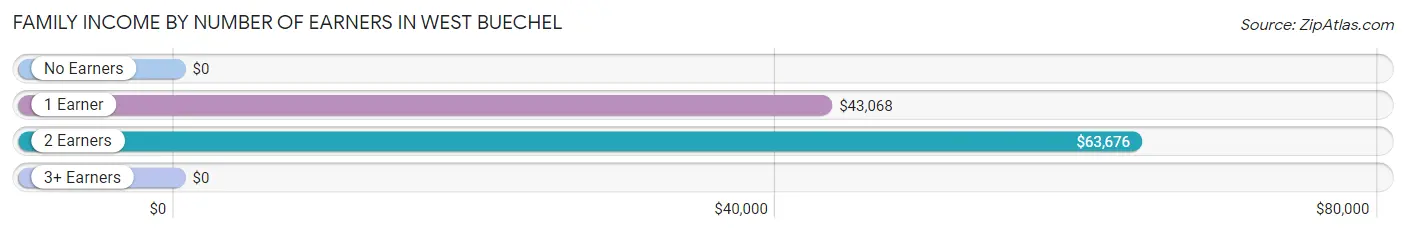
Family Income by Number of Earners in West Buechel
| Number of Earners | # Families | Median Income |
| No Earners | 44 (9.0%) | $0 |
| 1 Earner | 167 (34.2%) | $43,068 |
| 2 Earners | 196 (40.2%) | $63,676 |
| 3+ Earners | 81 (16.6%) | $0 |
| Total | 488 (100.0%) | $49,167 |
Household Income in West Buechel
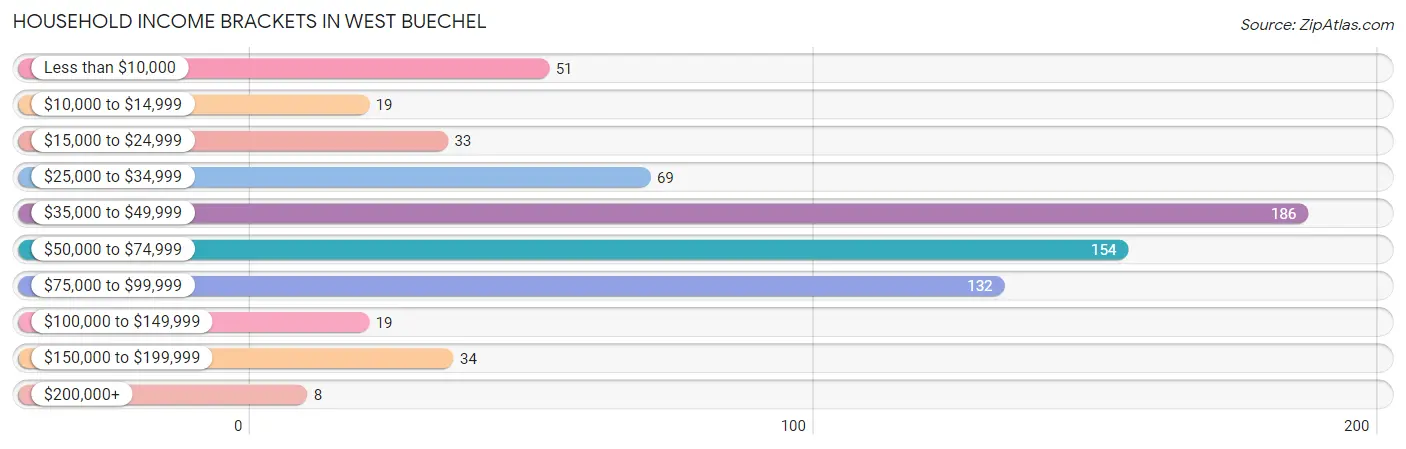
Household Income Brackets in West Buechel
With 186 households falling in the category, the $35,000 to $49,999 income range is the most frequent in West Buechel, accounting for 26.4% of all households. In contrast, only 8 households (1.1%) fall into the $200,000+ income bracket, making it the least populous group.
| Income Bracket | # Households | % Households |
| Less than $10,000 | 51 | 7.2% |
| $10,000 to $14,999 | 19 | 2.7% |
| $15,000 to $24,999 | 33 | 4.7% |
| $25,000 to $34,999 | 69 | 9.8% |
| $35,000 to $49,999 | 186 | 26.4% |
| $50,000 to $74,999 | 154 | 21.8% |
| $75,000 to $99,999 | 132 | 18.7% |
| $100,000 to $149,999 | 19 | 2.7% |
| $150,000 to $199,999 | 34 | 4.8% |
| $200,000+ | 8 | 1.1% |
Household Income by Householder Age in West Buechel
The median household income in West Buechel is $48,750, with the highest median household income of $75,709 found in the 65+ years age bracket for the primary householder. A total of 87 households (12.3%) fall into this category. Meanwhile, the 15 to 24 years age bracket for the primary householder has the lowest median household income of $33,125, with 56 households (7.9%) in this group.
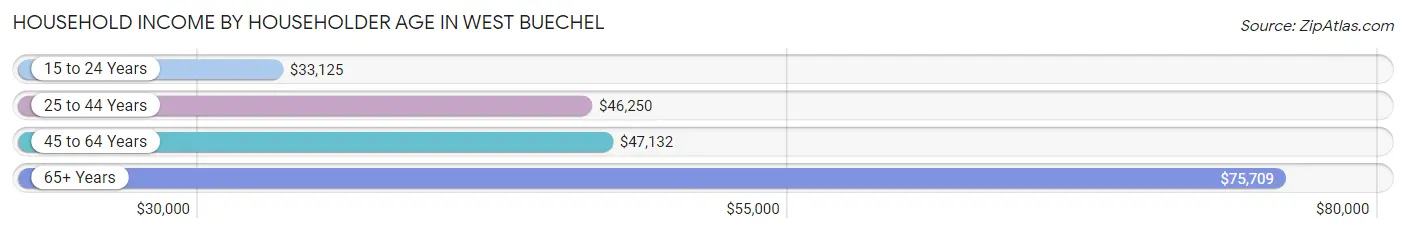
| Income Bracket | # Households | Median Income |
| 15 to 24 Years | 56 (7.9%) | $33,125 |
| 25 to 44 Years | 364 (51.6%) | $46,250 |
| 45 to 64 Years | 198 (28.1%) | $47,132 |
| 65+ Years | 87 (12.3%) | $75,709 |
| Total | 705 (100.0%) | $48,750 |
Poverty in West Buechel
Income Below Poverty by Sex and Age in West Buechel
With 17.3% poverty level for males and 21.0% for females among the residents of West Buechel, 12 to 14 year old males and 6 to 11 year old females are the most vulnerable to poverty, with 15 males (71.4%) and 32 females (50.8%) in their respective age groups living below the poverty level.
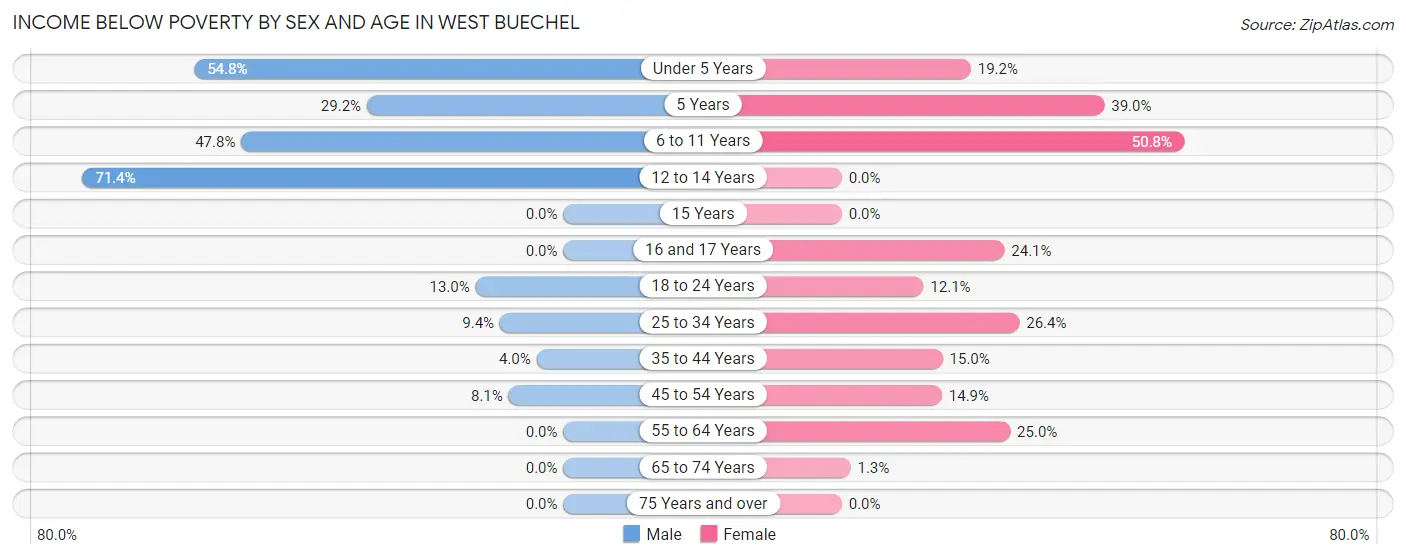
| Age Bracket | Male | Female |
| Under 5 Years | 57 (54.8%) | 32 (19.2%) |
| 5 Years | 7 (29.2%) | 23 (39.0%) |
| 6 to 11 Years | 33 (47.8%) | 32 (50.8%) |
| 12 to 14 Years | 15 (71.4%) | 0 (0.0%) |
| 15 Years | 0 (0.0%) | 0 (0.0%) |
| 16 and 17 Years | 0 (0.0%) | 7 (24.1%) |
| 18 to 24 Years | 12 (13.0%) | 8 (12.1%) |
| 25 to 34 Years | 13 (9.4%) | 63 (26.4%) |
| 35 to 44 Years | 6 (4.0%) | 22 (15.0%) |
| 45 to 54 Years | 10 (8.1%) | 11 (14.9%) |
| 55 to 64 Years | 0 (0.0%) | 22 (25.0%) |
| 65 to 74 Years | 0 (0.0%) | 1 (1.3%) |
| 75 Years and over | 0 (0.0%) | 0 (0.0%) |
| Total | 153 (17.3%) | 221 (21.0%) |
Income Above Poverty by Sex and Age in West Buechel
According to the poverty statistics in West Buechel, males aged 15 years and females aged 12 to 14 years are the age groups that are most secure financially, with 100.0% of males and 100.0% of females in these age groups living above the poverty line.
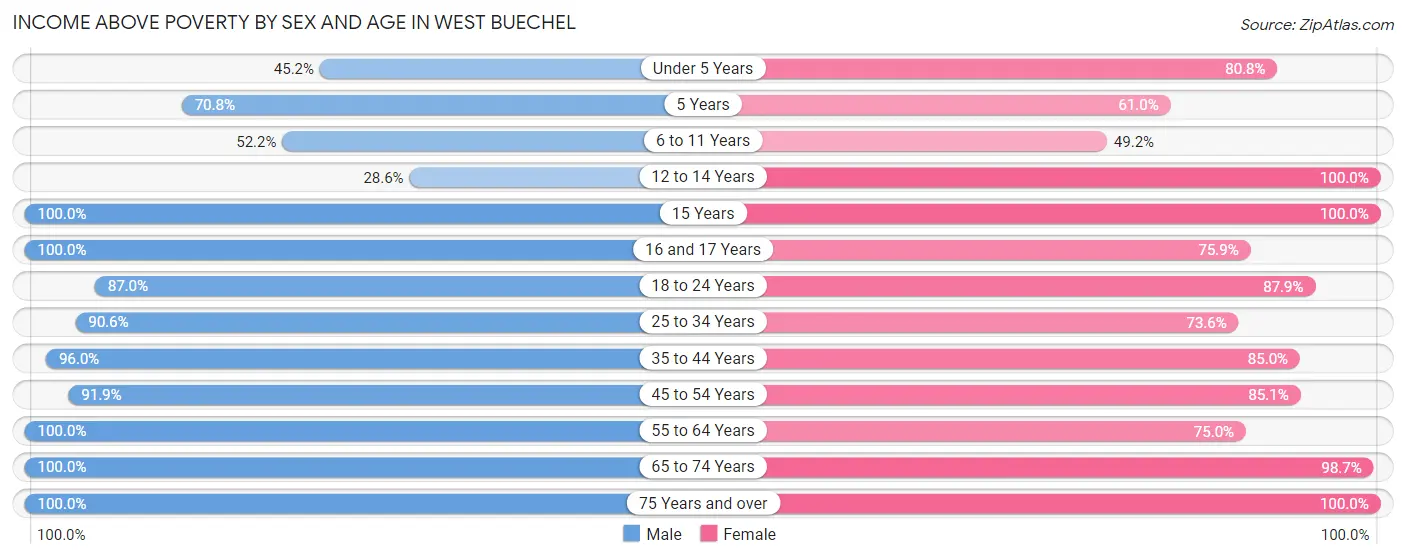
| Age Bracket | Male | Female |
| Under 5 Years | 47 (45.2%) | 135 (80.8%) |
| 5 Years | 17 (70.8%) | 36 (61.0%) |
| 6 to 11 Years | 36 (52.2%) | 31 (49.2%) |
| 12 to 14 Years | 6 (28.6%) | 28 (100.0%) |
| 15 Years | 3 (100.0%) | 5 (100.0%) |
| 16 and 17 Years | 54 (100.0%) | 22 (75.9%) |
| 18 to 24 Years | 80 (87.0%) | 58 (87.9%) |
| 25 to 34 Years | 125 (90.6%) | 176 (73.6%) |
| 35 to 44 Years | 145 (96.0%) | 125 (85.0%) |
| 45 to 54 Years | 113 (91.9%) | 63 (85.1%) |
| 55 to 64 Years | 52 (100.0%) | 66 (75.0%) |
| 65 to 74 Years | 43 (100.0%) | 76 (98.7%) |
| 75 Years and over | 10 (100.0%) | 10 (100.0%) |
| Total | 731 (82.7%) | 831 (79.0%) |
Income Below Poverty Among Married-Couple Families in West Buechel
The poverty statistics for married-couple families in West Buechel show that 6.9% or 19 of the total 276 families live below the poverty line. Families with 3 or 4 children have the highest poverty rate of 26.8%, comprising of 11 families. On the other hand, families with no children have the lowest poverty rate of 2.9%, which includes 3 families.
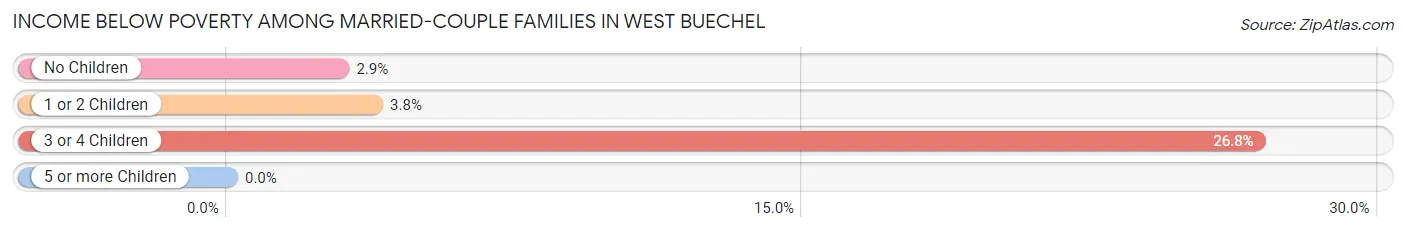
| Children | Above Poverty | Below Poverty |
| No Children | 100 (97.1%) | 3 (2.9%) |
| 1 or 2 Children | 127 (96.2%) | 5 (3.8%) |
| 3 or 4 Children | 30 (73.2%) | 11 (26.8%) |
| 5 or more Children | 0 (0.0%) | 0 (0.0%) |
| Total | 257 (93.1%) | 19 (6.9%) |
Income Below Poverty Among Single-Parent Households in West Buechel
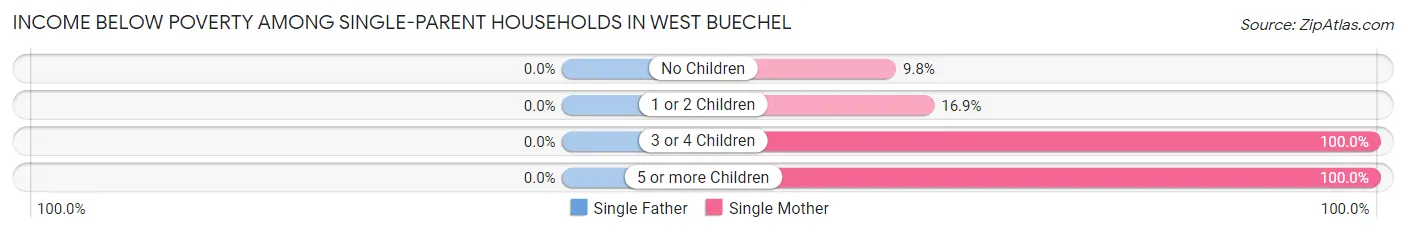
| Children | Single Father | Single Mother |
| No Children | 0 (0.0%) | 4 (9.8%) |
| 1 or 2 Children | 0 (0.0%) | 13 (16.9%) |
| 3 or 4 Children | 0 (0.0%) | 26 (100.0%) |
| 5 or more Children | 0 (0.0%) | 8 (100.0%) |
| Total | 0 (0.0%) | 51 (33.6%) |
Income Below Poverty Among Married-Couple vs Single-Parent Households in West Buechel
The poverty data for West Buechel shows that 19 of the married-couple family households (6.9%) and 51 of the single-parent households (24.1%) are living below the poverty level. Within the married-couple family households, those with 3 or 4 children have the highest poverty rate, with 11 households (26.8%) falling below the poverty line. Among the single-parent households, those with 3 or 4 children have the highest poverty rate, with 26 household (100.0%) living below poverty.
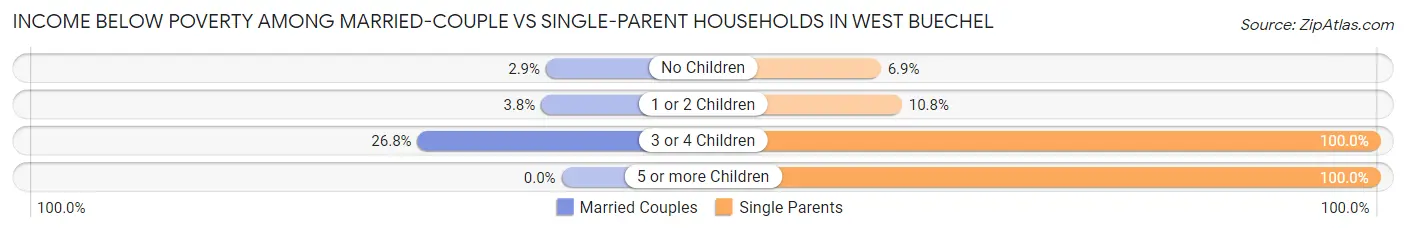
| Children | Married-Couple Families | Single-Parent Households |
| No Children | 3 (2.9%) | 4 (6.9%) |
| 1 or 2 Children | 5 (3.8%) | 13 (10.8%) |
| 3 or 4 Children | 11 (26.8%) | 26 (100.0%) |
| 5 or more Children | 0 (0.0%) | 8 (100.0%) |
| Total | 19 (6.9%) | 51 (24.1%) |
Race in West Buechel
The most populous races in West Buechel are Black / African American (830 | 42.9%), White / Caucasian (612 | 31.6%), and Asian (352 | 18.2%).
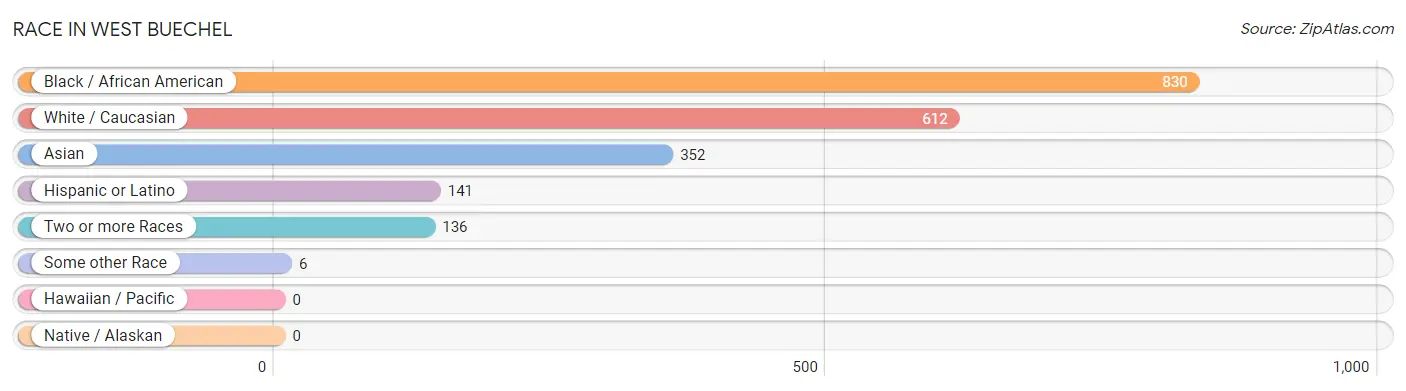
| Race | # Population | % Population |
| Asian | 352 | 18.2% |
| Black / African American | 830 | 42.9% |
| Hawaiian / Pacific | 0 | 0.0% |
| Hispanic or Latino | 141 | 7.3% |
| Native / Alaskan | 0 | 0.0% |
| White / Caucasian | 612 | 31.6% |
| Two or more Races | 136 | 7.0% |
| Some other Race | 6 | 0.3% |
| Total | 1,936 | 100.0% |
Ancestry in West Buechel
The most populous ancestries reported in West Buechel are Subsaharan African (355 | 18.3%), African (281 | 14.5%), German (234 | 12.1%), Irish (161 | 8.3%), and Cuban (119 | 6.1%), together accounting for 59.4% of all West Buechel residents.
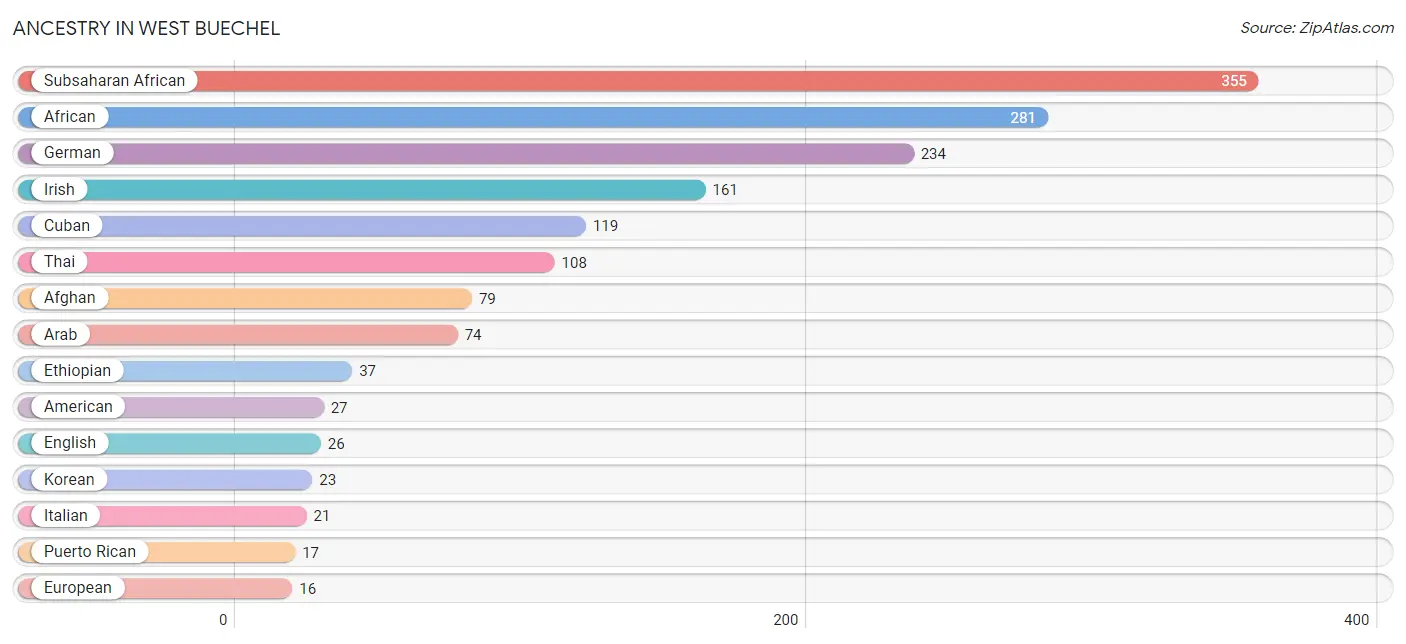
| Ancestry | # Population | % Population |
| Afghan | 79 | 4.1% |
| African | 281 | 14.5% |
| American | 27 | 1.4% |
| Arab | 74 | 3.8% |
| Burmese | 6 | 0.3% |
| Cherokee | 6 | 0.3% |
| Croatian | 12 | 0.6% |
| Cuban | 119 | 6.1% |
| English | 26 | 1.3% |
| Ethiopian | 37 | 1.9% |
| European | 16 | 0.8% |
| French | 7 | 0.4% |
| German | 234 | 12.1% |
| Irish | 161 | 8.3% |
| Italian | 21 | 1.1% |
| Jamaican | 1 | 0.1% |
| Korean | 23 | 1.2% |
| Liberian | 14 | 0.7% |
| Nigerian | 3 | 0.2% |
| Norwegian | 12 | 0.6% |
| Pakistani | 3 | 0.2% |
| Polish | 3 | 0.2% |
| Puerto Rican | 17 | 0.9% |
| Russian | 2 | 0.1% |
| Scottish | 11 | 0.6% |
| Subsaharan African | 355 | 18.3% |
| Thai | 108 | 5.6% | View All 27 Rows |
Immigrants in West Buechel
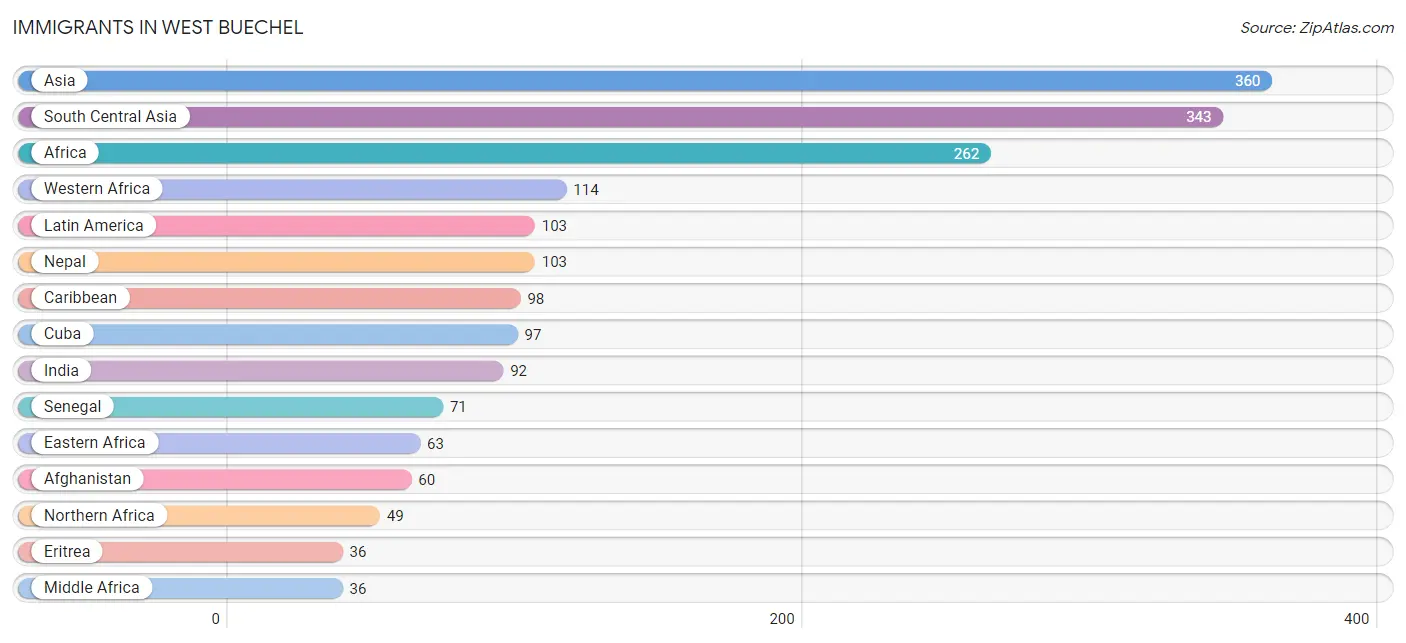
The most numerous immigrant groups reported in West Buechel came from Asia (360 | 18.6%), South Central Asia (343 | 17.7%), Africa (262 | 13.5%), Western Africa (114 | 5.9%), and Latin America (103 | 5.3%), together accounting for 61.1% of all West Buechel residents.
| Immigration Origin | # Population | % Population |
| Afghanistan | 60 | 3.1% |
| Africa | 262 | 13.5% |
| Argentina | 5 | 0.3% |
| Asia | 360 | 18.6% |
| Caribbean | 98 | 5.1% |
| Croatia | 12 | 0.6% |
| Cuba | 97 | 5.0% |
| Eastern Africa | 63 | 3.3% |
| Eastern Europe | 12 | 0.6% |
| Eritrea | 36 | 1.9% |
| Ethiopia | 27 | 1.4% |
| Europe | 12 | 0.6% |
| India | 92 | 4.8% |
| Jamaica | 1 | 0.1% |
| Latin America | 103 | 5.3% |
| Liberia | 14 | 0.7% |
| Middle Africa | 36 | 1.9% |
| Nepal | 103 | 5.3% |
| Nigeria | 3 | 0.2% |
| Northern Africa | 49 | 2.5% |
| Pakistan | 12 | 0.6% |
| Philippines | 14 | 0.7% |
| Senegal | 71 | 3.7% |
| South America | 5 | 0.3% |
| South Central Asia | 343 | 17.7% |
| South Eastern Asia | 17 | 0.9% |
| Sri Lanka | 7 | 0.4% |
| Thailand | 3 | 0.2% |
| Western Africa | 114 | 5.9% |
| Zaire | 36 | 1.9% | View All 30 Rows |
Sex and Age in West Buechel
Sex and Age in West Buechel
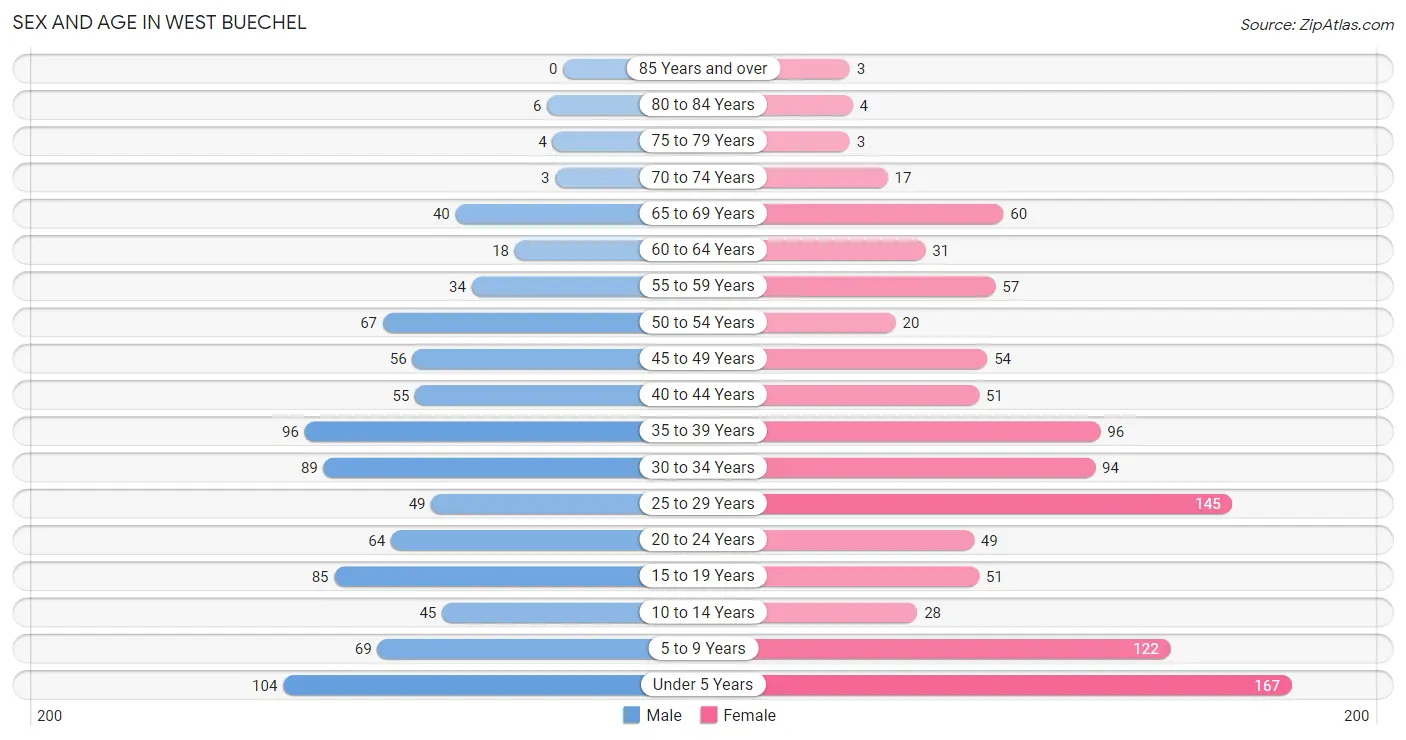
The most populous age groups in West Buechel are Under 5 Years (104 | 11.8%) for men and Under 5 Years (167 | 15.9%) for women.
| Age Bracket | Male | Female |
| Under 5 Years | 104 (11.8%) | 167 (15.9%) |
| 5 to 9 Years | 69 (7.8%) | 122 (11.6%) |
| 10 to 14 Years | 45 (5.1%) | 28 (2.7%) |
| 15 to 19 Years | 85 (9.6%) | 51 (4.9%) |
| 20 to 24 Years | 64 (7.2%) | 49 (4.7%) |
| 25 to 29 Years | 49 (5.5%) | 145 (13.8%) |
| 30 to 34 Years | 89 (10.1%) | 94 (8.9%) |
| 35 to 39 Years | 96 (10.9%) | 96 (9.1%) |
| 40 to 44 Years | 55 (6.2%) | 51 (4.9%) |
| 45 to 49 Years | 56 (6.3%) | 54 (5.1%) |
| 50 to 54 Years | 67 (7.6%) | 20 (1.9%) |
| 55 to 59 Years | 34 (3.8%) | 57 (5.4%) |
| 60 to 64 Years | 18 (2.0%) | 31 (2.9%) |
| 65 to 69 Years | 40 (4.5%) | 60 (5.7%) |
| 70 to 74 Years | 3 (0.3%) | 17 (1.6%) |
| 75 to 79 Years | 4 (0.4%) | 3 (0.3%) |
| 80 to 84 Years | 6 (0.7%) | 4 (0.4%) |
| 85 Years and over | 0 (0.0%) | 3 (0.3%) |
| Total | 884 (100.0%) | 1,052 (100.0%) |
Families and Households in West Buechel
Median Family Size in West Buechel
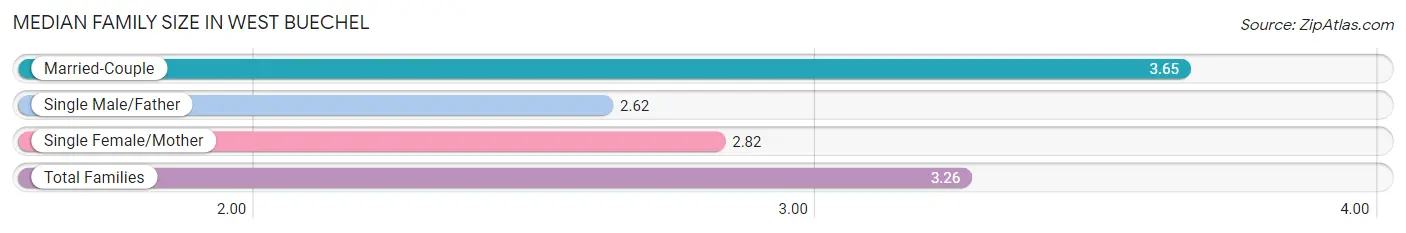
The median family size in West Buechel is 3.26 persons per family, with married-couple families (276 | 56.6%) accounting for the largest median family size of 3.65 persons per family. On the other hand, single male/father families (60 | 12.3%) represent the smallest median family size with 2.62 persons per family.
| Family Type | # Families | Family Size |
| Married-Couple | 276 (56.6%) | 3.65 |
| Single Male/Father | 60 (12.3%) | 2.62 |
| Single Female/Mother | 152 (31.1%) | 2.82 |
| Total Families | 488 (100.0%) | 3.26 |
Median Household Size in West Buechel
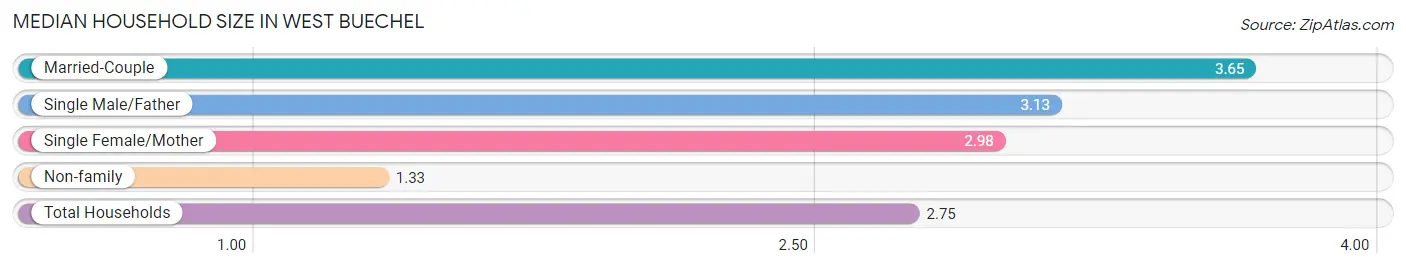
The median household size in West Buechel is 2.75 persons per household, with married-couple households (276 | 39.2%) accounting for the largest median household size of 3.65 persons per household. non-family households (217 | 30.8%) represent the smallest median household size with 1.33 persons per household.
| Household Type | # Households | Household Size |
| Married-Couple | 276 (39.2%) | 3.65 |
| Single Male/Father | 60 (8.5%) | 3.13 |
| Single Female/Mother | 152 (21.6%) | 2.98 |
| Non-family | 217 (30.8%) | 1.33 |
| Total Households | 705 (100.0%) | 2.75 |
Household Size by Marriage Status in West Buechel
Out of a total of 705 households in West Buechel, 488 (69.2%) are family households, while 217 (30.8%) are nonfamily households. The most numerous type of family households are 3-person households, comprising 181, and the most common type of nonfamily households are 1-person households, comprising 154.
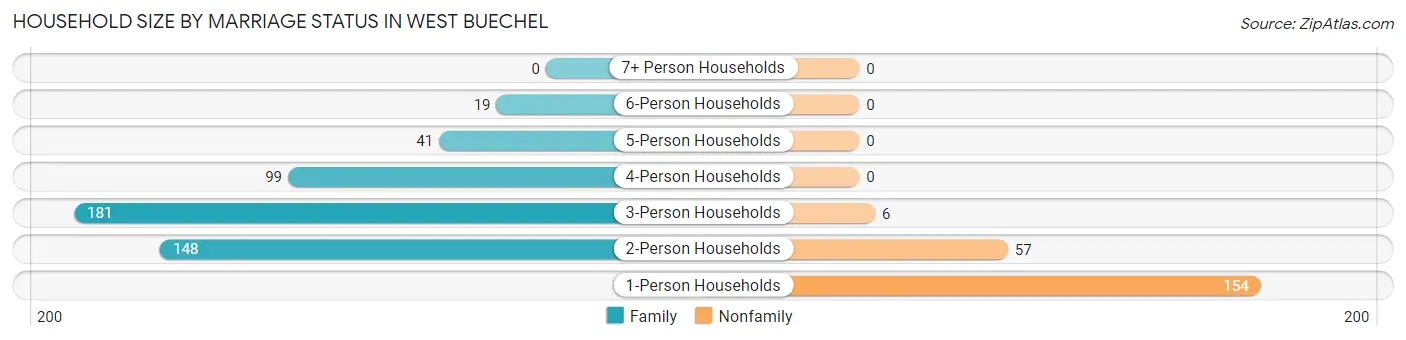
| Household Size | Family Households | Nonfamily Households |
| 1-Person Households | - | 154 (21.8%) |
| 2-Person Households | 148 (21.0%) | 57 (8.1%) |
| 3-Person Households | 181 (25.7%) | 6 (0.9%) |
| 4-Person Households | 99 (14.0%) | 0 (0.0%) |
| 5-Person Households | 41 (5.8%) | 0 (0.0%) |
| 6-Person Households | 19 (2.7%) | 0 (0.0%) |
| 7+ Person Households | 0 (0.0%) | 0 (0.0%) |
| Total | 488 (69.2%) | 217 (30.8%) |
Female Fertility in West Buechel
Fertility by Age in West Buechel
Average fertility rate in West Buechel is 104.0 births per 1,000 women. Women in the age bracket of 20 to 34 years have the highest fertility rate with 170.0 births per 1,000 women. Women in the age bracket of 20 to 34 years acount for 87.5% of all women with births.

| Age Bracket | Women with Births | Births / 1,000 Women |
| 15 to 19 years | 7 (12.5%) | 137.0 |
| 20 to 34 years | 49 (87.5%) | 170.0 |
| 35 to 50 years | 0 (0.0%) | 0.0 |
| Total | 56 (100.0%) | 104.0 |
Fertility by Age by Marriage Status in West Buechel
41.1% of women with births (56) in West Buechel are married. The highest percentage of unmarried women with births falls into 15 to 19 years age bracket with 100.0% of them unmarried at the time of birth, while the lowest percentage of unmarried women with births belong to 20 to 34 years age bracket with 53.1% of them unmarried.
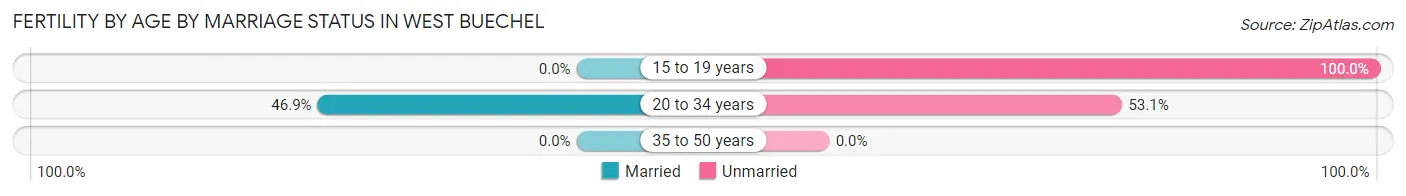
| Age Bracket | Married | Unmarried |
| 15 to 19 years | 0 (0.0%) | 7 (100.0%) |
| 20 to 34 years | 23 (46.9%) | 26 (53.1%) |
| 35 to 50 years | 0 (0.0%) | 0 (0.0%) |
| Total | 23 (41.1%) | 33 (58.9%) |
Fertility by Education in West Buechel
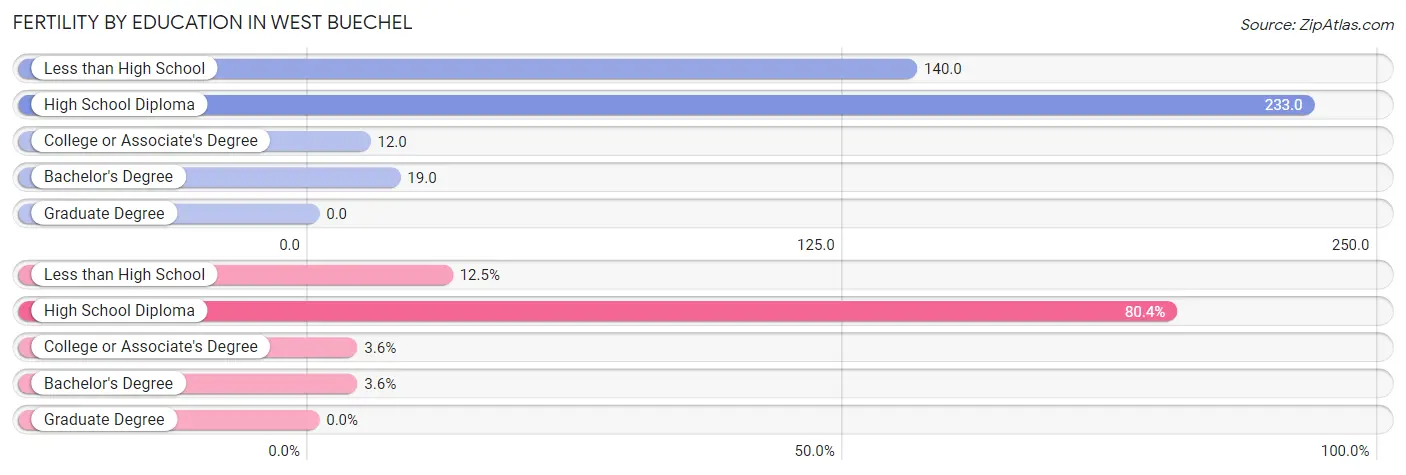
| Educational Attainment | Women with Births | Births / 1,000 Women |
| Less than High School | 7 (12.5%) | 140.0 |
| High School Diploma | 45 (80.4%) | 233.0 |
| College or Associate's Degree | 2 (3.6%) | 12.0 |
| Bachelor's Degree | 2 (3.6%) | 19.0 |
| Graduate Degree | 0 (0.0%) | 0.0 |
| Total | 56 (100.0%) | 104.0 |
Fertility by Education by Marriage Status in West Buechel
58.9% of women with births in West Buechel are unmarried. Women with the educational attainment of college or associate's degree are most likely to be married with 100.0% of them married at childbirth, while women with the educational attainment of less than high school are least likely to be married with 100.0% of them unmarried at childbirth.
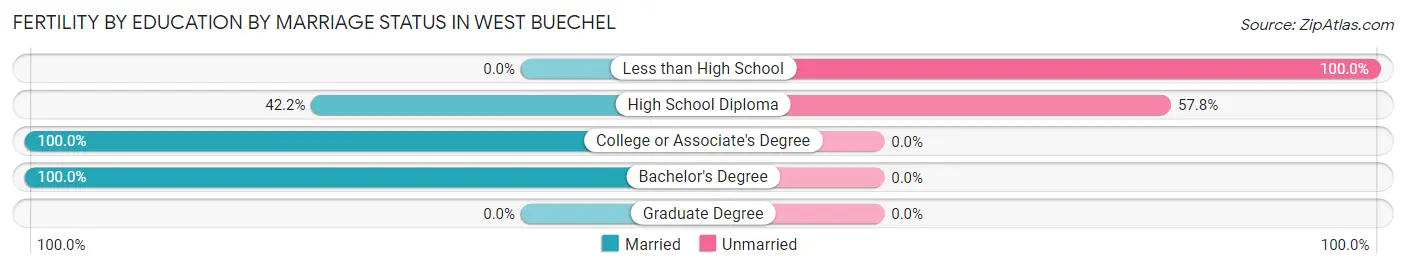
| Educational Attainment | Married | Unmarried |
| Less than High School | 0 (0.0%) | 7 (100.0%) |
| High School Diploma | 19 (42.2%) | 26 (57.8%) |
| College or Associate's Degree | 2 (100.0%) | 0 (0.0%) |
| Bachelor's Degree | 2 (100.0%) | 0 (0.0%) |
| Graduate Degree | 0 (0.0%) | 0 (0.0%) |
| Total | 23 (41.1%) | 33 (58.9%) |
Employment Characteristics in West Buechel
Employment by Class of Employer in West Buechel
Among the 1,025 employed individuals in West Buechel, private company employees (718 | 70.1%), not-for-profit organizations (135 | 13.2%), and state government employees (98 | 9.6%) make up the most common classes of employment.
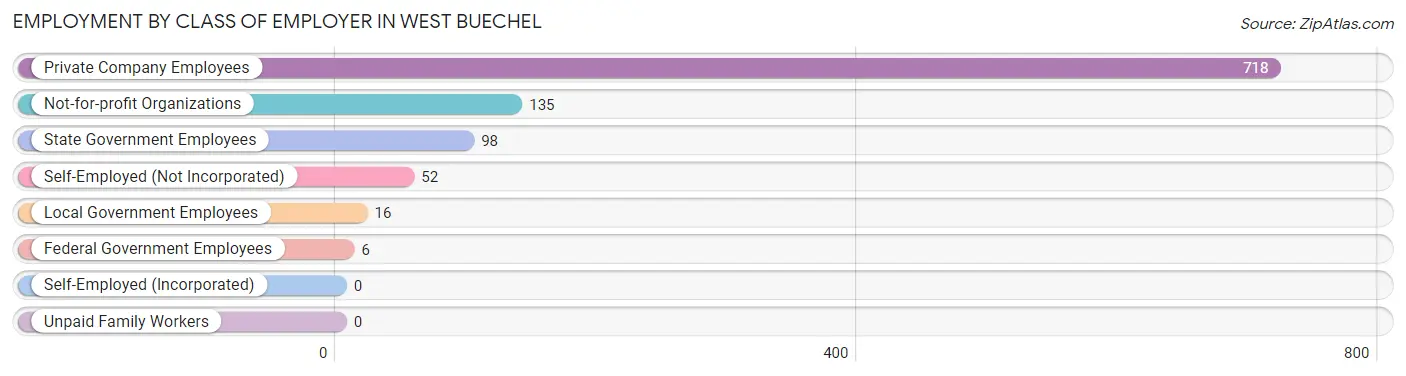
| Employer Class | # Employees | % Employees |
| Private Company Employees | 718 | 70.1% |
| Self-Employed (Incorporated) | 0 | 0.0% |
| Self-Employed (Not Incorporated) | 52 | 5.1% |
| Not-for-profit Organizations | 135 | 13.2% |
| Local Government Employees | 16 | 1.6% |
| State Government Employees | 98 | 9.6% |
| Federal Government Employees | 6 | 0.6% |
| Unpaid Family Workers | 0 | 0.0% |
| Total | 1,025 | 100.0% |
Employment Status by Age in West Buechel
According to the labor force statistics for West Buechel, out of the total population over 16 years of age (1,393), 80.0% or 1,114 individuals are in the labor force, with 4.8% or 53 of them unemployed. The age group with the highest labor force participation rate is 35 to 44 years, with 95.0% or 283 individuals in the labor force. Within the labor force, the 65 to 74 years age range has the highest percentage of unemployed individuals, with 40.7% or 37 of them being unemployed.
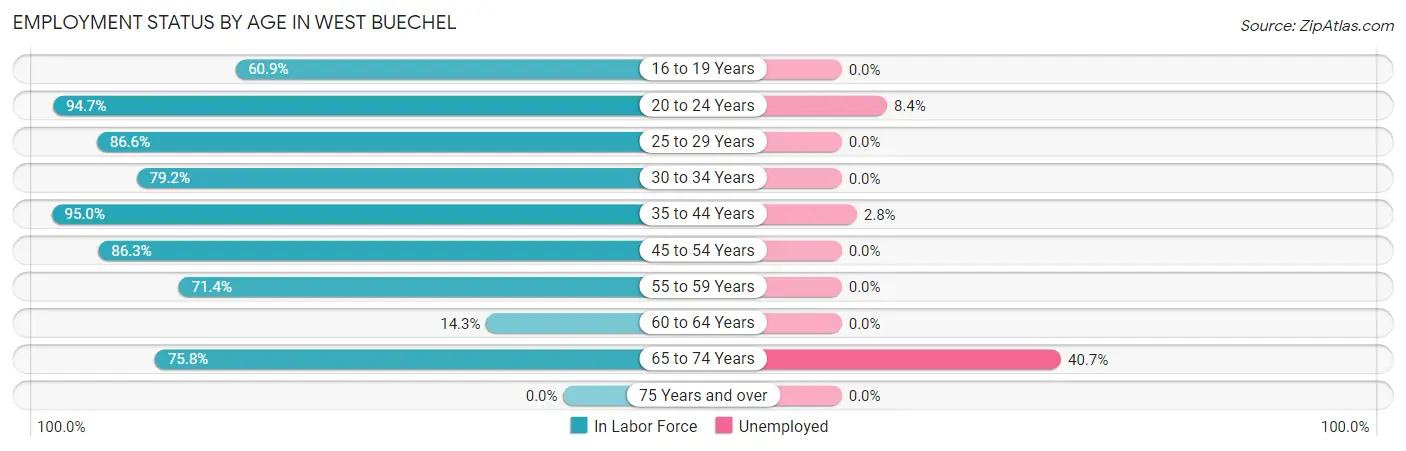
| Age Bracket | In Labor Force | Unemployed |
| 16 to 19 Years | 78 (60.9%) | 0 (0.0%) |
| 20 to 24 Years | 107 (94.7%) | 9 (8.4%) |
| 25 to 29 Years | 168 (86.6%) | 0 (0.0%) |
| 30 to 34 Years | 145 (79.2%) | 0 (0.0%) |
| 35 to 44 Years | 283 (95.0%) | 8 (2.8%) |
| 45 to 54 Years | 170 (86.3%) | 0 (0.0%) |
| 55 to 59 Years | 65 (71.4%) | 0 (0.0%) |
| 60 to 64 Years | 7 (14.3%) | 0 (0.0%) |
| 65 to 74 Years | 91 (75.8%) | 37 (40.7%) |
| 75 Years and over | 0 (0.0%) | 0 (0.0%) |
| Total | 1,114 (80.0%) | 53 (4.8%) |
Employment Status by Educational Attainment in West Buechel
According to labor force statistics for West Buechel, 82.8% of individuals (838) out of the total population between 25 and 64 years of age (1,012) are in the labor force, with 1.0% or 8 of them being unemployed. The group with the highest labor force participation rate are those with the educational attainment of high school diploma, with 90.2% or 295 individuals in the labor force. Within the labor force, individuals with less than high school education have the highest percentage of unemployment, with 9.1% or 5 of them being unemployed.
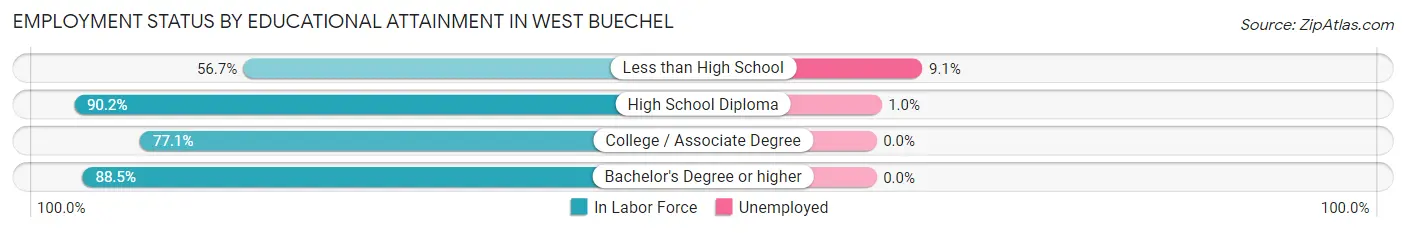
| Educational Attainment | In Labor Force | Unemployed |
| Less than High School | 55 (56.7%) | 9 (9.1%) |
| High School Diploma | 295 (90.2%) | 3 (1.0%) |
| College / Associate Degree | 219 (77.1%) | 0 (0.0%) |
| Bachelor's Degree or higher | 269 (88.5%) | 0 (0.0%) |
| Total | 838 (82.8%) | 10 (1.0%) |
Employment Occupations by Sex in West Buechel
Management, Business, Science and Arts Occupations
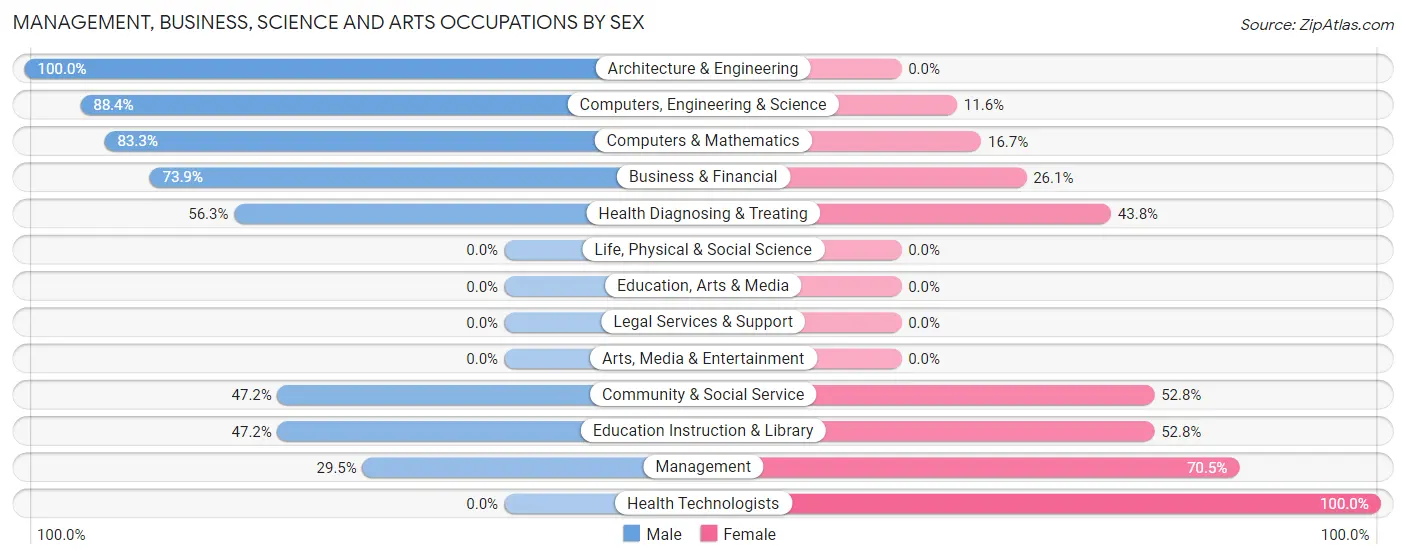
The most common Management, Business, Science and Arts occupations in West Buechel are Computers, Engineering & Science (86 | 8.1%), Management (78 | 7.4%), Computers & Mathematics (60 | 5.7%), Community & Social Service (36 | 3.4%), and Education Instruction & Library (36 | 3.4%).
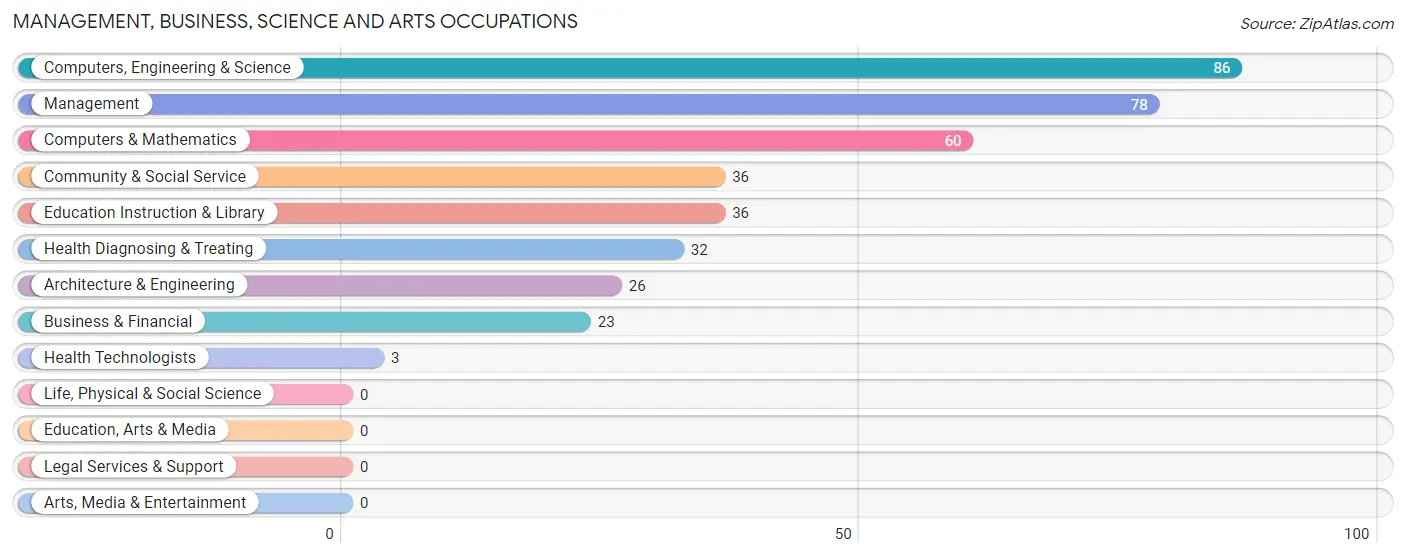
Management, Business, Science and Arts Occupations by Sex
Within the Management, Business, Science and Arts occupations in West Buechel, the most male-oriented occupations are Architecture & Engineering (100.0%), Computers, Engineering & Science (88.4%), and Computers & Mathematics (83.3%), while the most female-oriented occupations are Health Technologists (100.0%), Management (70.5%), and Community & Social Service (52.8%).
| Occupation | Male | Female |
| Management | 23 (29.5%) | 55 (70.5%) |
| Business & Financial | 17 (73.9%) | 6 (26.1%) |
| Computers, Engineering & Science | 76 (88.4%) | 10 (11.6%) |
| Computers & Mathematics | 50 (83.3%) | 10 (16.7%) |
| Architecture & Engineering | 26 (100.0%) | 0 (0.0%) |
| Life, Physical & Social Science | 0 (0.0%) | 0 (0.0%) |
| Community & Social Service | 17 (47.2%) | 19 (52.8%) |
| Education, Arts & Media | 0 (0.0%) | 0 (0.0%) |
| Legal Services & Support | 0 (0.0%) | 0 (0.0%) |
| Education Instruction & Library | 17 (47.2%) | 19 (52.8%) |
| Arts, Media & Entertainment | 0 (0.0%) | 0 (0.0%) |
| Health Diagnosing & Treating | 18 (56.2%) | 14 (43.8%) |
| Health Technologists | 0 (0.0%) | 3 (100.0%) |
| Total (Category) | 151 (59.2%) | 104 (40.8%) |
| Total (Overall) | 523 (49.3%) | 537 (50.7%) |
Services Occupations
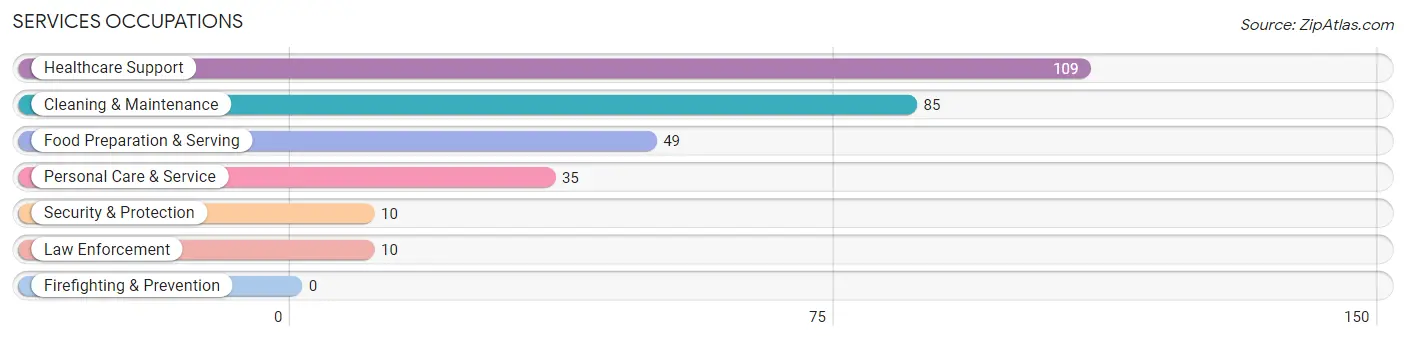
The most common Services occupations in West Buechel are Healthcare Support (109 | 10.3%), Cleaning & Maintenance (85 | 8.0%), Food Preparation & Serving (49 | 4.6%), Personal Care & Service (35 | 3.3%), and Security & Protection (10 | 0.9%).
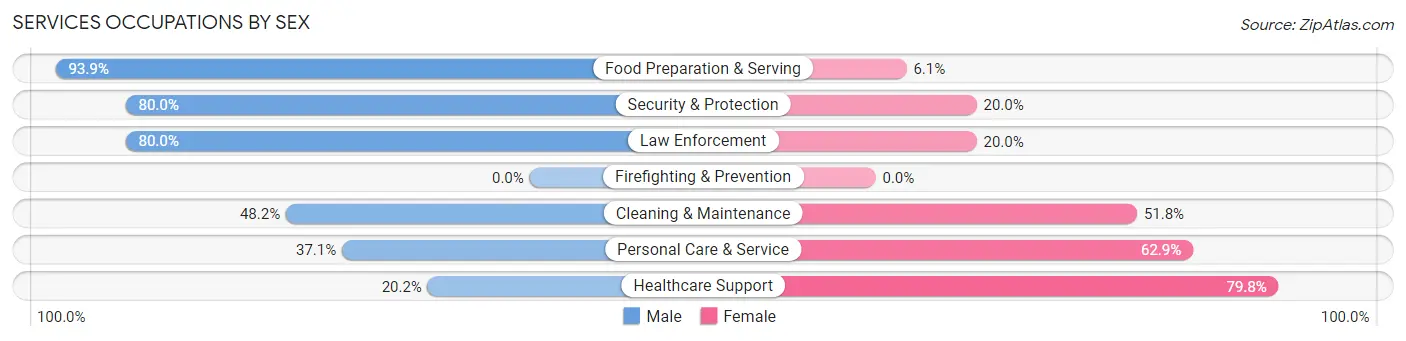
Services Occupations by Sex
Within the Services occupations in West Buechel, the most male-oriented occupations are Food Preparation & Serving (93.9%), Security & Protection (80.0%), and Law Enforcement (80.0%), while the most female-oriented occupations are Healthcare Support (79.8%), Personal Care & Service (62.9%), and Cleaning & Maintenance (51.8%).
| Occupation | Male | Female |
| Healthcare Support | 22 (20.2%) | 87 (79.8%) |
| Security & Protection | 8 (80.0%) | 2 (20.0%) |
| Firefighting & Prevention | 0 (0.0%) | 0 (0.0%) |
| Law Enforcement | 8 (80.0%) | 2 (20.0%) |
| Food Preparation & Serving | 46 (93.9%) | 3 (6.1%) |
| Cleaning & Maintenance | 41 (48.2%) | 44 (51.8%) |
| Personal Care & Service | 13 (37.1%) | 22 (62.9%) |
| Total (Category) | 130 (45.1%) | 158 (54.9%) |
| Total (Overall) | 523 (49.3%) | 537 (50.7%) |
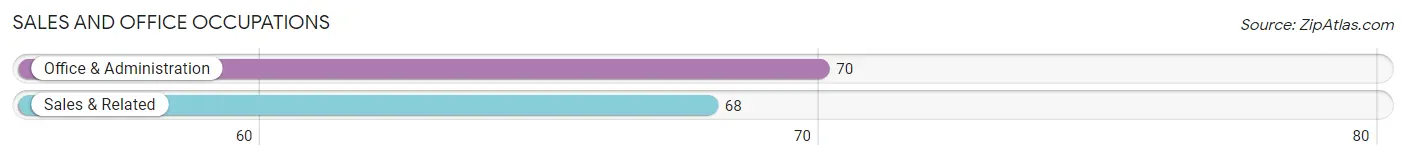
Sales and Office Occupations
The most common Sales and Office occupations in West Buechel are Office & Administration (70 | 6.6%), and Sales & Related (68 | 6.4%).
Sales and Office Occupations by Sex
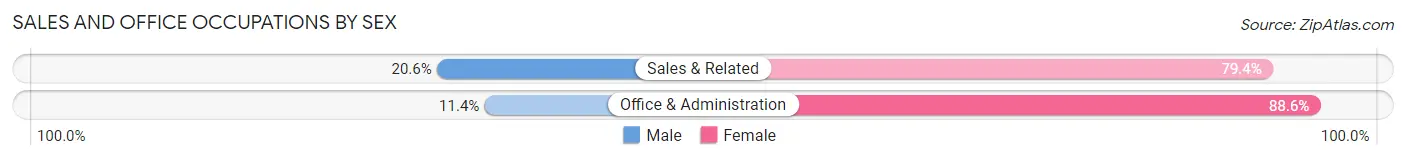
| Occupation | Male | Female |
| Sales & Related | 14 (20.6%) | 54 (79.4%) |
| Office & Administration | 8 (11.4%) | 62 (88.6%) |
| Total (Category) | 22 (15.9%) | 116 (84.1%) |
| Total (Overall) | 523 (49.3%) | 537 (50.7%) |
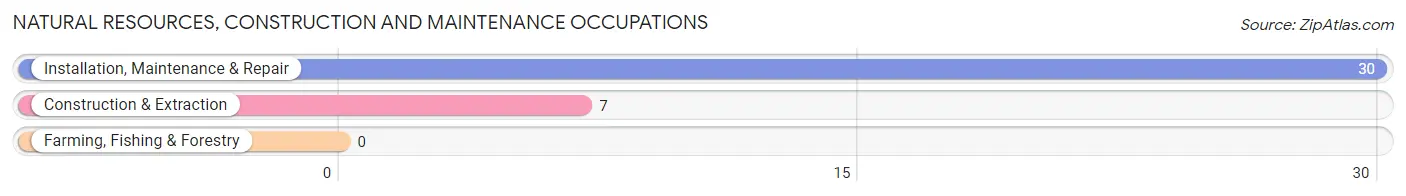
Natural Resources, Construction and Maintenance Occupations
The most common Natural Resources, Construction and Maintenance occupations in West Buechel are Installation, Maintenance & Repair (30 | 2.8%), and Construction & Extraction (7 | 0.7%).
Natural Resources, Construction and Maintenance Occupations by Sex
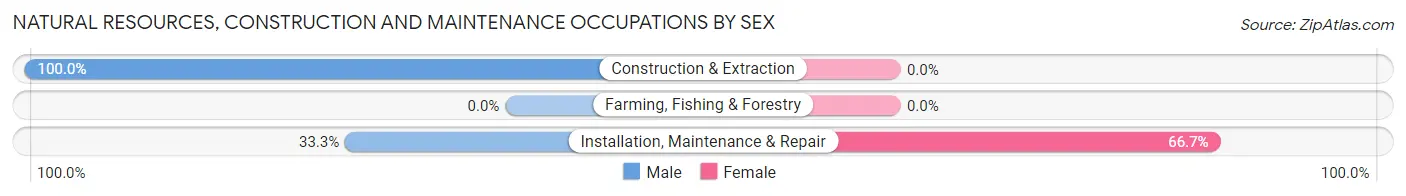
| Occupation | Male | Female |
| Farming, Fishing & Forestry | 0 (0.0%) | 0 (0.0%) |
| Construction & Extraction | 7 (100.0%) | 0 (0.0%) |
| Installation, Maintenance & Repair | 10 (33.3%) | 20 (66.7%) |
| Total (Category) | 17 (46.0%) | 20 (54.0%) |
| Total (Overall) | 523 (49.3%) | 537 (50.7%) |
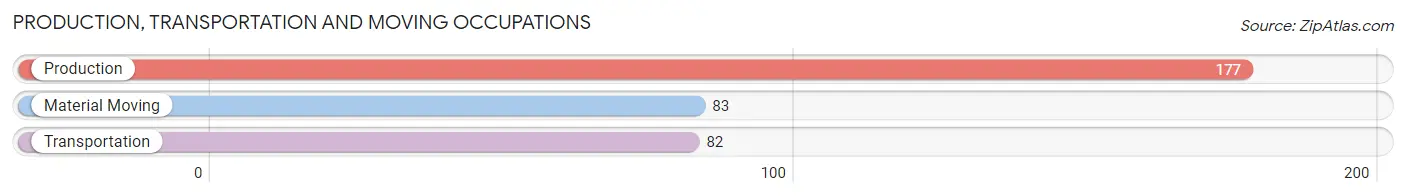
Production, Transportation and Moving Occupations
The most common Production, Transportation and Moving occupations in West Buechel are Production (177 | 16.7%), Material Moving (83 | 7.8%), and Transportation (82 | 7.7%).
Production, Transportation and Moving Occupations by Sex
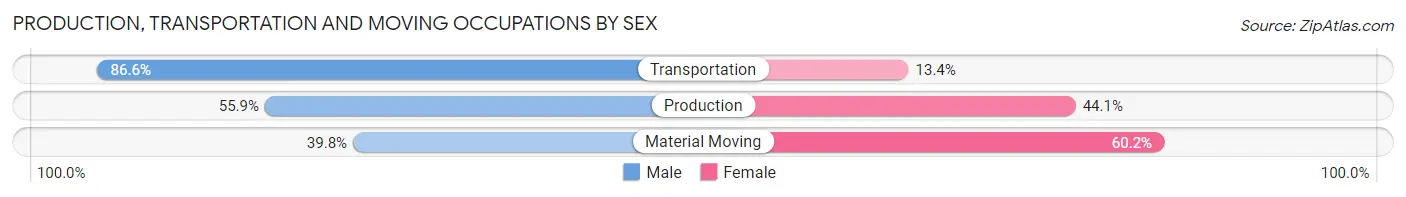
| Occupation | Male | Female |
| Production | 99 (55.9%) | 78 (44.1%) |
| Transportation | 71 (86.6%) | 11 (13.4%) |
| Material Moving | 33 (39.8%) | 50 (60.2%) |
| Total (Category) | 203 (59.4%) | 139 (40.6%) |
| Total (Overall) | 523 (49.3%) | 537 (50.7%) |
Employment Industries by Sex in West Buechel
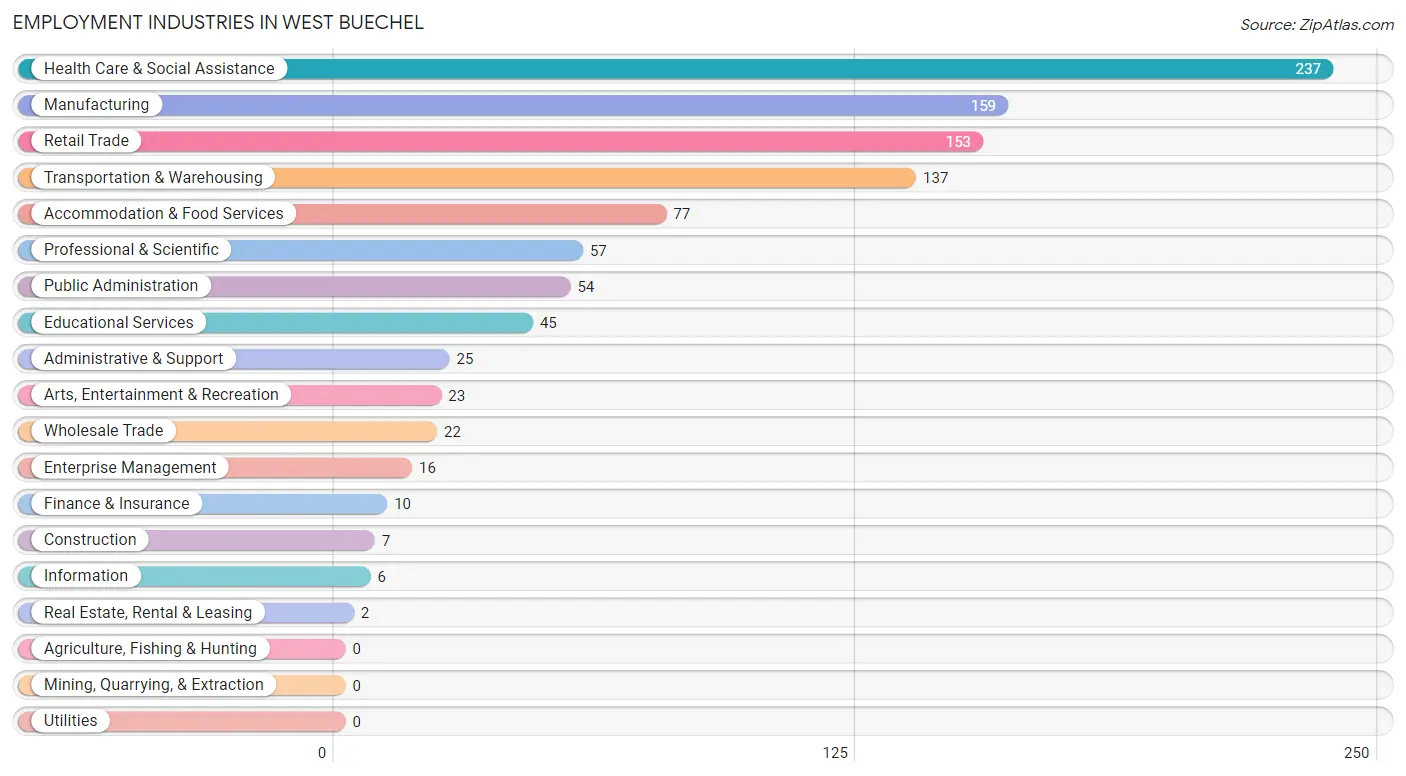
Employment Industries in West Buechel
The major employment industries in West Buechel include Health Care & Social Assistance (237 | 22.4%), Manufacturing (159 | 15.0%), Retail Trade (153 | 14.4%), Transportation & Warehousing (137 | 12.9%), and Accommodation & Food Services (77 | 7.3%).
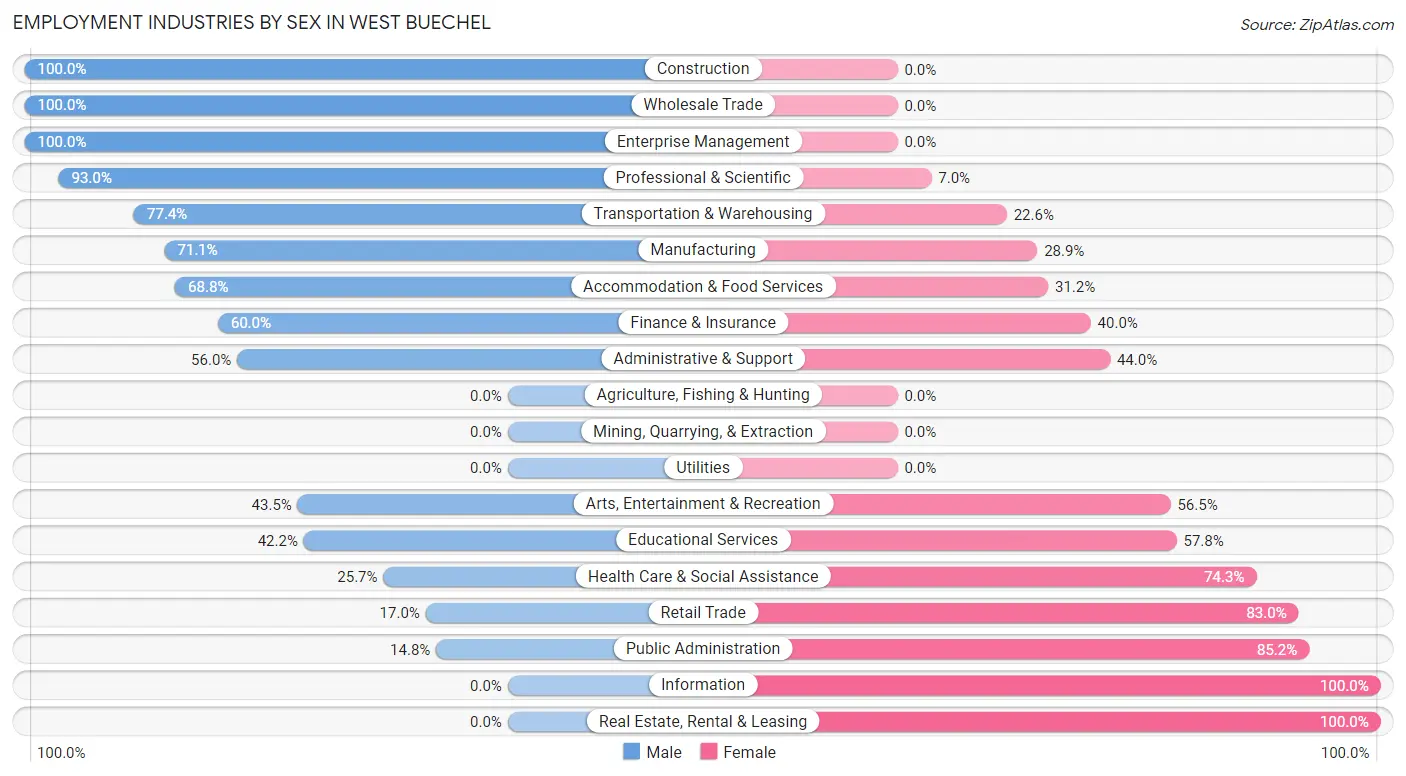
Employment Industries by Sex in West Buechel
The West Buechel industries that see more men than women are Construction (100.0%), Wholesale Trade (100.0%), and Enterprise Management (100.0%), whereas the industries that tend to have a higher number of women are Information (100.0%), Real Estate, Rental & Leasing (100.0%), and Public Administration (85.2%).
| Industry | Male | Female |
| Agriculture, Fishing & Hunting | 0 (0.0%) | 0 (0.0%) |
| Mining, Quarrying, & Extraction | 0 (0.0%) | 0 (0.0%) |
| Construction | 7 (100.0%) | 0 (0.0%) |
| Manufacturing | 113 (71.1%) | 46 (28.9%) |
| Wholesale Trade | 22 (100.0%) | 0 (0.0%) |
| Retail Trade | 26 (17.0%) | 127 (83.0%) |
| Transportation & Warehousing | 106 (77.4%) | 31 (22.6%) |
| Utilities | 0 (0.0%) | 0 (0.0%) |
| Information | 0 (0.0%) | 6 (100.0%) |
| Finance & Insurance | 6 (60.0%) | 4 (40.0%) |
| Real Estate, Rental & Leasing | 0 (0.0%) | 2 (100.0%) |
| Professional & Scientific | 53 (93.0%) | 4 (7.0%) |
| Enterprise Management | 16 (100.0%) | 0 (0.0%) |
| Administrative & Support | 14 (56.0%) | 11 (44.0%) |
| Educational Services | 19 (42.2%) | 26 (57.8%) |
| Health Care & Social Assistance | 61 (25.7%) | 176 (74.3%) |
| Arts, Entertainment & Recreation | 10 (43.5%) | 13 (56.5%) |
| Accommodation & Food Services | 53 (68.8%) | 24 (31.2%) |
| Public Administration | 8 (14.8%) | 46 (85.2%) |
| Total | 523 (49.3%) | 537 (50.7%) |
Education in West Buechel
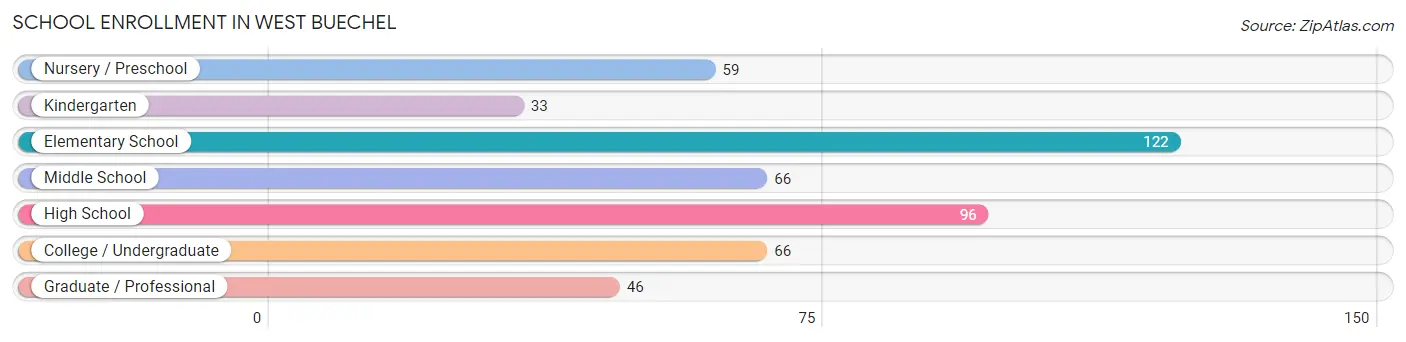
School Enrollment in West Buechel
The most common levels of schooling among the 488 students in West Buechel are elementary school (122 | 25.0%), high school (96 | 19.7%), and middle school (66 | 13.5%).
| School Level | # Students | % Students |
| Nursery / Preschool | 59 | 12.1% |
| Kindergarten | 33 | 6.8% |
| Elementary School | 122 | 25.0% |
| Middle School | 66 | 13.5% |
| High School | 96 | 19.7% |
| College / Undergraduate | 66 | 13.5% |
| Graduate / Professional | 46 | 9.4% |
| Total | 488 | 100.0% |
School Enrollment by Age by Funding Source in West Buechel
Out of a total of 488 students who are enrolled in schools in West Buechel, 101 (20.7%) attend a private institution, while the remaining 387 (79.3%) are enrolled in public schools. The age group of 20 to 24 year olds has the highest likelihood of being enrolled in private schools, with 7 (77.8% in the age bracket) enrolled. Conversely, the age group of 3 to 4 year olds has the lowest likelihood of being enrolled in a private school, with 27 (100.0% in the age bracket) attending a public institution.
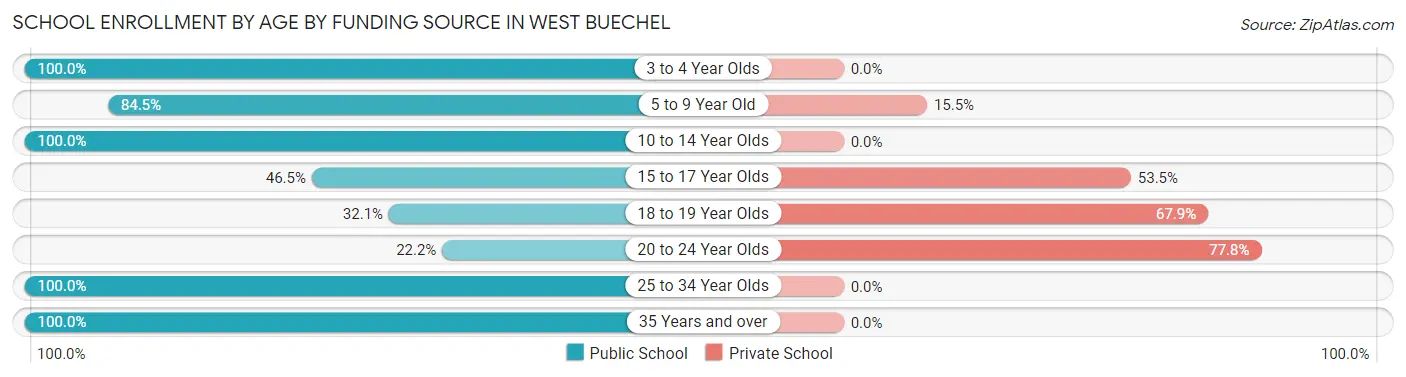
| Age Bracket | Public School | Private School |
| 3 to 4 Year Olds | 27 (100.0%) | 0 (0.0%) |
| 5 to 9 Year Old | 158 (84.5%) | 29 (15.5%) |
| 10 to 14 Year Olds | 73 (100.0%) | 0 (0.0%) |
| 15 to 17 Year Olds | 40 (46.5%) | 46 (53.5%) |
| 18 to 19 Year Olds | 9 (32.1%) | 19 (67.9%) |
| 20 to 24 Year Olds | 2 (22.2%) | 7 (77.8%) |
| 25 to 34 Year Olds | 30 (100.0%) | 0 (0.0%) |
| 35 Years and over | 48 (100.0%) | 0 (0.0%) |
| Total | 387 (79.3%) | 101 (20.7%) |
Educational Attainment by Field of Study in West Buechel
Business (83 | 21.1%), communications (57 | 14.5%), education (45 | 11.5%), engineering (42 | 10.7%), and literature & languages (40 | 10.2%) are the most common fields of study among 393 individuals in West Buechel who have obtained a bachelor's degree or higher.
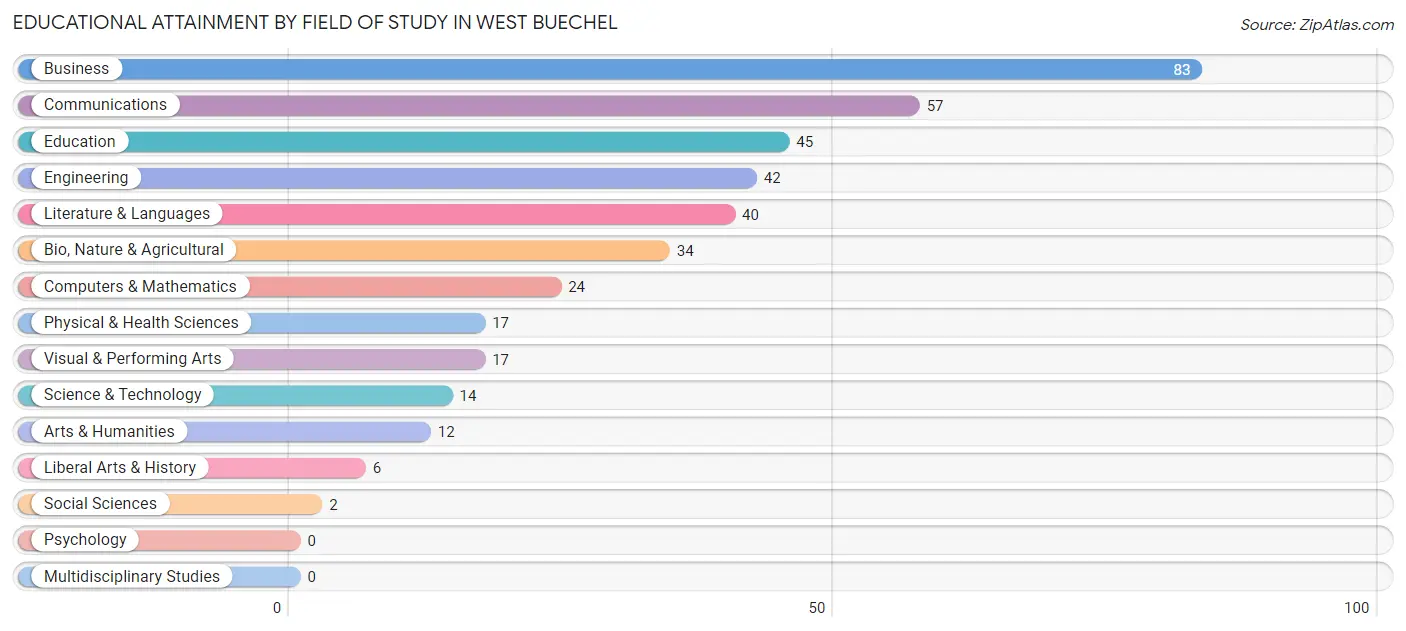
| Field of Study | # Graduates | % Graduates |
| Computers & Mathematics | 24 | 6.1% |
| Bio, Nature & Agricultural | 34 | 8.6% |
| Physical & Health Sciences | 17 | 4.3% |
| Psychology | 0 | 0.0% |
| Social Sciences | 2 | 0.5% |
| Engineering | 42 | 10.7% |
| Multidisciplinary Studies | 0 | 0.0% |
| Science & Technology | 14 | 3.6% |
| Business | 83 | 21.1% |
| Education | 45 | 11.5% |
| Literature & Languages | 40 | 10.2% |
| Liberal Arts & History | 6 | 1.5% |
| Visual & Performing Arts | 17 | 4.3% |
| Communications | 57 | 14.5% |
| Arts & Humanities | 12 | 3.0% |
| Total | 393 | 100.0% |
Transportation & Commute in West Buechel
Vehicle Availability by Sex in West Buechel
The most prevalent vehicle ownership categories in West Buechel are males with 1 vehicle (261, accounting for 53.5%) and females with 1 vehicle (281, making up 48.6%).
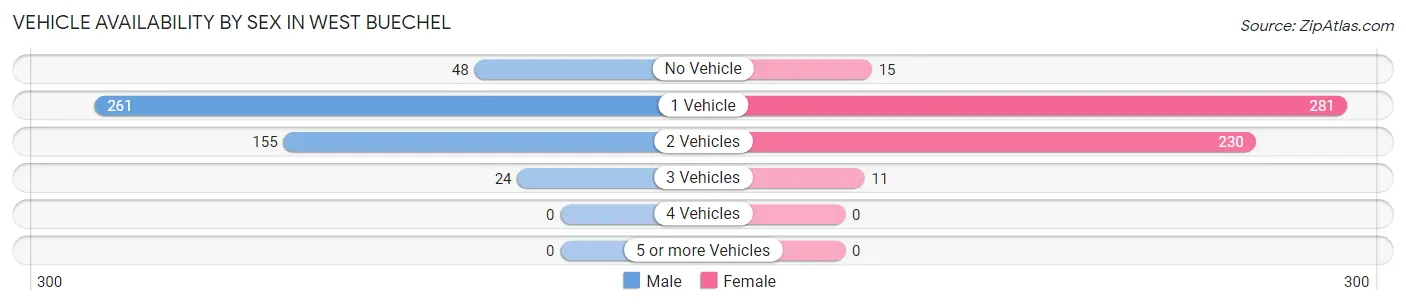
| Vehicles Available | Male | Female |
| No Vehicle | 48 (9.8%) | 15 (2.8%) |
| 1 Vehicle | 261 (53.5%) | 281 (52.3%) |
| 2 Vehicles | 155 (31.8%) | 230 (42.8%) |
| 3 Vehicles | 24 (4.9%) | 11 (2.1%) |
| 4 Vehicles | 0 (0.0%) | 0 (0.0%) |
| 5 or more Vehicles | 0 (0.0%) | 0 (0.0%) |
| Total | 488 (100.0%) | 537 (100.0%) |
Commute Time in West Buechel
The most frequently occuring commute durations in West Buechel are 15 to 19 minutes (233 commuters, 24.2%), 5 to 9 minutes (157 commuters, 16.3%), and 20 to 24 minutes (150 commuters, 15.6%).
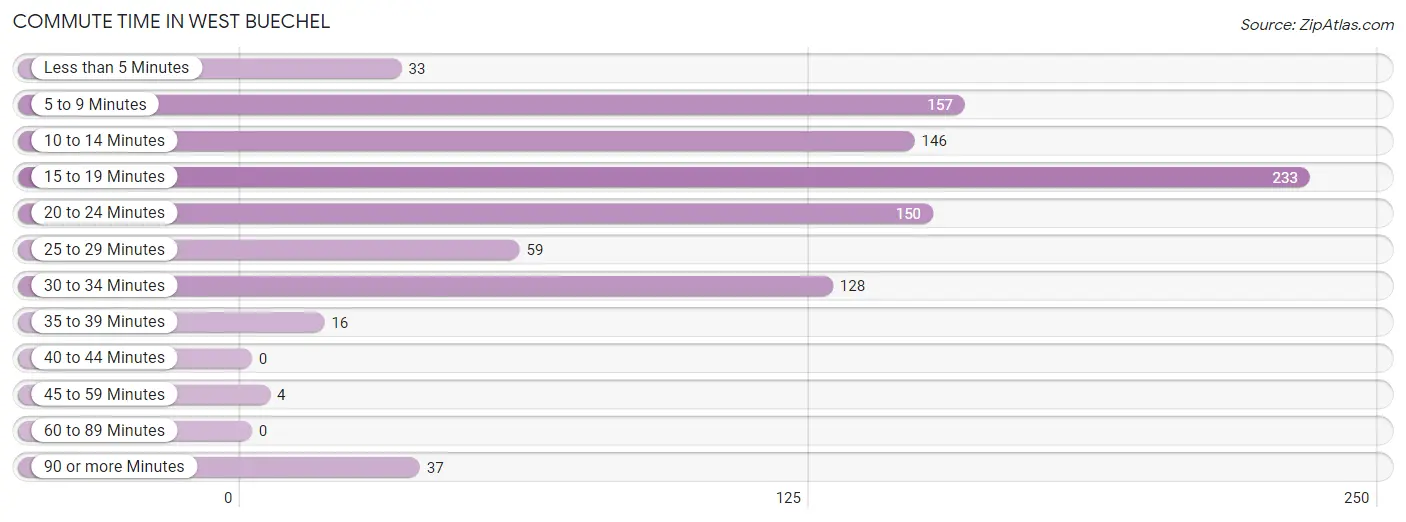
| Commute Time | # Commuters | % Commuters |
| Less than 5 Minutes | 33 | 3.4% |
| 5 to 9 Minutes | 157 | 16.3% |
| 10 to 14 Minutes | 146 | 15.2% |
| 15 to 19 Minutes | 233 | 24.2% |
| 20 to 24 Minutes | 150 | 15.6% |
| 25 to 29 Minutes | 59 | 6.1% |
| 30 to 34 Minutes | 128 | 13.3% |
| 35 to 39 Minutes | 16 | 1.7% |
| 40 to 44 Minutes | 0 | 0.0% |
| 45 to 59 Minutes | 4 | 0.4% |
| 60 to 89 Minutes | 0 | 0.0% |
| 90 or more Minutes | 37 | 3.8% |
Commute Time by Sex in West Buechel
The most common commute times in West Buechel are 15 to 19 minutes (94 commuters, 20.4%) for males and 15 to 19 minutes (139 commuters, 27.6%) for females.
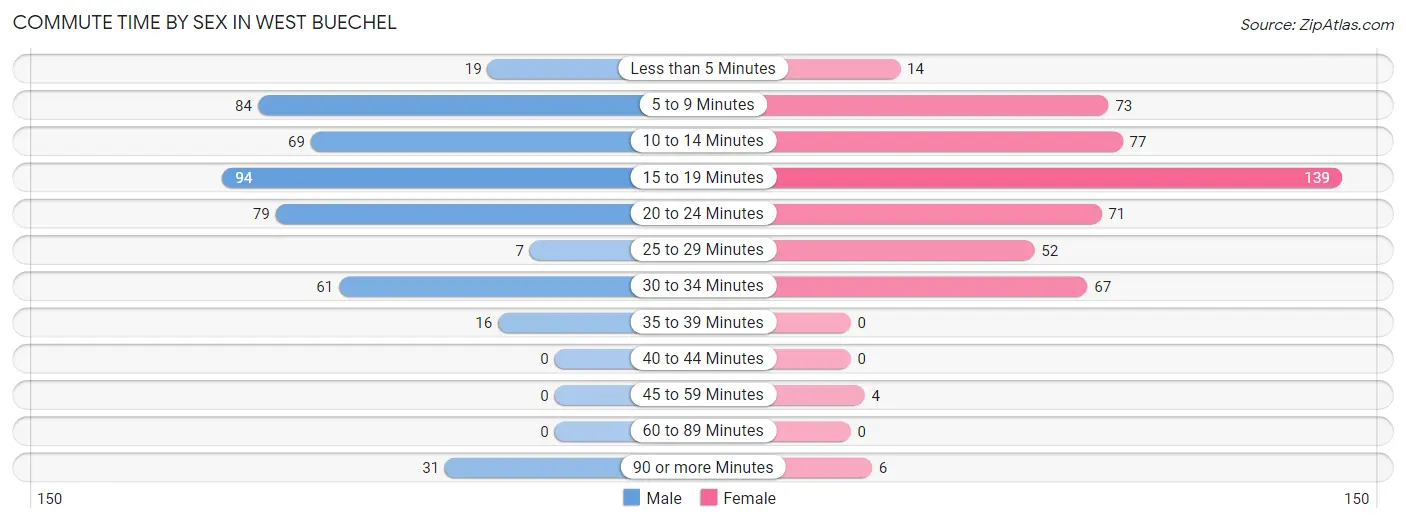
| Commute Time | Male | Female |
| Less than 5 Minutes | 19 (4.1%) | 14 (2.8%) |
| 5 to 9 Minutes | 84 (18.3%) | 73 (14.5%) |
| 10 to 14 Minutes | 69 (15.0%) | 77 (15.3%) |
| 15 to 19 Minutes | 94 (20.4%) | 139 (27.6%) |
| 20 to 24 Minutes | 79 (17.2%) | 71 (14.1%) |
| 25 to 29 Minutes | 7 (1.5%) | 52 (10.3%) |
| 30 to 34 Minutes | 61 (13.3%) | 67 (13.3%) |
| 35 to 39 Minutes | 16 (3.5%) | 0 (0.0%) |
| 40 to 44 Minutes | 0 (0.0%) | 0 (0.0%) |
| 45 to 59 Minutes | 0 (0.0%) | 4 (0.8%) |
| 60 to 89 Minutes | 0 (0.0%) | 0 (0.0%) |
| 90 or more Minutes | 31 (6.7%) | 6 (1.2%) |
Time of Departure to Work by Sex in West Buechel
The most frequent times of departure to work in West Buechel are 12:00 PM to 3:59 PM (73, 15.9%) for males and 4:00 PM to 11:59 PM (90, 17.9%) for females.
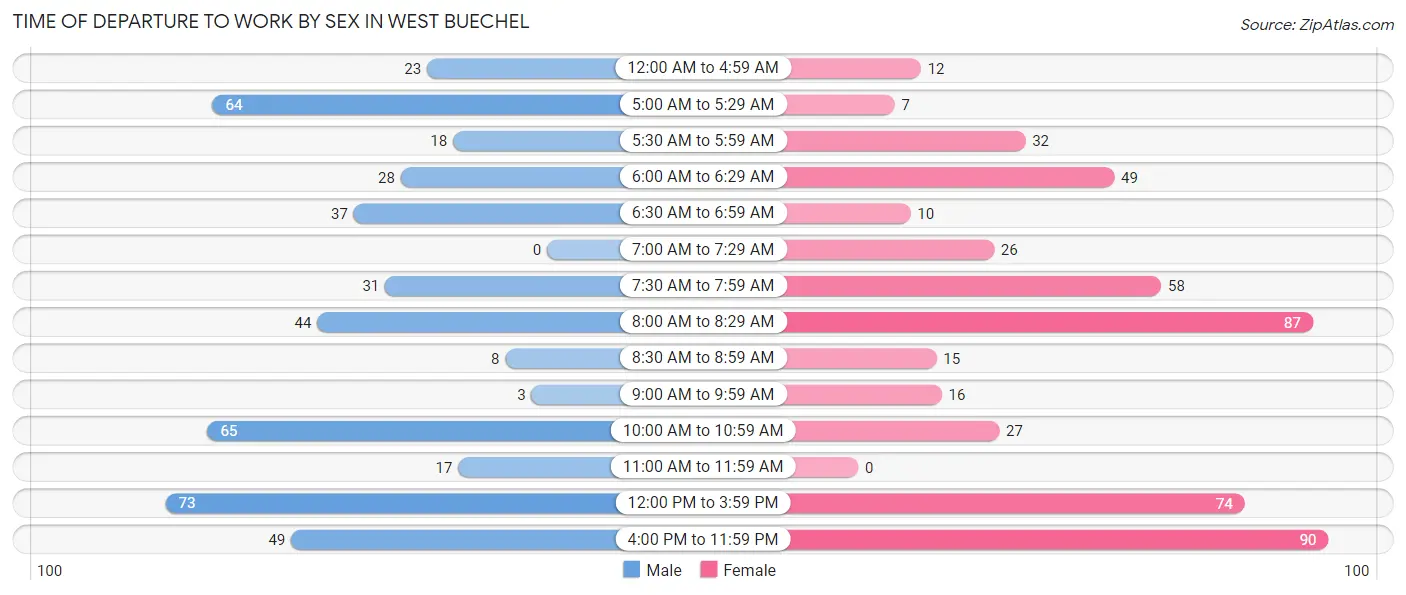
| Time of Departure | Male | Female |
| 12:00 AM to 4:59 AM | 23 (5.0%) | 12 (2.4%) |
| 5:00 AM to 5:29 AM | 64 (13.9%) | 7 (1.4%) |
| 5:30 AM to 5:59 AM | 18 (3.9%) | 32 (6.4%) |
| 6:00 AM to 6:29 AM | 28 (6.1%) | 49 (9.7%) |
| 6:30 AM to 6:59 AM | 37 (8.0%) | 10 (2.0%) |
| 7:00 AM to 7:29 AM | 0 (0.0%) | 26 (5.2%) |
| 7:30 AM to 7:59 AM | 31 (6.7%) | 58 (11.5%) |
| 8:00 AM to 8:29 AM | 44 (9.6%) | 87 (17.3%) |
| 8:30 AM to 8:59 AM | 8 (1.7%) | 15 (3.0%) |
| 9:00 AM to 9:59 AM | 3 (0.6%) | 16 (3.2%) |
| 10:00 AM to 10:59 AM | 65 (14.1%) | 27 (5.4%) |
| 11:00 AM to 11:59 AM | 17 (3.7%) | 0 (0.0%) |
| 12:00 PM to 3:59 PM | 73 (15.9%) | 74 (14.7%) |
| 4:00 PM to 11:59 PM | 49 (10.6%) | 90 (17.9%) |
| Total | 460 (100.0%) | 503 (100.0%) |
Housing Occupancy in West Buechel
Occupancy by Ownership in West Buechel
Of the total 705 dwellings in West Buechel, owner-occupied units account for 113 (16.0%), while renter-occupied units make up 592 (84.0%).
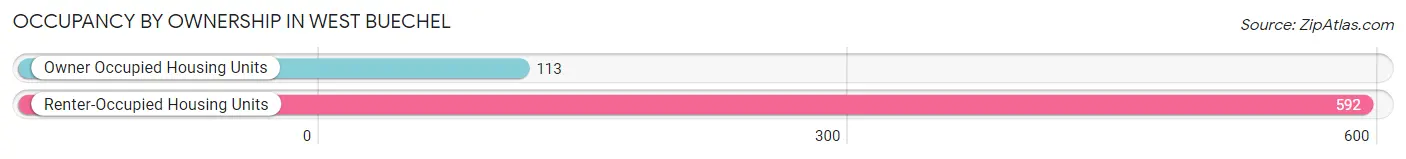
| Occupancy | # Housing Units | % Housing Units |
| Owner Occupied Housing Units | 113 | 16.0% |
| Renter-Occupied Housing Units | 592 | 84.0% |
| Total Occupied Housing Units | 705 | 100.0% |
Occupancy by Household Size in West Buechel
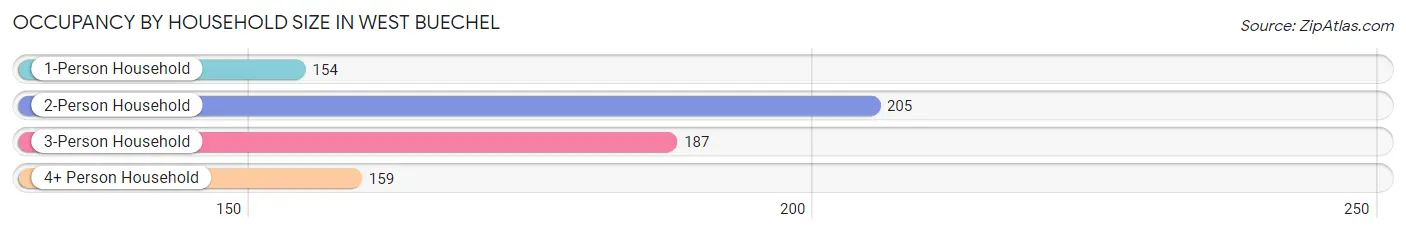
| Household Size | # Housing Units | % Housing Units |
| 1-Person Household | 154 | 21.8% |
| 2-Person Household | 205 | 29.1% |
| 3-Person Household | 187 | 26.5% |
| 4+ Person Household | 159 | 22.6% |
| Total Housing Units | 705 | 100.0% |
Occupancy by Ownership by Household Size in West Buechel
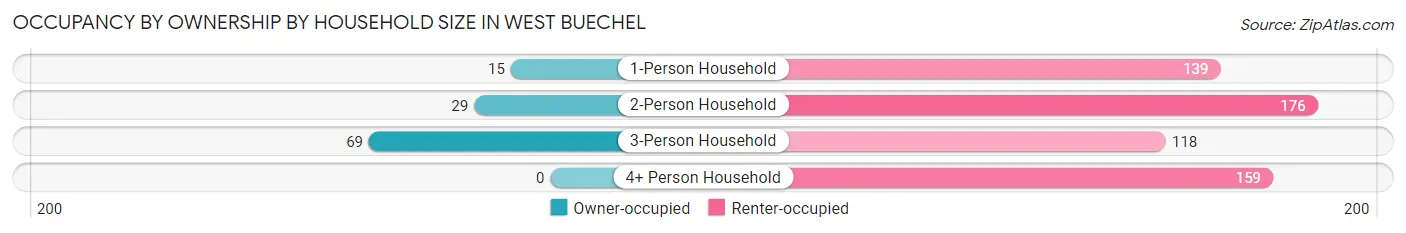
| Household Size | Owner-occupied | Renter-occupied |
| 1-Person Household | 15 (9.7%) | 139 (90.3%) |
| 2-Person Household | 29 (14.1%) | 176 (85.9%) |
| 3-Person Household | 69 (36.9%) | 118 (63.1%) |
| 4+ Person Household | 0 (0.0%) | 159 (100.0%) |
| Total Housing Units | 113 (16.0%) | 592 (84.0%) |
Occupancy by Educational Attainment in West Buechel
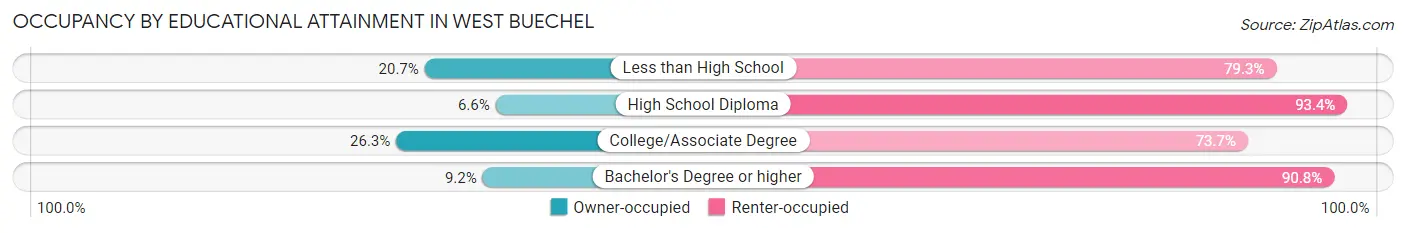
| Household Size | Owner-occupied | Renter-occupied |
| Less than High School | 18 (20.7%) | 69 (79.3%) |
| High School Diploma | 9 (6.6%) | 127 (93.4%) |
| College/Associate Degree | 64 (26.3%) | 179 (73.7%) |
| Bachelor's Degree or higher | 22 (9.2%) | 217 (90.8%) |
Occupancy by Age of Householder in West Buechel
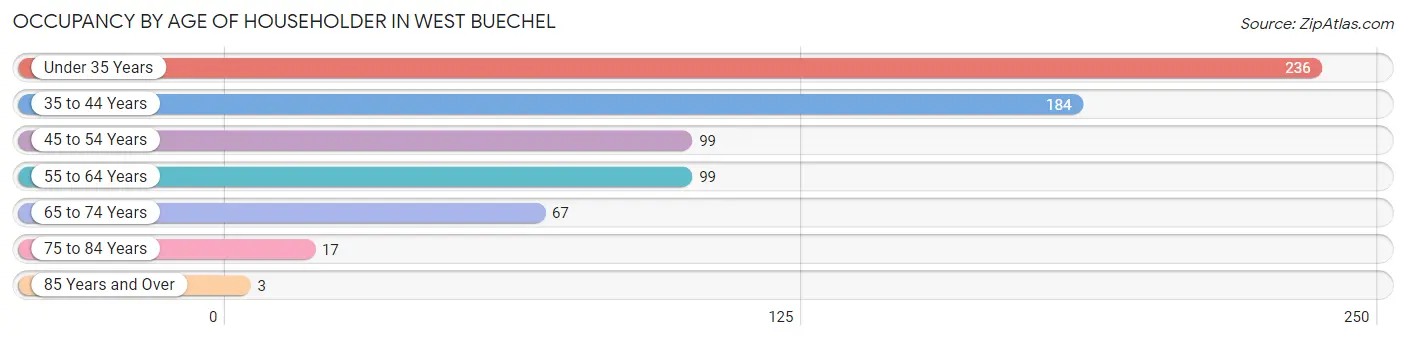
| Age Bracket | # Households | % Households |
| Under 35 Years | 236 | 33.5% |
| 35 to 44 Years | 184 | 26.1% |
| 45 to 54 Years | 99 | 14.0% |
| 55 to 64 Years | 99 | 14.0% |
| 65 to 74 Years | 67 | 9.5% |
| 75 to 84 Years | 17 | 2.4% |
| 85 Years and Over | 3 | 0.4% |
| Total | 705 | 100.0% |
Housing Finances in West Buechel
Median Income by Occupancy in West Buechel
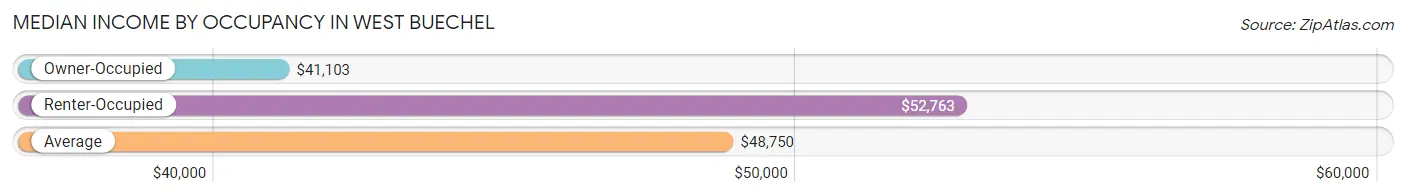
| Occupancy Type | # Households | Median Income |
| Owner-Occupied | 113 (16.0%) | $41,103 |
| Renter-Occupied | 592 (84.0%) | $52,763 |
| Average | 705 (100.0%) | $48,750 |
Occupancy by Householder Income Bracket in West Buechel
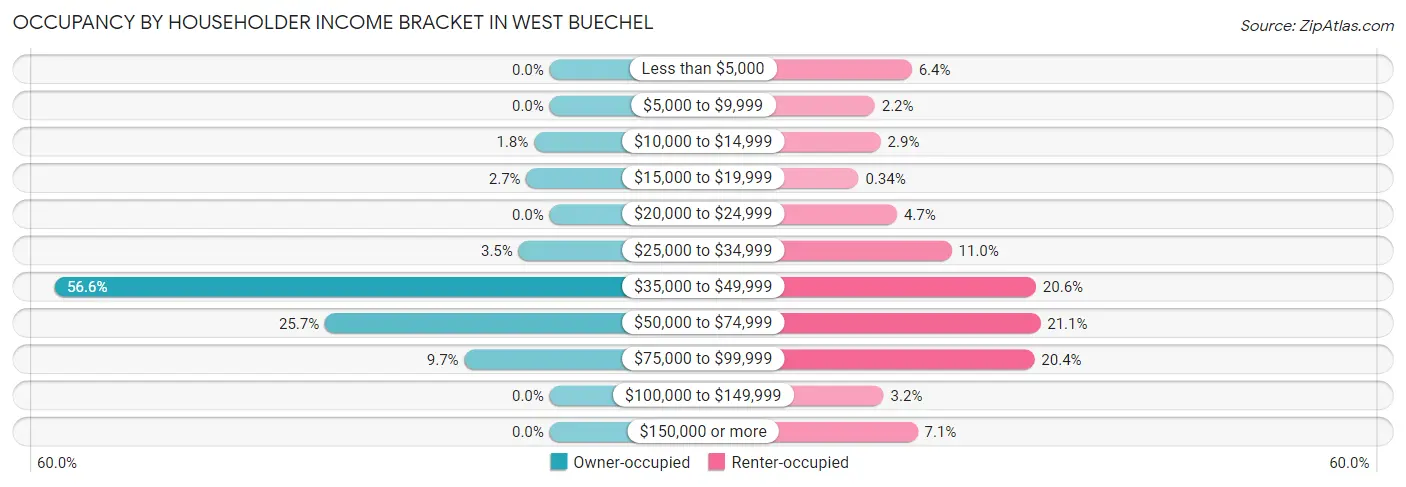
| Income Bracket | Owner-occupied | Renter-occupied |
| Less than $5,000 | 0 (0.0%) | 38 (6.4%) |
| $5,000 to $9,999 | 0 (0.0%) | 13 (2.2%) |
| $10,000 to $14,999 | 2 (1.8%) | 17 (2.9%) |
| $15,000 to $19,999 | 3 (2.6%) | 2 (0.3%) |
| $20,000 to $24,999 | 0 (0.0%) | 28 (4.7%) |
| $25,000 to $34,999 | 4 (3.5%) | 65 (11.0%) |
| $35,000 to $49,999 | 64 (56.6%) | 122 (20.6%) |
| $50,000 to $74,999 | 29 (25.7%) | 125 (21.1%) |
| $75,000 to $99,999 | 11 (9.7%) | 121 (20.4%) |
| $100,000 to $149,999 | 0 (0.0%) | 19 (3.2%) |
| $150,000 or more | 0 (0.0%) | 42 (7.1%) |
| Total | 113 (100.0%) | 592 (100.0%) |
Monthly Housing Cost Tiers in West Buechel
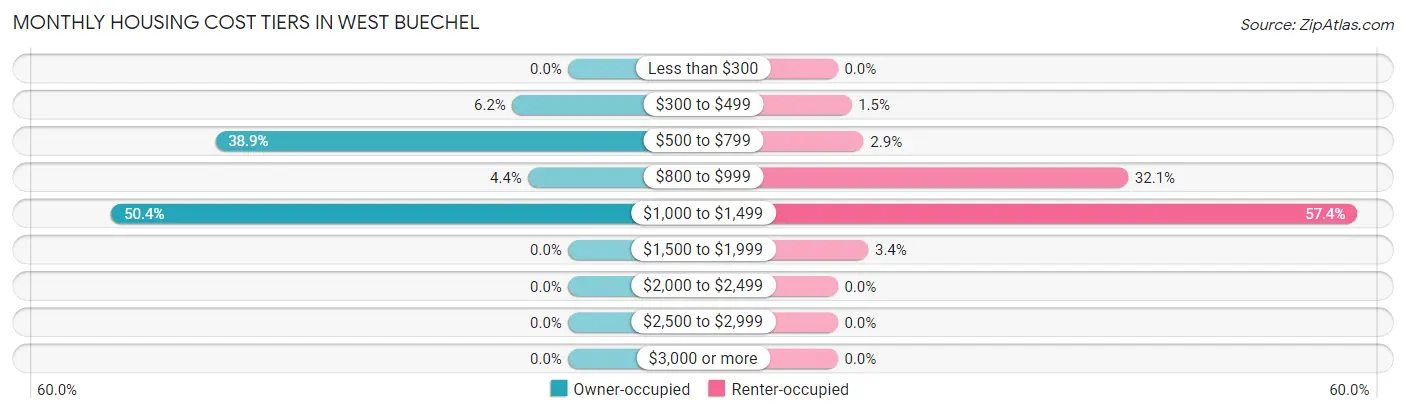
| Monthly Cost | Owner-occupied | Renter-occupied |
| Less than $300 | 0 (0.0%) | 0 (0.0%) |
| $300 to $499 | 7 (6.2%) | 9 (1.5%) |
| $500 to $799 | 44 (38.9%) | 17 (2.9%) |
| $800 to $999 | 5 (4.4%) | 190 (32.1%) |
| $1,000 to $1,499 | 57 (50.4%) | 340 (57.4%) |
| $1,500 to $1,999 | 0 (0.0%) | 20 (3.4%) |
| $2,000 to $2,499 | 0 (0.0%) | 0 (0.0%) |
| $2,500 to $2,999 | 0 (0.0%) | 0 (0.0%) |
| $3,000 or more | 0 (0.0%) | 0 (0.0%) |
| Total | 113 (100.0%) | 592 (100.0%) |
Physical Housing Characteristics in West Buechel
Housing Structures in West Buechel
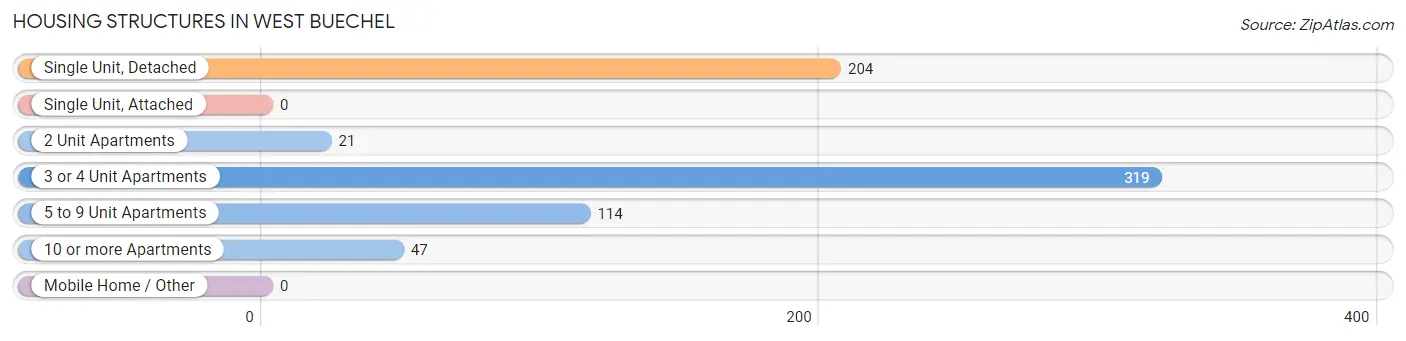
| Structure Type | # Housing Units | % Housing Units |
| Single Unit, Detached | 204 | 28.9% |
| Single Unit, Attached | 0 | 0.0% |
| 2 Unit Apartments | 21 | 3.0% |
| 3 or 4 Unit Apartments | 319 | 45.3% |
| 5 to 9 Unit Apartments | 114 | 16.2% |
| 10 or more Apartments | 47 | 6.7% |
| Mobile Home / Other | 0 | 0.0% |
| Total | 705 | 100.0% |
Housing Structures by Occupancy in West Buechel
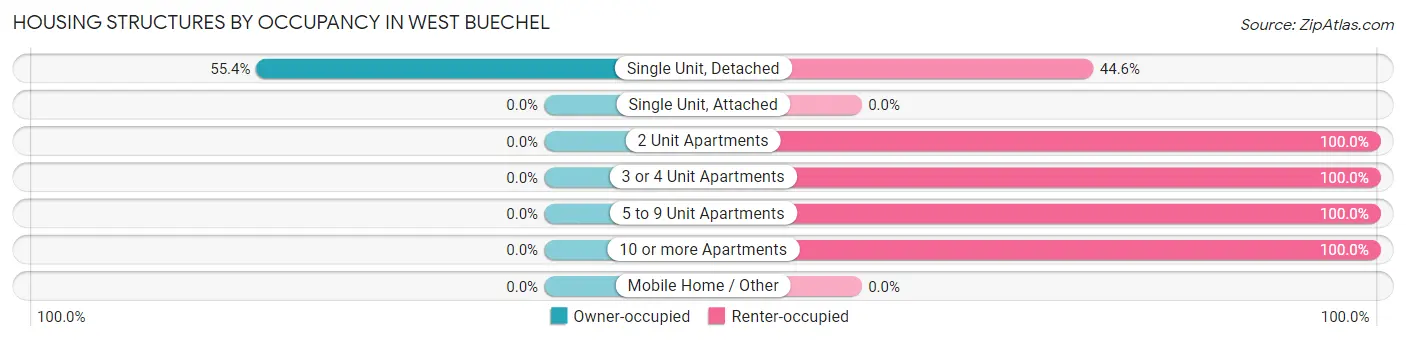
| Structure Type | Owner-occupied | Renter-occupied |
| Single Unit, Detached | 113 (55.4%) | 91 (44.6%) |
| Single Unit, Attached | 0 (0.0%) | 0 (0.0%) |
| 2 Unit Apartments | 0 (0.0%) | 21 (100.0%) |
| 3 or 4 Unit Apartments | 0 (0.0%) | 319 (100.0%) |
| 5 to 9 Unit Apartments | 0 (0.0%) | 114 (100.0%) |
| 10 or more Apartments | 0 (0.0%) | 47 (100.0%) |
| Mobile Home / Other | 0 (0.0%) | 0 (0.0%) |
| Total | 113 (16.0%) | 592 (84.0%) |
Housing Structures by Number of Rooms in West Buechel
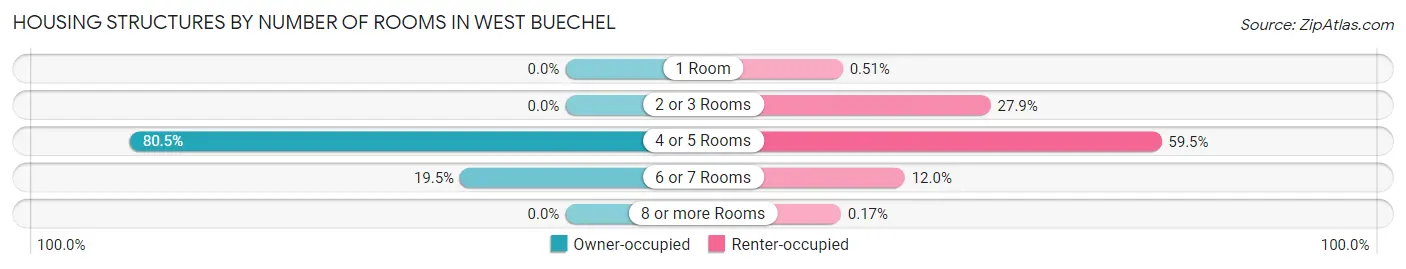
| Number of Rooms | Owner-occupied | Renter-occupied |
| 1 Room | 0 (0.0%) | 3 (0.5%) |
| 2 or 3 Rooms | 0 (0.0%) | 165 (27.9%) |
| 4 or 5 Rooms | 91 (80.5%) | 352 (59.5%) |
| 6 or 7 Rooms | 22 (19.5%) | 71 (12.0%) |
| 8 or more Rooms | 0 (0.0%) | 1 (0.2%) |
| Total | 113 (100.0%) | 592 (100.0%) |
Housing Structure by Heating Type in West Buechel
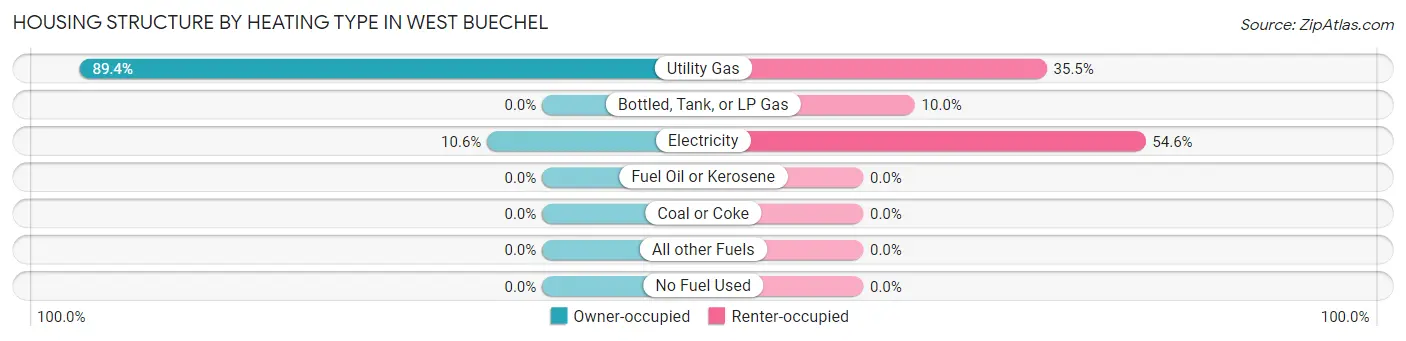
| Heating Type | Owner-occupied | Renter-occupied |
| Utility Gas | 101 (89.4%) | 210 (35.5%) |
| Bottled, Tank, or LP Gas | 0 (0.0%) | 59 (10.0%) |
| Electricity | 12 (10.6%) | 323 (54.6%) |
| Fuel Oil or Kerosene | 0 (0.0%) | 0 (0.0%) |
| Coal or Coke | 0 (0.0%) | 0 (0.0%) |
| All other Fuels | 0 (0.0%) | 0 (0.0%) |
| No Fuel Used | 0 (0.0%) | 0 (0.0%) |
| Total | 113 (100.0%) | 592 (100.0%) |
Household Vehicle Usage in West Buechel
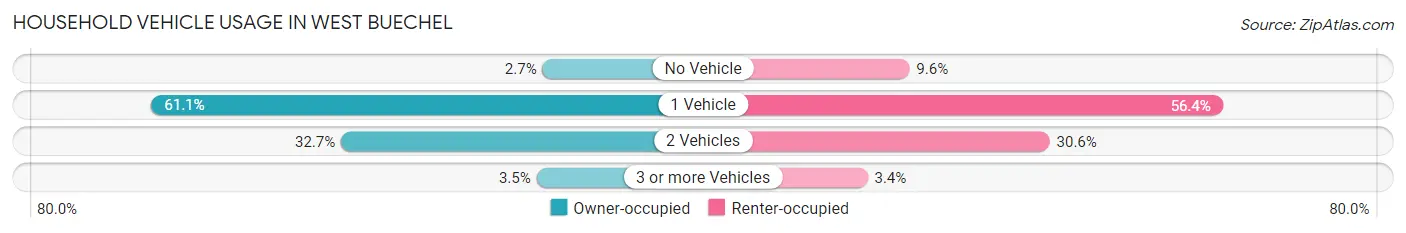
| Vehicles per Household | Owner-occupied | Renter-occupied |
| No Vehicle | 3 (2.6%) | 57 (9.6%) |
| 1 Vehicle | 69 (61.1%) | 334 (56.4%) |
| 2 Vehicles | 37 (32.7%) | 181 (30.6%) |
| 3 or more Vehicles | 4 (3.5%) | 20 (3.4%) |
| Total | 113 (100.0%) | 592 (100.0%) |
Real Estate & Mortgages in West Buechel
Real Estate and Mortgage Overview in West Buechel
| Characteristic | Without Mortgage | With Mortgage |
| Housing Units | 35 | 78 |
| Median Property Value | $87,600 | $161,100 |
| Median Household Income | $58,813 | $0 |
| Monthly Housing Costs | $553 | $0 |
| Real Estate Taxes | $738 | $0 |
Property Value by Mortgage Status in West Buechel
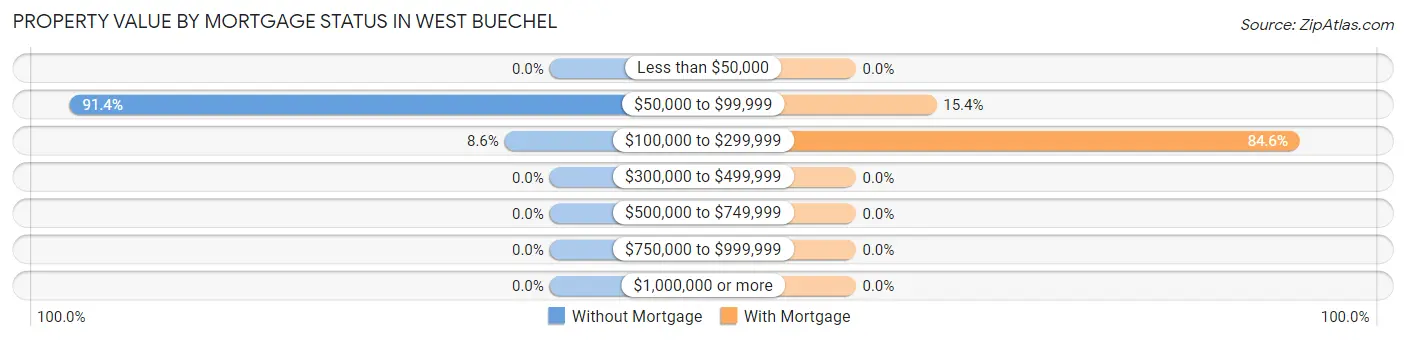
| Property Value | Without Mortgage | With Mortgage |
| Less than $50,000 | 0 (0.0%) | 0 (0.0%) |
| $50,000 to $99,999 | 32 (91.4%) | 12 (15.4%) |
| $100,000 to $299,999 | 3 (8.6%) | 66 (84.6%) |
| $300,000 to $499,999 | 0 (0.0%) | 0 (0.0%) |
| $500,000 to $749,999 | 0 (0.0%) | 0 (0.0%) |
| $750,000 to $999,999 | 0 (0.0%) | 0 (0.0%) |
| $1,000,000 or more | 0 (0.0%) | 0 (0.0%) |
| Total | 35 (100.0%) | 78 (100.0%) |
Household Income by Mortgage Status in West Buechel
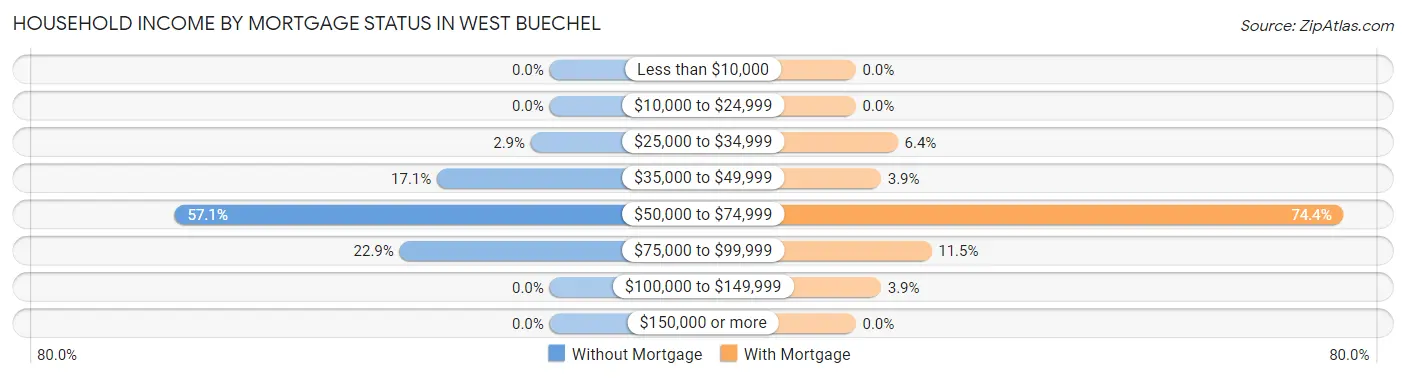
| Household Income | Without Mortgage | With Mortgage |
| Less than $10,000 | 0 (0.0%) | 0 (0.0%) |
| $10,000 to $24,999 | 0 (0.0%) | 0 (0.0%) |
| $25,000 to $34,999 | 1 (2.9%) | 5 (6.4%) |
| $35,000 to $49,999 | 6 (17.1%) | 3 (3.8%) |
| $50,000 to $74,999 | 20 (57.1%) | 58 (74.4%) |
| $75,000 to $99,999 | 8 (22.9%) | 9 (11.5%) |
| $100,000 to $149,999 | 0 (0.0%) | 3 (3.8%) |
| $150,000 or more | 0 (0.0%) | 0 (0.0%) |
| Total | 35 (100.0%) | 78 (100.0%) |
Property Value to Household Income Ratio in West Buechel
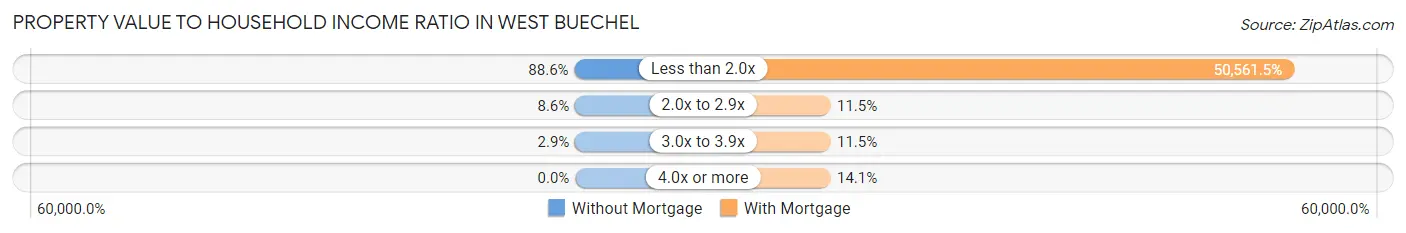
| Value-to-Income Ratio | Without Mortgage | With Mortgage |
| Less than 2.0x | 31 (88.6%) | 39,438 (50,561.5%) |
| 2.0x to 2.9x | 3 (8.6%) | 9 (11.5%) |
| 3.0x to 3.9x | 1 (2.9%) | 9 (11.5%) |
| 4.0x or more | 0 (0.0%) | 11 (14.1%) |
| Total | 35 (100.0%) | 78 (100.0%) |
Real Estate Taxes by Mortgage Status in West Buechel
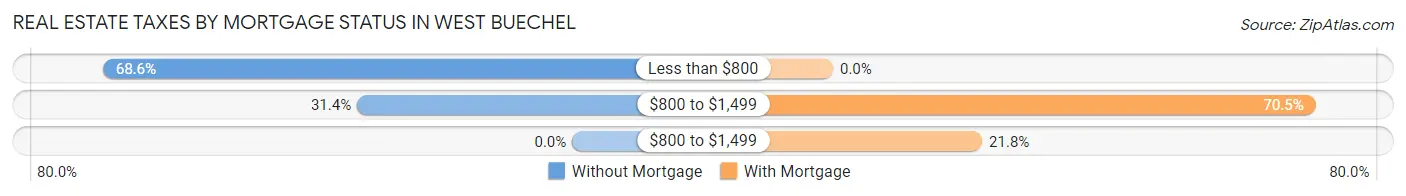
| Property Taxes | Without Mortgage | With Mortgage |
| Less than $800 | 24 (68.6%) | 0 (0.0%) |
| $800 to $1,499 | 11 (31.4%) | 55 (70.5%) |
| $800 to $1,499 | 0 (0.0%) | 17 (21.8%) |
| Total | 35 (100.0%) | 78 (100.0%) |
Health & Disability in West Buechel
Health Insurance Coverage by Age in West Buechel
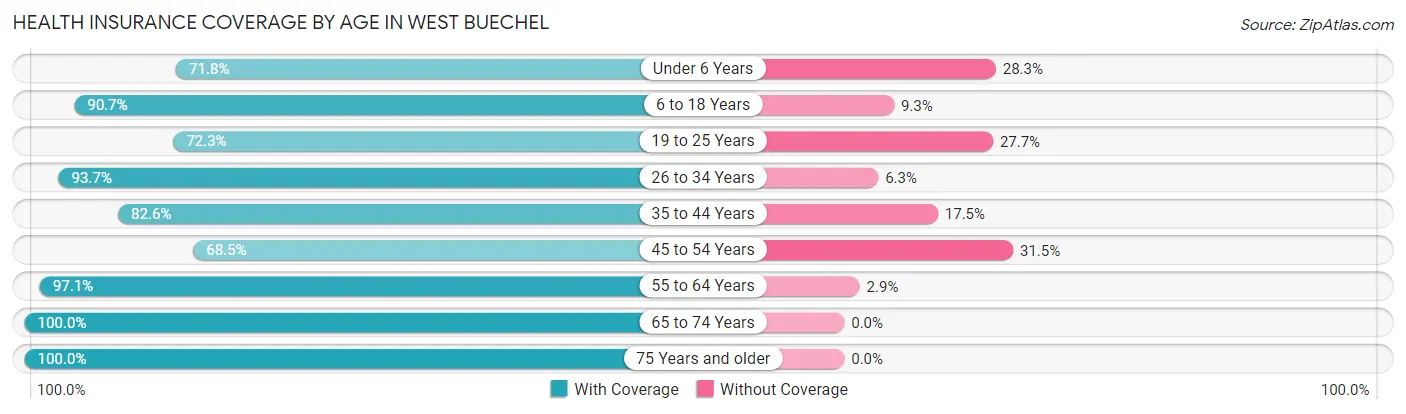
| Age Bracket | With Coverage | Without Coverage |
| Under 6 Years | 254 (71.8%) | 100 (28.2%) |
| 6 to 18 Years | 264 (90.7%) | 27 (9.3%) |
| 19 to 25 Years | 133 (72.3%) | 51 (27.7%) |
| 26 to 34 Years | 311 (93.7%) | 21 (6.3%) |
| 35 to 44 Years | 246 (82.6%) | 52 (17.4%) |
| 45 to 54 Years | 135 (68.5%) | 62 (31.5%) |
| 55 to 64 Years | 136 (97.1%) | 4 (2.9%) |
| 65 to 74 Years | 120 (100.0%) | 0 (0.0%) |
| 75 Years and older | 20 (100.0%) | 0 (0.0%) |
| Total | 1,619 (83.6%) | 317 (16.4%) |
Health Insurance Coverage by Citizenship Status in West Buechel
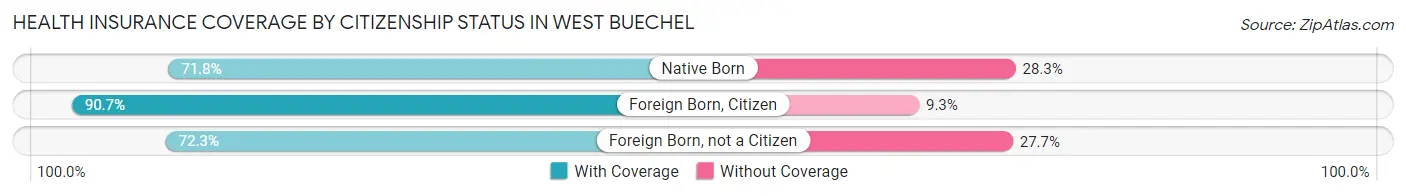
| Citizenship Status | With Coverage | Without Coverage |
| Native Born | 254 (71.8%) | 100 (28.2%) |
| Foreign Born, Citizen | 264 (90.7%) | 27 (9.3%) |
| Foreign Born, not a Citizen | 133 (72.3%) | 51 (27.7%) |
Health Insurance Coverage by Household Income in West Buechel
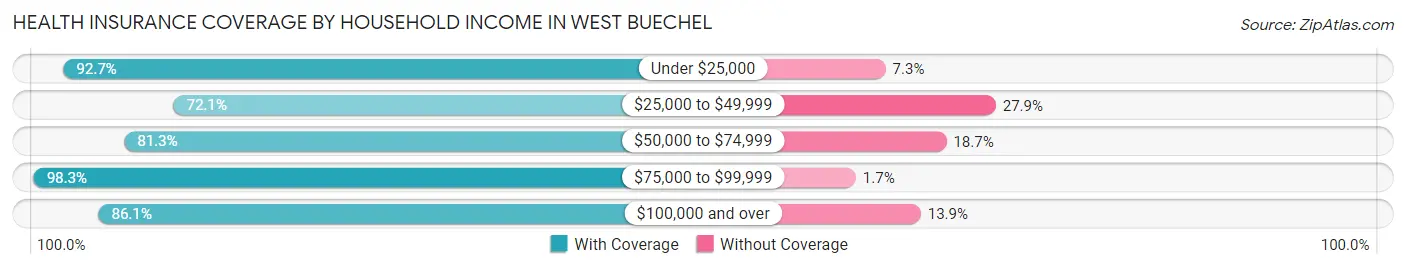
| Household Income | With Coverage | Without Coverage |
| Under $25,000 | 242 (92.7%) | 19 (7.3%) |
| $25,000 to $49,999 | 488 (72.1%) | 189 (27.9%) |
| $50,000 to $74,999 | 344 (81.3%) | 79 (18.7%) |
| $75,000 to $99,999 | 402 (98.3%) | 7 (1.7%) |
| $100,000 and over | 143 (86.1%) | 23 (13.9%) |
Public vs Private Health Insurance Coverage by Age in West Buechel
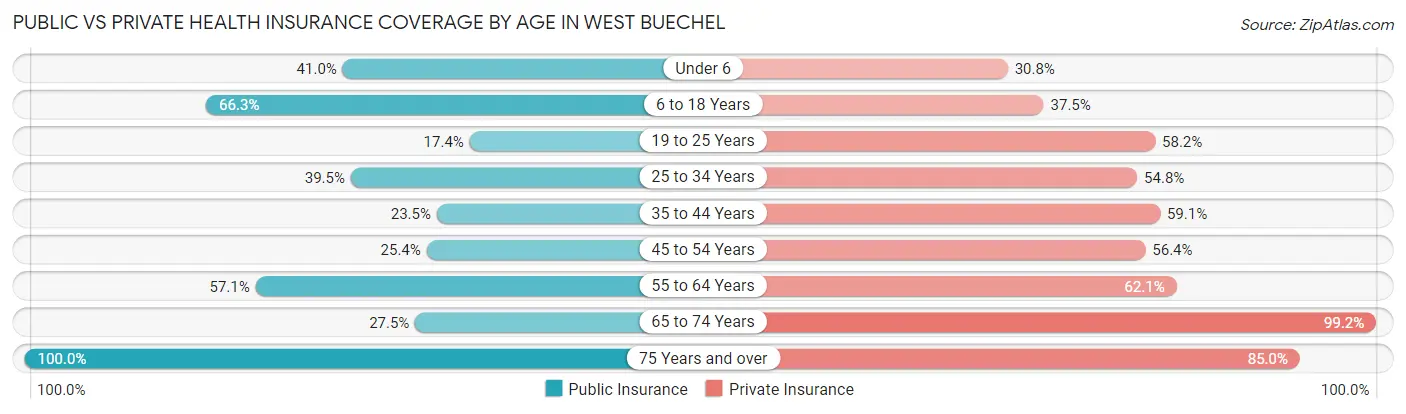
| Age Bracket | Public Insurance | Private Insurance |
| Under 6 | 145 (41.0%) | 109 (30.8%) |
| 6 to 18 Years | 193 (66.3%) | 109 (37.5%) |
| 19 to 25 Years | 32 (17.4%) | 107 (58.2%) |
| 25 to 34 Years | 131 (39.5%) | 182 (54.8%) |
| 35 to 44 Years | 70 (23.5%) | 176 (59.1%) |
| 45 to 54 Years | 50 (25.4%) | 111 (56.4%) |
| 55 to 64 Years | 80 (57.1%) | 87 (62.1%) |
| 65 to 74 Years | 33 (27.5%) | 119 (99.2%) |
| 75 Years and over | 20 (100.0%) | 17 (85.0%) |
| Total | 754 (39.0%) | 1,017 (52.5%) |
Disability Status by Sex by Age in West Buechel
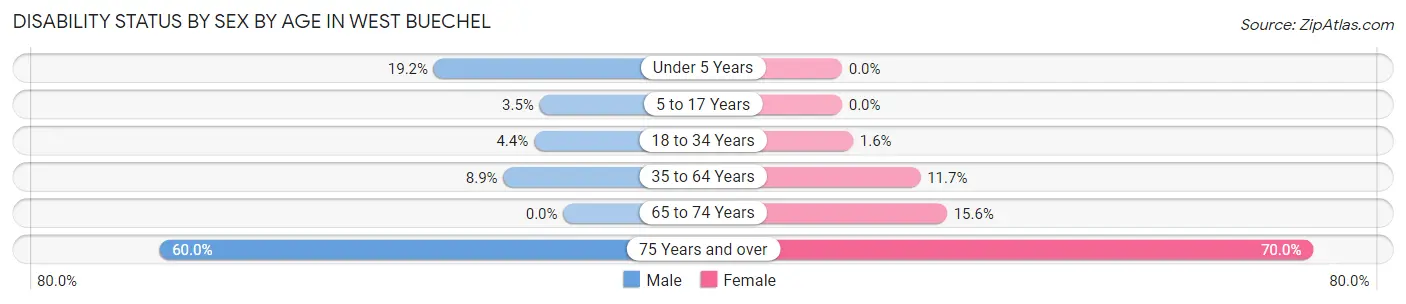
| Age Bracket | Male | Female |
| Under 5 Years | 20 (19.2%) | 0 (0.0%) |
| 5 to 17 Years | 6 (3.5%) | 0 (0.0%) |
| 18 to 34 Years | 10 (4.3%) | 5 (1.6%) |
| 35 to 64 Years | 29 (8.9%) | 36 (11.7%) |
| 65 to 74 Years | 0 (0.0%) | 12 (15.6%) |
| 75 Years and over | 6 (60.0%) | 7 (70.0%) |
Disability Class by Sex by Age in West Buechel
Disability Class: Hearing Difficulty
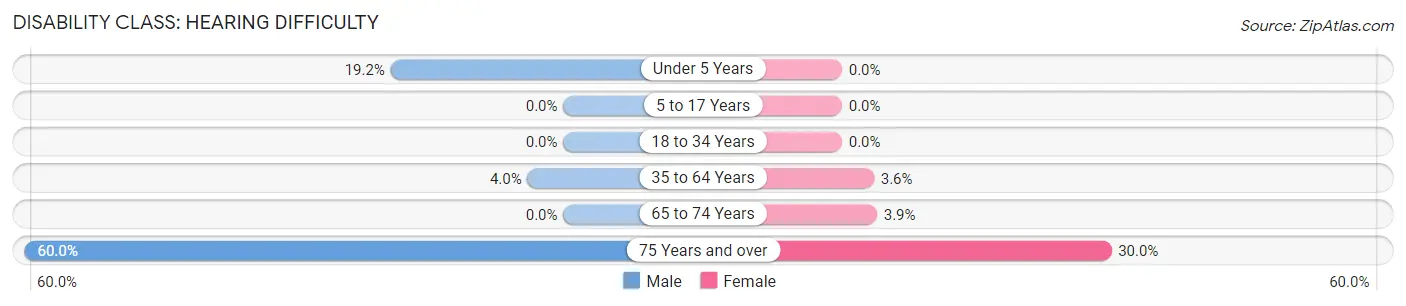
| Age Bracket | Male | Female |
| Under 5 Years | 20 (19.2%) | 0 (0.0%) |
| 5 to 17 Years | 0 (0.0%) | 0 (0.0%) |
| 18 to 34 Years | 0 (0.0%) | 0 (0.0%) |
| 35 to 64 Years | 13 (4.0%) | 11 (3.6%) |
| 65 to 74 Years | 0 (0.0%) | 3 (3.9%) |
| 75 Years and over | 6 (60.0%) | 3 (30.0%) |
Disability Class: Vision Difficulty
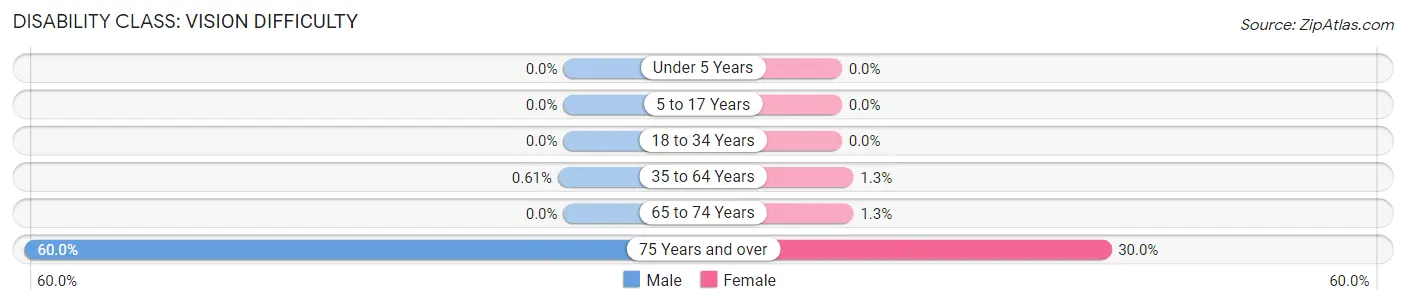
| Age Bracket | Male | Female |
| Under 5 Years | 0 (0.0%) | 0 (0.0%) |
| 5 to 17 Years | 0 (0.0%) | 0 (0.0%) |
| 18 to 34 Years | 0 (0.0%) | 0 (0.0%) |
| 35 to 64 Years | 2 (0.6%) | 4 (1.3%) |
| 65 to 74 Years | 0 (0.0%) | 1 (1.3%) |
| 75 Years and over | 6 (60.0%) | 3 (30.0%) |
Disability Class: Cognitive Difficulty
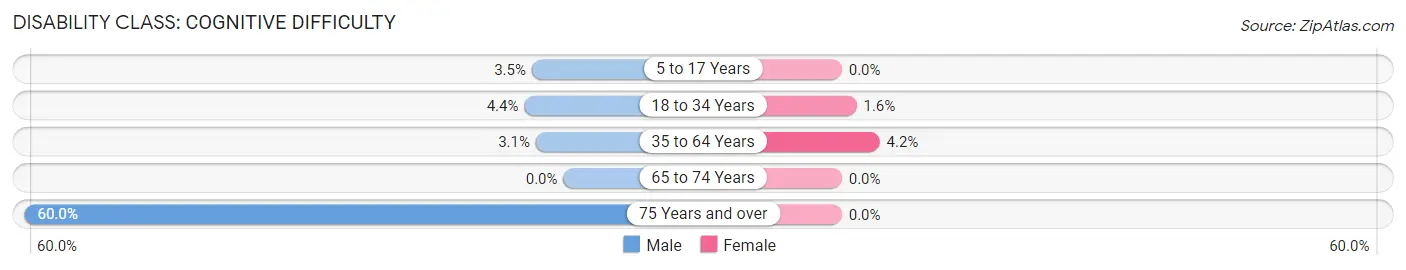
| Age Bracket | Male | Female |
| 5 to 17 Years | 6 (3.5%) | 0 (0.0%) |
| 18 to 34 Years | 10 (4.3%) | 5 (1.6%) |
| 35 to 64 Years | 10 (3.1%) | 13 (4.2%) |
| 65 to 74 Years | 0 (0.0%) | 0 (0.0%) |
| 75 Years and over | 6 (60.0%) | 0 (0.0%) |
Disability Class: Ambulatory Difficulty
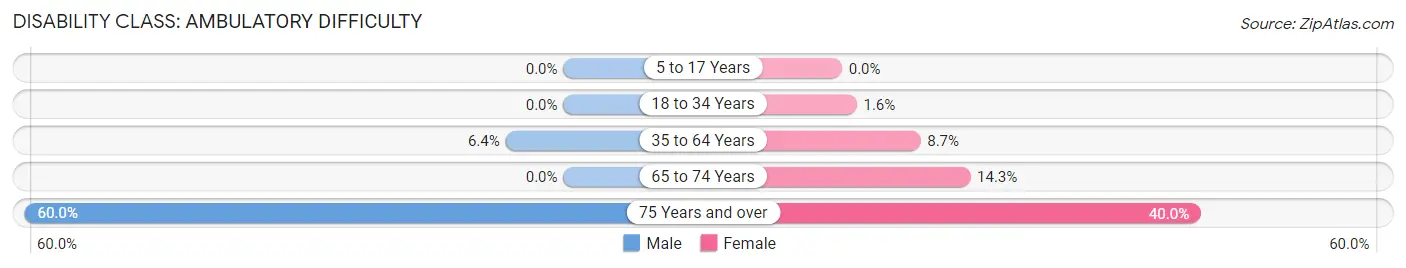
| Age Bracket | Male | Female |
| 5 to 17 Years | 0 (0.0%) | 0 (0.0%) |
| 18 to 34 Years | 0 (0.0%) | 5 (1.6%) |
| 35 to 64 Years | 21 (6.4%) | 27 (8.7%) |
| 65 to 74 Years | 0 (0.0%) | 11 (14.3%) |
| 75 Years and over | 6 (60.0%) | 4 (40.0%) |
Disability Class: Self-Care Difficulty
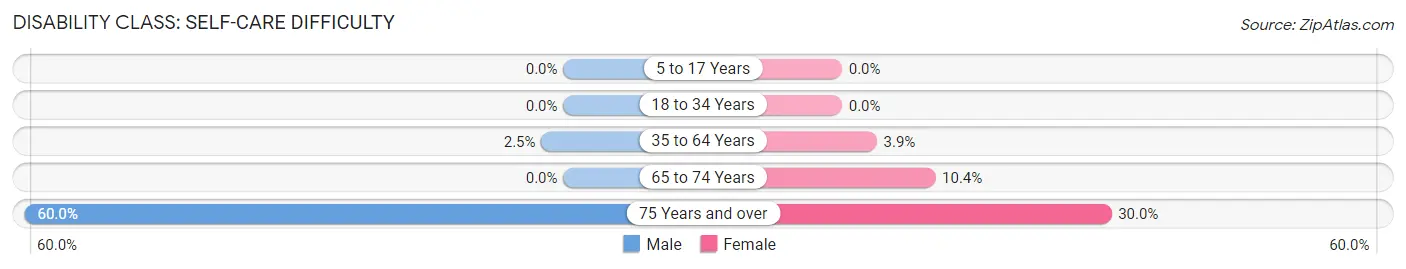
| Age Bracket | Male | Female |
| 5 to 17 Years | 0 (0.0%) | 0 (0.0%) |
| 18 to 34 Years | 0 (0.0%) | 0 (0.0%) |
| 35 to 64 Years | 8 (2.5%) | 12 (3.9%) |
| 65 to 74 Years | 0 (0.0%) | 8 (10.4%) |
| 75 Years and over | 6 (60.0%) | 3 (30.0%) |
Technology Access in West Buechel
Computing Device Access in West Buechel
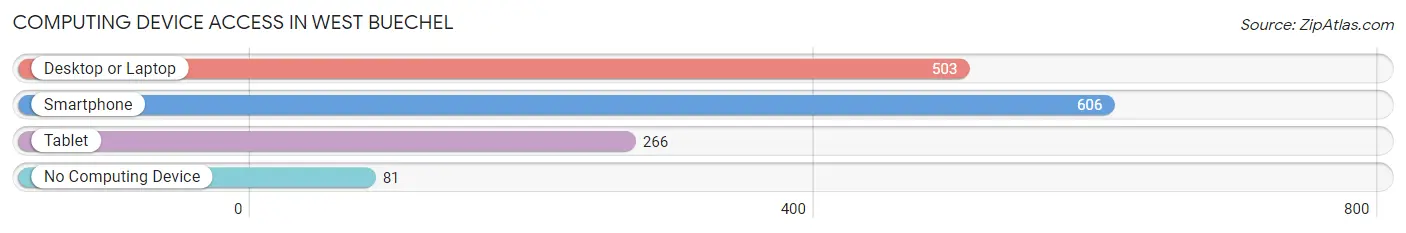
| Device Type | # Households | % Households |
| Desktop or Laptop | 503 | 71.4% |
| Smartphone | 606 | 86.0% |
| Tablet | 266 | 37.7% |
| No Computing Device | 81 | 11.5% |
| Total | 705 | 100.0% |
Internet Access in West Buechel
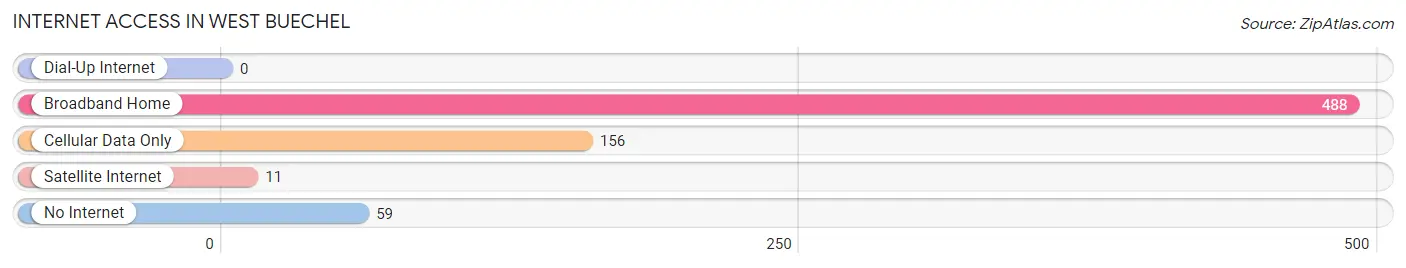
| Internet Type | # Households | % Households |
| Dial-Up Internet | 0 | 0.0% |
| Broadband Home | 488 | 69.2% |
| Cellular Data Only | 156 | 22.1% |
| Satellite Internet | 11 | 1.6% |
| No Internet | 59 | 8.4% |
| Total | 705 | 100.0% |
West Buechel Summary
West Buechel is a small city located in Jefferson County, Kentucky. It is a suburb of Louisville and is part of the Louisville Metro area. The population of West Buechel was 2,845 at the 2010 census.
History
West Buechel was founded in 1871 by German immigrants who had settled in the area. The town was named after the Buechel family, who were among the first settlers. The town was originally known as Buechel Station, but the name was changed to West Buechel in 1883.
The town grew rapidly in the late 19th and early 20th centuries, and by the 1920s it had become a thriving community. The town was home to a variety of businesses, including a flour mill, a brickyard, a sawmill, and a furniture factory.
In the 1950s, West Buechel began to decline as the population shifted to the suburbs of Louisville. The town was annexed by Louisville in 1974, and the population has continued to decline since then.
Geography
West Buechel is located in Jefferson County, Kentucky, about 10 miles east of downtown Louisville. The city is situated on the banks of the Ohio River, and is bordered by the cities of Jeffersontown and St. Matthews.
The city has a total area of 1.2 square miles, all of which is land. The terrain is mostly flat, with some rolling hills in the northern part of the city.
Economy
West Buechel is primarily a residential community, and the economy is largely based on service industries. The city is home to a variety of small businesses, including restaurants, retail stores, and professional services.
The city is also home to a number of industrial and manufacturing businesses, including a steel mill, a printing company, and a plastics factory.
Demographics
As of the 2010 census, the population of West Buechel was 2,845. The racial makeup of the city was 79.3% White, 15.2% African American, 0.7% Native American, 0.7% Asian, 0.1% Pacific Islander, and 3.9% from other races. Hispanic or Latino of any race were 4.2% of the population.
The median household income in West Buechel was $37,917, and the median family income was $45,938. The per capita income was $20,945. About 11.3% of families and 14.2% of the population were below the poverty line, including 19.2% of those under age 18 and 8.2% of those age 65 or over.
Common Questions
What is Per Capita Income in West Buechel?
Per Capita income in West Buechel is $22,459.
What is the Median Family Income in West Buechel?
Median Family Income in West Buechel is $49,167.
What is the Median Household income in West Buechel?
Median Household Income in West Buechel is $48,750.
What is Income or Wage Gap in West Buechel?
Income or Wage Gap in West Buechel is 29.6%.
Women in West Buechel earn 70.4 cents for every dollar earned by a man.
What is Family Income Deficit in West Buechel?
Family Income Deficit in West Buechel is $12,523.
Families that are below poverty line in West Buechel earn $12,523 less on average than the poverty threshold level.
What is Inequality or Gini Index in West Buechel?
Inequality or Gini Index in West Buechel is 0.37.
What is the Total Population of West Buechel?
Total Population of West Buechel is 1,936.
What is the Total Male Population of West Buechel?
Total Male Population of West Buechel is 884.
What is the Total Female Population of West Buechel?
Total Female Population of West Buechel is 1,052.
What is the Ratio of Males per 100 Females in West Buechel?
There are 84.03 Males per 100 Females in West Buechel.
What is the Ratio of Females per 100 Males in West Buechel?
There are 119.00 Females per 100 Males in West Buechel.
What is the Median Population Age in West Buechel?
Median Population Age in West Buechel is 29.7 Years.
What is the Average Family Size in West Buechel
Average Family Size in West Buechel is 3.3 People.
What is the Average Household Size in West Buechel
Average Household Size in West Buechel is 2.8 People.
How Large is the Labor Force in West Buechel?
There are 1,114 People in the Labor Forcein in West Buechel.
What is the Percentage of People in the Labor Force in West Buechel?
80.0% of People are in the Labor Force in West Buechel.
What is the Unemployment Rate in West Buechel?
Unemployment Rate in West Buechel is 4.8%.