Lyndon, KY Map & Demographics
Lyndon Map
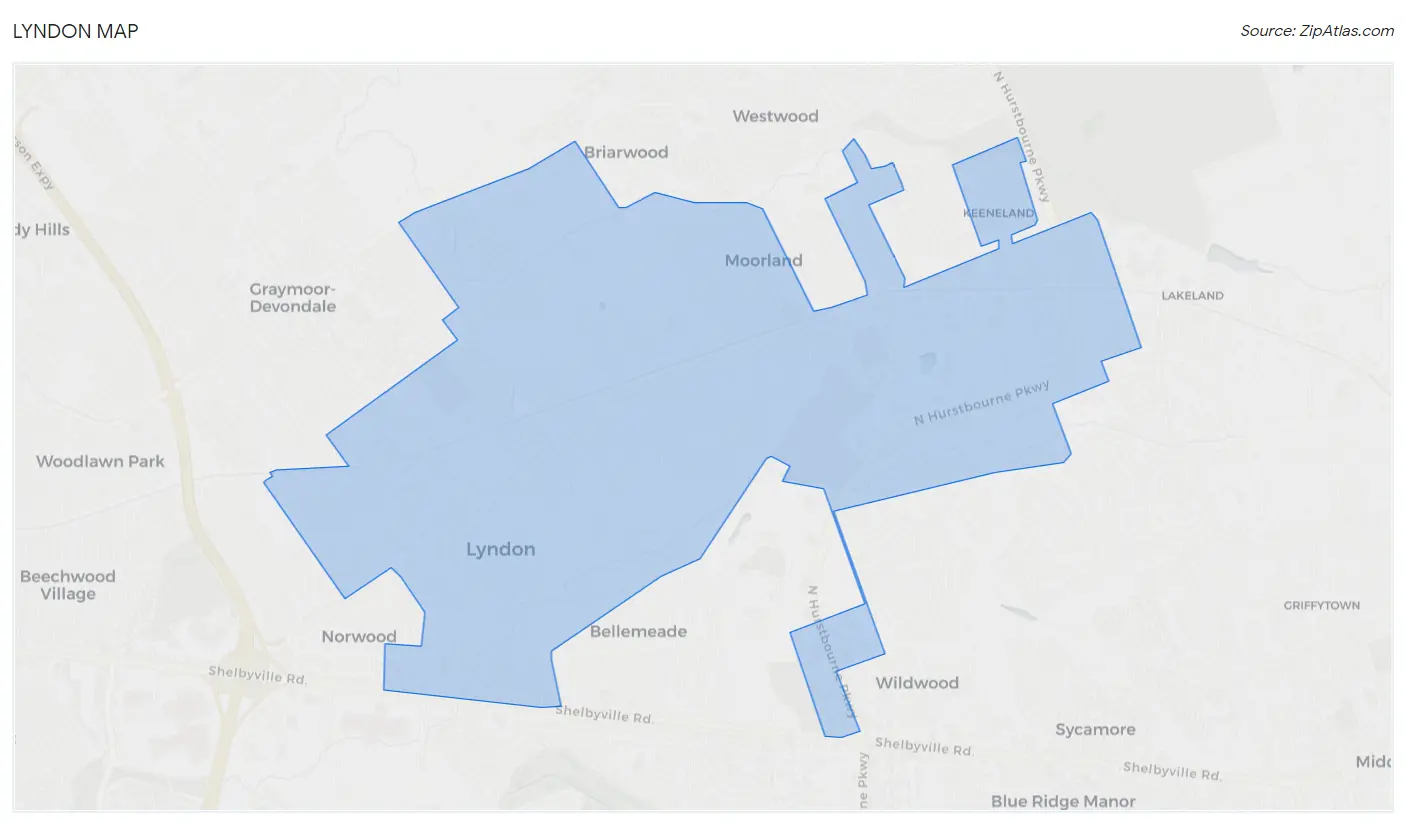
Lyndon Overview
$43,732
PER CAPITA INCOME
$92,411
AVG FAMILY INCOME
$63,806
AVG HOUSEHOLD INCOME
10.2%
WAGE / INCOME GAP [ % ]
89.8¢/ $1
WAGE / INCOME GAP [ $ ]
0.45
INEQUALITY / GINI INDEX
10,997
TOTAL POPULATION
5,063
MALE POPULATION
5,934
FEMALE POPULATION
85.32
MALES / 100 FEMALES
117.20
FEMALES / 100 MALES
36.3
MEDIAN AGE
2.7
AVG FAMILY SIZE
1.9
AVG HOUSEHOLD SIZE
6,754
LABOR FORCE [ PEOPLE ]
71.4%
PERCENT IN LABOR FORCE
4.0%
UNEMPLOYMENT RATE
Lyndon Area Codes
Income in Lyndon
Income Overview in Lyndon
Per Capita Income in Lyndon is $43,732, while median incomes of families and households are $92,411 and $63,806 respectively.
| Characteristic | Number | Measure |
| Per Capita Income | 10,997 | $43,732 |
| Median Family Income | 2,475 | $92,411 |
| Mean Family Income | 2,475 | $110,935 |
| Median Household Income | 5,776 | $63,806 |
| Mean Household Income | 5,776 | $82,263 |
| Income Deficit | 2,475 | $0 |
| Wage / Income Gap (%) | 10,997 | 10.18% |
| Wage / Income Gap ($) | 10,997 | 89.82¢ per $1 |
| Gini / Inequality Index | 10,997 | 0.45 |
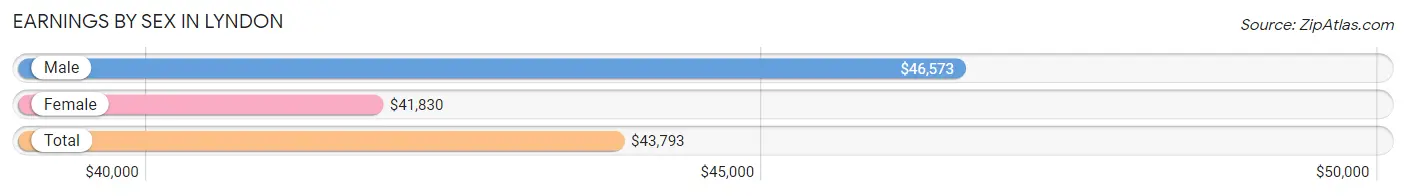
Earnings by Sex in Lyndon
Average Earnings in Lyndon are $43,793, $46,573 for men and $41,830 for women, a difference of 10.2%.
| Sex | Number | Average Earnings |
| Male | 3,422 (49.2%) | $46,573 |
| Female | 3,533 (50.8%) | $41,830 |
| Total | 6,955 (100.0%) | $43,793 |
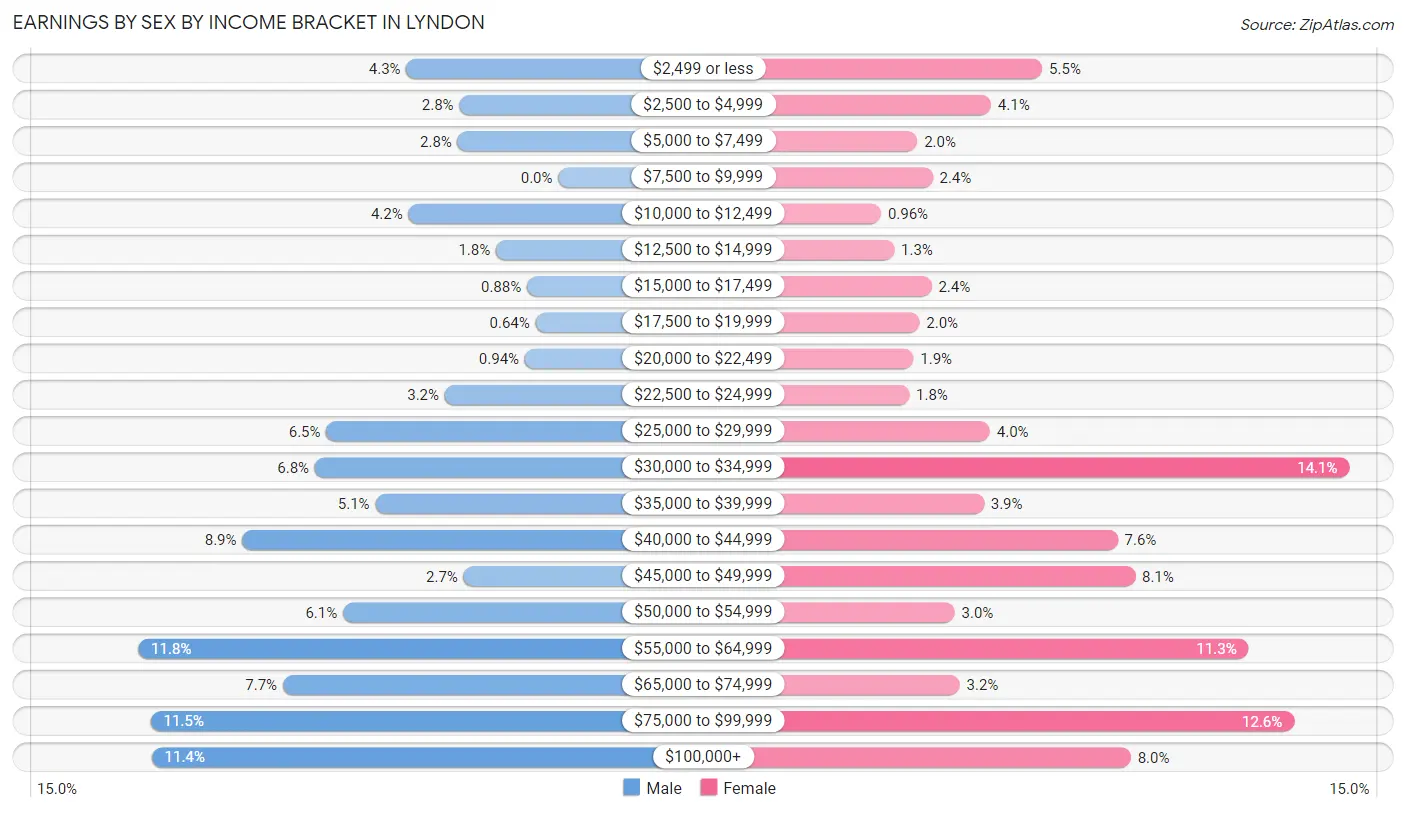
Earnings by Sex by Income Bracket in Lyndon
The most common earnings brackets in Lyndon are $55,000 to $64,999 for men (404 | 11.8%) and $30,000 to $34,999 for women (499 | 14.1%).
| Income | Male | Female |
| $2,499 or less | 146 (4.3%) | 194 (5.5%) |
| $2,500 to $4,999 | 95 (2.8%) | 143 (4.1%) |
| $5,000 to $7,499 | 97 (2.8%) | 70 (2.0%) |
| $7,500 to $9,999 | 0 (0.0%) | 85 (2.4%) |
| $10,000 to $12,499 | 144 (4.2%) | 34 (1.0%) |
| $12,500 to $14,999 | 60 (1.8%) | 47 (1.3%) |
| $15,000 to $17,499 | 30 (0.9%) | 84 (2.4%) |
| $17,500 to $19,999 | 22 (0.6%) | 72 (2.0%) |
| $20,000 to $22,499 | 32 (0.9%) | 66 (1.9%) |
| $22,500 to $24,999 | 109 (3.2%) | 62 (1.8%) |
| $25,000 to $29,999 | 223 (6.5%) | 142 (4.0%) |
| $30,000 to $34,999 | 234 (6.8%) | 499 (14.1%) |
| $35,000 to $39,999 | 176 (5.1%) | 136 (3.8%) |
| $40,000 to $44,999 | 304 (8.9%) | 269 (7.6%) |
| $45,000 to $49,999 | 91 (2.7%) | 286 (8.1%) |
| $50,000 to $54,999 | 207 (6.0%) | 107 (3.0%) |
| $55,000 to $64,999 | 404 (11.8%) | 399 (11.3%) |
| $65,000 to $74,999 | 265 (7.7%) | 112 (3.2%) |
| $75,000 to $99,999 | 392 (11.5%) | 444 (12.6%) |
| $100,000+ | 391 (11.4%) | 282 (8.0%) |
| Total | 3,422 (100.0%) | 3,533 (100.0%) |
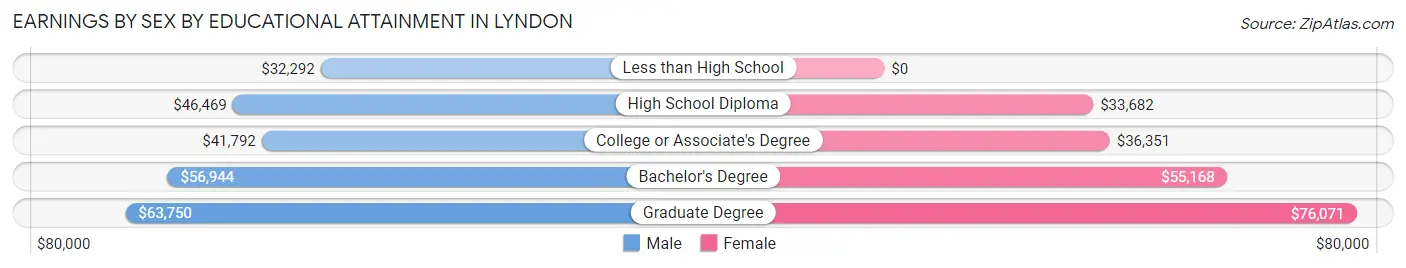
Earnings by Sex by Educational Attainment in Lyndon
Average earnings in Lyndon are $51,991 for men and $47,305 for women, a difference of 9.0%. Men with an educational attainment of graduate degree enjoy the highest average annual earnings of $63,750, while those with less than high school education earn the least with $32,292. Women with an educational attainment of graduate degree earn the most with the average annual earnings of $76,071, while those with high school diploma education have the smallest earnings of $33,682.
| Educational Attainment | Male Income | Female Income |
| Less than High School | $32,292 | $0 |
| High School Diploma | $46,469 | $33,682 |
| College or Associate's Degree | $41,792 | $36,351 |
| Bachelor's Degree | $56,944 | $55,168 |
| Graduate Degree | $63,750 | $76,071 |
| Total | $51,991 | $47,305 |
Family Income in Lyndon
Family Income Brackets in Lyndon
According to the Lyndon family income data, there are 676 families falling into the $100,000 to $149,999 income range, which is the most common income bracket and makes up 27.3% of all families.
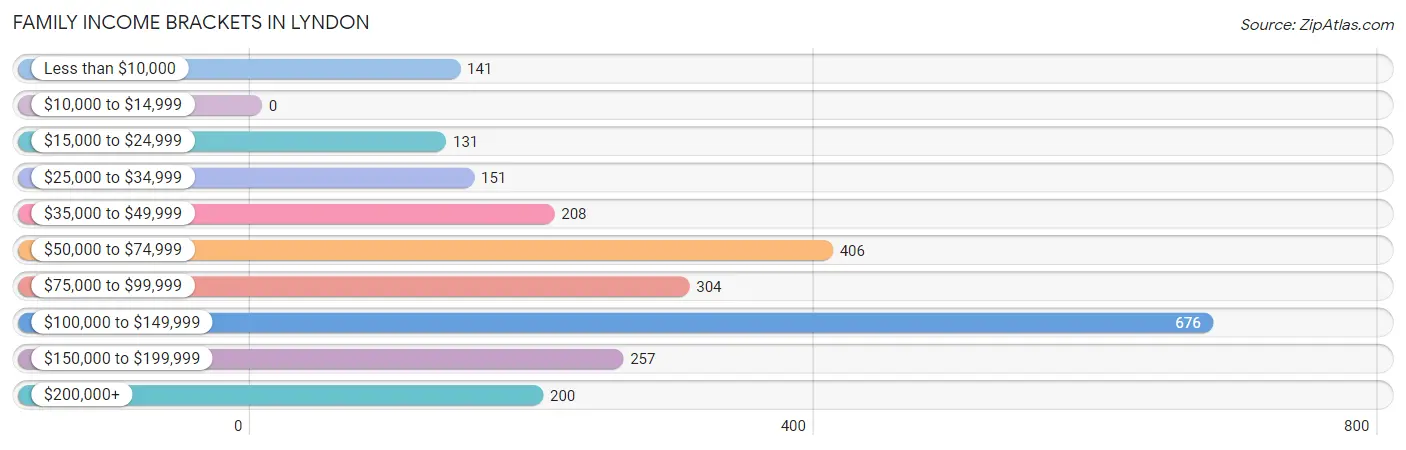
| Income Bracket | # Families | % Families |
| Less than $10,000 | 141 | 5.7% |
| $10,000 to $14,999 | 0 | 0.0% |
| $15,000 to $24,999 | 131 | 5.3% |
| $25,000 to $34,999 | 151 | 6.1% |
| $35,000 to $49,999 | 208 | 8.4% |
| $50,000 to $74,999 | 406 | 16.4% |
| $75,000 to $99,999 | 304 | 12.3% |
| $100,000 to $149,999 | 676 | 27.3% |
| $150,000 to $199,999 | 257 | 10.4% |
| $200,000+ | 200 | 8.1% |
Family Income by Famaliy Size in Lyndon
4-person families (201 | 8.1%) account for the highest median family income in Lyndon with $108,607 per family, while 2-person families (1,590 | 64.2%) have the highest median income of $38,375 per family member.
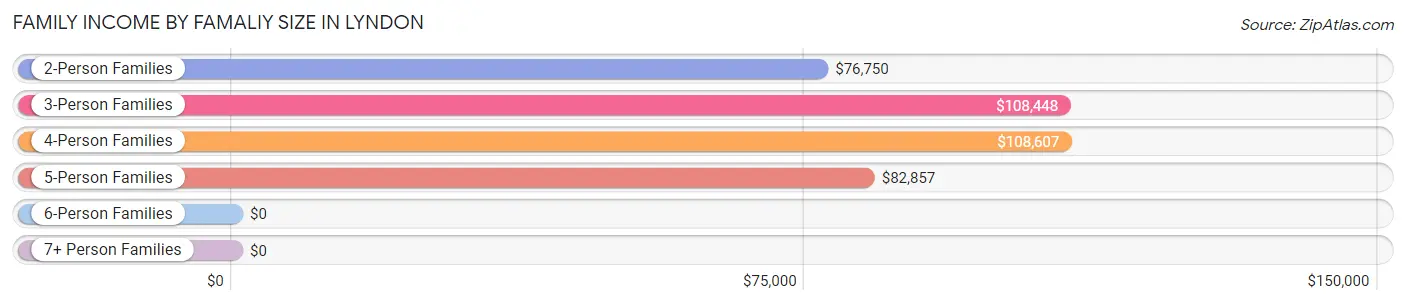
| Income Bracket | # Families | Median Income |
| 2-Person Families | 1,590 (64.2%) | $76,750 |
| 3-Person Families | 508 (20.5%) | $108,448 |
| 4-Person Families | 201 (8.1%) | $108,607 |
| 5-Person Families | 156 (6.3%) | $82,857 |
| 6-Person Families | 18 (0.7%) | $0 |
| 7+ Person Families | 2 (0.1%) | $0 |
| Total | 2,475 (100.0%) | $92,411 |
Family Income by Number of Earners in Lyndon
The median family income in Lyndon is $92,411, with families comprising 3+ earners (172) having the highest median family income of $148,026, while families with 1 earner (767) have the lowest median family income of $58,233, accounting for 7.0% and 31.0% of families, respectively.
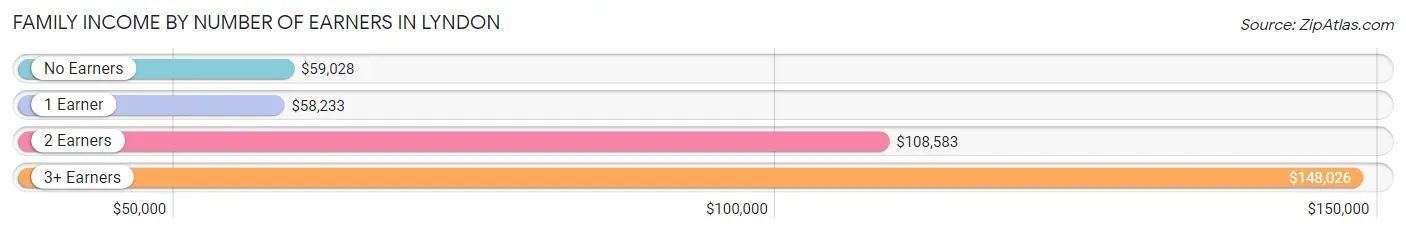
| Number of Earners | # Families | Median Income |
| No Earners | 343 (13.9%) | $59,028 |
| 1 Earner | 767 (31.0%) | $58,233 |
| 2 Earners | 1,193 (48.2%) | $108,583 |
| 3+ Earners | 172 (7.0%) | $148,026 |
| Total | 2,475 (100.0%) | $92,411 |
Household Income in Lyndon
Household Income Brackets in Lyndon
With 1,305 households falling in the category, the $50,000 to $74,999 income range is the most frequent in Lyndon, accounting for 22.6% of all households. In contrast, only 46 households (0.8%) fall into the $10,000 to $14,999 income bracket, making it the least populous group.
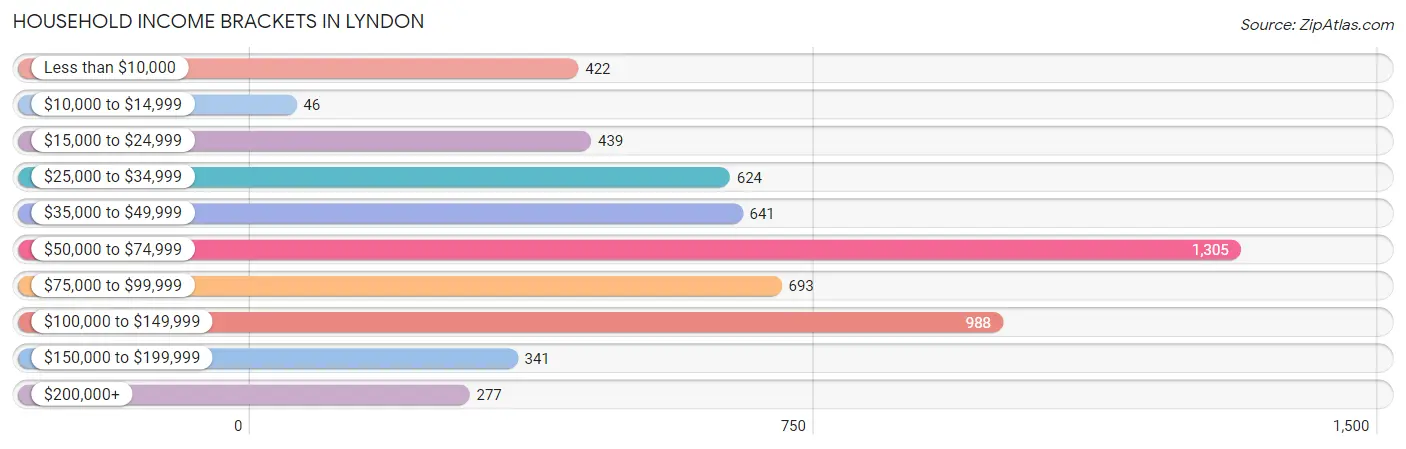
| Income Bracket | # Households | % Households |
| Less than $10,000 | 422 | 7.3% |
| $10,000 to $14,999 | 46 | 0.8% |
| $15,000 to $24,999 | 439 | 7.6% |
| $25,000 to $34,999 | 624 | 10.8% |
| $35,000 to $49,999 | 641 | 11.1% |
| $50,000 to $74,999 | 1,305 | 22.6% |
| $75,000 to $99,999 | 693 | 12.0% |
| $100,000 to $149,999 | 988 | 17.1% |
| $150,000 to $199,999 | 341 | 5.9% |
| $200,000+ | 277 | 4.8% |
Household Income by Householder Age in Lyndon
The median household income in Lyndon is $63,806, with the highest median household income of $73,266 found in the 25 to 44 years age bracket for the primary householder. A total of 2,305 households (39.9%) fall into this category. Meanwhile, the 15 to 24 years age bracket for the primary householder has the lowest median household income of $45,478, with 371 households (6.4%) in this group.
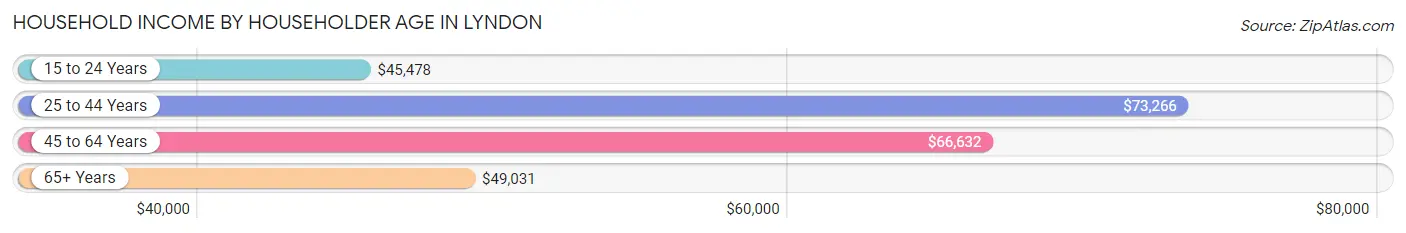
| Income Bracket | # Households | Median Income |
| 15 to 24 Years | 371 (6.4%) | $45,478 |
| 25 to 44 Years | 2,305 (39.9%) | $73,266 |
| 45 to 64 Years | 1,548 (26.8%) | $66,632 |
| 65+ Years | 1,552 (26.9%) | $49,031 |
| Total | 5,776 (100.0%) | $63,806 |
Poverty in Lyndon
Income Below Poverty by Sex and Age in Lyndon
With 8.5% poverty level for males and 10.6% for females among the residents of Lyndon, under 5 year old males and under 5 year old females are the most vulnerable to poverty, with 84 males (44.0%) and 132 females (30.0%) in their respective age groups living below the poverty level.
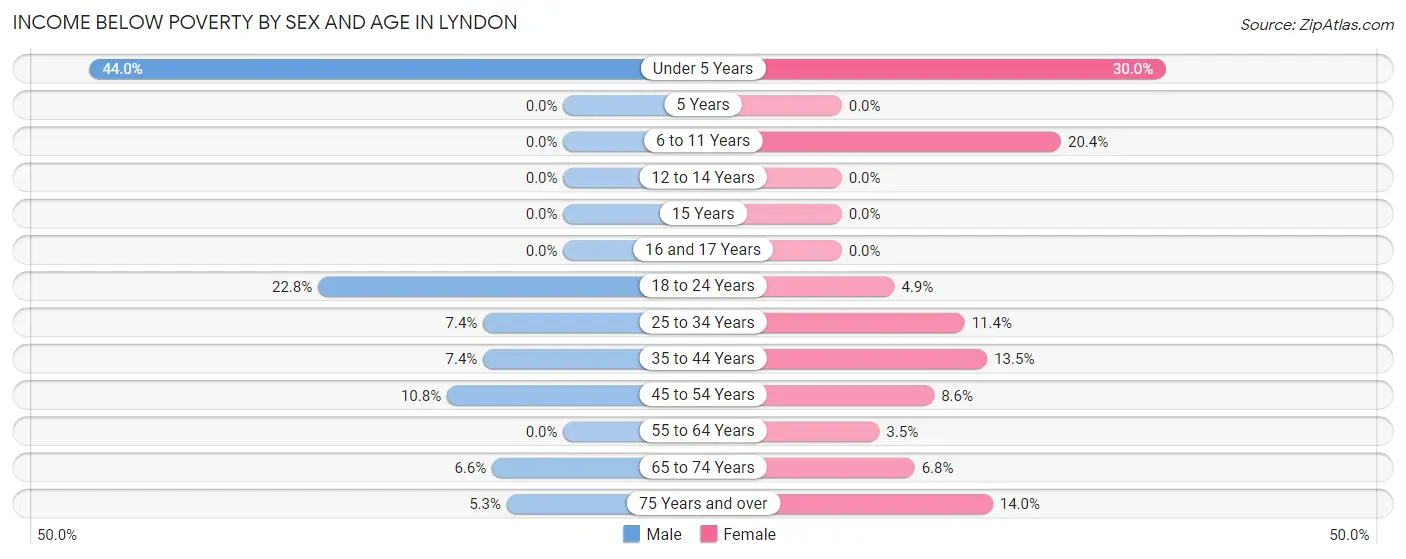
| Age Bracket | Male | Female |
| Under 5 Years | 84 (44.0%) | 132 (30.0%) |
| 5 Years | 0 (0.0%) | 0 (0.0%) |
| 6 to 11 Years | 0 (0.0%) | 46 (20.3%) |
| 12 to 14 Years | 0 (0.0%) | 0 (0.0%) |
| 15 Years | 0 (0.0%) | 0 (0.0%) |
| 16 and 17 Years | 0 (0.0%) | 0 (0.0%) |
| 18 to 24 Years | 92 (22.8%) | 22 (4.9%) |
| 25 to 34 Years | 106 (7.4%) | 139 (11.4%) |
| 35 to 44 Years | 38 (7.4%) | 83 (13.5%) |
| 45 to 54 Years | 61 (10.8%) | 44 (8.6%) |
| 55 to 64 Years | 0 (0.0%) | 30 (3.5%) |
| 65 to 74 Years | 26 (6.6%) | 46 (6.8%) |
| 75 Years and over | 18 (5.2%) | 88 (14.0%) |
| Total | 425 (8.5%) | 630 (10.6%) |
Income Above Poverty by Sex and Age in Lyndon
According to the poverty statistics in Lyndon, males aged 5 years and females aged 5 years are the age groups that are most secure financially, with 100.0% of males and 100.0% of females in these age groups living above the poverty line.
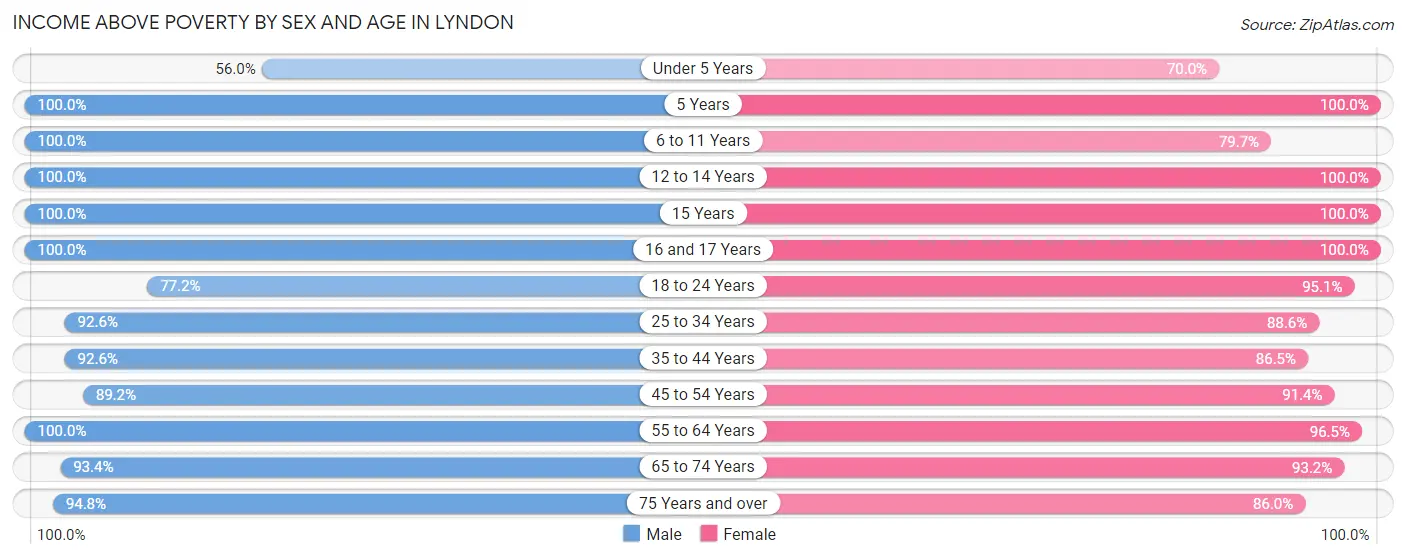
| Age Bracket | Male | Female |
| Under 5 Years | 107 (56.0%) | 308 (70.0%) |
| 5 Years | 57 (100.0%) | 65 (100.0%) |
| 6 to 11 Years | 204 (100.0%) | 180 (79.6%) |
| 12 to 14 Years | 150 (100.0%) | 23 (100.0%) |
| 15 Years | 100 (100.0%) | 62 (100.0%) |
| 16 and 17 Years | 70 (100.0%) | 153 (100.0%) |
| 18 to 24 Years | 312 (77.2%) | 428 (95.1%) |
| 25 to 34 Years | 1,318 (92.6%) | 1,079 (88.6%) |
| 35 to 44 Years | 473 (92.6%) | 532 (86.5%) |
| 45 to 54 Years | 504 (89.2%) | 469 (91.4%) |
| 55 to 64 Years | 620 (100.0%) | 829 (96.5%) |
| 65 to 74 Years | 367 (93.4%) | 633 (93.2%) |
| 75 Years and over | 325 (94.8%) | 540 (86.0%) |
| Total | 4,607 (91.5%) | 5,301 (89.4%) |
Income Below Poverty Among Married-Couple Families in Lyndon
The poverty statistics for married-couple families in Lyndon show that 3.8% or 58 of the total 1,544 families live below the poverty line. Families with 1 or 2 children have the highest poverty rate of 11.1%, comprising of 42 families. On the other hand, families with 3 or 4 children have the lowest poverty rate of 0.0%, which includes 0 families.
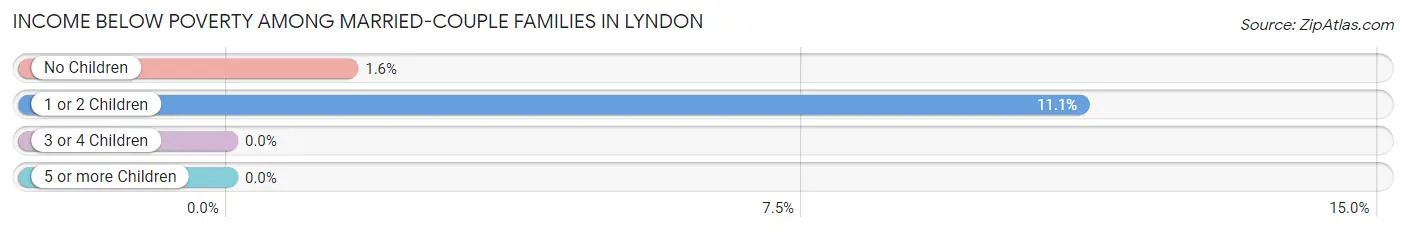
| Children | Above Poverty | Below Poverty |
| No Children | 1,000 (98.4%) | 16 (1.6%) |
| 1 or 2 Children | 336 (88.9%) | 42 (11.1%) |
| 3 or 4 Children | 148 (100.0%) | 0 (0.0%) |
| 5 or more Children | 2 (100.0%) | 0 (0.0%) |
| Total | 1,486 (96.2%) | 58 (3.8%) |
Income Below Poverty Among Single-Parent Households in Lyndon
According to the poverty data in Lyndon, 3.8% or 11 single-father households and 19.6% or 125 single-mother households are living below the poverty line. Among single-father households, those with no children have the highest poverty rate, with 11 households (4.4%) experiencing poverty. Likewise, among single-mother households, those with 3 or 4 children have the highest poverty rate, with 43 households (100.0%) falling below the poverty line.
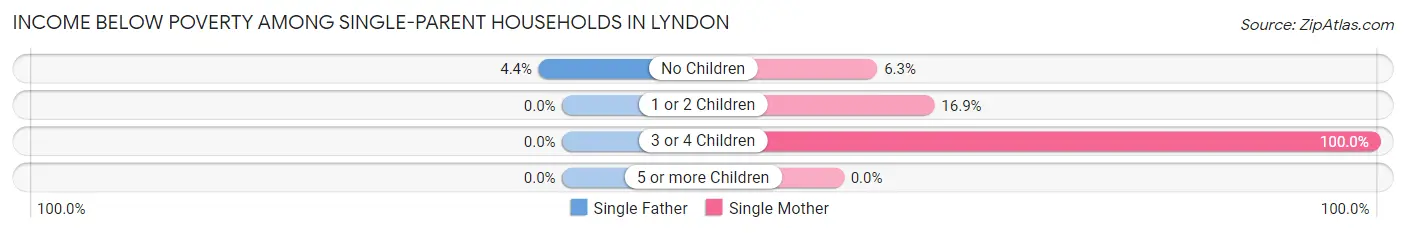
| Children | Single Father | Single Mother |
| No Children | 11 (4.4%) | 11 (6.2%) |
| 1 or 2 Children | 0 (0.0%) | 71 (16.9%) |
| 3 or 4 Children | 0 (0.0%) | 43 (100.0%) |
| 5 or more Children | 0 (0.0%) | 0 (0.0%) |
| Total | 11 (3.8%) | 125 (19.6%) |
Income Below Poverty Among Married-Couple vs Single-Parent Households in Lyndon
The poverty data for Lyndon shows that 58 of the married-couple family households (3.8%) and 136 of the single-parent households (14.6%) are living below the poverty level. Within the married-couple family households, those with 1 or 2 children have the highest poverty rate, with 42 households (11.1%) falling below the poverty line. Among the single-parent households, those with 3 or 4 children have the highest poverty rate, with 43 household (100.0%) living below poverty.
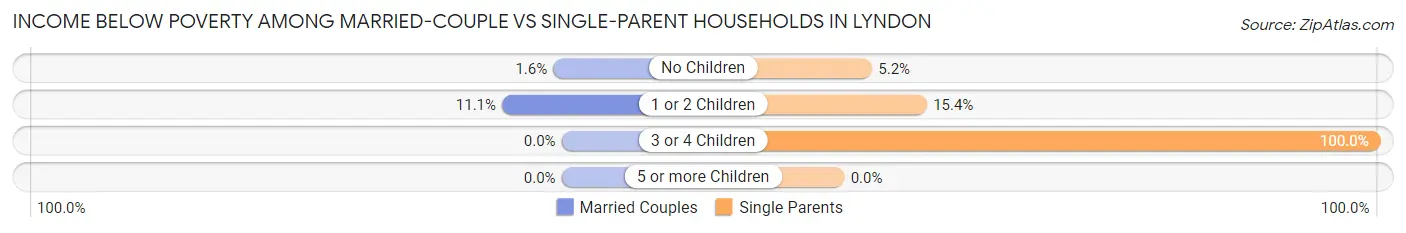
| Children | Married-Couple Families | Single-Parent Households |
| No Children | 16 (1.6%) | 22 (5.2%) |
| 1 or 2 Children | 42 (11.1%) | 71 (15.4%) |
| 3 or 4 Children | 0 (0.0%) | 43 (100.0%) |
| 5 or more Children | 0 (0.0%) | 0 (0.0%) |
| Total | 58 (3.8%) | 136 (14.6%) |
Race in Lyndon
The most populous races in Lyndon are White / Caucasian (7,999 | 72.7%), Black / African American (2,089 | 19.0%), and Two or more Races (612 | 5.6%).
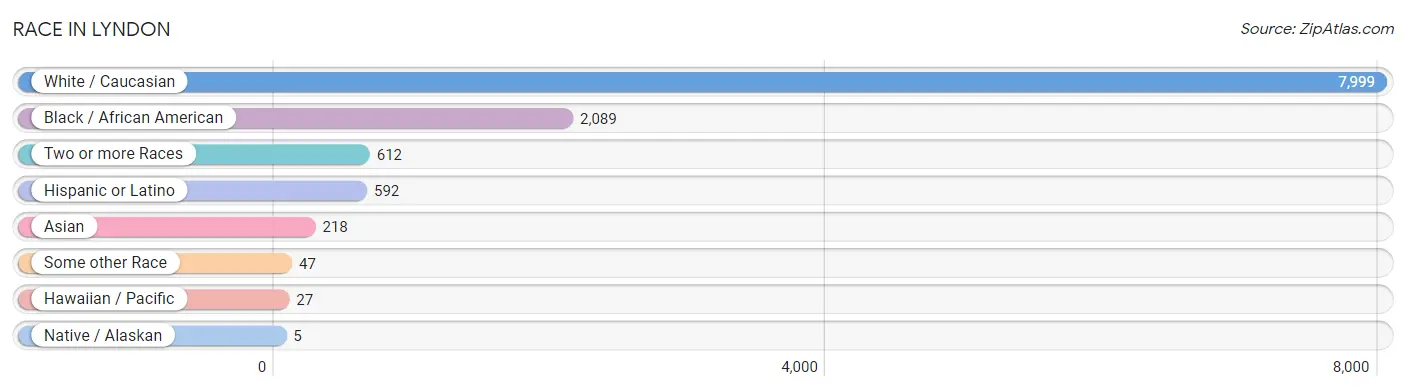
| Race | # Population | % Population |
| Asian | 218 | 2.0% |
| Black / African American | 2,089 | 19.0% |
| Hawaiian / Pacific | 27 | 0.3% |
| Hispanic or Latino | 592 | 5.4% |
| Native / Alaskan | 5 | 0.1% |
| White / Caucasian | 7,999 | 72.7% |
| Two or more Races | 612 | 5.6% |
| Some other Race | 47 | 0.4% |
| Total | 10,997 | 100.0% |
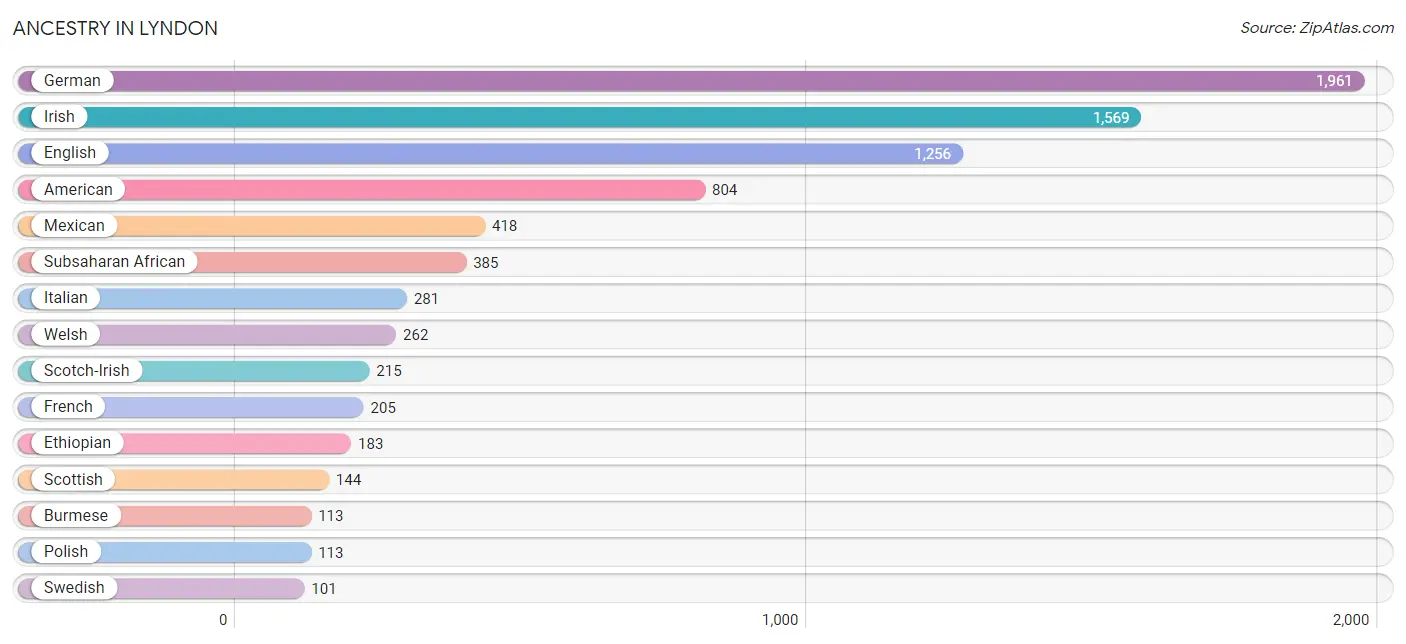
Ancestry in Lyndon
The most populous ancestries reported in Lyndon are German (1,961 | 17.8%), Irish (1,569 | 14.3%), English (1,256 | 11.4%), American (804 | 7.3%), and Mexican (418 | 3.8%), together accounting for 54.6% of all Lyndon residents.
| Ancestry | # Population | % Population |
| African | 10 | 0.1% |
| American | 804 | 7.3% |
| Arab | 18 | 0.2% |
| Austrian | 42 | 0.4% |
| Bhutanese | 42 | 0.4% |
| Brazilian | 32 | 0.3% |
| British | 65 | 0.6% |
| Burmese | 113 | 1.0% |
| Central American | 68 | 0.6% |
| Cherokee | 37 | 0.3% |
| Choctaw | 9 | 0.1% |
| Croatian | 10 | 0.1% |
| Cuban | 24 | 0.2% |
| Czech | 9 | 0.1% |
| Danish | 19 | 0.2% |
| Dominican | 33 | 0.3% |
| Dutch | 76 | 0.7% |
| Eastern European | 42 | 0.4% |
| English | 1,256 | 11.4% |
| Ethiopian | 183 | 1.7% |
| European | 94 | 0.9% |
| French | 205 | 1.9% |
| French Canadian | 59 | 0.5% |
| German | 1,961 | 17.8% |
| Hmong | 90 | 0.8% |
| Hungarian | 54 | 0.5% |
| Indian (Asian) | 32 | 0.3% |
| Indonesian | 13 | 0.1% |
| Iranian | 27 | 0.3% |
| Irish | 1,569 | 14.3% |
| Italian | 281 | 2.6% |
| Jamaican | 88 | 0.8% |
| Korean | 51 | 0.5% |
| Liberian | 43 | 0.4% |
| Mexican | 418 | 3.8% |
| Mexican American Indian | 5 | 0.1% |
| Nicaraguan | 8 | 0.1% |
| Northern European | 49 | 0.4% |
| Norwegian | 66 | 0.6% |
| Panamanian | 8 | 0.1% |
| Peruvian | 6 | 0.1% |
| Polish | 113 | 1.0% |
| Portuguese | 1 | 0.0% |
| Russian | 33 | 0.3% |
| Salvadoran | 52 | 0.5% |
| Samoan | 27 | 0.3% |
| Scandinavian | 27 | 0.3% |
| Scotch-Irish | 215 | 2.0% |
| Scottish | 144 | 1.3% |
| Sioux | 5 | 0.1% |
| Slovene | 21 | 0.2% |
| Somali | 27 | 0.3% |
| South American | 6 | 0.1% |
| Spaniard | 25 | 0.2% |
| Sri Lankan | 84 | 0.8% |
| Subsaharan African | 385 | 3.5% |
| Swedish | 101 | 0.9% |
| Swiss | 23 | 0.2% |
| Syrian | 18 | 0.2% |
| Thai | 10 | 0.1% |
| Ukrainian | 51 | 0.5% |
| Welsh | 262 | 2.4% | View All 62 Rows |
Immigrants in Lyndon
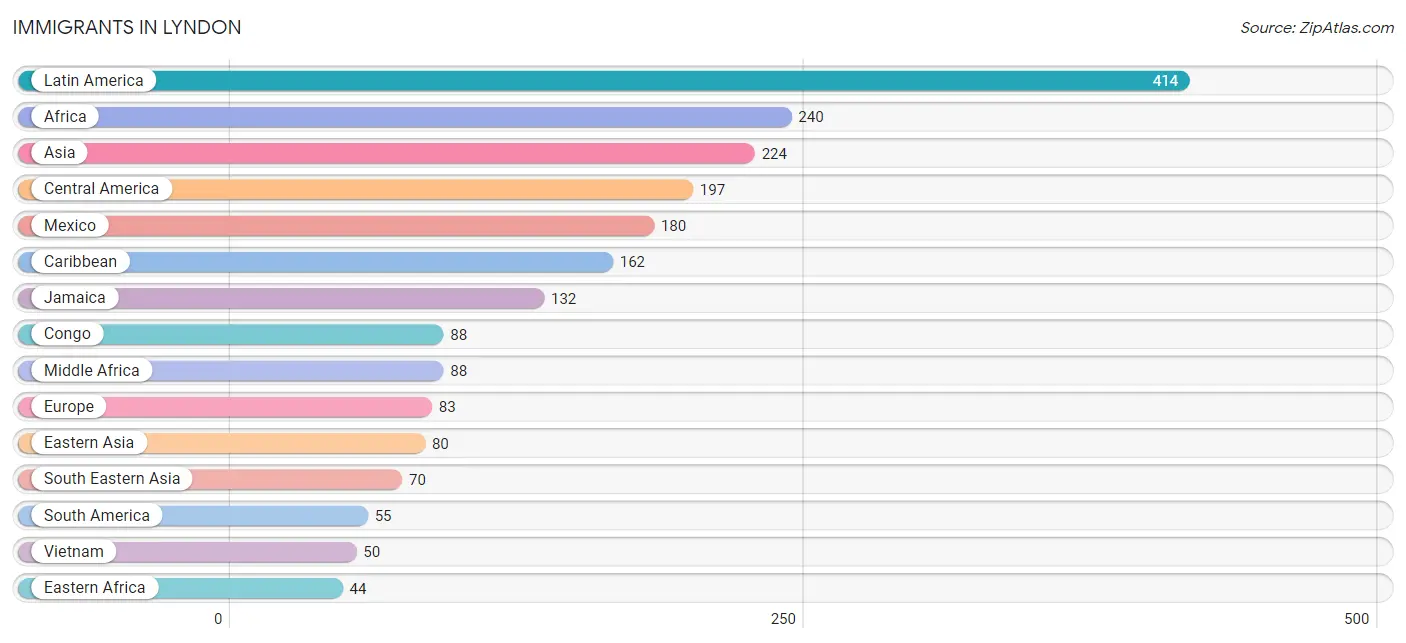
The most numerous immigrant groups reported in Lyndon came from Latin America (414 | 3.8%), Africa (240 | 2.2%), Asia (224 | 2.0%), Central America (197 | 1.8%), and Mexico (180 | 1.6%), together accounting for 11.4% of all Lyndon residents.
| Immigration Origin | # Population | % Population |
| Africa | 240 | 2.2% |
| Asia | 224 | 2.0% |
| Brazil | 32 | 0.3% |
| Caribbean | 162 | 1.5% |
| Central America | 197 | 1.8% |
| China | 32 | 0.3% |
| Congo | 88 | 0.8% |
| Cuba | 24 | 0.2% |
| Dominican Republic | 6 | 0.1% |
| Eastern Africa | 44 | 0.4% |
| Eastern Asia | 80 | 0.7% |
| El Salvador | 9 | 0.1% |
| Ethiopia | 44 | 0.4% |
| Europe | 83 | 0.7% |
| Germany | 41 | 0.4% |
| Iran | 27 | 0.3% |
| Jamaica | 132 | 1.2% |
| Japan | 8 | 0.1% |
| Jordan | 3 | 0.0% |
| Korea | 40 | 0.4% |
| Latin America | 414 | 3.8% |
| Liberia | 19 | 0.2% |
| Mexico | 180 | 1.6% |
| Middle Africa | 88 | 0.8% |
| Nepal | 15 | 0.1% |
| Northern Europe | 32 | 0.3% |
| Panama | 8 | 0.1% |
| Peru | 6 | 0.1% |
| Philippines | 7 | 0.1% |
| South America | 55 | 0.5% |
| South Central Asia | 42 | 0.4% |
| South Eastern Asia | 70 | 0.6% |
| Southern Europe | 10 | 0.1% |
| Spain | 10 | 0.1% |
| Syria | 29 | 0.3% |
| Venezuela | 17 | 0.2% |
| Vietnam | 50 | 0.4% |
| Western Africa | 19 | 0.2% |
| Western Asia | 32 | 0.3% |
| Western Europe | 41 | 0.4% | View All 40 Rows |
Sex and Age in Lyndon
Sex and Age in Lyndon
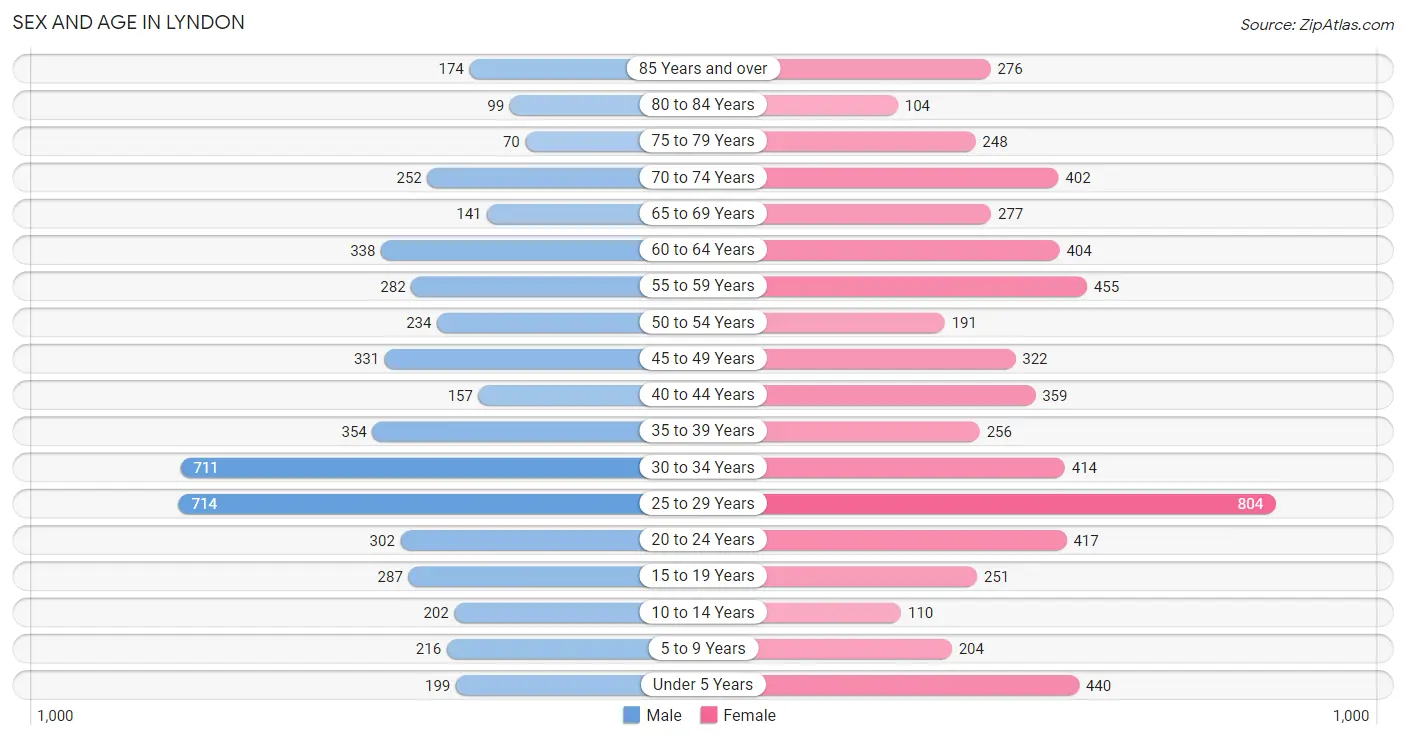
The most populous age groups in Lyndon are 25 to 29 Years (714 | 14.1%) for men and 25 to 29 Years (804 | 13.6%) for women.
| Age Bracket | Male | Female |
| Under 5 Years | 199 (3.9%) | 440 (7.4%) |
| 5 to 9 Years | 216 (4.3%) | 204 (3.4%) |
| 10 to 14 Years | 202 (4.0%) | 110 (1.8%) |
| 15 to 19 Years | 287 (5.7%) | 251 (4.2%) |
| 20 to 24 Years | 302 (6.0%) | 417 (7.0%) |
| 25 to 29 Years | 714 (14.1%) | 804 (13.6%) |
| 30 to 34 Years | 711 (14.0%) | 414 (7.0%) |
| 35 to 39 Years | 354 (7.0%) | 256 (4.3%) |
| 40 to 44 Years | 157 (3.1%) | 359 (6.0%) |
| 45 to 49 Years | 331 (6.5%) | 322 (5.4%) |
| 50 to 54 Years | 234 (4.6%) | 191 (3.2%) |
| 55 to 59 Years | 282 (5.6%) | 455 (7.7%) |
| 60 to 64 Years | 338 (6.7%) | 404 (6.8%) |
| 65 to 69 Years | 141 (2.8%) | 277 (4.7%) |
| 70 to 74 Years | 252 (5.0%) | 402 (6.8%) |
| 75 to 79 Years | 70 (1.4%) | 248 (4.2%) |
| 80 to 84 Years | 99 (2.0%) | 104 (1.8%) |
| 85 Years and over | 174 (3.4%) | 276 (4.6%) |
| Total | 5,063 (100.0%) | 5,934 (100.0%) |
Families and Households in Lyndon
Median Family Size in Lyndon
The median family size in Lyndon is 2.72 persons per family, with married-couple families (1,544 | 62.4%) accounting for the largest median family size of 2.79 persons per family. On the other hand, single male/father families (292 | 11.8%) represent the smallest median family size with 2.41 persons per family.

| Family Type | # Families | Family Size |
| Married-Couple | 1,544 (62.4%) | 2.79 |
| Single Male/Father | 292 (11.8%) | 2.41 |
| Single Female/Mother | 639 (25.8%) | 2.70 |
| Total Families | 2,475 (100.0%) | 2.72 |
Median Household Size in Lyndon
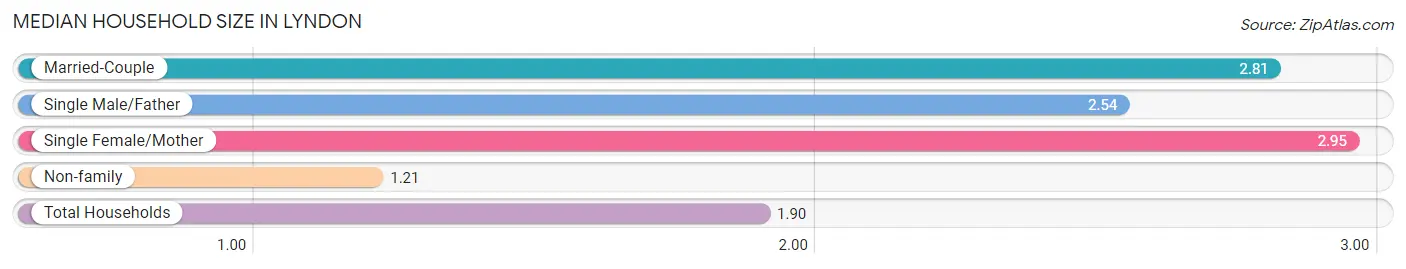
The median household size in Lyndon is 1.90 persons per household, with single female/mother households (639 | 11.1%) accounting for the largest median household size of 2.95 persons per household. non-family households (3,301 | 57.2%) represent the smallest median household size with 1.21 persons per household.
| Household Type | # Households | Household Size |
| Married-Couple | 1,544 (26.7%) | 2.81 |
| Single Male/Father | 292 (5.1%) | 2.54 |
| Single Female/Mother | 639 (11.1%) | 2.95 |
| Non-family | 3,301 (57.2%) | 1.21 |
| Total Households | 5,776 (100.0%) | 1.90 |
Household Size by Marriage Status in Lyndon
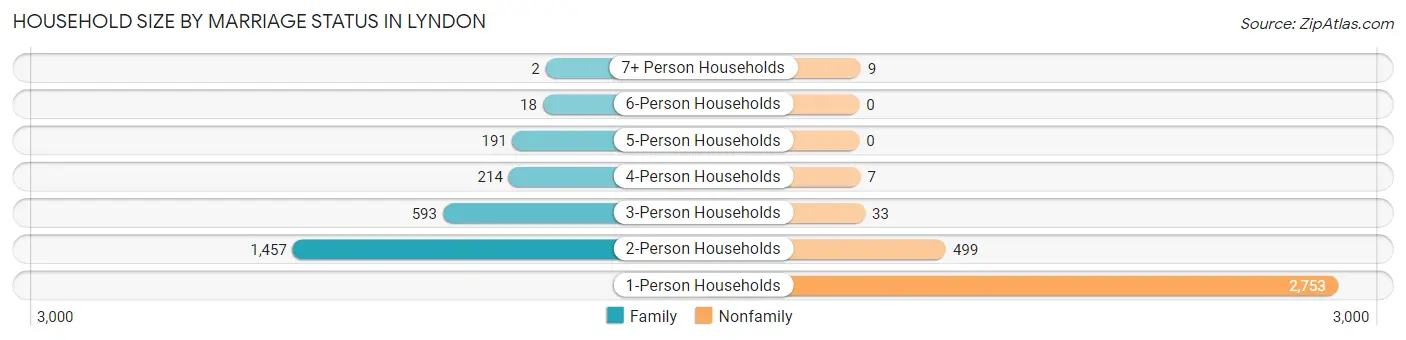
Out of a total of 5,776 households in Lyndon, 2,475 (42.8%) are family households, while 3,301 (57.2%) are nonfamily households. The most numerous type of family households are 2-person households, comprising 1,457, and the most common type of nonfamily households are 1-person households, comprising 2,753.
| Household Size | Family Households | Nonfamily Households |
| 1-Person Households | - | 2,753 (47.7%) |
| 2-Person Households | 1,457 (25.2%) | 499 (8.6%) |
| 3-Person Households | 593 (10.3%) | 33 (0.6%) |
| 4-Person Households | 214 (3.7%) | 7 (0.1%) |
| 5-Person Households | 191 (3.3%) | 0 (0.0%) |
| 6-Person Households | 18 (0.3%) | 0 (0.0%) |
| 7+ Person Households | 2 (0.0%) | 9 (0.2%) |
| Total | 2,475 (42.8%) | 3,301 (57.2%) |
Female Fertility in Lyndon
Fertility by Age in Lyndon
Average fertility rate in Lyndon is 50.0 births per 1,000 women. Women in the age bracket of 20 to 34 years have the highest fertility rate with 80.0 births per 1,000 women. Women in the age bracket of 20 to 34 years acount for 91.6% of all women with births.
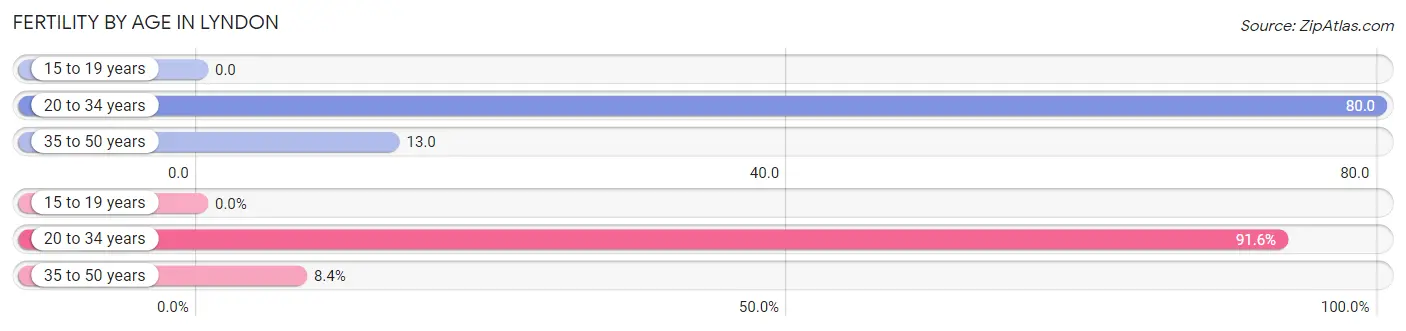
| Age Bracket | Women with Births | Births / 1,000 Women |
| 15 to 19 years | 0 (0.0%) | 0.0 |
| 20 to 34 years | 131 (91.6%) | 80.0 |
| 35 to 50 years | 12 (8.4%) | 13.0 |
| Total | 143 (100.0%) | 50.0 |
Fertility by Age by Marriage Status in Lyndon
79.0% of women with births (143) in Lyndon are married. The highest percentage of unmarried women with births falls into 20 to 34 years age bracket with 22.9% of them unmarried at the time of birth, while the lowest percentage of unmarried women with births belong to 35 to 50 years age bracket with 0.0% of them unmarried.
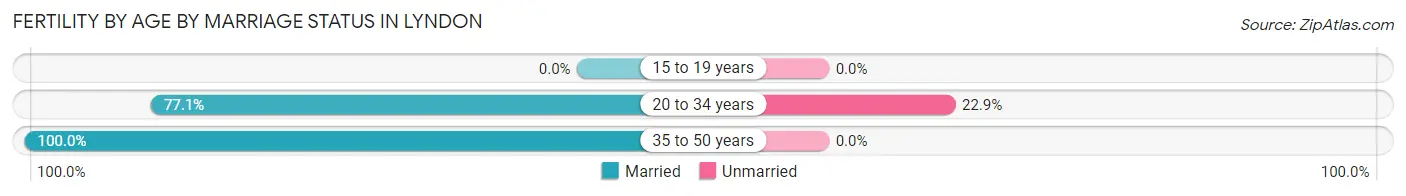
| Age Bracket | Married | Unmarried |
| 15 to 19 years | 0 (0.0%) | 0 (0.0%) |
| 20 to 34 years | 101 (77.1%) | 30 (22.9%) |
| 35 to 50 years | 12 (100.0%) | 0 (0.0%) |
| Total | 113 (79.0%) | 30 (21.0%) |
Fertility by Education in Lyndon
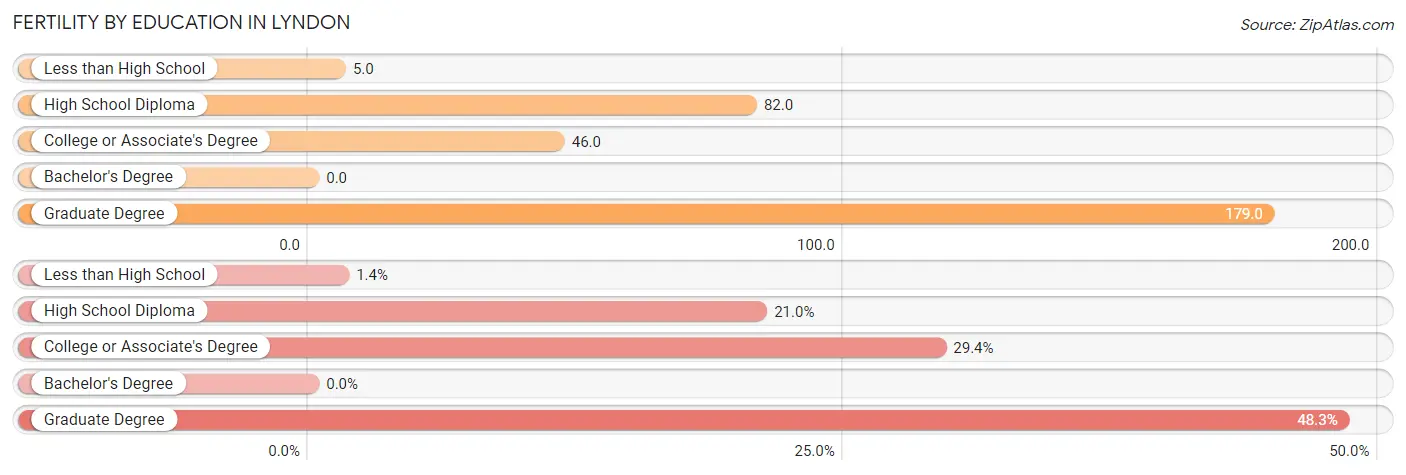
| Educational Attainment | Women with Births | Births / 1,000 Women |
| Less than High School | 2 (1.4%) | 5.0 |
| High School Diploma | 30 (21.0%) | 82.0 |
| College or Associate's Degree | 42 (29.4%) | 46.0 |
| Bachelor's Degree | 0 (0.0%) | 0.0 |
| Graduate Degree | 69 (48.2%) | 179.0 |
| Total | 143 (100.0%) | 50.0 |
Fertility by Education by Marriage Status in Lyndon
21.0% of women with births in Lyndon are unmarried. Women with the educational attainment of less than high school are most likely to be married with 100.0% of them married at childbirth, while women with the educational attainment of high school diploma are least likely to be married with 100.0% of them unmarried at childbirth.
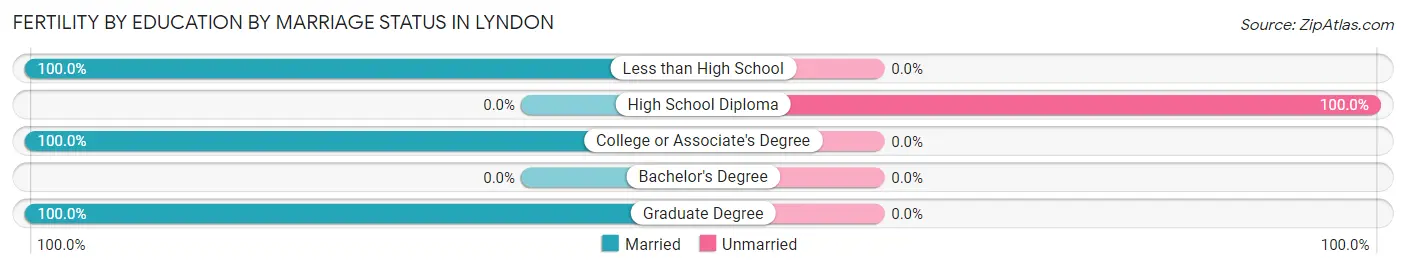
| Educational Attainment | Married | Unmarried |
| Less than High School | 2 (100.0%) | 0 (0.0%) |
| High School Diploma | 0 (0.0%) | 30 (100.0%) |
| College or Associate's Degree | 42 (100.0%) | 0 (0.0%) |
| Bachelor's Degree | 0 (0.0%) | 0 (0.0%) |
| Graduate Degree | 69 (100.0%) | 0 (0.0%) |
| Total | 113 (79.0%) | 30 (21.0%) |
Employment Characteristics in Lyndon
Employment by Class of Employer in Lyndon
Among the 6,414 employed individuals in Lyndon, private company employees (4,366 | 68.1%), not-for-profit organizations (690 | 10.8%), and local government employees (384 | 6.0%) make up the most common classes of employment.
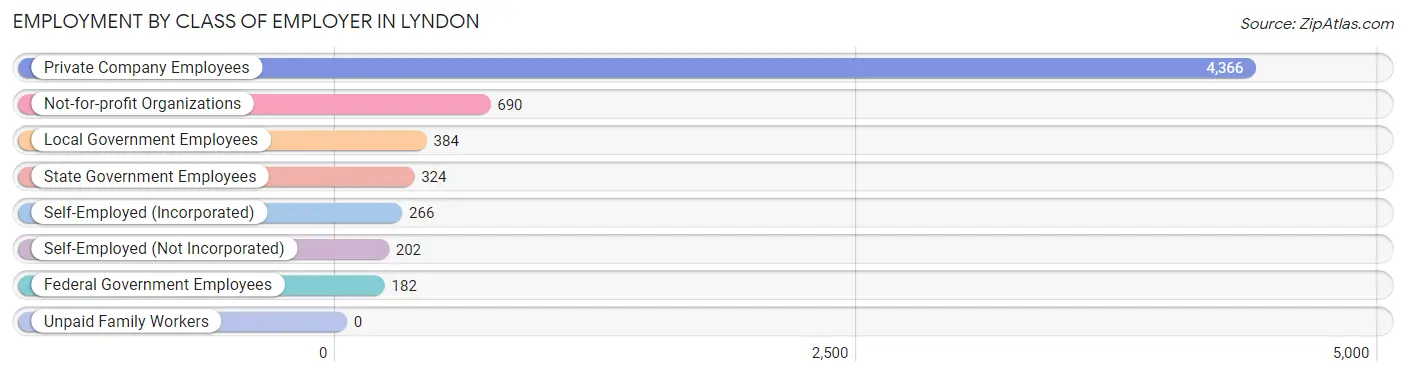
| Employer Class | # Employees | % Employees |
| Private Company Employees | 4,366 | 68.1% |
| Self-Employed (Incorporated) | 266 | 4.2% |
| Self-Employed (Not Incorporated) | 202 | 3.2% |
| Not-for-profit Organizations | 690 | 10.8% |
| Local Government Employees | 384 | 6.0% |
| State Government Employees | 324 | 5.1% |
| Federal Government Employees | 182 | 2.8% |
| Unpaid Family Workers | 0 | 0.0% |
| Total | 6,414 | 100.0% |
Employment Status by Age in Lyndon
According to the labor force statistics for Lyndon, out of the total population over 16 years of age (9,459), 71.4% or 6,754 individuals are in the labor force, with 4.0% or 270 of them unemployed. The age group with the highest labor force participation rate is 30 to 34 years, with 96.0% or 1,080 individuals in the labor force. Within the labor force, the 16 to 19 years age range has the highest percentage of unemployed individuals, with 25.2% or 60 of them being unemployed.
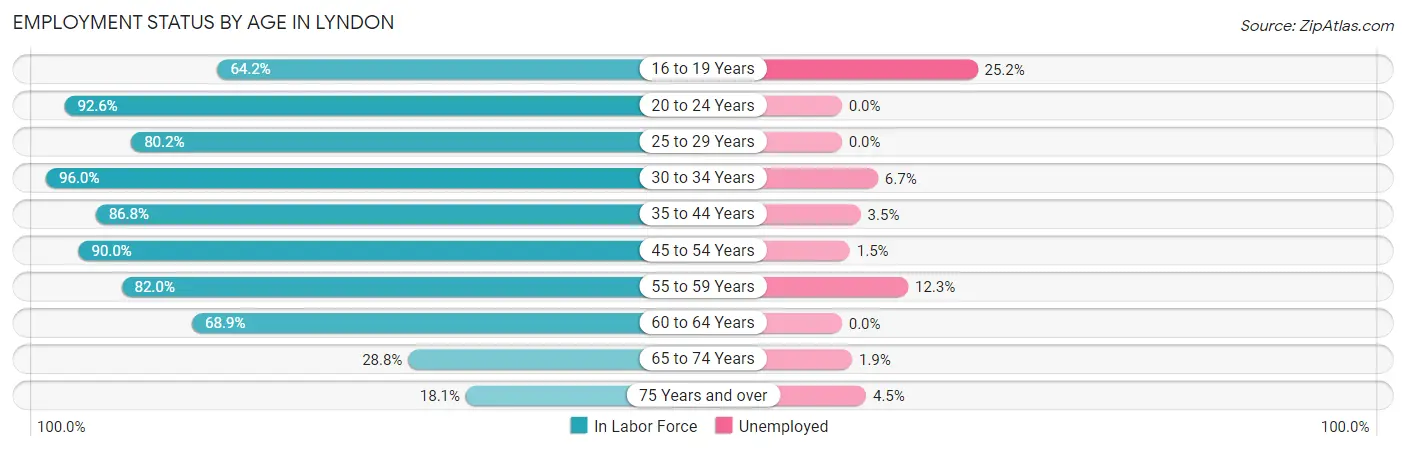
| Age Bracket | In Labor Force | Unemployed |
| 16 to 19 Years | 238 (64.2%) | 60 (25.2%) |
| 20 to 24 Years | 666 (92.6%) | 0 (0.0%) |
| 25 to 29 Years | 1,217 (80.2%) | 0 (0.0%) |
| 30 to 34 Years | 1,080 (96.0%) | 72 (6.7%) |
| 35 to 44 Years | 977 (86.8%) | 34 (3.5%) |
| 45 to 54 Years | 970 (90.0%) | 15 (1.5%) |
| 55 to 59 Years | 604 (82.0%) | 74 (12.3%) |
| 60 to 64 Years | 511 (68.9%) | 0 (0.0%) |
| 65 to 74 Years | 309 (28.8%) | 6 (1.9%) |
| 75 Years and over | 176 (18.1%) | 8 (4.5%) |
| Total | 6,754 (71.4%) | 270 (4.0%) |
Employment Status by Educational Attainment in Lyndon
According to labor force statistics for Lyndon, 84.7% of individuals (5,358) out of the total population between 25 and 64 years of age (6,326) are in the labor force, with 3.6% or 193 of them being unemployed. The group with the highest labor force participation rate are those with the educational attainment of bachelor's degree or higher, with 92.6% or 2,584 individuals in the labor force. Within the labor force, individuals with less than high school education have the highest percentage of unemployment, with 10.3% or 34 of them being unemployed.
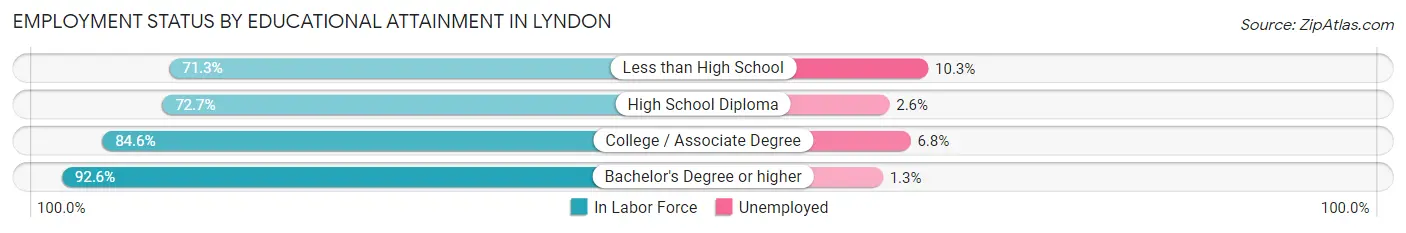
| Educational Attainment | In Labor Force | Unemployed |
| Less than High School | 331 (71.3%) | 48 (10.3%) |
| High School Diploma | 938 (72.7%) | 34 (2.6%) |
| College / Associate Degree | 1,507 (84.6%) | 121 (6.8%) |
| Bachelor's Degree or higher | 2,584 (92.6%) | 36 (1.3%) |
| Total | 5,358 (84.7%) | 228 (3.6%) |
Employment Occupations by Sex in Lyndon
Management, Business, Science and Arts Occupations
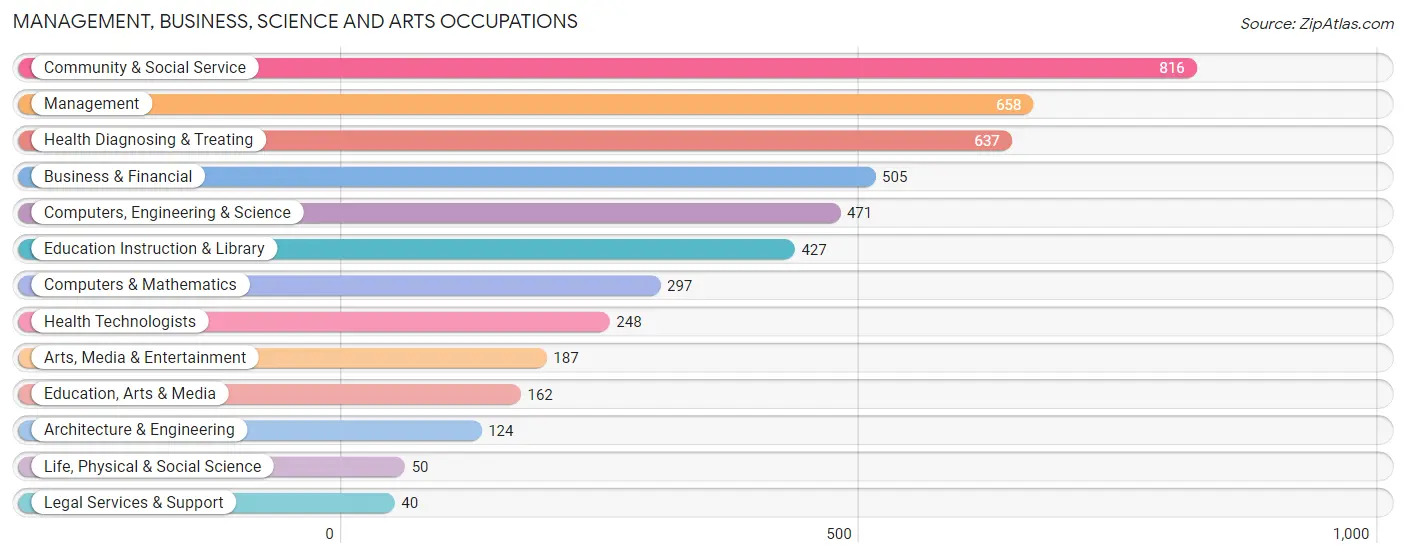
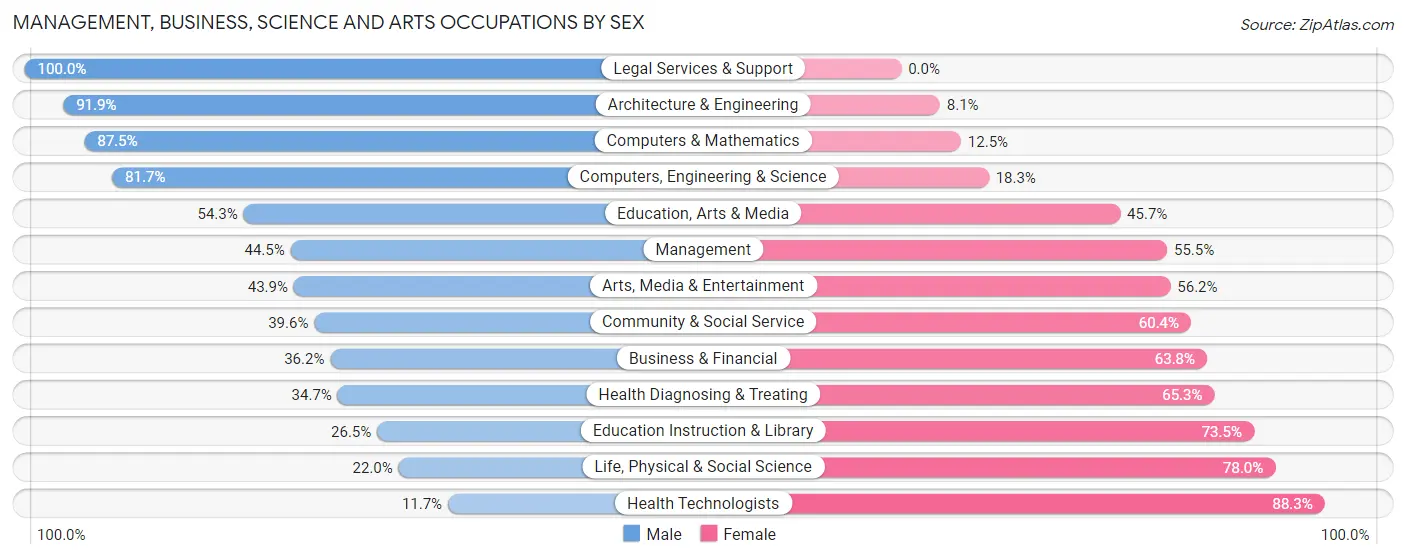
The most common Management, Business, Science and Arts occupations in Lyndon are Community & Social Service (816 | 12.6%), Management (658 | 10.2%), Health Diagnosing & Treating (637 | 9.8%), Business & Financial (505 | 7.8%), and Computers, Engineering & Science (471 | 7.3%).
Management, Business, Science and Arts Occupations by Sex
Within the Management, Business, Science and Arts occupations in Lyndon, the most male-oriented occupations are Legal Services & Support (100.0%), Architecture & Engineering (91.9%), and Computers & Mathematics (87.5%), while the most female-oriented occupations are Health Technologists (88.3%), Life, Physical & Social Science (78.0%), and Education Instruction & Library (73.5%).
| Occupation | Male | Female |
| Management | 293 (44.5%) | 365 (55.5%) |
| Business & Financial | 183 (36.2%) | 322 (63.8%) |
| Computers, Engineering & Science | 385 (81.7%) | 86 (18.3%) |
| Computers & Mathematics | 260 (87.5%) | 37 (12.5%) |
| Architecture & Engineering | 114 (91.9%) | 10 (8.1%) |
| Life, Physical & Social Science | 11 (22.0%) | 39 (78.0%) |
| Community & Social Service | 323 (39.6%) | 493 (60.4%) |
| Education, Arts & Media | 88 (54.3%) | 74 (45.7%) |
| Legal Services & Support | 40 (100.0%) | 0 (0.0%) |
| Education Instruction & Library | 113 (26.5%) | 314 (73.5%) |
| Arts, Media & Entertainment | 82 (43.9%) | 105 (56.1%) |
| Health Diagnosing & Treating | 221 (34.7%) | 416 (65.3%) |
| Health Technologists | 29 (11.7%) | 219 (88.3%) |
| Total (Category) | 1,405 (45.5%) | 1,682 (54.5%) |
| Total (Overall) | 3,234 (49.9%) | 3,246 (50.1%) |
Services Occupations
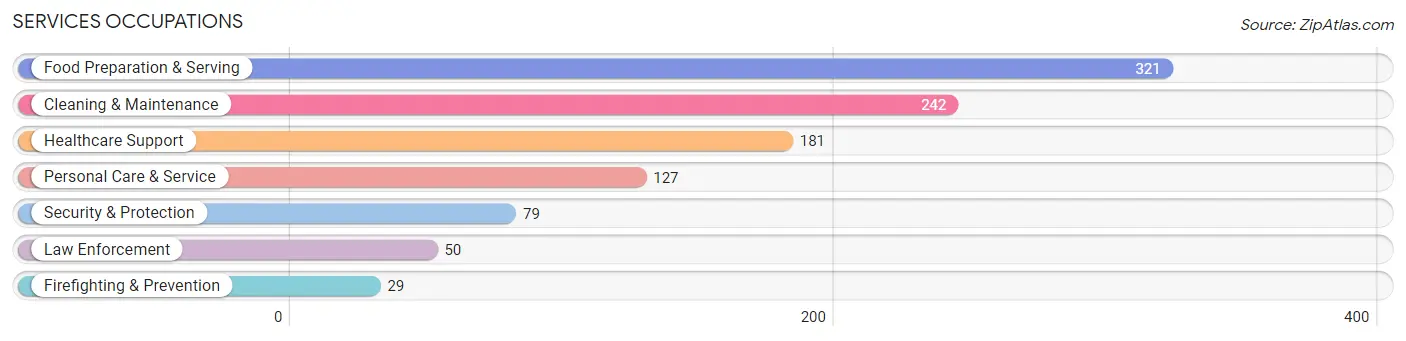
The most common Services occupations in Lyndon are Food Preparation & Serving (321 | 5.0%), Cleaning & Maintenance (242 | 3.7%), Healthcare Support (181 | 2.8%), Personal Care & Service (127 | 2.0%), and Security & Protection (79 | 1.2%).
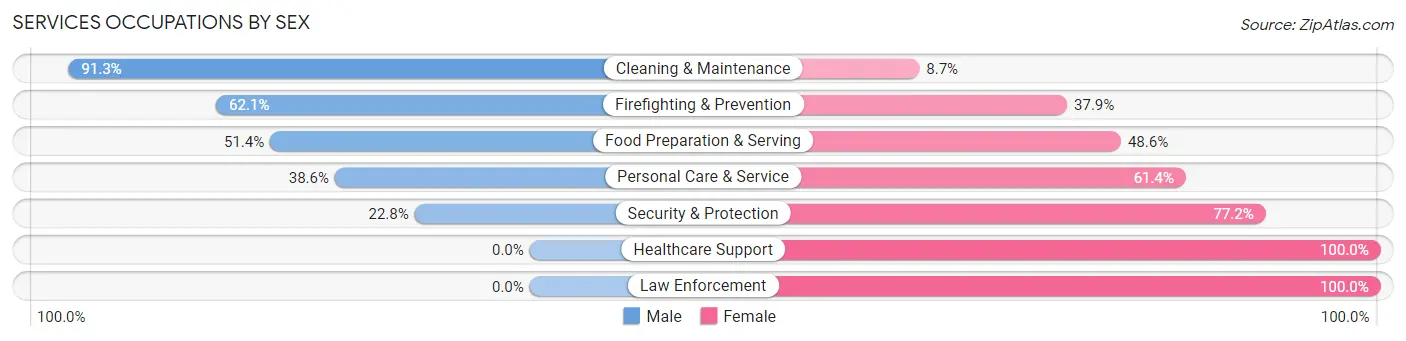
Services Occupations by Sex
Within the Services occupations in Lyndon, the most male-oriented occupations are Cleaning & Maintenance (91.3%), Firefighting & Prevention (62.1%), and Food Preparation & Serving (51.4%), while the most female-oriented occupations are Healthcare Support (100.0%), Law Enforcement (100.0%), and Security & Protection (77.2%).
| Occupation | Male | Female |
| Healthcare Support | 0 (0.0%) | 181 (100.0%) |
| Security & Protection | 18 (22.8%) | 61 (77.2%) |
| Firefighting & Prevention | 18 (62.1%) | 11 (37.9%) |
| Law Enforcement | 0 (0.0%) | 50 (100.0%) |
| Food Preparation & Serving | 165 (51.4%) | 156 (48.6%) |
| Cleaning & Maintenance | 221 (91.3%) | 21 (8.7%) |
| Personal Care & Service | 49 (38.6%) | 78 (61.4%) |
| Total (Category) | 453 (47.7%) | 497 (52.3%) |
| Total (Overall) | 3,234 (49.9%) | 3,246 (50.1%) |
Sales and Office Occupations
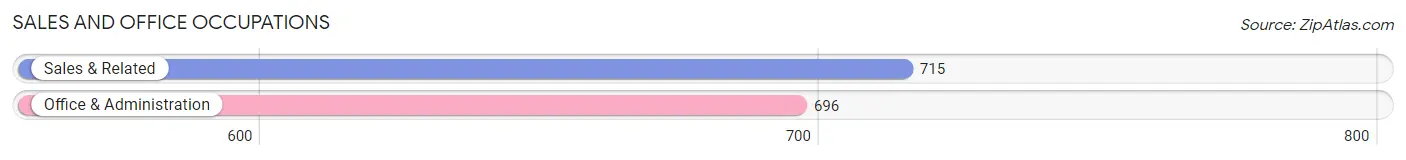
The most common Sales and Office occupations in Lyndon are Sales & Related (715 | 11.0%), and Office & Administration (696 | 10.7%).
Sales and Office Occupations by Sex
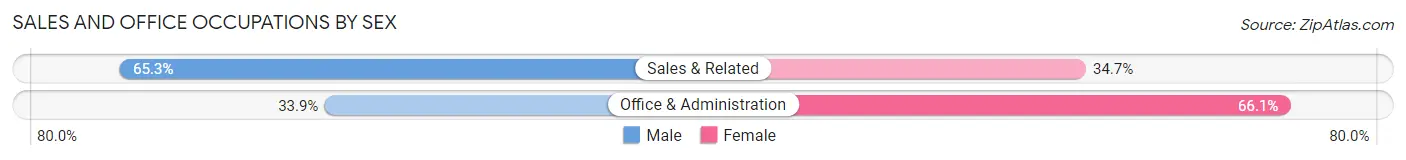
| Occupation | Male | Female |
| Sales & Related | 467 (65.3%) | 248 (34.7%) |
| Office & Administration | 236 (33.9%) | 460 (66.1%) |
| Total (Category) | 703 (49.8%) | 708 (50.2%) |
| Total (Overall) | 3,234 (49.9%) | 3,246 (50.1%) |
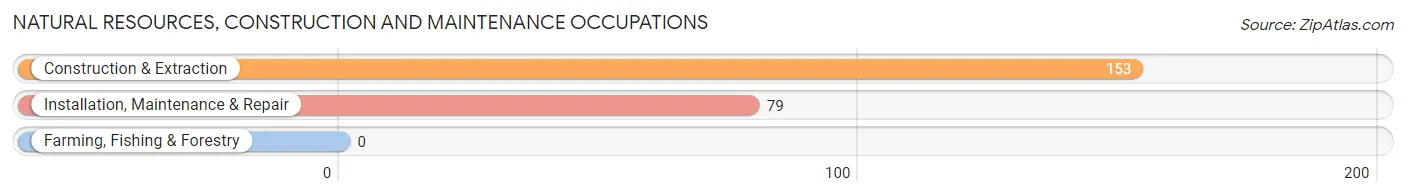
Natural Resources, Construction and Maintenance Occupations
The most common Natural Resources, Construction and Maintenance occupations in Lyndon are Construction & Extraction (153 | 2.4%), and Installation, Maintenance & Repair (79 | 1.2%).
Natural Resources, Construction and Maintenance Occupations by Sex
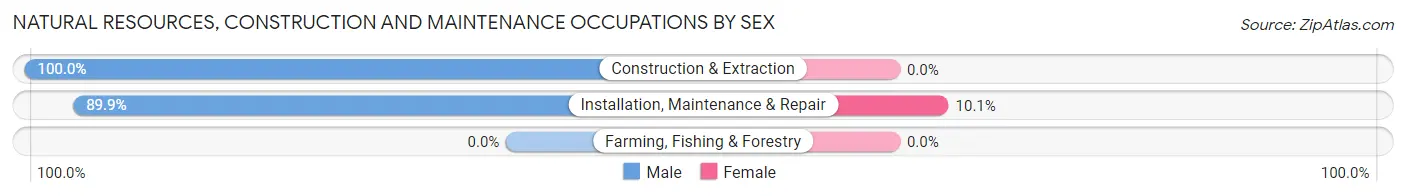
| Occupation | Male | Female |
| Farming, Fishing & Forestry | 0 (0.0%) | 0 (0.0%) |
| Construction & Extraction | 153 (100.0%) | 0 (0.0%) |
| Installation, Maintenance & Repair | 71 (89.9%) | 8 (10.1%) |
| Total (Category) | 224 (96.6%) | 8 (3.5%) |
| Total (Overall) | 3,234 (49.9%) | 3,246 (50.1%) |
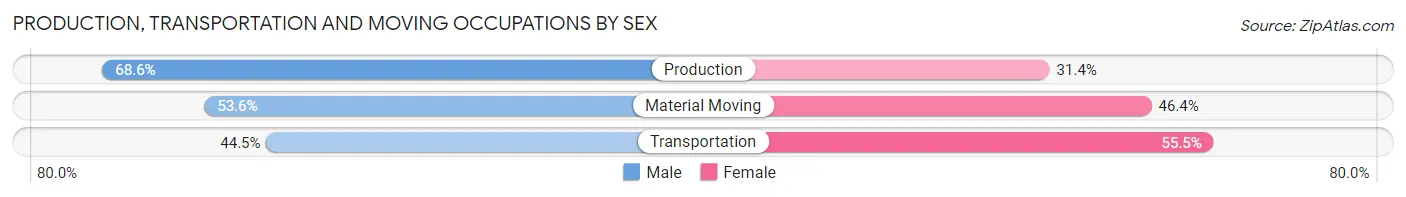
Production, Transportation and Moving Occupations
The most common Production, Transportation and Moving occupations in Lyndon are Material Moving (373 | 5.8%), Production (245 | 3.8%), and Transportation (182 | 2.8%).
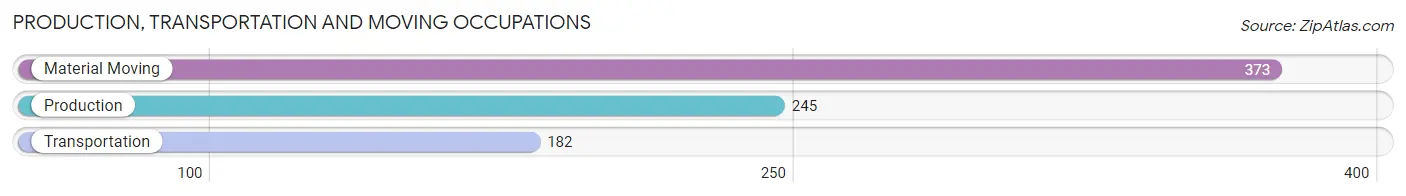
Production, Transportation and Moving Occupations by Sex
| Occupation | Male | Female |
| Production | 168 (68.6%) | 77 (31.4%) |
| Transportation | 81 (44.5%) | 101 (55.5%) |
| Material Moving | 200 (53.6%) | 173 (46.4%) |
| Total (Category) | 449 (56.1%) | 351 (43.9%) |
| Total (Overall) | 3,234 (49.9%) | 3,246 (50.1%) |
Employment Industries by Sex in Lyndon
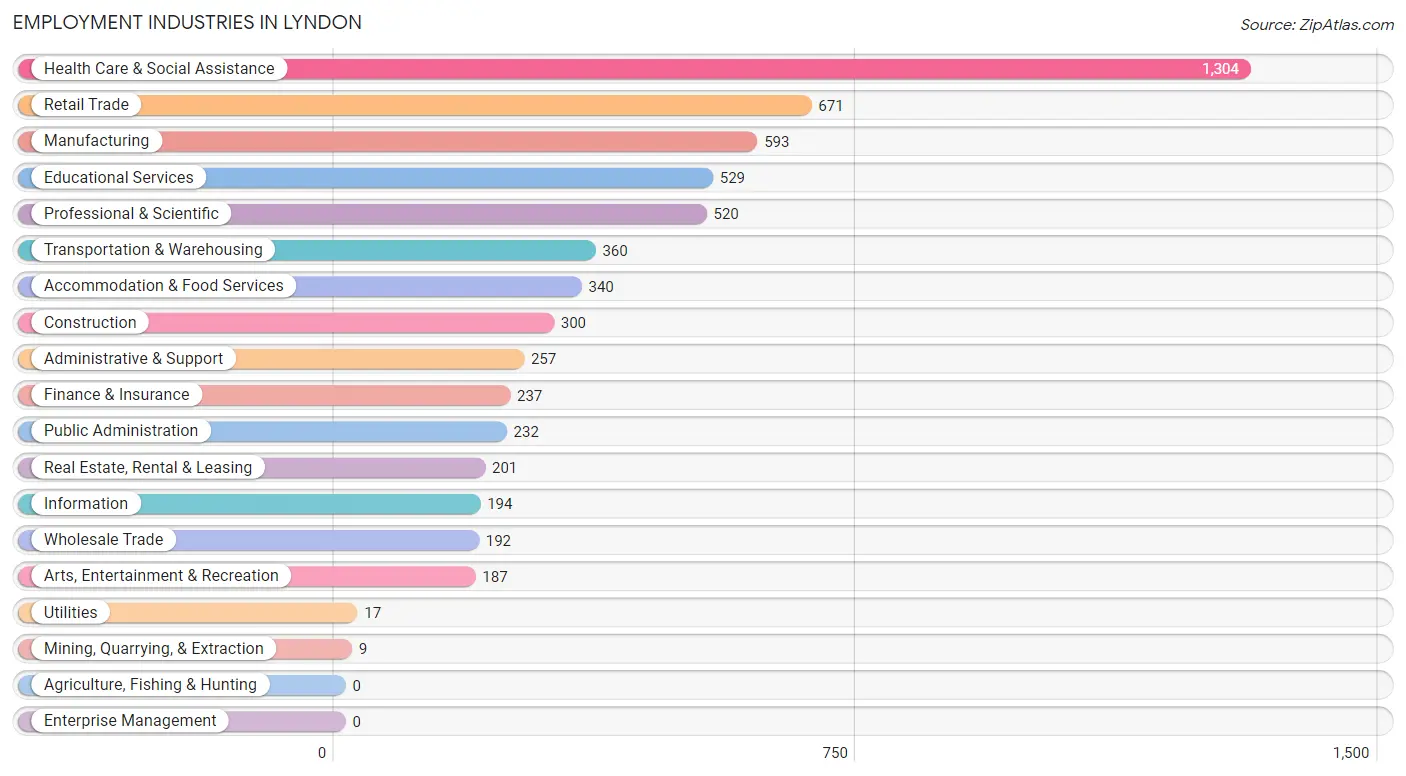
Employment Industries in Lyndon
The major employment industries in Lyndon include Health Care & Social Assistance (1,304 | 20.1%), Retail Trade (671 | 10.3%), Manufacturing (593 | 9.1%), Educational Services (529 | 8.2%), and Professional & Scientific (520 | 8.0%).
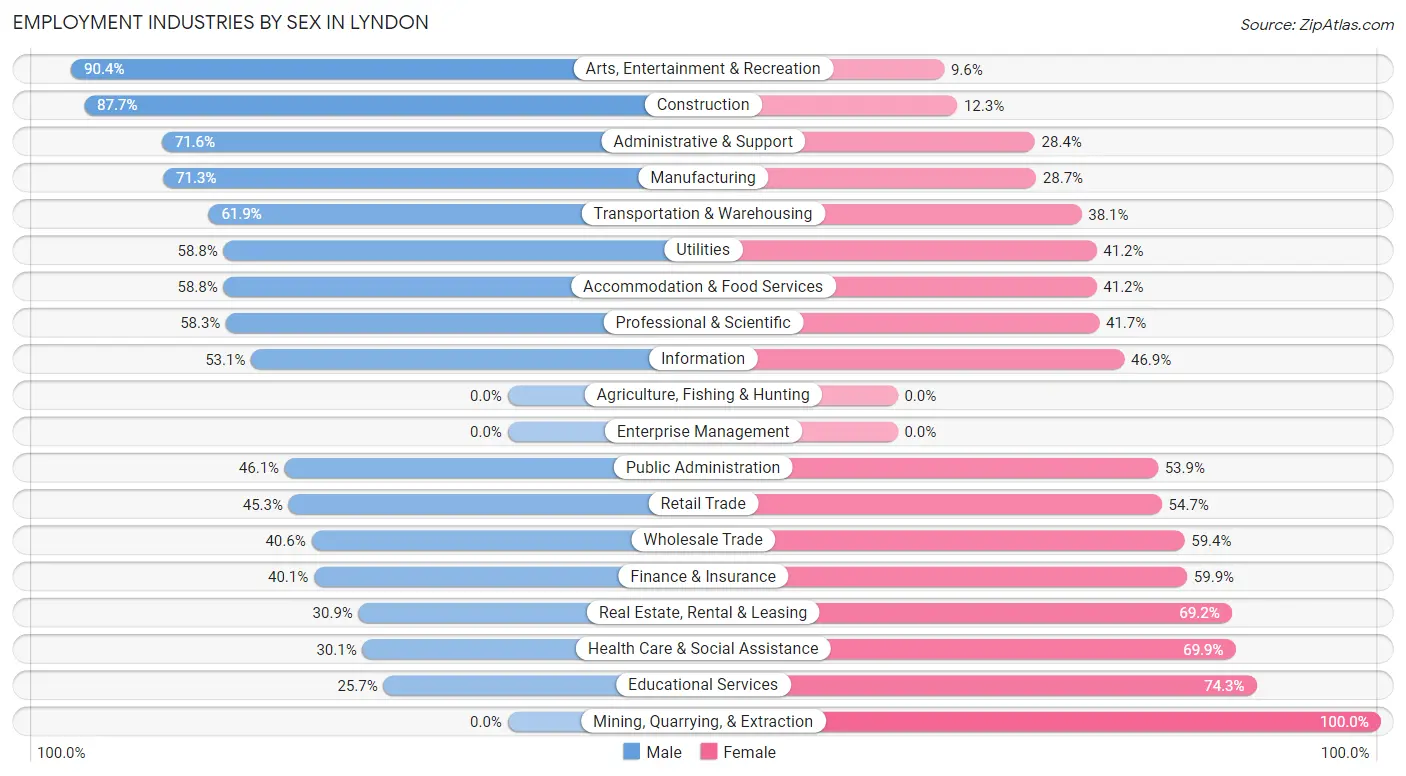
Employment Industries by Sex in Lyndon
The Lyndon industries that see more men than women are Arts, Entertainment & Recreation (90.4%), Construction (87.7%), and Administrative & Support (71.6%), whereas the industries that tend to have a higher number of women are Mining, Quarrying, & Extraction (100.0%), Educational Services (74.3%), and Health Care & Social Assistance (69.9%).
| Industry | Male | Female |
| Agriculture, Fishing & Hunting | 0 (0.0%) | 0 (0.0%) |
| Mining, Quarrying, & Extraction | 0 (0.0%) | 9 (100.0%) |
| Construction | 263 (87.7%) | 37 (12.3%) |
| Manufacturing | 423 (71.3%) | 170 (28.7%) |
| Wholesale Trade | 78 (40.6%) | 114 (59.4%) |
| Retail Trade | 304 (45.3%) | 367 (54.7%) |
| Transportation & Warehousing | 223 (61.9%) | 137 (38.1%) |
| Utilities | 10 (58.8%) | 7 (41.2%) |
| Information | 103 (53.1%) | 91 (46.9%) |
| Finance & Insurance | 95 (40.1%) | 142 (59.9%) |
| Real Estate, Rental & Leasing | 62 (30.8%) | 139 (69.2%) |
| Professional & Scientific | 303 (58.3%) | 217 (41.7%) |
| Enterprise Management | 0 (0.0%) | 0 (0.0%) |
| Administrative & Support | 184 (71.6%) | 73 (28.4%) |
| Educational Services | 136 (25.7%) | 393 (74.3%) |
| Health Care & Social Assistance | 392 (30.1%) | 912 (69.9%) |
| Arts, Entertainment & Recreation | 169 (90.4%) | 18 (9.6%) |
| Accommodation & Food Services | 200 (58.8%) | 140 (41.2%) |
| Public Administration | 107 (46.1%) | 125 (53.9%) |
| Total | 3,234 (49.9%) | 3,246 (50.1%) |
Education in Lyndon
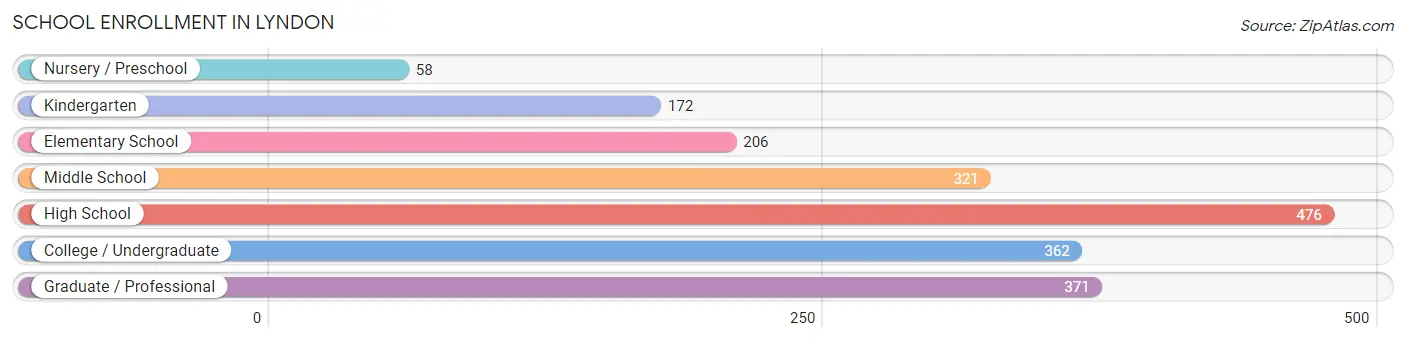
School Enrollment in Lyndon
The most common levels of schooling among the 1,966 students in Lyndon are high school (476 | 24.2%), graduate / professional (371 | 18.9%), and college / undergraduate (362 | 18.4%).
| School Level | # Students | % Students |
| Nursery / Preschool | 58 | 2.9% |
| Kindergarten | 172 | 8.7% |
| Elementary School | 206 | 10.5% |
| Middle School | 321 | 16.3% |
| High School | 476 | 24.2% |
| College / Undergraduate | 362 | 18.4% |
| Graduate / Professional | 371 | 18.9% |
| Total | 1,966 | 100.0% |
School Enrollment by Age by Funding Source in Lyndon
Out of a total of 1,966 students who are enrolled in schools in Lyndon, 529 (26.9%) attend a private institution, while the remaining 1,437 (73.1%) are enrolled in public schools. The age group of 3 to 4 year olds has the highest likelihood of being enrolled in private schools, with 47 (85.5% in the age bracket) enrolled. Conversely, the age group of 5 to 9 year old has the lowest likelihood of being enrolled in a private school, with 410 (98.6% in the age bracket) attending a public institution.
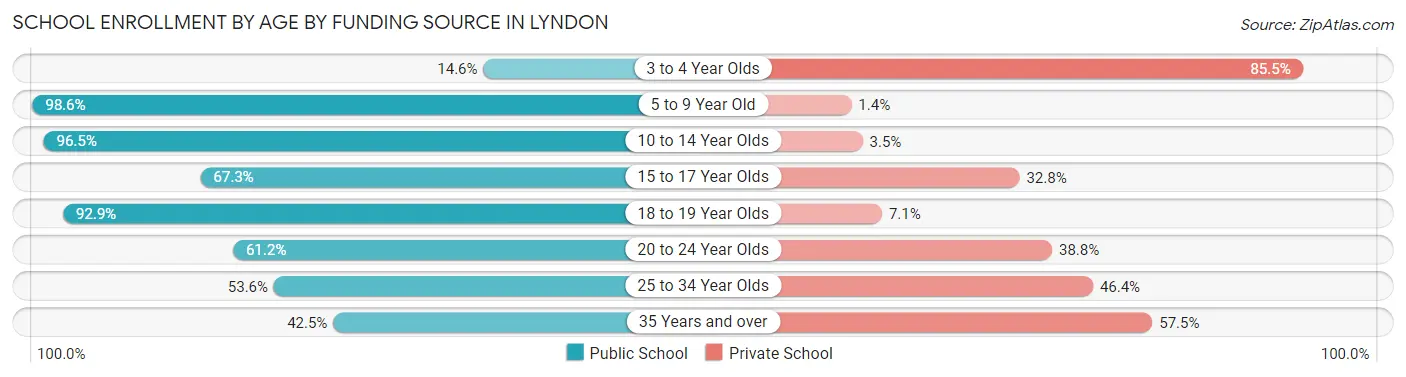
| Age Bracket | Public School | Private School |
| 3 to 4 Year Olds | 8 (14.5%) | 47 (85.5%) |
| 5 to 9 Year Old | 410 (98.6%) | 6 (1.4%) |
| 10 to 14 Year Olds | 301 (96.5%) | 11 (3.5%) |
| 15 to 17 Year Olds | 269 (67.2%) | 131 (32.8%) |
| 18 to 19 Year Olds | 104 (92.9%) | 8 (7.1%) |
| 20 to 24 Year Olds | 145 (61.2%) | 92 (38.8%) |
| 25 to 34 Year Olds | 75 (53.6%) | 65 (46.4%) |
| 35 Years and over | 125 (42.5%) | 169 (57.5%) |
| Total | 1,437 (73.1%) | 529 (26.9%) |
Educational Attainment by Field of Study in Lyndon
Business (761 | 19.0%), social sciences (357 | 8.9%), education (355 | 8.9%), psychology (352 | 8.8%), and science & technology (351 | 8.8%) are the most common fields of study among 3,999 individuals in Lyndon who have obtained a bachelor's degree or higher.
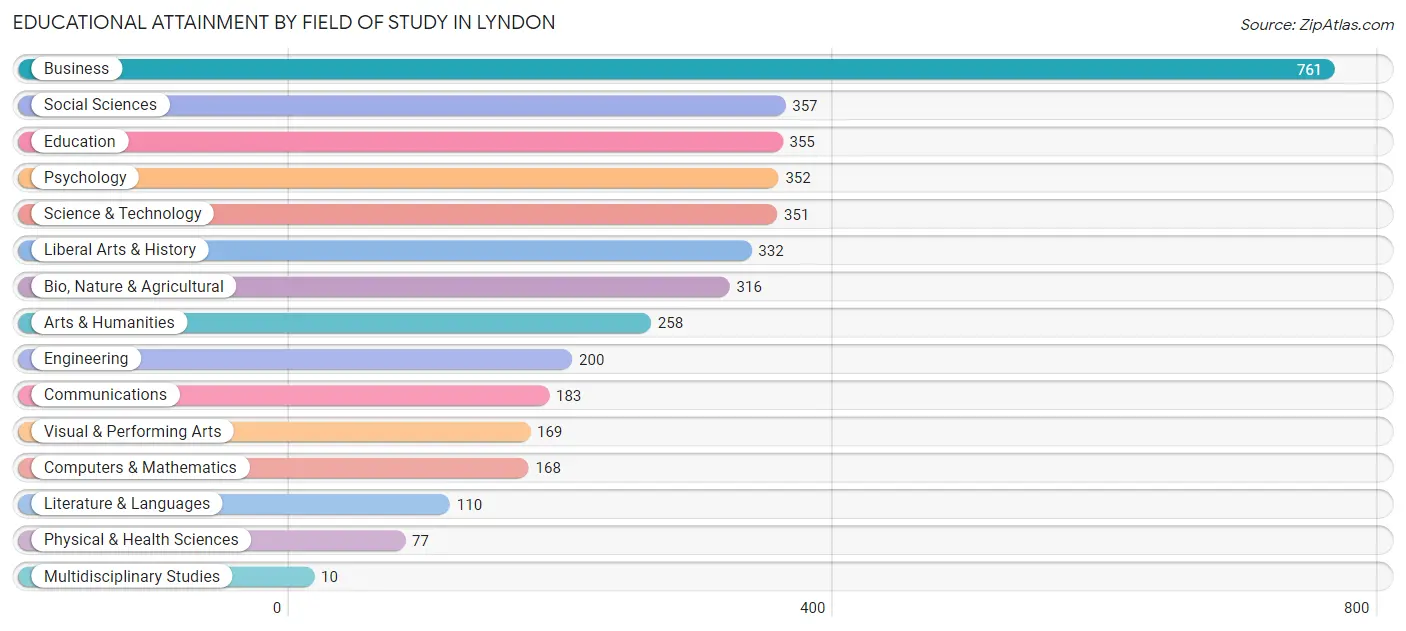
| Field of Study | # Graduates | % Graduates |
| Computers & Mathematics | 168 | 4.2% |
| Bio, Nature & Agricultural | 316 | 7.9% |
| Physical & Health Sciences | 77 | 1.9% |
| Psychology | 352 | 8.8% |
| Social Sciences | 357 | 8.9% |
| Engineering | 200 | 5.0% |
| Multidisciplinary Studies | 10 | 0.3% |
| Science & Technology | 351 | 8.8% |
| Business | 761 | 19.0% |
| Education | 355 | 8.9% |
| Literature & Languages | 110 | 2.8% |
| Liberal Arts & History | 332 | 8.3% |
| Visual & Performing Arts | 169 | 4.2% |
| Communications | 183 | 4.6% |
| Arts & Humanities | 258 | 6.5% |
| Total | 3,999 | 100.0% |
Transportation & Commute in Lyndon
Vehicle Availability by Sex in Lyndon
The most prevalent vehicle ownership categories in Lyndon are males with 2 vehicles (1,439, accounting for 44.7%) and females with 2 vehicles (1,666, making up 45.0%).
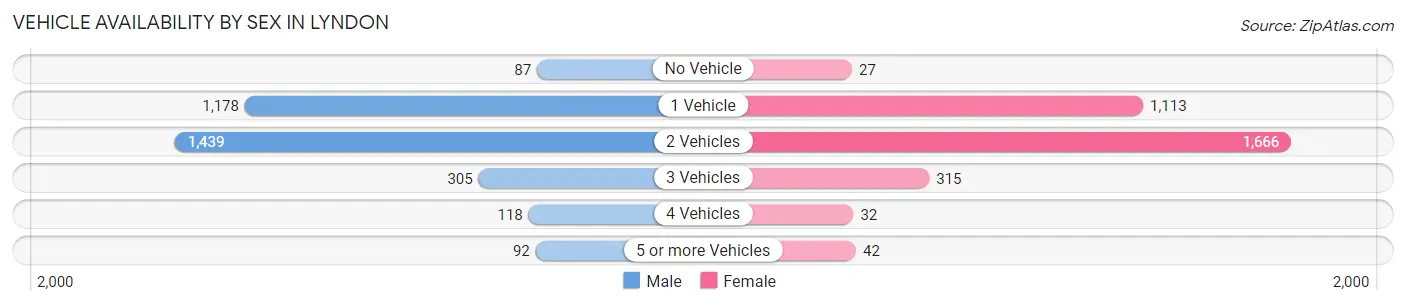
| Vehicles Available | Male | Female |
| No Vehicle | 87 (2.7%) | 27 (0.9%) |
| 1 Vehicle | 1,178 (36.6%) | 1,113 (34.8%) |
| 2 Vehicles | 1,439 (44.7%) | 1,666 (52.1%) |
| 3 Vehicles | 305 (9.5%) | 315 (9.9%) |
| 4 Vehicles | 118 (3.7%) | 32 (1.0%) |
| 5 or more Vehicles | 92 (2.9%) | 42 (1.3%) |
| Total | 3,219 (100.0%) | 3,195 (100.0%) |
Commute Time in Lyndon
The most frequently occuring commute durations in Lyndon are 15 to 19 minutes (1,360 commuters, 24.2%), 10 to 14 minutes (1,166 commuters, 20.8%), and 20 to 24 minutes (986 commuters, 17.6%).
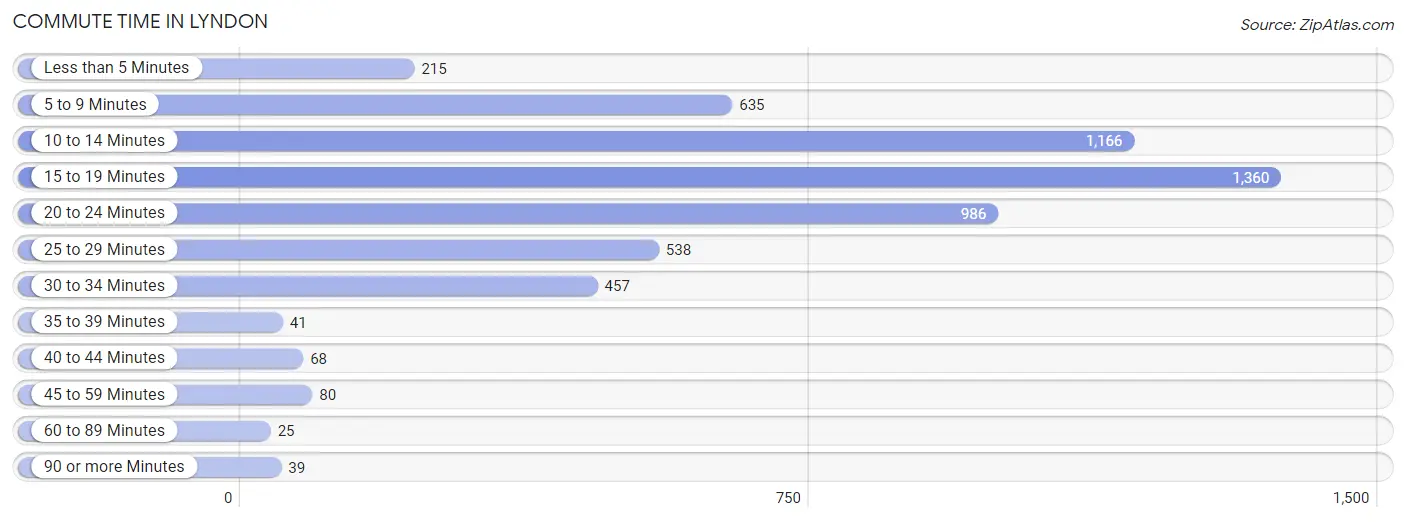
| Commute Time | # Commuters | % Commuters |
| Less than 5 Minutes | 215 | 3.8% |
| 5 to 9 Minutes | 635 | 11.3% |
| 10 to 14 Minutes | 1,166 | 20.8% |
| 15 to 19 Minutes | 1,360 | 24.2% |
| 20 to 24 Minutes | 986 | 17.6% |
| 25 to 29 Minutes | 538 | 9.6% |
| 30 to 34 Minutes | 457 | 8.2% |
| 35 to 39 Minutes | 41 | 0.7% |
| 40 to 44 Minutes | 68 | 1.2% |
| 45 to 59 Minutes | 80 | 1.4% |
| 60 to 89 Minutes | 25 | 0.4% |
| 90 or more Minutes | 39 | 0.7% |
Commute Time by Sex in Lyndon
The most common commute times in Lyndon are 10 to 14 minutes (639 commuters, 22.4%) for males and 15 to 19 minutes (749 commuters, 27.1%) for females.
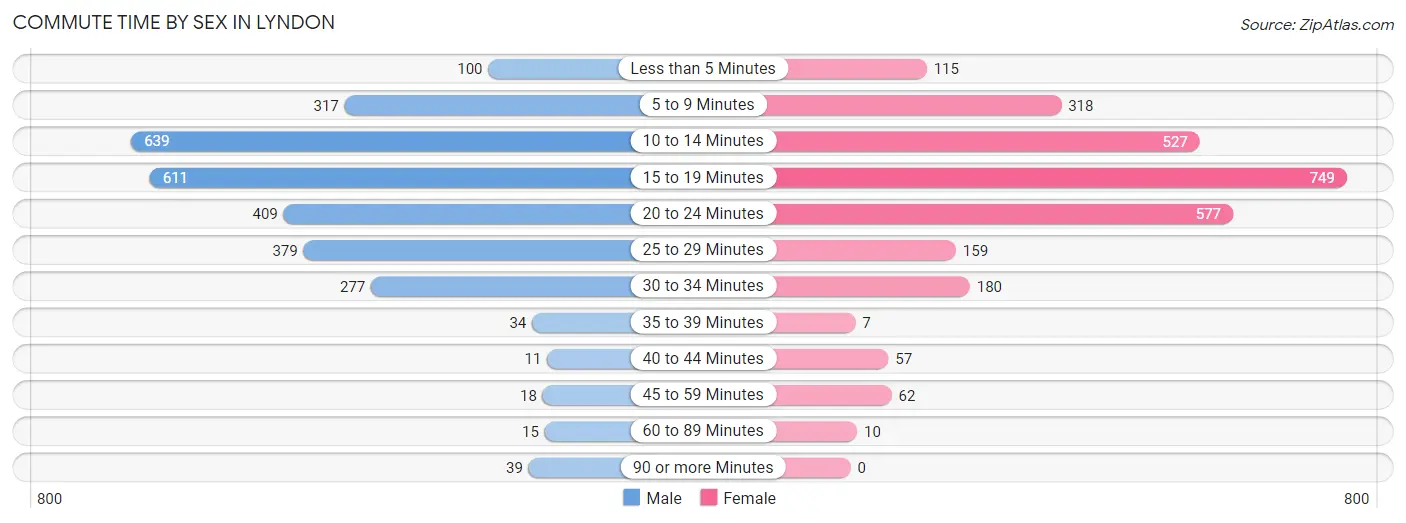
| Commute Time | Male | Female |
| Less than 5 Minutes | 100 (3.5%) | 115 (4.2%) |
| 5 to 9 Minutes | 317 (11.1%) | 318 (11.5%) |
| 10 to 14 Minutes | 639 (22.4%) | 527 (19.1%) |
| 15 to 19 Minutes | 611 (21.4%) | 749 (27.1%) |
| 20 to 24 Minutes | 409 (14.4%) | 577 (20.9%) |
| 25 to 29 Minutes | 379 (13.3%) | 159 (5.8%) |
| 30 to 34 Minutes | 277 (9.7%) | 180 (6.5%) |
| 35 to 39 Minutes | 34 (1.2%) | 7 (0.3%) |
| 40 to 44 Minutes | 11 (0.4%) | 57 (2.1%) |
| 45 to 59 Minutes | 18 (0.6%) | 62 (2.2%) |
| 60 to 89 Minutes | 15 (0.5%) | 10 (0.4%) |
| 90 or more Minutes | 39 (1.4%) | 0 (0.0%) |
Time of Departure to Work by Sex in Lyndon
The most frequent times of departure to work in Lyndon are 8:00 AM to 8:29 AM (433, 15.2%) for males and 7:00 AM to 7:29 AM (413, 15.0%) for females.
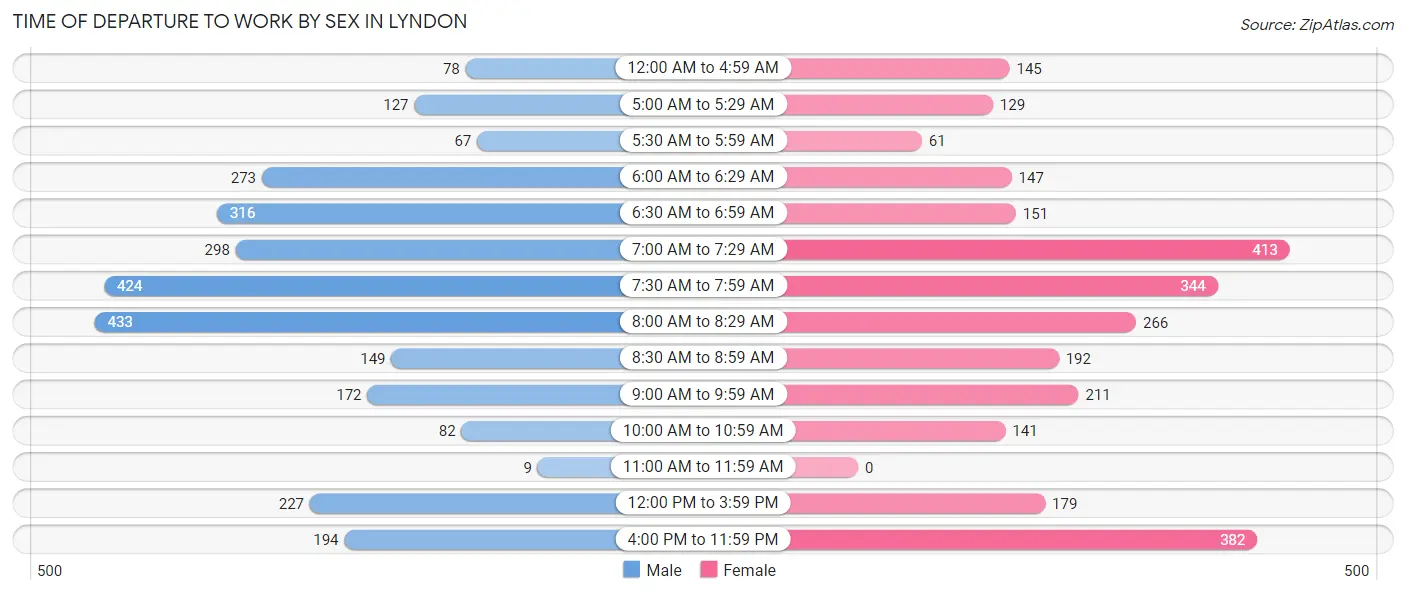
| Time of Departure | Male | Female |
| 12:00 AM to 4:59 AM | 78 (2.7%) | 145 (5.2%) |
| 5:00 AM to 5:29 AM | 127 (4.5%) | 129 (4.7%) |
| 5:30 AM to 5:59 AM | 67 (2.4%) | 61 (2.2%) |
| 6:00 AM to 6:29 AM | 273 (9.6%) | 147 (5.3%) |
| 6:30 AM to 6:59 AM | 316 (11.1%) | 151 (5.5%) |
| 7:00 AM to 7:29 AM | 298 (10.5%) | 413 (15.0%) |
| 7:30 AM to 7:59 AM | 424 (14.9%) | 344 (12.5%) |
| 8:00 AM to 8:29 AM | 433 (15.2%) | 266 (9.6%) |
| 8:30 AM to 8:59 AM | 149 (5.2%) | 192 (7.0%) |
| 9:00 AM to 9:59 AM | 172 (6.0%) | 211 (7.6%) |
| 10:00 AM to 10:59 AM | 82 (2.9%) | 141 (5.1%) |
| 11:00 AM to 11:59 AM | 9 (0.3%) | 0 (0.0%) |
| 12:00 PM to 3:59 PM | 227 (8.0%) | 179 (6.5%) |
| 4:00 PM to 11:59 PM | 194 (6.8%) | 382 (13.8%) |
| Total | 2,849 (100.0%) | 2,761 (100.0%) |
Housing Occupancy in Lyndon
Occupancy by Ownership in Lyndon
Of the total 5,776 dwellings in Lyndon, owner-occupied units account for 2,344 (40.6%), while renter-occupied units make up 3,432 (59.4%).
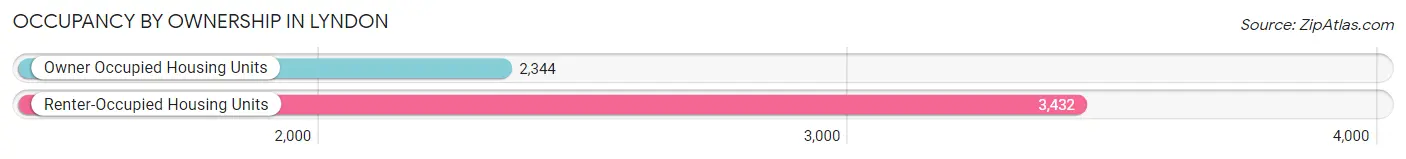
| Occupancy | # Housing Units | % Housing Units |
| Owner Occupied Housing Units | 2,344 | 40.6% |
| Renter-Occupied Housing Units | 3,432 | 59.4% |
| Total Occupied Housing Units | 5,776 | 100.0% |
Occupancy by Household Size in Lyndon
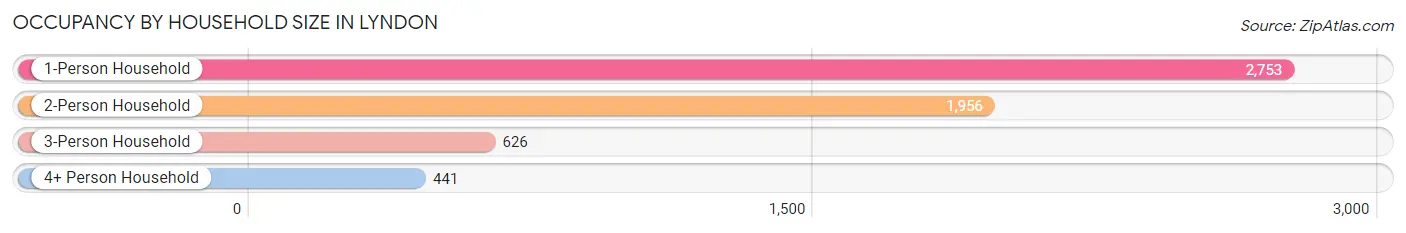
| Household Size | # Housing Units | % Housing Units |
| 1-Person Household | 2,753 | 47.7% |
| 2-Person Household | 1,956 | 33.9% |
| 3-Person Household | 626 | 10.8% |
| 4+ Person Household | 441 | 7.6% |
| Total Housing Units | 5,776 | 100.0% |
Occupancy by Ownership by Household Size in Lyndon
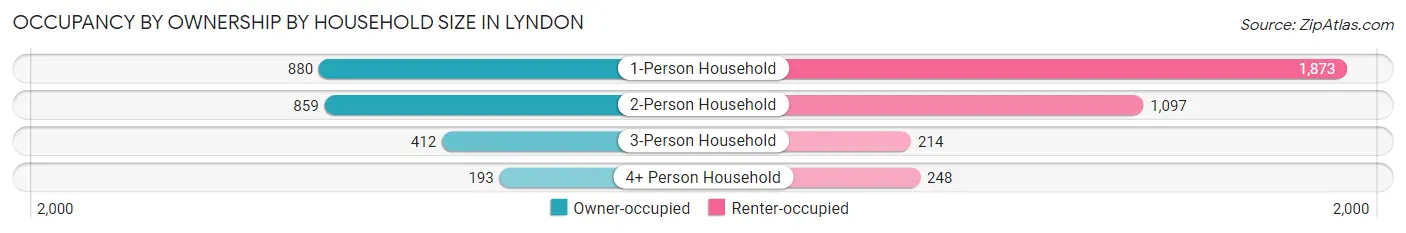
| Household Size | Owner-occupied | Renter-occupied |
| 1-Person Household | 880 (32.0%) | 1,873 (68.0%) |
| 2-Person Household | 859 (43.9%) | 1,097 (56.1%) |
| 3-Person Household | 412 (65.8%) | 214 (34.2%) |
| 4+ Person Household | 193 (43.8%) | 248 (56.2%) |
| Total Housing Units | 2,344 (40.6%) | 3,432 (59.4%) |
Occupancy by Educational Attainment in Lyndon
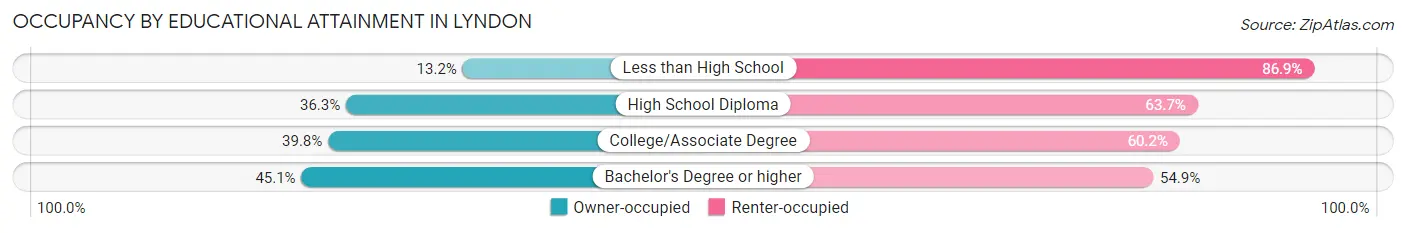
| Household Size | Owner-occupied | Renter-occupied |
| Less than High School | 33 (13.2%) | 218 (86.9%) |
| High School Diploma | 350 (36.3%) | 615 (63.7%) |
| College/Associate Degree | 724 (39.8%) | 1,094 (60.2%) |
| Bachelor's Degree or higher | 1,237 (45.1%) | 1,505 (54.9%) |
Occupancy by Age of Householder in Lyndon
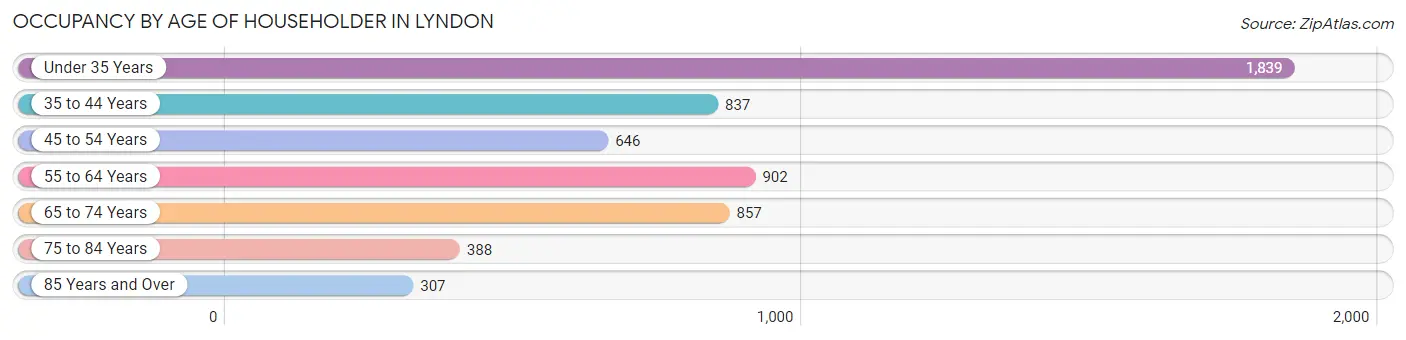
| Age Bracket | # Households | % Households |
| Under 35 Years | 1,839 | 31.8% |
| 35 to 44 Years | 837 | 14.5% |
| 45 to 54 Years | 646 | 11.2% |
| 55 to 64 Years | 902 | 15.6% |
| 65 to 74 Years | 857 | 14.8% |
| 75 to 84 Years | 388 | 6.7% |
| 85 Years and Over | 307 | 5.3% |
| Total | 5,776 | 100.0% |
Housing Finances in Lyndon
Median Income by Occupancy in Lyndon
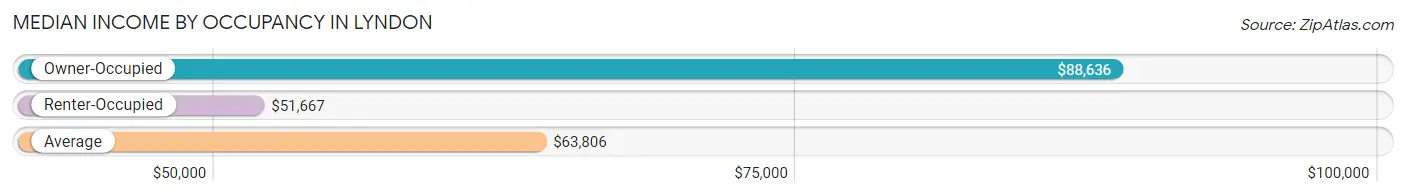
| Occupancy Type | # Households | Median Income |
| Owner-Occupied | 2,344 (40.6%) | $88,636 |
| Renter-Occupied | 3,432 (59.4%) | $51,667 |
| Average | 5,776 (100.0%) | $63,806 |
Occupancy by Householder Income Bracket in Lyndon
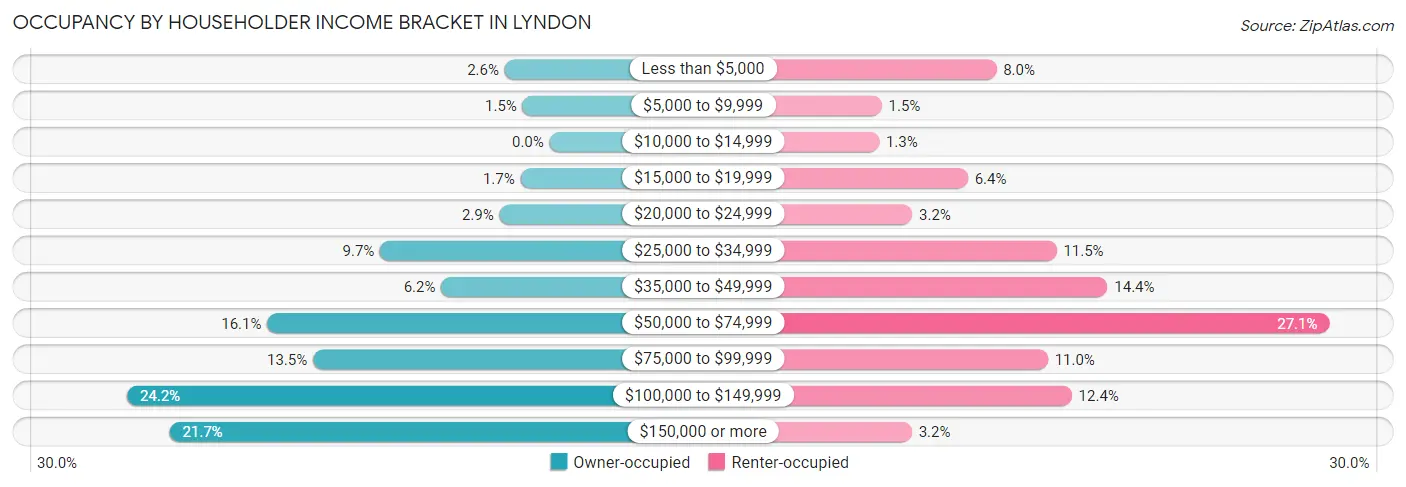
| Income Bracket | Owner-occupied | Renter-occupied |
| Less than $5,000 | 60 (2.6%) | 276 (8.0%) |
| $5,000 to $9,999 | 36 (1.5%) | 51 (1.5%) |
| $10,000 to $14,999 | 0 (0.0%) | 46 (1.3%) |
| $15,000 to $19,999 | 39 (1.7%) | 220 (6.4%) |
| $20,000 to $24,999 | 67 (2.9%) | 111 (3.2%) |
| $25,000 to $34,999 | 227 (9.7%) | 394 (11.5%) |
| $35,000 to $49,999 | 145 (6.2%) | 494 (14.4%) |
| $50,000 to $74,999 | 378 (16.1%) | 929 (27.1%) |
| $75,000 to $99,999 | 317 (13.5%) | 377 (11.0%) |
| $100,000 to $149,999 | 566 (24.1%) | 424 (12.3%) |
| $150,000 or more | 509 (21.7%) | 110 (3.2%) |
| Total | 2,344 (100.0%) | 3,432 (100.0%) |
Monthly Housing Cost Tiers in Lyndon
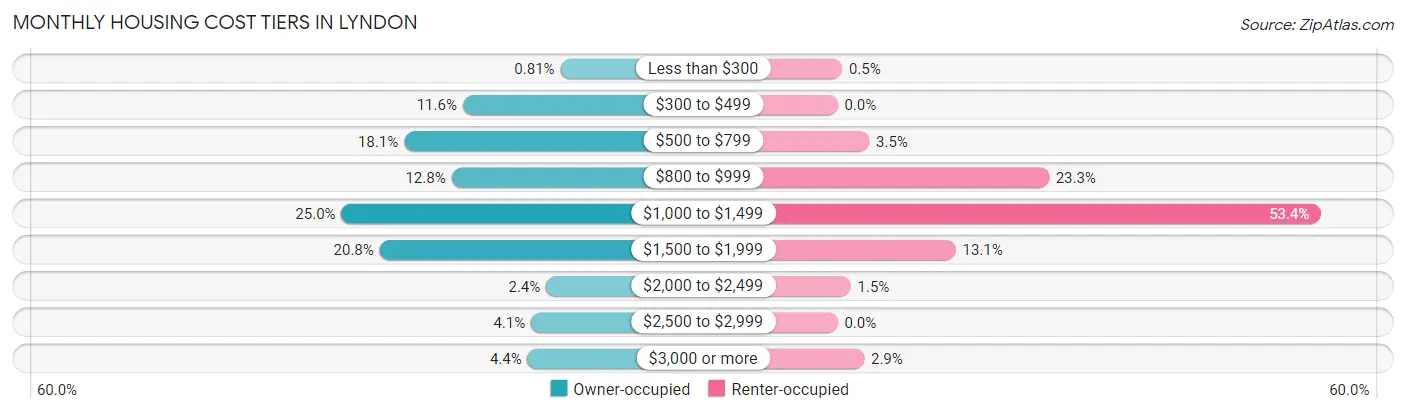
| Monthly Cost | Owner-occupied | Renter-occupied |
| Less than $300 | 19 (0.8%) | 17 (0.5%) |
| $300 to $499 | 272 (11.6%) | 0 (0.0%) |
| $500 to $799 | 424 (18.1%) | 120 (3.5%) |
| $800 to $999 | 301 (12.8%) | 801 (23.3%) |
| $1,000 to $1,499 | 586 (25.0%) | 1,834 (53.4%) |
| $1,500 to $1,999 | 487 (20.8%) | 448 (13.1%) |
| $2,000 to $2,499 | 56 (2.4%) | 50 (1.5%) |
| $2,500 to $2,999 | 95 (4.1%) | 0 (0.0%) |
| $3,000 or more | 104 (4.4%) | 101 (2.9%) |
| Total | 2,344 (100.0%) | 3,432 (100.0%) |
Physical Housing Characteristics in Lyndon
Housing Structures in Lyndon
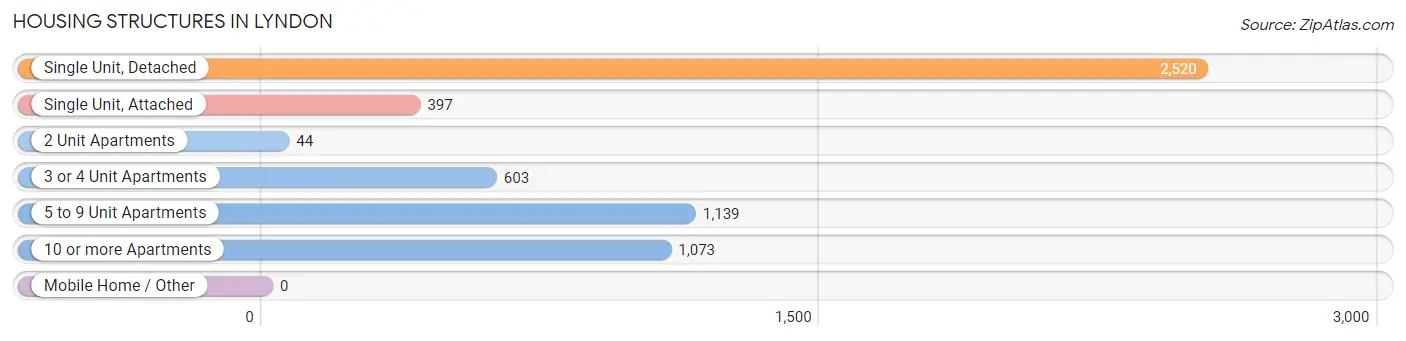
| Structure Type | # Housing Units | % Housing Units |
| Single Unit, Detached | 2,520 | 43.6% |
| Single Unit, Attached | 397 | 6.9% |
| 2 Unit Apartments | 44 | 0.8% |
| 3 or 4 Unit Apartments | 603 | 10.4% |
| 5 to 9 Unit Apartments | 1,139 | 19.7% |
| 10 or more Apartments | 1,073 | 18.6% |
| Mobile Home / Other | 0 | 0.0% |
| Total | 5,776 | 100.0% |
Housing Structures by Occupancy in Lyndon
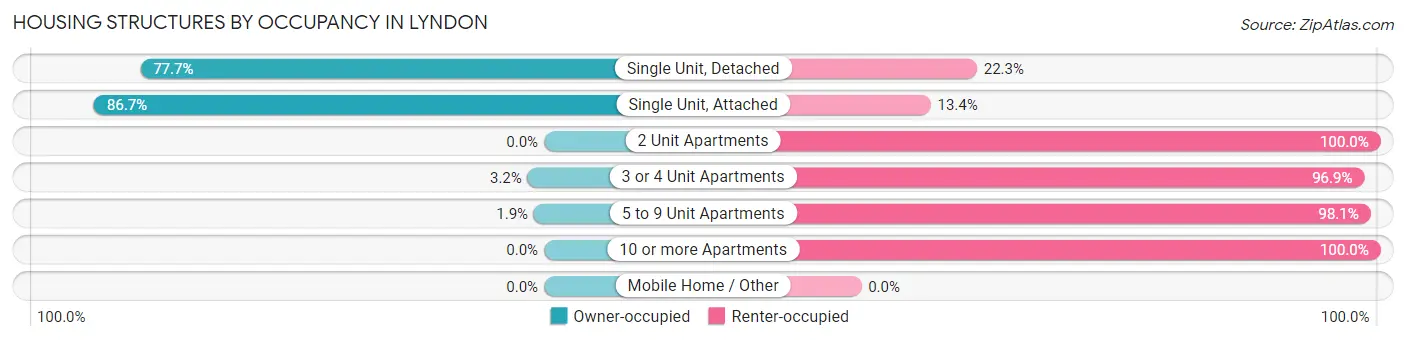
| Structure Type | Owner-occupied | Renter-occupied |
| Single Unit, Detached | 1,959 (77.7%) | 561 (22.3%) |
| Single Unit, Attached | 344 (86.7%) | 53 (13.4%) |
| 2 Unit Apartments | 0 (0.0%) | 44 (100.0%) |
| 3 or 4 Unit Apartments | 19 (3.2%) | 584 (96.9%) |
| 5 to 9 Unit Apartments | 22 (1.9%) | 1,117 (98.1%) |
| 10 or more Apartments | 0 (0.0%) | 1,073 (100.0%) |
| Mobile Home / Other | 0 (0.0%) | 0 (0.0%) |
| Total | 2,344 (40.6%) | 3,432 (59.4%) |
Housing Structures by Number of Rooms in Lyndon
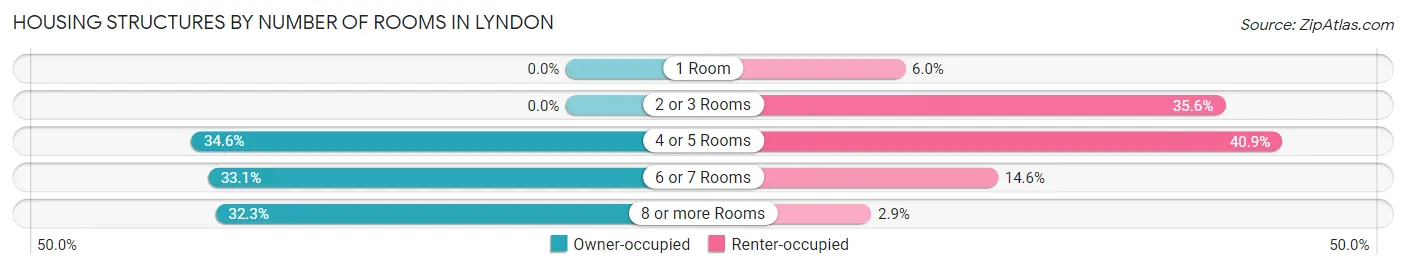
| Number of Rooms | Owner-occupied | Renter-occupied |
| 1 Room | 0 (0.0%) | 207 (6.0%) |
| 2 or 3 Rooms | 0 (0.0%) | 1,222 (35.6%) |
| 4 or 5 Rooms | 811 (34.6%) | 1,403 (40.9%) |
| 6 or 7 Rooms | 775 (33.1%) | 501 (14.6%) |
| 8 or more Rooms | 758 (32.3%) | 99 (2.9%) |
| Total | 2,344 (100.0%) | 3,432 (100.0%) |
Housing Structure by Heating Type in Lyndon
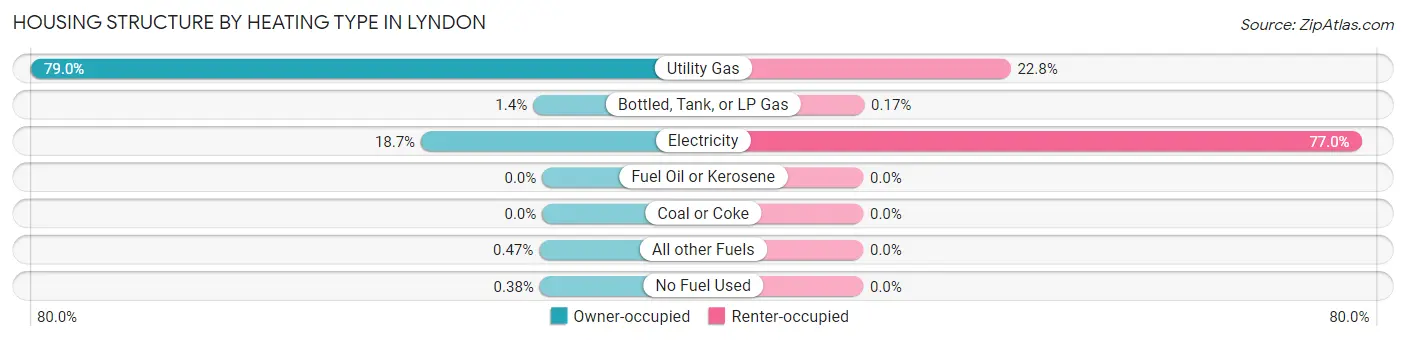
| Heating Type | Owner-occupied | Renter-occupied |
| Utility Gas | 1,852 (79.0%) | 782 (22.8%) |
| Bottled, Tank, or LP Gas | 33 (1.4%) | 6 (0.2%) |
| Electricity | 439 (18.7%) | 2,644 (77.0%) |
| Fuel Oil or Kerosene | 0 (0.0%) | 0 (0.0%) |
| Coal or Coke | 0 (0.0%) | 0 (0.0%) |
| All other Fuels | 11 (0.5%) | 0 (0.0%) |
| No Fuel Used | 9 (0.4%) | 0 (0.0%) |
| Total | 2,344 (100.0%) | 3,432 (100.0%) |
Household Vehicle Usage in Lyndon
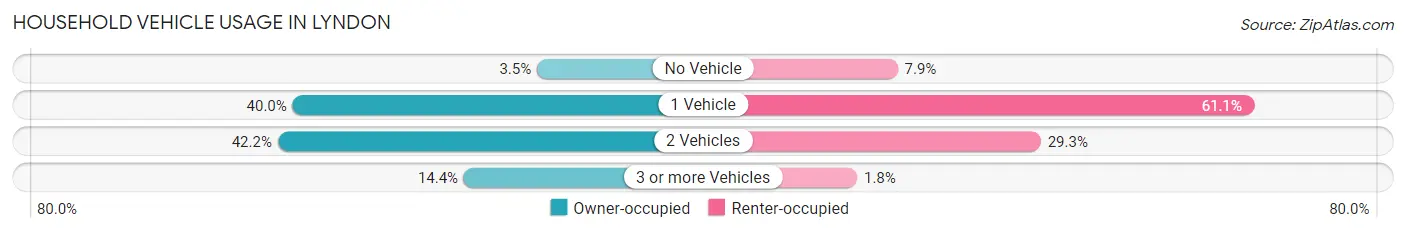
| Vehicles per Household | Owner-occupied | Renter-occupied |
| No Vehicle | 81 (3.5%) | 270 (7.9%) |
| 1 Vehicle | 937 (40.0%) | 2,096 (61.1%) |
| 2 Vehicles | 989 (42.2%) | 1,004 (29.2%) |
| 3 or more Vehicles | 337 (14.4%) | 62 (1.8%) |
| Total | 2,344 (100.0%) | 3,432 (100.0%) |
Real Estate & Mortgages in Lyndon
Real Estate and Mortgage Overview in Lyndon
| Characteristic | Without Mortgage | With Mortgage |
| Housing Units | 908 | 1,436 |
| Median Property Value | $270,100 | $245,500 |
| Median Household Income | $61,111 | $423 |
| Monthly Housing Costs | $650 | $104 |
| Real Estate Taxes | $2,014 | $24 |
Property Value by Mortgage Status in Lyndon
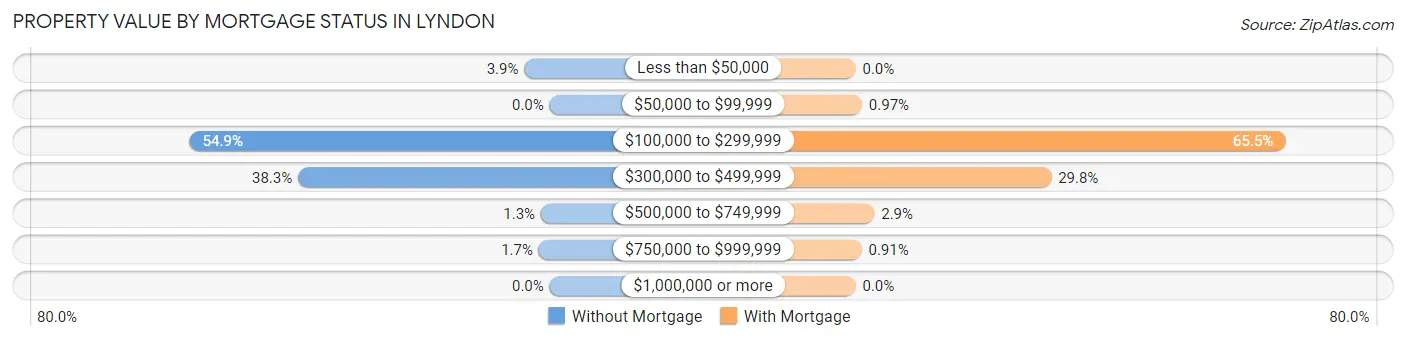
| Property Value | Without Mortgage | With Mortgage |
| Less than $50,000 | 35 (3.8%) | 0 (0.0%) |
| $50,000 to $99,999 | 0 (0.0%) | 14 (1.0%) |
| $100,000 to $299,999 | 498 (54.8%) | 940 (65.5%) |
| $300,000 to $499,999 | 348 (38.3%) | 428 (29.8%) |
| $500,000 to $749,999 | 12 (1.3%) | 41 (2.9%) |
| $750,000 to $999,999 | 15 (1.7%) | 13 (0.9%) |
| $1,000,000 or more | 0 (0.0%) | 0 (0.0%) |
| Total | 908 (100.0%) | 1,436 (100.0%) |
Household Income by Mortgage Status in Lyndon
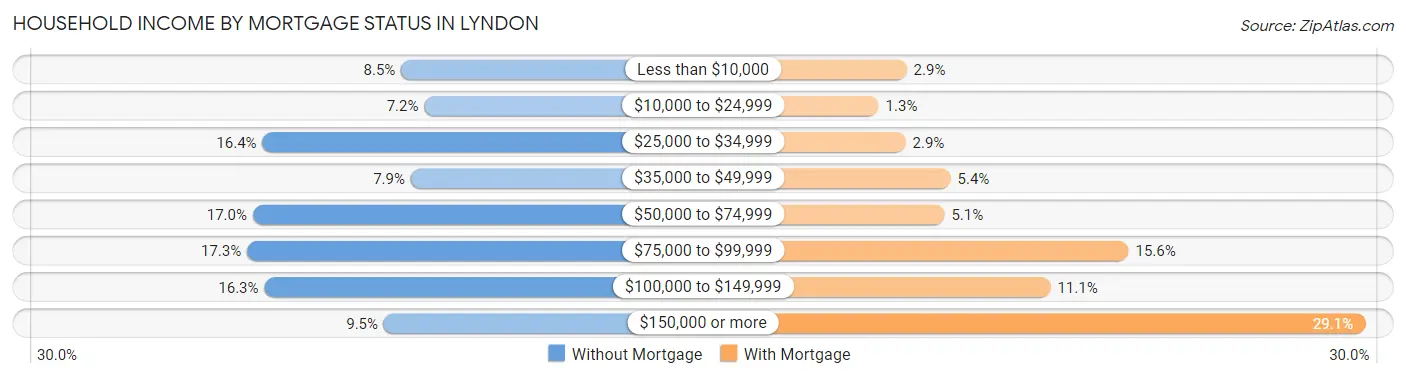
| Household Income | Without Mortgage | With Mortgage |
| Less than $10,000 | 77 (8.5%) | 42 (2.9%) |
| $10,000 to $24,999 | 65 (7.2%) | 19 (1.3%) |
| $25,000 to $34,999 | 149 (16.4%) | 41 (2.9%) |
| $35,000 to $49,999 | 72 (7.9%) | 78 (5.4%) |
| $50,000 to $74,999 | 154 (17.0%) | 73 (5.1%) |
| $75,000 to $99,999 | 157 (17.3%) | 224 (15.6%) |
| $100,000 to $149,999 | 148 (16.3%) | 160 (11.1%) |
| $150,000 or more | 86 (9.5%) | 418 (29.1%) |
| Total | 908 (100.0%) | 1,436 (100.0%) |
Property Value to Household Income Ratio in Lyndon
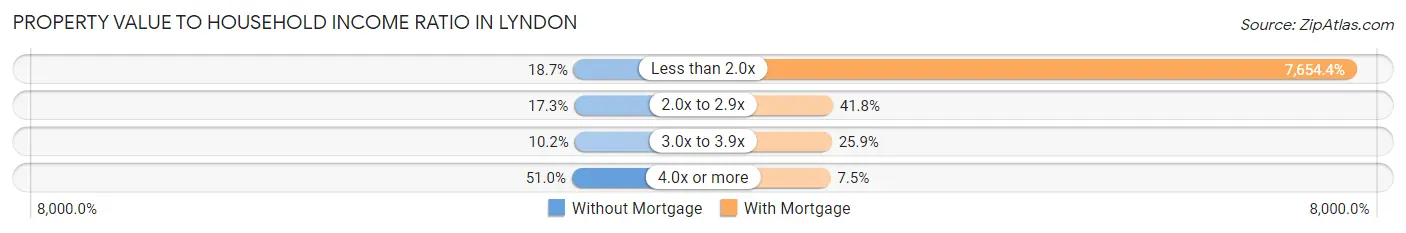
| Value-to-Income Ratio | Without Mortgage | With Mortgage |
| Less than 2.0x | 170 (18.7%) | 109,917 (7,654.4%) |
| 2.0x to 2.9x | 157 (17.3%) | 600 (41.8%) |
| 3.0x to 3.9x | 93 (10.2%) | 372 (25.9%) |
| 4.0x or more | 463 (51.0%) | 108 (7.5%) |
| Total | 908 (100.0%) | 1,436 (100.0%) |
Real Estate Taxes by Mortgage Status in Lyndon
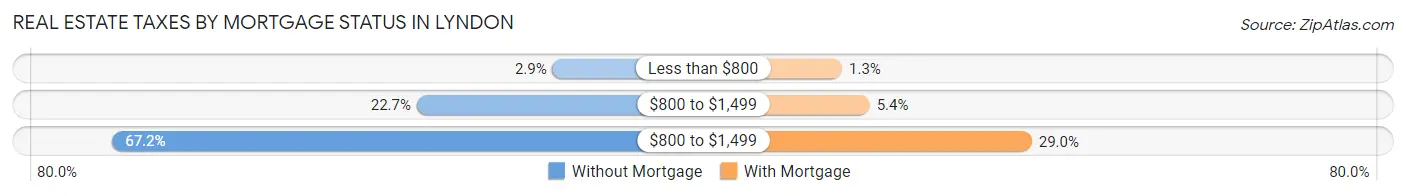
| Property Taxes | Without Mortgage | With Mortgage |
| Less than $800 | 26 (2.9%) | 19 (1.3%) |
| $800 to $1,499 | 206 (22.7%) | 77 (5.4%) |
| $800 to $1,499 | 610 (67.2%) | 417 (29.0%) |
| Total | 908 (100.0%) | 1,436 (100.0%) |
Health & Disability in Lyndon
Health Insurance Coverage by Age in Lyndon
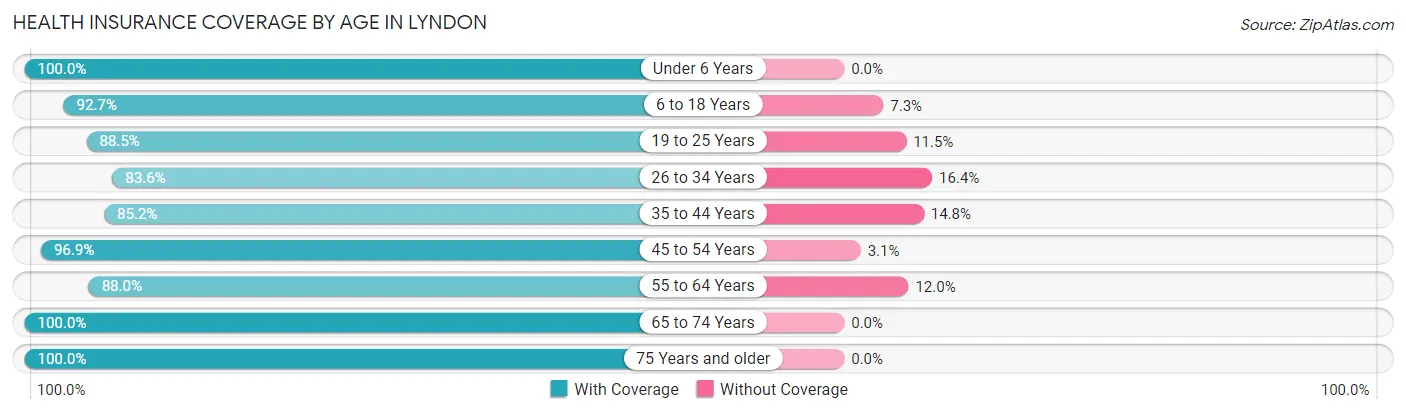
| Age Bracket | With Coverage | Without Coverage |
| Under 6 Years | 761 (100.0%) | 0 (0.0%) |
| 6 to 18 Years | 1,031 (92.7%) | 81 (7.3%) |
| 19 to 25 Years | 1,050 (88.5%) | 137 (11.5%) |
| 26 to 34 Years | 1,827 (83.6%) | 358 (16.4%) |
| 35 to 44 Years | 959 (85.2%) | 167 (14.8%) |
| 45 to 54 Years | 1,045 (96.9%) | 33 (3.1%) |
| 55 to 64 Years | 1,302 (88.0%) | 177 (12.0%) |
| 65 to 74 Years | 1,072 (100.0%) | 0 (0.0%) |
| 75 Years and older | 971 (100.0%) | 0 (0.0%) |
| Total | 10,018 (91.3%) | 953 (8.7%) |
Health Insurance Coverage by Citizenship Status in Lyndon
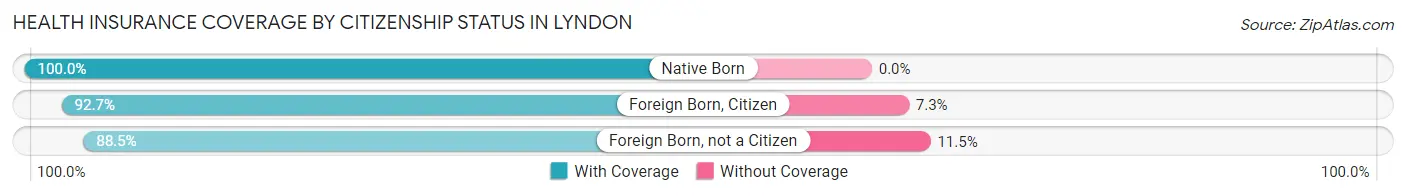
| Citizenship Status | With Coverage | Without Coverage |
| Native Born | 761 (100.0%) | 0 (0.0%) |
| Foreign Born, Citizen | 1,031 (92.7%) | 81 (7.3%) |
| Foreign Born, not a Citizen | 1,050 (88.5%) | 137 (11.5%) |
Health Insurance Coverage by Household Income in Lyndon
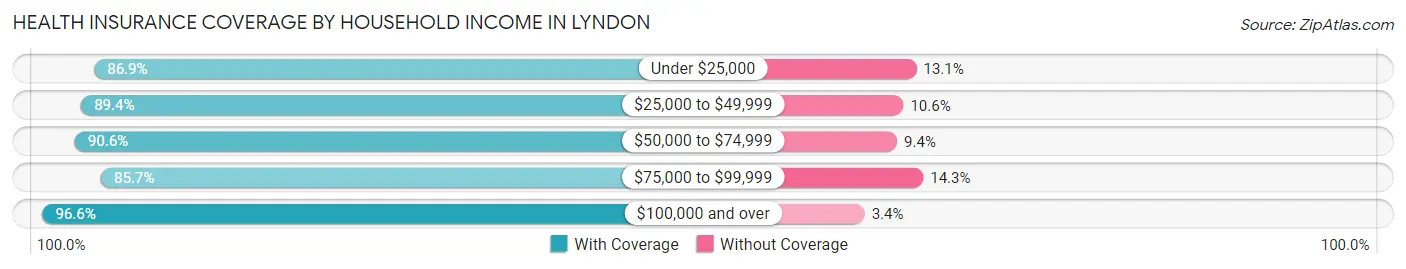
| Household Income | With Coverage | Without Coverage |
| Under $25,000 | 1,211 (86.9%) | 182 (13.1%) |
| $25,000 to $49,999 | 1,573 (89.4%) | 187 (10.6%) |
| $50,000 to $74,999 | 1,931 (90.6%) | 201 (9.4%) |
| $75,000 to $99,999 | 1,499 (85.7%) | 251 (14.3%) |
| $100,000 and over | 3,797 (96.6%) | 132 (3.4%) |
Public vs Private Health Insurance Coverage by Age in Lyndon
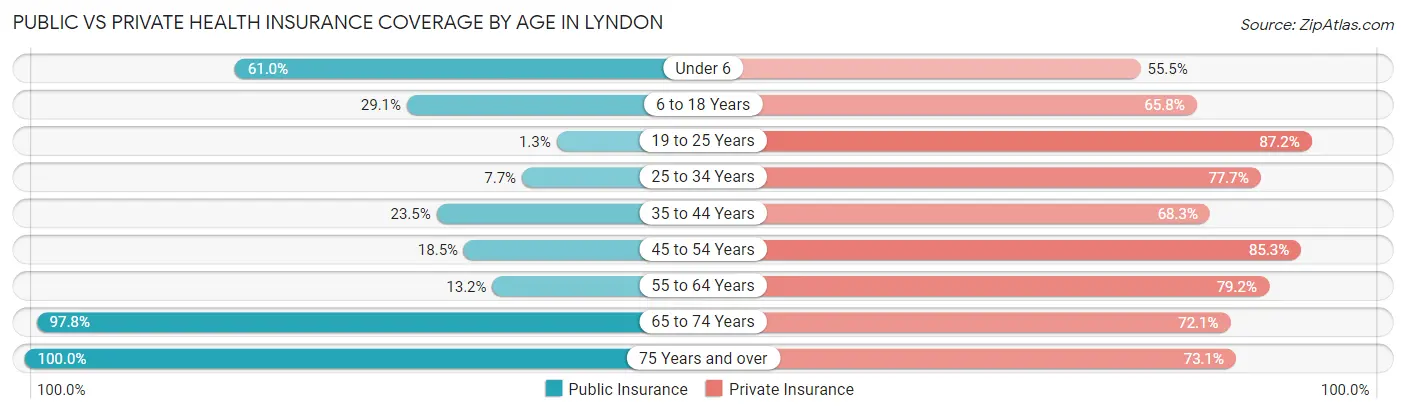
| Age Bracket | Public Insurance | Private Insurance |
| Under 6 | 464 (61.0%) | 422 (55.4%) |
| 6 to 18 Years | 323 (29.0%) | 732 (65.8%) |
| 19 to 25 Years | 15 (1.3%) | 1,035 (87.2%) |
| 25 to 34 Years | 168 (7.7%) | 1,698 (77.7%) |
| 35 to 44 Years | 265 (23.5%) | 769 (68.3%) |
| 45 to 54 Years | 199 (18.5%) | 919 (85.3%) |
| 55 to 64 Years | 195 (13.2%) | 1,172 (79.2%) |
| 65 to 74 Years | 1,048 (97.8%) | 773 (72.1%) |
| 75 Years and over | 971 (100.0%) | 710 (73.1%) |
| Total | 3,648 (33.3%) | 8,230 (75.0%) |
Disability Status by Sex by Age in Lyndon
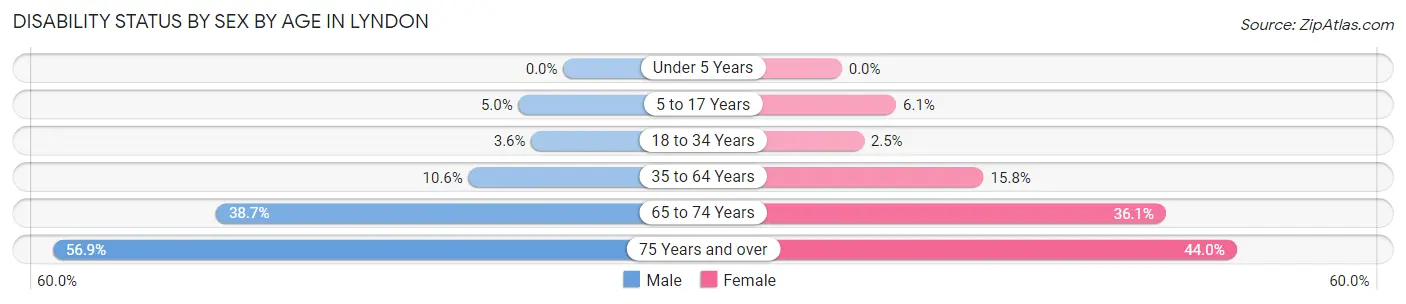
| Age Bracket | Male | Female |
| Under 5 Years | 0 (0.0%) | 0 (0.0%) |
| 5 to 17 Years | 29 (5.0%) | 32 (6.0%) |
| 18 to 34 Years | 65 (3.6%) | 41 (2.5%) |
| 35 to 64 Years | 179 (10.5%) | 314 (15.8%) |
| 65 to 74 Years | 152 (38.7%) | 245 (36.1%) |
| 75 Years and over | 195 (56.9%) | 276 (44.0%) |
Disability Class by Sex by Age in Lyndon
Disability Class: Hearing Difficulty
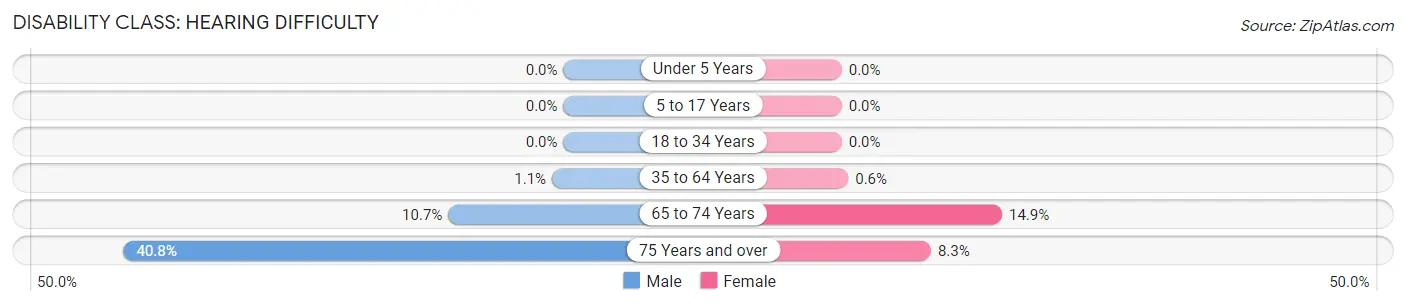
| Age Bracket | Male | Female |
| Under 5 Years | 0 (0.0%) | 0 (0.0%) |
| 5 to 17 Years | 0 (0.0%) | 0 (0.0%) |
| 18 to 34 Years | 0 (0.0%) | 0 (0.0%) |
| 35 to 64 Years | 18 (1.1%) | 12 (0.6%) |
| 65 to 74 Years | 42 (10.7%) | 101 (14.9%) |
| 75 Years and over | 140 (40.8%) | 52 (8.3%) |
Disability Class: Vision Difficulty
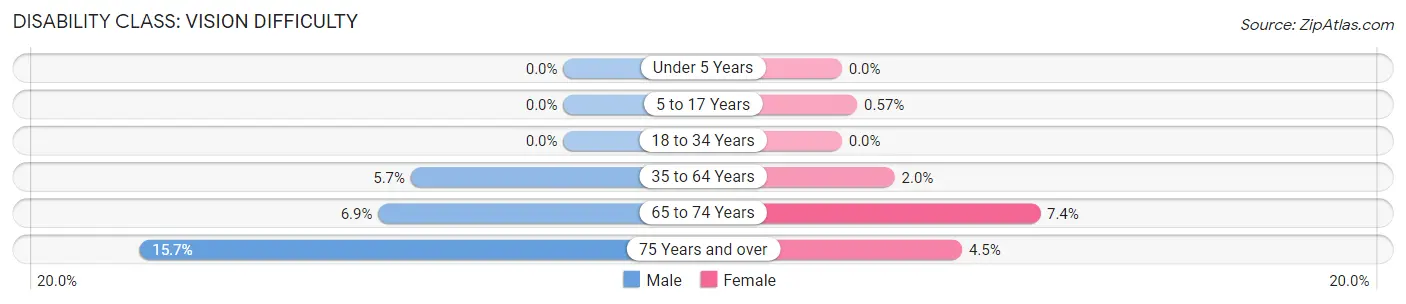
| Age Bracket | Male | Female |
| Under 5 Years | 0 (0.0%) | 0 (0.0%) |
| 5 to 17 Years | 0 (0.0%) | 3 (0.6%) |
| 18 to 34 Years | 0 (0.0%) | 0 (0.0%) |
| 35 to 64 Years | 96 (5.7%) | 39 (2.0%) |
| 65 to 74 Years | 27 (6.9%) | 50 (7.4%) |
| 75 Years and over | 54 (15.7%) | 28 (4.5%) |
Disability Class: Cognitive Difficulty
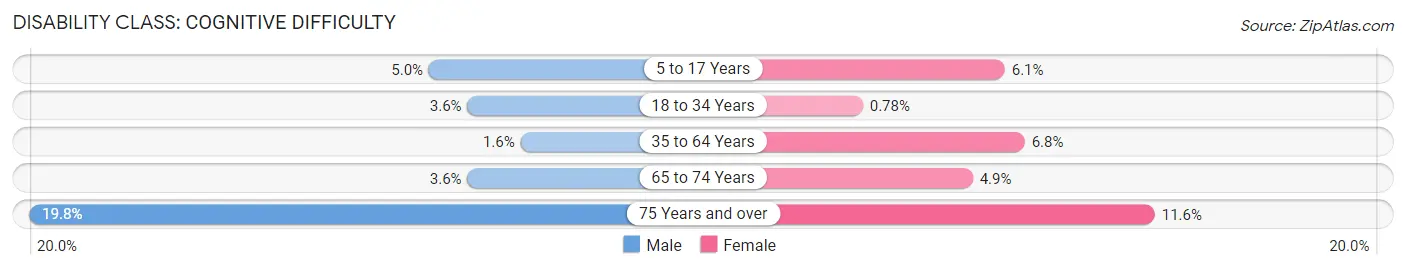
| Age Bracket | Male | Female |
| 5 to 17 Years | 29 (5.0%) | 32 (6.0%) |
| 18 to 34 Years | 65 (3.6%) | 13 (0.8%) |
| 35 to 64 Years | 27 (1.6%) | 135 (6.8%) |
| 65 to 74 Years | 14 (3.6%) | 33 (4.9%) |
| 75 Years and over | 68 (19.8%) | 73 (11.6%) |
Disability Class: Ambulatory Difficulty
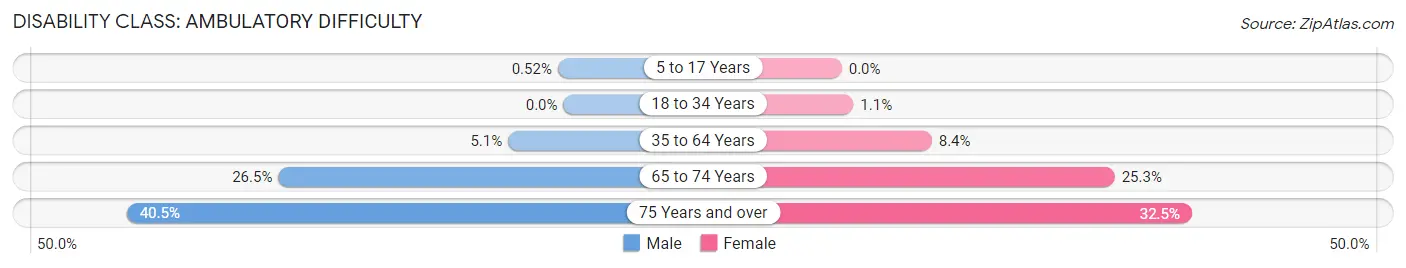
| Age Bracket | Male | Female |
| 5 to 17 Years | 3 (0.5%) | 0 (0.0%) |
| 18 to 34 Years | 0 (0.0%) | 18 (1.1%) |
| 35 to 64 Years | 87 (5.1%) | 166 (8.4%) |
| 65 to 74 Years | 104 (26.5%) | 172 (25.3%) |
| 75 Years and over | 139 (40.5%) | 204 (32.5%) |
Disability Class: Self-Care Difficulty
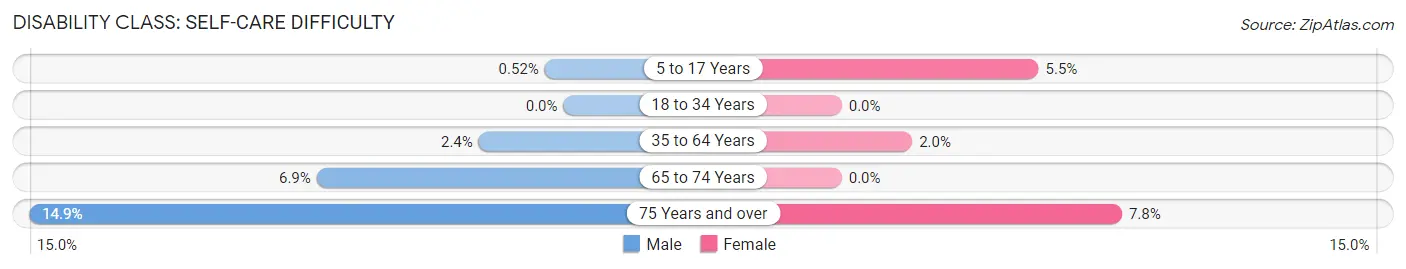
| Age Bracket | Male | Female |
| 5 to 17 Years | 3 (0.5%) | 29 (5.5%) |
| 18 to 34 Years | 0 (0.0%) | 0 (0.0%) |
| 35 to 64 Years | 40 (2.4%) | 39 (2.0%) |
| 65 to 74 Years | 27 (6.9%) | 0 (0.0%) |
| 75 Years and over | 51 (14.9%) | 49 (7.8%) |
Technology Access in Lyndon
Computing Device Access in Lyndon
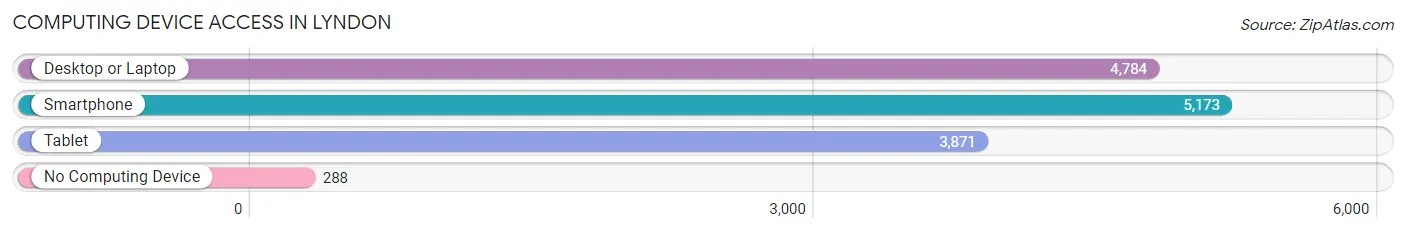
| Device Type | # Households | % Households |
| Desktop or Laptop | 4,784 | 82.8% |
| Smartphone | 5,173 | 89.6% |
| Tablet | 3,871 | 67.0% |
| No Computing Device | 288 | 5.0% |
| Total | 5,776 | 100.0% |
Internet Access in Lyndon
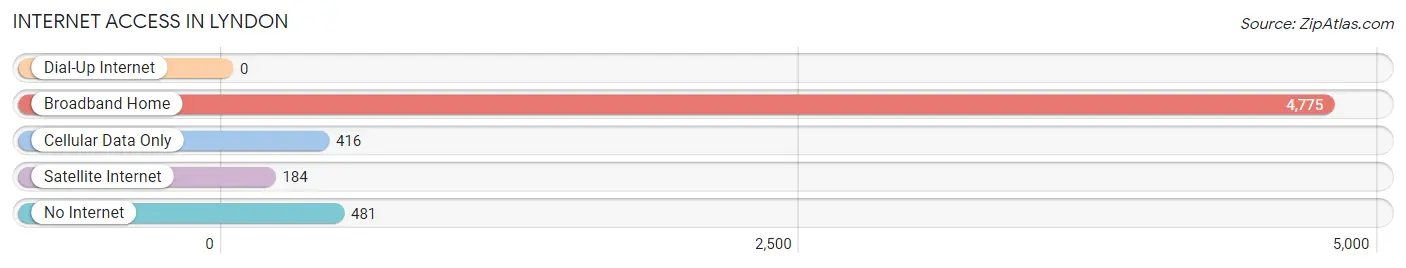
| Internet Type | # Households | % Households |
| Dial-Up Internet | 0 | 0.0% |
| Broadband Home | 4,775 | 82.7% |
| Cellular Data Only | 416 | 7.2% |
| Satellite Internet | 184 | 3.2% |
| No Internet | 481 | 8.3% |
| Total | 5,776 | 100.0% |
Lyndon Summary
Lyndon, Kentucky is a small city located in Jefferson County, Kentucky. It is a suburb of Louisville and is part of the Louisville Metro area. The city has a population of 8,819 as of the 2010 census.
History
The area that is now Lyndon was first settled in the early 1800s by a group of settlers from Virginia. The area was originally known as "The Crossroads" due to its location at the intersection of two major roads. In 1851, the area was renamed Lyndon after the nearby Lyndon Hall, which was named after the family of William Lyne, a prominent local landowner.
The city was officially incorporated in 1872 and was home to a variety of businesses, including a flour mill, a sawmill, a grist mill, and a distillery. The city also had a number of churches, including the Lyndon Methodist Church, which was founded in 1871.
In the late 19th century, the city was home to a number of prominent citizens, including William Lyne, who served as mayor from 1872 to 1876. Lyne was also a prominent businessman and was instrumental in the development of the city.
Geography
Lyndon is located in Jefferson County, Kentucky, approximately 8 miles southeast of downtown Louisville. The city is situated on the banks of the Ohio River and is bordered by the cities of St. Matthews, Middletown, and Anchorage.
The city has a total area of 2.3 square miles, all of which is land. The terrain is mostly flat, with some rolling hills in the northern part of the city.
Economy
The economy of Lyndon is largely based on the service industry. The city is home to a number of restaurants, retail stores, and other businesses. The city is also home to a number of corporate offices, including those of Humana, Brown-Forman, and Yum! Brands.
The city is also home to a number of educational institutions, including the University of Louisville, Jefferson Community and Technical College, and the Kentucky School for the Blind.
Demographics
As of the 2010 census, the population of Lyndon was 8,819. The racial makeup of the city was 79.2% White, 15.2% African American, 0.3% Native American, 1.7% Asian, 0.1% Pacific Islander, 1.2% from other races, and 2.4% from two or more races. Hispanic or Latino of any race were 3.2% of the population.
The median household income in Lyndon was $50,945, and the median family income was $60,945. The per capita income for the city was $25,945. About 8.2% of families and 10.2% of the population were below the poverty line, including 14.2% of those under age 18 and 6.2% of those age 65 or over.
Common Questions
What is Per Capita Income in Lyndon?
Per Capita income in Lyndon is $43,732.
What is the Median Family Income in Lyndon?
Median Family Income in Lyndon is $92,411.
What is the Median Household income in Lyndon?
Median Household Income in Lyndon is $63,806.
What is Income or Wage Gap in Lyndon?
Income or Wage Gap in Lyndon is 10.2%.
Women in Lyndon earn 89.8 cents for every dollar earned by a man.
What is Inequality or Gini Index in Lyndon?
Inequality or Gini Index in Lyndon is 0.45.
What is the Total Population of Lyndon?
Total Population of Lyndon is 10,997.
What is the Total Male Population of Lyndon?
Total Male Population of Lyndon is 5,063.
What is the Total Female Population of Lyndon?
Total Female Population of Lyndon is 5,934.
What is the Ratio of Males per 100 Females in Lyndon?
There are 85.32 Males per 100 Females in Lyndon.
What is the Ratio of Females per 100 Males in Lyndon?
There are 117.20 Females per 100 Males in Lyndon.
What is the Median Population Age in Lyndon?
Median Population Age in Lyndon is 36.3 Years.
What is the Average Family Size in Lyndon
Average Family Size in Lyndon is 2.7 People.
What is the Average Household Size in Lyndon
Average Household Size in Lyndon is 1.9 People.
How Large is the Labor Force in Lyndon?
There are 6,754 People in the Labor Forcein in Lyndon.
What is the Percentage of People in the Labor Force in Lyndon?
71.4% of People are in the Labor Force in Lyndon.
What is the Unemployment Rate in Lyndon?
Unemployment Rate in Lyndon is 4.0%.