Southgate, KY Map & Demographics
Southgate Map
Southgate Overview
$33,831
PER CAPITA INCOME
$68,466
AVG FAMILY INCOME
$54,107
AVG HOUSEHOLD INCOME
25.0%
WAGE / INCOME GAP [ % ]
75.0¢/ $1
WAGE / INCOME GAP [ $ ]
0.44
INEQUALITY / GINI INDEX
3,677
TOTAL POPULATION
1,650
MALE POPULATION
2,027
FEMALE POPULATION
81.40
MALES / 100 FEMALES
122.85
FEMALES / 100 MALES
33.9
MEDIAN AGE
2.7
AVG FAMILY SIZE
2.0
AVG HOUSEHOLD SIZE
2,156
LABOR FORCE [ PEOPLE ]
74.9%
PERCENT IN LABOR FORCE
4.6%
UNEMPLOYMENT RATE
Southgate Area Codes
Income in Southgate
Income Overview in Southgate
Per Capita Income in Southgate is $33,831, while median incomes of families and households are $68,466 and $54,107 respectively.
| Characteristic | Number | Measure |
| Per Capita Income | 3,677 | $33,831 |
| Median Family Income | 959 | $68,466 |
| Mean Family Income | 959 | $81,502 |
| Median Household Income | 1,823 | $54,107 |
| Mean Household Income | 1,823 | $68,449 |
| Income Deficit | 959 | $0 |
| Wage / Income Gap (%) | 3,677 | 24.95% |
| Wage / Income Gap ($) | 3,677 | 75.05¢ per $1 |
| Gini / Inequality Index | 3,677 | 0.44 |
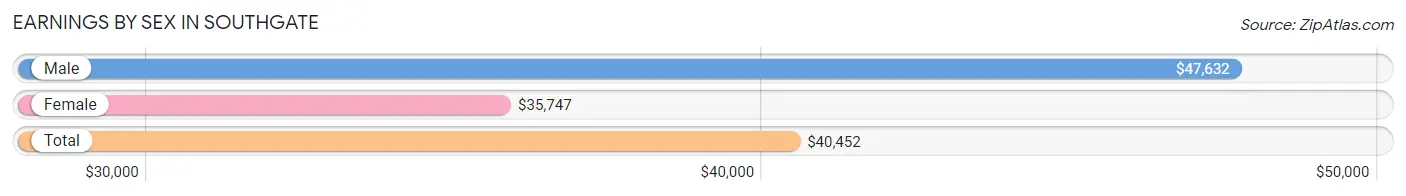
Earnings by Sex in Southgate
Average Earnings in Southgate are $40,452, $47,632 for men and $35,747 for women, a difference of 24.9%.
| Sex | Number | Average Earnings |
| Male | 976 (43.9%) | $47,632 |
| Female | 1,250 (56.1%) | $35,747 |
| Total | 2,226 (100.0%) | $40,452 |
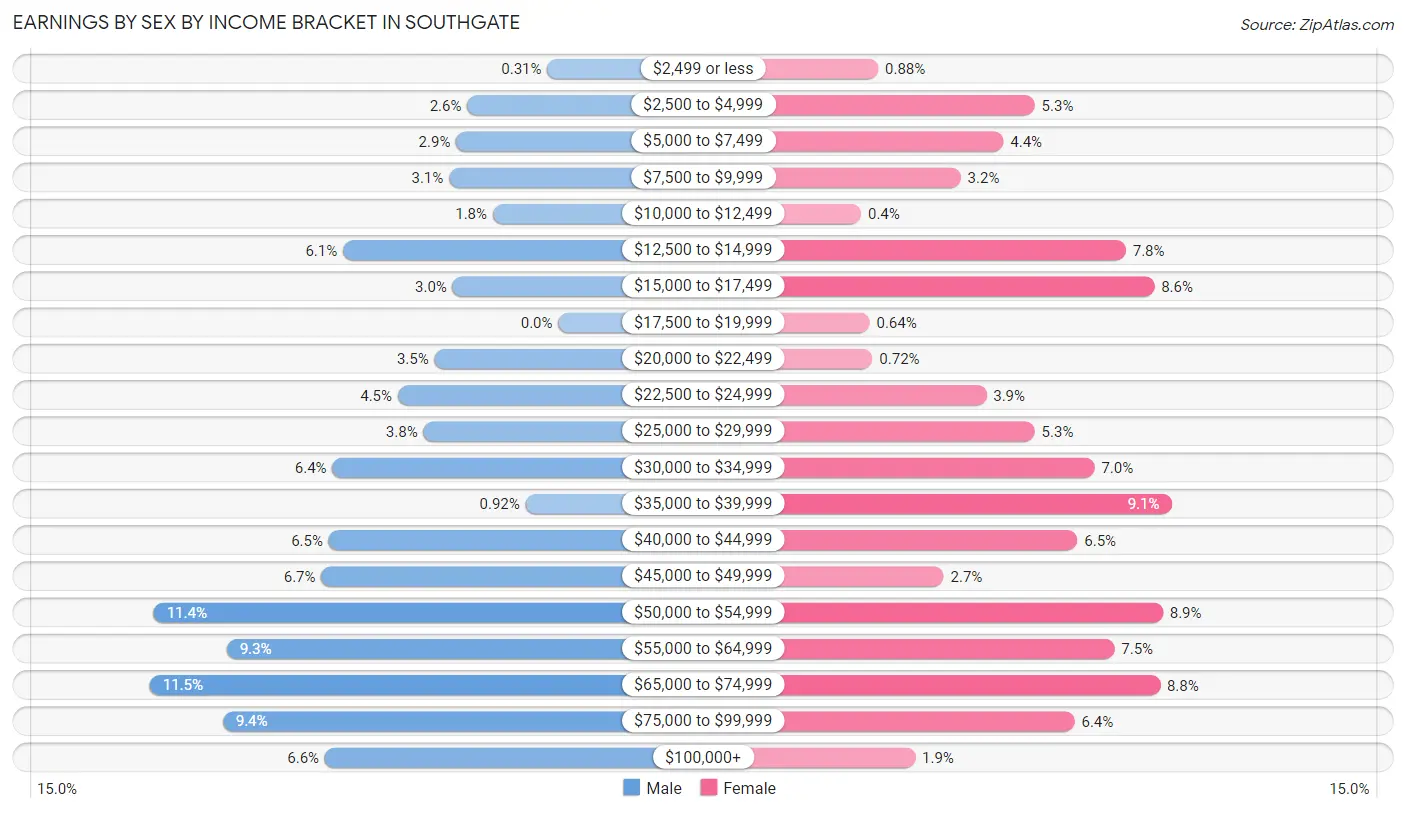
Earnings by Sex by Income Bracket in Southgate
The most common earnings brackets in Southgate are $65,000 to $74,999 for men (112 | 11.5%) and $35,000 to $39,999 for women (114 | 9.1%).
| Income | Male | Female |
| $2,499 or less | 3 (0.3%) | 11 (0.9%) |
| $2,500 to $4,999 | 25 (2.6%) | 66 (5.3%) |
| $5,000 to $7,499 | 28 (2.9%) | 55 (4.4%) |
| $7,500 to $9,999 | 30 (3.1%) | 40 (3.2%) |
| $10,000 to $12,499 | 18 (1.8%) | 5 (0.4%) |
| $12,500 to $14,999 | 59 (6.0%) | 98 (7.8%) |
| $15,000 to $17,499 | 29 (3.0%) | 108 (8.6%) |
| $17,500 to $19,999 | 0 (0.0%) | 8 (0.6%) |
| $20,000 to $22,499 | 34 (3.5%) | 9 (0.7%) |
| $22,500 to $24,999 | 44 (4.5%) | 49 (3.9%) |
| $25,000 to $29,999 | 37 (3.8%) | 66 (5.3%) |
| $30,000 to $34,999 | 62 (6.4%) | 87 (7.0%) |
| $35,000 to $39,999 | 9 (0.9%) | 114 (9.1%) |
| $40,000 to $44,999 | 63 (6.5%) | 81 (6.5%) |
| $45,000 to $49,999 | 65 (6.7%) | 34 (2.7%) |
| $50,000 to $54,999 | 111 (11.4%) | 111 (8.9%) |
| $55,000 to $64,999 | 91 (9.3%) | 94 (7.5%) |
| $65,000 to $74,999 | 112 (11.5%) | 110 (8.8%) |
| $75,000 to $99,999 | 92 (9.4%) | 80 (6.4%) |
| $100,000+ | 64 (6.6%) | 24 (1.9%) |
| Total | 976 (100.0%) | 1,250 (100.0%) |
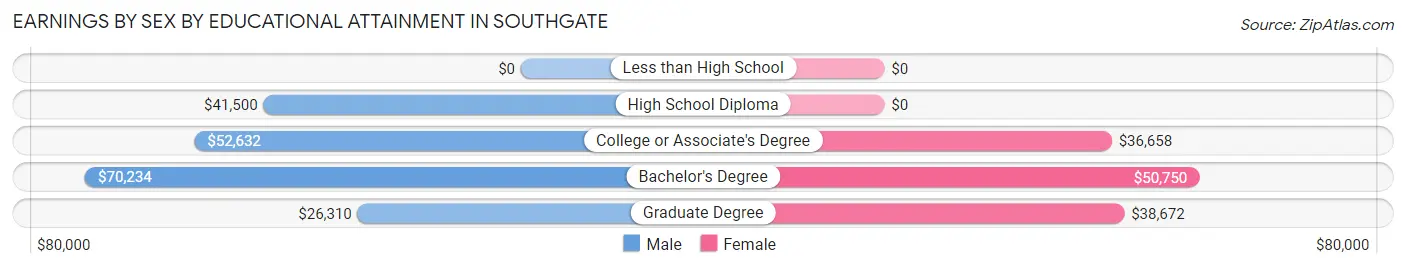
Earnings by Sex by Educational Attainment in Southgate
Average earnings in Southgate are $52,402 for men and $35,925 for women, a difference of 31.4%. Men with an educational attainment of bachelor's degree enjoy the highest average annual earnings of $70,234, while those with graduate degree education earn the least with $26,310. Women with an educational attainment of bachelor's degree earn the most with the average annual earnings of $50,750, while those with college or associate's degree education have the smallest earnings of $36,658.
| Educational Attainment | Male Income | Female Income |
| Less than High School | - | - |
| High School Diploma | $41,500 | $0 |
| College or Associate's Degree | $52,632 | $36,658 |
| Bachelor's Degree | $70,234 | $50,750 |
| Graduate Degree | $26,310 | $38,672 |
| Total | $52,402 | $35,925 |
Family Income in Southgate
Family Income Brackets in Southgate
According to the Southgate family income data, there are 201 families falling into the $50,000 to $74,999 income range, which is the most common income bracket and makes up 21.0% of all families. Conversely, the $10,000 to $14,999 income bracket is the least frequent group with only 16 families (1.7%) belonging to this category.
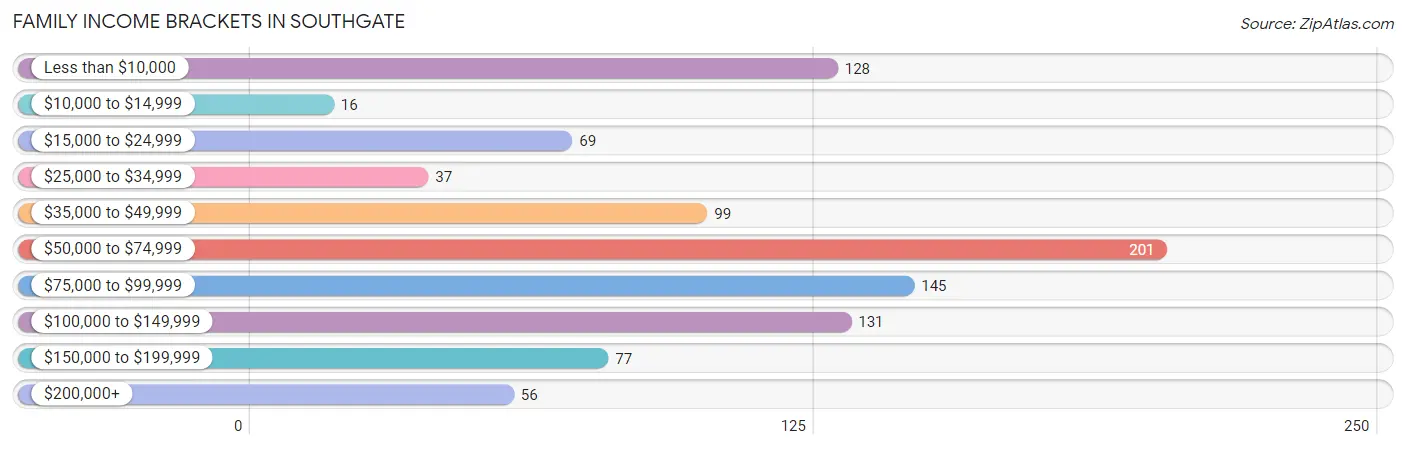
| Income Bracket | # Families | % Families |
| Less than $10,000 | 128 | 13.3% |
| $10,000 to $14,999 | 16 | 1.7% |
| $15,000 to $24,999 | 69 | 7.2% |
| $25,000 to $34,999 | 37 | 3.9% |
| $35,000 to $49,999 | 99 | 10.3% |
| $50,000 to $74,999 | 201 | 21.0% |
| $75,000 to $99,999 | 145 | 15.1% |
| $100,000 to $149,999 | 131 | 13.7% |
| $150,000 to $199,999 | 77 | 8.0% |
| $200,000+ | 56 | 5.8% |
Family Income by Famaliy Size in Southgate
5-person families (37 | 3.9%) account for the highest median family income in Southgate with $172,344 per family, while 5-person families (37 | 3.9%) have the highest median income of $34,469 per family member.
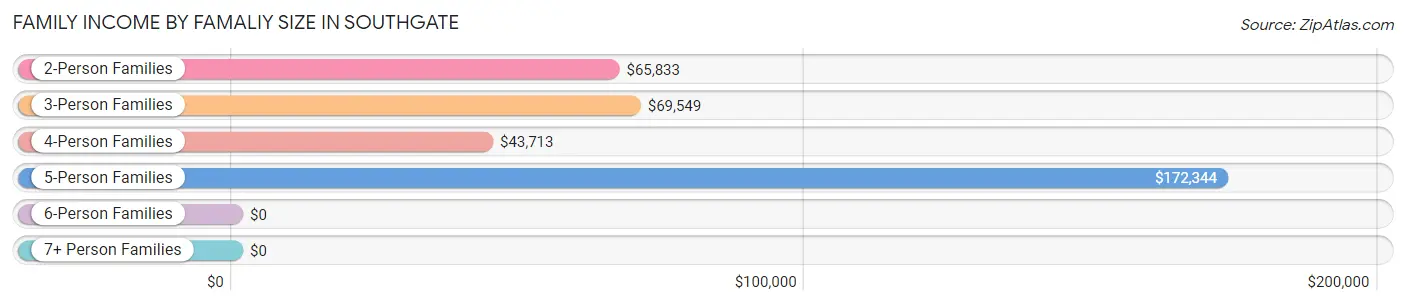
| Income Bracket | # Families | Median Income |
| 2-Person Families | 504 (52.5%) | $65,833 |
| 3-Person Families | 229 (23.9%) | $69,549 |
| 4-Person Families | 185 (19.3%) | $43,713 |
| 5-Person Families | 37 (3.9%) | $172,344 |
| 6-Person Families | 0 (0.0%) | $0 |
| 7+ Person Families | 4 (0.4%) | $0 |
| Total | 959 (100.0%) | $68,466 |
Family Income by Number of Earners in Southgate
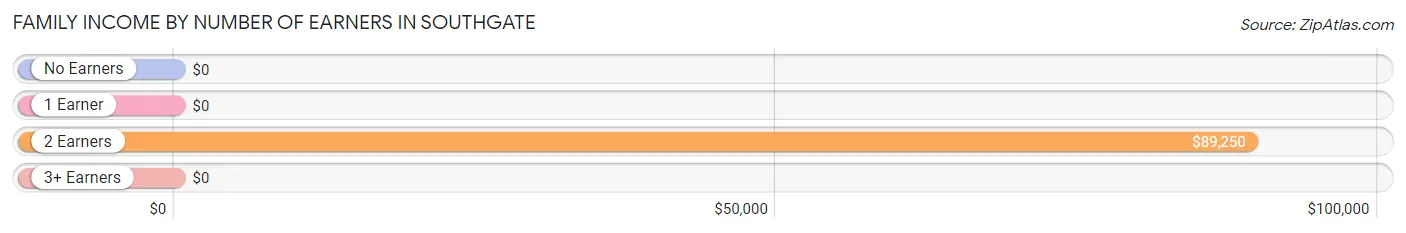
| Number of Earners | # Families | Median Income |
| No Earners | 155 (16.2%) | $0 |
| 1 Earner | 313 (32.6%) | $0 |
| 2 Earners | 424 (44.2%) | $89,250 |
| 3+ Earners | 67 (7.0%) | $0 |
| Total | 959 (100.0%) | $68,466 |
Household Income in Southgate
Household Income Brackets in Southgate
With 414 households falling in the category, the $50,000 to $74,999 income range is the most frequent in Southgate, accounting for 22.7% of all households. In contrast, only 47 households (2.6%) fall into the $10,000 to $14,999 income bracket, making it the least populous group.
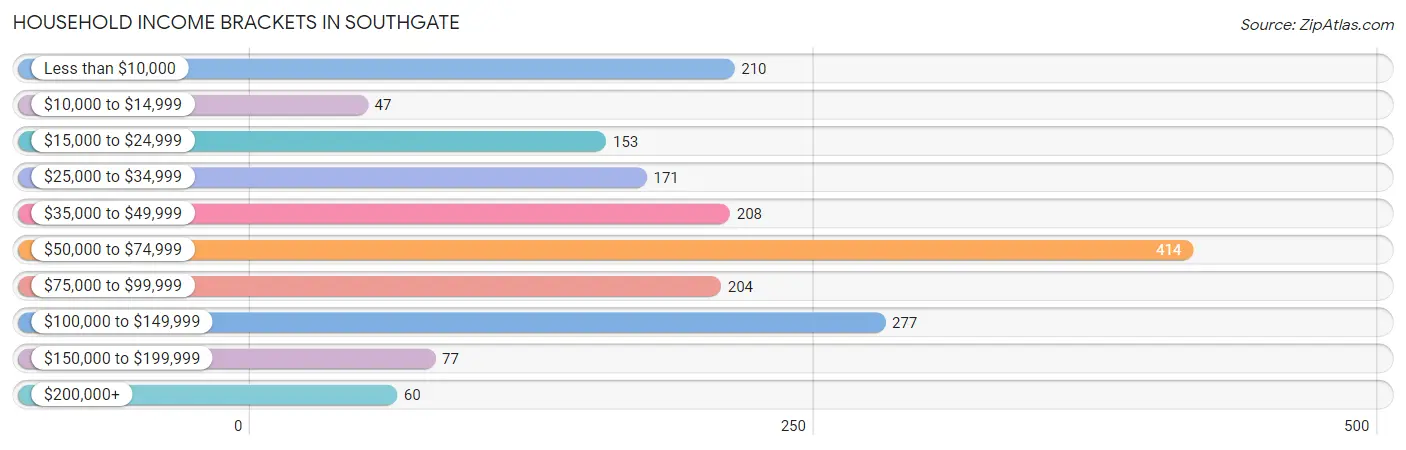
| Income Bracket | # Households | % Households |
| Less than $10,000 | 210 | 11.5% |
| $10,000 to $14,999 | 47 | 2.6% |
| $15,000 to $24,999 | 153 | 8.4% |
| $25,000 to $34,999 | 171 | 9.4% |
| $35,000 to $49,999 | 208 | 11.4% |
| $50,000 to $74,999 | 414 | 22.7% |
| $75,000 to $99,999 | 204 | 11.2% |
| $100,000 to $149,999 | 277 | 15.2% |
| $150,000 to $199,999 | 77 | 4.2% |
| $200,000+ | 60 | 3.3% |
Household Income by Householder Age in Southgate
The median household income in Southgate is $54,107, with the highest median household income of $67,821 found in the 45 to 64 years age bracket for the primary householder. A total of 516 households (28.3%) fall into this category. Meanwhile, the 15 to 24 years age bracket for the primary householder has the lowest median household income of $0, with 130 households (7.1%) in this group.
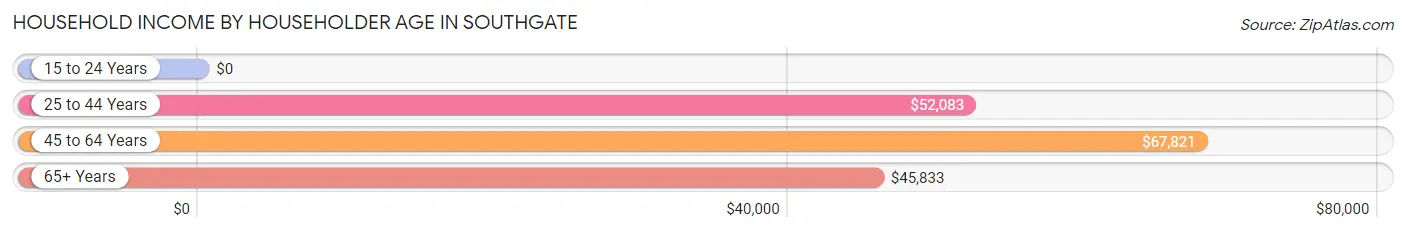
| Income Bracket | # Households | Median Income |
| 15 to 24 Years | 130 (7.1%) | $0 |
| 25 to 44 Years | 867 (47.6%) | $52,083 |
| 45 to 64 Years | 516 (28.3%) | $67,821 |
| 65+ Years | 310 (17.0%) | $45,833 |
| Total | 1,823 (100.0%) | $54,107 |
Poverty in Southgate
Income Below Poverty by Sex and Age in Southgate
With 19.9% poverty level for males and 20.2% for females among the residents of Southgate, 15 year old males and 16 and 17 year old females are the most vulnerable to poverty, with 19 males (100.0%) and 12 females (75.0%) in their respective age groups living below the poverty level.
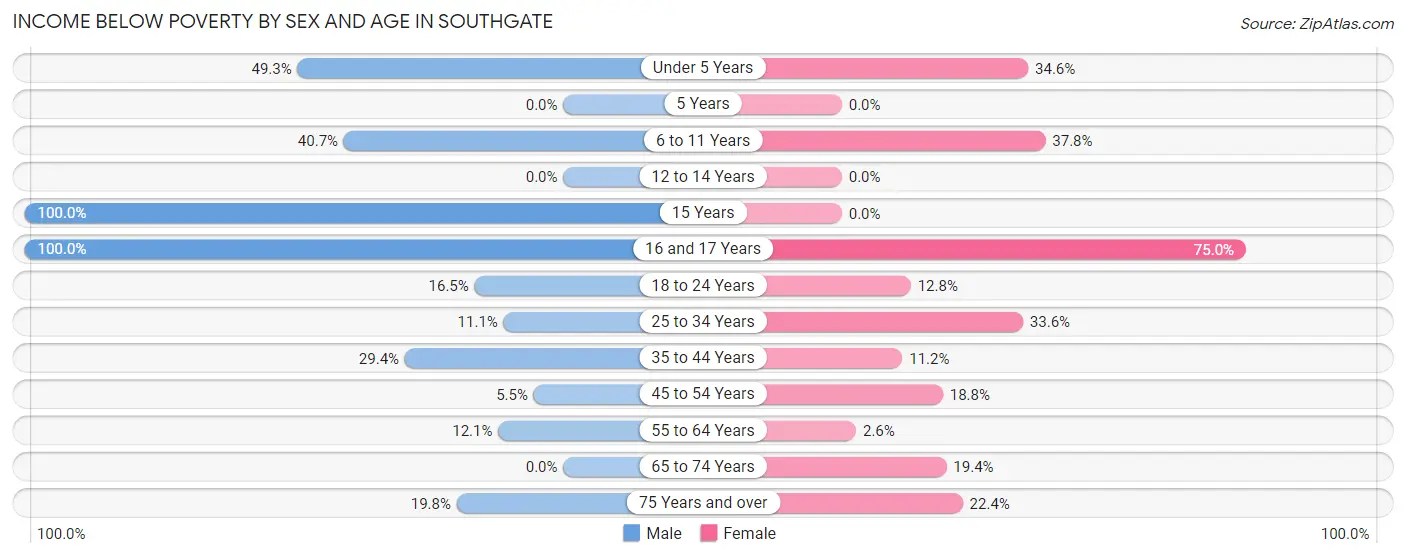
| Age Bracket | Male | Female |
| Under 5 Years | 37 (49.3%) | 37 (34.6%) |
| 5 Years | 0 (0.0%) | 0 (0.0%) |
| 6 to 11 Years | 101 (40.7%) | 99 (37.8%) |
| 12 to 14 Years | 0 (0.0%) | 0 (0.0%) |
| 15 Years | 19 (100.0%) | 0 (0.0%) |
| 16 and 17 Years | 14 (100.0%) | 12 (75.0%) |
| 18 to 24 Years | 28 (16.5%) | 16 (12.8%) |
| 25 to 34 Years | 42 (11.1%) | 119 (33.6%) |
| 35 to 44 Years | 30 (29.4%) | 43 (11.2%) |
| 45 to 54 Years | 8 (5.5%) | 24 (18.8%) |
| 55 to 64 Years | 32 (12.1%) | 9 (2.6%) |
| 65 to 74 Years | 0 (0.0%) | 27 (19.4%) |
| 75 Years and over | 18 (19.8%) | 24 (22.4%) |
| Total | 329 (19.9%) | 410 (20.2%) |
Income Above Poverty by Sex and Age in Southgate
According to the poverty statistics in Southgate, males aged 5 years and females aged 5 years are the age groups that are most secure financially, with 100.0% of males and 100.0% of females in these age groups living above the poverty line.
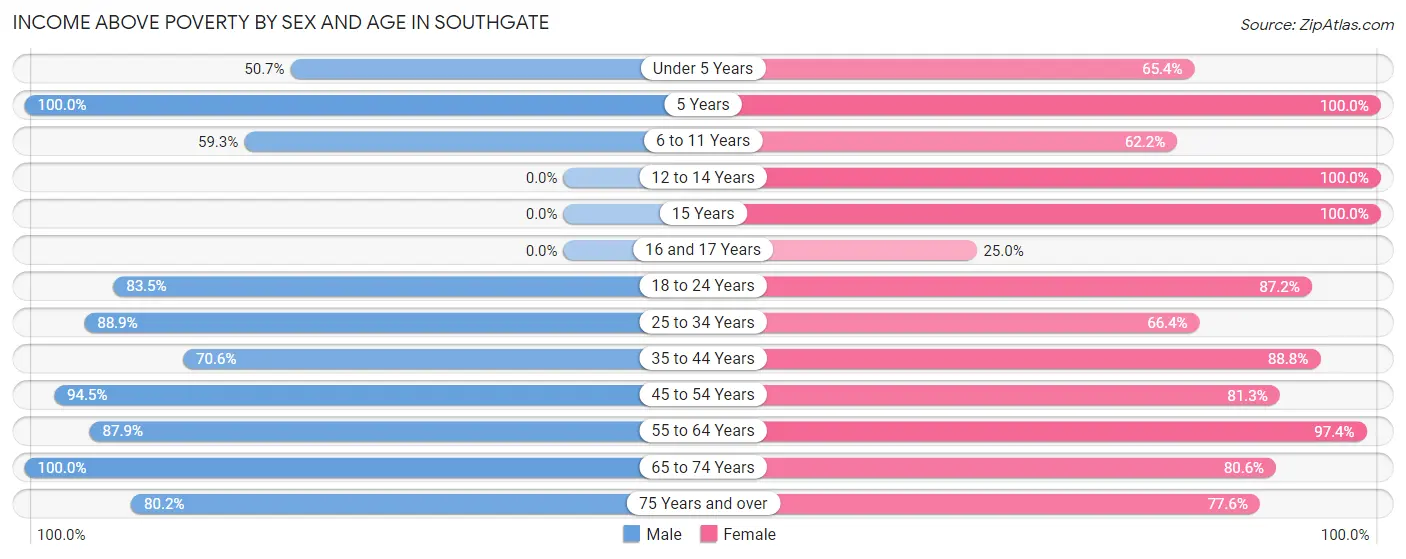
| Age Bracket | Male | Female |
| Under 5 Years | 38 (50.7%) | 70 (65.4%) |
| 5 Years | 22 (100.0%) | 7 (100.0%) |
| 6 to 11 Years | 147 (59.3%) | 163 (62.2%) |
| 12 to 14 Years | 0 (0.0%) | 42 (100.0%) |
| 15 Years | 0 (0.0%) | 16 (100.0%) |
| 16 and 17 Years | 0 (0.0%) | 4 (25.0%) |
| 18 to 24 Years | 142 (83.5%) | 109 (87.2%) |
| 25 to 34 Years | 337 (88.9%) | 235 (66.4%) |
| 35 to 44 Years | 72 (70.6%) | 340 (88.8%) |
| 45 to 54 Years | 138 (94.5%) | 104 (81.2%) |
| 55 to 64 Years | 233 (87.9%) | 332 (97.4%) |
| 65 to 74 Years | 119 (100.0%) | 112 (80.6%) |
| 75 Years and over | 73 (80.2%) | 83 (77.6%) |
| Total | 1,321 (80.1%) | 1,617 (79.8%) |
Income Below Poverty Among Married-Couple Families in Southgate
The poverty statistics for married-couple families in Southgate show that 1.1% or 5 of the total 462 families live below the poverty line. Families with no children have the highest poverty rate of 1.4%, comprising of 5 families. On the other hand, families with 1 or 2 children have the lowest poverty rate of 0.0%, which includes 0 families.
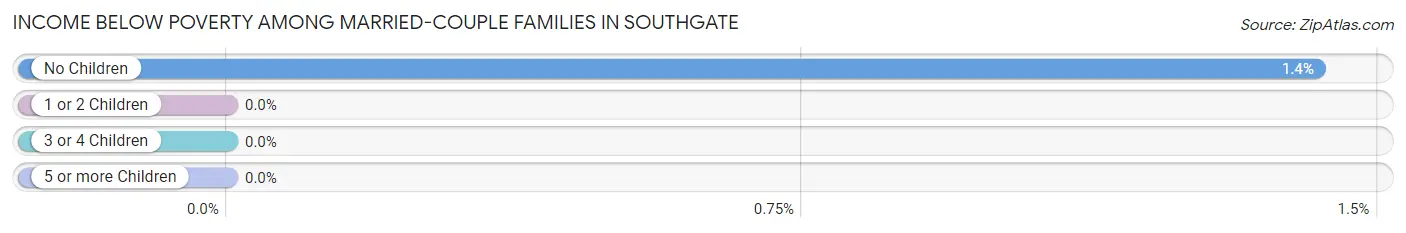
| Children | Above Poverty | Below Poverty |
| No Children | 347 (98.6%) | 5 (1.4%) |
| 1 or 2 Children | 106 (100.0%) | 0 (0.0%) |
| 3 or 4 Children | 4 (100.0%) | 0 (0.0%) |
| 5 or more Children | 0 (0.0%) | 0 (0.0%) |
| Total | 457 (98.9%) | 5 (1.1%) |
Income Below Poverty Among Single-Parent Households in Southgate
According to the poverty data in Southgate, 53.4% or 55 single-father households and 35.3% or 139 single-mother households are living below the poverty line. Among single-father households, those with no children have the highest poverty rate, with 8 households (72.7%) experiencing poverty. Likewise, among single-mother households, those with 3 or 4 children have the highest poverty rate, with 40 households (66.7%) falling below the poverty line.
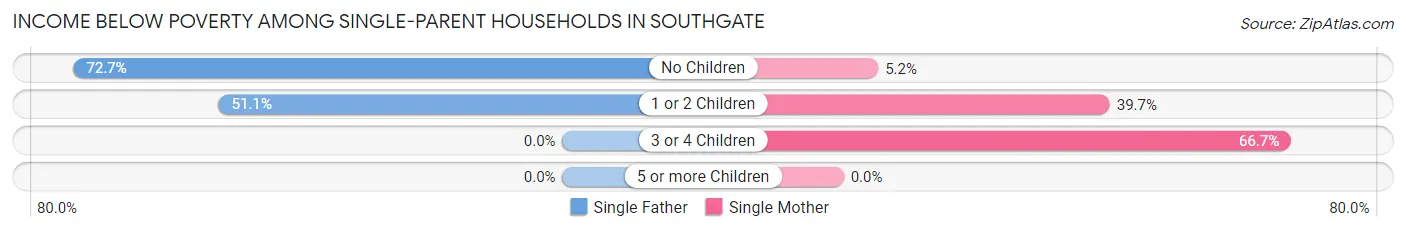
| Children | Single Father | Single Mother |
| No Children | 8 (72.7%) | 5 (5.1%) |
| 1 or 2 Children | 47 (51.1%) | 94 (39.7%) |
| 3 or 4 Children | 0 (0.0%) | 40 (66.7%) |
| 5 or more Children | 0 (0.0%) | 0 (0.0%) |
| Total | 55 (53.4%) | 139 (35.3%) |
Income Below Poverty Among Married-Couple vs Single-Parent Households in Southgate
The poverty data for Southgate shows that 5 of the married-couple family households (1.1%) and 194 of the single-parent households (39.0%) are living below the poverty level. Within the married-couple family households, those with no children have the highest poverty rate, with 5 households (1.4%) falling below the poverty line. Among the single-parent households, those with 3 or 4 children have the highest poverty rate, with 40 household (66.7%) living below poverty.
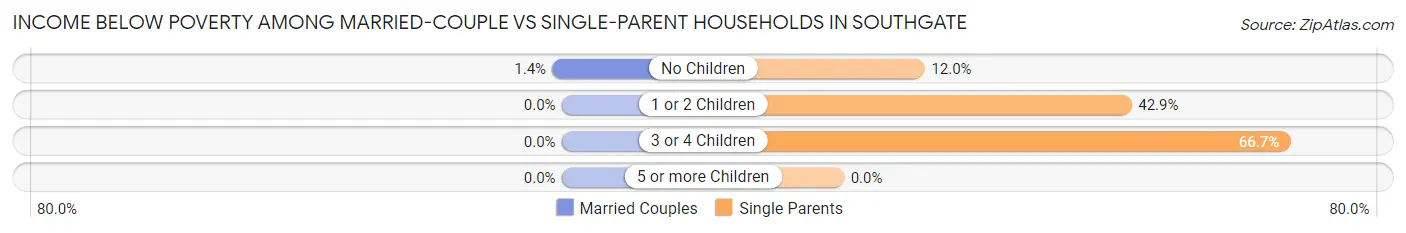
| Children | Married-Couple Families | Single-Parent Households |
| No Children | 5 (1.4%) | 13 (12.0%) |
| 1 or 2 Children | 0 (0.0%) | 141 (42.9%) |
| 3 or 4 Children | 0 (0.0%) | 40 (66.7%) |
| 5 or more Children | 0 (0.0%) | 0 (0.0%) |
| Total | 5 (1.1%) | 194 (39.0%) |
Race in Southgate
The most populous races in Southgate are White / Caucasian (3,276 | 89.1%), Black / African American (291 | 7.9%), and Asian (61 | 1.7%).
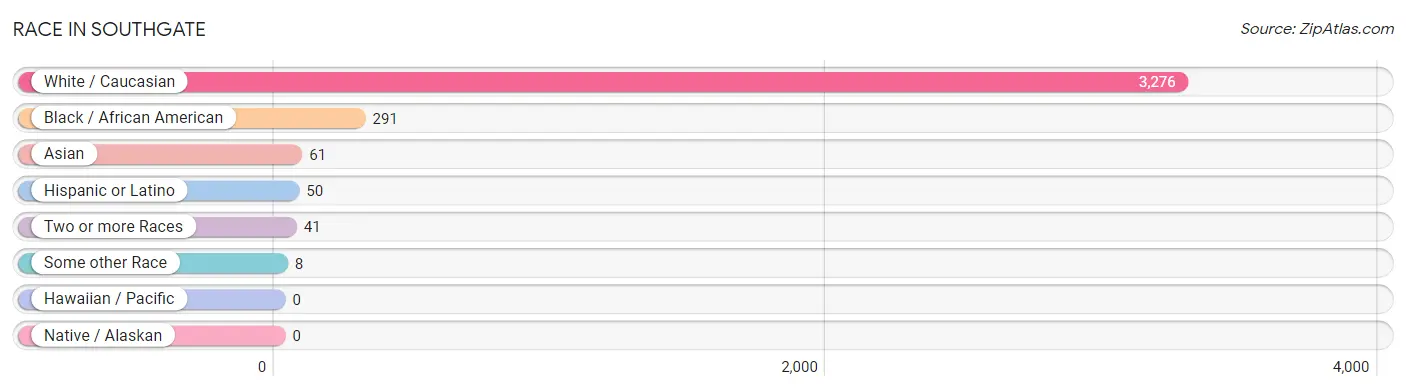
| Race | # Population | % Population |
| Asian | 61 | 1.7% |
| Black / African American | 291 | 7.9% |
| Hawaiian / Pacific | 0 | 0.0% |
| Hispanic or Latino | 50 | 1.4% |
| Native / Alaskan | 0 | 0.0% |
| White / Caucasian | 3,276 | 89.1% |
| Two or more Races | 41 | 1.1% |
| Some other Race | 8 | 0.2% |
| Total | 3,677 | 100.0% |
Ancestry in Southgate
The most populous ancestries reported in Southgate are German (1,495 | 40.7%), Irish (527 | 14.3%), English (486 | 13.2%), French (209 | 5.7%), and Italian (189 | 5.1%), together accounting for 79.0% of all Southgate residents.
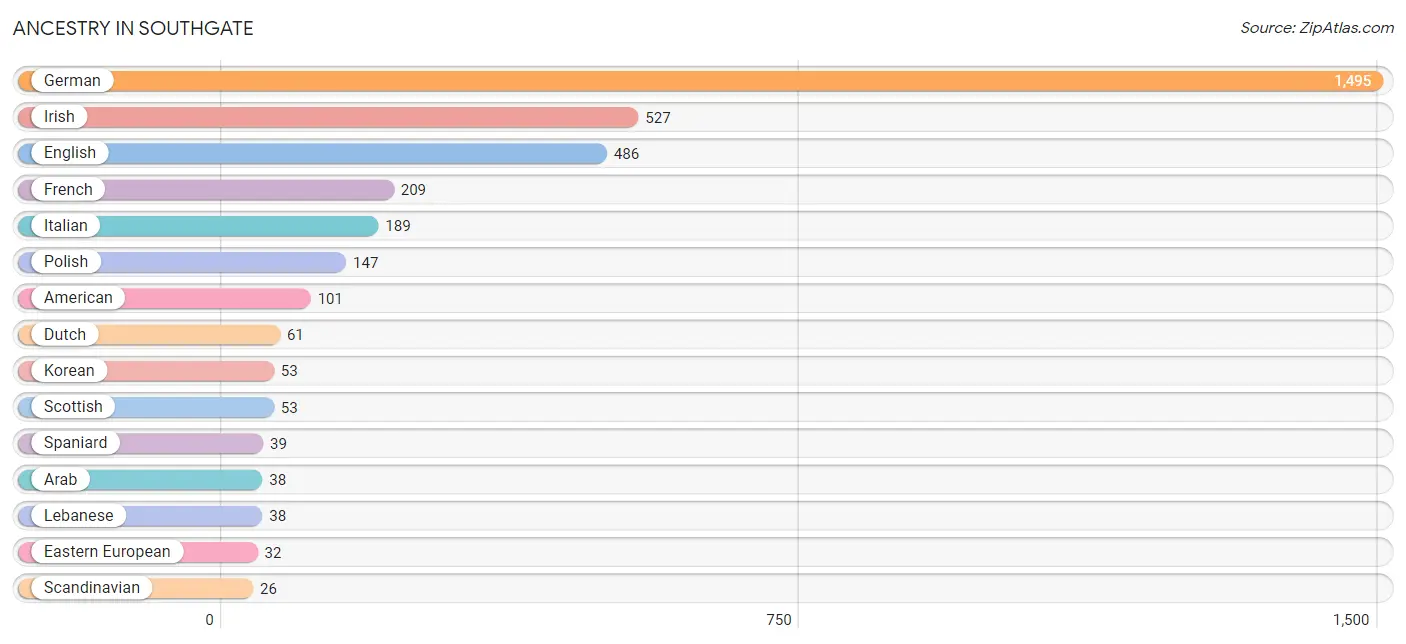
| Ancestry | # Population | % Population |
| American | 101 | 2.8% |
| Arab | 38 | 1.0% |
| Austrian | 4 | 0.1% |
| Belgian | 16 | 0.4% |
| Bhutanese | 4 | 0.1% |
| Blackfeet | 2 | 0.1% |
| British | 15 | 0.4% |
| Czech | 25 | 0.7% |
| Dutch | 61 | 1.7% |
| Eastern European | 32 | 0.9% |
| English | 486 | 13.2% |
| European | 6 | 0.2% |
| French | 209 | 5.7% |
| French Canadian | 9 | 0.2% |
| German | 1,495 | 40.7% |
| Greek | 4 | 0.1% |
| Hungarian | 12 | 0.3% |
| Indian (Asian) | 8 | 0.2% |
| Irish | 527 | 14.3% |
| Italian | 189 | 5.1% |
| Korean | 53 | 1.4% |
| Lebanese | 38 | 1.0% |
| Lithuanian | 23 | 0.6% |
| Luxembourger | 10 | 0.3% |
| Nigerian | 21 | 0.6% |
| Northern European | 13 | 0.4% |
| Polish | 147 | 4.0% |
| Puerto Rican | 8 | 0.2% |
| Scandinavian | 26 | 0.7% |
| Scotch-Irish | 11 | 0.3% |
| Scottish | 53 | 1.4% |
| Slovene | 8 | 0.2% |
| Spaniard | 39 | 1.1% |
| Spanish | 3 | 0.1% |
| Subsaharan African | 21 | 0.6% |
| Swedish | 6 | 0.2% |
| Thai | 8 | 0.2% |
| Turkish | 4 | 0.1% |
| Welsh | 18 | 0.5% | View All 39 Rows |
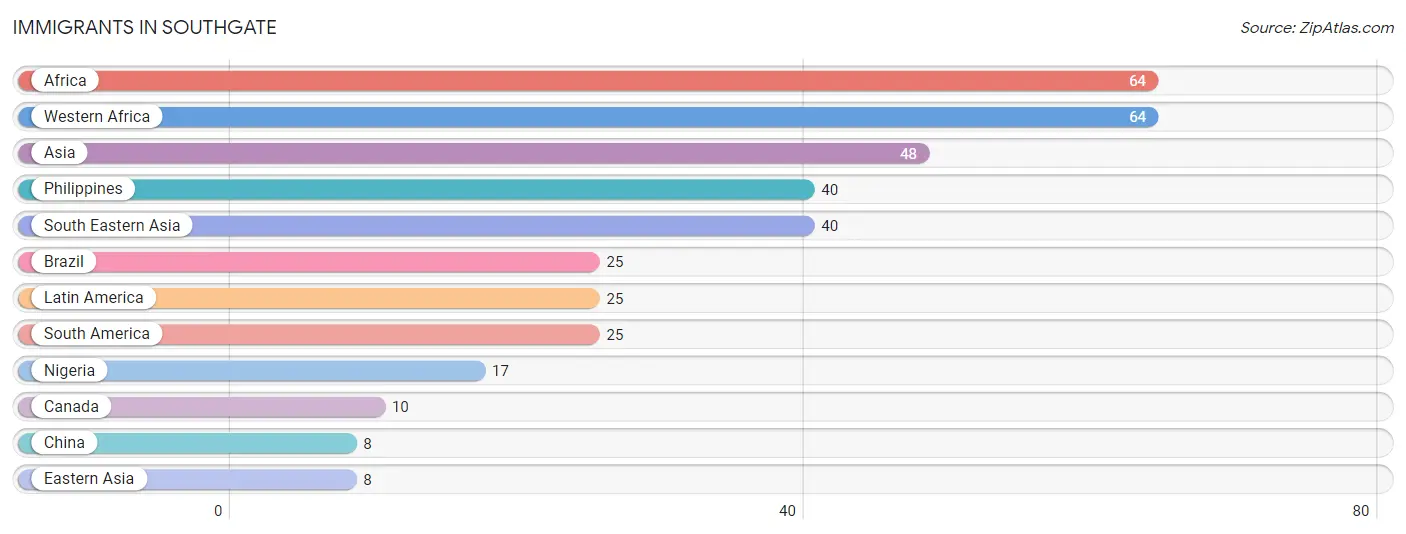
Immigrants in Southgate
The most numerous immigrant groups reported in Southgate came from Africa (64 | 1.7%), Western Africa (64 | 1.7%), Asia (48 | 1.3%), Philippines (40 | 1.1%), and South Eastern Asia (40 | 1.1%), together accounting for 7.0% of all Southgate residents.
| Immigration Origin | # Population | % Population |
| Africa | 64 | 1.7% |
| Asia | 48 | 1.3% |
| Brazil | 25 | 0.7% |
| Canada | 10 | 0.3% |
| China | 8 | 0.2% |
| Eastern Asia | 8 | 0.2% |
| Latin America | 25 | 0.7% |
| Nigeria | 17 | 0.5% |
| Philippines | 40 | 1.1% |
| South America | 25 | 0.7% |
| South Eastern Asia | 40 | 1.1% |
| Western Africa | 64 | 1.7% | View All 12 Rows |
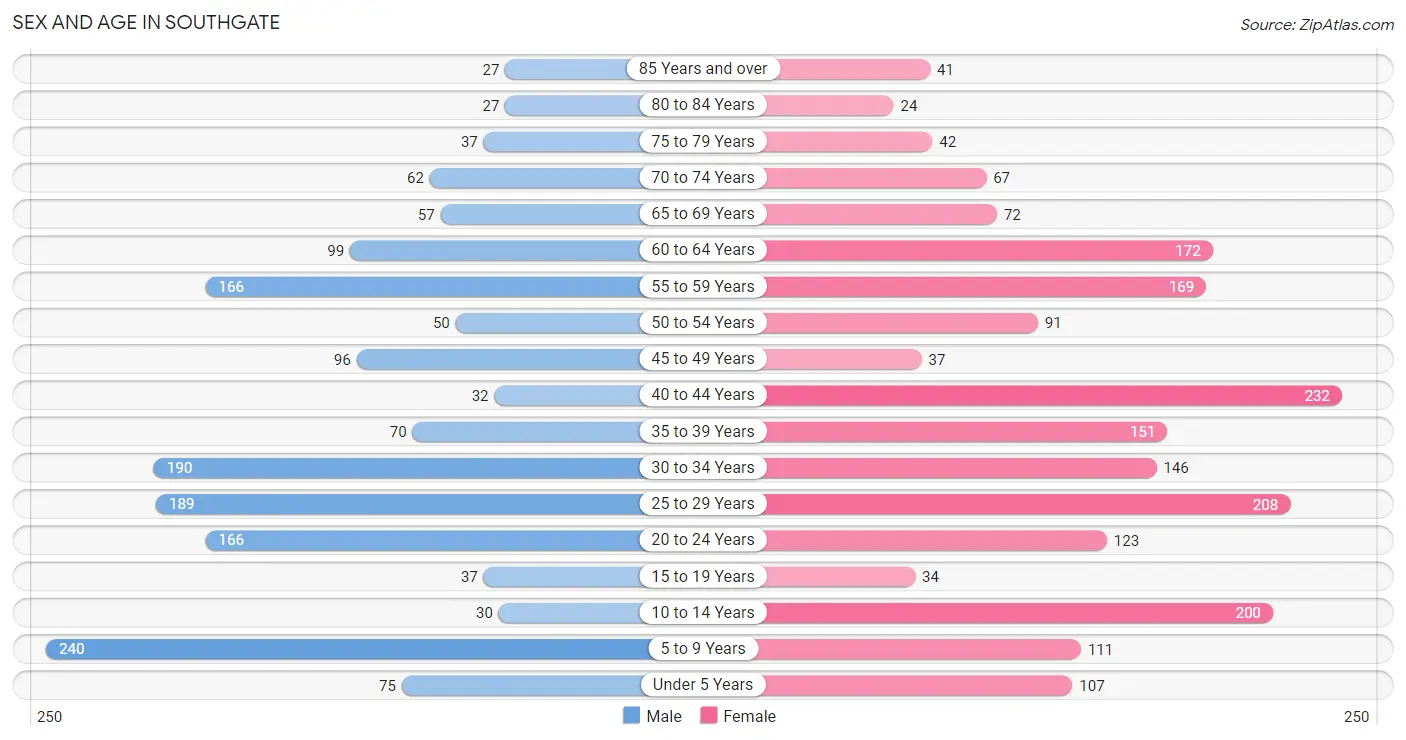
Sex and Age in Southgate
Sex and Age in Southgate
The most populous age groups in Southgate are 5 to 9 Years (240 | 14.5%) for men and 40 to 44 Years (232 | 11.5%) for women.
| Age Bracket | Male | Female |
| Under 5 Years | 75 (4.5%) | 107 (5.3%) |
| 5 to 9 Years | 240 (14.5%) | 111 (5.5%) |
| 10 to 14 Years | 30 (1.8%) | 200 (9.9%) |
| 15 to 19 Years | 37 (2.2%) | 34 (1.7%) |
| 20 to 24 Years | 166 (10.1%) | 123 (6.1%) |
| 25 to 29 Years | 189 (11.5%) | 208 (10.3%) |
| 30 to 34 Years | 190 (11.5%) | 146 (7.2%) |
| 35 to 39 Years | 70 (4.2%) | 151 (7.4%) |
| 40 to 44 Years | 32 (1.9%) | 232 (11.5%) |
| 45 to 49 Years | 96 (5.8%) | 37 (1.8%) |
| 50 to 54 Years | 50 (3.0%) | 91 (4.5%) |
| 55 to 59 Years | 166 (10.1%) | 169 (8.3%) |
| 60 to 64 Years | 99 (6.0%) | 172 (8.5%) |
| 65 to 69 Years | 57 (3.5%) | 72 (3.5%) |
| 70 to 74 Years | 62 (3.8%) | 67 (3.3%) |
| 75 to 79 Years | 37 (2.2%) | 42 (2.1%) |
| 80 to 84 Years | 27 (1.6%) | 24 (1.2%) |
| 85 Years and over | 27 (1.6%) | 41 (2.0%) |
| Total | 1,650 (100.0%) | 2,027 (100.0%) |
Families and Households in Southgate
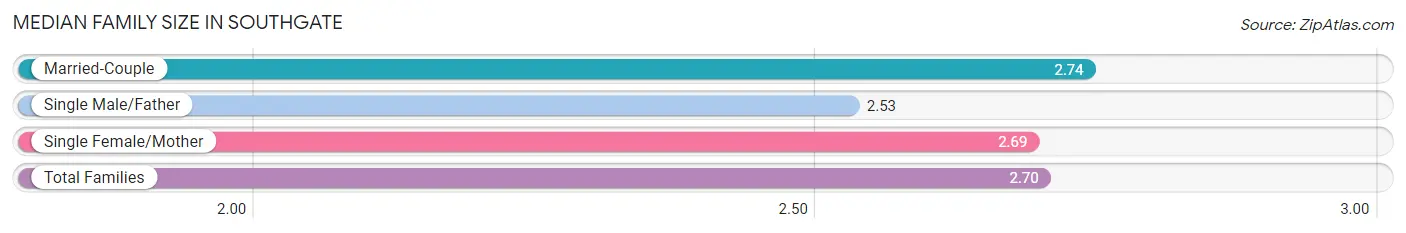
Median Family Size in Southgate
The median family size in Southgate is 2.70 persons per family, with married-couple families (462 | 48.2%) accounting for the largest median family size of 2.74 persons per family. On the other hand, single male/father families (103 | 10.7%) represent the smallest median family size with 2.53 persons per family.
| Family Type | # Families | Family Size |
| Married-Couple | 462 (48.2%) | 2.74 |
| Single Male/Father | 103 (10.7%) | 2.53 |
| Single Female/Mother | 394 (41.1%) | 2.69 |
| Total Families | 959 (100.0%) | 2.70 |
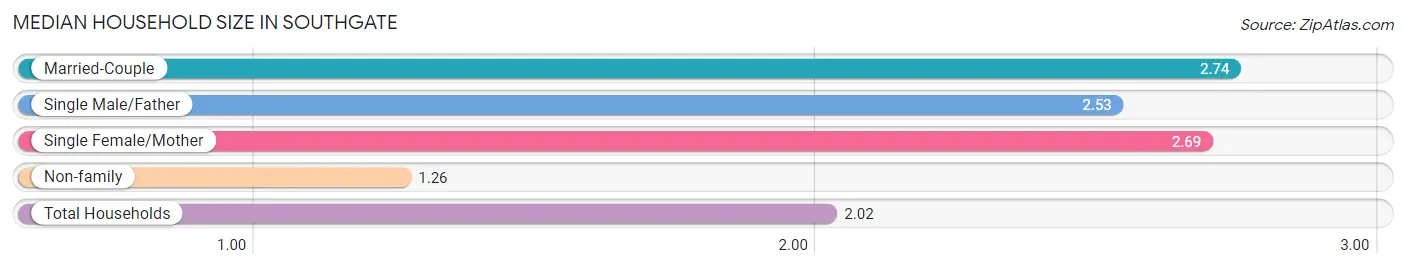
Median Household Size in Southgate
The median household size in Southgate is 2.02 persons per household, with married-couple households (462 | 25.3%) accounting for the largest median household size of 2.74 persons per household. non-family households (864 | 47.4%) represent the smallest median household size with 1.26 persons per household.
| Household Type | # Households | Household Size |
| Married-Couple | 462 (25.3%) | 2.74 |
| Single Male/Father | 103 (5.7%) | 2.53 |
| Single Female/Mother | 394 (21.6%) | 2.69 |
| Non-family | 864 (47.4%) | 1.26 |
| Total Households | 1,823 (100.0%) | 2.02 |
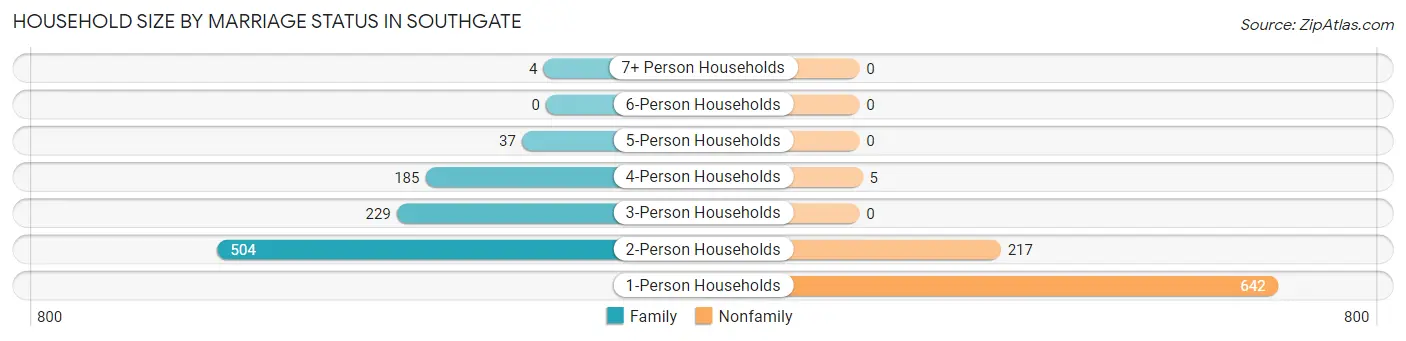
Household Size by Marriage Status in Southgate
Out of a total of 1,823 households in Southgate, 959 (52.6%) are family households, while 864 (47.4%) are nonfamily households. The most numerous type of family households are 2-person households, comprising 504, and the most common type of nonfamily households are 1-person households, comprising 642.
| Household Size | Family Households | Nonfamily Households |
| 1-Person Households | - | 642 (35.2%) |
| 2-Person Households | 504 (27.7%) | 217 (11.9%) |
| 3-Person Households | 229 (12.6%) | 0 (0.0%) |
| 4-Person Households | 185 (10.2%) | 5 (0.3%) |
| 5-Person Households | 37 (2.0%) | 0 (0.0%) |
| 6-Person Households | 0 (0.0%) | 0 (0.0%) |
| 7+ Person Households | 4 (0.2%) | 0 (0.0%) |
| Total | 959 (52.6%) | 864 (47.4%) |
Female Fertility in Southgate
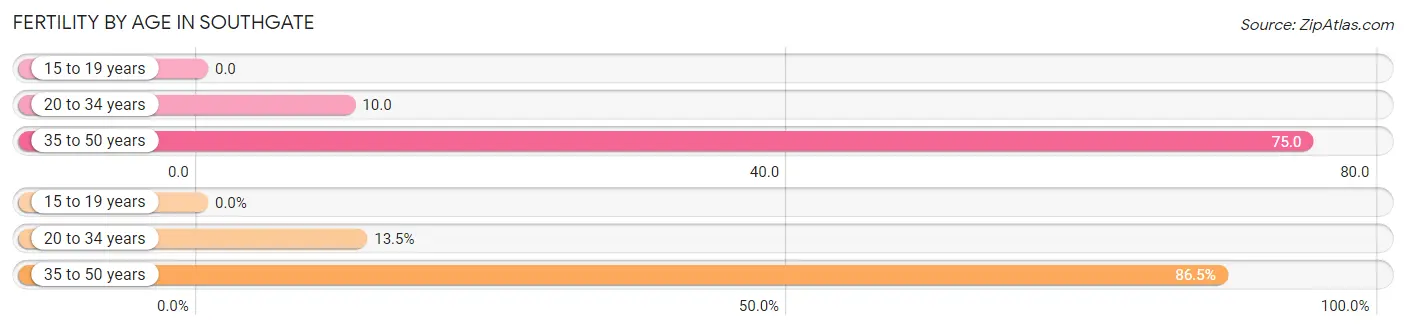
Fertility by Age in Southgate
Average fertility rate in Southgate is 39.0 births per 1,000 women. Women in the age bracket of 35 to 50 years have the highest fertility rate with 75.0 births per 1,000 women. Women in the age bracket of 35 to 50 years acount for 86.5% of all women with births.
| Age Bracket | Women with Births | Births / 1,000 Women |
| 15 to 19 years | 0 (0.0%) | 0.0 |
| 20 to 34 years | 5 (13.5%) | 10.0 |
| 35 to 50 years | 32 (86.5%) | 75.0 |
| Total | 37 (100.0%) | 39.0 |
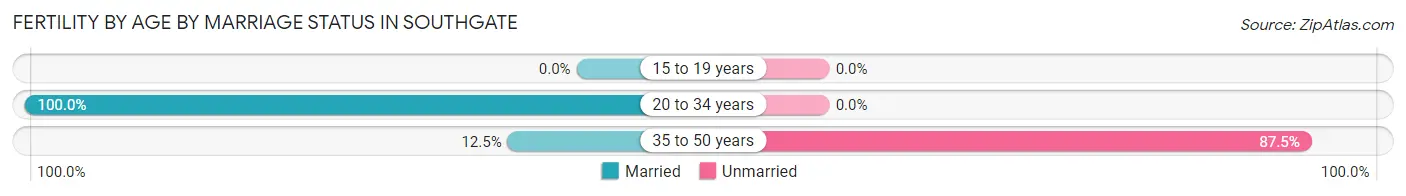
Fertility by Age by Marriage Status in Southgate
24.3% of women with births (37) in Southgate are married. The highest percentage of unmarried women with births falls into 35 to 50 years age bracket with 87.5% of them unmarried at the time of birth, while the lowest percentage of unmarried women with births belong to 20 to 34 years age bracket with 0.0% of them unmarried.
| Age Bracket | Married | Unmarried |
| 15 to 19 years | 0 (0.0%) | 0 (0.0%) |
| 20 to 34 years | 5 (100.0%) | 0 (0.0%) |
| 35 to 50 years | 4 (12.5%) | 28 (87.5%) |
| Total | 9 (24.3%) | 28 (75.7%) |
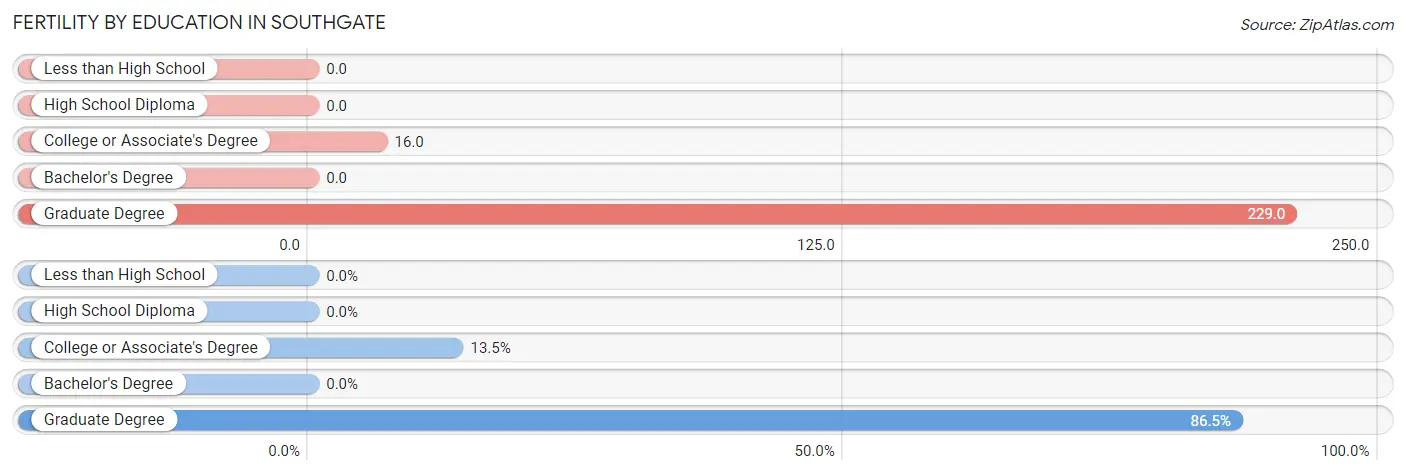
Fertility by Education in Southgate
| Educational Attainment | Women with Births | Births / 1,000 Women |
| Less than High School | 0 (0.0%) | 0.0 |
| High School Diploma | 0 (0.0%) | 0.0 |
| College or Associate's Degree | 5 (13.5%) | 16.0 |
| Bachelor's Degree | 0 (0.0%) | 0.0 |
| Graduate Degree | 32 (86.5%) | 229.0 |
| Total | 37 (100.0%) | 39.0 |
Fertility by Education by Marriage Status in Southgate
75.7% of women with births in Southgate are unmarried. Women with the educational attainment of college or associate's degree are most likely to be married with 100.0% of them married at childbirth, while women with the educational attainment of graduate degree are least likely to be married with 87.5% of them unmarried at childbirth.
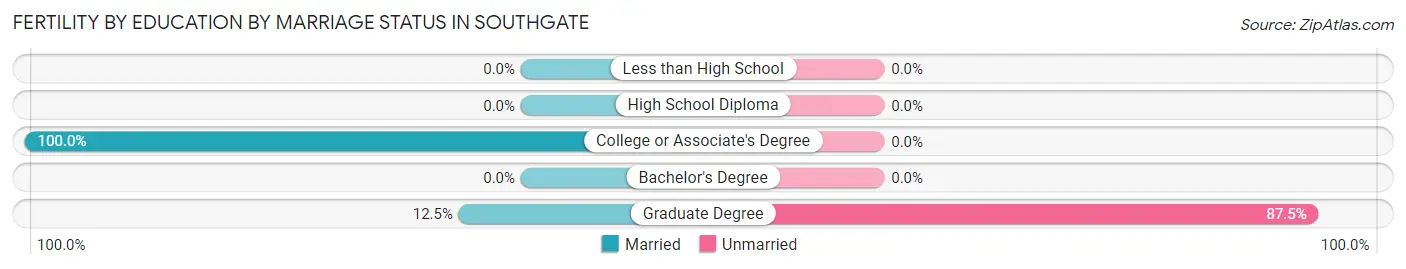
| Educational Attainment | Married | Unmarried |
| Less than High School | 0 (0.0%) | 0 (0.0%) |
| High School Diploma | 0 (0.0%) | 0 (0.0%) |
| College or Associate's Degree | 5 (100.0%) | 0 (0.0%) |
| Bachelor's Degree | 0 (0.0%) | 0 (0.0%) |
| Graduate Degree | 4 (12.5%) | 28 (87.5%) |
| Total | 9 (24.3%) | 28 (75.7%) |
Employment Characteristics in Southgate
Employment by Class of Employer in Southgate
Among the 2,038 employed individuals in Southgate, private company employees (1,336 | 65.5%), not-for-profit organizations (236 | 11.6%), and local government employees (169 | 8.3%) make up the most common classes of employment.
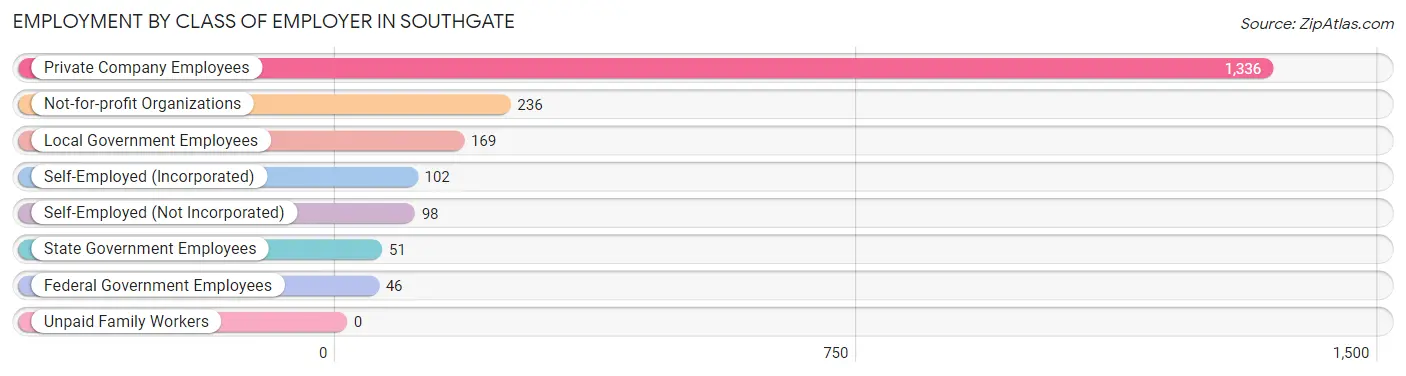
| Employer Class | # Employees | % Employees |
| Private Company Employees | 1,336 | 65.5% |
| Self-Employed (Incorporated) | 102 | 5.0% |
| Self-Employed (Not Incorporated) | 98 | 4.8% |
| Not-for-profit Organizations | 236 | 11.6% |
| Local Government Employees | 169 | 8.3% |
| State Government Employees | 51 | 2.5% |
| Federal Government Employees | 46 | 2.3% |
| Unpaid Family Workers | 0 | 0.0% |
| Total | 2,038 | 100.0% |
Employment Status by Age in Southgate
According to the labor force statistics for Southgate, out of the total population over 16 years of age (2,879), 74.9% or 2,156 individuals are in the labor force, with 4.6% or 99 of them unemployed. The age group with the highest labor force participation rate is 20 to 24 years, with 100.0% or 289 individuals in the labor force. Within the labor force, the 65 to 74 years age range has the highest percentage of unemployed individuals, with 11.9% or 8 of them being unemployed.
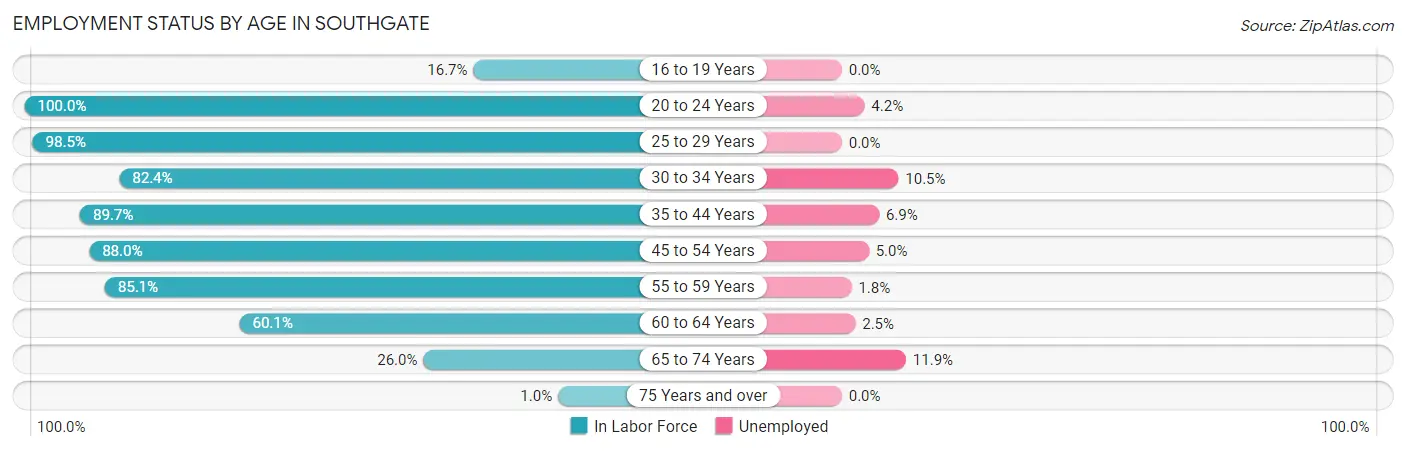
| Age Bracket | In Labor Force | Unemployed |
| 16 to 19 Years | 6 (16.7%) | 0 (0.0%) |
| 20 to 24 Years | 289 (100.0%) | 12 (4.2%) |
| 25 to 29 Years | 391 (98.5%) | 0 (0.0%) |
| 30 to 34 Years | 277 (82.4%) | 29 (10.5%) |
| 35 to 44 Years | 435 (89.7%) | 30 (6.9%) |
| 45 to 54 Years | 241 (88.0%) | 12 (5.0%) |
| 55 to 59 Years | 285 (85.1%) | 5 (1.8%) |
| 60 to 64 Years | 163 (60.1%) | 4 (2.5%) |
| 65 to 74 Years | 67 (26.0%) | 8 (11.9%) |
| 75 Years and over | 2 (1.0%) | 0 (0.0%) |
| Total | 2,156 (74.9%) | 99 (4.6%) |
Employment Status by Educational Attainment in Southgate
According to labor force statistics for Southgate, 85.4% of individuals (1,792) out of the total population between 25 and 64 years of age (2,098) are in the labor force, with 4.5% or 81 of them being unemployed. The group with the highest labor force participation rate are those with the educational attainment of bachelor's degree or higher, with 98.2% or 808 individuals in the labor force. Within the labor force, individuals with college / associate degree education have the highest percentage of unemployment, with 5.9% or 38 of them being unemployed.
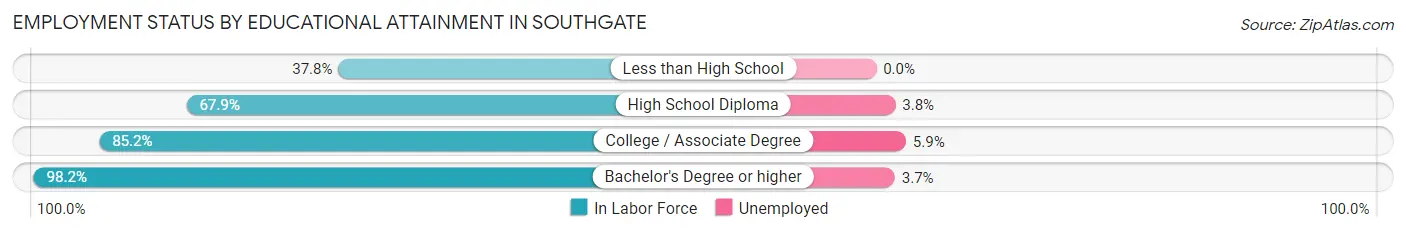
| Educational Attainment | In Labor Force | Unemployed |
| Less than High School | 17 (37.8%) | 0 (0.0%) |
| High School Diploma | 320 (67.9%) | 18 (3.8%) |
| College / Associate Degree | 647 (85.2%) | 45 (5.9%) |
| Bachelor's Degree or higher | 808 (98.2%) | 30 (3.7%) |
| Total | 1,792 (85.4%) | 94 (4.5%) |
Employment Occupations by Sex in Southgate
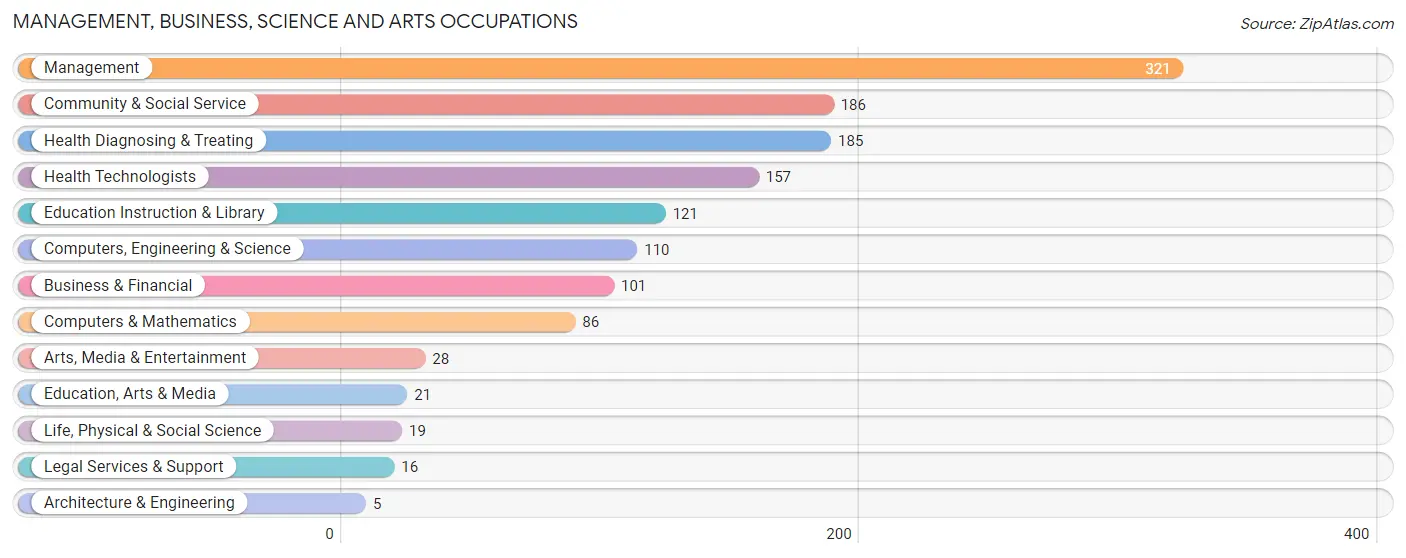
Management, Business, Science and Arts Occupations
The most common Management, Business, Science and Arts occupations in Southgate are Management (321 | 15.6%), Community & Social Service (186 | 9.0%), Health Diagnosing & Treating (185 | 9.0%), Health Technologists (157 | 7.6%), and Education Instruction & Library (121 | 5.9%).
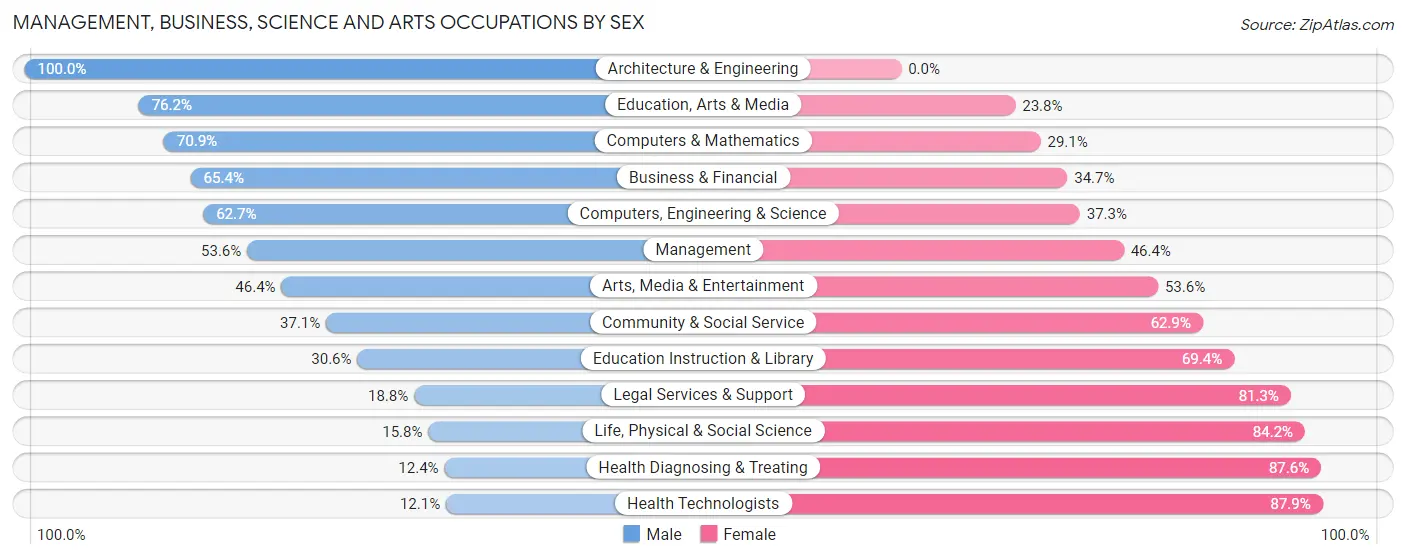
Management, Business, Science and Arts Occupations by Sex
Within the Management, Business, Science and Arts occupations in Southgate, the most male-oriented occupations are Architecture & Engineering (100.0%), Education, Arts & Media (76.2%), and Computers & Mathematics (70.9%), while the most female-oriented occupations are Health Technologists (87.9%), Health Diagnosing & Treating (87.6%), and Life, Physical & Social Science (84.2%).
| Occupation | Male | Female |
| Management | 172 (53.6%) | 149 (46.4%) |
| Business & Financial | 66 (65.3%) | 35 (34.6%) |
| Computers, Engineering & Science | 69 (62.7%) | 41 (37.3%) |
| Computers & Mathematics | 61 (70.9%) | 25 (29.1%) |
| Architecture & Engineering | 5 (100.0%) | 0 (0.0%) |
| Life, Physical & Social Science | 3 (15.8%) | 16 (84.2%) |
| Community & Social Service | 69 (37.1%) | 117 (62.9%) |
| Education, Arts & Media | 16 (76.2%) | 5 (23.8%) |
| Legal Services & Support | 3 (18.8%) | 13 (81.2%) |
| Education Instruction & Library | 37 (30.6%) | 84 (69.4%) |
| Arts, Media & Entertainment | 13 (46.4%) | 15 (53.6%) |
| Health Diagnosing & Treating | 23 (12.4%) | 162 (87.6%) |
| Health Technologists | 19 (12.1%) | 138 (87.9%) |
| Total (Category) | 399 (44.2%) | 504 (55.8%) |
| Total (Overall) | 945 (46.0%) | 1,111 (54.0%) |
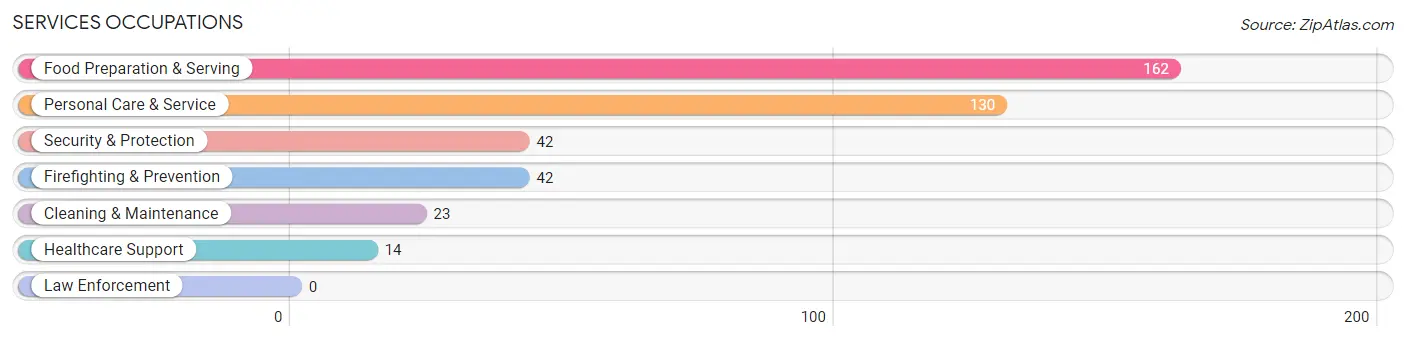
Services Occupations
The most common Services occupations in Southgate are Food Preparation & Serving (162 | 7.9%), Personal Care & Service (130 | 6.3%), Security & Protection (42 | 2.0%), Firefighting & Prevention (42 | 2.0%), and Cleaning & Maintenance (23 | 1.1%).
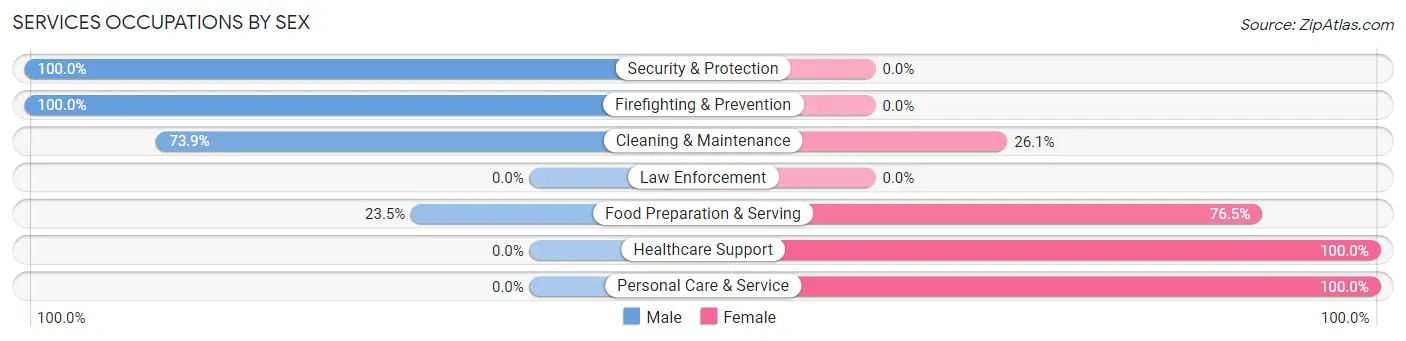
Services Occupations by Sex
Within the Services occupations in Southgate, the most male-oriented occupations are Security & Protection (100.0%), Firefighting & Prevention (100.0%), and Cleaning & Maintenance (73.9%), while the most female-oriented occupations are Healthcare Support (100.0%), Personal Care & Service (100.0%), and Food Preparation & Serving (76.5%).
| Occupation | Male | Female |
| Healthcare Support | 0 (0.0%) | 14 (100.0%) |
| Security & Protection | 42 (100.0%) | 0 (0.0%) |
| Firefighting & Prevention | 42 (100.0%) | 0 (0.0%) |
| Law Enforcement | 0 (0.0%) | 0 (0.0%) |
| Food Preparation & Serving | 38 (23.5%) | 124 (76.5%) |
| Cleaning & Maintenance | 17 (73.9%) | 6 (26.1%) |
| Personal Care & Service | 0 (0.0%) | 130 (100.0%) |
| Total (Category) | 97 (26.2%) | 274 (73.9%) |
| Total (Overall) | 945 (46.0%) | 1,111 (54.0%) |
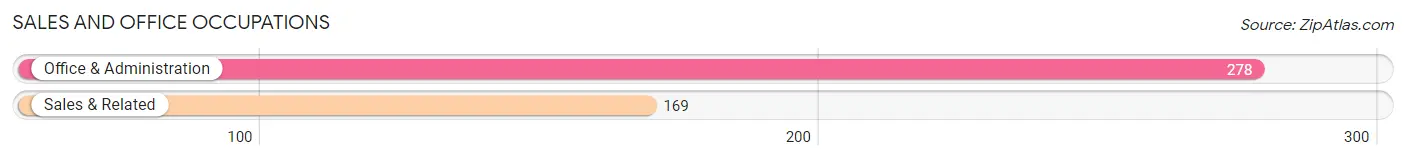
Sales and Office Occupations
The most common Sales and Office occupations in Southgate are Office & Administration (278 | 13.5%), and Sales & Related (169 | 8.2%).
Sales and Office Occupations by Sex
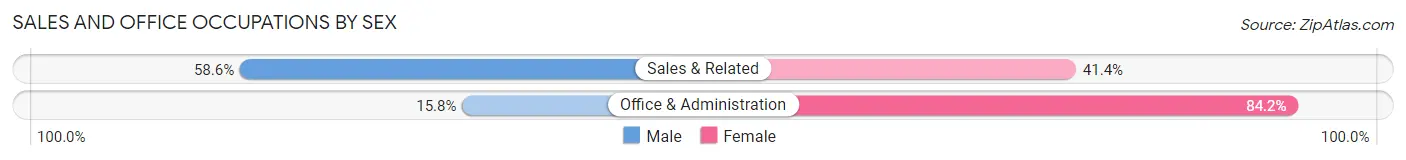
| Occupation | Male | Female |
| Sales & Related | 99 (58.6%) | 70 (41.4%) |
| Office & Administration | 44 (15.8%) | 234 (84.2%) |
| Total (Category) | 143 (32.0%) | 304 (68.0%) |
| Total (Overall) | 945 (46.0%) | 1,111 (54.0%) |
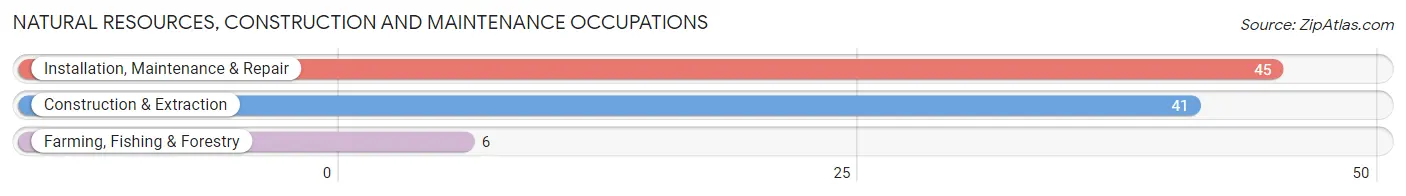
Natural Resources, Construction and Maintenance Occupations
The most common Natural Resources, Construction and Maintenance occupations in Southgate are Installation, Maintenance & Repair (45 | 2.2%), Construction & Extraction (41 | 2.0%), and Farming, Fishing & Forestry (6 | 0.3%).
Natural Resources, Construction and Maintenance Occupations by Sex
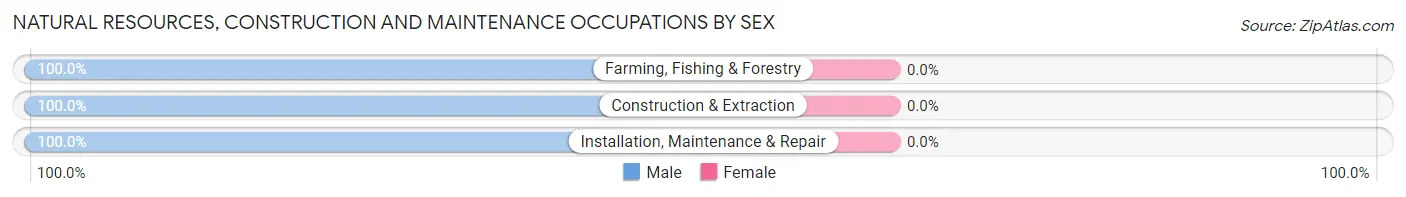
| Occupation | Male | Female |
| Farming, Fishing & Forestry | 6 (100.0%) | 0 (0.0%) |
| Construction & Extraction | 41 (100.0%) | 0 (0.0%) |
| Installation, Maintenance & Repair | 45 (100.0%) | 0 (0.0%) |
| Total (Category) | 92 (100.0%) | 0 (0.0%) |
| Total (Overall) | 945 (46.0%) | 1,111 (54.0%) |
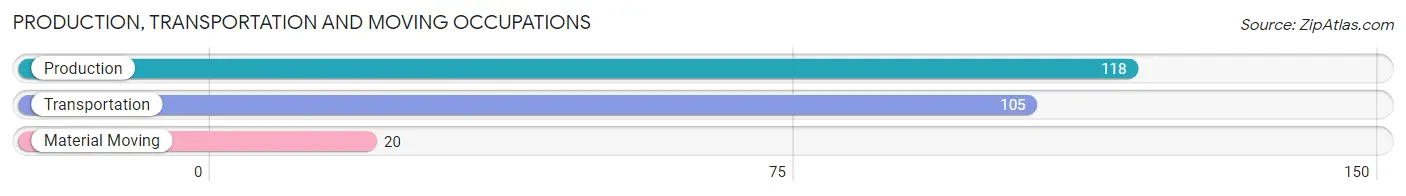
Production, Transportation and Moving Occupations
The most common Production, Transportation and Moving occupations in Southgate are Production (118 | 5.7%), Transportation (105 | 5.1%), and Material Moving (20 | 1.0%).
Production, Transportation and Moving Occupations by Sex
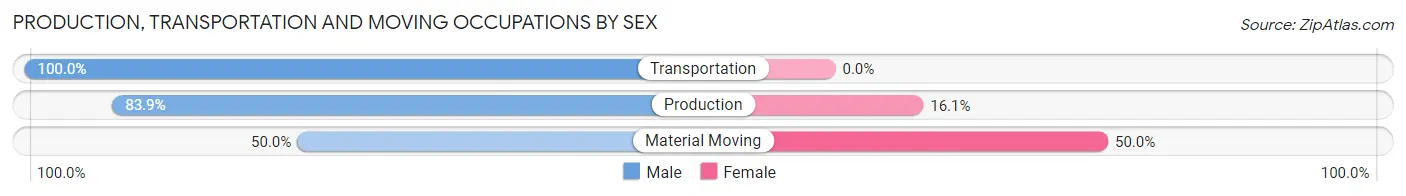
| Occupation | Male | Female |
| Production | 99 (83.9%) | 19 (16.1%) |
| Transportation | 105 (100.0%) | 0 (0.0%) |
| Material Moving | 10 (50.0%) | 10 (50.0%) |
| Total (Category) | 214 (88.1%) | 29 (11.9%) |
| Total (Overall) | 945 (46.0%) | 1,111 (54.0%) |
Employment Industries by Sex in Southgate
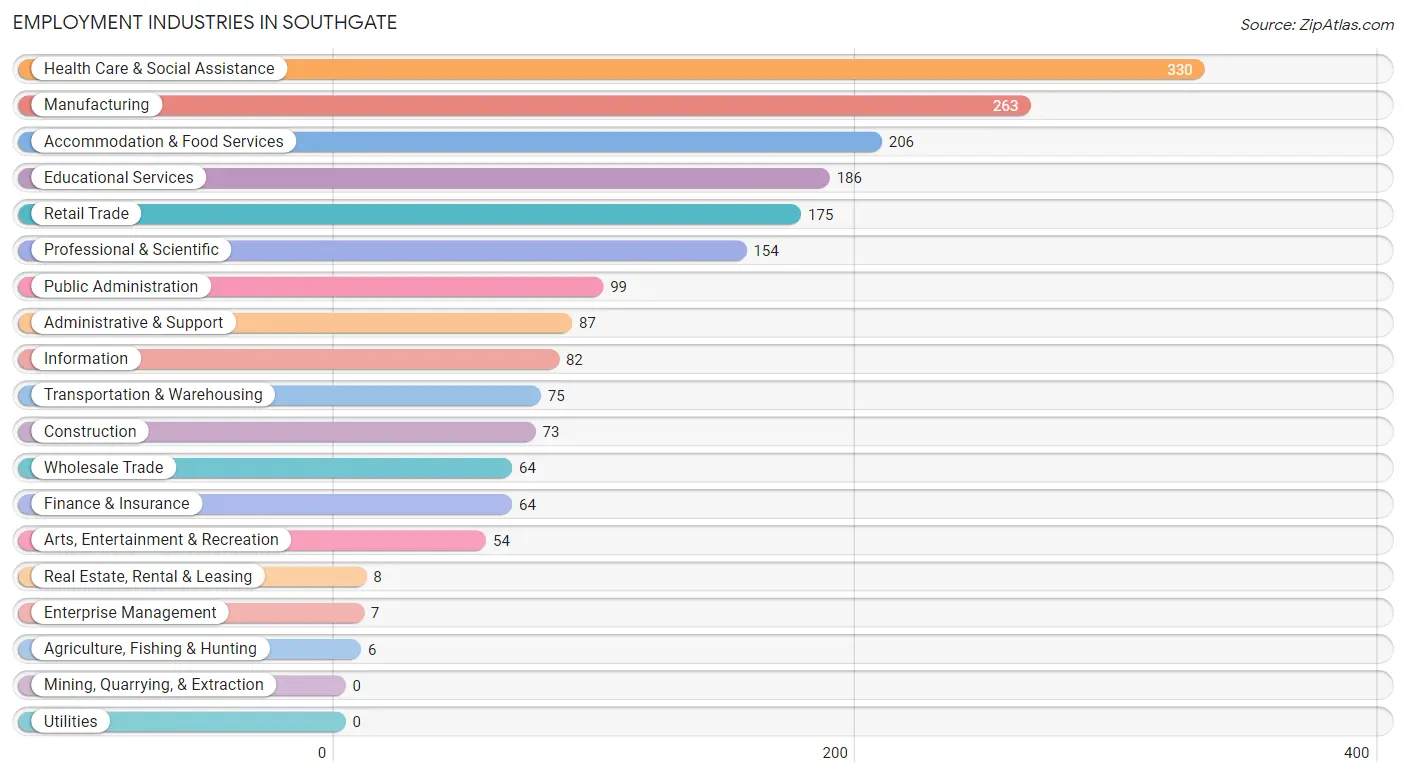
Employment Industries in Southgate
The major employment industries in Southgate include Health Care & Social Assistance (330 | 16.1%), Manufacturing (263 | 12.8%), Accommodation & Food Services (206 | 10.0%), Educational Services (186 | 9.0%), and Retail Trade (175 | 8.5%).
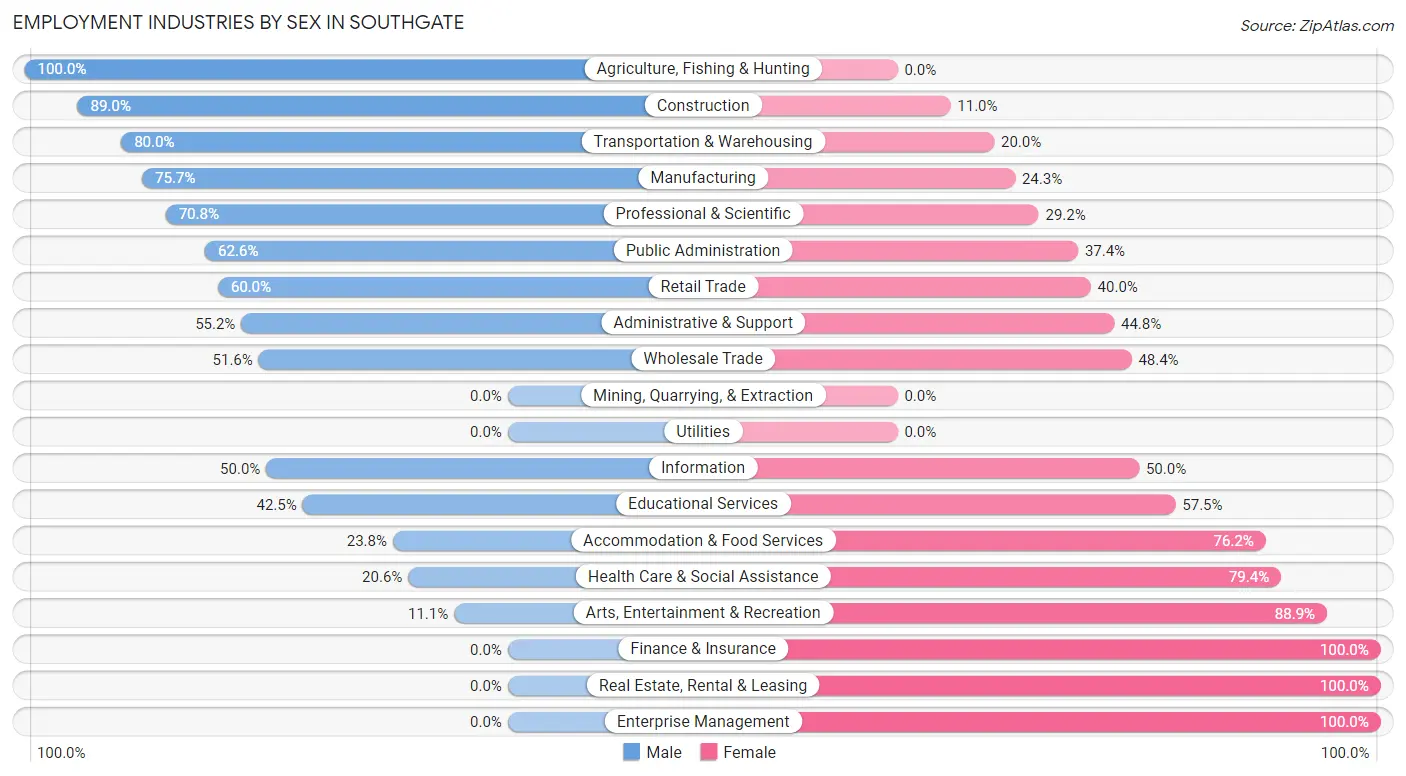
Employment Industries by Sex in Southgate
The Southgate industries that see more men than women are Agriculture, Fishing & Hunting (100.0%), Construction (89.0%), and Transportation & Warehousing (80.0%), whereas the industries that tend to have a higher number of women are Finance & Insurance (100.0%), Real Estate, Rental & Leasing (100.0%), and Enterprise Management (100.0%).
| Industry | Male | Female |
| Agriculture, Fishing & Hunting | 6 (100.0%) | 0 (0.0%) |
| Mining, Quarrying, & Extraction | 0 (0.0%) | 0 (0.0%) |
| Construction | 65 (89.0%) | 8 (11.0%) |
| Manufacturing | 199 (75.7%) | 64 (24.3%) |
| Wholesale Trade | 33 (51.6%) | 31 (48.4%) |
| Retail Trade | 105 (60.0%) | 70 (40.0%) |
| Transportation & Warehousing | 60 (80.0%) | 15 (20.0%) |
| Utilities | 0 (0.0%) | 0 (0.0%) |
| Information | 41 (50.0%) | 41 (50.0%) |
| Finance & Insurance | 0 (0.0%) | 64 (100.0%) |
| Real Estate, Rental & Leasing | 0 (0.0%) | 8 (100.0%) |
| Professional & Scientific | 109 (70.8%) | 45 (29.2%) |
| Enterprise Management | 0 (0.0%) | 7 (100.0%) |
| Administrative & Support | 48 (55.2%) | 39 (44.8%) |
| Educational Services | 79 (42.5%) | 107 (57.5%) |
| Health Care & Social Assistance | 68 (20.6%) | 262 (79.4%) |
| Arts, Entertainment & Recreation | 6 (11.1%) | 48 (88.9%) |
| Accommodation & Food Services | 49 (23.8%) | 157 (76.2%) |
| Public Administration | 62 (62.6%) | 37 (37.4%) |
| Total | 945 (46.0%) | 1,111 (54.0%) |
Education in Southgate
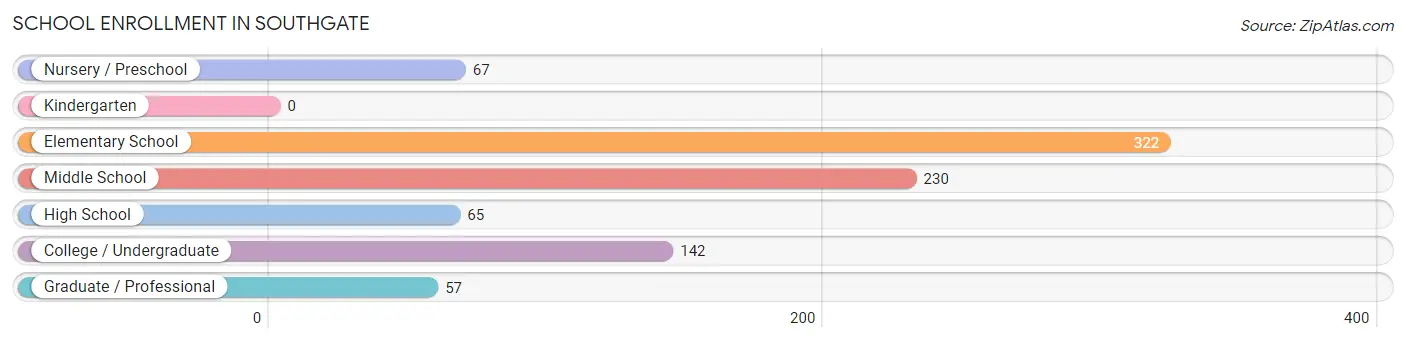
School Enrollment in Southgate
The most common levels of schooling among the 883 students in Southgate are elementary school (322 | 36.5%), middle school (230 | 26.1%), and college / undergraduate (142 | 16.1%).
| School Level | # Students | % Students |
| Nursery / Preschool | 67 | 7.6% |
| Kindergarten | 0 | 0.0% |
| Elementary School | 322 | 36.5% |
| Middle School | 230 | 26.1% |
| High School | 65 | 7.4% |
| College / Undergraduate | 142 | 16.1% |
| Graduate / Professional | 57 | 6.5% |
| Total | 883 | 100.0% |
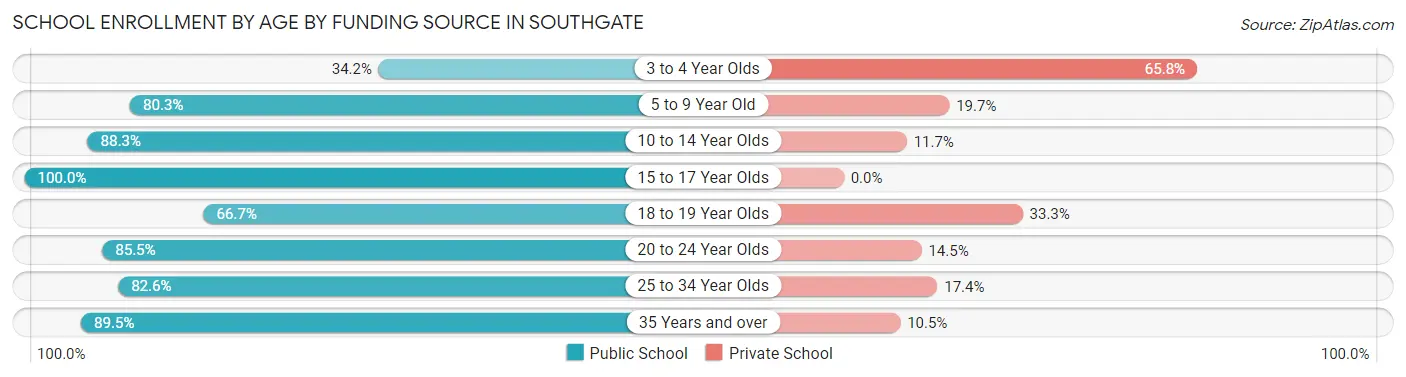
School Enrollment by Age by Funding Source in Southgate
Out of a total of 883 students who are enrolled in schools in Southgate, 152 (17.2%) attend a private institution, while the remaining 731 (82.8%) are enrolled in public schools. The age group of 3 to 4 year olds has the highest likelihood of being enrolled in private schools, with 25 (65.8% in the age bracket) enrolled. Conversely, the age group of 15 to 17 year olds has the lowest likelihood of being enrolled in a private school, with 65 (100.0% in the age bracket) attending a public institution.
| Age Bracket | Public School | Private School |
| 3 to 4 Year Olds | 13 (34.2%) | 25 (65.8%) |
| 5 to 9 Year Old | 282 (80.3%) | 69 (19.7%) |
| 10 to 14 Year Olds | 203 (88.3%) | 27 (11.7%) |
| 15 to 17 Year Olds | 65 (100.0%) | 0 (0.0%) |
| 18 to 19 Year Olds | 4 (66.7%) | 2 (33.3%) |
| 20 to 24 Year Olds | 59 (85.5%) | 10 (14.5%) |
| 25 to 34 Year Olds | 71 (82.6%) | 15 (17.4%) |
| 35 Years and over | 34 (89.5%) | 4 (10.5%) |
| Total | 731 (82.8%) | 152 (17.2%) |
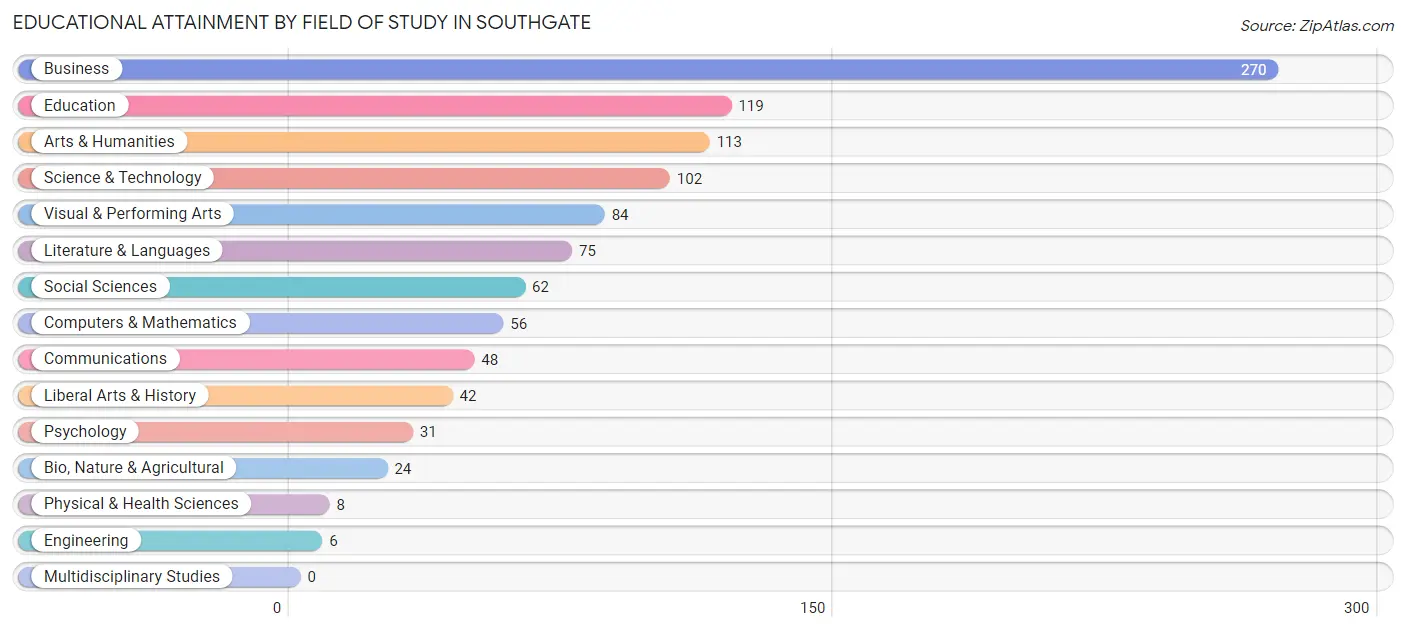
Educational Attainment by Field of Study in Southgate
Business (270 | 26.0%), education (119 | 11.4%), arts & humanities (113 | 10.9%), science & technology (102 | 9.8%), and visual & performing arts (84 | 8.1%) are the most common fields of study among 1,040 individuals in Southgate who have obtained a bachelor's degree or higher.
| Field of Study | # Graduates | % Graduates |
| Computers & Mathematics | 56 | 5.4% |
| Bio, Nature & Agricultural | 24 | 2.3% |
| Physical & Health Sciences | 8 | 0.8% |
| Psychology | 31 | 3.0% |
| Social Sciences | 62 | 6.0% |
| Engineering | 6 | 0.6% |
| Multidisciplinary Studies | 0 | 0.0% |
| Science & Technology | 102 | 9.8% |
| Business | 270 | 26.0% |
| Education | 119 | 11.4% |
| Literature & Languages | 75 | 7.2% |
| Liberal Arts & History | 42 | 4.0% |
| Visual & Performing Arts | 84 | 8.1% |
| Communications | 48 | 4.6% |
| Arts & Humanities | 113 | 10.9% |
| Total | 1,040 | 100.0% |
Transportation & Commute in Southgate
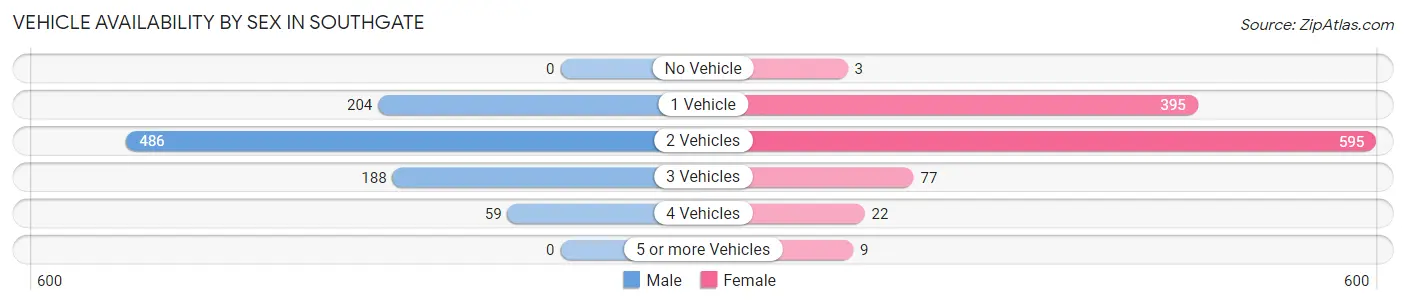
Vehicle Availability by Sex in Southgate
The most prevalent vehicle ownership categories in Southgate are males with 2 vehicles (486, accounting for 51.9%) and females with 2 vehicles (595, making up 44.1%).
| Vehicles Available | Male | Female |
| No Vehicle | 0 (0.0%) | 3 (0.3%) |
| 1 Vehicle | 204 (21.8%) | 395 (35.9%) |
| 2 Vehicles | 486 (51.9%) | 595 (54.0%) |
| 3 Vehicles | 188 (20.1%) | 77 (7.0%) |
| 4 Vehicles | 59 (6.3%) | 22 (2.0%) |
| 5 or more Vehicles | 0 (0.0%) | 9 (0.8%) |
| Total | 937 (100.0%) | 1,101 (100.0%) |
Commute Time in Southgate
The most frequently occuring commute durations in Southgate are 10 to 14 minutes (396 commuters, 20.3%), 30 to 34 minutes (352 commuters, 18.1%), and 15 to 19 minutes (336 commuters, 17.2%).
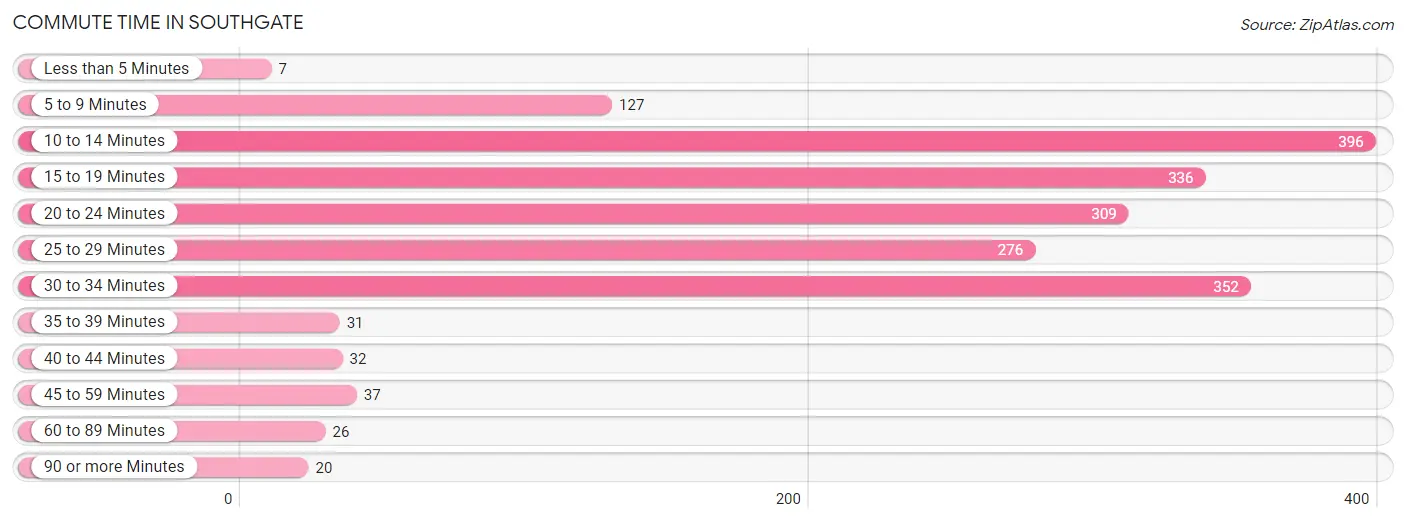
| Commute Time | # Commuters | % Commuters |
| Less than 5 Minutes | 7 | 0.4% |
| 5 to 9 Minutes | 127 | 6.5% |
| 10 to 14 Minutes | 396 | 20.3% |
| 15 to 19 Minutes | 336 | 17.2% |
| 20 to 24 Minutes | 309 | 15.9% |
| 25 to 29 Minutes | 276 | 14.2% |
| 30 to 34 Minutes | 352 | 18.1% |
| 35 to 39 Minutes | 31 | 1.6% |
| 40 to 44 Minutes | 32 | 1.6% |
| 45 to 59 Minutes | 37 | 1.9% |
| 60 to 89 Minutes | 26 | 1.3% |
| 90 or more Minutes | 20 | 1.0% |
Commute Time by Sex in Southgate
The most common commute times in Southgate are 30 to 34 minutes (193 commuters, 20.9%) for males and 10 to 14 minutes (248 commuters, 24.1%) for females.
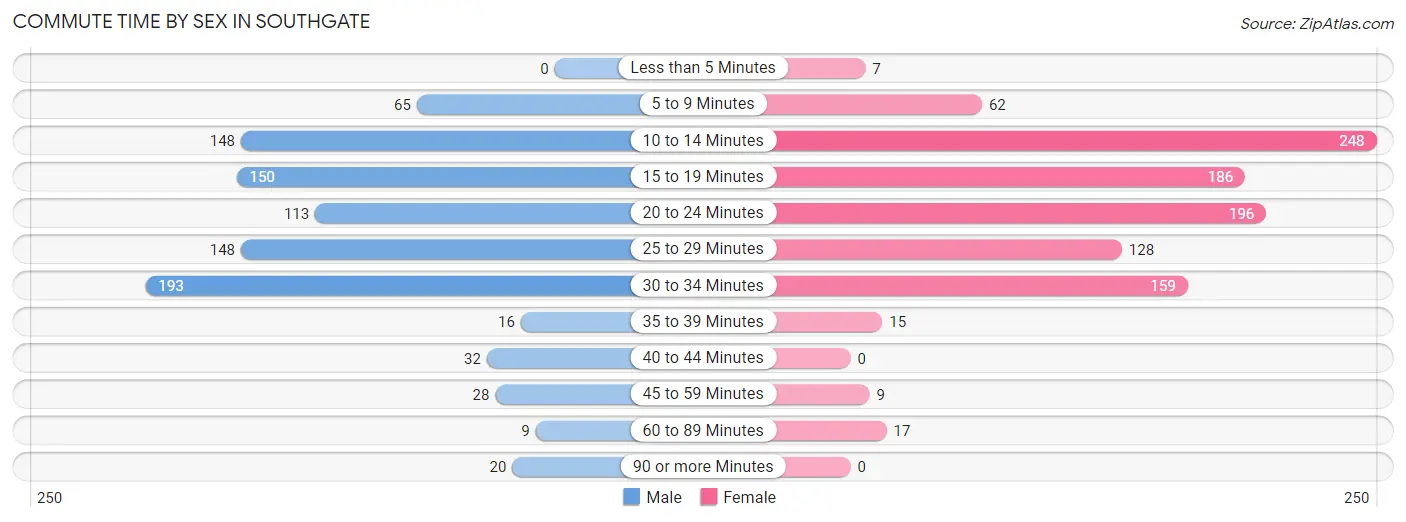
| Commute Time | Male | Female |
| Less than 5 Minutes | 0 (0.0%) | 7 (0.7%) |
| 5 to 9 Minutes | 65 (7.0%) | 62 (6.0%) |
| 10 to 14 Minutes | 148 (16.1%) | 248 (24.1%) |
| 15 to 19 Minutes | 150 (16.3%) | 186 (18.1%) |
| 20 to 24 Minutes | 113 (12.3%) | 196 (19.1%) |
| 25 to 29 Minutes | 148 (16.1%) | 128 (12.5%) |
| 30 to 34 Minutes | 193 (20.9%) | 159 (15.5%) |
| 35 to 39 Minutes | 16 (1.7%) | 15 (1.5%) |
| 40 to 44 Minutes | 32 (3.5%) | 0 (0.0%) |
| 45 to 59 Minutes | 28 (3.0%) | 9 (0.9%) |
| 60 to 89 Minutes | 9 (1.0%) | 17 (1.7%) |
| 90 or more Minutes | 20 (2.2%) | 0 (0.0%) |
Time of Departure to Work by Sex in Southgate
The most frequent times of departure to work in Southgate are 7:30 AM to 7:59 AM (200, 21.7%) for males and 7:00 AM to 7:29 AM (205, 20.0%) for females.
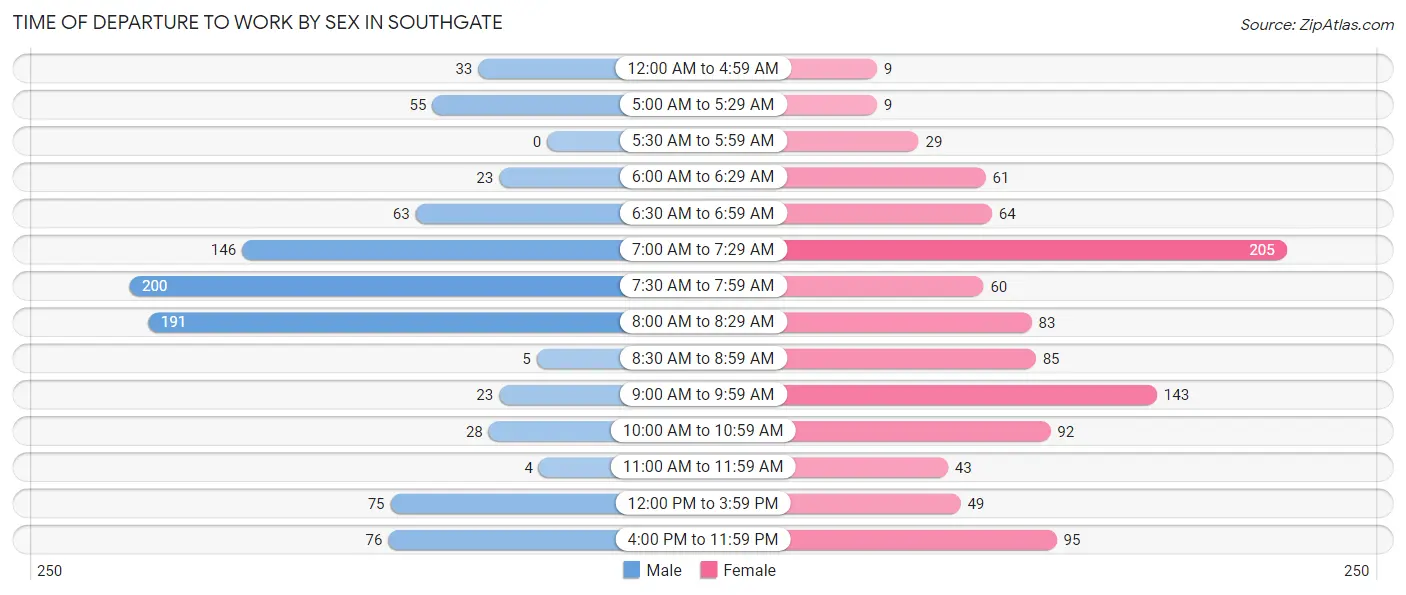
| Time of Departure | Male | Female |
| 12:00 AM to 4:59 AM | 33 (3.6%) | 9 (0.9%) |
| 5:00 AM to 5:29 AM | 55 (6.0%) | 9 (0.9%) |
| 5:30 AM to 5:59 AM | 0 (0.0%) | 29 (2.8%) |
| 6:00 AM to 6:29 AM | 23 (2.5%) | 61 (5.9%) |
| 6:30 AM to 6:59 AM | 63 (6.8%) | 64 (6.2%) |
| 7:00 AM to 7:29 AM | 146 (15.8%) | 205 (20.0%) |
| 7:30 AM to 7:59 AM | 200 (21.7%) | 60 (5.8%) |
| 8:00 AM to 8:29 AM | 191 (20.7%) | 83 (8.1%) |
| 8:30 AM to 8:59 AM | 5 (0.5%) | 85 (8.3%) |
| 9:00 AM to 9:59 AM | 23 (2.5%) | 143 (13.9%) |
| 10:00 AM to 10:59 AM | 28 (3.0%) | 92 (9.0%) |
| 11:00 AM to 11:59 AM | 4 (0.4%) | 43 (4.2%) |
| 12:00 PM to 3:59 PM | 75 (8.1%) | 49 (4.8%) |
| 4:00 PM to 11:59 PM | 76 (8.2%) | 95 (9.2%) |
| Total | 922 (100.0%) | 1,027 (100.0%) |
Housing Occupancy in Southgate
Occupancy by Ownership in Southgate
Of the total 1,823 dwellings in Southgate, owner-occupied units account for 1,043 (57.2%), while renter-occupied units make up 780 (42.8%).
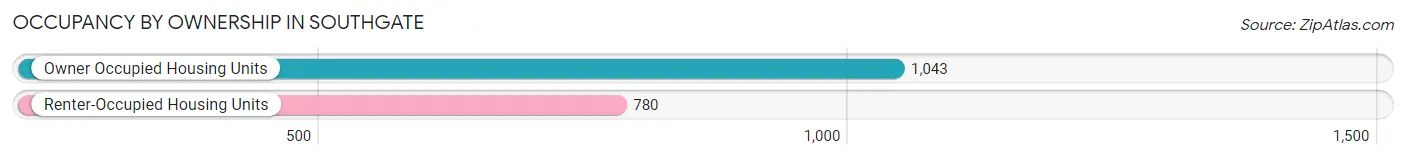
| Occupancy | # Housing Units | % Housing Units |
| Owner Occupied Housing Units | 1,043 | 57.2% |
| Renter-Occupied Housing Units | 780 | 42.8% |
| Total Occupied Housing Units | 1,823 | 100.0% |
Occupancy by Household Size in Southgate
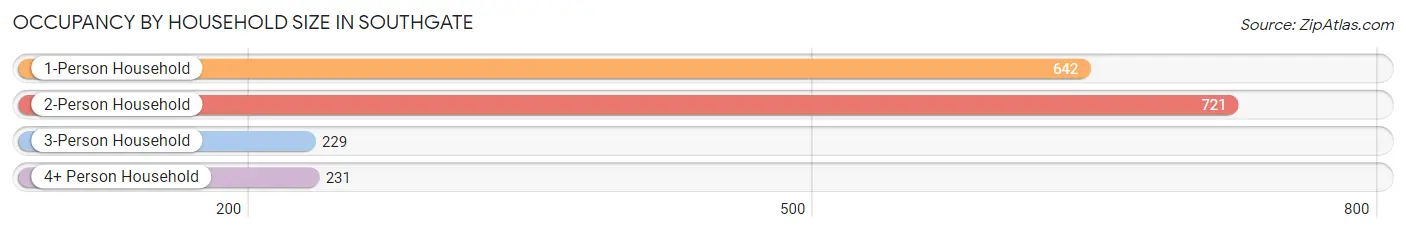
| Household Size | # Housing Units | % Housing Units |
| 1-Person Household | 642 | 35.2% |
| 2-Person Household | 721 | 39.6% |
| 3-Person Household | 229 | 12.6% |
| 4+ Person Household | 231 | 12.7% |
| Total Housing Units | 1,823 | 100.0% |
Occupancy by Ownership by Household Size in Southgate
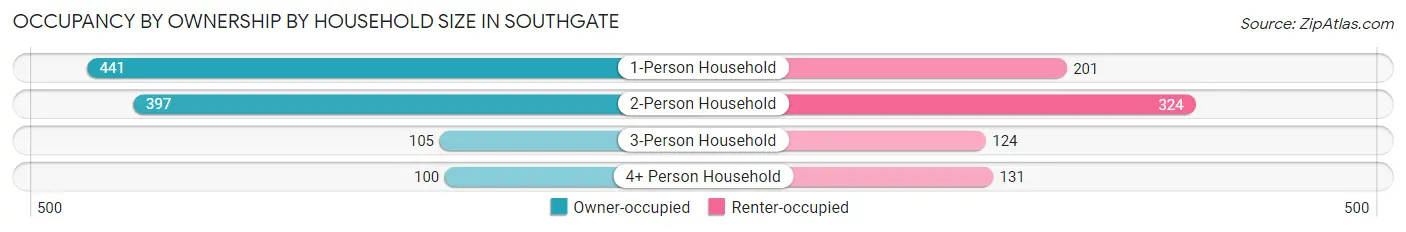
| Household Size | Owner-occupied | Renter-occupied |
| 1-Person Household | 441 (68.7%) | 201 (31.3%) |
| 2-Person Household | 397 (55.1%) | 324 (44.9%) |
| 3-Person Household | 105 (45.9%) | 124 (54.1%) |
| 4+ Person Household | 100 (43.3%) | 131 (56.7%) |
| Total Housing Units | 1,043 (57.2%) | 780 (42.8%) |
Occupancy by Educational Attainment in Southgate
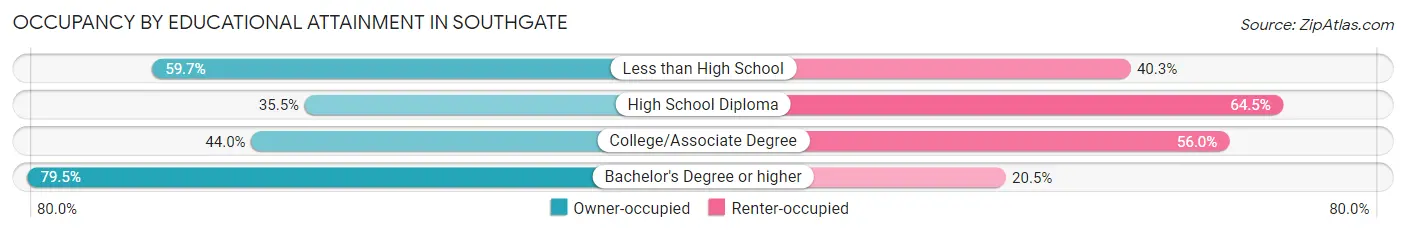
| Household Size | Owner-occupied | Renter-occupied |
| Less than High School | 46 (59.7%) | 31 (40.3%) |
| High School Diploma | 134 (35.5%) | 243 (64.5%) |
| College/Associate Degree | 280 (44.0%) | 356 (56.0%) |
| Bachelor's Degree or higher | 583 (79.5%) | 150 (20.5%) |
Occupancy by Age of Householder in Southgate
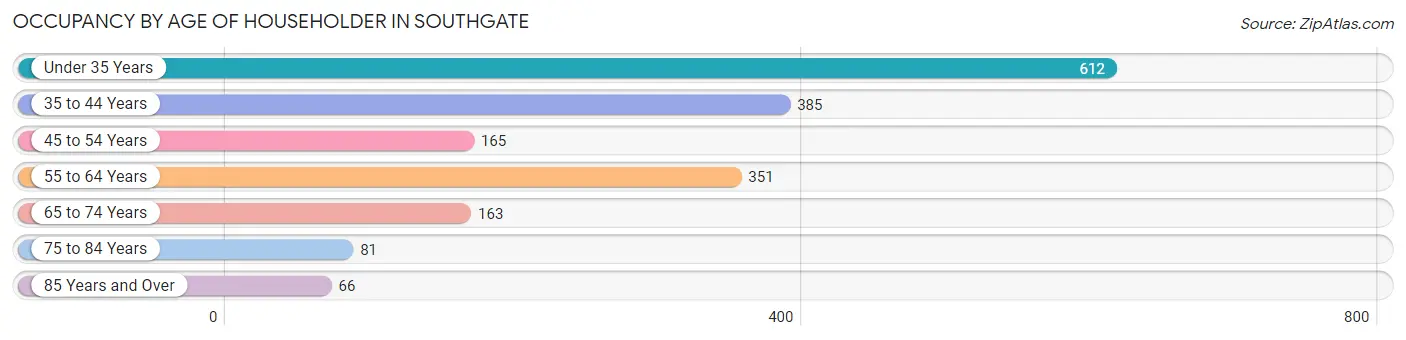
| Age Bracket | # Households | % Households |
| Under 35 Years | 612 | 33.6% |
| 35 to 44 Years | 385 | 21.1% |
| 45 to 54 Years | 165 | 9.0% |
| 55 to 64 Years | 351 | 19.3% |
| 65 to 74 Years | 163 | 8.9% |
| 75 to 84 Years | 81 | 4.4% |
| 85 Years and Over | 66 | 3.6% |
| Total | 1,823 | 100.0% |
Housing Finances in Southgate
Median Income by Occupancy in Southgate
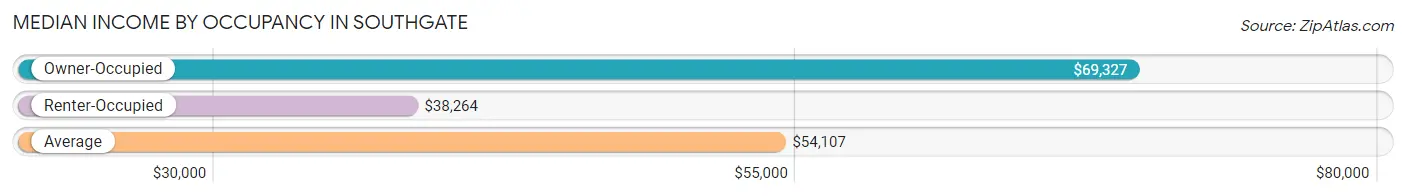
| Occupancy Type | # Households | Median Income |
| Owner-Occupied | 1,043 (57.2%) | $69,327 |
| Renter-Occupied | 780 (42.8%) | $38,264 |
| Average | 1,823 (100.0%) | $54,107 |
Occupancy by Householder Income Bracket in Southgate
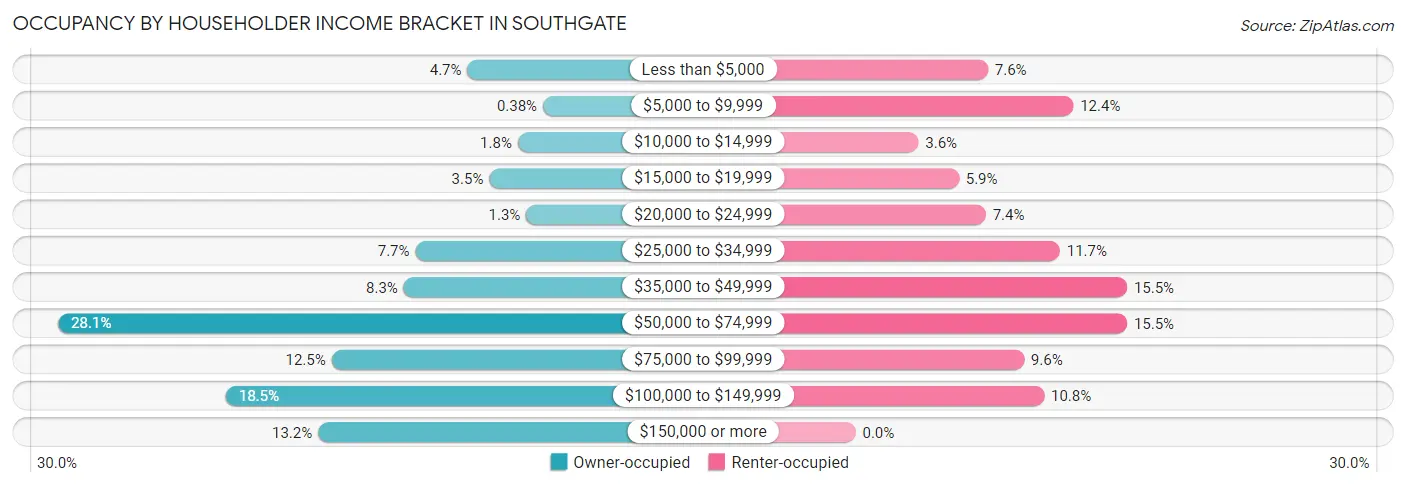
| Income Bracket | Owner-occupied | Renter-occupied |
| Less than $5,000 | 49 (4.7%) | 59 (7.6%) |
| $5,000 to $9,999 | 4 (0.4%) | 97 (12.4%) |
| $10,000 to $14,999 | 19 (1.8%) | 28 (3.6%) |
| $15,000 to $19,999 | 36 (3.5%) | 46 (5.9%) |
| $20,000 to $24,999 | 14 (1.3%) | 58 (7.4%) |
| $25,000 to $34,999 | 80 (7.7%) | 91 (11.7%) |
| $35,000 to $49,999 | 87 (8.3%) | 121 (15.5%) |
| $50,000 to $74,999 | 293 (28.1%) | 121 (15.5%) |
| $75,000 to $99,999 | 130 (12.5%) | 75 (9.6%) |
| $100,000 to $149,999 | 193 (18.5%) | 84 (10.8%) |
| $150,000 or more | 138 (13.2%) | 0 (0.0%) |
| Total | 1,043 (100.0%) | 780 (100.0%) |
Monthly Housing Cost Tiers in Southgate
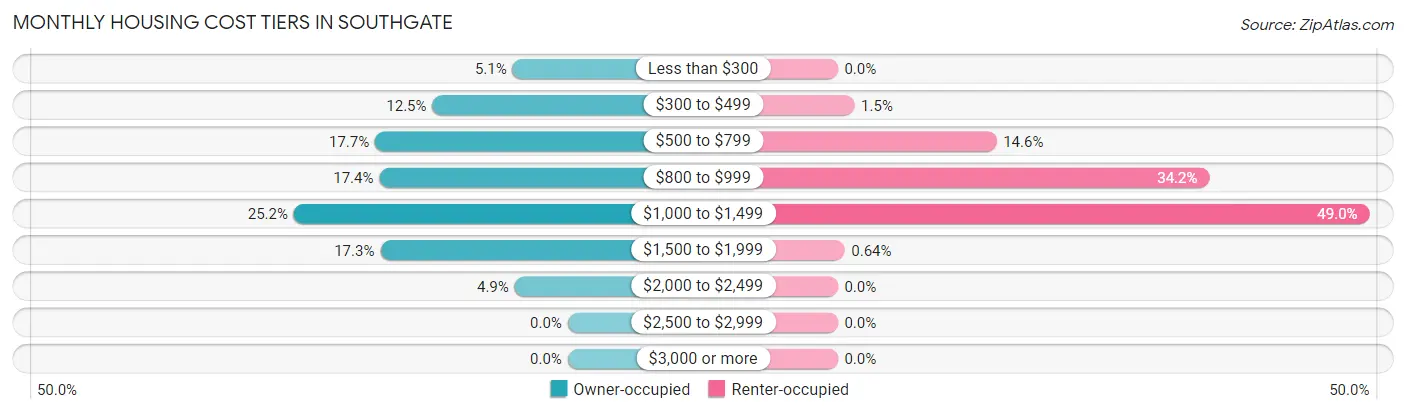
| Monthly Cost | Owner-occupied | Renter-occupied |
| Less than $300 | 53 (5.1%) | 0 (0.0%) |
| $300 to $499 | 130 (12.5%) | 12 (1.5%) |
| $500 to $799 | 185 (17.7%) | 114 (14.6%) |
| $800 to $999 | 181 (17.3%) | 267 (34.2%) |
| $1,000 to $1,499 | 263 (25.2%) | 382 (49.0%) |
| $1,500 to $1,999 | 180 (17.3%) | 5 (0.6%) |
| $2,000 to $2,499 | 51 (4.9%) | 0 (0.0%) |
| $2,500 to $2,999 | 0 (0.0%) | 0 (0.0%) |
| $3,000 or more | 0 (0.0%) | 0 (0.0%) |
| Total | 1,043 (100.0%) | 780 (100.0%) |
Physical Housing Characteristics in Southgate
Housing Structures in Southgate
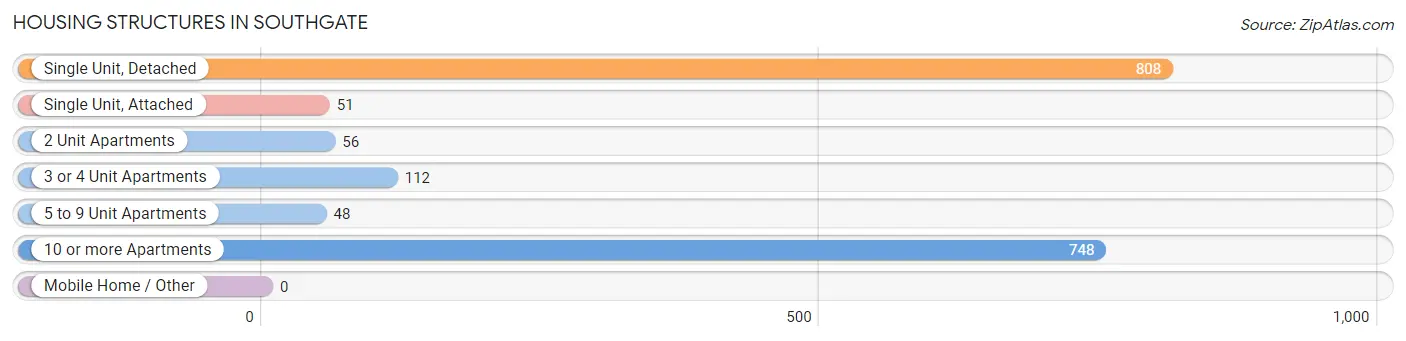
| Structure Type | # Housing Units | % Housing Units |
| Single Unit, Detached | 808 | 44.3% |
| Single Unit, Attached | 51 | 2.8% |
| 2 Unit Apartments | 56 | 3.1% |
| 3 or 4 Unit Apartments | 112 | 6.1% |
| 5 to 9 Unit Apartments | 48 | 2.6% |
| 10 or more Apartments | 748 | 41.0% |
| Mobile Home / Other | 0 | 0.0% |
| Total | 1,823 | 100.0% |
Housing Structures by Occupancy in Southgate
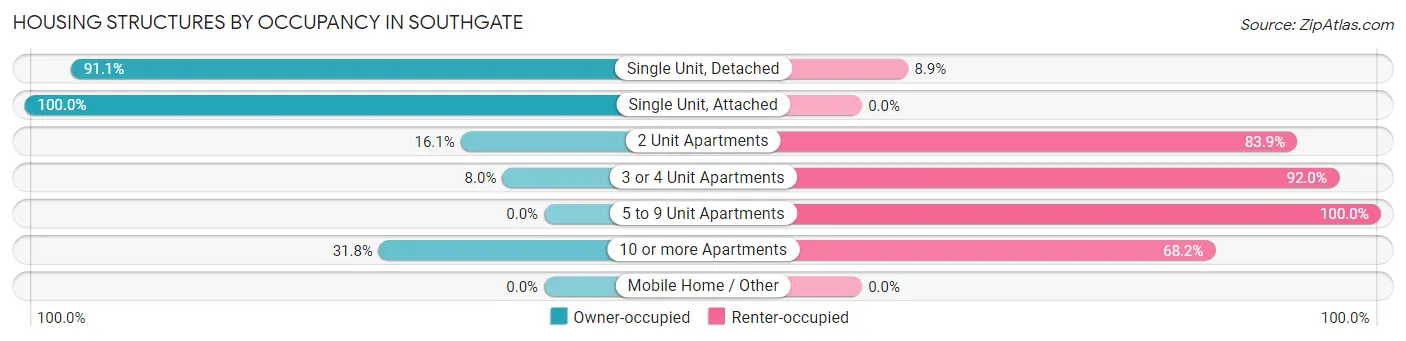
| Structure Type | Owner-occupied | Renter-occupied |
| Single Unit, Detached | 736 (91.1%) | 72 (8.9%) |
| Single Unit, Attached | 51 (100.0%) | 0 (0.0%) |
| 2 Unit Apartments | 9 (16.1%) | 47 (83.9%) |
| 3 or 4 Unit Apartments | 9 (8.0%) | 103 (92.0%) |
| 5 to 9 Unit Apartments | 0 (0.0%) | 48 (100.0%) |
| 10 or more Apartments | 238 (31.8%) | 510 (68.2%) |
| Mobile Home / Other | 0 (0.0%) | 0 (0.0%) |
| Total | 1,043 (57.2%) | 780 (42.8%) |
Housing Structures by Number of Rooms in Southgate
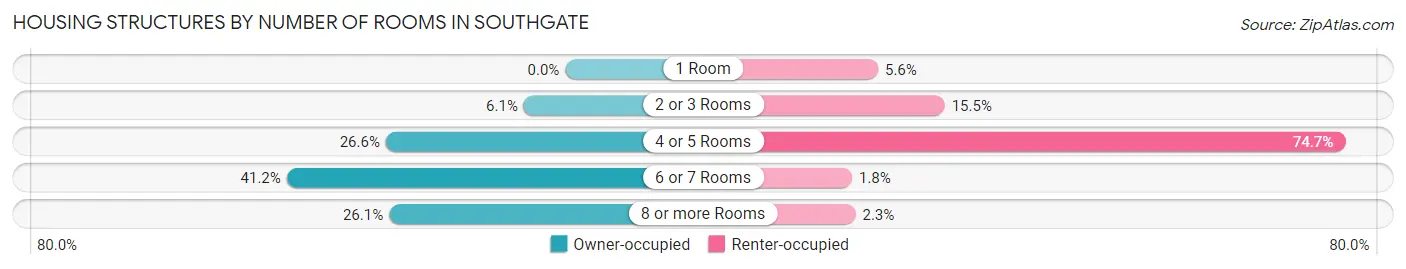
| Number of Rooms | Owner-occupied | Renter-occupied |
| 1 Room | 0 (0.0%) | 44 (5.6%) |
| 2 or 3 Rooms | 64 (6.1%) | 121 (15.5%) |
| 4 or 5 Rooms | 277 (26.6%) | 583 (74.7%) |
| 6 or 7 Rooms | 430 (41.2%) | 14 (1.8%) |
| 8 or more Rooms | 272 (26.1%) | 18 (2.3%) |
| Total | 1,043 (100.0%) | 780 (100.0%) |
Housing Structure by Heating Type in Southgate
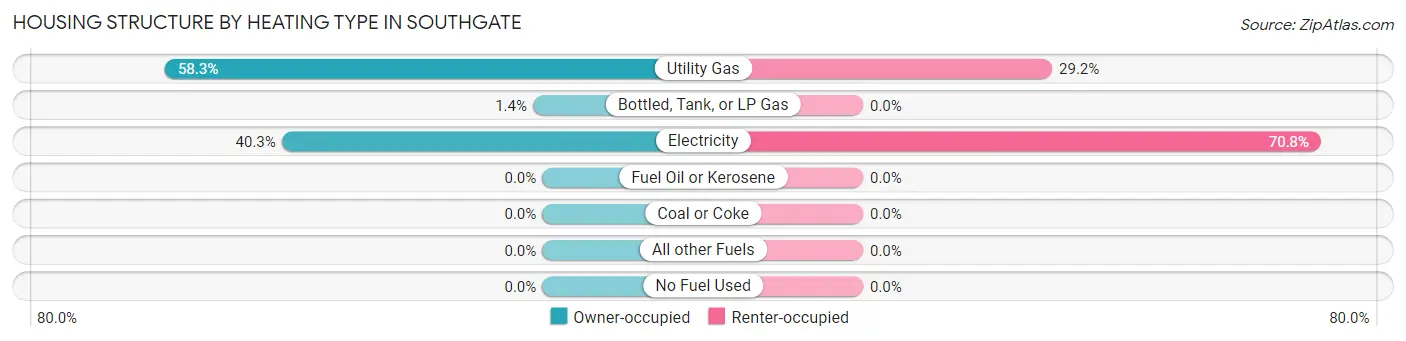
| Heating Type | Owner-occupied | Renter-occupied |
| Utility Gas | 608 (58.3%) | 228 (29.2%) |
| Bottled, Tank, or LP Gas | 15 (1.4%) | 0 (0.0%) |
| Electricity | 420 (40.3%) | 552 (70.8%) |
| Fuel Oil or Kerosene | 0 (0.0%) | 0 (0.0%) |
| Coal or Coke | 0 (0.0%) | 0 (0.0%) |
| All other Fuels | 0 (0.0%) | 0 (0.0%) |
| No Fuel Used | 0 (0.0%) | 0 (0.0%) |
| Total | 1,043 (100.0%) | 780 (100.0%) |
Household Vehicle Usage in Southgate
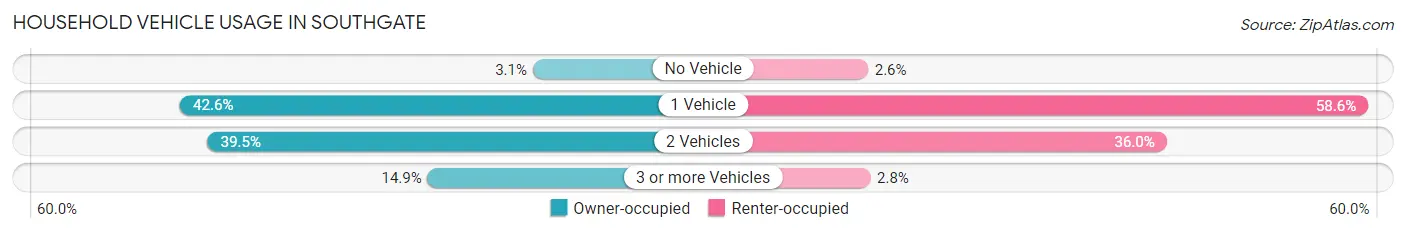
| Vehicles per Household | Owner-occupied | Renter-occupied |
| No Vehicle | 32 (3.1%) | 20 (2.6%) |
| 1 Vehicle | 444 (42.6%) | 457 (58.6%) |
| 2 Vehicles | 412 (39.5%) | 281 (36.0%) |
| 3 or more Vehicles | 155 (14.9%) | 22 (2.8%) |
| Total | 1,043 (100.0%) | 780 (100.0%) |
Real Estate & Mortgages in Southgate
Real Estate and Mortgage Overview in Southgate
| Characteristic | Without Mortgage | With Mortgage |
| Housing Units | 465 | 578 |
| Median Property Value | $161,100 | $180,200 |
| Median Household Income | $51,835 | $116 |
| Monthly Housing Costs | $550 | $0 |
| Real Estate Taxes | $1,715 | $12 |
Property Value by Mortgage Status in Southgate
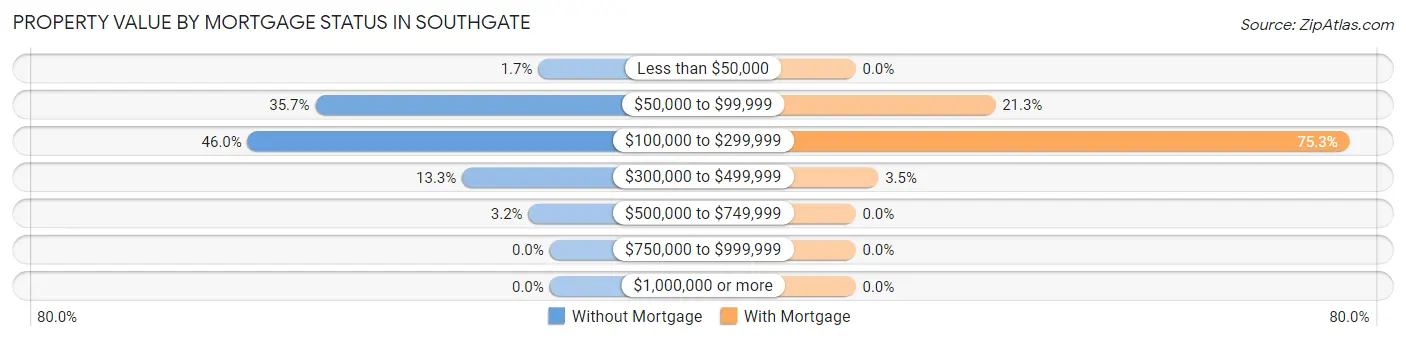
| Property Value | Without Mortgage | With Mortgage |
| Less than $50,000 | 8 (1.7%) | 0 (0.0%) |
| $50,000 to $99,999 | 166 (35.7%) | 123 (21.3%) |
| $100,000 to $299,999 | 214 (46.0%) | 435 (75.3%) |
| $300,000 to $499,999 | 62 (13.3%) | 20 (3.5%) |
| $500,000 to $749,999 | 15 (3.2%) | 0 (0.0%) |
| $750,000 to $999,999 | 0 (0.0%) | 0 (0.0%) |
| $1,000,000 or more | 0 (0.0%) | 0 (0.0%) |
| Total | 465 (100.0%) | 578 (100.0%) |
Household Income by Mortgage Status in Southgate
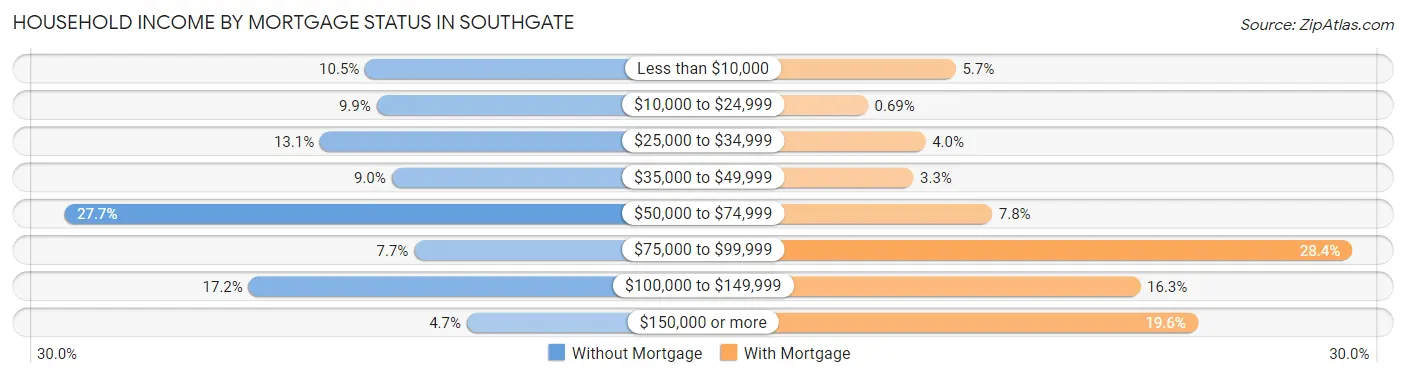
| Household Income | Without Mortgage | With Mortgage |
| Less than $10,000 | 49 (10.5%) | 33 (5.7%) |
| $10,000 to $24,999 | 46 (9.9%) | 4 (0.7%) |
| $25,000 to $34,999 | 61 (13.1%) | 23 (4.0%) |
| $35,000 to $49,999 | 42 (9.0%) | 19 (3.3%) |
| $50,000 to $74,999 | 129 (27.7%) | 45 (7.8%) |
| $75,000 to $99,999 | 36 (7.7%) | 164 (28.4%) |
| $100,000 to $149,999 | 80 (17.2%) | 94 (16.3%) |
| $150,000 or more | 22 (4.7%) | 113 (19.6%) |
| Total | 465 (100.0%) | 578 (100.0%) |
Property Value to Household Income Ratio in Southgate
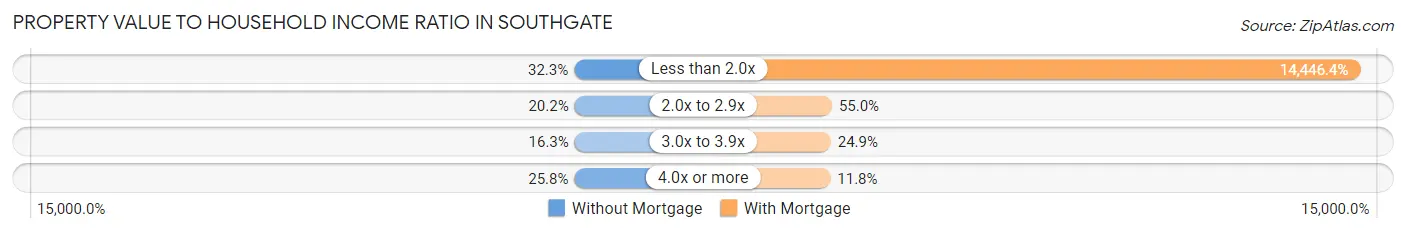
| Value-to-Income Ratio | Without Mortgage | With Mortgage |
| Less than 2.0x | 150 (32.3%) | 83,500 (14,446.4%) |
| 2.0x to 2.9x | 94 (20.2%) | 318 (55.0%) |
| 3.0x to 3.9x | 76 (16.3%) | 144 (24.9%) |
| 4.0x or more | 120 (25.8%) | 68 (11.8%) |
| Total | 465 (100.0%) | 578 (100.0%) |
Real Estate Taxes by Mortgage Status in Southgate
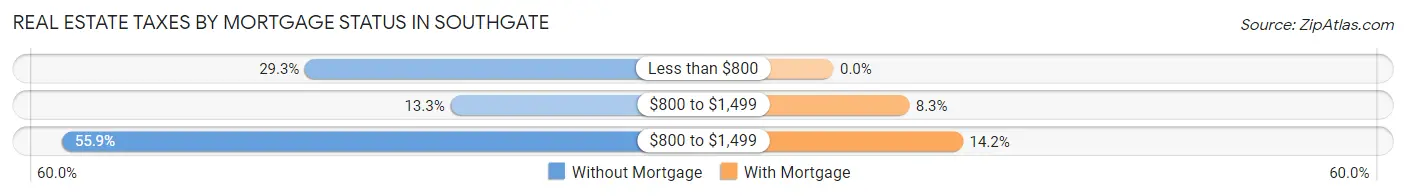
| Property Taxes | Without Mortgage | With Mortgage |
| Less than $800 | 136 (29.2%) | 0 (0.0%) |
| $800 to $1,499 | 62 (13.3%) | 48 (8.3%) |
| $800 to $1,499 | 260 (55.9%) | 82 (14.2%) |
| Total | 465 (100.0%) | 578 (100.0%) |
Health & Disability in Southgate
Health Insurance Coverage by Age in Southgate
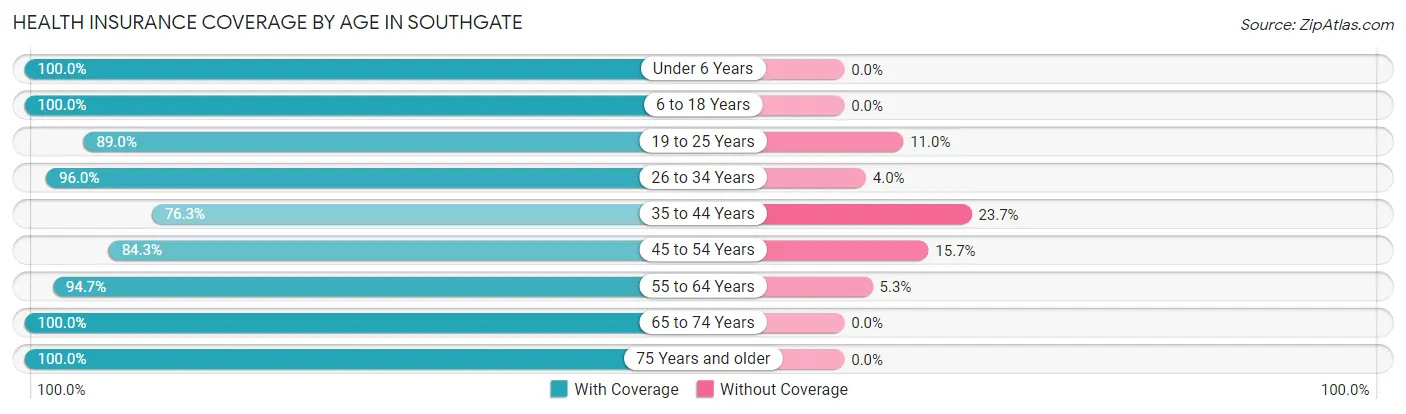
| Age Bracket | With Coverage | Without Coverage |
| Under 6 Years | 211 (100.0%) | 0 (0.0%) |
| 6 to 18 Years | 617 (100.0%) | 0 (0.0%) |
| 19 to 25 Years | 340 (89.0%) | 42 (11.0%) |
| 26 to 34 Years | 620 (96.0%) | 26 (4.0%) |
| 35 to 44 Years | 370 (76.3%) | 115 (23.7%) |
| 45 to 54 Years | 231 (84.3%) | 43 (15.7%) |
| 55 to 64 Years | 574 (94.7%) | 32 (5.3%) |
| 65 to 74 Years | 258 (100.0%) | 0 (0.0%) |
| 75 Years and older | 198 (100.0%) | 0 (0.0%) |
| Total | 3,419 (93.0%) | 258 (7.0%) |
Health Insurance Coverage by Citizenship Status in Southgate
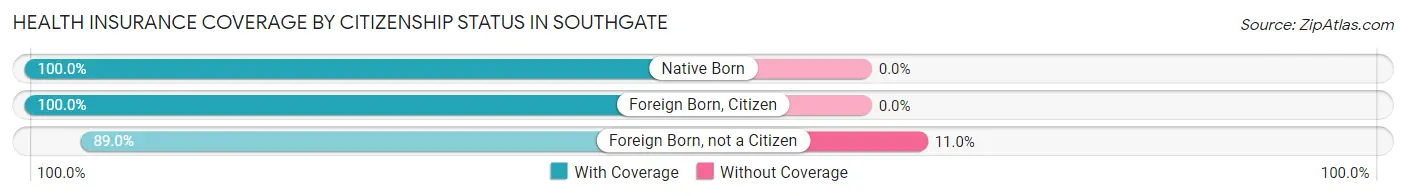
| Citizenship Status | With Coverage | Without Coverage |
| Native Born | 211 (100.0%) | 0 (0.0%) |
| Foreign Born, Citizen | 617 (100.0%) | 0 (0.0%) |
| Foreign Born, not a Citizen | 340 (89.0%) | 42 (11.0%) |
Health Insurance Coverage by Household Income in Southgate
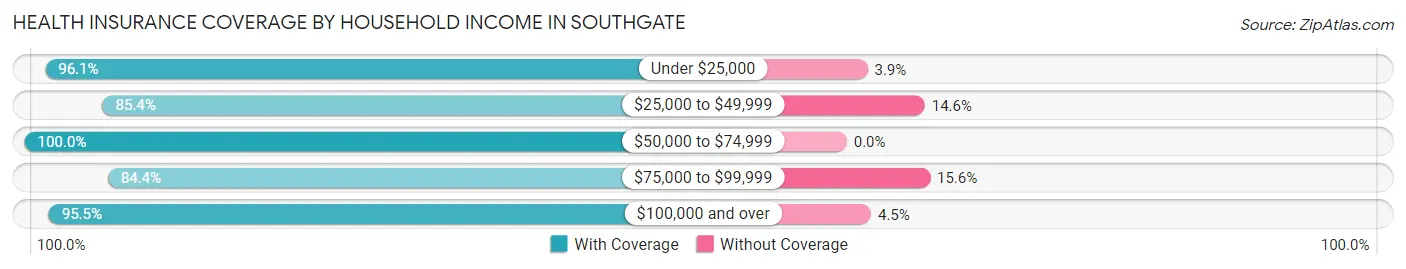
| Household Income | With Coverage | Without Coverage |
| Under $25,000 | 743 (96.1%) | 30 (3.9%) |
| $25,000 to $49,999 | 596 (85.4%) | 102 (14.6%) |
| $50,000 to $74,999 | 679 (100.0%) | 0 (0.0%) |
| $75,000 to $99,999 | 433 (84.4%) | 80 (15.6%) |
| $100,000 and over | 968 (95.5%) | 46 (4.5%) |
Public vs Private Health Insurance Coverage by Age in Southgate
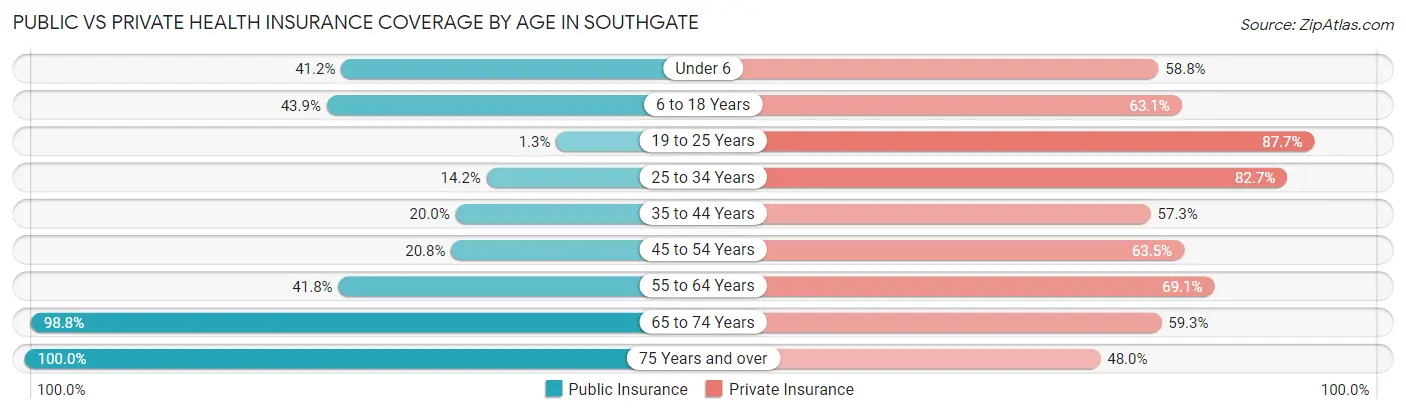
| Age Bracket | Public Insurance | Private Insurance |
| Under 6 | 87 (41.2%) | 124 (58.8%) |
| 6 to 18 Years | 271 (43.9%) | 389 (63.0%) |
| 19 to 25 Years | 5 (1.3%) | 335 (87.7%) |
| 25 to 34 Years | 92 (14.2%) | 534 (82.7%) |
| 35 to 44 Years | 97 (20.0%) | 278 (57.3%) |
| 45 to 54 Years | 57 (20.8%) | 174 (63.5%) |
| 55 to 64 Years | 253 (41.7%) | 419 (69.1%) |
| 65 to 74 Years | 255 (98.8%) | 153 (59.3%) |
| 75 Years and over | 198 (100.0%) | 95 (48.0%) |
| Total | 1,315 (35.8%) | 2,501 (68.0%) |
Disability Status by Sex by Age in Southgate
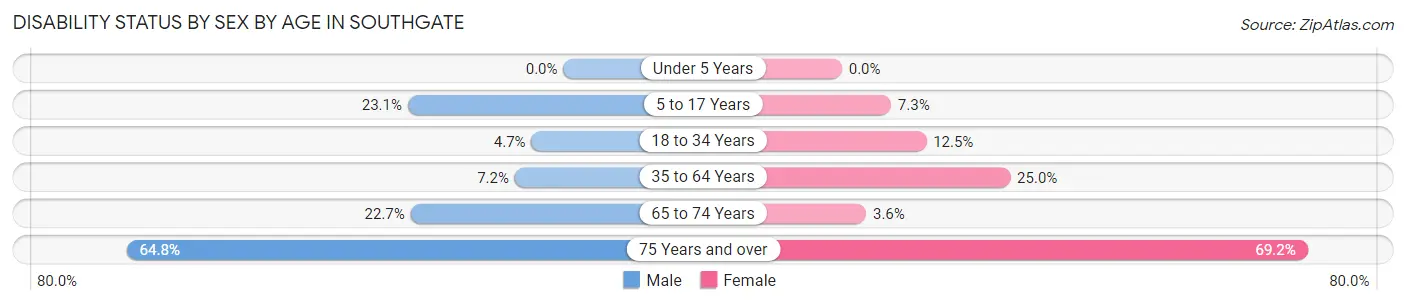
| Age Bracket | Male | Female |
| Under 5 Years | 0 (0.0%) | 0 (0.0%) |
| 5 to 17 Years | 70 (23.1%) | 25 (7.3%) |
| 18 to 34 Years | 26 (4.7%) | 60 (12.5%) |
| 35 to 64 Years | 37 (7.2%) | 213 (25.0%) |
| 65 to 74 Years | 27 (22.7%) | 5 (3.6%) |
| 75 Years and over | 59 (64.8%) | 74 (69.2%) |
Disability Class by Sex by Age in Southgate
Disability Class: Hearing Difficulty
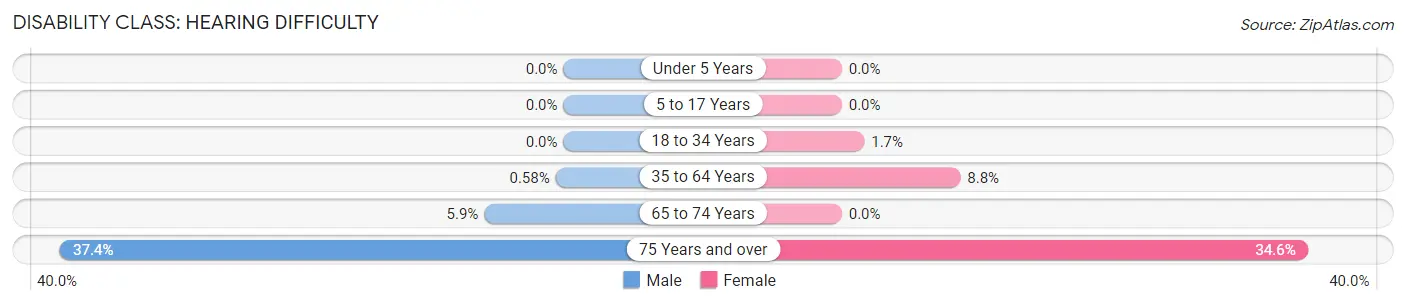
| Age Bracket | Male | Female |
| Under 5 Years | 0 (0.0%) | 0 (0.0%) |
| 5 to 17 Years | 0 (0.0%) | 0 (0.0%) |
| 18 to 34 Years | 0 (0.0%) | 8 (1.7%) |
| 35 to 64 Years | 3 (0.6%) | 75 (8.8%) |
| 65 to 74 Years | 7 (5.9%) | 0 (0.0%) |
| 75 Years and over | 34 (37.4%) | 37 (34.6%) |
Disability Class: Vision Difficulty
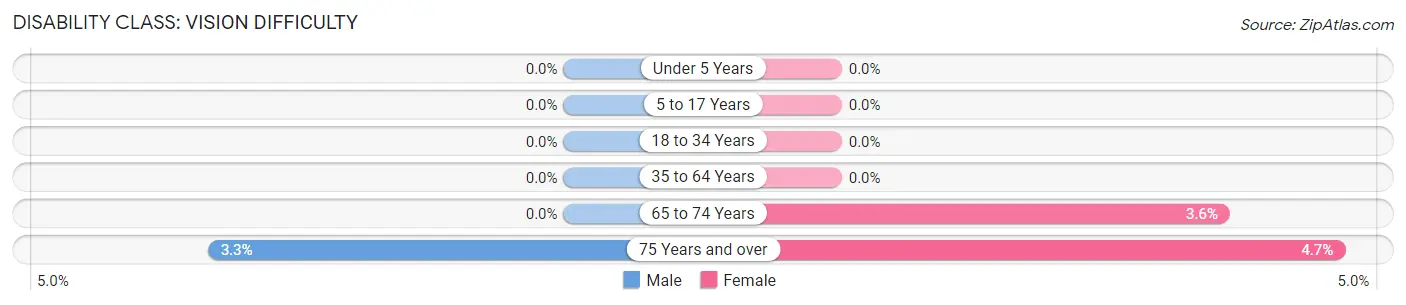
| Age Bracket | Male | Female |
| Under 5 Years | 0 (0.0%) | 0 (0.0%) |
| 5 to 17 Years | 0 (0.0%) | 0 (0.0%) |
| 18 to 34 Years | 0 (0.0%) | 0 (0.0%) |
| 35 to 64 Years | 0 (0.0%) | 0 (0.0%) |
| 65 to 74 Years | 0 (0.0%) | 5 (3.6%) |
| 75 Years and over | 3 (3.3%) | 5 (4.7%) |
Disability Class: Cognitive Difficulty
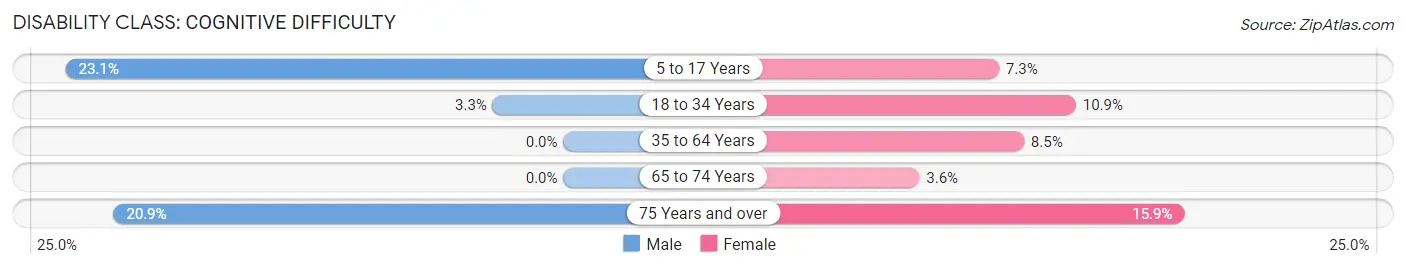
| Age Bracket | Male | Female |
| 5 to 17 Years | 70 (23.1%) | 25 (7.3%) |
| 18 to 34 Years | 18 (3.3%) | 52 (10.9%) |
| 35 to 64 Years | 0 (0.0%) | 72 (8.5%) |
| 65 to 74 Years | 0 (0.0%) | 5 (3.6%) |
| 75 Years and over | 19 (20.9%) | 17 (15.9%) |
Disability Class: Ambulatory Difficulty
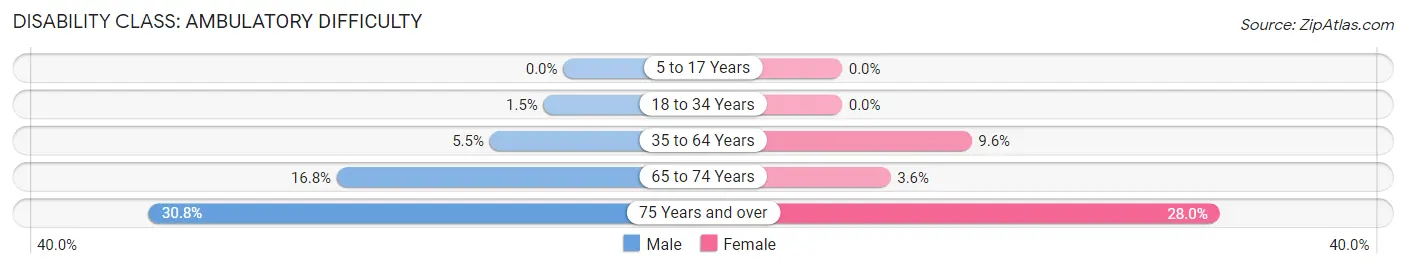
| Age Bracket | Male | Female |
| 5 to 17 Years | 0 (0.0%) | 0 (0.0%) |
| 18 to 34 Years | 8 (1.5%) | 0 (0.0%) |
| 35 to 64 Years | 28 (5.5%) | 82 (9.6%) |
| 65 to 74 Years | 20 (16.8%) | 5 (3.6%) |
| 75 Years and over | 28 (30.8%) | 30 (28.0%) |
Disability Class: Self-Care Difficulty
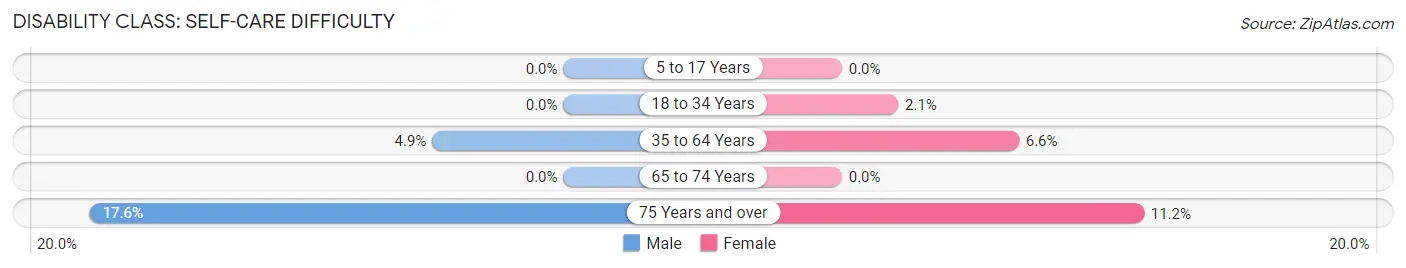
| Age Bracket | Male | Female |
| 5 to 17 Years | 0 (0.0%) | 0 (0.0%) |
| 18 to 34 Years | 0 (0.0%) | 10 (2.1%) |
| 35 to 64 Years | 25 (4.9%) | 56 (6.6%) |
| 65 to 74 Years | 0 (0.0%) | 0 (0.0%) |
| 75 Years and over | 16 (17.6%) | 12 (11.2%) |
Technology Access in Southgate
Computing Device Access in Southgate
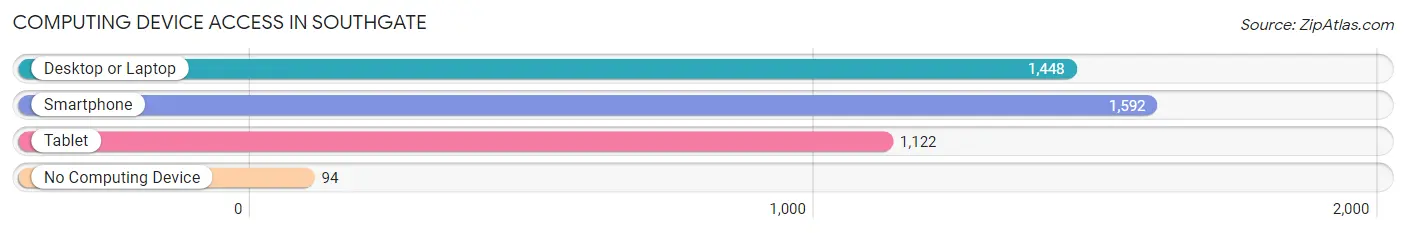
| Device Type | # Households | % Households |
| Desktop or Laptop | 1,448 | 79.4% |
| Smartphone | 1,592 | 87.3% |
| Tablet | 1,122 | 61.6% |
| No Computing Device | 94 | 5.2% |
| Total | 1,823 | 100.0% |
Internet Access in Southgate
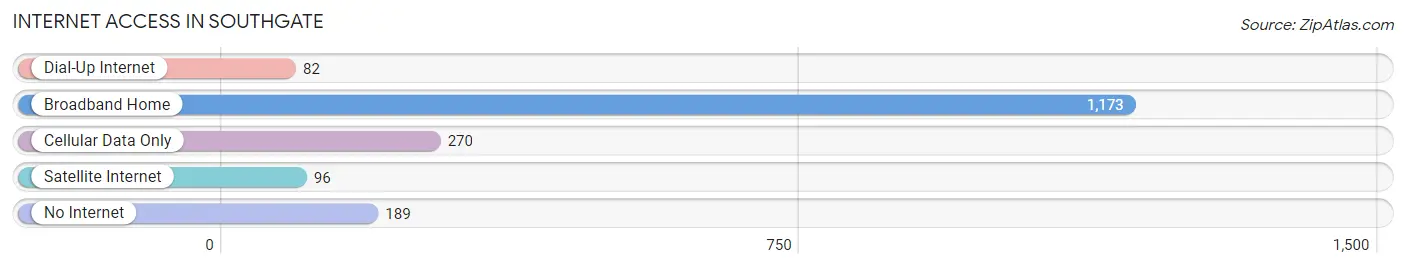
| Internet Type | # Households | % Households |
| Dial-Up Internet | 82 | 4.5% |
| Broadband Home | 1,173 | 64.3% |
| Cellular Data Only | 270 | 14.8% |
| Satellite Internet | 96 | 5.3% |
| No Internet | 189 | 10.4% |
| Total | 1,823 | 100.0% |
Southgate Summary
History
Southgate is a small city located in Campbell County, Kentucky. It is situated on the Ohio River, just south of Cincinnati, Ohio. The city was founded in 1817 by William Southgate, a Revolutionary War veteran. Southgate was originally a small farming community, but it has since grown into a thriving city with a population of over 8,000 people.
The city has a rich history that dates back to the early 1800s. During the Civil War, Southgate was a major supply center for the Union Army. After the war, the city experienced a period of growth and prosperity. In the late 1800s, the city was home to several factories, including a paper mill, a flour mill, and a tobacco factory.
In the early 1900s, Southgate was a popular destination for tourists. The city was home to several resorts, including the Southgate Hotel and the Southgate Casino. The city also had a thriving entertainment scene, with several theaters, restaurants, and bars.
In the 1950s, Southgate experienced a period of decline. The factories closed and the city’s population began to decline. In the 1970s, the city began to experience a resurgence. The city was revitalized with the construction of a new shopping center and the opening of a new hospital.
Today, Southgate is a vibrant city with a diverse population. The city is home to several businesses, including a large shopping mall, a movie theater, and several restaurants. The city also has several parks and recreational facilities.
Geography
Southgate is located in Campbell County, Kentucky. The city is situated on the Ohio River, just south of Cincinnati, Ohio. The city is bordered by the cities of Newport, Bellevue, and Fort Thomas. The city covers an area of 4.3 square miles and has a population of 8,000 people.
The city is located in a hilly region of Kentucky. The terrain is mostly flat, with some rolling hills. The city is located in a temperate climate, with hot summers and cold winters. The average temperature in the summer is around 80 degrees Fahrenheit, and the average temperature in the winter is around 40 degrees Fahrenheit.
Economy
Southgate’s economy is largely based on the service industry. The city is home to several businesses, including a large shopping mall, a movie theater, and several restaurants. The city also has several parks and recreational facilities.
The city is also home to several manufacturing companies, including a paper mill, a flour mill, and a tobacco factory. The city is also home to several technology companies, including a software development company and a medical device manufacturer.
Demographics
As of the 2010 census, Southgate had a population of 8,000 people. The city has a diverse population, with a mix of races and ethnicities. The largest racial group is white, making up 78.3% of the population. The second largest racial group is African American, making up 15.2% of the population. Other racial groups include Asian (3.2%), Hispanic (2.2%), and Native American (1.1%).
The median household income in Southgate is $45,000. The median age is 38 years old. The city has a high rate of homeownership, with over 70% of the population owning their own homes. The city also has a high rate of educational attainment, with over 90% of the population having a high school diploma or higher.
Common Questions
What is Per Capita Income in Southgate?
Per Capita income in Southgate is $33,831.
What is the Median Family Income in Southgate?
Median Family Income in Southgate is $68,466.
What is the Median Household income in Southgate?
Median Household Income in Southgate is $54,107.
What is Income or Wage Gap in Southgate?
Income or Wage Gap in Southgate is 25.0%.
Women in Southgate earn 75.0 cents for every dollar earned by a man.
What is Inequality or Gini Index in Southgate?
Inequality or Gini Index in Southgate is 0.44.
What is the Total Population of Southgate?
Total Population of Southgate is 3,677.
What is the Total Male Population of Southgate?
Total Male Population of Southgate is 1,650.
What is the Total Female Population of Southgate?
Total Female Population of Southgate is 2,027.
What is the Ratio of Males per 100 Females in Southgate?
There are 81.40 Males per 100 Females in Southgate.
What is the Ratio of Females per 100 Males in Southgate?
There are 122.85 Females per 100 Males in Southgate.
What is the Median Population Age in Southgate?
Median Population Age in Southgate is 33.9 Years.
What is the Average Family Size in Southgate
Average Family Size in Southgate is 2.7 People.
What is the Average Household Size in Southgate
Average Household Size in Southgate is 2.0 People.
How Large is the Labor Force in Southgate?
There are 2,156 People in the Labor Forcein in Southgate.
What is the Percentage of People in the Labor Force in Southgate?
74.9% of People are in the Labor Force in Southgate.
What is the Unemployment Rate in Southgate?
Unemployment Rate in Southgate is 4.6%.