Mount Vernon, KY Map & Demographics
Mount Vernon Map
Mount Vernon Overview
$19,933
PER CAPITA INCOME
$49,531
AVG FAMILY INCOME
$34,550
AVG HOUSEHOLD INCOME
37.6%
WAGE / INCOME GAP [ % ]
62.4¢/ $1
WAGE / INCOME GAP [ $ ]
0.51
INEQUALITY / GINI INDEX
2,342
TOTAL POPULATION
1,138
MALE POPULATION
1,204
FEMALE POPULATION
94.52
MALES / 100 FEMALES
105.80
FEMALES / 100 MALES
45.4
MEDIAN AGE
3.1
AVG FAMILY SIZE
2.4
AVG HOUSEHOLD SIZE
876
LABOR FORCE [ PEOPLE ]
45.3%
PERCENT IN LABOR FORCE
3.7%
UNEMPLOYMENT RATE
Mount Vernon Zip Codes
Mount Vernon Area Codes
Income in Mount Vernon
Income Overview in Mount Vernon
Per Capita Income in Mount Vernon is $19,933, while median incomes of families and households are $49,531 and $34,550 respectively.
| Characteristic | Number | Measure |
| Per Capita Income | 2,342 | $19,933 |
| Median Family Income | 560 | $49,531 |
| Mean Family Income | 560 | $61,403 |
| Median Household Income | 889 | $34,550 |
| Mean Household Income | 889 | $47,788 |
| Income Deficit | 560 | $0 |
| Wage / Income Gap (%) | 2,342 | 37.62% |
| Wage / Income Gap ($) | 2,342 | 62.38¢ per $1 |
| Gini / Inequality Index | 2,342 | 0.51 |
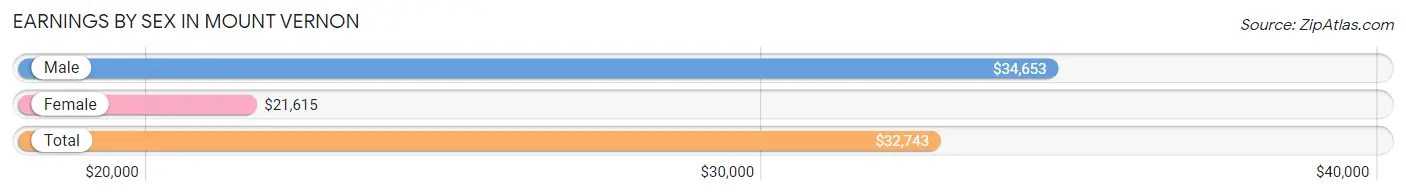
Earnings by Sex in Mount Vernon
Average Earnings in Mount Vernon are $32,743, $34,653 for men and $21,615 for women, a difference of 37.6%.
| Sex | Number | Average Earnings |
| Male | 604 (62.5%) | $34,653 |
| Female | 362 (37.5%) | $21,615 |
| Total | 966 (100.0%) | $32,743 |
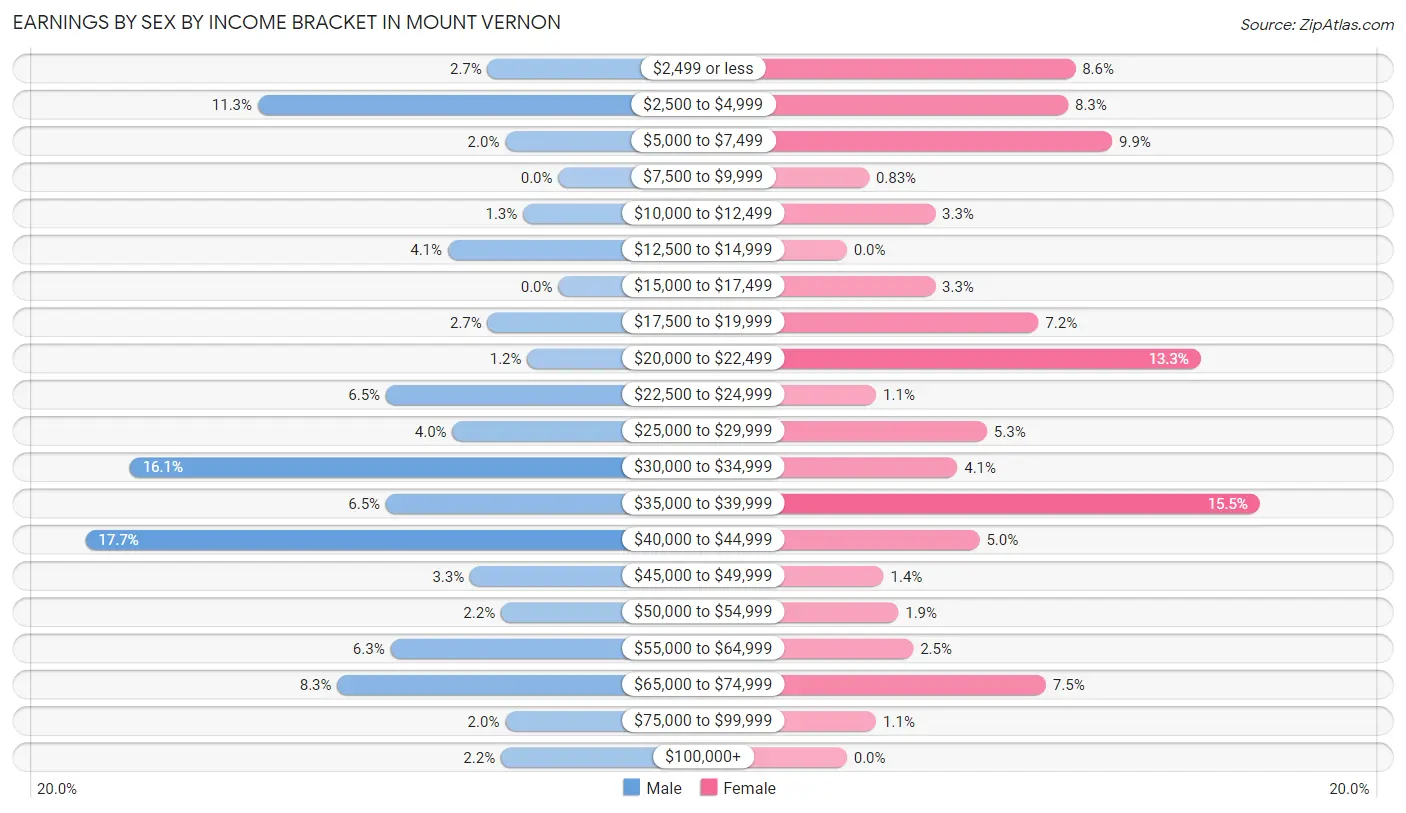
Earnings by Sex by Income Bracket in Mount Vernon
The most common earnings brackets in Mount Vernon are $40,000 to $44,999 for men (107 | 17.7%) and $35,000 to $39,999 for women (56 | 15.5%).
| Income | Male | Female |
| $2,499 or less | 16 (2.6%) | 31 (8.6%) |
| $2,500 to $4,999 | 68 (11.3%) | 30 (8.3%) |
| $5,000 to $7,499 | 12 (2.0%) | 36 (9.9%) |
| $7,500 to $9,999 | 0 (0.0%) | 3 (0.8%) |
| $10,000 to $12,499 | 8 (1.3%) | 12 (3.3%) |
| $12,500 to $14,999 | 25 (4.1%) | 0 (0.0%) |
| $15,000 to $17,499 | 0 (0.0%) | 12 (3.3%) |
| $17,500 to $19,999 | 16 (2.6%) | 26 (7.2%) |
| $20,000 to $22,499 | 7 (1.2%) | 48 (13.3%) |
| $22,500 to $24,999 | 39 (6.5%) | 4 (1.1%) |
| $25,000 to $29,999 | 24 (4.0%) | 19 (5.2%) |
| $30,000 to $34,999 | 97 (16.1%) | 15 (4.1%) |
| $35,000 to $39,999 | 39 (6.5%) | 56 (15.5%) |
| $40,000 to $44,999 | 107 (17.7%) | 18 (5.0%) |
| $45,000 to $49,999 | 20 (3.3%) | 5 (1.4%) |
| $50,000 to $54,999 | 13 (2.1%) | 7 (1.9%) |
| $55,000 to $64,999 | 38 (6.3%) | 9 (2.5%) |
| $65,000 to $74,999 | 50 (8.3%) | 27 (7.5%) |
| $75,000 to $99,999 | 12 (2.0%) | 4 (1.1%) |
| $100,000+ | 13 (2.1%) | 0 (0.0%) |
| Total | 604 (100.0%) | 362 (100.0%) |
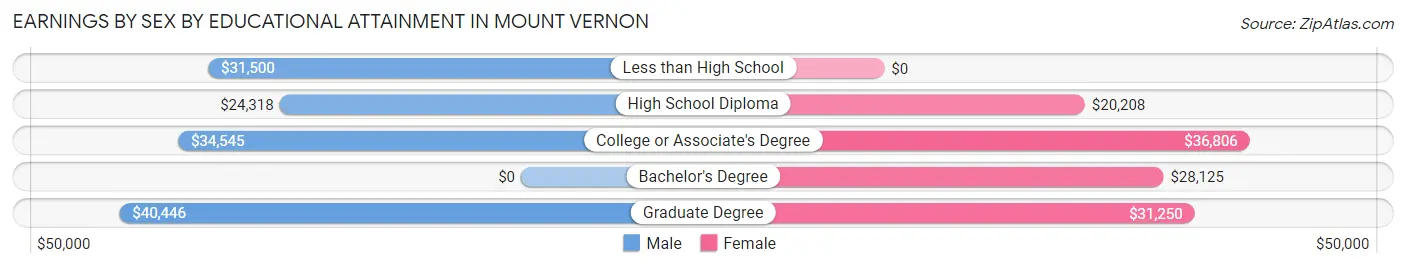
Earnings by Sex by Educational Attainment in Mount Vernon
Average earnings in Mount Vernon are $34,659 for men and $24,375 for women, a difference of 29.7%. Men with an educational attainment of graduate degree enjoy the highest average annual earnings of $40,446, while those with high school diploma education earn the least with $24,318. Women with an educational attainment of college or associate's degree earn the most with the average annual earnings of $36,806, while those with high school diploma education have the smallest earnings of $20,208.
| Educational Attainment | Male Income | Female Income |
| Less than High School | $31,500 | $0 |
| High School Diploma | $24,318 | $20,208 |
| College or Associate's Degree | $34,545 | $36,806 |
| Bachelor's Degree | - | - |
| Graduate Degree | $40,446 | $31,250 |
| Total | $34,659 | $24,375 |
Family Income in Mount Vernon
Family Income Brackets in Mount Vernon
According to the Mount Vernon family income data, there are 116 families falling into the $75,000 to $99,999 income range, which is the most common income bracket and makes up 20.7% of all families. Conversely, the $150,000 to $199,999 income bracket is the least frequent group with only 4 families (0.7%) belonging to this category.
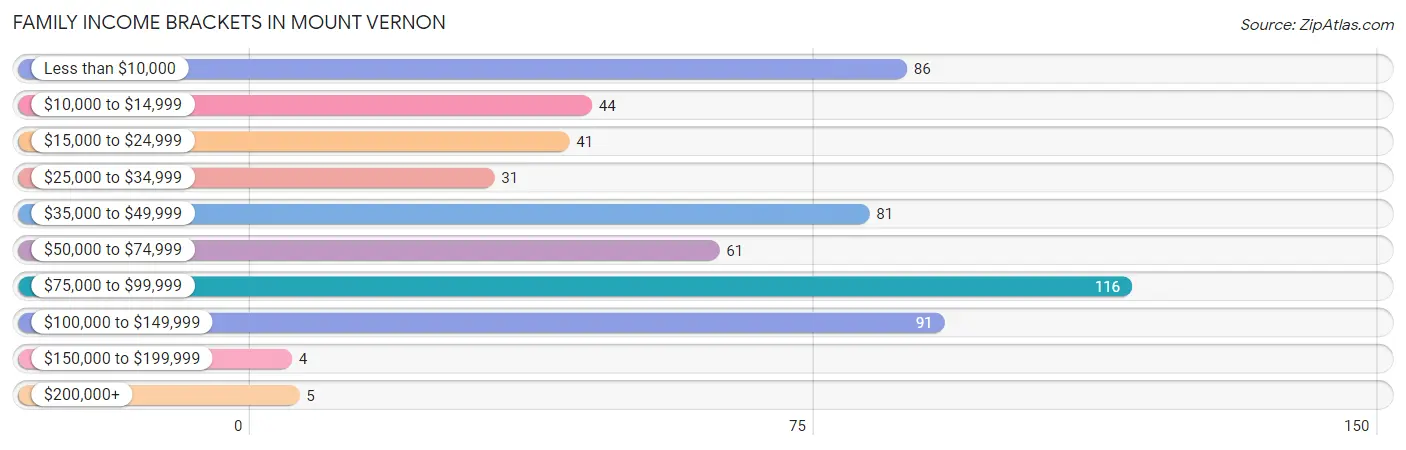
| Income Bracket | # Families | % Families |
| Less than $10,000 | 86 | 15.4% |
| $10,000 to $14,999 | 44 | 7.9% |
| $15,000 to $24,999 | 41 | 7.3% |
| $25,000 to $34,999 | 31 | 5.5% |
| $35,000 to $49,999 | 81 | 14.5% |
| $50,000 to $74,999 | 61 | 10.9% |
| $75,000 to $99,999 | 116 | 20.7% |
| $100,000 to $149,999 | 91 | 16.3% |
| $150,000 to $199,999 | 4 | 0.7% |
| $200,000+ | 5 | 0.9% |
Family Income by Famaliy Size in Mount Vernon
4-person families (34 | 6.1%) account for the highest median family income in Mount Vernon with $66,250 per family, while 2-person families (233 | 41.6%) have the highest median income of $32,768 per family member.
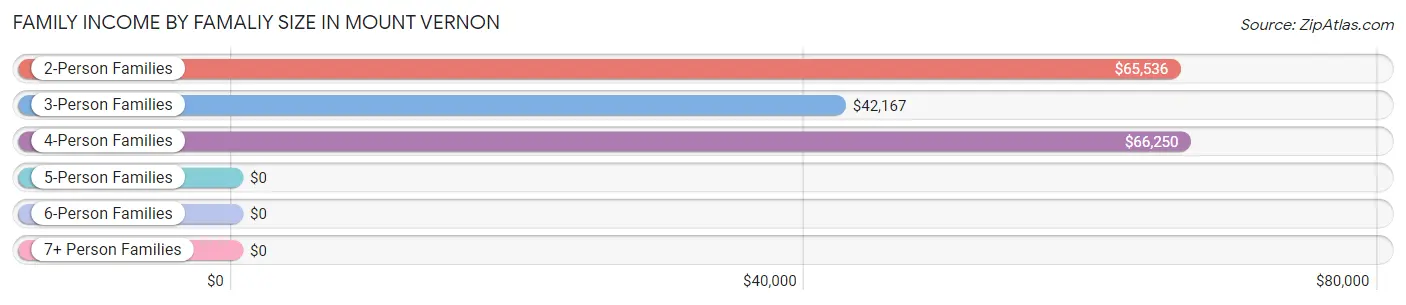
| Income Bracket | # Families | Median Income |
| 2-Person Families | 233 (41.6%) | $65,536 |
| 3-Person Families | 250 (44.6%) | $42,167 |
| 4-Person Families | 34 (6.1%) | $66,250 |
| 5-Person Families | 30 (5.4%) | $0 |
| 6-Person Families | 12 (2.1%) | $0 |
| 7+ Person Families | 1 (0.2%) | $0 |
| Total | 560 (100.0%) | $49,531 |
Family Income by Number of Earners in Mount Vernon
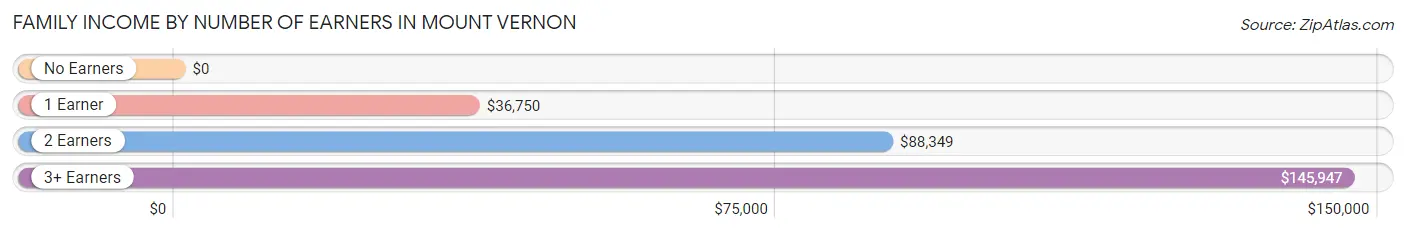
| Number of Earners | # Families | Median Income |
| No Earners | 158 (28.2%) | $0 |
| 1 Earner | 183 (32.7%) | $36,750 |
| 2 Earners | 168 (30.0%) | $88,349 |
| 3+ Earners | 51 (9.1%) | $145,947 |
| Total | 560 (100.0%) | $49,531 |
Household Income in Mount Vernon
Household Income Brackets in Mount Vernon
With 174 households falling in the category, the less than $10,000 income range is the most frequent in Mount Vernon, accounting for 19.6% of all households. In contrast, only 4 households (0.4%) fall into the $150,000 to $199,999 income bracket, making it the least populous group.
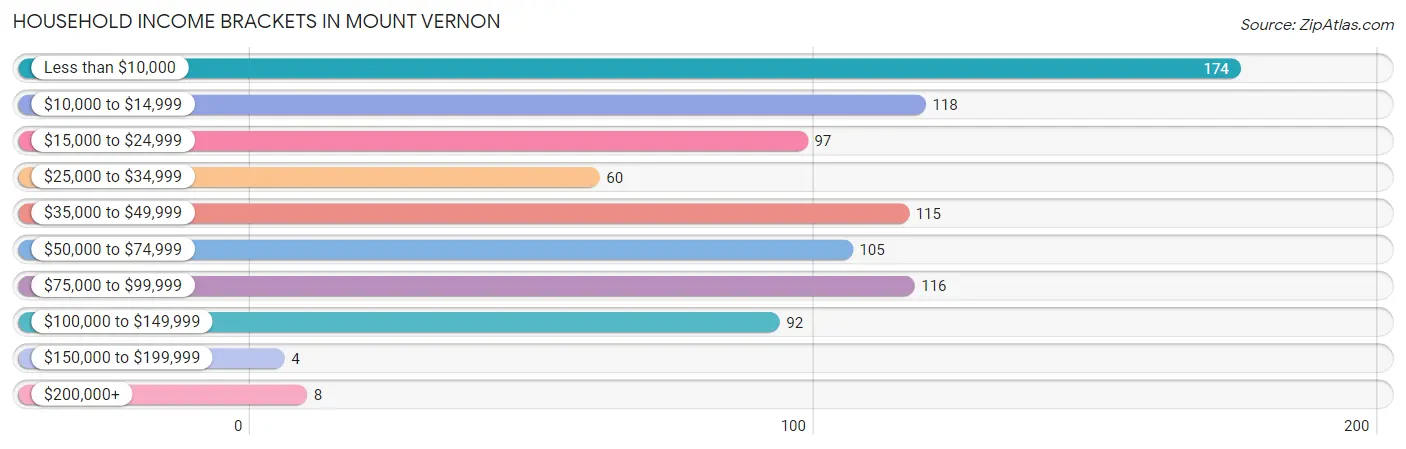
| Income Bracket | # Households | % Households |
| Less than $10,000 | 174 | 19.6% |
| $10,000 to $14,999 | 118 | 13.3% |
| $15,000 to $24,999 | 97 | 10.9% |
| $25,000 to $34,999 | 60 | 6.7% |
| $35,000 to $49,999 | 115 | 12.9% |
| $50,000 to $74,999 | 105 | 11.8% |
| $75,000 to $99,999 | 116 | 13.0% |
| $100,000 to $149,999 | 92 | 10.3% |
| $150,000 to $199,999 | 4 | 0.4% |
| $200,000+ | 8 | 0.9% |
Household Income by Householder Age in Mount Vernon
The median household income in Mount Vernon is $34,550, with the highest median household income of $62,000 found in the 45 to 64 years age bracket for the primary householder. A total of 352 households (39.6%) fall into this category. Meanwhile, the 15 to 24 years age bracket for the primary householder has the lowest median household income of $0, with 69 households (7.8%) in this group.
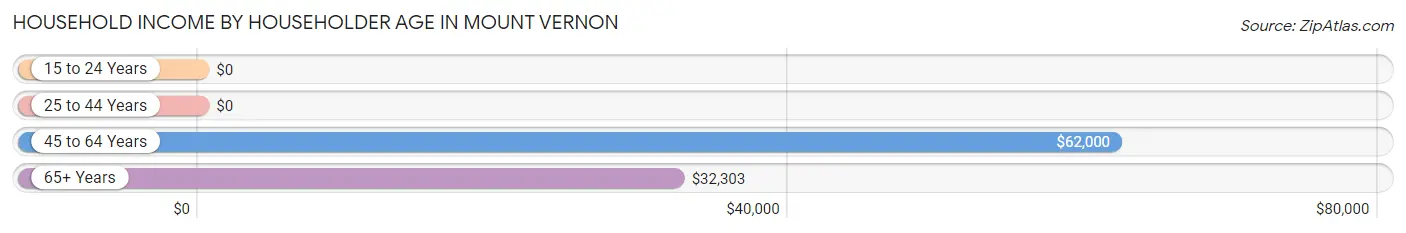
| Income Bracket | # Households | Median Income |
| 15 to 24 Years | 69 (7.8%) | $0 |
| 25 to 44 Years | 159 (17.9%) | $0 |
| 45 to 64 Years | 352 (39.6%) | $62,000 |
| 65+ Years | 309 (34.8%) | $32,303 |
| Total | 889 (100.0%) | $34,550 |
Poverty in Mount Vernon
Income Below Poverty by Sex and Age in Mount Vernon
With 26.6% poverty level for males and 36.3% for females among the residents of Mount Vernon, 6 to 11 year old males and 5 year old females are the most vulnerable to poverty, with 110 males (99.1%) and 12 females (100.0%) in their respective age groups living below the poverty level.
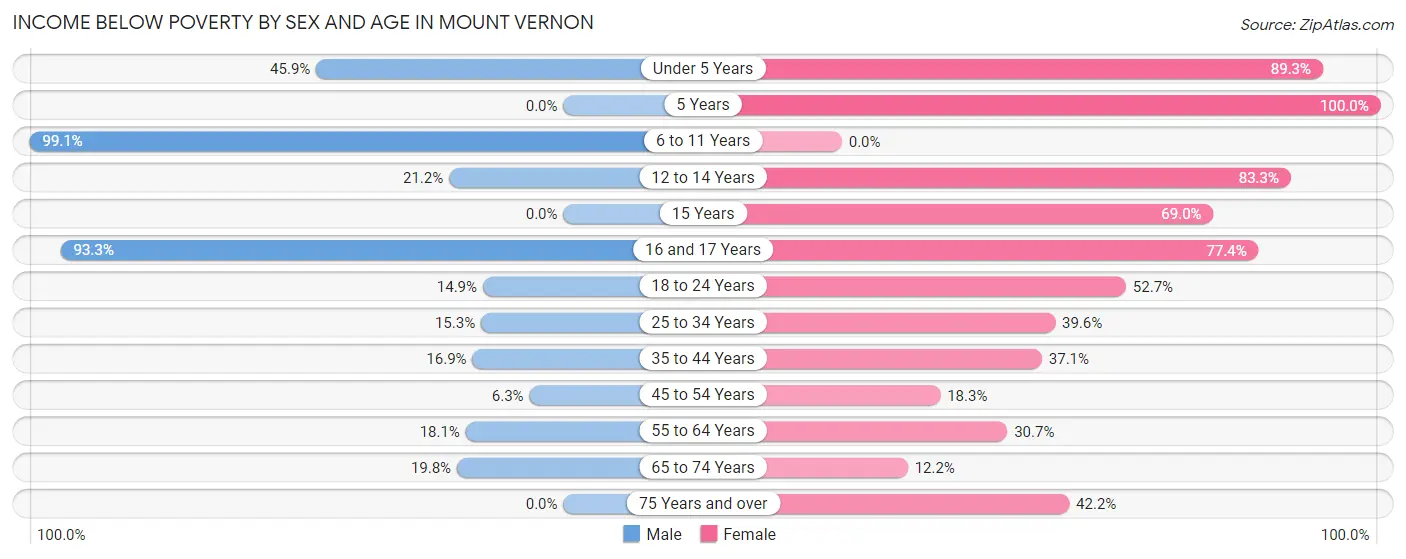
| Age Bracket | Male | Female |
| Under 5 Years | 39 (45.9%) | 50 (89.3%) |
| 5 Years | 0 (0.0%) | 12 (100.0%) |
| 6 to 11 Years | 110 (99.1%) | 0 (0.0%) |
| 12 to 14 Years | 7 (21.2%) | 15 (83.3%) |
| 15 Years | 0 (0.0%) | 20 (69.0%) |
| 16 and 17 Years | 14 (93.3%) | 41 (77.4%) |
| 18 to 24 Years | 26 (14.9%) | 29 (52.7%) |
| 25 to 34 Years | 13 (15.3%) | 38 (39.6%) |
| 35 to 44 Years | 13 (16.9%) | 52 (37.1%) |
| 45 to 54 Years | 8 (6.3%) | 36 (18.3%) |
| 55 to 64 Years | 35 (18.1%) | 39 (30.7%) |
| 65 to 74 Years | 16 (19.8%) | 17 (12.2%) |
| 75 Years and over | 0 (0.0%) | 46 (42.2%) |
| Total | 281 (26.6%) | 395 (36.3%) |
Income Above Poverty by Sex and Age in Mount Vernon
According to the poverty statistics in Mount Vernon, males aged 15 years and females aged 6 to 11 years are the age groups that are most secure financially, with 100.0% of males and 100.0% of females in these age groups living above the poverty line.
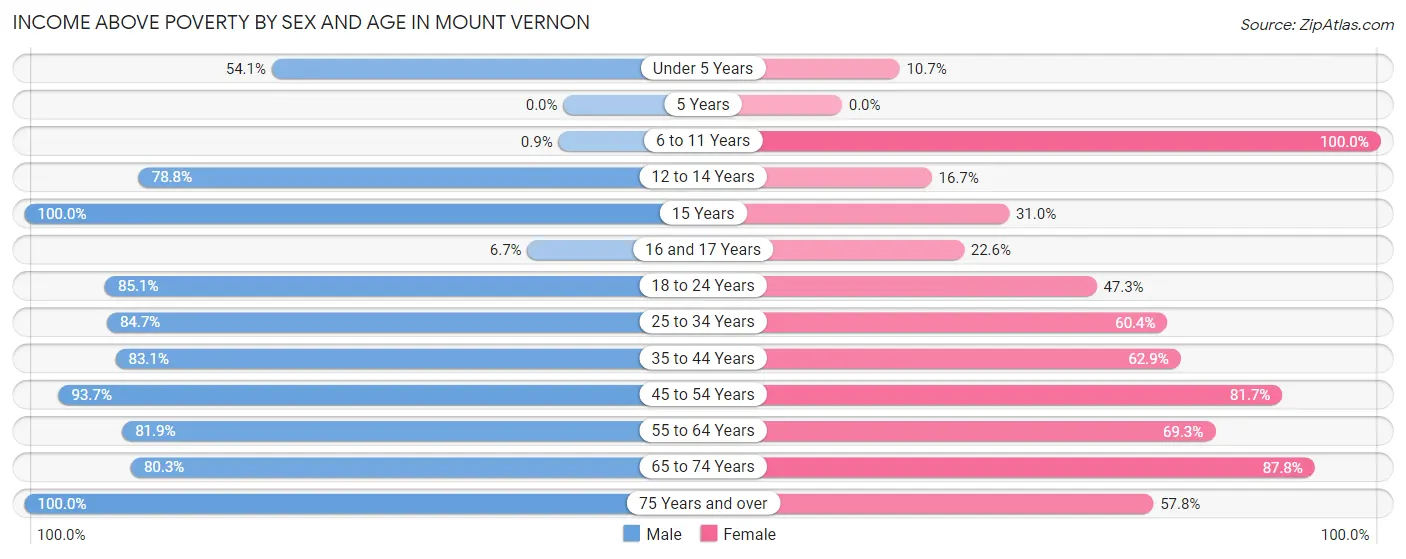
| Age Bracket | Male | Female |
| Under 5 Years | 46 (54.1%) | 6 (10.7%) |
| 5 Years | 0 (0.0%) | 0 (0.0%) |
| 6 to 11 Years | 1 (0.9%) | 58 (100.0%) |
| 12 to 14 Years | 26 (78.8%) | 3 (16.7%) |
| 15 Years | 1 (100.0%) | 9 (31.0%) |
| 16 and 17 Years | 1 (6.7%) | 12 (22.6%) |
| 18 to 24 Years | 148 (85.1%) | 26 (47.3%) |
| 25 to 34 Years | 72 (84.7%) | 58 (60.4%) |
| 35 to 44 Years | 64 (83.1%) | 88 (62.9%) |
| 45 to 54 Years | 119 (93.7%) | 161 (81.7%) |
| 55 to 64 Years | 158 (81.9%) | 88 (69.3%) |
| 65 to 74 Years | 65 (80.2%) | 122 (87.8%) |
| 75 Years and over | 73 (100.0%) | 63 (57.8%) |
| Total | 774 (73.4%) | 694 (63.7%) |
Income Below Poverty Among Married-Couple Families in Mount Vernon
The poverty statistics for married-couple families in Mount Vernon show that 5.6% or 20 of the total 356 families live below the poverty line. Families with 1 or 2 children have the highest poverty rate of 8.1%, comprising of 7 families. On the other hand, families with 3 or 4 children have the lowest poverty rate of 0.0%, which includes 0 families.
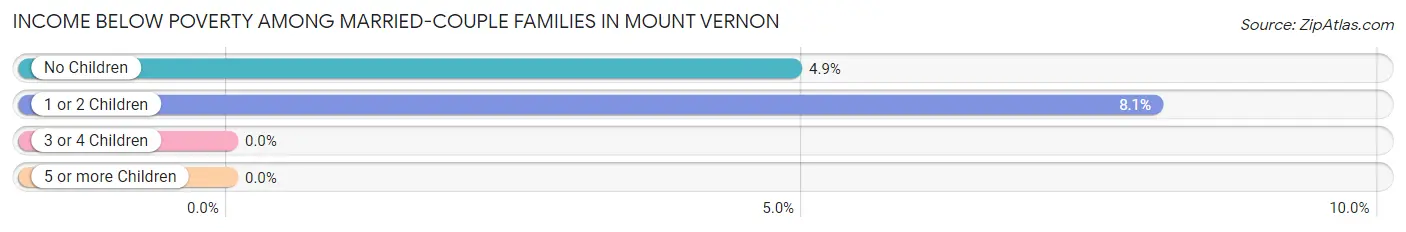
| Children | Above Poverty | Below Poverty |
| No Children | 252 (95.1%) | 13 (4.9%) |
| 1 or 2 Children | 80 (91.9%) | 7 (8.1%) |
| 3 or 4 Children | 3 (100.0%) | 0 (0.0%) |
| 5 or more Children | 1 (100.0%) | 0 (0.0%) |
| Total | 336 (94.4%) | 20 (5.6%) |
Income Below Poverty Among Single-Parent Households in Mount Vernon
According to the poverty data in Mount Vernon, 46.4% or 26 single-father households and 68.9% or 102 single-mother households are living below the poverty line. Among single-father households, those with 1 or 2 children have the highest poverty rate, with 26 households (66.7%) experiencing poverty. Likewise, among single-mother households, those with 3 or 4 children have the highest poverty rate, with 25 households (100.0%) falling below the poverty line.
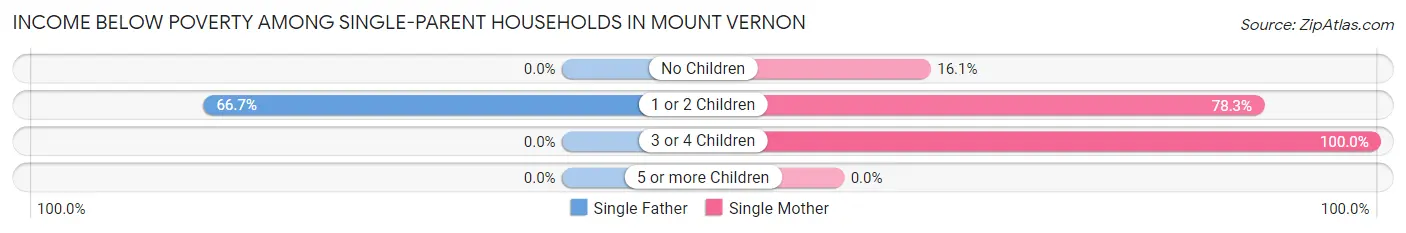
| Children | Single Father | Single Mother |
| No Children | 0 (0.0%) | 5 (16.1%) |
| 1 or 2 Children | 26 (66.7%) | 72 (78.3%) |
| 3 or 4 Children | 0 (0.0%) | 25 (100.0%) |
| 5 or more Children | 0 (0.0%) | 0 (0.0%) |
| Total | 26 (46.4%) | 102 (68.9%) |
Income Below Poverty Among Married-Couple vs Single-Parent Households in Mount Vernon
The poverty data for Mount Vernon shows that 20 of the married-couple family households (5.6%) and 128 of the single-parent households (62.7%) are living below the poverty level. Within the married-couple family households, those with 1 or 2 children have the highest poverty rate, with 7 households (8.1%) falling below the poverty line. Among the single-parent households, those with 3 or 4 children have the highest poverty rate, with 25 household (100.0%) living below poverty.
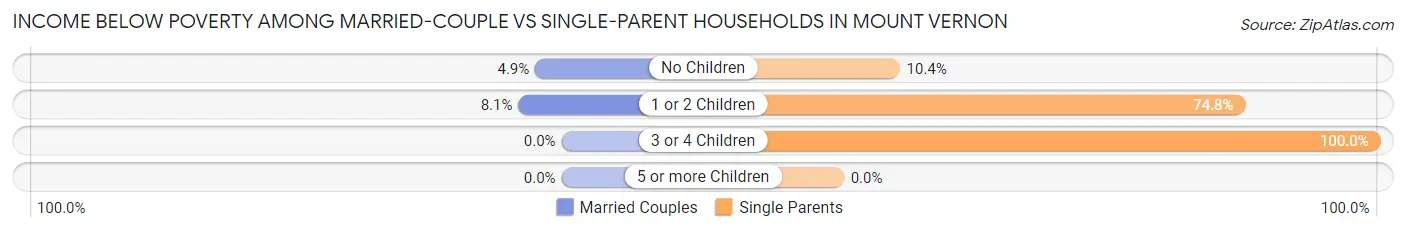
| Children | Married-Couple Families | Single-Parent Households |
| No Children | 13 (4.9%) | 5 (10.4%) |
| 1 or 2 Children | 7 (8.1%) | 98 (74.8%) |
| 3 or 4 Children | 0 (0.0%) | 25 (100.0%) |
| 5 or more Children | 0 (0.0%) | 0 (0.0%) |
| Total | 20 (5.6%) | 128 (62.7%) |
Race in Mount Vernon
The most populous races in Mount Vernon are White / Caucasian (2,179 | 93.0%), Two or more Races (148 | 6.3%), and Native / Alaskan (8 | 0.3%).
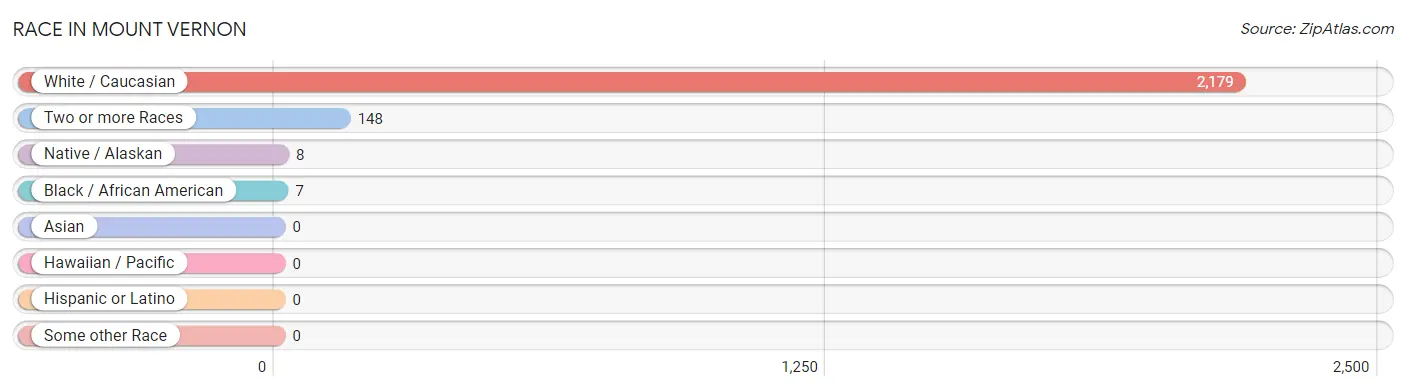
| Race | # Population | % Population |
| Asian | 0 | 0.0% |
| Black / African American | 7 | 0.3% |
| Hawaiian / Pacific | 0 | 0.0% |
| Hispanic or Latino | 0 | 0.0% |
| Native / Alaskan | 8 | 0.3% |
| White / Caucasian | 2,179 | 93.0% |
| Two or more Races | 148 | 6.3% |
| Some other Race | 0 | 0.0% |
| Total | 2,342 | 100.0% |
Ancestry in Mount Vernon
The most populous ancestries reported in Mount Vernon are American (561 | 23.9%), German (317 | 13.5%), English (220 | 9.4%), Irish (133 | 5.7%), and Scottish (118 | 5.0%), together accounting for 57.6% of all Mount Vernon residents.
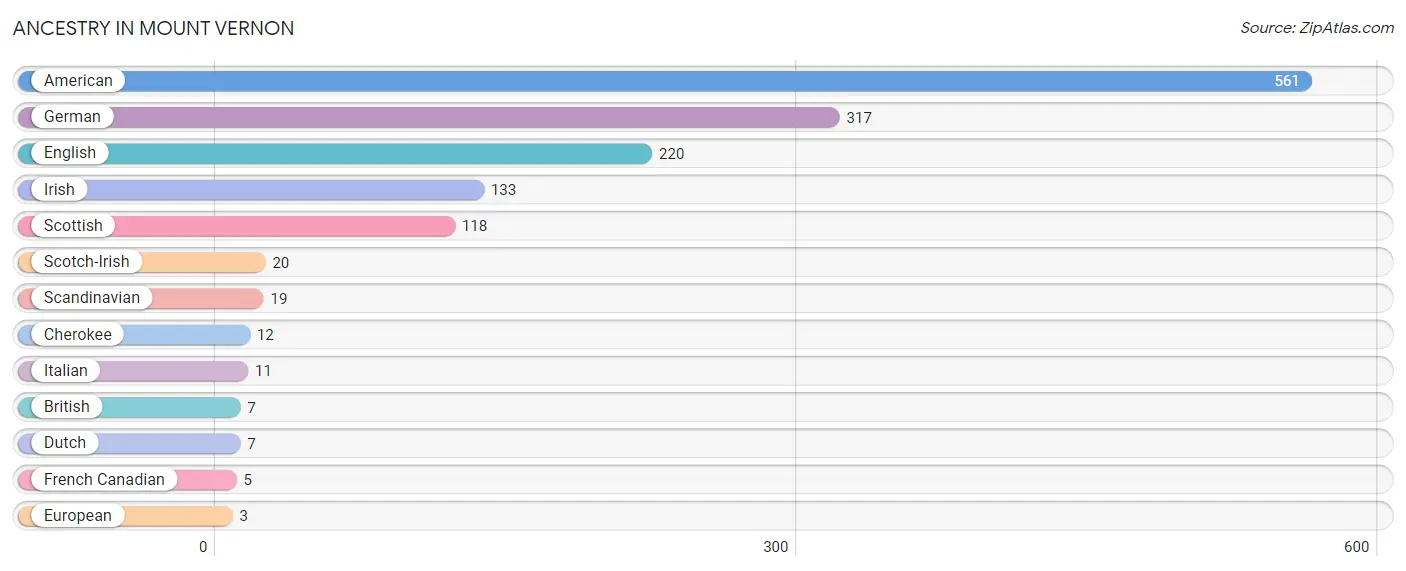
| Ancestry | # Population | % Population |
| American | 561 | 23.9% |
| British | 7 | 0.3% |
| Cherokee | 12 | 0.5% |
| Dutch | 7 | 0.3% |
| English | 220 | 9.4% |
| European | 3 | 0.1% |
| French Canadian | 5 | 0.2% |
| German | 317 | 13.5% |
| Irish | 133 | 5.7% |
| Italian | 11 | 0.5% |
| Scandinavian | 19 | 0.8% |
| Scotch-Irish | 20 | 0.9% |
| Scottish | 118 | 5.0% | View All 13 Rows |
Immigrants in Mount Vernon

| Immigration Origin | # Population | % Population | View All 0 Rows |
Sex and Age in Mount Vernon
Sex and Age in Mount Vernon
The most populous age groups in Mount Vernon are 10 to 14 Years (113 | 9.9%) for men and 70 to 74 Years (110 | 9.1%) for women.
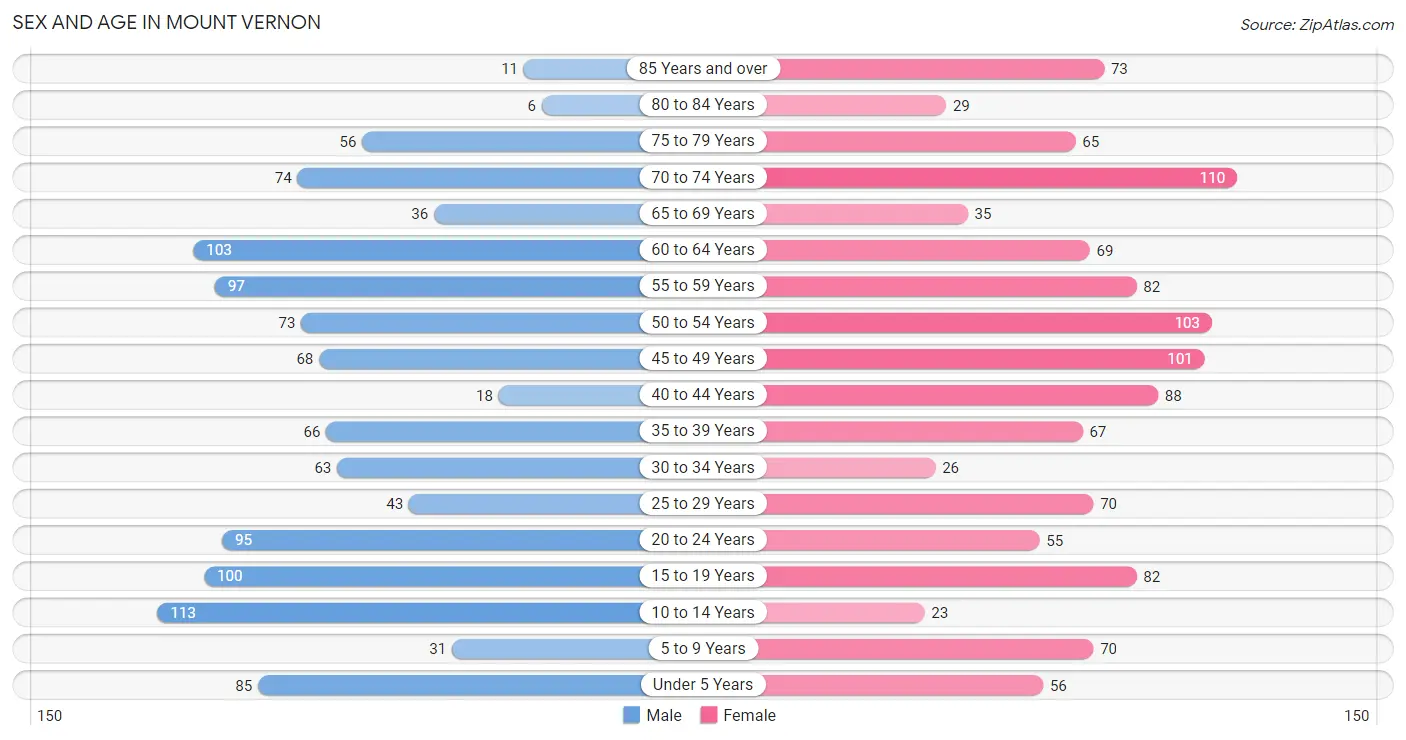
| Age Bracket | Male | Female |
| Under 5 Years | 85 (7.5%) | 56 (4.6%) |
| 5 to 9 Years | 31 (2.7%) | 70 (5.8%) |
| 10 to 14 Years | 113 (9.9%) | 23 (1.9%) |
| 15 to 19 Years | 100 (8.8%) | 82 (6.8%) |
| 20 to 24 Years | 95 (8.4%) | 55 (4.6%) |
| 25 to 29 Years | 43 (3.8%) | 70 (5.8%) |
| 30 to 34 Years | 63 (5.5%) | 26 (2.2%) |
| 35 to 39 Years | 66 (5.8%) | 67 (5.6%) |
| 40 to 44 Years | 18 (1.6%) | 88 (7.3%) |
| 45 to 49 Years | 68 (6.0%) | 101 (8.4%) |
| 50 to 54 Years | 73 (6.4%) | 103 (8.6%) |
| 55 to 59 Years | 97 (8.5%) | 82 (6.8%) |
| 60 to 64 Years | 103 (9.0%) | 69 (5.7%) |
| 65 to 69 Years | 36 (3.2%) | 35 (2.9%) |
| 70 to 74 Years | 74 (6.5%) | 110 (9.1%) |
| 75 to 79 Years | 56 (4.9%) | 65 (5.4%) |
| 80 to 84 Years | 6 (0.5%) | 29 (2.4%) |
| 85 Years and over | 11 (1.0%) | 73 (6.1%) |
| Total | 1,138 (100.0%) | 1,204 (100.0%) |
Families and Households in Mount Vernon
Median Family Size in Mount Vernon
The median family size in Mount Vernon is 3.09 persons per family, with single male/father families (56 | 10.0%) accounting for the largest median family size of 3.95 persons per family. On the other hand, married-couple families (356 | 63.6%) represent the smallest median family size with 2.83 persons per family.
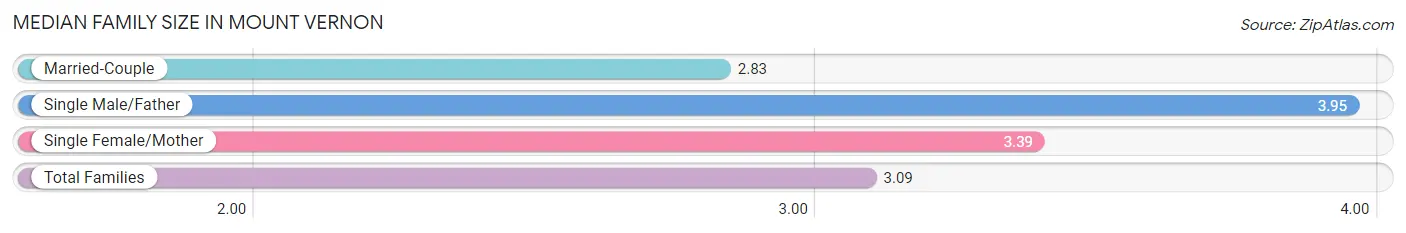
| Family Type | # Families | Family Size |
| Married-Couple | 356 (63.6%) | 2.83 |
| Single Male/Father | 56 (10.0%) | 3.95 |
| Single Female/Mother | 148 (26.4%) | 3.39 |
| Total Families | 560 (100.0%) | 3.09 |
Median Household Size in Mount Vernon
The median household size in Mount Vernon is 2.39 persons per household, with single male/father households (56 | 6.3%) accounting for the largest median household size of 4.2 persons per household. non-family households (329 | 37.0%) represent the smallest median household size with 1.06 persons per household.
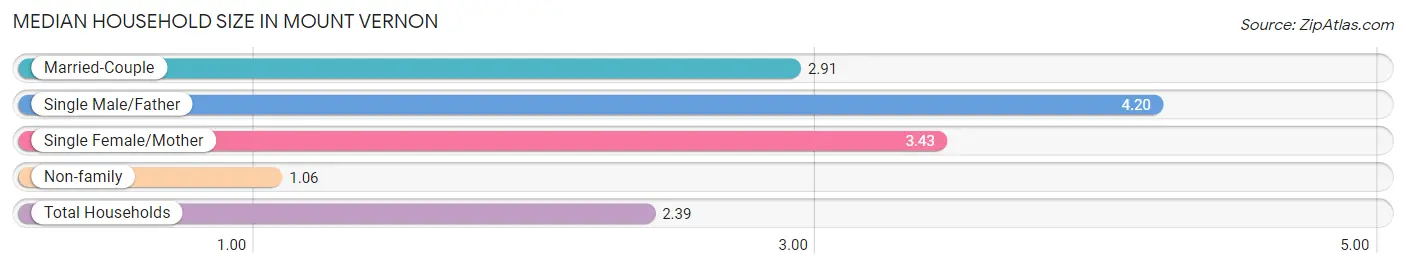
| Household Type | # Households | Household Size |
| Married-Couple | 356 (40.0%) | 2.91 |
| Single Male/Father | 56 (6.3%) | 4.20 |
| Single Female/Mother | 148 (16.7%) | 3.43 |
| Non-family | 329 (37.0%) | 1.06 |
| Total Households | 889 (100.0%) | 2.39 |
Household Size by Marriage Status in Mount Vernon
Out of a total of 889 households in Mount Vernon, 560 (63.0%) are family households, while 329 (37.0%) are nonfamily households. The most numerous type of family households are 3-person households, comprising 270, and the most common type of nonfamily households are 1-person households, comprising 300.
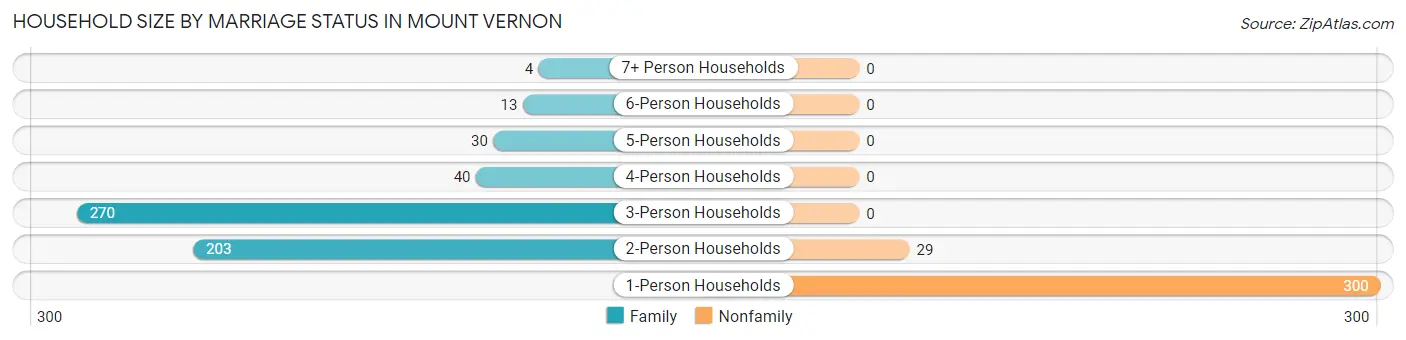
| Household Size | Family Households | Nonfamily Households |
| 1-Person Households | - | 300 (33.8%) |
| 2-Person Households | 203 (22.8%) | 29 (3.3%) |
| 3-Person Households | 270 (30.4%) | 0 (0.0%) |
| 4-Person Households | 40 (4.5%) | 0 (0.0%) |
| 5-Person Households | 30 (3.4%) | 0 (0.0%) |
| 6-Person Households | 13 (1.5%) | 0 (0.0%) |
| 7+ Person Households | 4 (0.4%) | 0 (0.0%) |
| Total | 560 (63.0%) | 329 (37.0%) |
Female Fertility in Mount Vernon
Fertility by Age in Mount Vernon
Average fertility rate in Mount Vernon is 78.0 births per 1,000 women. Women in the age bracket of 15 to 19 years have the highest fertility rate with 232.0 births per 1,000 women. Women in the age bracket of 20 to 34 years acount for 52.5% of all women with births.
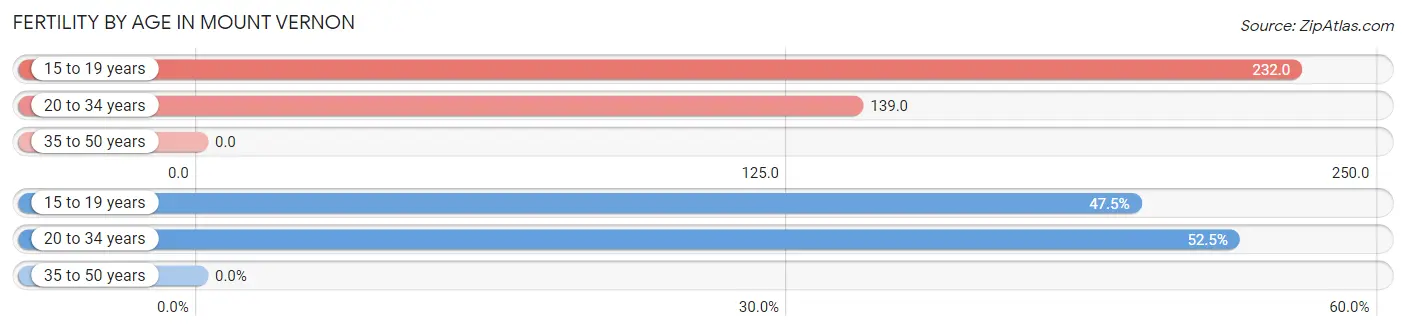
| Age Bracket | Women with Births | Births / 1,000 Women |
| 15 to 19 years | 19 (47.5%) | 232.0 |
| 20 to 34 years | 21 (52.5%) | 139.0 |
| 35 to 50 years | 0 (0.0%) | 0.0 |
| Total | 40 (100.0%) | 78.0 |
Fertility by Age by Marriage Status in Mount Vernon
52.5% of women with births (40) in Mount Vernon are married. The highest percentage of unmarried women with births falls into 15 to 19 years age bracket with 100.0% of them unmarried at the time of birth, while the lowest percentage of unmarried women with births belong to 20 to 34 years age bracket with 0.0% of them unmarried.
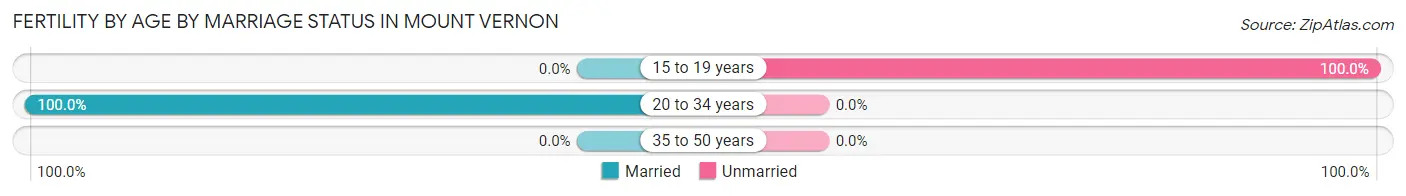
| Age Bracket | Married | Unmarried |
| 15 to 19 years | 0 (0.0%) | 19 (100.0%) |
| 20 to 34 years | 21 (100.0%) | 0 (0.0%) |
| 35 to 50 years | 0 (0.0%) | 0 (0.0%) |
| Total | 21 (52.5%) | 19 (47.5%) |
Fertility by Education in Mount Vernon
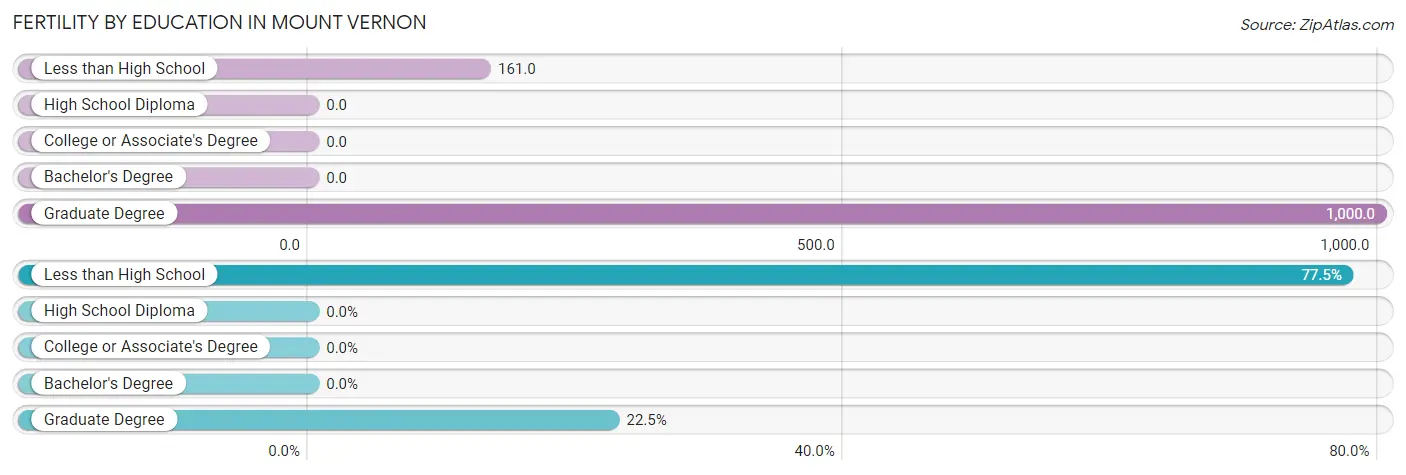
| Educational Attainment | Women with Births | Births / 1,000 Women |
| Less than High School | 31 (77.5%) | 161.0 |
| High School Diploma | 0 (0.0%) | 0.0 |
| College or Associate's Degree | 0 (0.0%) | 0.0 |
| Bachelor's Degree | 0 (0.0%) | 0.0 |
| Graduate Degree | 9 (22.5%) | 1,000.0 |
| Total | 40 (100.0%) | 78.0 |
Fertility by Education by Marriage Status in Mount Vernon
47.5% of women with births in Mount Vernon are unmarried. Women with the educational attainment of graduate degree are most likely to be married with 100.0% of them married at childbirth, while women with the educational attainment of less than high school are least likely to be married with 61.3% of them unmarried at childbirth.
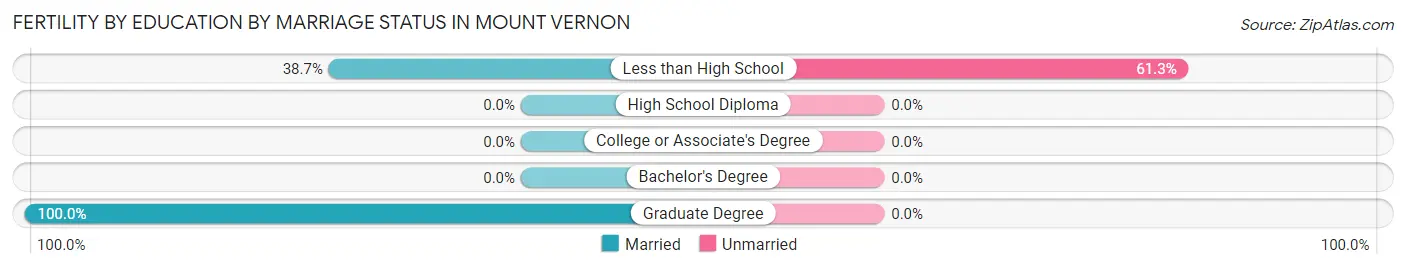
| Educational Attainment | Married | Unmarried |
| Less than High School | 12 (38.7%) | 19 (61.3%) |
| High School Diploma | 0 (0.0%) | 0 (0.0%) |
| College or Associate's Degree | 0 (0.0%) | 0 (0.0%) |
| Bachelor's Degree | 0 (0.0%) | 0 (0.0%) |
| Graduate Degree | 9 (100.0%) | 0 (0.0%) |
| Total | 21 (52.5%) | 19 (47.5%) |
Employment Characteristics in Mount Vernon
Employment by Class of Employer in Mount Vernon
Among the 814 employed individuals in Mount Vernon, private company employees (522 | 64.1%), local government employees (149 | 18.3%), and state government employees (53 | 6.5%) make up the most common classes of employment.
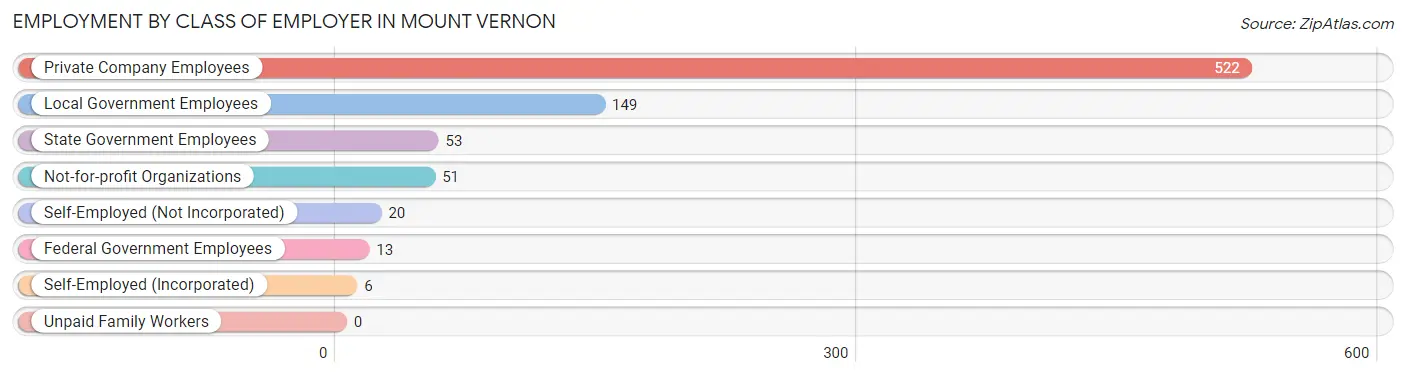
| Employer Class | # Employees | % Employees |
| Private Company Employees | 522 | 64.1% |
| Self-Employed (Incorporated) | 6 | 0.7% |
| Self-Employed (Not Incorporated) | 20 | 2.5% |
| Not-for-profit Organizations | 51 | 6.3% |
| Local Government Employees | 149 | 18.3% |
| State Government Employees | 53 | 6.5% |
| Federal Government Employees | 13 | 1.6% |
| Unpaid Family Workers | 0 | 0.0% |
| Total | 814 | 100.0% |
Employment Status by Age in Mount Vernon
According to the labor force statistics for Mount Vernon, out of the total population over 16 years of age (1,934), 45.3% or 876 individuals are in the labor force, with 3.7% or 32 of them unemployed. The age group with the highest labor force participation rate is 20 to 24 years, with 80.7% or 121 individuals in the labor force. Within the labor force, the 35 to 44 years age range has the highest percentage of unemployed individuals, with 10.6% or 14 of them being unemployed.
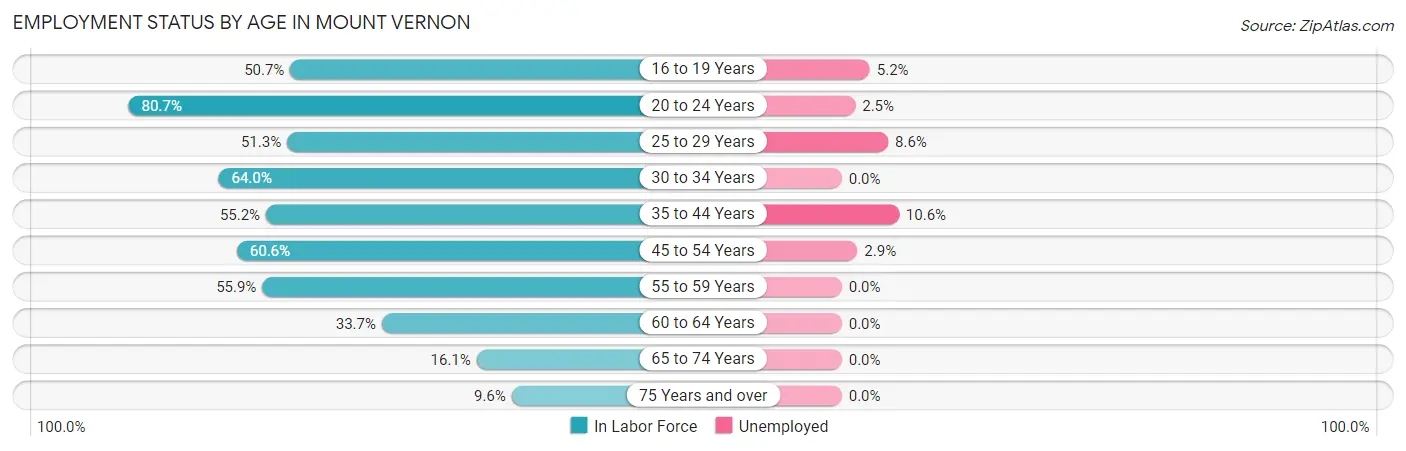
| Age Bracket | In Labor Force | Unemployed |
| 16 to 19 Years | 77 (50.7%) | 4 (5.2%) |
| 20 to 24 Years | 121 (80.7%) | 3 (2.5%) |
| 25 to 29 Years | 58 (51.3%) | 5 (8.6%) |
| 30 to 34 Years | 57 (64.0%) | 0 (0.0%) |
| 35 to 44 Years | 132 (55.2%) | 14 (10.6%) |
| 45 to 54 Years | 209 (60.6%) | 6 (2.9%) |
| 55 to 59 Years | 100 (55.9%) | 0 (0.0%) |
| 60 to 64 Years | 58 (33.7%) | 0 (0.0%) |
| 65 to 74 Years | 41 (16.1%) | 0 (0.0%) |
| 75 Years and over | 23 (9.6%) | 0 (0.0%) |
| Total | 876 (45.3%) | 32 (3.7%) |
Employment Status by Educational Attainment in Mount Vernon
According to labor force statistics for Mount Vernon, 54.0% of individuals (614) out of the total population between 25 and 64 years of age (1,137) are in the labor force, with 4.1% or 25 of them being unemployed. The group with the highest labor force participation rate are those with the educational attainment of college / associate degree, with 75.0% or 255 individuals in the labor force. Within the labor force, individuals with college / associate degree education have the highest percentage of unemployment, with 5.1% or 13 of them being unemployed.
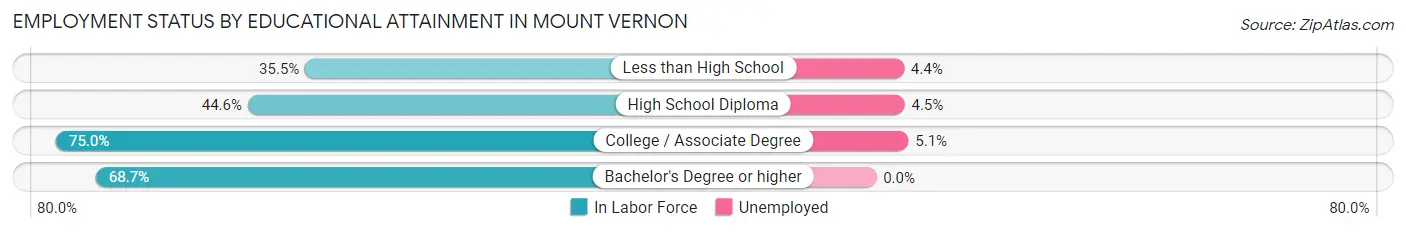
| Educational Attainment | In Labor Force | Unemployed |
| Less than High School | 113 (35.5%) | 14 (4.4%) |
| High School Diploma | 154 (44.6%) | 16 (4.5%) |
| College / Associate Degree | 255 (75.0%) | 17 (5.1%) |
| Bachelor's Degree or higher | 92 (68.7%) | 0 (0.0%) |
| Total | 614 (54.0%) | 47 (4.1%) |
Employment Occupations by Sex in Mount Vernon
Management, Business, Science and Arts Occupations
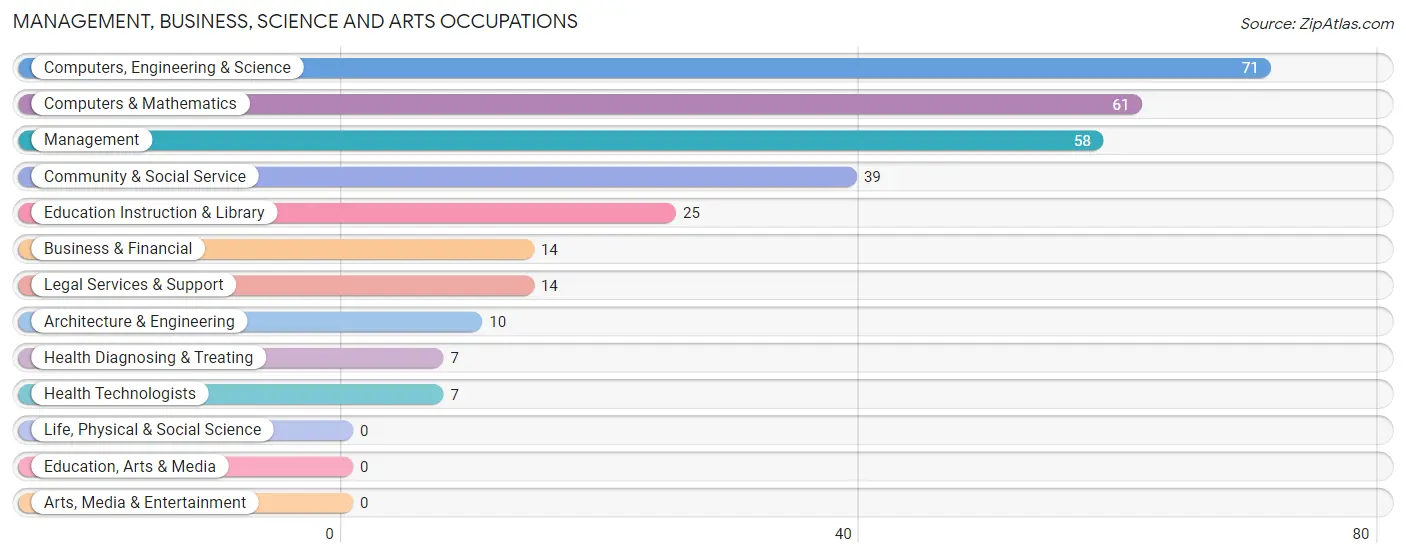
The most common Management, Business, Science and Arts occupations in Mount Vernon are Computers, Engineering & Science (71 | 8.4%), Computers & Mathematics (61 | 7.2%), Management (58 | 6.9%), Community & Social Service (39 | 4.6%), and Education Instruction & Library (25 | 3.0%).
Management, Business, Science and Arts Occupations by Sex
Within the Management, Business, Science and Arts occupations in Mount Vernon, the most male-oriented occupations are Computers, Engineering & Science (100.0%), Computers & Mathematics (100.0%), and Architecture & Engineering (100.0%), while the most female-oriented occupations are Health Diagnosing & Treating (100.0%), Health Technologists (100.0%), and Education Instruction & Library (84.0%).
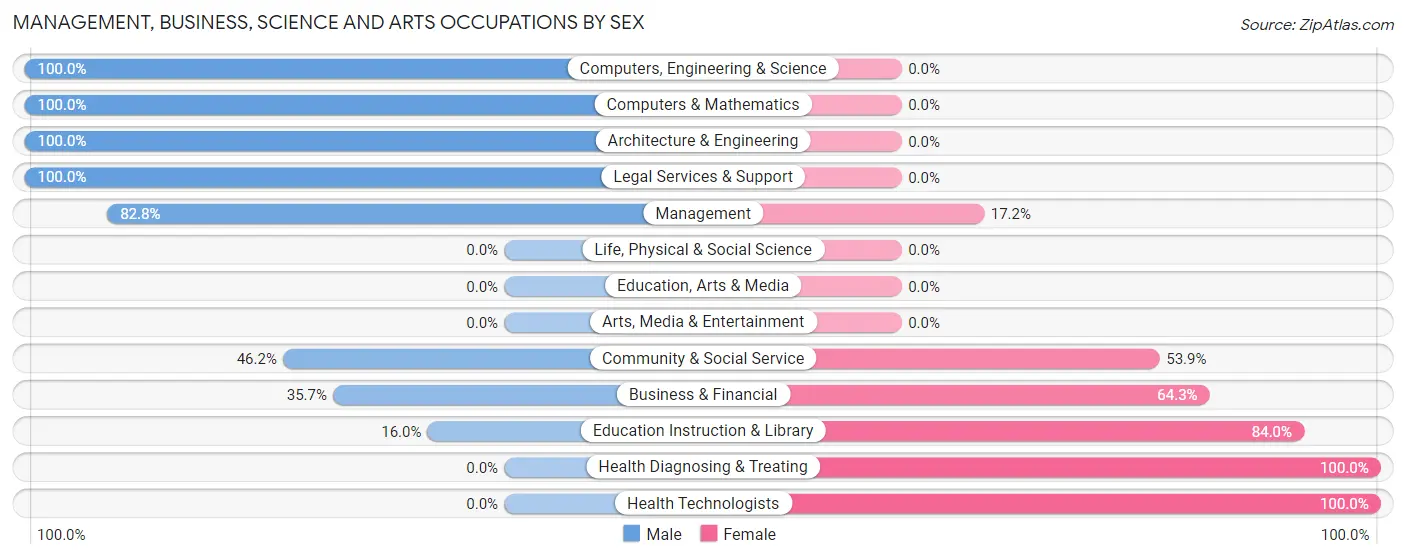
| Occupation | Male | Female |
| Management | 48 (82.8%) | 10 (17.2%) |
| Business & Financial | 5 (35.7%) | 9 (64.3%) |
| Computers, Engineering & Science | 71 (100.0%) | 0 (0.0%) |
| Computers & Mathematics | 61 (100.0%) | 0 (0.0%) |
| Architecture & Engineering | 10 (100.0%) | 0 (0.0%) |
| Life, Physical & Social Science | 0 (0.0%) | 0 (0.0%) |
| Community & Social Service | 18 (46.2%) | 21 (53.8%) |
| Education, Arts & Media | 0 (0.0%) | 0 (0.0%) |
| Legal Services & Support | 14 (100.0%) | 0 (0.0%) |
| Education Instruction & Library | 4 (16.0%) | 21 (84.0%) |
| Arts, Media & Entertainment | 0 (0.0%) | 0 (0.0%) |
| Health Diagnosing & Treating | 0 (0.0%) | 7 (100.0%) |
| Health Technologists | 0 (0.0%) | 7 (100.0%) |
| Total (Category) | 142 (75.1%) | 47 (24.9%) |
| Total (Overall) | 557 (66.0%) | 287 (34.0%) |
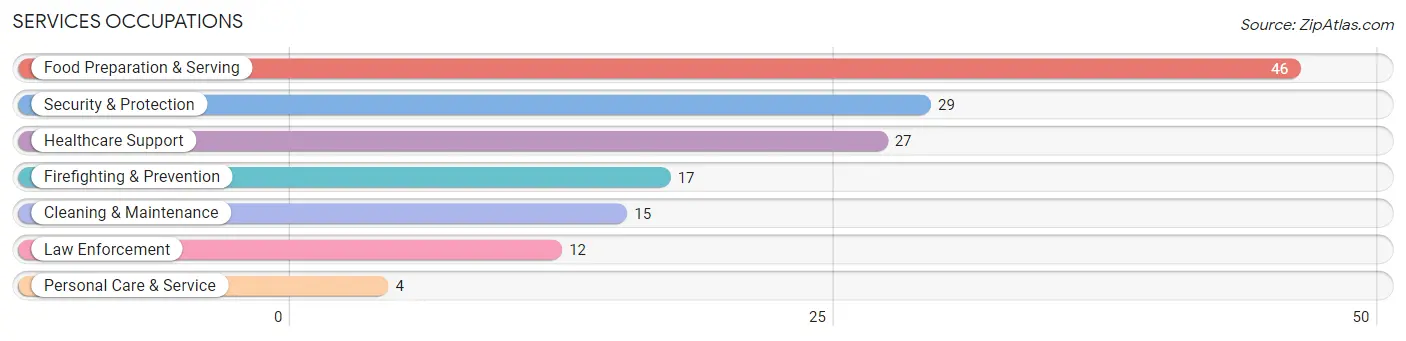
Services Occupations
The most common Services occupations in Mount Vernon are Food Preparation & Serving (46 | 5.4%), Security & Protection (29 | 3.4%), Healthcare Support (27 | 3.2%), Firefighting & Prevention (17 | 2.0%), and Cleaning & Maintenance (15 | 1.8%).
Services Occupations by Sex
Within the Services occupations in Mount Vernon, the most male-oriented occupations are Firefighting & Prevention (100.0%), Personal Care & Service (100.0%), and Security & Protection (58.6%), while the most female-oriented occupations are Healthcare Support (100.0%), Law Enforcement (100.0%), and Cleaning & Maintenance (100.0%).
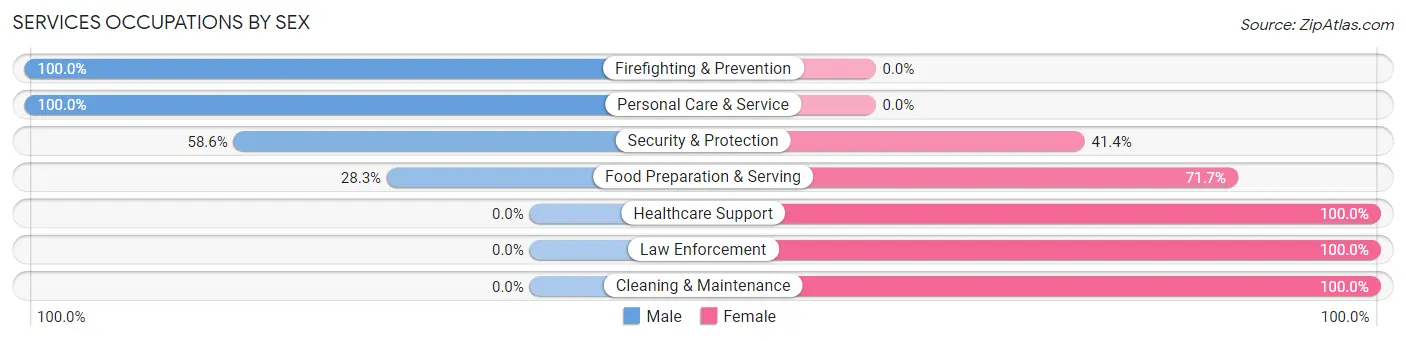
| Occupation | Male | Female |
| Healthcare Support | 0 (0.0%) | 27 (100.0%) |
| Security & Protection | 17 (58.6%) | 12 (41.4%) |
| Firefighting & Prevention | 17 (100.0%) | 0 (0.0%) |
| Law Enforcement | 0 (0.0%) | 12 (100.0%) |
| Food Preparation & Serving | 13 (28.3%) | 33 (71.7%) |
| Cleaning & Maintenance | 0 (0.0%) | 15 (100.0%) |
| Personal Care & Service | 4 (100.0%) | 0 (0.0%) |
| Total (Category) | 34 (28.1%) | 87 (71.9%) |
| Total (Overall) | 557 (66.0%) | 287 (34.0%) |
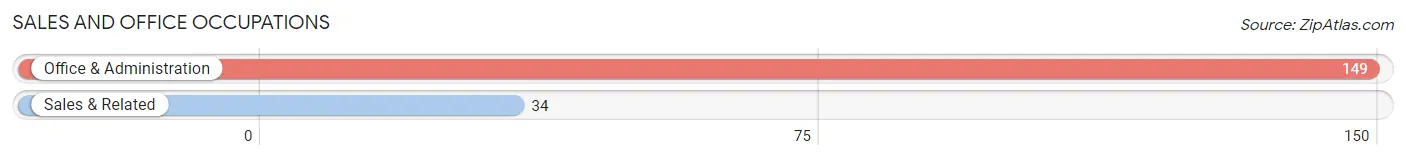
Sales and Office Occupations
The most common Sales and Office occupations in Mount Vernon are Office & Administration (149 | 17.6%), and Sales & Related (34 | 4.0%).
Sales and Office Occupations by Sex
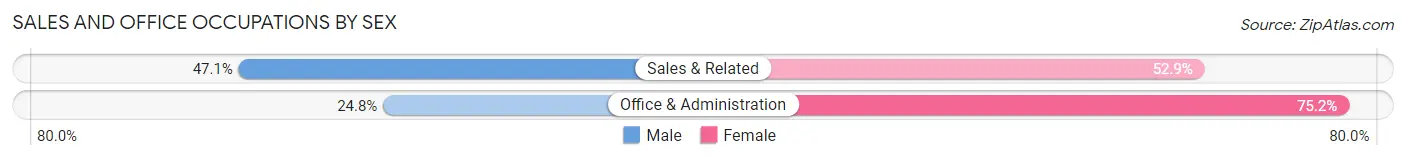
| Occupation | Male | Female |
| Sales & Related | 16 (47.1%) | 18 (52.9%) |
| Office & Administration | 37 (24.8%) | 112 (75.2%) |
| Total (Category) | 53 (29.0%) | 130 (71.0%) |
| Total (Overall) | 557 (66.0%) | 287 (34.0%) |
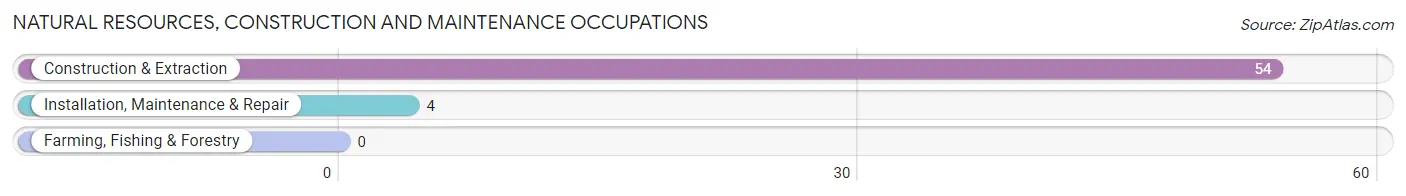
Natural Resources, Construction and Maintenance Occupations
The most common Natural Resources, Construction and Maintenance occupations in Mount Vernon are Construction & Extraction (54 | 6.4%), and Installation, Maintenance & Repair (4 | 0.5%).
Natural Resources, Construction and Maintenance Occupations by Sex
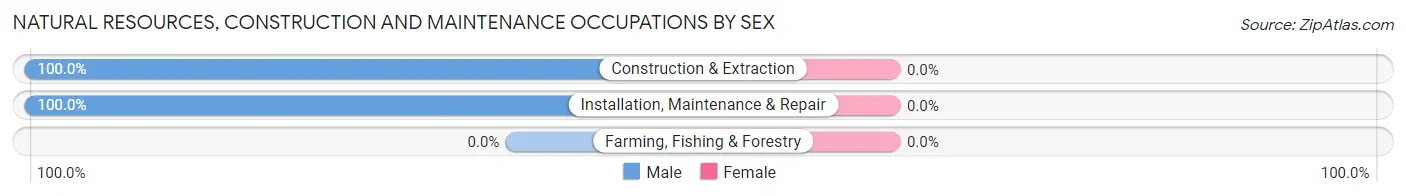
| Occupation | Male | Female |
| Farming, Fishing & Forestry | 0 (0.0%) | 0 (0.0%) |
| Construction & Extraction | 54 (100.0%) | 0 (0.0%) |
| Installation, Maintenance & Repair | 4 (100.0%) | 0 (0.0%) |
| Total (Category) | 58 (100.0%) | 0 (0.0%) |
| Total (Overall) | 557 (66.0%) | 287 (34.0%) |
Production, Transportation and Moving Occupations
The most common Production, Transportation and Moving occupations in Mount Vernon are Production (151 | 17.9%), Material Moving (121 | 14.3%), and Transportation (21 | 2.5%).
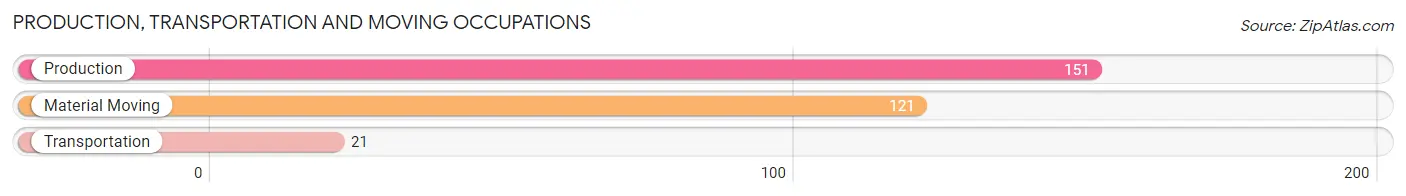
Production, Transportation and Moving Occupations by Sex
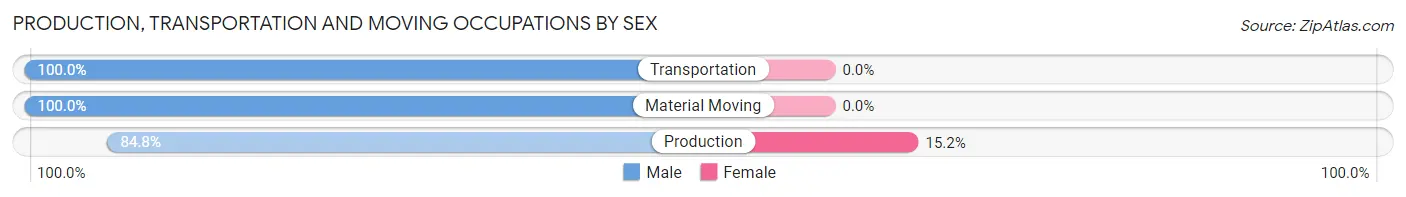
| Occupation | Male | Female |
| Production | 128 (84.8%) | 23 (15.2%) |
| Transportation | 21 (100.0%) | 0 (0.0%) |
| Material Moving | 121 (100.0%) | 0 (0.0%) |
| Total (Category) | 270 (92.1%) | 23 (7.9%) |
| Total (Overall) | 557 (66.0%) | 287 (34.0%) |
Employment Industries by Sex in Mount Vernon
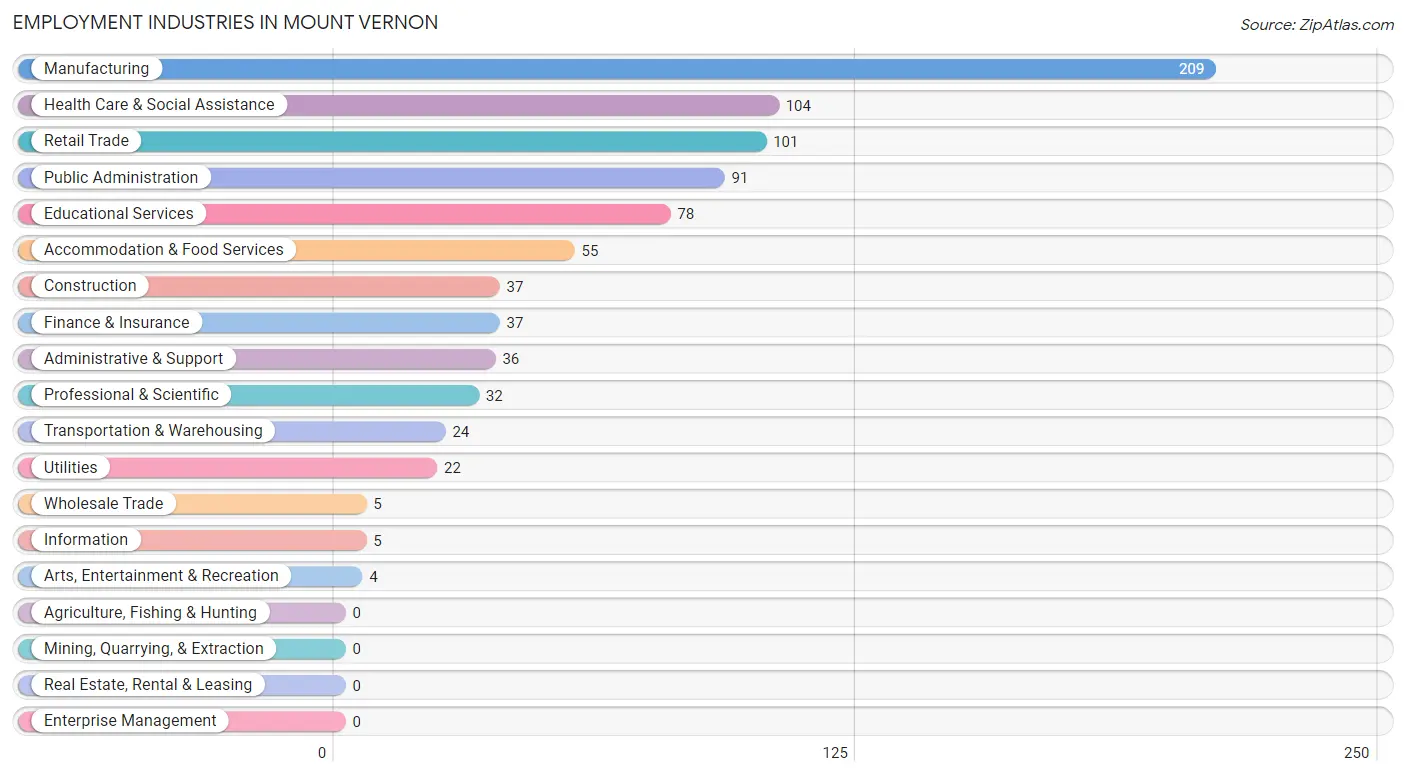
Employment Industries in Mount Vernon
The major employment industries in Mount Vernon include Manufacturing (209 | 24.8%), Health Care & Social Assistance (104 | 12.3%), Retail Trade (101 | 12.0%), Public Administration (91 | 10.8%), and Educational Services (78 | 9.2%).
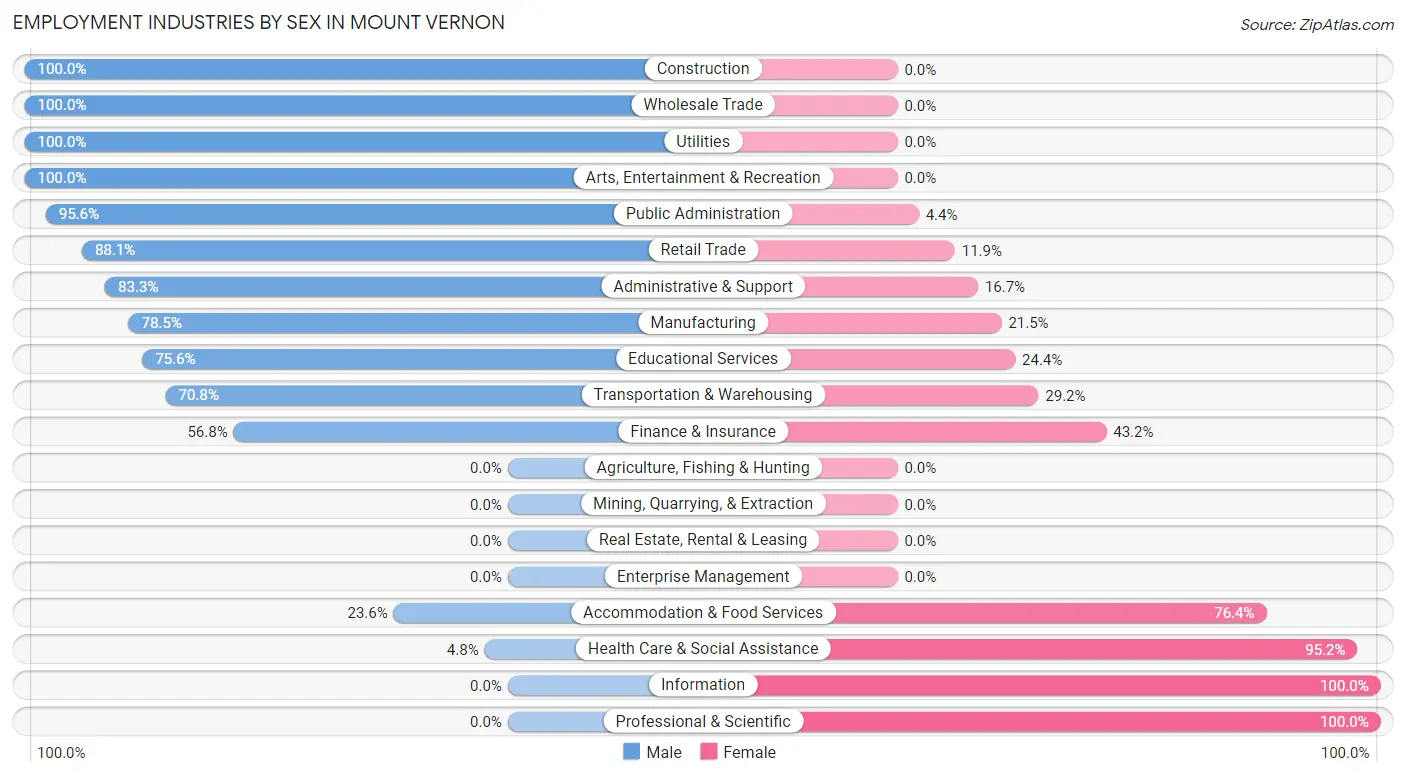
Employment Industries by Sex in Mount Vernon
The Mount Vernon industries that see more men than women are Construction (100.0%), Wholesale Trade (100.0%), and Utilities (100.0%), whereas the industries that tend to have a higher number of women are Information (100.0%), Professional & Scientific (100.0%), and Health Care & Social Assistance (95.2%).
| Industry | Male | Female |
| Agriculture, Fishing & Hunting | 0 (0.0%) | 0 (0.0%) |
| Mining, Quarrying, & Extraction | 0 (0.0%) | 0 (0.0%) |
| Construction | 37 (100.0%) | 0 (0.0%) |
| Manufacturing | 164 (78.5%) | 45 (21.5%) |
| Wholesale Trade | 5 (100.0%) | 0 (0.0%) |
| Retail Trade | 89 (88.1%) | 12 (11.9%) |
| Transportation & Warehousing | 17 (70.8%) | 7 (29.2%) |
| Utilities | 22 (100.0%) | 0 (0.0%) |
| Information | 0 (0.0%) | 5 (100.0%) |
| Finance & Insurance | 21 (56.8%) | 16 (43.2%) |
| Real Estate, Rental & Leasing | 0 (0.0%) | 0 (0.0%) |
| Professional & Scientific | 0 (0.0%) | 32 (100.0%) |
| Enterprise Management | 0 (0.0%) | 0 (0.0%) |
| Administrative & Support | 30 (83.3%) | 6 (16.7%) |
| Educational Services | 59 (75.6%) | 19 (24.4%) |
| Health Care & Social Assistance | 5 (4.8%) | 99 (95.2%) |
| Arts, Entertainment & Recreation | 4 (100.0%) | 0 (0.0%) |
| Accommodation & Food Services | 13 (23.6%) | 42 (76.4%) |
| Public Administration | 87 (95.6%) | 4 (4.4%) |
| Total | 557 (66.0%) | 287 (34.0%) |
Education in Mount Vernon
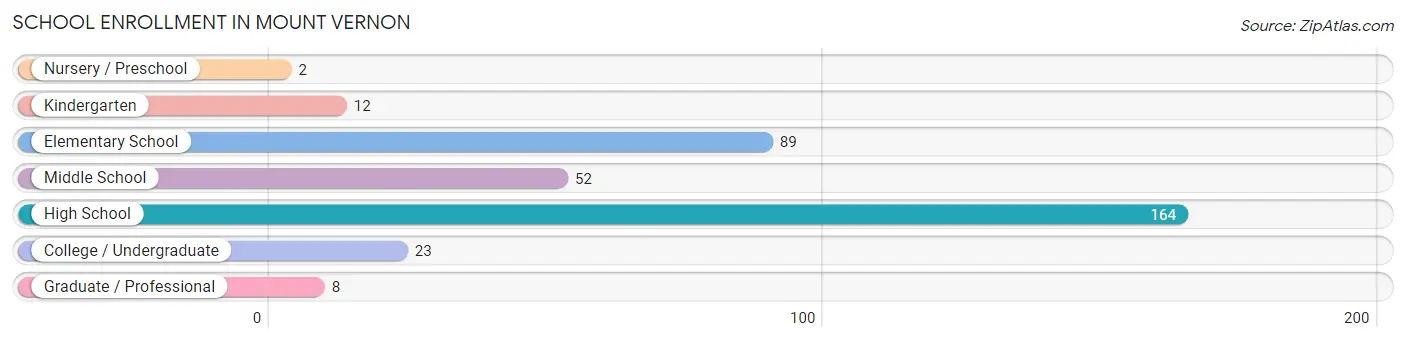
School Enrollment in Mount Vernon
The most common levels of schooling among the 350 students in Mount Vernon are high school (164 | 46.9%), elementary school (89 | 25.4%), and middle school (52 | 14.9%).
| School Level | # Students | % Students |
| Nursery / Preschool | 2 | 0.6% |
| Kindergarten | 12 | 3.4% |
| Elementary School | 89 | 25.4% |
| Middle School | 52 | 14.9% |
| High School | 164 | 46.9% |
| College / Undergraduate | 23 | 6.6% |
| Graduate / Professional | 8 | 2.3% |
| Total | 350 | 100.0% |
School Enrollment by Age by Funding Source in Mount Vernon
Out of a total of 350 students who are enrolled in schools in Mount Vernon, 4 (1.1%) attend a private institution, while the remaining 346 (98.9%) are enrolled in public schools. The age group of 5 to 9 year old has the highest likelihood of being enrolled in private schools, with 4 (4.0% in the age bracket) enrolled. Conversely, the age group of 3 to 4 year olds has the lowest likelihood of being enrolled in a private school, with 2 (100.0% in the age bracket) attending a public institution.
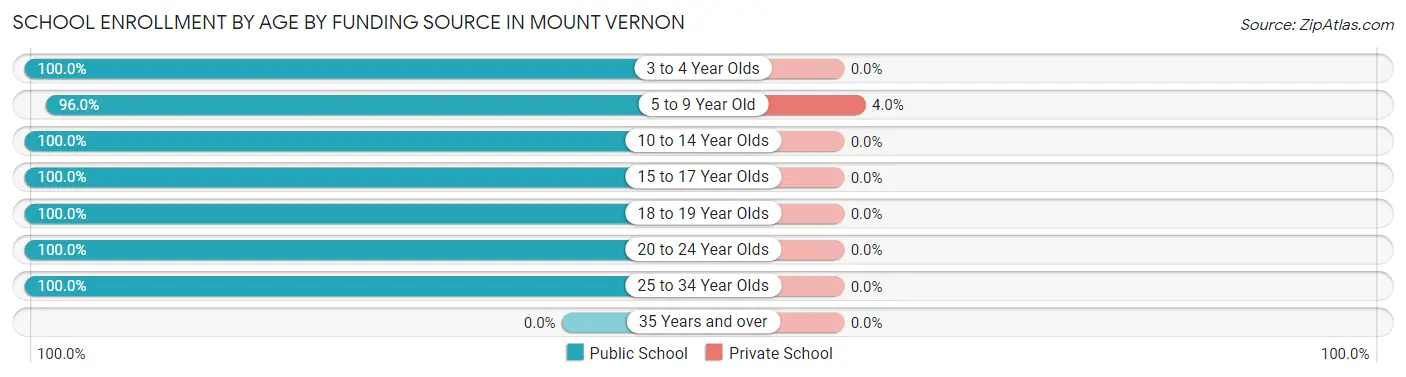
| Age Bracket | Public School | Private School |
| 3 to 4 Year Olds | 2 (100.0%) | 0 (0.0%) |
| 5 to 9 Year Old | 97 (96.0%) | 4 (4.0%) |
| 10 to 14 Year Olds | 37 (100.0%) | 0 (0.0%) |
| 15 to 17 Year Olds | 98 (100.0%) | 0 (0.0%) |
| 18 to 19 Year Olds | 84 (100.0%) | 0 (0.0%) |
| 20 to 24 Year Olds | 10 (100.0%) | 0 (0.0%) |
| 25 to 34 Year Olds | 18 (100.0%) | 0 (0.0%) |
| 35 Years and over | 0 (0.0%) | 0 (0.0%) |
| Total | 346 (98.9%) | 4 (1.1%) |
Educational Attainment by Field of Study in Mount Vernon
Science & technology (51 | 23.8%), arts & humanities (32 | 14.9%), liberal arts & history (31 | 14.5%), business (25 | 11.7%), and education (21 | 9.8%) are the most common fields of study among 214 individuals in Mount Vernon who have obtained a bachelor's degree or higher.
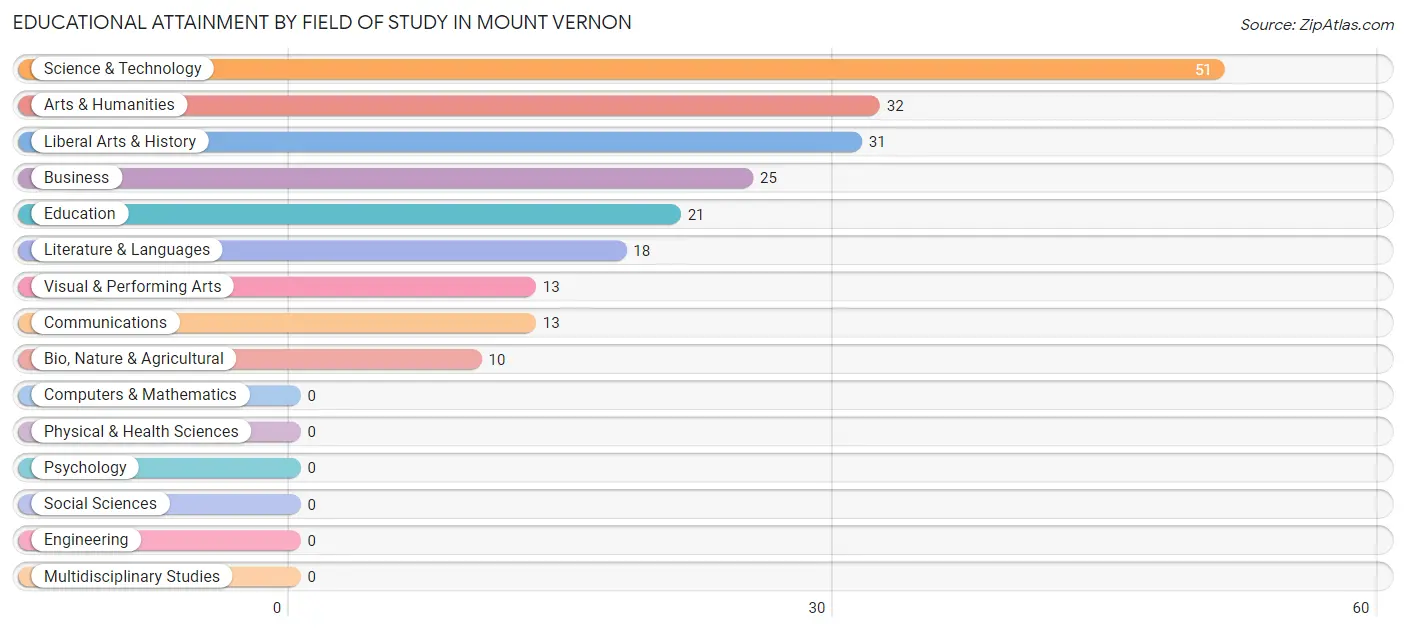
| Field of Study | # Graduates | % Graduates |
| Computers & Mathematics | 0 | 0.0% |
| Bio, Nature & Agricultural | 10 | 4.7% |
| Physical & Health Sciences | 0 | 0.0% |
| Psychology | 0 | 0.0% |
| Social Sciences | 0 | 0.0% |
| Engineering | 0 | 0.0% |
| Multidisciplinary Studies | 0 | 0.0% |
| Science & Technology | 51 | 23.8% |
| Business | 25 | 11.7% |
| Education | 21 | 9.8% |
| Literature & Languages | 18 | 8.4% |
| Liberal Arts & History | 31 | 14.5% |
| Visual & Performing Arts | 13 | 6.1% |
| Communications | 13 | 6.1% |
| Arts & Humanities | 32 | 14.9% |
| Total | 214 | 100.0% |
Transportation & Commute in Mount Vernon
Vehicle Availability by Sex in Mount Vernon
The most prevalent vehicle ownership categories in Mount Vernon are males with 3 vehicles (284, accounting for 53.9%) and females with 3 vehicles (112, making up 103.3%).
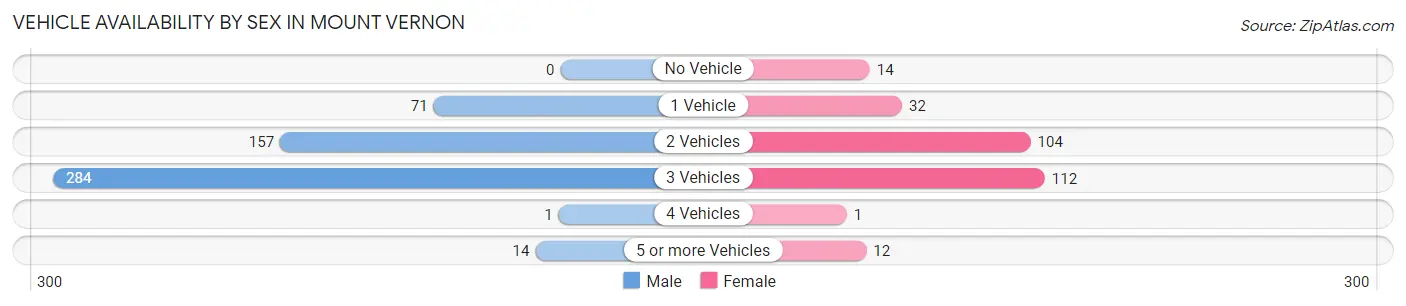
| Vehicles Available | Male | Female |
| No Vehicle | 0 (0.0%) | 14 (5.1%) |
| 1 Vehicle | 71 (13.5%) | 32 (11.6%) |
| 2 Vehicles | 157 (29.8%) | 104 (37.8%) |
| 3 Vehicles | 284 (53.9%) | 112 (40.7%) |
| 4 Vehicles | 1 (0.2%) | 1 (0.4%) |
| 5 or more Vehicles | 14 (2.7%) | 12 (4.4%) |
| Total | 527 (100.0%) | 275 (100.0%) |
Commute Time in Mount Vernon
The most frequently occuring commute durations in Mount Vernon are 30 to 34 minutes (189 commuters, 24.5%), 5 to 9 minutes (156 commuters, 20.3%), and 10 to 14 minutes (134 commuters, 17.4%).
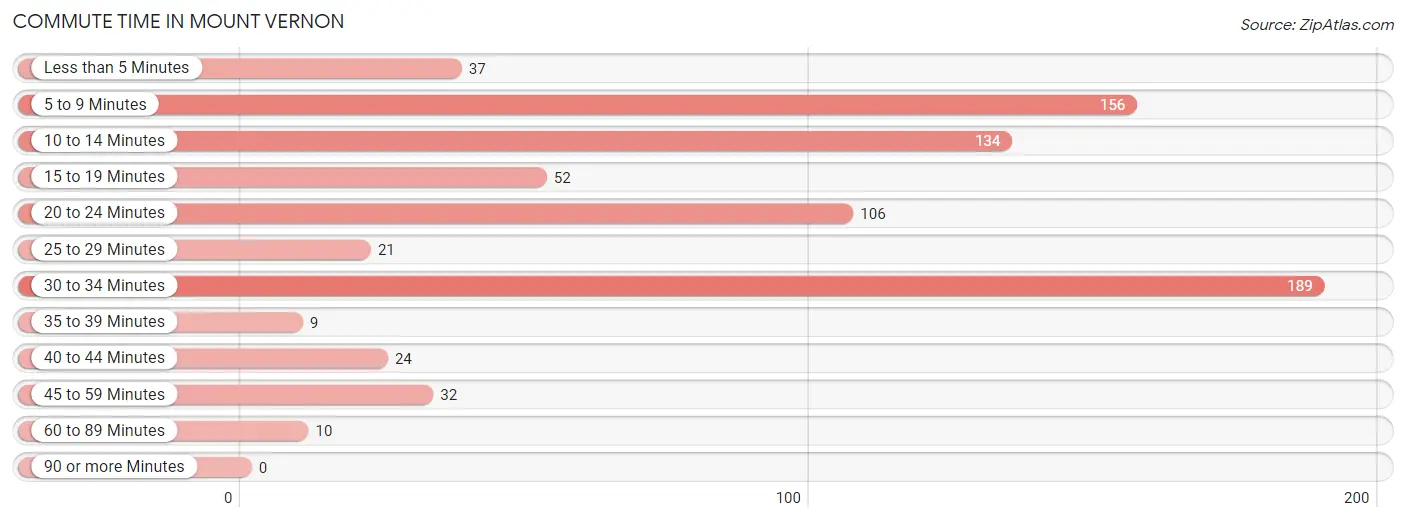
| Commute Time | # Commuters | % Commuters |
| Less than 5 Minutes | 37 | 4.8% |
| 5 to 9 Minutes | 156 | 20.3% |
| 10 to 14 Minutes | 134 | 17.4% |
| 15 to 19 Minutes | 52 | 6.8% |
| 20 to 24 Minutes | 106 | 13.8% |
| 25 to 29 Minutes | 21 | 2.7% |
| 30 to 34 Minutes | 189 | 24.5% |
| 35 to 39 Minutes | 9 | 1.2% |
| 40 to 44 Minutes | 24 | 3.1% |
| 45 to 59 Minutes | 32 | 4.2% |
| 60 to 89 Minutes | 10 | 1.3% |
| 90 or more Minutes | 0 | 0.0% |
Commute Time by Sex in Mount Vernon
The most common commute times in Mount Vernon are 30 to 34 minutes (177 commuters, 35.8%) for males and 10 to 14 minutes (64 commuters, 23.2%) for females.
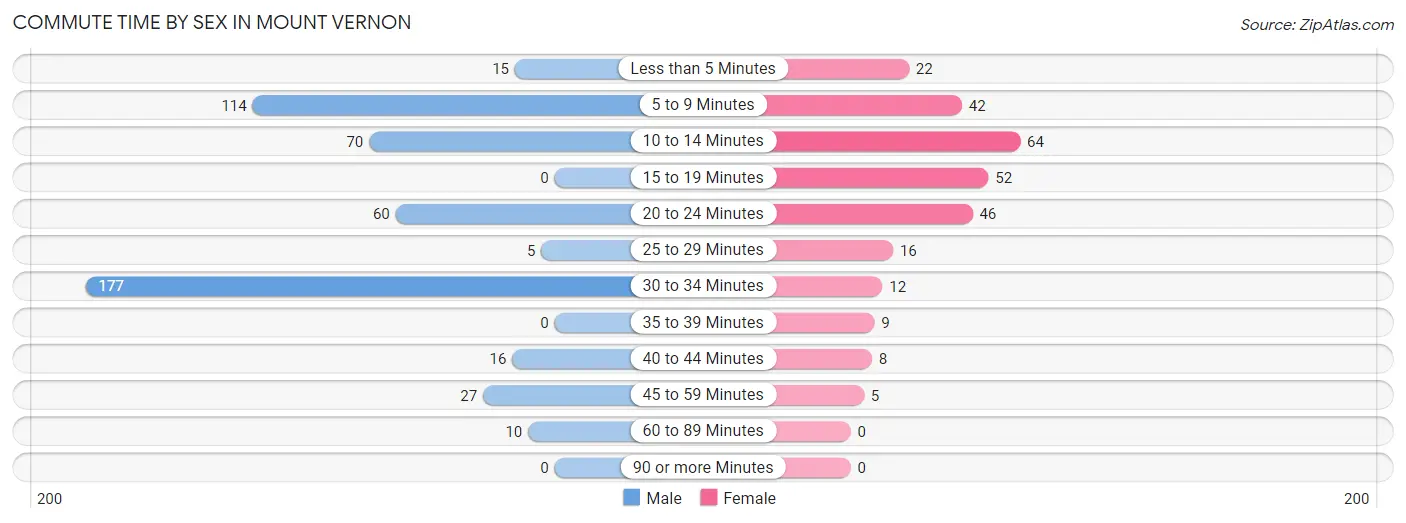
| Commute Time | Male | Female |
| Less than 5 Minutes | 15 (3.0%) | 22 (8.0%) |
| 5 to 9 Minutes | 114 (23.1%) | 42 (15.2%) |
| 10 to 14 Minutes | 70 (14.2%) | 64 (23.2%) |
| 15 to 19 Minutes | 0 (0.0%) | 52 (18.8%) |
| 20 to 24 Minutes | 60 (12.1%) | 46 (16.7%) |
| 25 to 29 Minutes | 5 (1.0%) | 16 (5.8%) |
| 30 to 34 Minutes | 177 (35.8%) | 12 (4.3%) |
| 35 to 39 Minutes | 0 (0.0%) | 9 (3.3%) |
| 40 to 44 Minutes | 16 (3.2%) | 8 (2.9%) |
| 45 to 59 Minutes | 27 (5.5%) | 5 (1.8%) |
| 60 to 89 Minutes | 10 (2.0%) | 0 (0.0%) |
| 90 or more Minutes | 0 (0.0%) | 0 (0.0%) |
Time of Departure to Work by Sex in Mount Vernon
The most frequent times of departure to work in Mount Vernon are 12:00 PM to 3:59 PM (138, 27.9%) for males and 12:00 AM to 4:59 AM (58, 21.0%) for females.
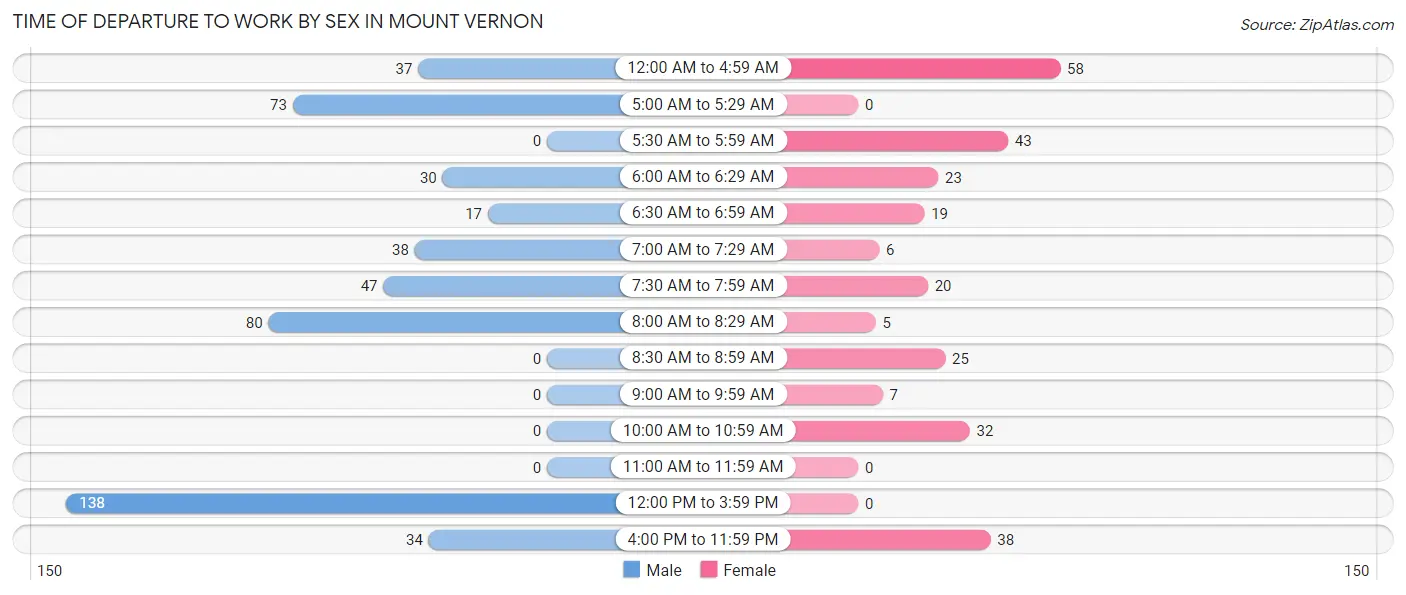
| Time of Departure | Male | Female |
| 12:00 AM to 4:59 AM | 37 (7.5%) | 58 (21.0%) |
| 5:00 AM to 5:29 AM | 73 (14.8%) | 0 (0.0%) |
| 5:30 AM to 5:59 AM | 0 (0.0%) | 43 (15.6%) |
| 6:00 AM to 6:29 AM | 30 (6.1%) | 23 (8.3%) |
| 6:30 AM to 6:59 AM | 17 (3.4%) | 19 (6.9%) |
| 7:00 AM to 7:29 AM | 38 (7.7%) | 6 (2.2%) |
| 7:30 AM to 7:59 AM | 47 (9.5%) | 20 (7.2%) |
| 8:00 AM to 8:29 AM | 80 (16.2%) | 5 (1.8%) |
| 8:30 AM to 8:59 AM | 0 (0.0%) | 25 (9.1%) |
| 9:00 AM to 9:59 AM | 0 (0.0%) | 7 (2.5%) |
| 10:00 AM to 10:59 AM | 0 (0.0%) | 32 (11.6%) |
| 11:00 AM to 11:59 AM | 0 (0.0%) | 0 (0.0%) |
| 12:00 PM to 3:59 PM | 138 (27.9%) | 0 (0.0%) |
| 4:00 PM to 11:59 PM | 34 (6.9%) | 38 (13.8%) |
| Total | 494 (100.0%) | 276 (100.0%) |
Housing Occupancy in Mount Vernon
Occupancy by Ownership in Mount Vernon
Of the total 889 dwellings in Mount Vernon, owner-occupied units account for 431 (48.5%), while renter-occupied units make up 458 (51.5%).
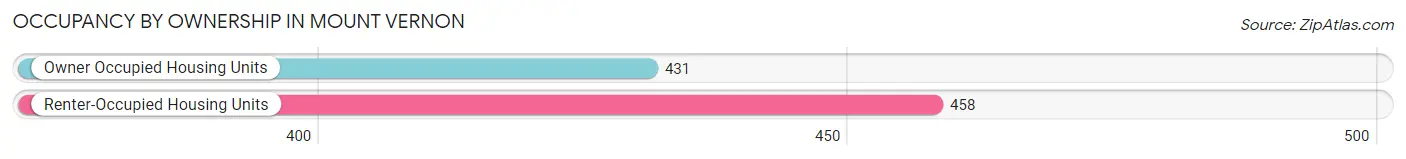
| Occupancy | # Housing Units | % Housing Units |
| Owner Occupied Housing Units | 431 | 48.5% |
| Renter-Occupied Housing Units | 458 | 51.5% |
| Total Occupied Housing Units | 889 | 100.0% |
Occupancy by Household Size in Mount Vernon
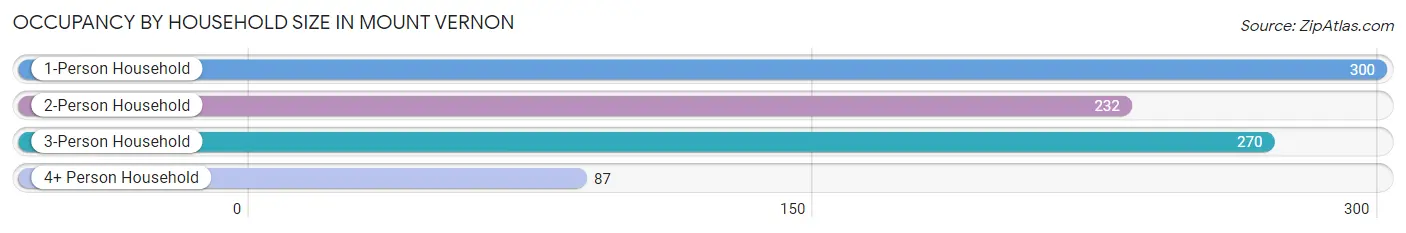
| Household Size | # Housing Units | % Housing Units |
| 1-Person Household | 300 | 33.8% |
| 2-Person Household | 232 | 26.1% |
| 3-Person Household | 270 | 30.4% |
| 4+ Person Household | 87 | 9.8% |
| Total Housing Units | 889 | 100.0% |
Occupancy by Ownership by Household Size in Mount Vernon
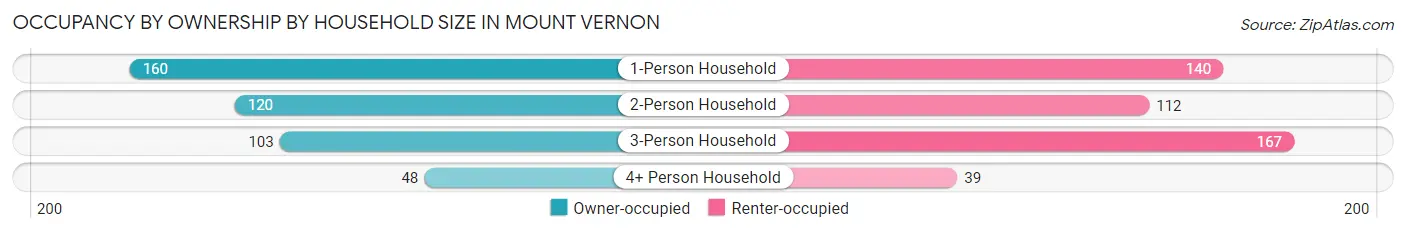
| Household Size | Owner-occupied | Renter-occupied |
| 1-Person Household | 160 (53.3%) | 140 (46.7%) |
| 2-Person Household | 120 (51.7%) | 112 (48.3%) |
| 3-Person Household | 103 (38.2%) | 167 (61.9%) |
| 4+ Person Household | 48 (55.2%) | 39 (44.8%) |
| Total Housing Units | 431 (48.5%) | 458 (51.5%) |
Occupancy by Educational Attainment in Mount Vernon
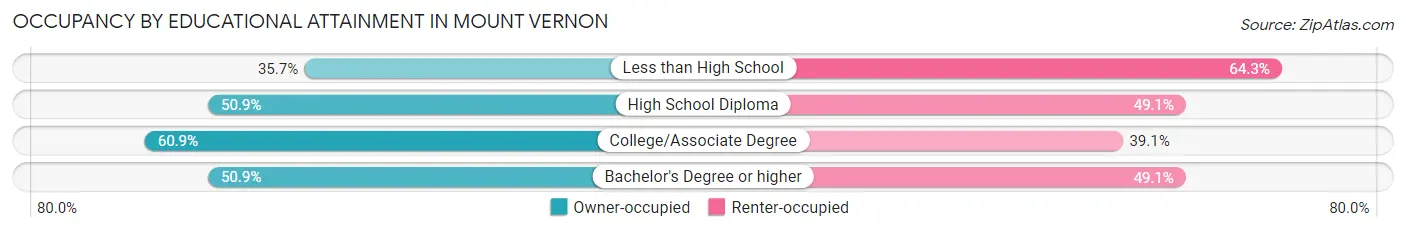
| Household Size | Owner-occupied | Renter-occupied |
| Less than High School | 101 (35.7%) | 182 (64.3%) |
| High School Diploma | 143 (50.9%) | 138 (49.1%) |
| College/Associate Degree | 131 (60.9%) | 84 (39.1%) |
| Bachelor's Degree or higher | 56 (50.9%) | 54 (49.1%) |
Occupancy by Age of Householder in Mount Vernon
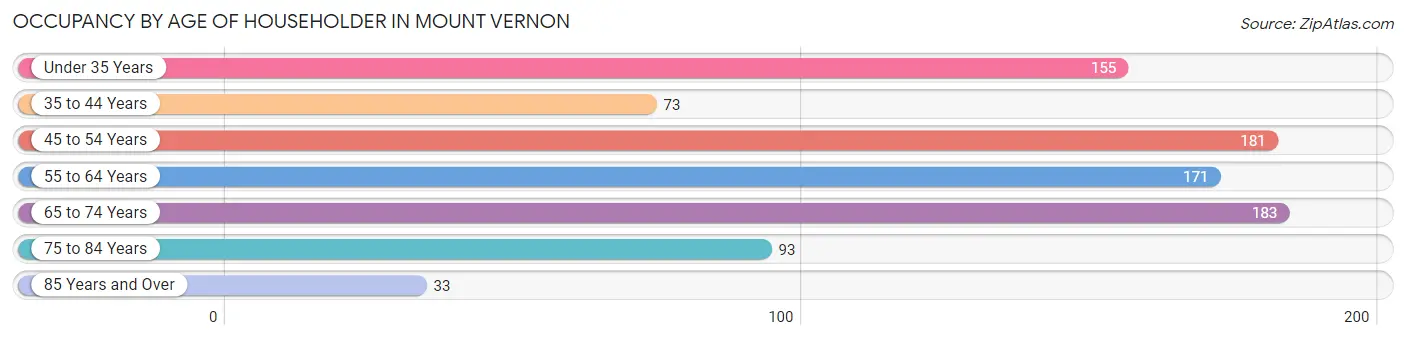
| Age Bracket | # Households | % Households |
| Under 35 Years | 155 | 17.4% |
| 35 to 44 Years | 73 | 8.2% |
| 45 to 54 Years | 181 | 20.4% |
| 55 to 64 Years | 171 | 19.2% |
| 65 to 74 Years | 183 | 20.6% |
| 75 to 84 Years | 93 | 10.5% |
| 85 Years and Over | 33 | 3.7% |
| Total | 889 | 100.0% |
Housing Finances in Mount Vernon
Median Income by Occupancy in Mount Vernon
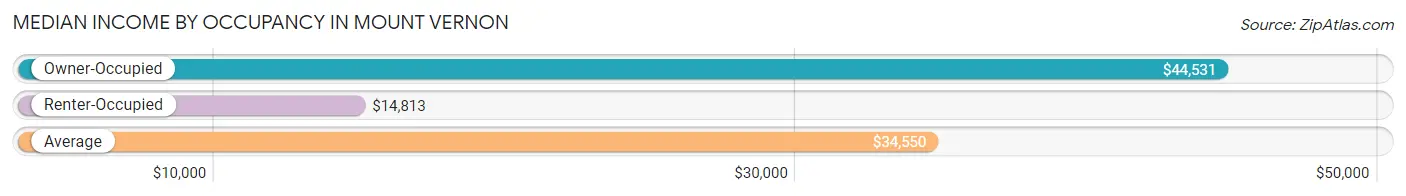
| Occupancy Type | # Households | Median Income |
| Owner-Occupied | 431 (48.5%) | $44,531 |
| Renter-Occupied | 458 (51.5%) | $14,813 |
| Average | 889 (100.0%) | $34,550 |
Occupancy by Householder Income Bracket in Mount Vernon
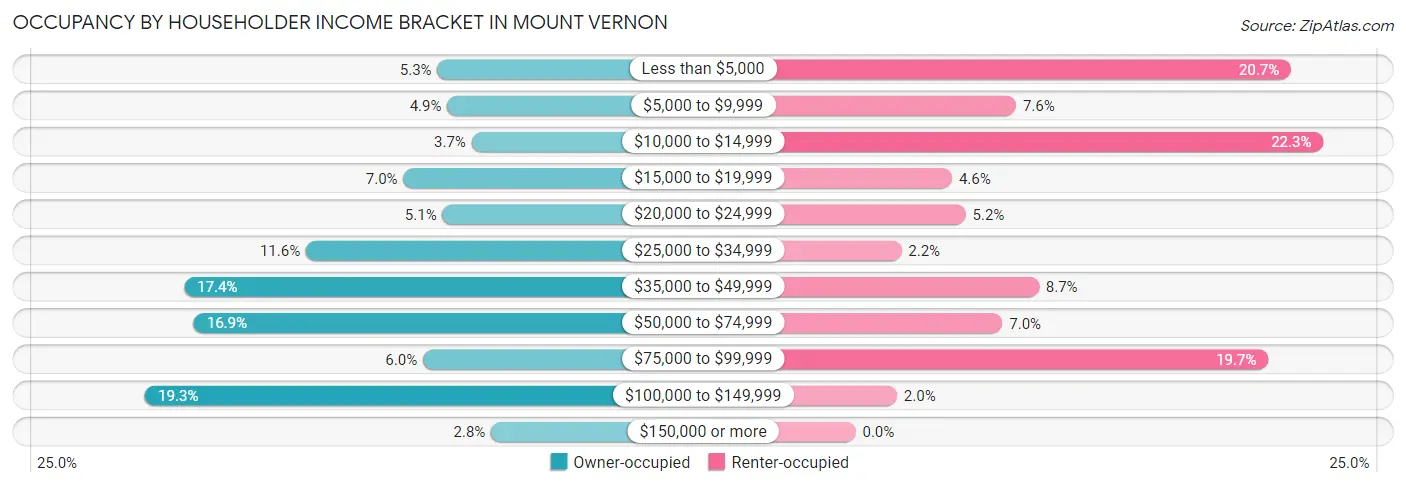
| Income Bracket | Owner-occupied | Renter-occupied |
| Less than $5,000 | 23 (5.3%) | 95 (20.7%) |
| $5,000 to $9,999 | 21 (4.9%) | 35 (7.6%) |
| $10,000 to $14,999 | 16 (3.7%) | 102 (22.3%) |
| $15,000 to $19,999 | 30 (7.0%) | 21 (4.6%) |
| $20,000 to $24,999 | 22 (5.1%) | 24 (5.2%) |
| $25,000 to $34,999 | 50 (11.6%) | 10 (2.2%) |
| $35,000 to $49,999 | 75 (17.4%) | 40 (8.7%) |
| $50,000 to $74,999 | 73 (16.9%) | 32 (7.0%) |
| $75,000 to $99,999 | 26 (6.0%) | 90 (19.7%) |
| $100,000 to $149,999 | 83 (19.3%) | 9 (2.0%) |
| $150,000 or more | 12 (2.8%) | 0 (0.0%) |
| Total | 431 (100.0%) | 458 (100.0%) |
Monthly Housing Cost Tiers in Mount Vernon
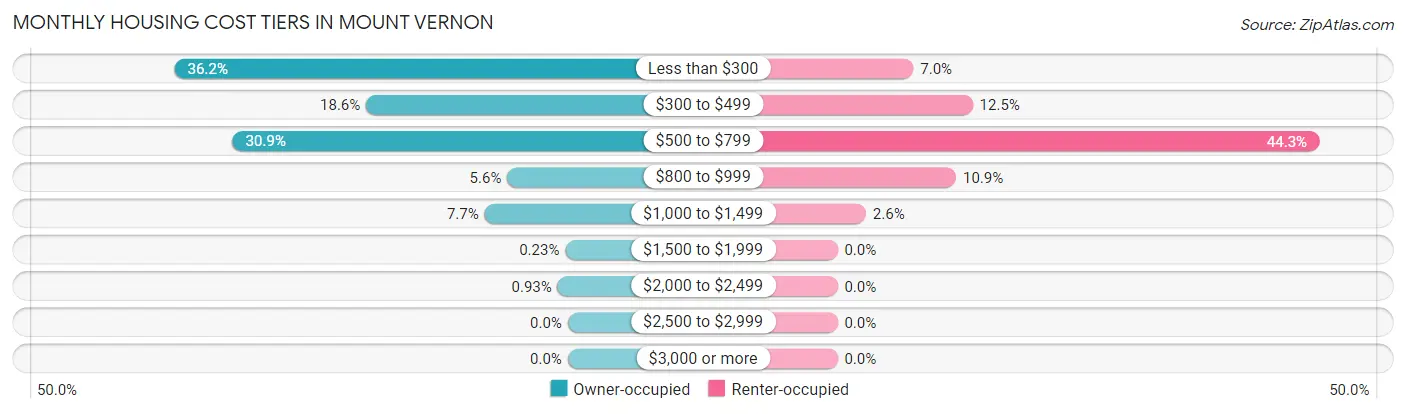
| Monthly Cost | Owner-occupied | Renter-occupied |
| Less than $300 | 156 (36.2%) | 32 (7.0%) |
| $300 to $499 | 80 (18.6%) | 57 (12.4%) |
| $500 to $799 | 133 (30.9%) | 203 (44.3%) |
| $800 to $999 | 24 (5.6%) | 50 (10.9%) |
| $1,000 to $1,499 | 33 (7.7%) | 12 (2.6%) |
| $1,500 to $1,999 | 1 (0.2%) | 0 (0.0%) |
| $2,000 to $2,499 | 4 (0.9%) | 0 (0.0%) |
| $2,500 to $2,999 | 0 (0.0%) | 0 (0.0%) |
| $3,000 or more | 0 (0.0%) | 0 (0.0%) |
| Total | 431 (100.0%) | 458 (100.0%) |
Physical Housing Characteristics in Mount Vernon
Housing Structures in Mount Vernon
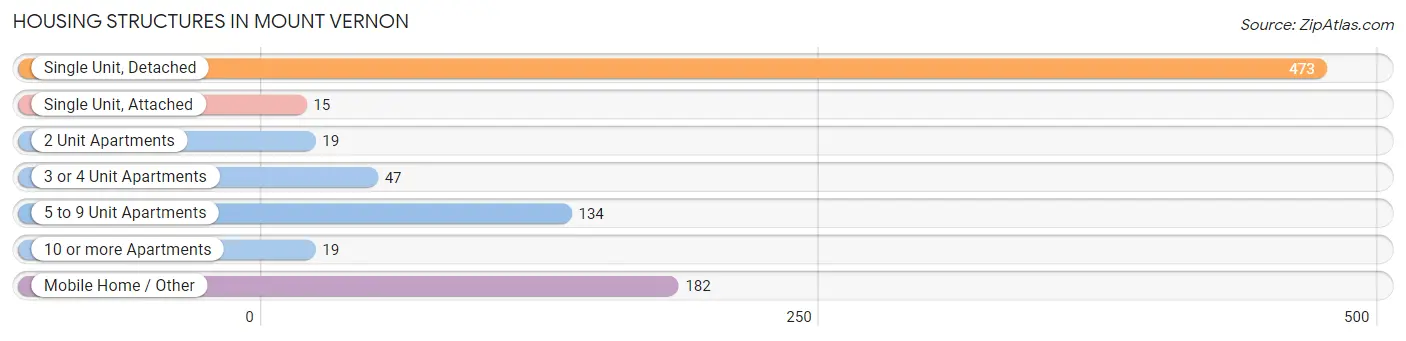
| Structure Type | # Housing Units | % Housing Units |
| Single Unit, Detached | 473 | 53.2% |
| Single Unit, Attached | 15 | 1.7% |
| 2 Unit Apartments | 19 | 2.1% |
| 3 or 4 Unit Apartments | 47 | 5.3% |
| 5 to 9 Unit Apartments | 134 | 15.1% |
| 10 or more Apartments | 19 | 2.1% |
| Mobile Home / Other | 182 | 20.5% |
| Total | 889 | 100.0% |
Housing Structures by Occupancy in Mount Vernon
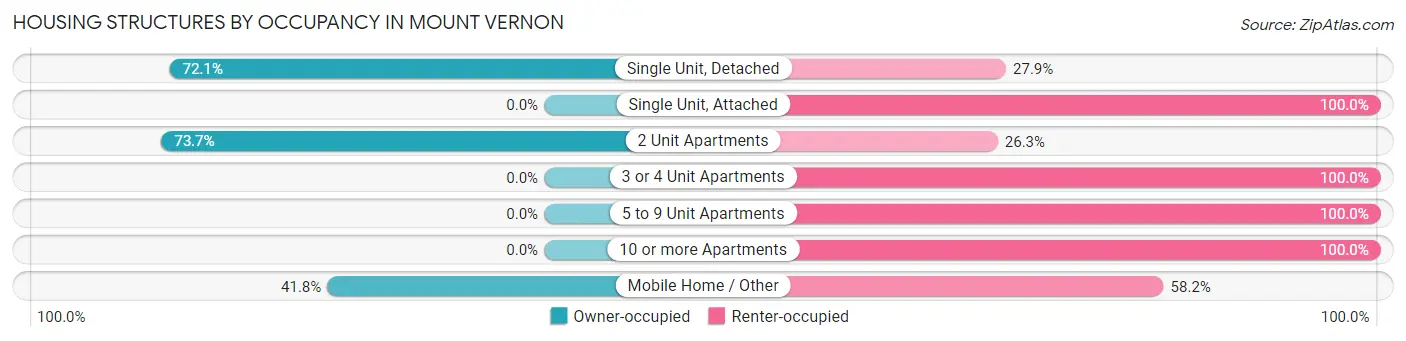
| Structure Type | Owner-occupied | Renter-occupied |
| Single Unit, Detached | 341 (72.1%) | 132 (27.9%) |
| Single Unit, Attached | 0 (0.0%) | 15 (100.0%) |
| 2 Unit Apartments | 14 (73.7%) | 5 (26.3%) |
| 3 or 4 Unit Apartments | 0 (0.0%) | 47 (100.0%) |
| 5 to 9 Unit Apartments | 0 (0.0%) | 134 (100.0%) |
| 10 or more Apartments | 0 (0.0%) | 19 (100.0%) |
| Mobile Home / Other | 76 (41.8%) | 106 (58.2%) |
| Total | 431 (48.5%) | 458 (51.5%) |
Housing Structures by Number of Rooms in Mount Vernon
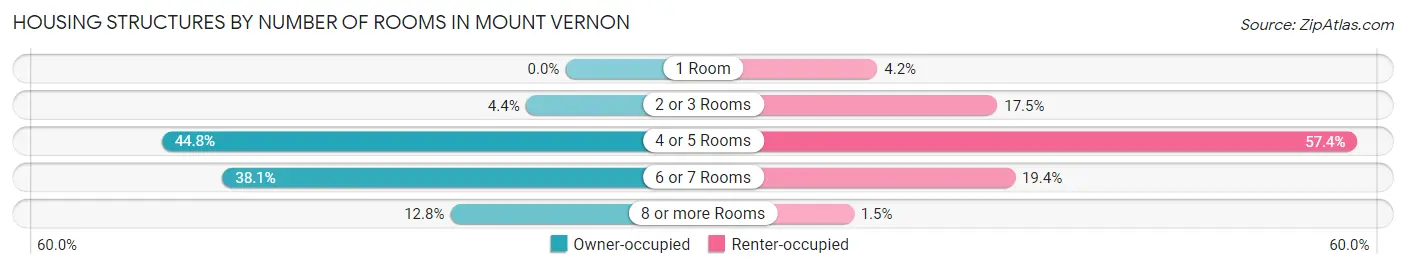
| Number of Rooms | Owner-occupied | Renter-occupied |
| 1 Room | 0 (0.0%) | 19 (4.2%) |
| 2 or 3 Rooms | 19 (4.4%) | 80 (17.5%) |
| 4 or 5 Rooms | 193 (44.8%) | 263 (57.4%) |
| 6 or 7 Rooms | 164 (38.1%) | 89 (19.4%) |
| 8 or more Rooms | 55 (12.8%) | 7 (1.5%) |
| Total | 431 (100.0%) | 458 (100.0%) |
Housing Structure by Heating Type in Mount Vernon
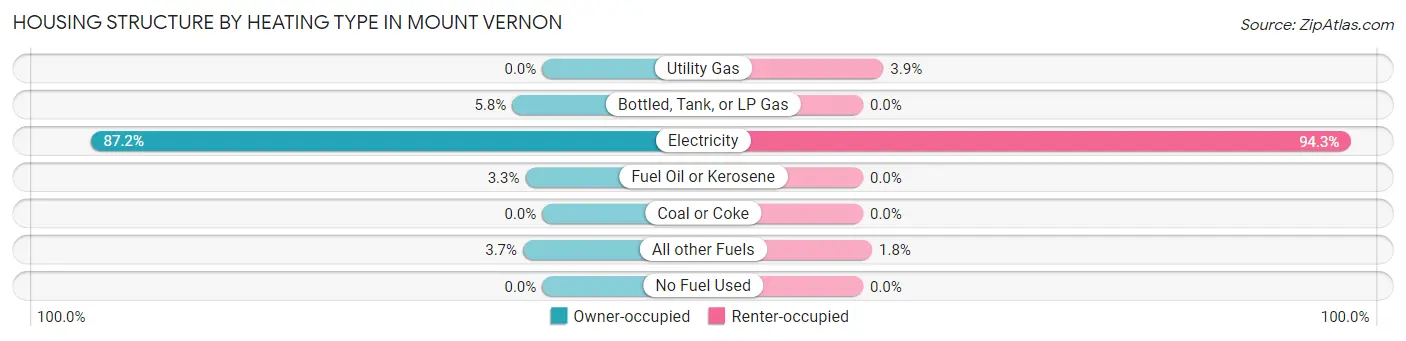
| Heating Type | Owner-occupied | Renter-occupied |
| Utility Gas | 0 (0.0%) | 18 (3.9%) |
| Bottled, Tank, or LP Gas | 25 (5.8%) | 0 (0.0%) |
| Electricity | 376 (87.2%) | 432 (94.3%) |
| Fuel Oil or Kerosene | 14 (3.3%) | 0 (0.0%) |
| Coal or Coke | 0 (0.0%) | 0 (0.0%) |
| All other Fuels | 16 (3.7%) | 8 (1.8%) |
| No Fuel Used | 0 (0.0%) | 0 (0.0%) |
| Total | 431 (100.0%) | 458 (100.0%) |
Household Vehicle Usage in Mount Vernon
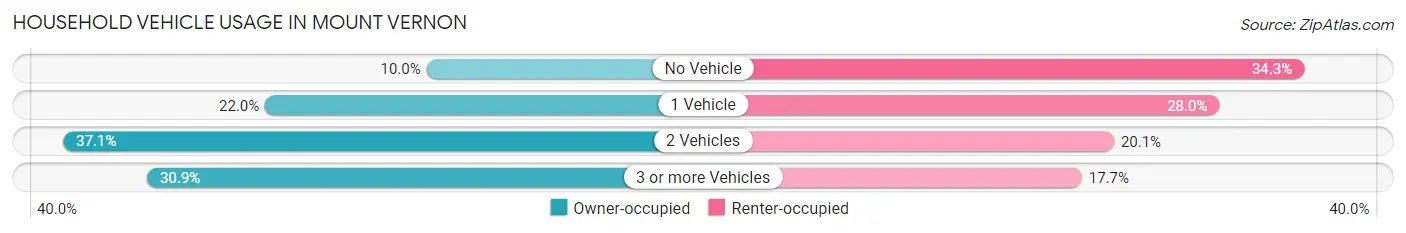
| Vehicles per Household | Owner-occupied | Renter-occupied |
| No Vehicle | 43 (10.0%) | 157 (34.3%) |
| 1 Vehicle | 95 (22.0%) | 128 (28.0%) |
| 2 Vehicles | 160 (37.1%) | 92 (20.1%) |
| 3 or more Vehicles | 133 (30.9%) | 81 (17.7%) |
| Total | 431 (100.0%) | 458 (100.0%) |
Real Estate & Mortgages in Mount Vernon
Real Estate and Mortgage Overview in Mount Vernon
| Characteristic | Without Mortgage | With Mortgage |
| Housing Units | 285 | 146 |
| Median Property Value | $66,300 | $124,200 |
| Median Household Income | $34,950 | $9 |
| Monthly Housing Costs | $302 | $0 |
| Real Estate Taxes | $438 | $14 |
Property Value by Mortgage Status in Mount Vernon
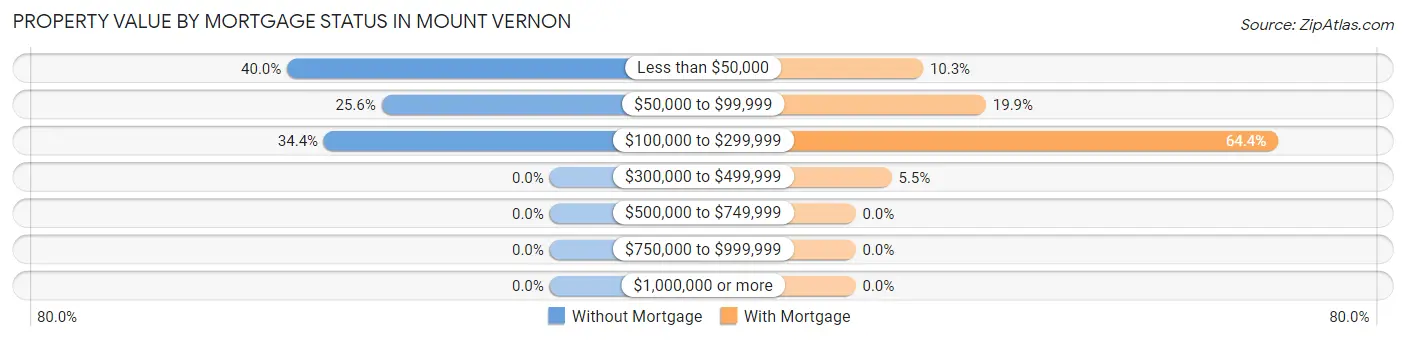
| Property Value | Without Mortgage | With Mortgage |
| Less than $50,000 | 114 (40.0%) | 15 (10.3%) |
| $50,000 to $99,999 | 73 (25.6%) | 29 (19.9%) |
| $100,000 to $299,999 | 98 (34.4%) | 94 (64.4%) |
| $300,000 to $499,999 | 0 (0.0%) | 8 (5.5%) |
| $500,000 to $749,999 | 0 (0.0%) | 0 (0.0%) |
| $750,000 to $999,999 | 0 (0.0%) | 0 (0.0%) |
| $1,000,000 or more | 0 (0.0%) | 0 (0.0%) |
| Total | 285 (100.0%) | 146 (100.0%) |
Household Income by Mortgage Status in Mount Vernon
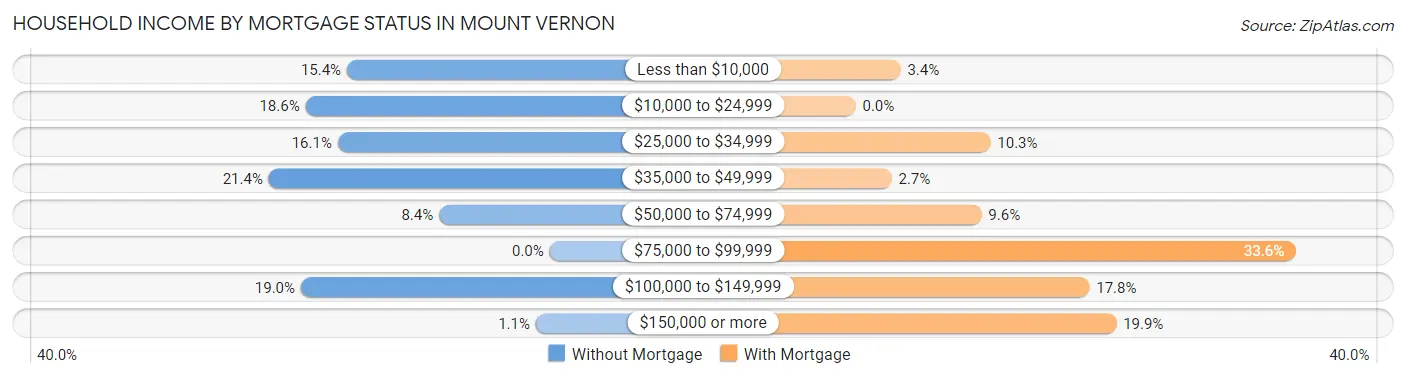
| Household Income | Without Mortgage | With Mortgage |
| Less than $10,000 | 44 (15.4%) | 5 (3.4%) |
| $10,000 to $24,999 | 53 (18.6%) | 0 (0.0%) |
| $25,000 to $34,999 | 46 (16.1%) | 15 (10.3%) |
| $35,000 to $49,999 | 61 (21.4%) | 4 (2.7%) |
| $50,000 to $74,999 | 24 (8.4%) | 14 (9.6%) |
| $75,000 to $99,999 | 0 (0.0%) | 49 (33.6%) |
| $100,000 to $149,999 | 54 (19.0%) | 26 (17.8%) |
| $150,000 or more | 3 (1.1%) | 29 (19.9%) |
| Total | 285 (100.0%) | 146 (100.0%) |
Property Value to Household Income Ratio in Mount Vernon
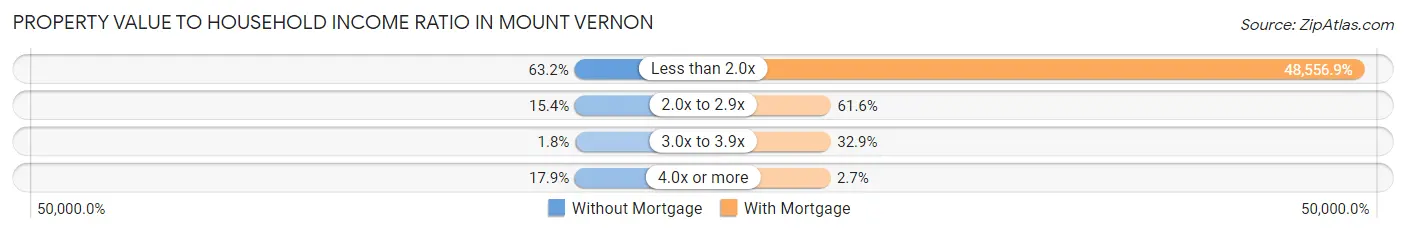
| Value-to-Income Ratio | Without Mortgage | With Mortgage |
| Less than 2.0x | 180 (63.2%) | 70,893 (48,556.8%) |
| 2.0x to 2.9x | 44 (15.4%) | 90 (61.6%) |
| 3.0x to 3.9x | 5 (1.8%) | 48 (32.9%) |
| 4.0x or more | 51 (17.9%) | 4 (2.7%) |
| Total | 285 (100.0%) | 146 (100.0%) |
Real Estate Taxes by Mortgage Status in Mount Vernon
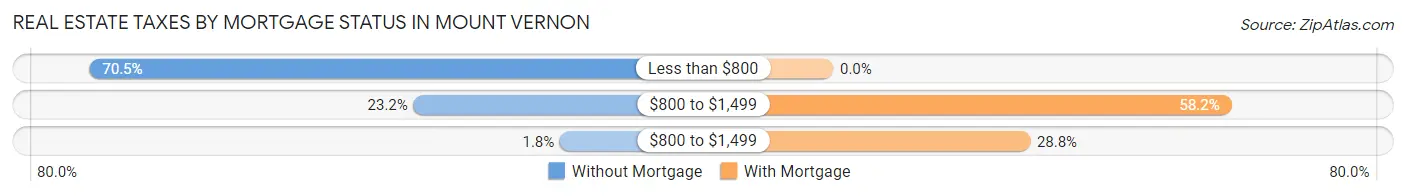
| Property Taxes | Without Mortgage | With Mortgage |
| Less than $800 | 201 (70.5%) | 0 (0.0%) |
| $800 to $1,499 | 66 (23.2%) | 85 (58.2%) |
| $800 to $1,499 | 5 (1.8%) | 42 (28.8%) |
| Total | 285 (100.0%) | 146 (100.0%) |
Health & Disability in Mount Vernon
Health Insurance Coverage by Age in Mount Vernon
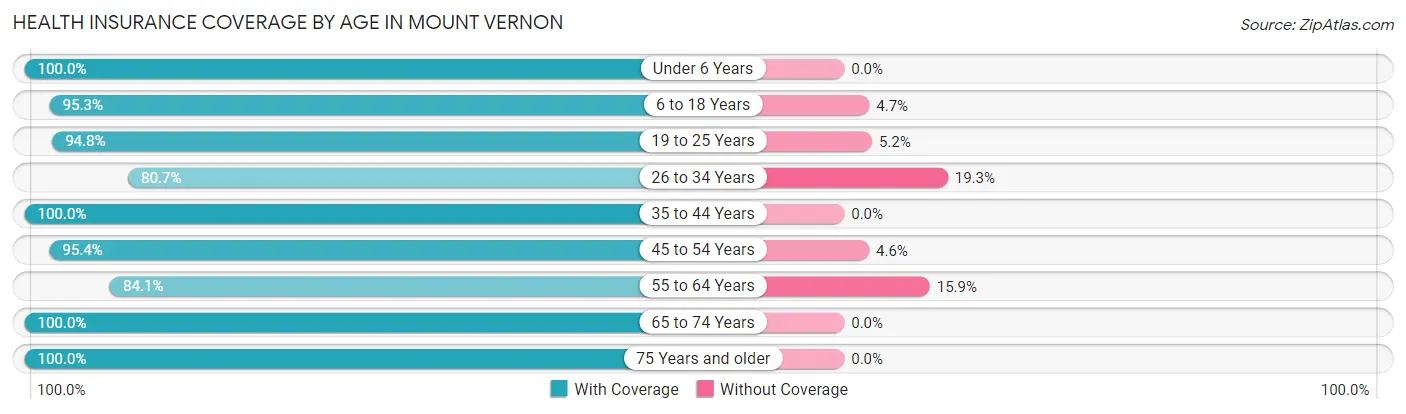
| Age Bracket | With Coverage | Without Coverage |
| Under 6 Years | 153 (100.0%) | 0 (0.0%) |
| 6 to 18 Years | 388 (95.3%) | 19 (4.7%) |
| 19 to 25 Years | 147 (94.8%) | 8 (5.2%) |
| 26 to 34 Years | 138 (80.7%) | 33 (19.3%) |
| 35 to 44 Years | 217 (100.0%) | 0 (0.0%) |
| 45 to 54 Years | 309 (95.4%) | 15 (4.6%) |
| 55 to 64 Years | 269 (84.1%) | 51 (15.9%) |
| 65 to 74 Years | 220 (100.0%) | 0 (0.0%) |
| 75 Years and older | 182 (100.0%) | 0 (0.0%) |
| Total | 2,023 (94.1%) | 126 (5.9%) |
Health Insurance Coverage by Citizenship Status in Mount Vernon
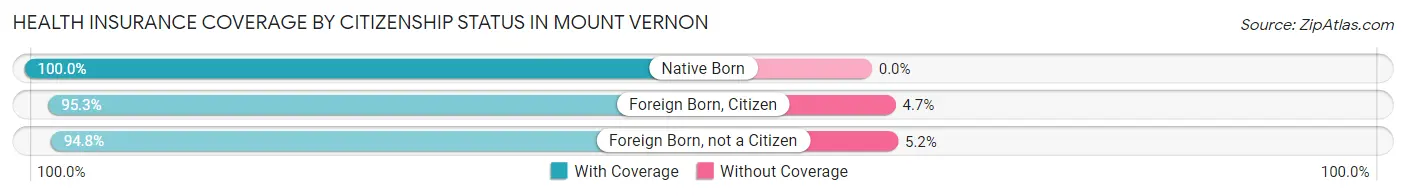
| Citizenship Status | With Coverage | Without Coverage |
| Native Born | 153 (100.0%) | 0 (0.0%) |
| Foreign Born, Citizen | 388 (95.3%) | 19 (4.7%) |
| Foreign Born, not a Citizen | 147 (94.8%) | 8 (5.2%) |
Health Insurance Coverage by Household Income in Mount Vernon
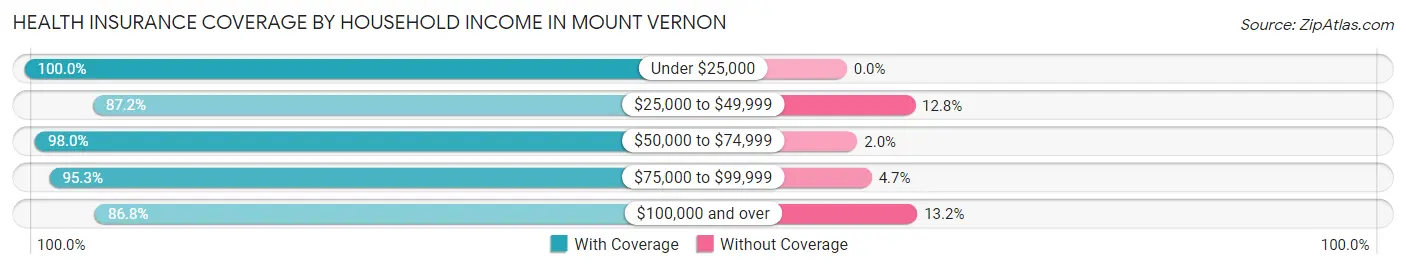
| Household Income | With Coverage | Without Coverage |
| Under $25,000 | 738 (100.0%) | 0 (0.0%) |
| $25,000 to $49,999 | 355 (87.2%) | 52 (12.8%) |
| $50,000 to $74,999 | 247 (98.0%) | 5 (2.0%) |
| $75,000 to $99,999 | 306 (95.3%) | 15 (4.7%) |
| $100,000 and over | 355 (86.8%) | 54 (13.2%) |
Public vs Private Health Insurance Coverage by Age in Mount Vernon
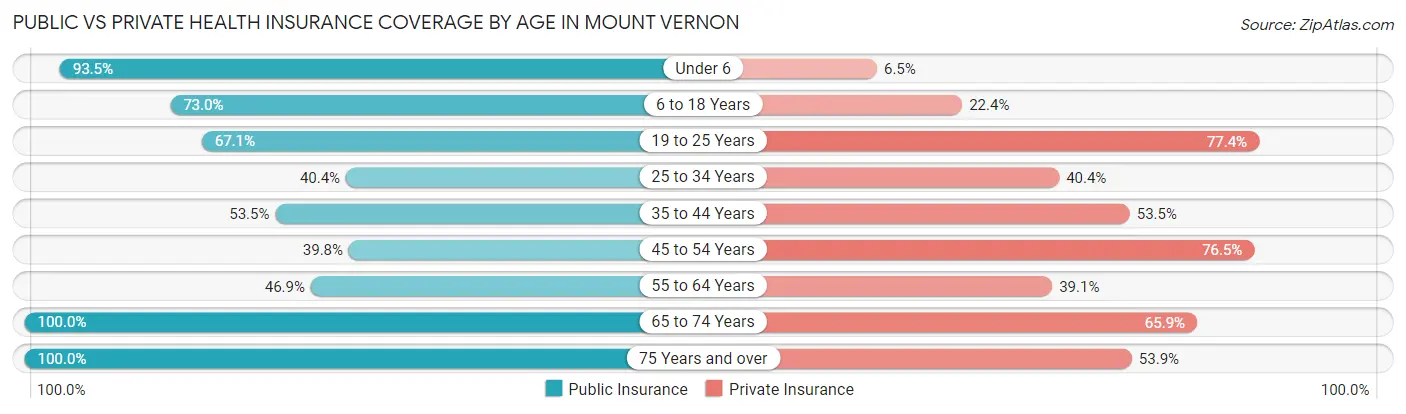
| Age Bracket | Public Insurance | Private Insurance |
| Under 6 | 143 (93.5%) | 10 (6.5%) |
| 6 to 18 Years | 297 (73.0%) | 91 (22.4%) |
| 19 to 25 Years | 104 (67.1%) | 120 (77.4%) |
| 25 to 34 Years | 69 (40.4%) | 69 (40.4%) |
| 35 to 44 Years | 116 (53.5%) | 116 (53.5%) |
| 45 to 54 Years | 129 (39.8%) | 248 (76.5%) |
| 55 to 64 Years | 150 (46.9%) | 125 (39.1%) |
| 65 to 74 Years | 220 (100.0%) | 145 (65.9%) |
| 75 Years and over | 182 (100.0%) | 98 (53.8%) |
| Total | 1,410 (65.6%) | 1,022 (47.6%) |
Disability Status by Sex by Age in Mount Vernon
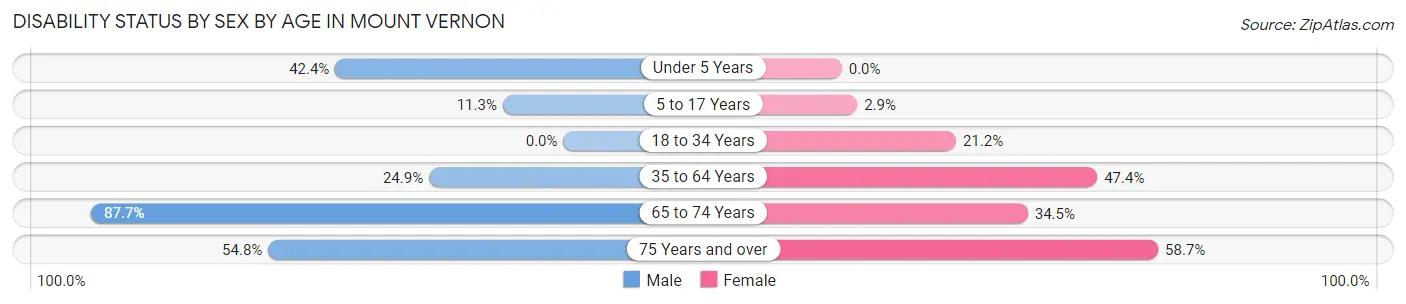
| Age Bracket | Male | Female |
| Under 5 Years | 36 (42.3%) | 0 (0.0%) |
| 5 to 17 Years | 18 (11.3%) | 5 (2.9%) |
| 18 to 34 Years | 0 (0.0%) | 32 (21.2%) |
| 35 to 64 Years | 99 (24.9%) | 220 (47.4%) |
| 65 to 74 Years | 71 (87.6%) | 48 (34.5%) |
| 75 Years and over | 40 (54.8%) | 64 (58.7%) |
Disability Class by Sex by Age in Mount Vernon
Disability Class: Hearing Difficulty
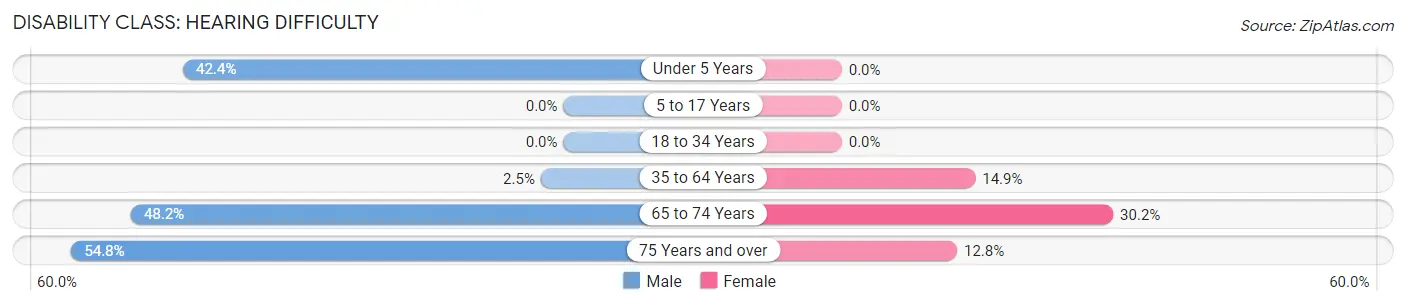
| Age Bracket | Male | Female |
| Under 5 Years | 36 (42.3%) | 0 (0.0%) |
| 5 to 17 Years | 0 (0.0%) | 0 (0.0%) |
| 18 to 34 Years | 0 (0.0%) | 0 (0.0%) |
| 35 to 64 Years | 10 (2.5%) | 69 (14.9%) |
| 65 to 74 Years | 39 (48.1%) | 42 (30.2%) |
| 75 Years and over | 40 (54.8%) | 14 (12.8%) |
Disability Class: Vision Difficulty
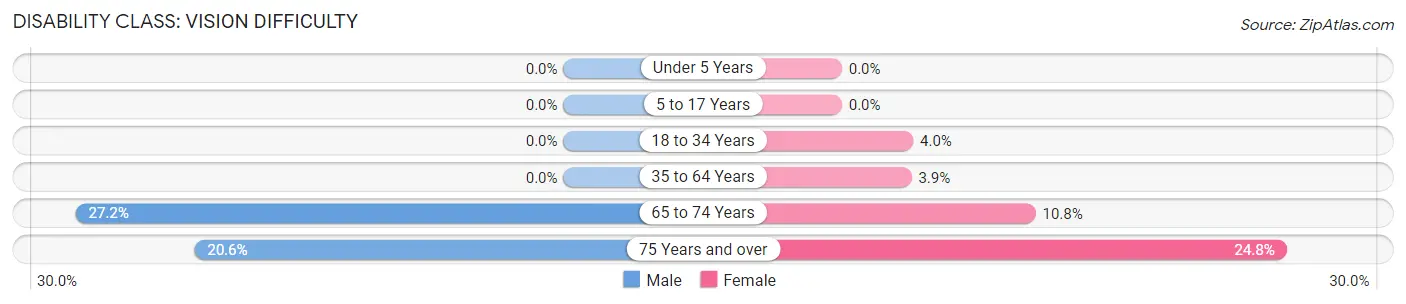
| Age Bracket | Male | Female |
| Under 5 Years | 0 (0.0%) | 0 (0.0%) |
| 5 to 17 Years | 0 (0.0%) | 0 (0.0%) |
| 18 to 34 Years | 0 (0.0%) | 6 (4.0%) |
| 35 to 64 Years | 0 (0.0%) | 18 (3.9%) |
| 65 to 74 Years | 22 (27.2%) | 15 (10.8%) |
| 75 Years and over | 15 (20.5%) | 27 (24.8%) |
Disability Class: Cognitive Difficulty
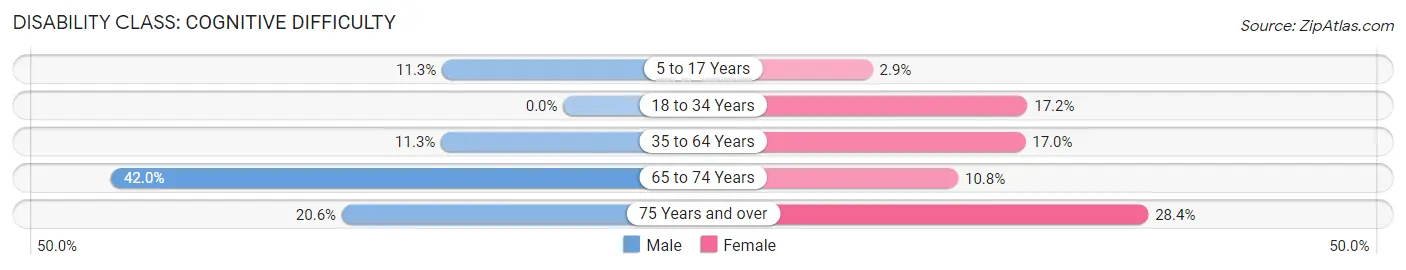
| Age Bracket | Male | Female |
| 5 to 17 Years | 18 (11.3%) | 5 (2.9%) |
| 18 to 34 Years | 0 (0.0%) | 26 (17.2%) |
| 35 to 64 Years | 45 (11.3%) | 79 (17.0%) |
| 65 to 74 Years | 34 (42.0%) | 15 (10.8%) |
| 75 Years and over | 15 (20.5%) | 31 (28.4%) |
Disability Class: Ambulatory Difficulty
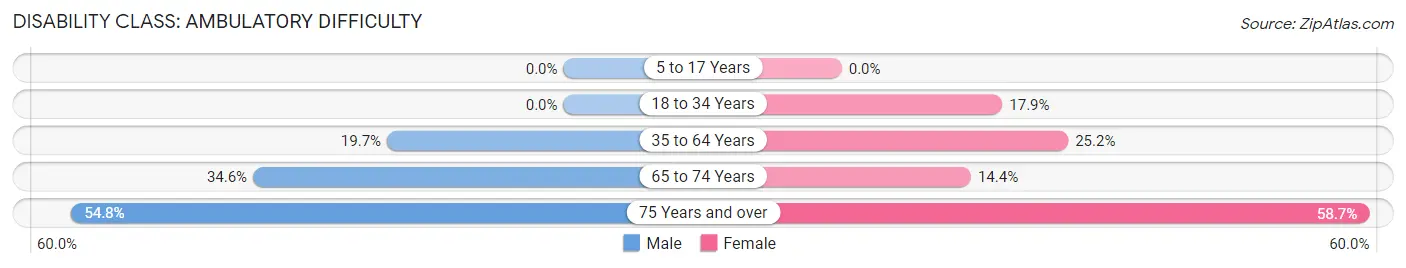
| Age Bracket | Male | Female |
| 5 to 17 Years | 0 (0.0%) | 0 (0.0%) |
| 18 to 34 Years | 0 (0.0%) | 27 (17.9%) |
| 35 to 64 Years | 78 (19.7%) | 117 (25.2%) |
| 65 to 74 Years | 28 (34.6%) | 20 (14.4%) |
| 75 Years and over | 40 (54.8%) | 64 (58.7%) |
Disability Class: Self-Care Difficulty
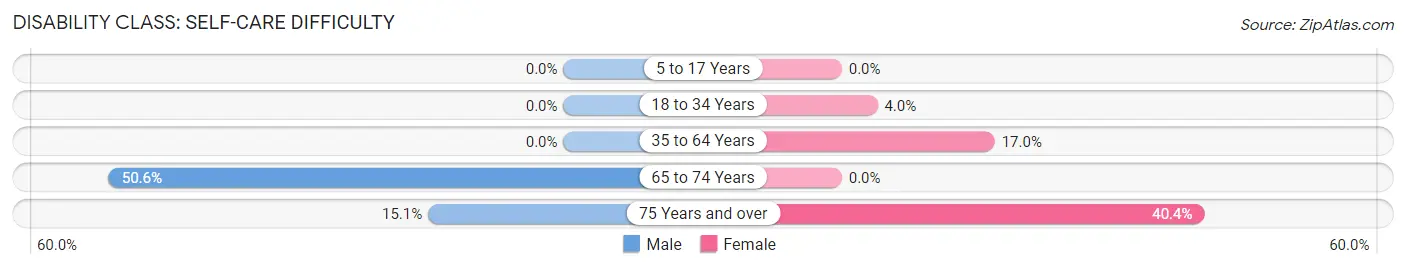
| Age Bracket | Male | Female |
| 5 to 17 Years | 0 (0.0%) | 0 (0.0%) |
| 18 to 34 Years | 0 (0.0%) | 6 (4.0%) |
| 35 to 64 Years | 0 (0.0%) | 79 (17.0%) |
| 65 to 74 Years | 41 (50.6%) | 0 (0.0%) |
| 75 Years and over | 11 (15.1%) | 44 (40.4%) |
Technology Access in Mount Vernon
Computing Device Access in Mount Vernon
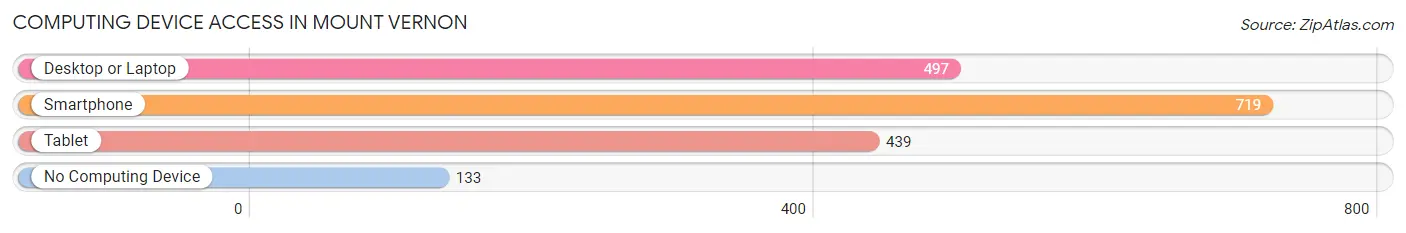
| Device Type | # Households | % Households |
| Desktop or Laptop | 497 | 55.9% |
| Smartphone | 719 | 80.9% |
| Tablet | 439 | 49.4% |
| No Computing Device | 133 | 15.0% |
| Total | 889 | 100.0% |
Internet Access in Mount Vernon
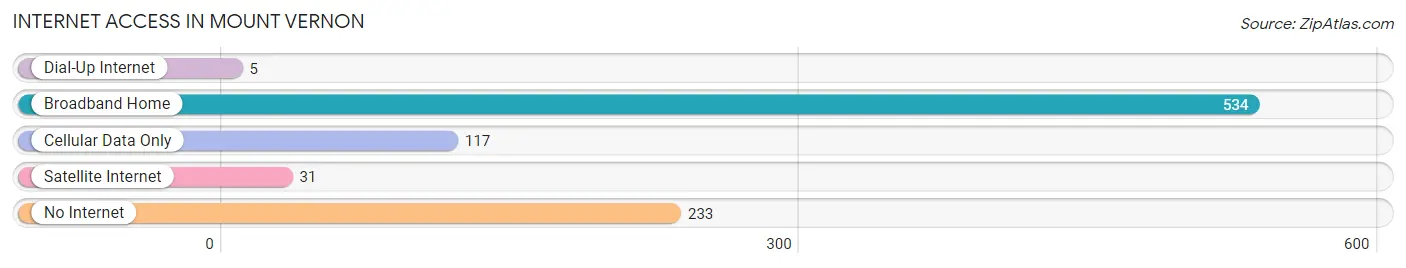
| Internet Type | # Households | % Households |
| Dial-Up Internet | 5 | 0.6% |
| Broadband Home | 534 | 60.1% |
| Cellular Data Only | 117 | 13.2% |
| Satellite Internet | 31 | 3.5% |
| No Internet | 233 | 26.2% |
| Total | 889 | 100.0% |
Mount Vernon Summary
Introduction
Mount Vernon is a small city located in Rockcastle County, Kentucky. It is situated in the foothills of the Appalachian Mountains and is the county seat of Rockcastle County. The city has a population of 2,062 as of the 2010 census. The city is known for its rich history, beautiful scenery, and friendly people.
History
Mount Vernon was founded in 1810 by a group of settlers from Virginia. The city was named after George Washington’s home, Mount Vernon. The city was incorporated in 1820 and has been the county seat of Rockcastle County since 1821.
The city was an important stop on the Wilderness Road, which was the main route for settlers traveling westward. The city was also an important stop on the Louisville and Nashville Railroad, which was built in the late 1800s.
The city was home to several important historical figures, including Abraham Lincoln’s father, Thomas Lincoln, and Confederate General John Hunt Morgan. The city was also the site of the Battle of Mount Vernon in 1862, which was a major battle in the Civil War.
Geography
Mount Vernon is located in the foothills of the Appalachian Mountains in southeastern Kentucky. The city is situated at the intersection of US Highway 25 and Kentucky Route 461. The city is surrounded by rolling hills and lush forests.
The city is located in the Cumberland Plateau region of Kentucky, which is known for its rugged terrain and beautiful scenery. The city is located near the headwaters of the Rockcastle River, which is a popular destination for fishing and canoeing.
Economy
The economy of Mount Vernon is largely based on agriculture and tourism. The city is home to several farms, which produce a variety of crops, including corn, soybeans, and tobacco. The city is also home to several tourist attractions, including the Rockcastle River, the Abraham Lincoln Birthplace National Historic Site, and the Battle of Mount Vernon Civil War Site.
The city is also home to several small businesses, including restaurants, shops, and hotels. The city is also home to several manufacturing companies, including a furniture factory and a plastics factory.
Demographics
As of the 2010 census, the population of Mount Vernon was 2,062. The city has a population that is predominantly white (94.3%) and has a median household income of $30,938. The city has a poverty rate of 22.3%, which is higher than the national average.
Conclusion
Mount Vernon is a small city located in Rockcastle County, Kentucky. The city is known for its rich history, beautiful scenery, and friendly people. The city’s economy is largely based on agriculture and tourism, and the city is home to several small businesses, manufacturing companies, and tourist attractions. The city has a population that is predominantly white and has a median household income of $30,938.
Common Questions
What is Per Capita Income in Mount Vernon?
Per Capita income in Mount Vernon is $19,933.
What is the Median Family Income in Mount Vernon?
Median Family Income in Mount Vernon is $49,531.
What is the Median Household income in Mount Vernon?
Median Household Income in Mount Vernon is $34,550.
What is Income or Wage Gap in Mount Vernon?
Income or Wage Gap in Mount Vernon is 37.6%.
Women in Mount Vernon earn 62.4 cents for every dollar earned by a man.
What is Inequality or Gini Index in Mount Vernon?
Inequality or Gini Index in Mount Vernon is 0.51.
What is the Total Population of Mount Vernon?
Total Population of Mount Vernon is 2,342.
What is the Total Male Population of Mount Vernon?
Total Male Population of Mount Vernon is 1,138.
What is the Total Female Population of Mount Vernon?
Total Female Population of Mount Vernon is 1,204.
What is the Ratio of Males per 100 Females in Mount Vernon?
There are 94.52 Males per 100 Females in Mount Vernon.
What is the Ratio of Females per 100 Males in Mount Vernon?
There are 105.80 Females per 100 Males in Mount Vernon.
What is the Median Population Age in Mount Vernon?
Median Population Age in Mount Vernon is 45.4 Years.
What is the Average Family Size in Mount Vernon
Average Family Size in Mount Vernon is 3.1 People.
What is the Average Household Size in Mount Vernon
Average Household Size in Mount Vernon is 2.4 People.
How Large is the Labor Force in Mount Vernon?
There are 876 People in the Labor Forcein in Mount Vernon.
What is the Percentage of People in the Labor Force in Mount Vernon?
45.3% of People are in the Labor Force in Mount Vernon.
What is the Unemployment Rate in Mount Vernon?
Unemployment Rate in Mount Vernon is 3.7%.