Caneyville, KY Map & Demographics
Caneyville Map
Caneyville Overview
$18,015
PER CAPITA INCOME
$57,917
AVG FAMILY INCOME
$42,212
AVG HOUSEHOLD INCOME
26.2%
WAGE / INCOME GAP [ % ]
73.8¢/ $1
WAGE / INCOME GAP [ $ ]
0.48
INEQUALITY / GINI INDEX
665
TOTAL POPULATION
301
MALE POPULATION
364
FEMALE POPULATION
82.69
MALES / 100 FEMALES
120.93
FEMALES / 100 MALES
33.2
MEDIAN AGE
4.4
AVG FAMILY SIZE
2.8
AVG HOUSEHOLD SIZE
285
LABOR FORCE [ PEOPLE ]
62.0%
PERCENT IN LABOR FORCE
0.4%
UNEMPLOYMENT RATE
Caneyville Zip Codes
Caneyville Area Codes
Income in Caneyville
Income Overview in Caneyville
Per Capita Income in Caneyville is $18,015, while median incomes of families and households are $57,917 and $42,212 respectively.
| Characteristic | Number | Measure |
| Per Capita Income | 665 | $18,015 |
| Median Family Income | 125 | $57,917 |
| Mean Family Income | 125 | $65,445 |
| Median Household Income | 235 | $42,212 |
| Mean Household Income | 235 | $44,499 |
| Income Deficit | 125 | $0 |
| Wage / Income Gap (%) | 665 | 26.16% |
| Wage / Income Gap ($) | 665 | 73.84¢ per $1 |
| Gini / Inequality Index | 665 | 0.48 |
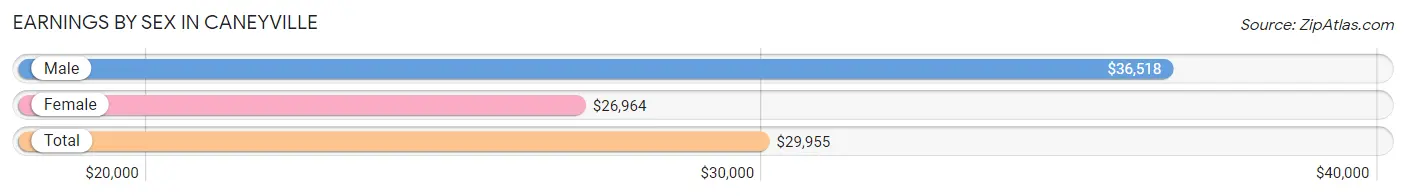
Earnings by Sex in Caneyville
Average Earnings in Caneyville are $29,955, $36,518 for men and $26,964 for women, a difference of 26.2%.
| Sex | Number | Average Earnings |
| Male | 127 (44.3%) | $36,518 |
| Female | 160 (55.7%) | $26,964 |
| Total | 287 (100.0%) | $29,955 |
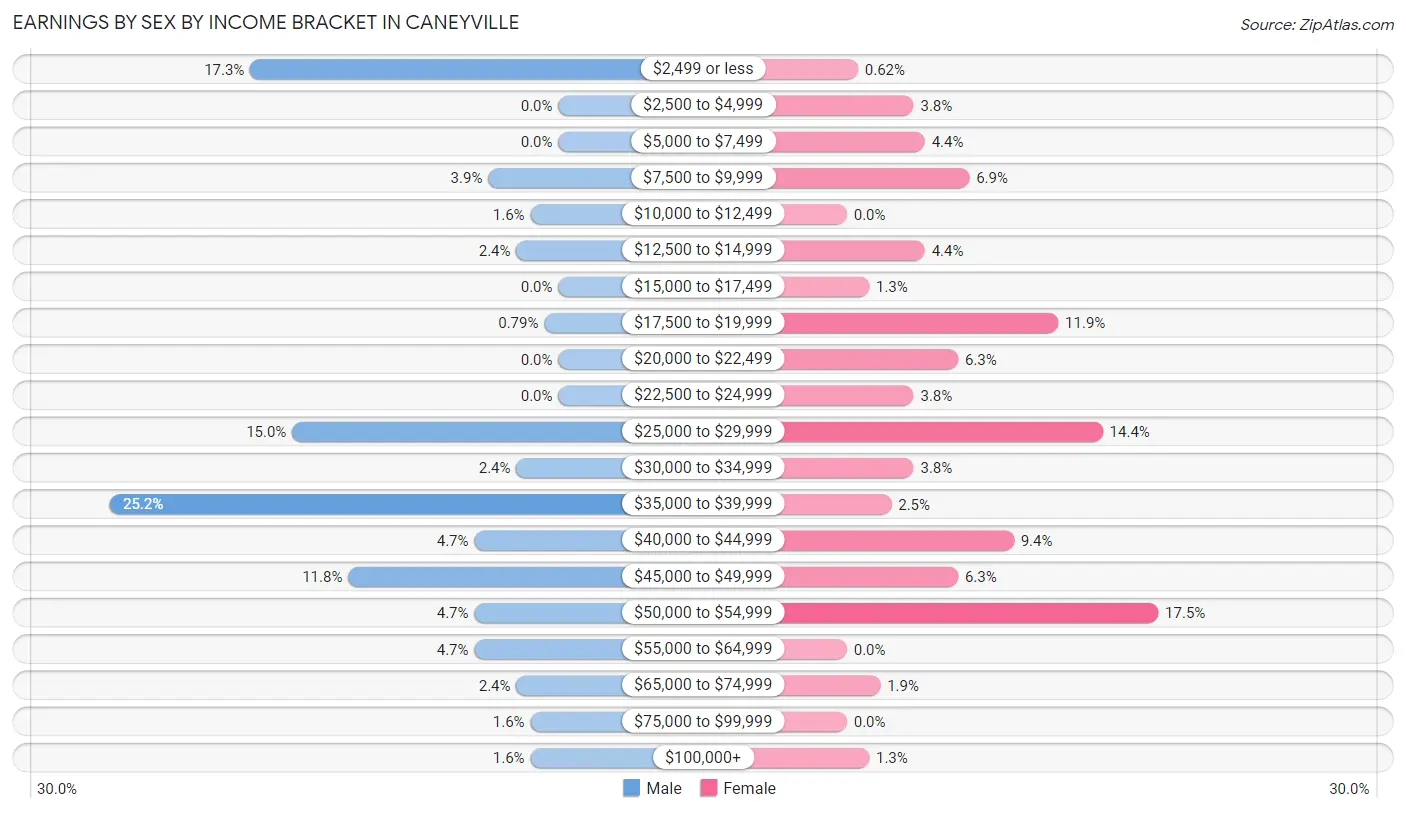
Earnings by Sex by Income Bracket in Caneyville
The most common earnings brackets in Caneyville are $35,000 to $39,999 for men (32 | 25.2%) and $50,000 to $54,999 for women (28 | 17.5%).
| Income | Male | Female |
| $2,499 or less | 22 (17.3%) | 1 (0.6%) |
| $2,500 to $4,999 | 0 (0.0%) | 6 (3.7%) |
| $5,000 to $7,499 | 0 (0.0%) | 7 (4.4%) |
| $7,500 to $9,999 | 5 (3.9%) | 11 (6.9%) |
| $10,000 to $12,499 | 2 (1.6%) | 0 (0.0%) |
| $12,500 to $14,999 | 3 (2.4%) | 7 (4.4%) |
| $15,000 to $17,499 | 0 (0.0%) | 2 (1.3%) |
| $17,500 to $19,999 | 1 (0.8%) | 19 (11.9%) |
| $20,000 to $22,499 | 0 (0.0%) | 10 (6.2%) |
| $22,500 to $24,999 | 0 (0.0%) | 6 (3.7%) |
| $25,000 to $29,999 | 19 (15.0%) | 23 (14.4%) |
| $30,000 to $34,999 | 3 (2.4%) | 6 (3.7%) |
| $35,000 to $39,999 | 32 (25.2%) | 4 (2.5%) |
| $40,000 to $44,999 | 6 (4.7%) | 15 (9.4%) |
| $45,000 to $49,999 | 15 (11.8%) | 10 (6.2%) |
| $50,000 to $54,999 | 6 (4.7%) | 28 (17.5%) |
| $55,000 to $64,999 | 6 (4.7%) | 0 (0.0%) |
| $65,000 to $74,999 | 3 (2.4%) | 3 (1.9%) |
| $75,000 to $99,999 | 2 (1.6%) | 0 (0.0%) |
| $100,000+ | 2 (1.6%) | 2 (1.3%) |
| Total | 127 (100.0%) | 160 (100.0%) |
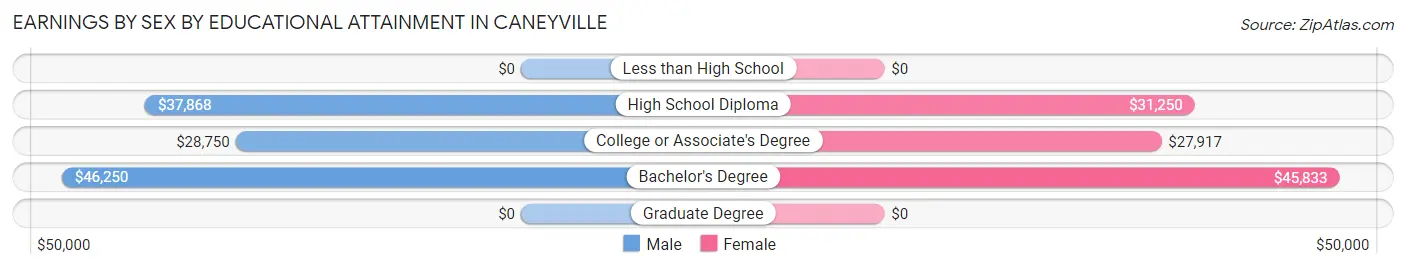
Earnings by Sex by Educational Attainment in Caneyville
Average earnings in Caneyville are $37,986 for men and $28,750 for women, a difference of 24.3%. Men with an educational attainment of bachelor's degree enjoy the highest average annual earnings of $46,250, while those with college or associate's degree education earn the least with $28,750. Women with an educational attainment of bachelor's degree earn the most with the average annual earnings of $45,833, while those with college or associate's degree education have the smallest earnings of $27,917.
| Educational Attainment | Male Income | Female Income |
| Less than High School | - | - |
| High School Diploma | $37,868 | $31,250 |
| College or Associate's Degree | $28,750 | $27,917 |
| Bachelor's Degree | $46,250 | $45,833 |
| Graduate Degree | - | - |
| Total | $37,986 | $28,750 |
Family Income in Caneyville
Family Income Brackets in Caneyville
According to the Caneyville family income data, there are 40 families falling into the $50,000 to $74,999 income range, which is the most common income bracket and makes up 32.0% of all families.
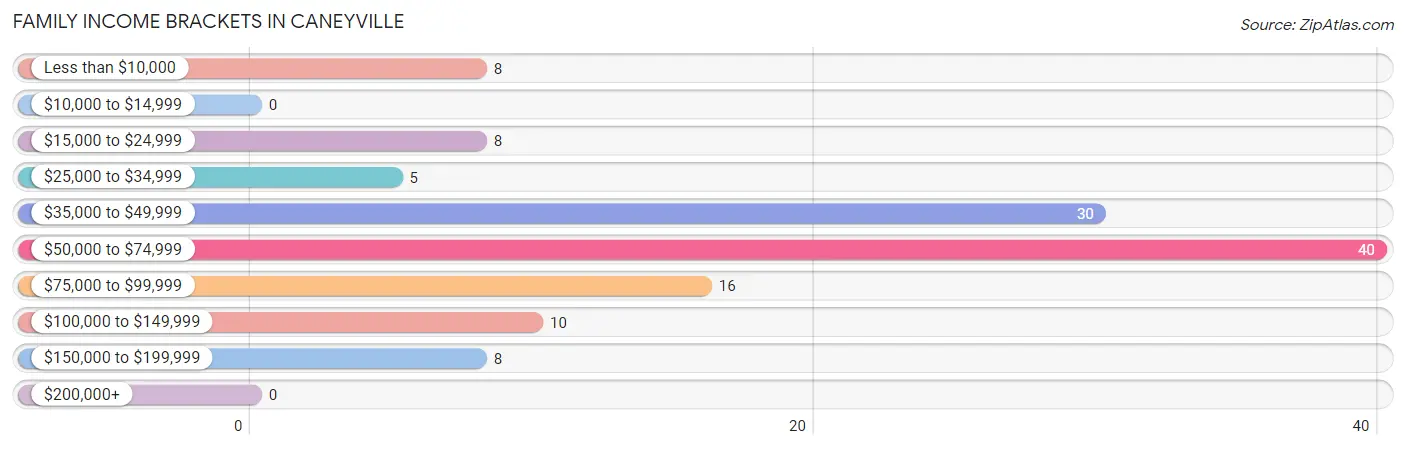
| Income Bracket | # Families | % Families |
| Less than $10,000 | 8 | 6.4% |
| $10,000 to $14,999 | 0 | 0.0% |
| $15,000 to $24,999 | 8 | 6.4% |
| $25,000 to $34,999 | 5 | 4.0% |
| $35,000 to $49,999 | 30 | 24.0% |
| $50,000 to $74,999 | 40 | 32.0% |
| $75,000 to $99,999 | 16 | 12.8% |
| $100,000 to $149,999 | 10 | 8.0% |
| $150,000 to $199,999 | 8 | 6.4% |
| $200,000+ | 0 | 0.0% |
Family Income by Famaliy Size in Caneyville
3-person families (21 | 16.8%) account for the highest median family income in Caneyville with $59,028 per family, while 2-person families (55 | 44.0%) have the highest median income of $21,180 per family member.
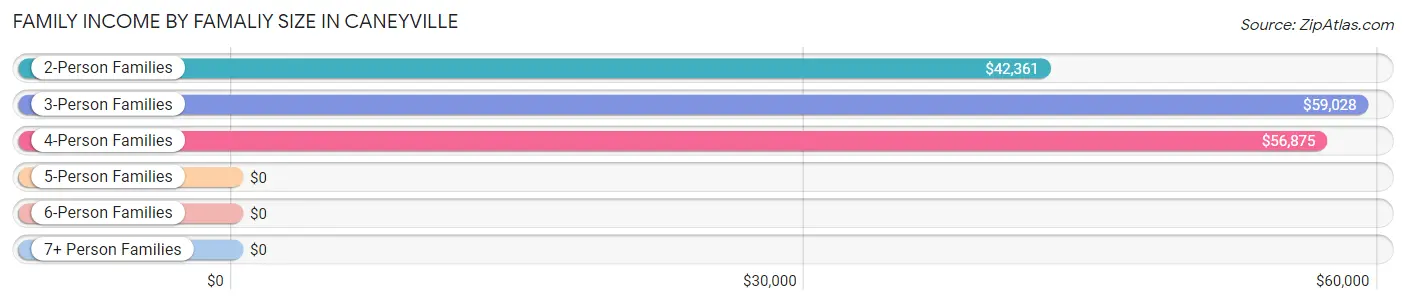
| Income Bracket | # Families | Median Income |
| 2-Person Families | 55 (44.0%) | $42,361 |
| 3-Person Families | 21 (16.8%) | $59,028 |
| 4-Person Families | 27 (21.6%) | $56,875 |
| 5-Person Families | 12 (9.6%) | $0 |
| 6-Person Families | 0 (0.0%) | $0 |
| 7+ Person Families | 10 (8.0%) | $0 |
| Total | 125 (100.0%) | $57,917 |
Family Income by Number of Earners in Caneyville
The median family income in Caneyville is $57,917, with families comprising 1 earner (30) having the highest median family income of $65,313, while families with no earners (23) have the lowest median family income of $16,094, accounting for 24.0% and 18.4% of families, respectively.
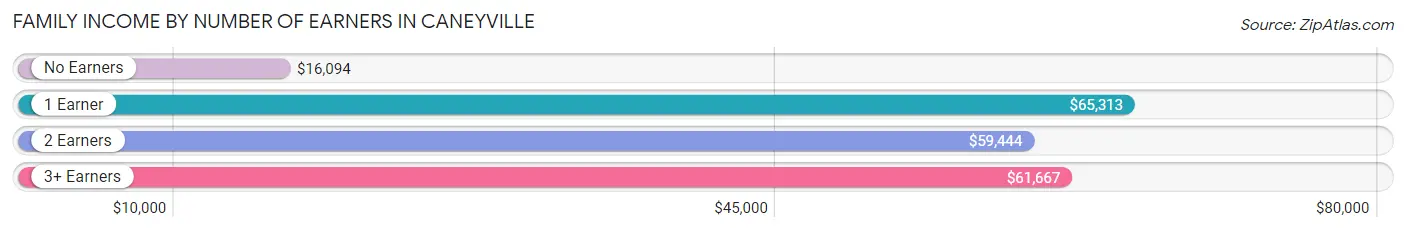
| Number of Earners | # Families | Median Income |
| No Earners | 23 (18.4%) | $16,094 |
| 1 Earner | 30 (24.0%) | $65,313 |
| 2 Earners | 58 (46.4%) | $59,444 |
| 3+ Earners | 14 (11.2%) | $61,667 |
| Total | 125 (100.0%) | $57,917 |
Household Income in Caneyville
Household Income Brackets in Caneyville
With 51 households falling in the category, the $50,000 to $74,999 income range is the most frequent in Caneyville, accounting for 21.7% of all households.
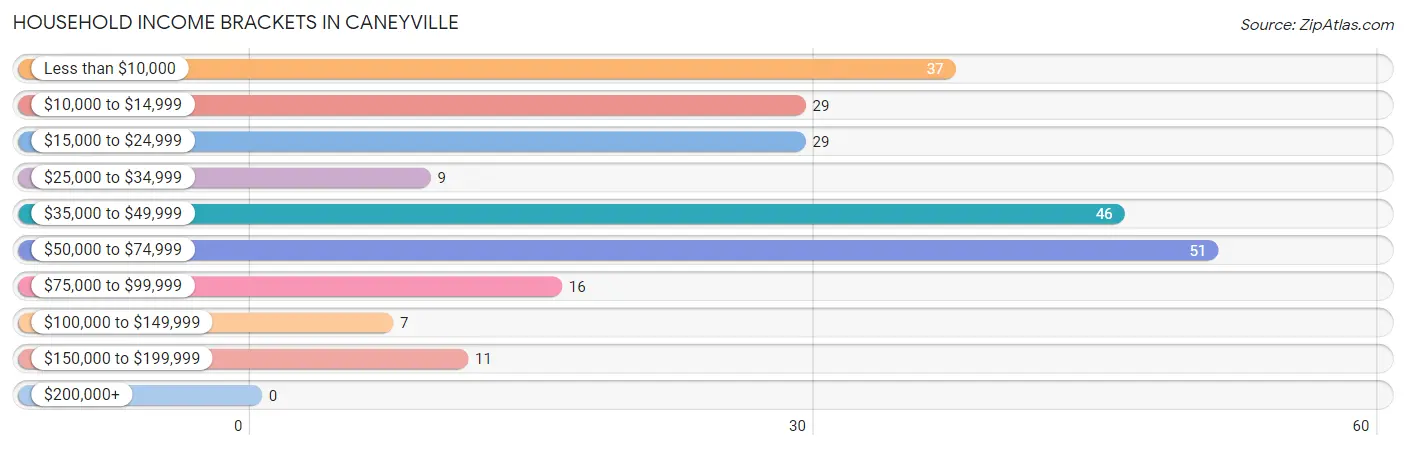
| Income Bracket | # Households | % Households |
| Less than $10,000 | 37 | 15.7% |
| $10,000 to $14,999 | 29 | 12.3% |
| $15,000 to $24,999 | 29 | 12.3% |
| $25,000 to $34,999 | 9 | 3.8% |
| $35,000 to $49,999 | 46 | 19.6% |
| $50,000 to $74,999 | 51 | 21.7% |
| $75,000 to $99,999 | 16 | 6.8% |
| $100,000 to $149,999 | 7 | 3.0% |
| $150,000 to $199,999 | 11 | 4.7% |
| $200,000+ | 0 | 0.0% |
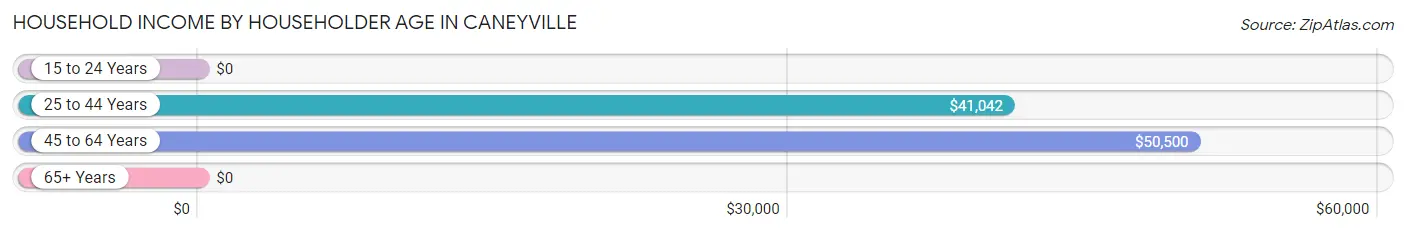
Household Income by Householder Age in Caneyville
The median household income in Caneyville is $42,212, with the highest median household income of $50,500 found in the 45 to 64 years age bracket for the primary householder. A total of 76 households (32.3%) fall into this category. Meanwhile, the 15 to 24 years age bracket for the primary householder has the lowest median household income of $0, with 5 households (2.1%) in this group.
| Income Bracket | # Households | Median Income |
| 15 to 24 Years | 5 (2.1%) | $0 |
| 25 to 44 Years | 92 (39.2%) | $41,042 |
| 45 to 64 Years | 76 (32.3%) | $50,500 |
| 65+ Years | 62 (26.4%) | $0 |
| Total | 235 (100.0%) | $42,212 |
Poverty in Caneyville
Income Below Poverty by Sex and Age in Caneyville
With 19.6% poverty level for males and 12.9% for females among the residents of Caneyville, 15 year old males and 75 year old and over females are the most vulnerable to poverty, with 3 males (50.0%) and 22 females (75.9%) in their respective age groups living below the poverty level.
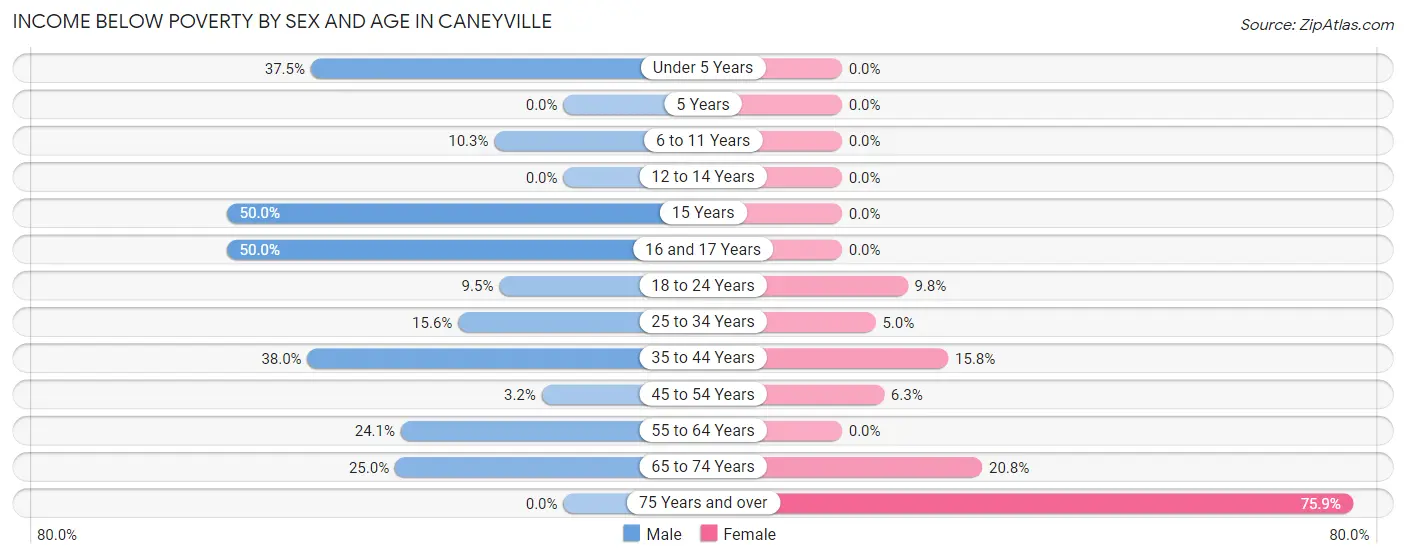
| Age Bracket | Male | Female |
| Under 5 Years | 9 (37.5%) | 0 (0.0%) |
| 5 Years | 0 (0.0%) | 0 (0.0%) |
| 6 to 11 Years | 4 (10.3%) | 0 (0.0%) |
| 12 to 14 Years | 0 (0.0%) | 0 (0.0%) |
| 15 Years | 3 (50.0%) | 0 (0.0%) |
| 16 and 17 Years | 3 (50.0%) | 0 (0.0%) |
| 18 to 24 Years | 2 (9.5%) | 4 (9.8%) |
| 25 to 34 Years | 5 (15.6%) | 2 (5.0%) |
| 35 to 44 Years | 19 (38.0%) | 12 (15.8%) |
| 45 to 54 Years | 1 (3.2%) | 2 (6.2%) |
| 55 to 64 Years | 7 (24.1%) | 0 (0.0%) |
| 65 to 74 Years | 6 (25.0%) | 5 (20.8%) |
| 75 Years and over | 0 (0.0%) | 22 (75.9%) |
| Total | 59 (19.6%) | 47 (12.9%) |
Income Above Poverty by Sex and Age in Caneyville
According to the poverty statistics in Caneyville, males aged 5 years and females aged under 5 years are the age groups that are most secure financially, with 100.0% of males and 100.0% of females in these age groups living above the poverty line.
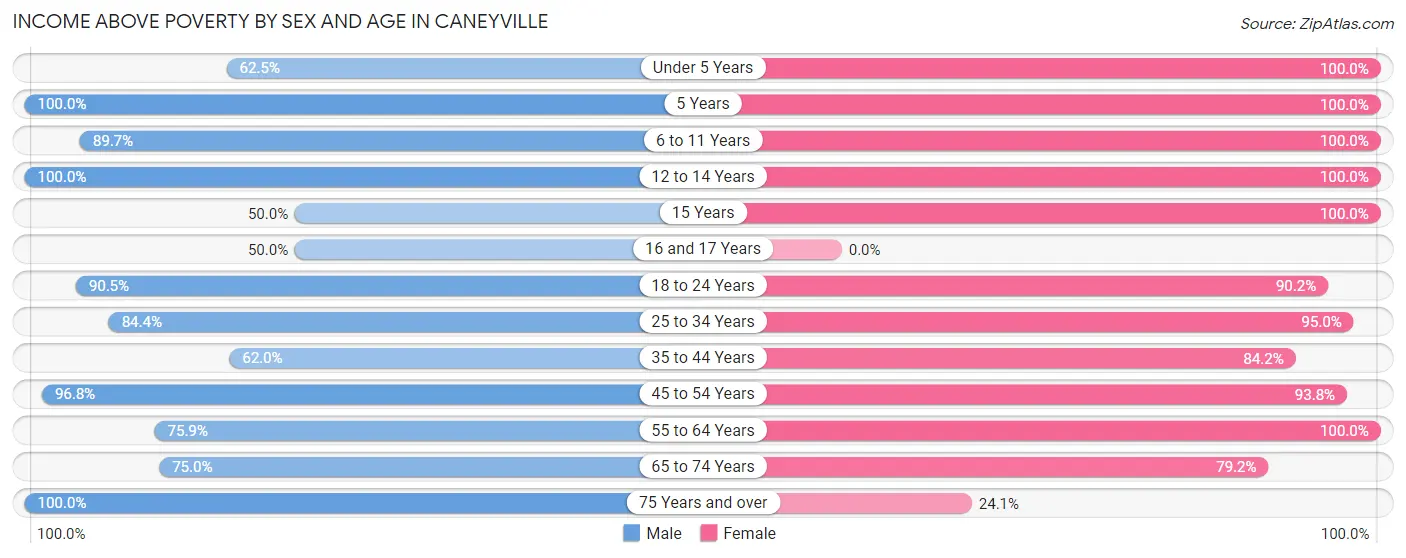
| Age Bracket | Male | Female |
| Under 5 Years | 15 (62.5%) | 25 (100.0%) |
| 5 Years | 4 (100.0%) | 3 (100.0%) |
| 6 to 11 Years | 35 (89.7%) | 33 (100.0%) |
| 12 to 14 Years | 32 (100.0%) | 34 (100.0%) |
| 15 Years | 3 (50.0%) | 5 (100.0%) |
| 16 and 17 Years | 3 (50.0%) | 0 (0.0%) |
| 18 to 24 Years | 19 (90.5%) | 37 (90.2%) |
| 25 to 34 Years | 27 (84.4%) | 38 (95.0%) |
| 35 to 44 Years | 31 (62.0%) | 64 (84.2%) |
| 45 to 54 Years | 30 (96.8%) | 30 (93.8%) |
| 55 to 64 Years | 22 (75.9%) | 22 (100.0%) |
| 65 to 74 Years | 18 (75.0%) | 19 (79.2%) |
| 75 Years and over | 3 (100.0%) | 7 (24.1%) |
| Total | 242 (80.4%) | 317 (87.1%) |
Income Below Poverty Among Married-Couple Families in Caneyville
The poverty statistics for married-couple families in Caneyville show that 3.5% or 3 of the total 86 families live below the poverty line. Families with 1 or 2 children have the highest poverty rate of 4.5%, comprising of 2 families. On the other hand, families with 3 or 4 children have the lowest poverty rate of 0.0%, which includes 0 families.
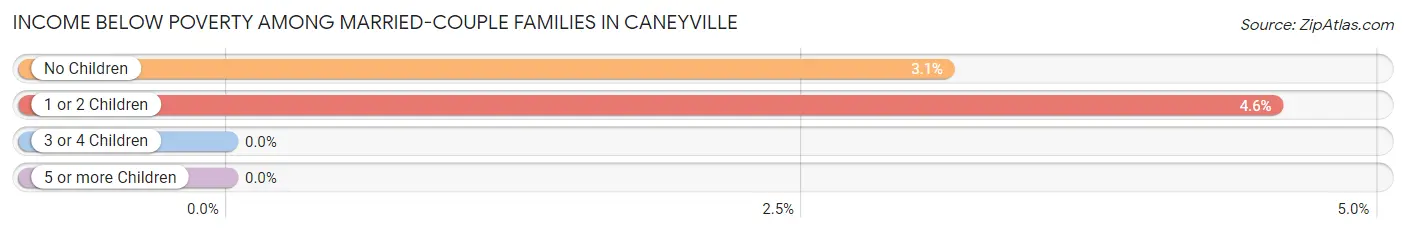
| Children | Above Poverty | Below Poverty |
| No Children | 31 (96.9%) | 1 (3.1%) |
| 1 or 2 Children | 42 (95.5%) | 2 (4.5%) |
| 3 or 4 Children | 10 (100.0%) | 0 (0.0%) |
| 5 or more Children | 0 (0.0%) | 0 (0.0%) |
| Total | 83 (96.5%) | 3 (3.5%) |
Income Below Poverty Among Single-Parent Households in Caneyville
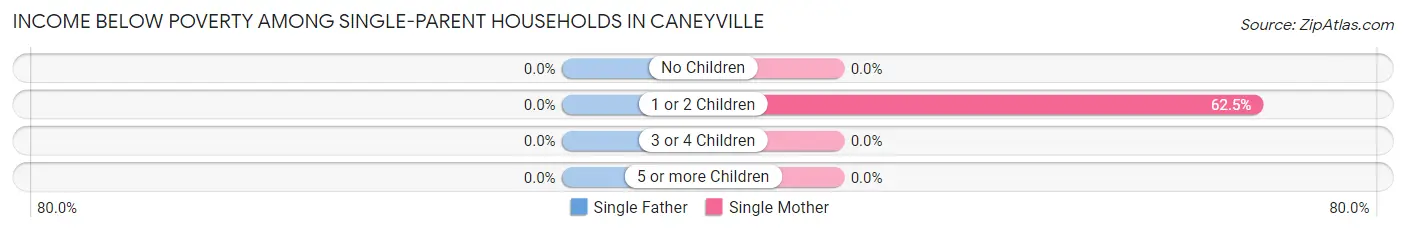
| Children | Single Father | Single Mother |
| No Children | 0 (0.0%) | 0 (0.0%) |
| 1 or 2 Children | 0 (0.0%) | 15 (62.5%) |
| 3 or 4 Children | 0 (0.0%) | 0 (0.0%) |
| 5 or more Children | 0 (0.0%) | 0 (0.0%) |
| Total | 0 (0.0%) | 15 (62.5%) |
Income Below Poverty Among Married-Couple vs Single-Parent Households in Caneyville
The poverty data for Caneyville shows that 3 of the married-couple family households (3.5%) and 15 of the single-parent households (38.5%) are living below the poverty level. Within the married-couple family households, those with 1 or 2 children have the highest poverty rate, with 2 households (4.5%) falling below the poverty line. Among the single-parent households, those with 1 or 2 children have the highest poverty rate, with 15 household (50.0%) living below poverty.
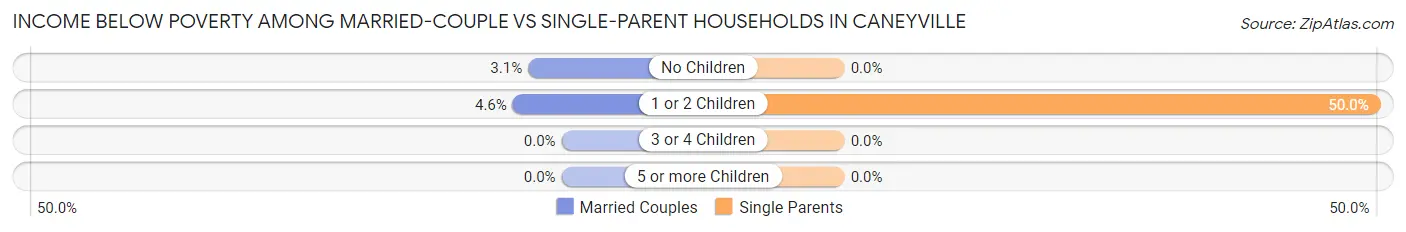
| Children | Married-Couple Families | Single-Parent Households |
| No Children | 1 (3.1%) | 0 (0.0%) |
| 1 or 2 Children | 2 (4.5%) | 15 (50.0%) |
| 3 or 4 Children | 0 (0.0%) | 0 (0.0%) |
| 5 or more Children | 0 (0.0%) | 0 (0.0%) |
| Total | 3 (3.5%) | 15 (38.5%) |
Race in Caneyville
The most populous races in Caneyville are White / Caucasian (606 | 91.1%), Two or more Races (58 | 8.7%), and Hispanic or Latino (3 | 0.4%).
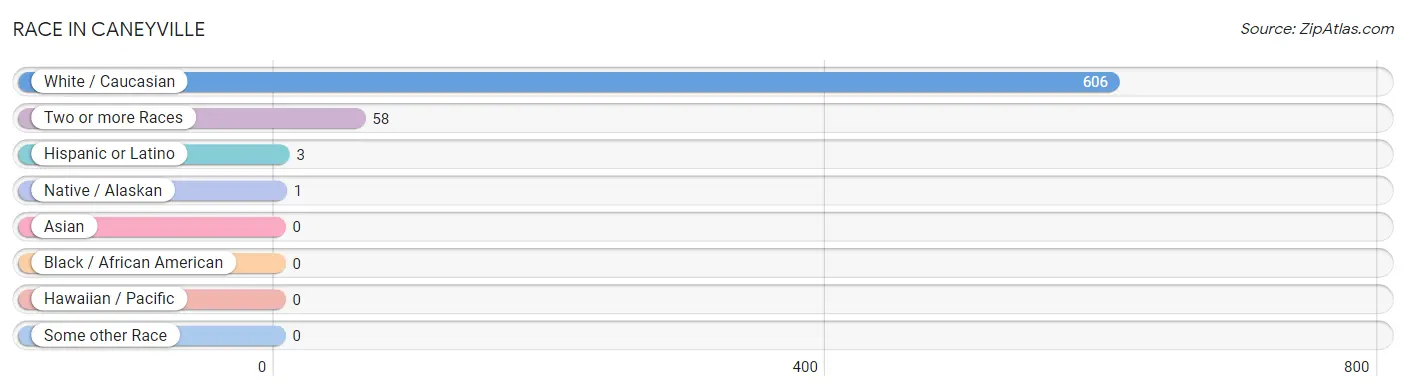
| Race | # Population | % Population |
| Asian | 0 | 0.0% |
| Black / African American | 0 | 0.0% |
| Hawaiian / Pacific | 0 | 0.0% |
| Hispanic or Latino | 3 | 0.4% |
| Native / Alaskan | 1 | 0.2% |
| White / Caucasian | 606 | 91.1% |
| Two or more Races | 58 | 8.7% |
| Some other Race | 0 | 0.0% |
| Total | 665 | 100.0% |
Ancestry in Caneyville
The most populous ancestries reported in Caneyville are American (76 | 11.4%), English (71 | 10.7%), Irish (63 | 9.5%), German (60 | 9.0%), and British (45 | 6.8%), together accounting for 47.4% of all Caneyville residents.
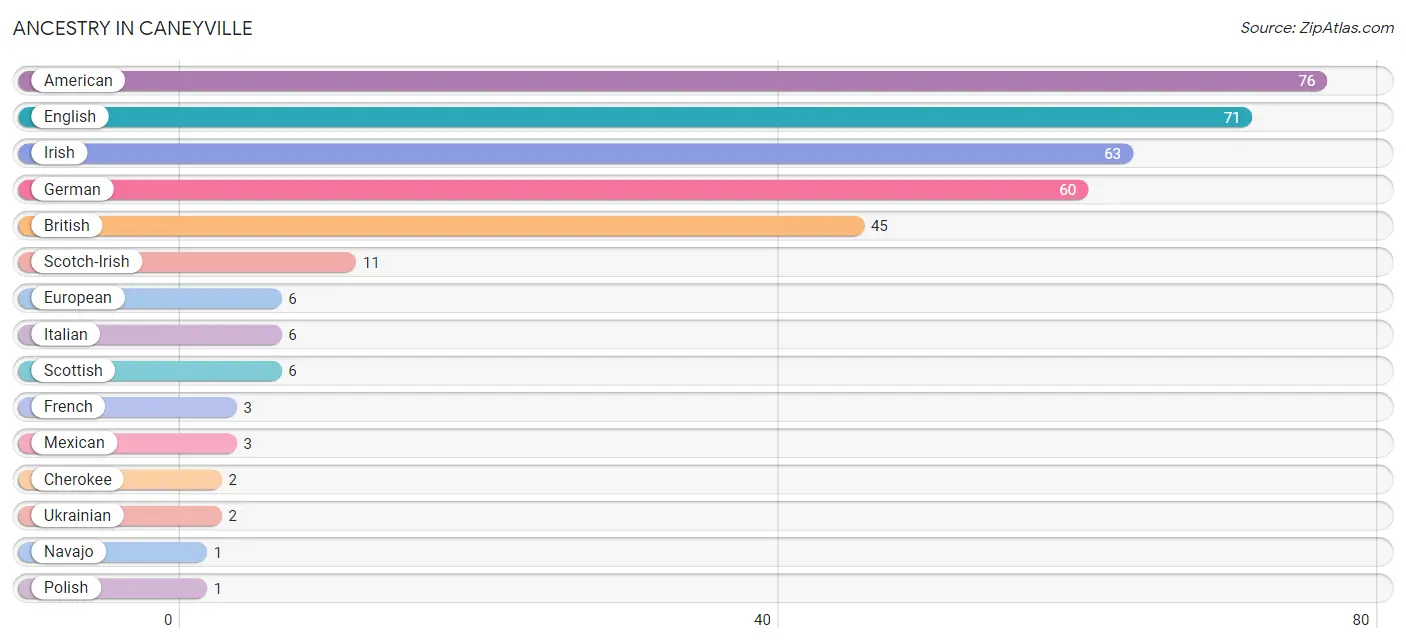
| Ancestry | # Population | % Population |
| American | 76 | 11.4% |
| British | 45 | 6.8% |
| Cherokee | 2 | 0.3% |
| English | 71 | 10.7% |
| European | 6 | 0.9% |
| French | 3 | 0.4% |
| German | 60 | 9.0% |
| Irish | 63 | 9.5% |
| Italian | 6 | 0.9% |
| Mexican | 3 | 0.4% |
| Navajo | 1 | 0.2% |
| Polish | 1 | 0.2% |
| Scotch-Irish | 11 | 1.7% |
| Scottish | 6 | 0.9% |
| Ukrainian | 2 | 0.3% | View All 15 Rows |
Immigrants in Caneyville

| Immigration Origin | # Population | % Population | View All 0 Rows |
Sex and Age in Caneyville
Sex and Age in Caneyville
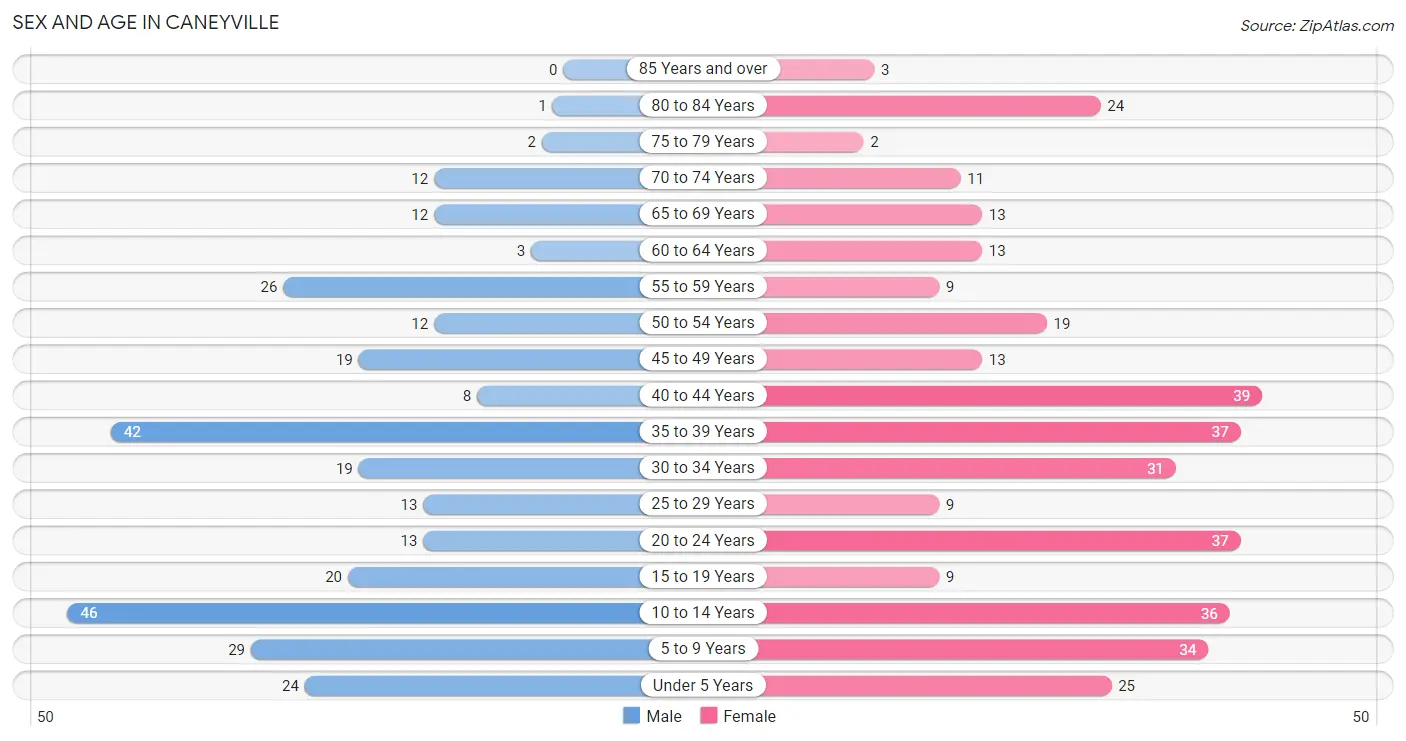
The most populous age groups in Caneyville are 10 to 14 Years (46 | 15.3%) for men and 40 to 44 Years (39 | 10.7%) for women.
| Age Bracket | Male | Female |
| Under 5 Years | 24 (8.0%) | 25 (6.9%) |
| 5 to 9 Years | 29 (9.6%) | 34 (9.3%) |
| 10 to 14 Years | 46 (15.3%) | 36 (9.9%) |
| 15 to 19 Years | 20 (6.6%) | 9 (2.5%) |
| 20 to 24 Years | 13 (4.3%) | 37 (10.2%) |
| 25 to 29 Years | 13 (4.3%) | 9 (2.5%) |
| 30 to 34 Years | 19 (6.3%) | 31 (8.5%) |
| 35 to 39 Years | 42 (14.0%) | 37 (10.2%) |
| 40 to 44 Years | 8 (2.7%) | 39 (10.7%) |
| 45 to 49 Years | 19 (6.3%) | 13 (3.6%) |
| 50 to 54 Years | 12 (4.0%) | 19 (5.2%) |
| 55 to 59 Years | 26 (8.6%) | 9 (2.5%) |
| 60 to 64 Years | 3 (1.0%) | 13 (3.6%) |
| 65 to 69 Years | 12 (4.0%) | 13 (3.6%) |
| 70 to 74 Years | 12 (4.0%) | 11 (3.0%) |
| 75 to 79 Years | 2 (0.7%) | 2 (0.5%) |
| 80 to 84 Years | 1 (0.3%) | 24 (6.6%) |
| 85 Years and over | 0 (0.0%) | 3 (0.8%) |
| Total | 301 (100.0%) | 364 (100.0%) |
Families and Households in Caneyville
Median Family Size in Caneyville
The median family size in Caneyville is 4.36 persons per family, with single male/father families (15 | 12.0%) accounting for the largest median family size of 5.4 persons per family. On the other hand, single female/mother families (24 | 19.2%) represent the smallest median family size with 1.83 persons per family.
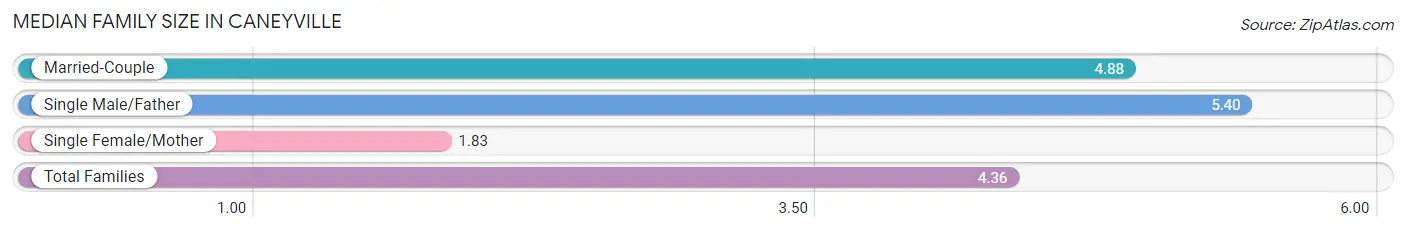
| Family Type | # Families | Family Size |
| Married-Couple | 86 (68.8%) | 4.88 |
| Single Male/Father | 15 (12.0%) | 5.40 |
| Single Female/Mother | 24 (19.2%) | 1.83 |
| Total Families | 125 (100.0%) | 4.36 |
Median Household Size in Caneyville
The median household size in Caneyville is 2.83 persons per household, with single male/father households (15 | 6.4%) accounting for the largest median household size of 5.4 persons per household. non-family households (110 | 46.8%) represent the smallest median household size with 1.02 persons per household.
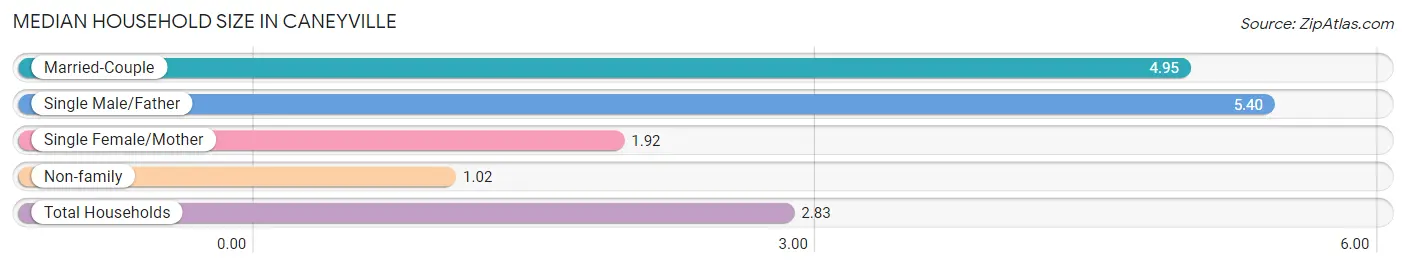
| Household Type | # Households | Household Size |
| Married-Couple | 86 (36.6%) | 4.95 |
| Single Male/Father | 15 (6.4%) | 5.40 |
| Single Female/Mother | 24 (10.2%) | 1.92 |
| Non-family | 110 (46.8%) | 1.02 |
| Total Households | 235 (100.0%) | 2.83 |
Household Size by Marriage Status in Caneyville
Out of a total of 235 households in Caneyville, 125 (53.2%) are family households, while 110 (46.8%) are nonfamily households. The most numerous type of family households are 2-person households, comprising 52, and the most common type of nonfamily households are 1-person households, comprising 107.
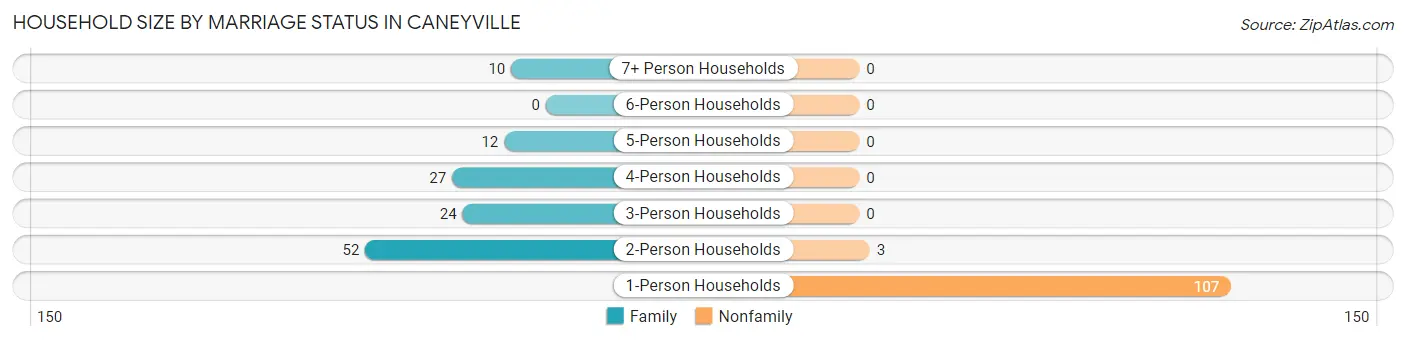
| Household Size | Family Households | Nonfamily Households |
| 1-Person Households | - | 107 (45.5%) |
| 2-Person Households | 52 (22.1%) | 3 (1.3%) |
| 3-Person Households | 24 (10.2%) | 0 (0.0%) |
| 4-Person Households | 27 (11.5%) | 0 (0.0%) |
| 5-Person Households | 12 (5.1%) | 0 (0.0%) |
| 6-Person Households | 0 (0.0%) | 0 (0.0%) |
| 7+ Person Households | 10 (4.3%) | 0 (0.0%) |
| Total | 125 (53.2%) | 110 (46.8%) |
Female Fertility in Caneyville
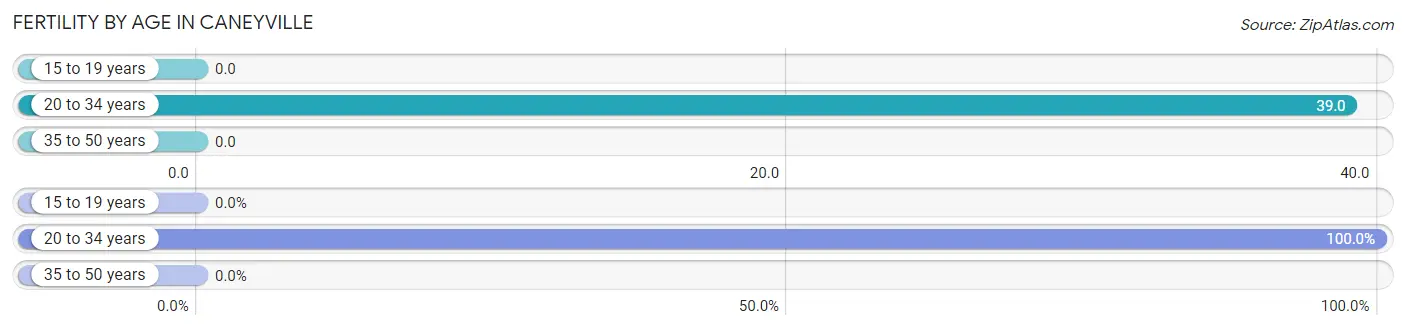
Fertility by Age in Caneyville
Average fertility rate in Caneyville is 16.0 births per 1,000 women. Women in the age bracket of 20 to 34 years have the highest fertility rate with 39.0 births per 1,000 women. Women in the age bracket of 20 to 34 years acount for 100.0% of all women with births.
| Age Bracket | Women with Births | Births / 1,000 Women |
| 15 to 19 years | 0 (0.0%) | 0.0 |
| 20 to 34 years | 3 (100.0%) | 39.0 |
| 35 to 50 years | 0 (0.0%) | 0.0 |
| Total | 3 (100.0%) | 16.0 |
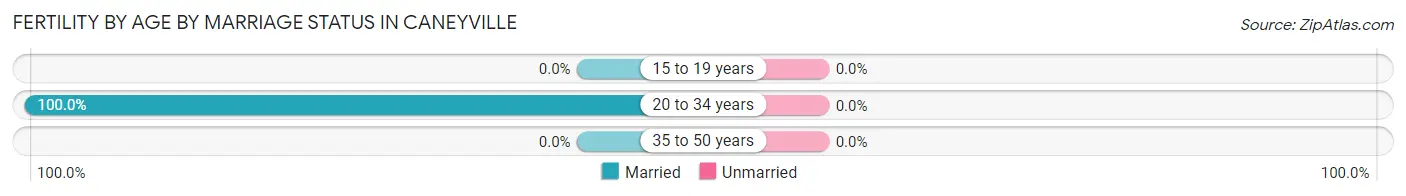
Fertility by Age by Marriage Status in Caneyville
| Age Bracket | Married | Unmarried |
| 15 to 19 years | 0 (0.0%) | 0 (0.0%) |
| 20 to 34 years | 3 (100.0%) | 0 (0.0%) |
| 35 to 50 years | 0 (0.0%) | 0 (0.0%) |
| Total | 3 (100.0%) | 0 (0.0%) |
Fertility by Education in Caneyville
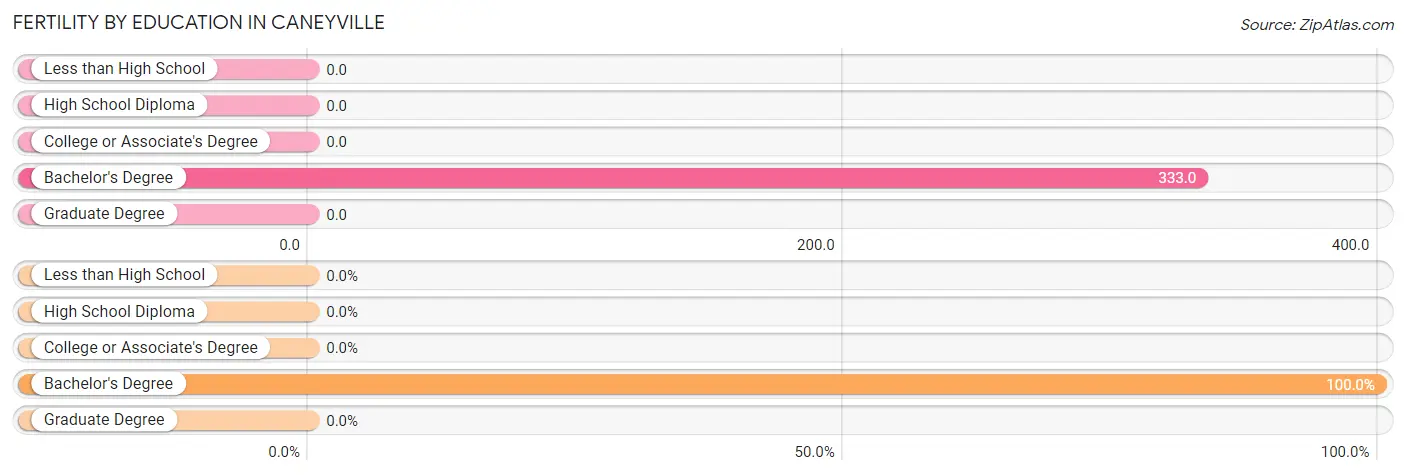
| Educational Attainment | Women with Births | Births / 1,000 Women |
| Less than High School | 0 (0.0%) | 0.0 |
| High School Diploma | 0 (0.0%) | 0.0 |
| College or Associate's Degree | 0 (0.0%) | 0.0 |
| Bachelor's Degree | 3 (100.0%) | 333.0 |
| Graduate Degree | 0 (0.0%) | 0.0 |
| Total | 3 (100.0%) | 16.0 |
Fertility by Education by Marriage Status in Caneyville
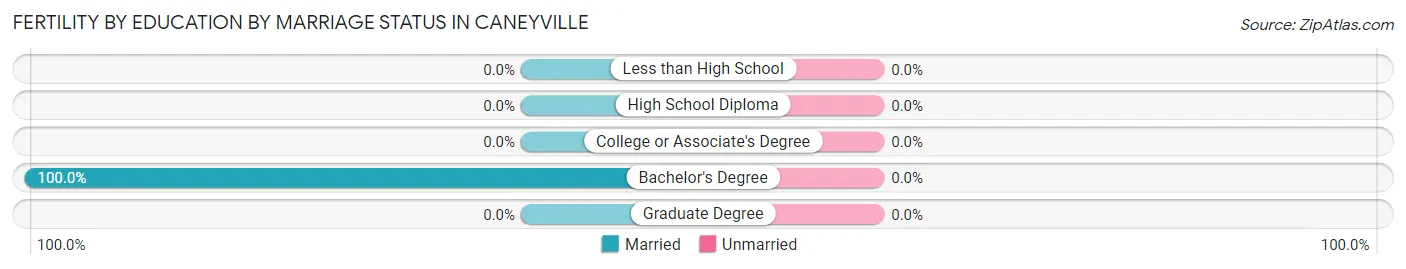
| Educational Attainment | Married | Unmarried |
| Less than High School | 0 (0.0%) | 0 (0.0%) |
| High School Diploma | 0 (0.0%) | 0 (0.0%) |
| College or Associate's Degree | 0 (0.0%) | 0 (0.0%) |
| Bachelor's Degree | 3 (100.0%) | 0 (0.0%) |
| Graduate Degree | 0 (0.0%) | 0 (0.0%) |
| Total | 3 (100.0%) | 0 (0.0%) |
Employment Characteristics in Caneyville
Employment by Class of Employer in Caneyville
Among the 273 employed individuals in Caneyville, private company employees (174 | 63.7%), local government employees (29 | 10.6%), and self-employed (not incorporated) (26 | 9.5%) make up the most common classes of employment.
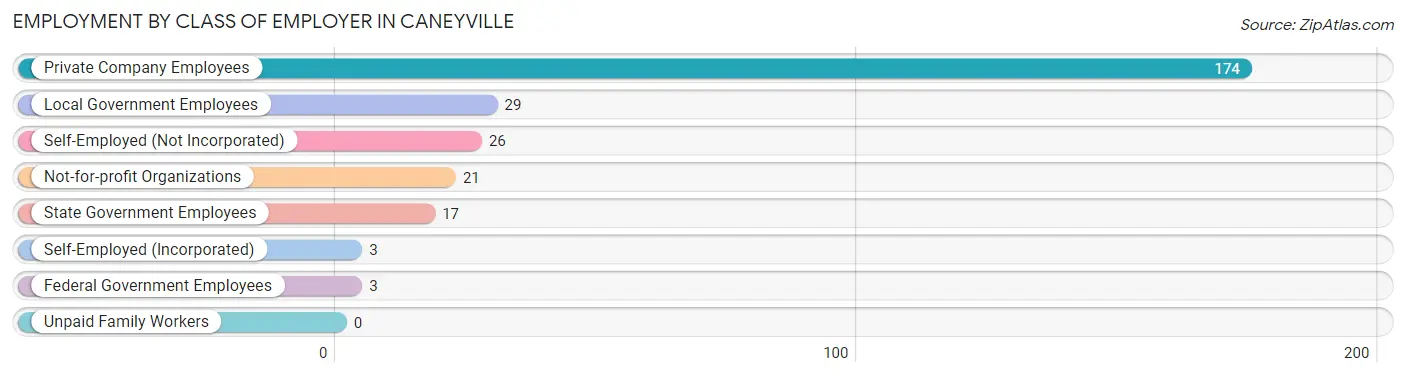
| Employer Class | # Employees | % Employees |
| Private Company Employees | 174 | 63.7% |
| Self-Employed (Incorporated) | 3 | 1.1% |
| Self-Employed (Not Incorporated) | 26 | 9.5% |
| Not-for-profit Organizations | 21 | 7.7% |
| Local Government Employees | 29 | 10.6% |
| State Government Employees | 17 | 6.2% |
| Federal Government Employees | 3 | 1.1% |
| Unpaid Family Workers | 0 | 0.0% |
| Total | 273 | 100.0% |
Employment Status by Age in Caneyville
According to the labor force statistics for Caneyville, out of the total population over 16 years of age (460), 62.0% or 285 individuals are in the labor force, with 0.4% or 1 of them unemployed. The age group with the highest labor force participation rate is 25 to 29 years, with 100.0% or 22 individuals in the labor force. Within the labor force, the 16 to 19 years age range has the highest percentage of unemployed individuals, with 8.3% or 1 of them being unemployed.
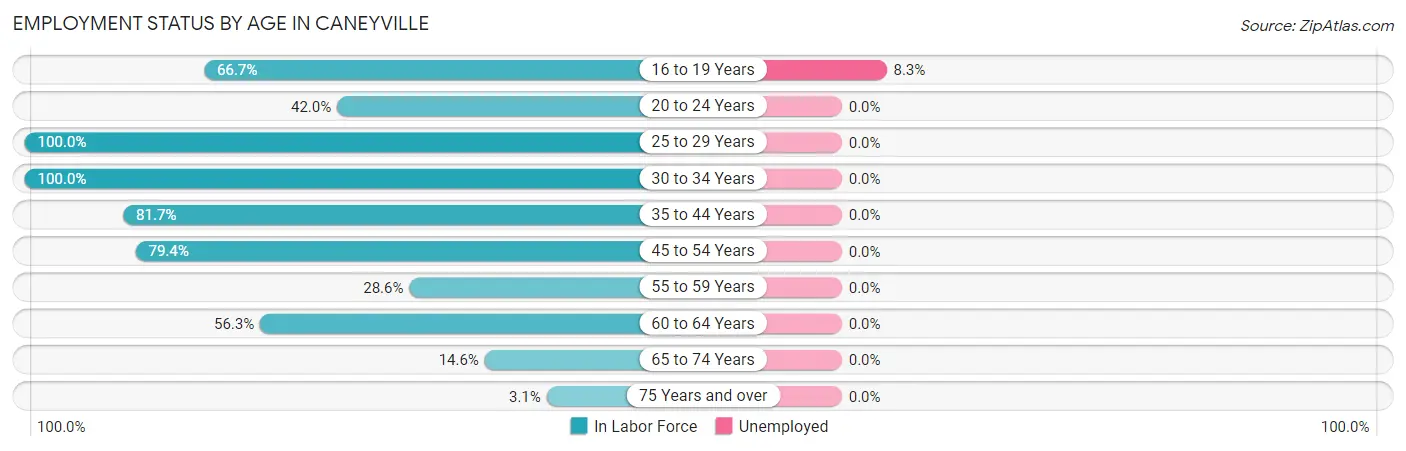
| Age Bracket | In Labor Force | Unemployed |
| 16 to 19 Years | 12 (66.7%) | 1 (8.3%) |
| 20 to 24 Years | 21 (42.0%) | 0 (0.0%) |
| 25 to 29 Years | 22 (100.0%) | 0 (0.0%) |
| 30 to 34 Years | 50 (100.0%) | 0 (0.0%) |
| 35 to 44 Years | 103 (81.7%) | 0 (0.0%) |
| 45 to 54 Years | 50 (79.4%) | 0 (0.0%) |
| 55 to 59 Years | 10 (28.6%) | 0 (0.0%) |
| 60 to 64 Years | 9 (56.3%) | 0 (0.0%) |
| 65 to 74 Years | 7 (14.6%) | 0 (0.0%) |
| 75 Years and over | 1 (3.1%) | 0 (0.0%) |
| Total | 285 (62.0%) | 1 (0.4%) |
Employment Status by Educational Attainment in Caneyville
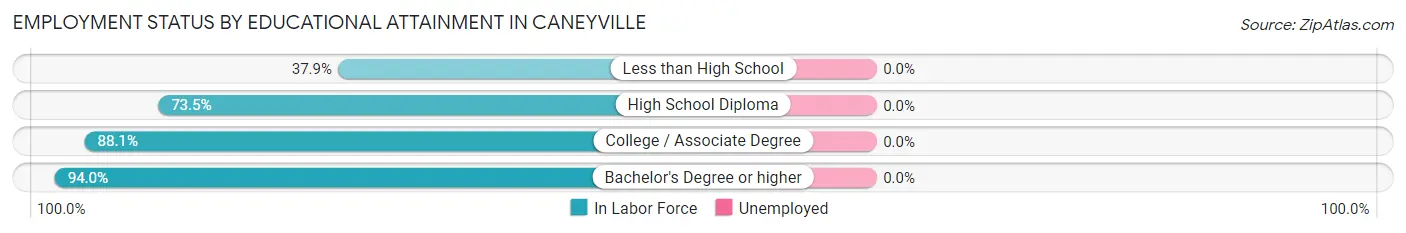
| Educational Attainment | In Labor Force | Unemployed |
| Less than High School | 11 (37.9%) | 0 (0.0%) |
| High School Diploma | 97 (73.5%) | 0 (0.0%) |
| College / Associate Degree | 89 (88.1%) | 0 (0.0%) |
| Bachelor's Degree or higher | 47 (94.0%) | 0 (0.0%) |
| Total | 244 (78.2%) | 0 (0.0%) |
Employment Occupations by Sex in Caneyville
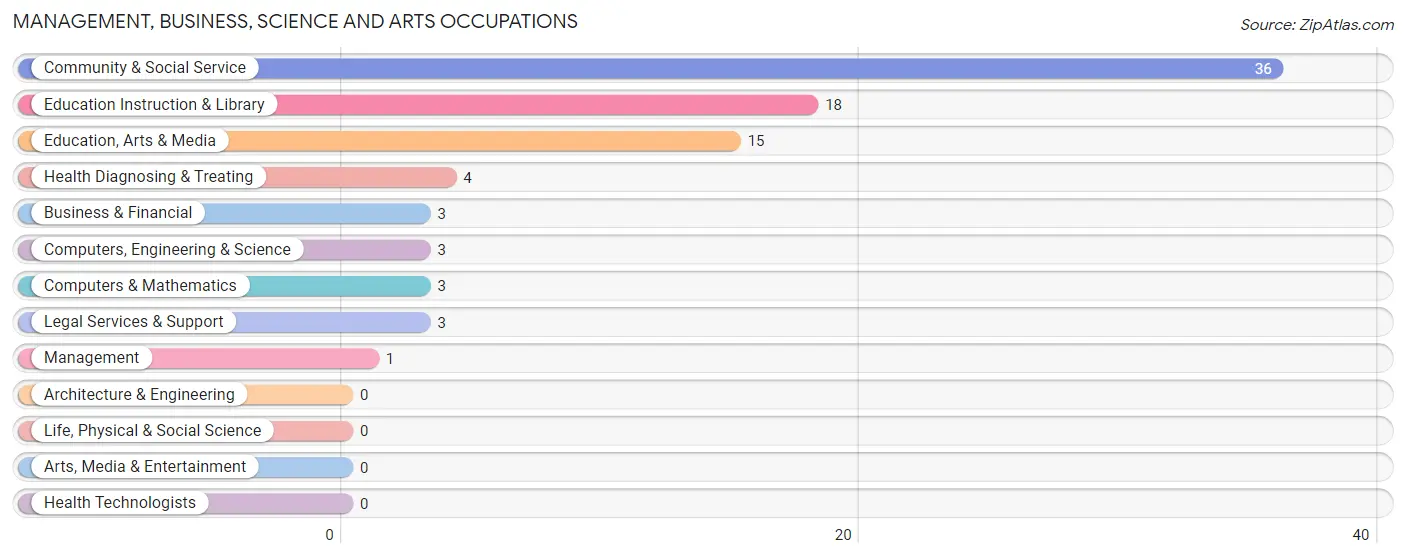
Management, Business, Science and Arts Occupations
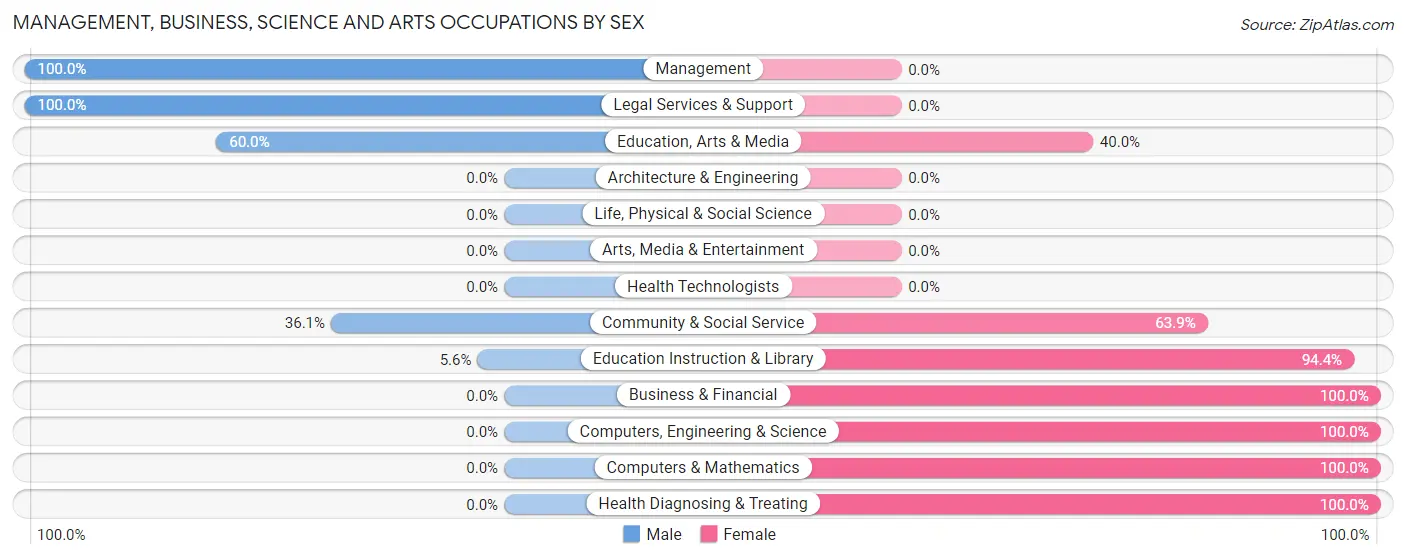
The most common Management, Business, Science and Arts occupations in Caneyville are Community & Social Service (36 | 12.7%), Education Instruction & Library (18 | 6.3%), Education, Arts & Media (15 | 5.3%), Health Diagnosing & Treating (4 | 1.4%), and Business & Financial (3 | 1.1%).
Management, Business, Science and Arts Occupations by Sex
Within the Management, Business, Science and Arts occupations in Caneyville, the most male-oriented occupations are Management (100.0%), Legal Services & Support (100.0%), and Education, Arts & Media (60.0%), while the most female-oriented occupations are Business & Financial (100.0%), Computers, Engineering & Science (100.0%), and Computers & Mathematics (100.0%).
| Occupation | Male | Female |
| Management | 1 (100.0%) | 0 (0.0%) |
| Business & Financial | 0 (0.0%) | 3 (100.0%) |
| Computers, Engineering & Science | 0 (0.0%) | 3 (100.0%) |
| Computers & Mathematics | 0 (0.0%) | 3 (100.0%) |
| Architecture & Engineering | 0 (0.0%) | 0 (0.0%) |
| Life, Physical & Social Science | 0 (0.0%) | 0 (0.0%) |
| Community & Social Service | 13 (36.1%) | 23 (63.9%) |
| Education, Arts & Media | 9 (60.0%) | 6 (40.0%) |
| Legal Services & Support | 3 (100.0%) | 0 (0.0%) |
| Education Instruction & Library | 1 (5.6%) | 17 (94.4%) |
| Arts, Media & Entertainment | 0 (0.0%) | 0 (0.0%) |
| Health Diagnosing & Treating | 0 (0.0%) | 4 (100.0%) |
| Health Technologists | 0 (0.0%) | 0 (0.0%) |
| Total (Category) | 14 (29.8%) | 33 (70.2%) |
| Total (Overall) | 127 (44.7%) | 157 (55.3%) |
Services Occupations
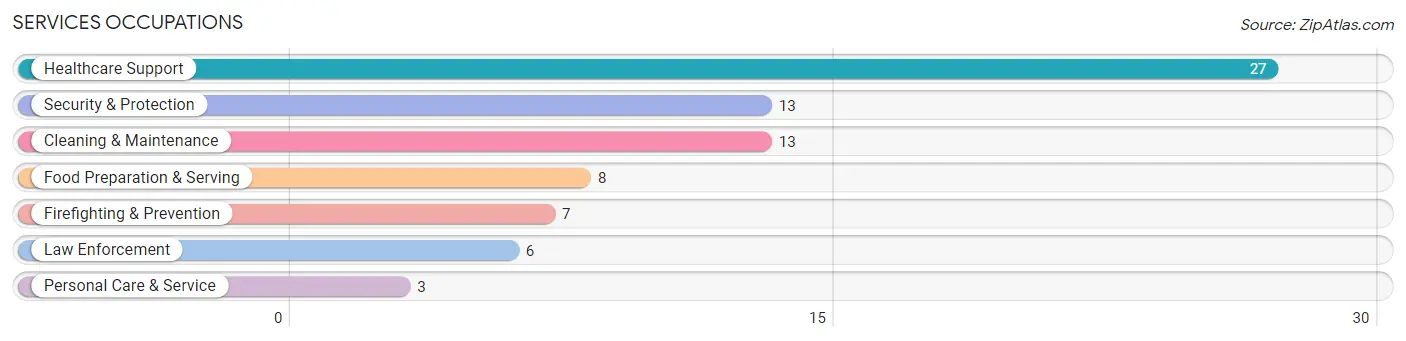
The most common Services occupations in Caneyville are Healthcare Support (27 | 9.5%), Security & Protection (13 | 4.6%), Cleaning & Maintenance (13 | 4.6%), Food Preparation & Serving (8 | 2.8%), and Firefighting & Prevention (7 | 2.5%).
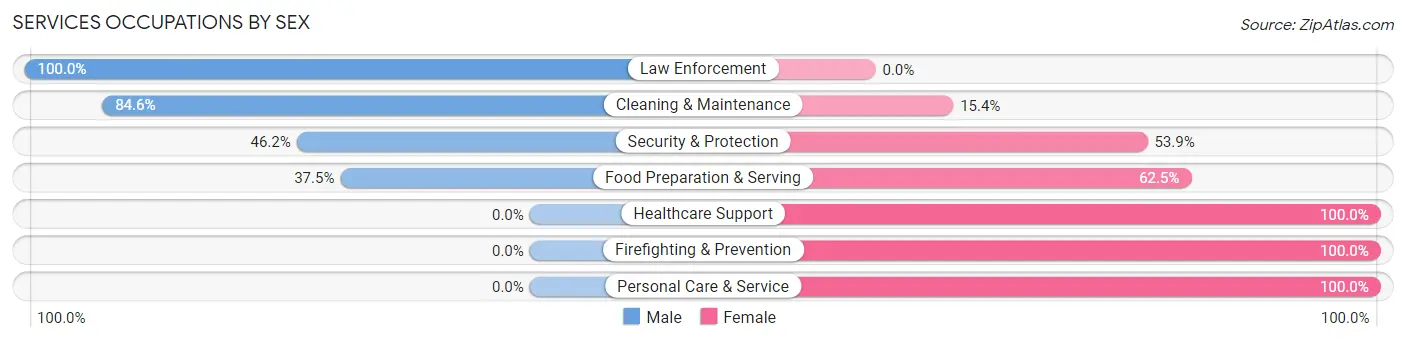
Services Occupations by Sex
Within the Services occupations in Caneyville, the most male-oriented occupations are Law Enforcement (100.0%), Cleaning & Maintenance (84.6%), and Security & Protection (46.2%), while the most female-oriented occupations are Healthcare Support (100.0%), Firefighting & Prevention (100.0%), and Personal Care & Service (100.0%).
| Occupation | Male | Female |
| Healthcare Support | 0 (0.0%) | 27 (100.0%) |
| Security & Protection | 6 (46.2%) | 7 (53.8%) |
| Firefighting & Prevention | 0 (0.0%) | 7 (100.0%) |
| Law Enforcement | 6 (100.0%) | 0 (0.0%) |
| Food Preparation & Serving | 3 (37.5%) | 5 (62.5%) |
| Cleaning & Maintenance | 11 (84.6%) | 2 (15.4%) |
| Personal Care & Service | 0 (0.0%) | 3 (100.0%) |
| Total (Category) | 20 (31.2%) | 44 (68.8%) |
| Total (Overall) | 127 (44.7%) | 157 (55.3%) |
Sales and Office Occupations
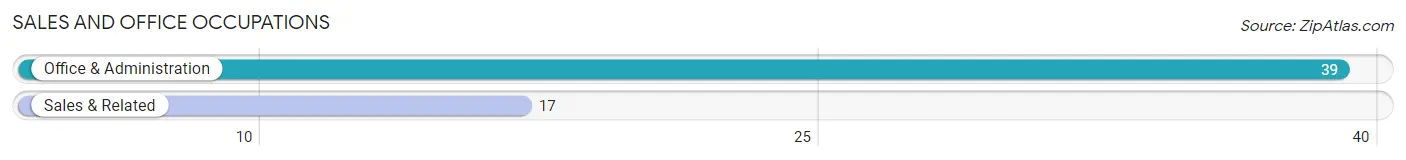
The most common Sales and Office occupations in Caneyville are Office & Administration (39 | 13.7%), and Sales & Related (17 | 6.0%).
Sales and Office Occupations by Sex
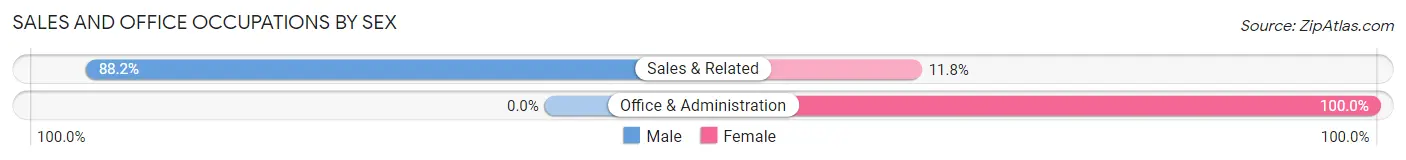
| Occupation | Male | Female |
| Sales & Related | 15 (88.2%) | 2 (11.8%) |
| Office & Administration | 0 (0.0%) | 39 (100.0%) |
| Total (Category) | 15 (26.8%) | 41 (73.2%) |
| Total (Overall) | 127 (44.7%) | 157 (55.3%) |
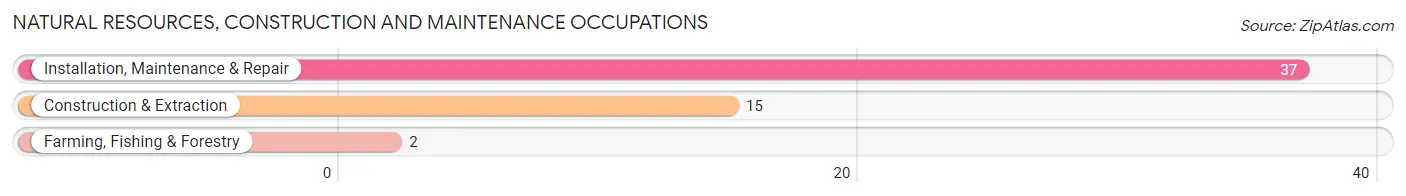
Natural Resources, Construction and Maintenance Occupations
The most common Natural Resources, Construction and Maintenance occupations in Caneyville are Installation, Maintenance & Repair (37 | 13.0%), Construction & Extraction (15 | 5.3%), and Farming, Fishing & Forestry (2 | 0.7%).
Natural Resources, Construction and Maintenance Occupations by Sex
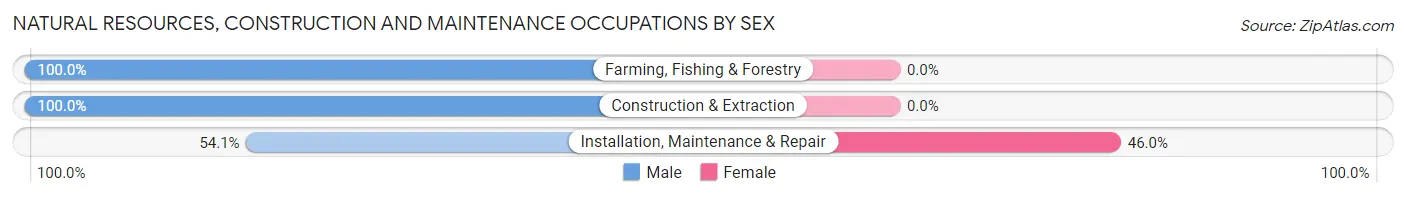
| Occupation | Male | Female |
| Farming, Fishing & Forestry | 2 (100.0%) | 0 (0.0%) |
| Construction & Extraction | 15 (100.0%) | 0 (0.0%) |
| Installation, Maintenance & Repair | 20 (54.0%) | 17 (46.0%) |
| Total (Category) | 37 (68.5%) | 17 (31.5%) |
| Total (Overall) | 127 (44.7%) | 157 (55.3%) |
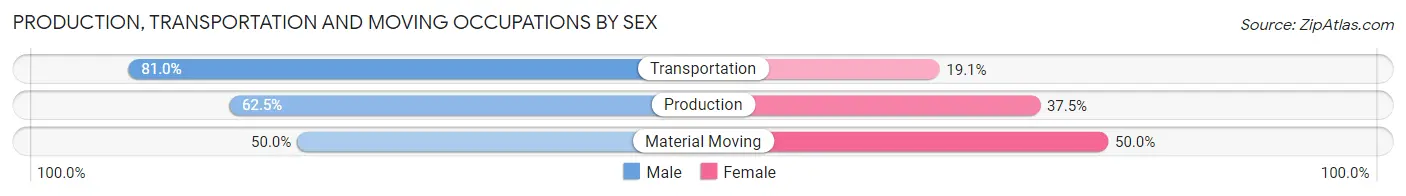
Production, Transportation and Moving Occupations
The most common Production, Transportation and Moving occupations in Caneyville are Production (24 | 8.5%), Transportation (21 | 7.4%), and Material Moving (18 | 6.3%).
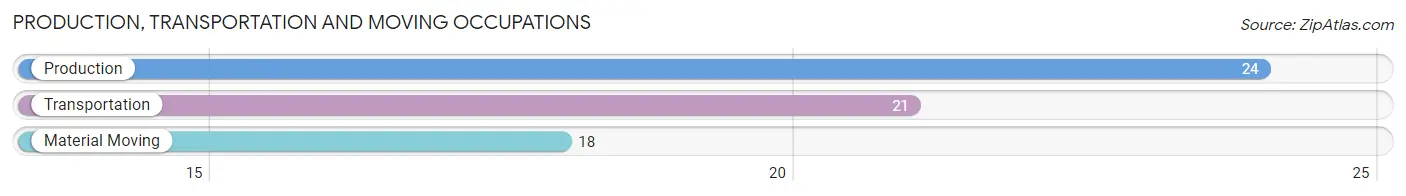
Production, Transportation and Moving Occupations by Sex
| Occupation | Male | Female |
| Production | 15 (62.5%) | 9 (37.5%) |
| Transportation | 17 (80.9%) | 4 (19.1%) |
| Material Moving | 9 (50.0%) | 9 (50.0%) |
| Total (Category) | 41 (65.1%) | 22 (34.9%) |
| Total (Overall) | 127 (44.7%) | 157 (55.3%) |
Employment Industries by Sex in Caneyville
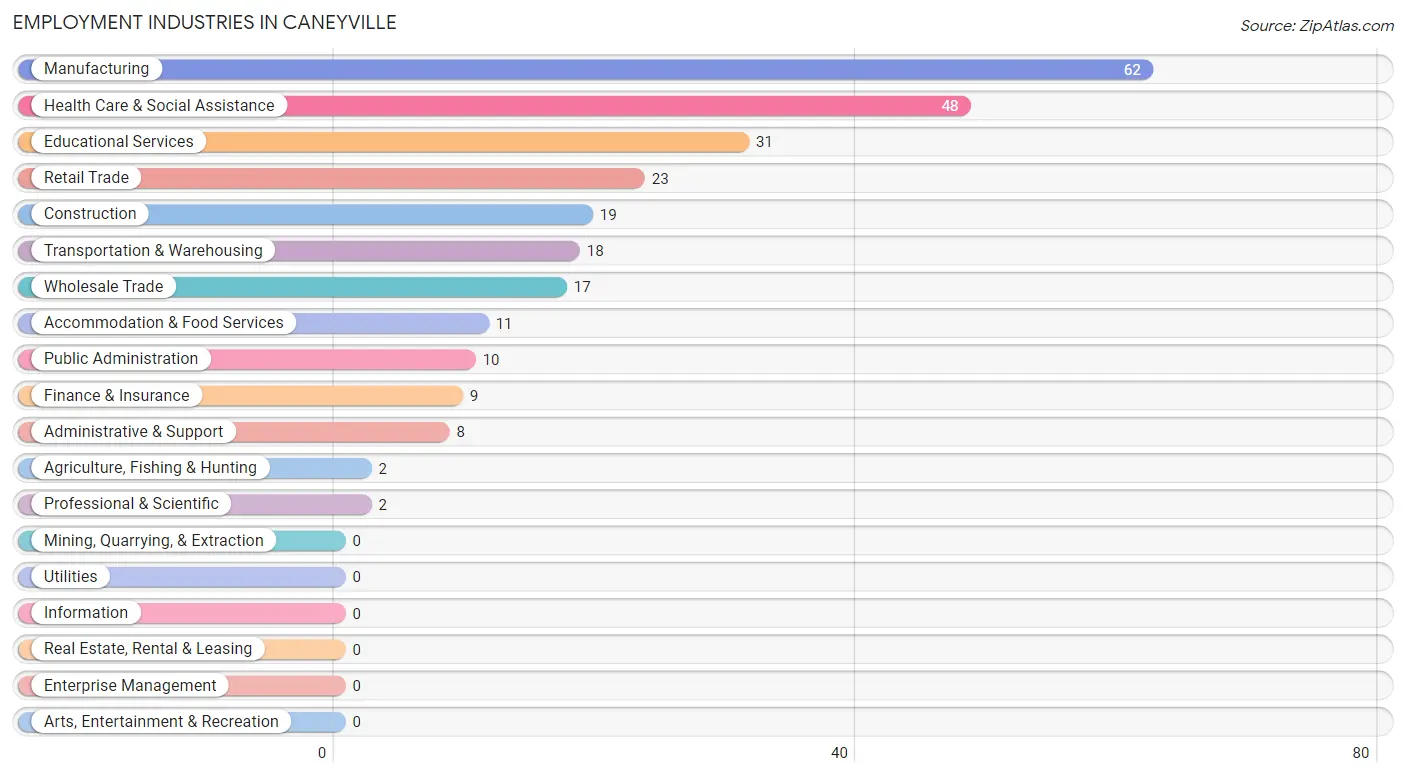
Employment Industries in Caneyville
The major employment industries in Caneyville include Manufacturing (62 | 21.8%), Health Care & Social Assistance (48 | 16.9%), Educational Services (31 | 10.9%), Retail Trade (23 | 8.1%), and Construction (19 | 6.7%).
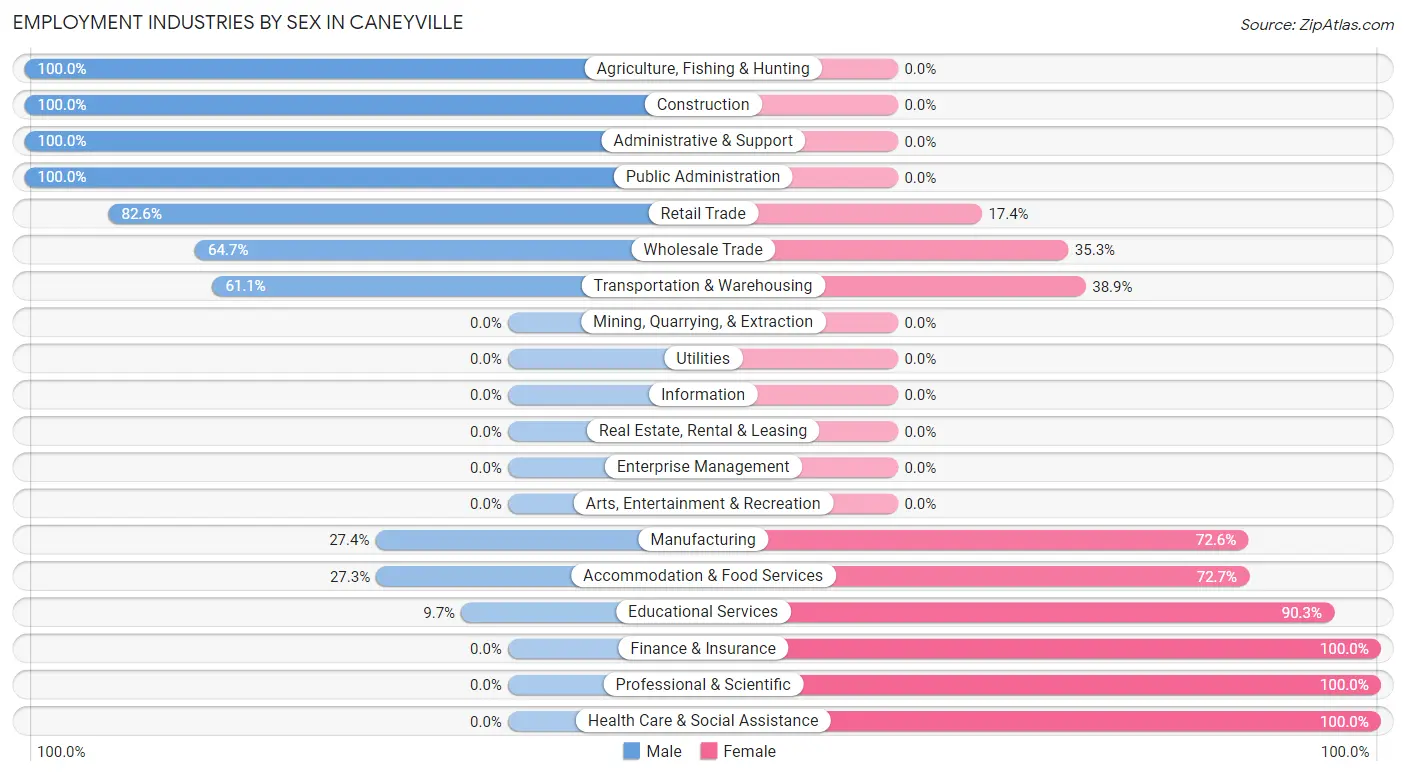
Employment Industries by Sex in Caneyville
The Caneyville industries that see more men than women are Agriculture, Fishing & Hunting (100.0%), Construction (100.0%), and Administrative & Support (100.0%), whereas the industries that tend to have a higher number of women are Finance & Insurance (100.0%), Professional & Scientific (100.0%), and Health Care & Social Assistance (100.0%).
| Industry | Male | Female |
| Agriculture, Fishing & Hunting | 2 (100.0%) | 0 (0.0%) |
| Mining, Quarrying, & Extraction | 0 (0.0%) | 0 (0.0%) |
| Construction | 19 (100.0%) | 0 (0.0%) |
| Manufacturing | 17 (27.4%) | 45 (72.6%) |
| Wholesale Trade | 11 (64.7%) | 6 (35.3%) |
| Retail Trade | 19 (82.6%) | 4 (17.4%) |
| Transportation & Warehousing | 11 (61.1%) | 7 (38.9%) |
| Utilities | 0 (0.0%) | 0 (0.0%) |
| Information | 0 (0.0%) | 0 (0.0%) |
| Finance & Insurance | 0 (0.0%) | 9 (100.0%) |
| Real Estate, Rental & Leasing | 0 (0.0%) | 0 (0.0%) |
| Professional & Scientific | 0 (0.0%) | 2 (100.0%) |
| Enterprise Management | 0 (0.0%) | 0 (0.0%) |
| Administrative & Support | 8 (100.0%) | 0 (0.0%) |
| Educational Services | 3 (9.7%) | 28 (90.3%) |
| Health Care & Social Assistance | 0 (0.0%) | 48 (100.0%) |
| Arts, Entertainment & Recreation | 0 (0.0%) | 0 (0.0%) |
| Accommodation & Food Services | 3 (27.3%) | 8 (72.7%) |
| Public Administration | 10 (100.0%) | 0 (0.0%) |
| Total | 127 (44.7%) | 157 (55.3%) |
Education in Caneyville
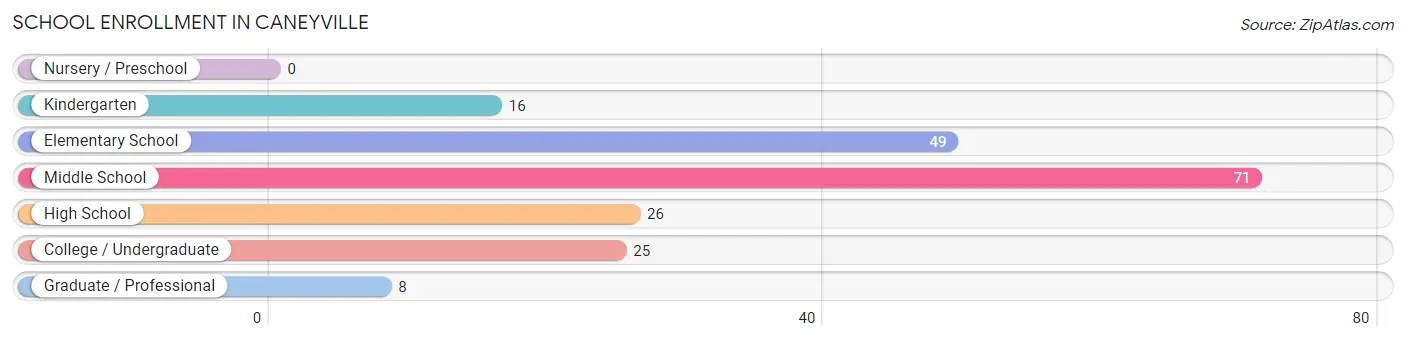
School Enrollment in Caneyville
The most common levels of schooling among the 195 students in Caneyville are middle school (71 | 36.4%), elementary school (49 | 25.1%), and high school (26 | 13.3%).
| School Level | # Students | % Students |
| Nursery / Preschool | 0 | 0.0% |
| Kindergarten | 16 | 8.2% |
| Elementary School | 49 | 25.1% |
| Middle School | 71 | 36.4% |
| High School | 26 | 13.3% |
| College / Undergraduate | 25 | 12.8% |
| Graduate / Professional | 8 | 4.1% |
| Total | 195 | 100.0% |
School Enrollment by Age by Funding Source in Caneyville
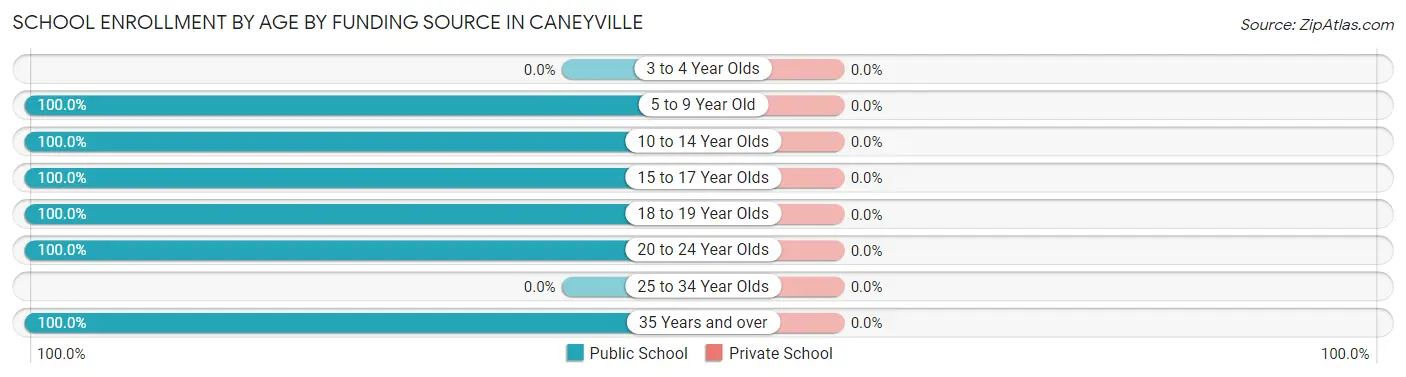
| Age Bracket | Public School | Private School |
| 3 to 4 Year Olds | 0 (0.0%) | 0 (0.0%) |
| 5 to 9 Year Old | 63 (100.0%) | 0 (0.0%) |
| 10 to 14 Year Olds | 82 (100.0%) | 0 (0.0%) |
| 15 to 17 Year Olds | 17 (100.0%) | 0 (0.0%) |
| 18 to 19 Year Olds | 8 (100.0%) | 0 (0.0%) |
| 20 to 24 Year Olds | 17 (100.0%) | 0 (0.0%) |
| 25 to 34 Year Olds | 0 (0.0%) | 0 (0.0%) |
| 35 Years and over | 8 (100.0%) | 0 (0.0%) |
| Total | 195 (100.0%) | 0 (0.0%) |
Educational Attainment by Field of Study in Caneyville
Science & technology (39 | 43.8%), business (15 | 16.9%), liberal arts & history (11 | 12.4%), social sciences (9 | 10.1%), and education (9 | 10.1%) are the most common fields of study among 89 individuals in Caneyville who have obtained a bachelor's degree or higher.
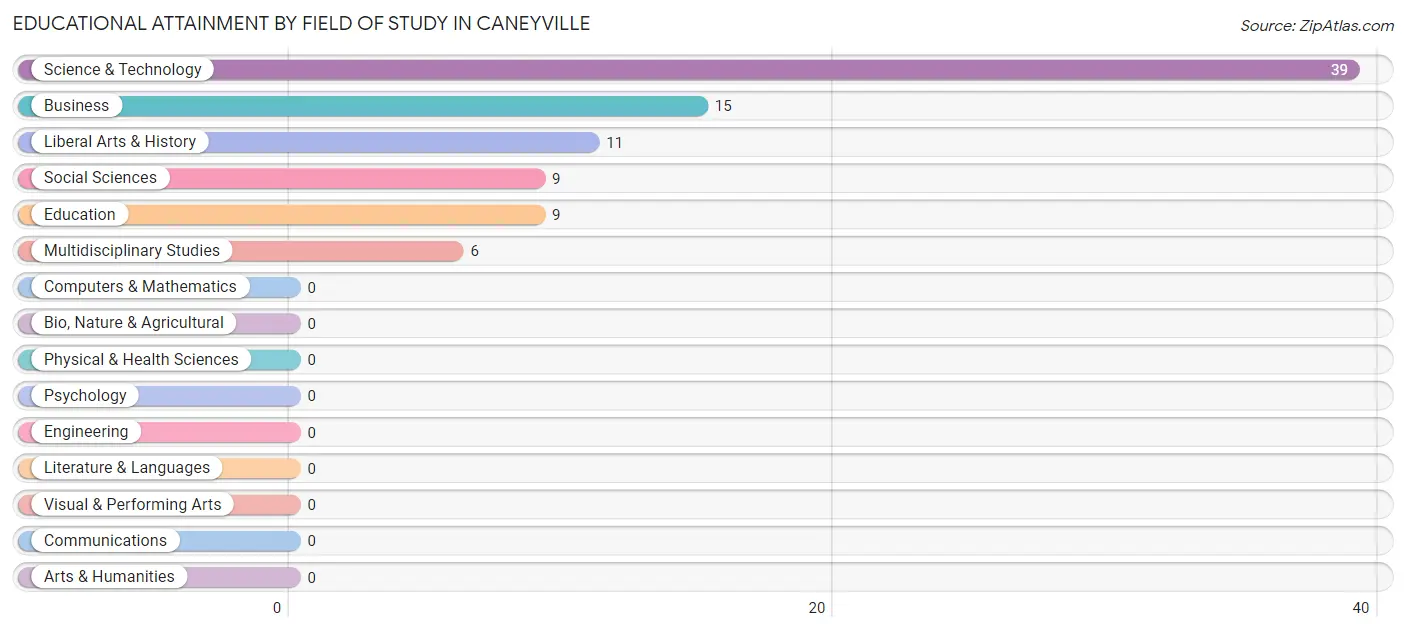
| Field of Study | # Graduates | % Graduates |
| Computers & Mathematics | 0 | 0.0% |
| Bio, Nature & Agricultural | 0 | 0.0% |
| Physical & Health Sciences | 0 | 0.0% |
| Psychology | 0 | 0.0% |
| Social Sciences | 9 | 10.1% |
| Engineering | 0 | 0.0% |
| Multidisciplinary Studies | 6 | 6.7% |
| Science & Technology | 39 | 43.8% |
| Business | 15 | 16.9% |
| Education | 9 | 10.1% |
| Literature & Languages | 0 | 0.0% |
| Liberal Arts & History | 11 | 12.4% |
| Visual & Performing Arts | 0 | 0.0% |
| Communications | 0 | 0.0% |
| Arts & Humanities | 0 | 0.0% |
| Total | 89 | 100.0% |
Transportation & Commute in Caneyville
Vehicle Availability by Sex in Caneyville
The most prevalent vehicle ownership categories in Caneyville are males with 4 vehicles (43, accounting for 33.9%) and females with 4 vehicles (43, making up 29.4%).
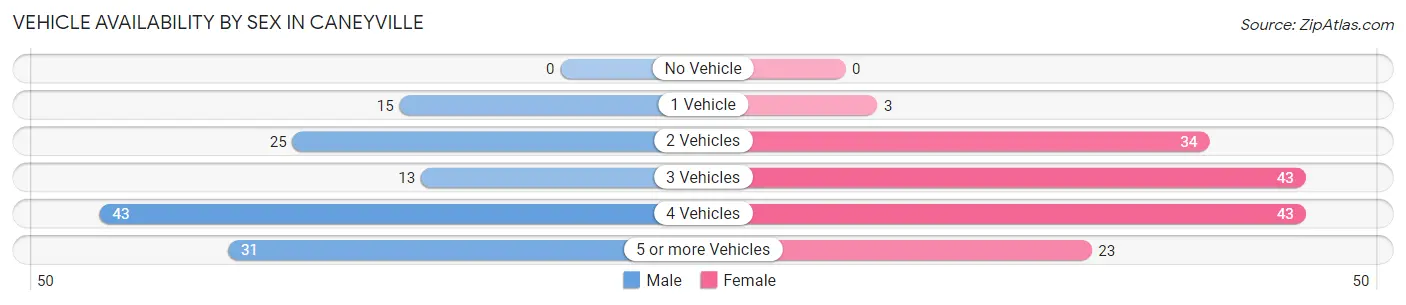
| Vehicles Available | Male | Female |
| No Vehicle | 0 (0.0%) | 0 (0.0%) |
| 1 Vehicle | 15 (11.8%) | 3 (2.1%) |
| 2 Vehicles | 25 (19.7%) | 34 (23.3%) |
| 3 Vehicles | 13 (10.2%) | 43 (29.4%) |
| 4 Vehicles | 43 (33.9%) | 43 (29.4%) |
| 5 or more Vehicles | 31 (24.4%) | 23 (15.8%) |
| Total | 127 (100.0%) | 146 (100.0%) |
Commute Time in Caneyville
The most frequently occuring commute durations in Caneyville are 20 to 24 minutes (72 commuters, 26.4%), 30 to 34 minutes (55 commuters, 20.2%), and 5 to 9 minutes (34 commuters, 12.4%).
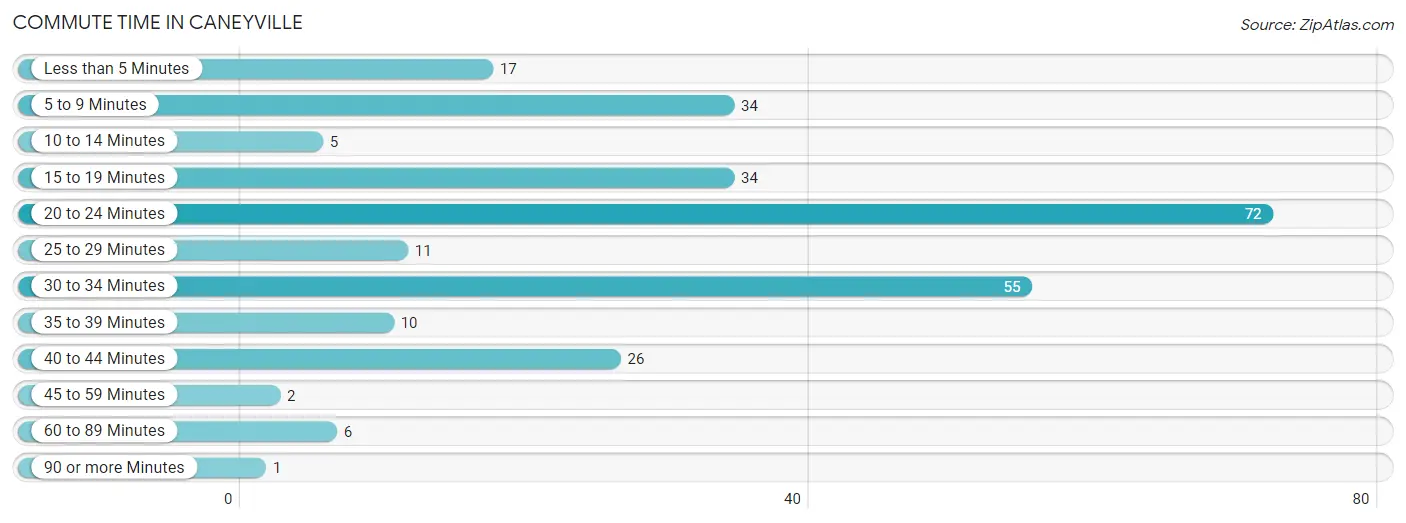
| Commute Time | # Commuters | % Commuters |
| Less than 5 Minutes | 17 | 6.2% |
| 5 to 9 Minutes | 34 | 12.4% |
| 10 to 14 Minutes | 5 | 1.8% |
| 15 to 19 Minutes | 34 | 12.4% |
| 20 to 24 Minutes | 72 | 26.4% |
| 25 to 29 Minutes | 11 | 4.0% |
| 30 to 34 Minutes | 55 | 20.2% |
| 35 to 39 Minutes | 10 | 3.7% |
| 40 to 44 Minutes | 26 | 9.5% |
| 45 to 59 Minutes | 2 | 0.7% |
| 60 to 89 Minutes | 6 | 2.2% |
| 90 or more Minutes | 1 | 0.4% |
Commute Time by Sex in Caneyville
The most common commute times in Caneyville are 30 to 34 minutes (38 commuters, 29.9%) for males and 20 to 24 minutes (61 commuters, 41.8%) for females.
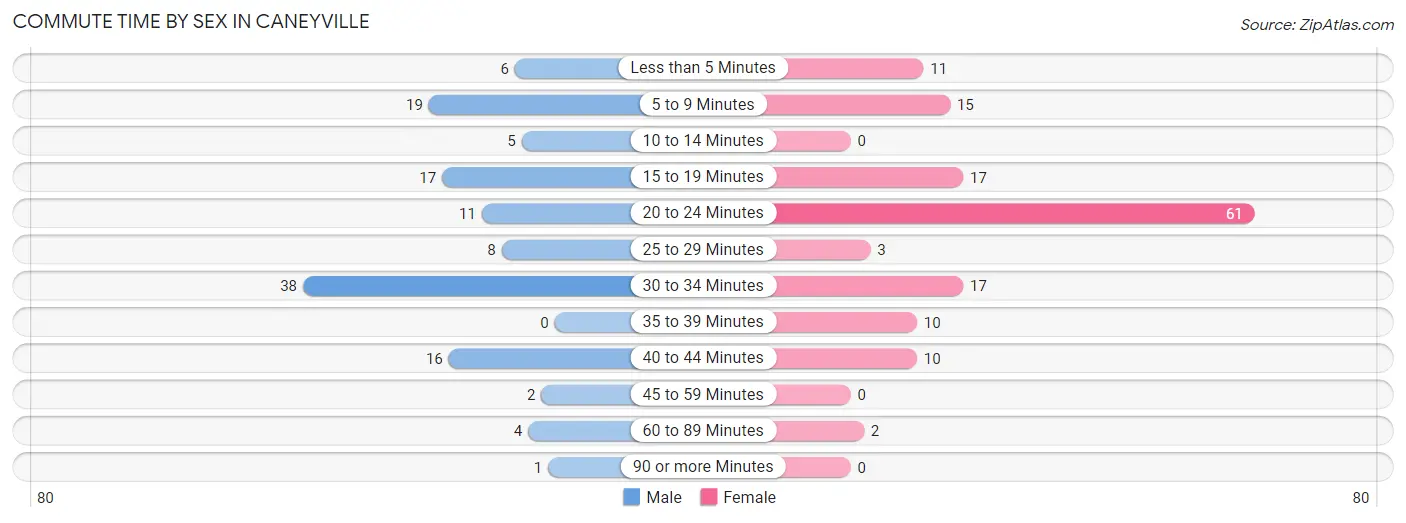
| Commute Time | Male | Female |
| Less than 5 Minutes | 6 (4.7%) | 11 (7.5%) |
| 5 to 9 Minutes | 19 (15.0%) | 15 (10.3%) |
| 10 to 14 Minutes | 5 (3.9%) | 0 (0.0%) |
| 15 to 19 Minutes | 17 (13.4%) | 17 (11.6%) |
| 20 to 24 Minutes | 11 (8.7%) | 61 (41.8%) |
| 25 to 29 Minutes | 8 (6.3%) | 3 (2.1%) |
| 30 to 34 Minutes | 38 (29.9%) | 17 (11.6%) |
| 35 to 39 Minutes | 0 (0.0%) | 10 (6.9%) |
| 40 to 44 Minutes | 16 (12.6%) | 10 (6.9%) |
| 45 to 59 Minutes | 2 (1.6%) | 0 (0.0%) |
| 60 to 89 Minutes | 4 (3.2%) | 2 (1.4%) |
| 90 or more Minutes | 1 (0.8%) | 0 (0.0%) |
Time of Departure to Work by Sex in Caneyville
The most frequent times of departure to work in Caneyville are 12:00 AM to 4:59 AM (31, 24.4%) for males and 6:30 AM to 6:59 AM (37, 25.3%) for females.
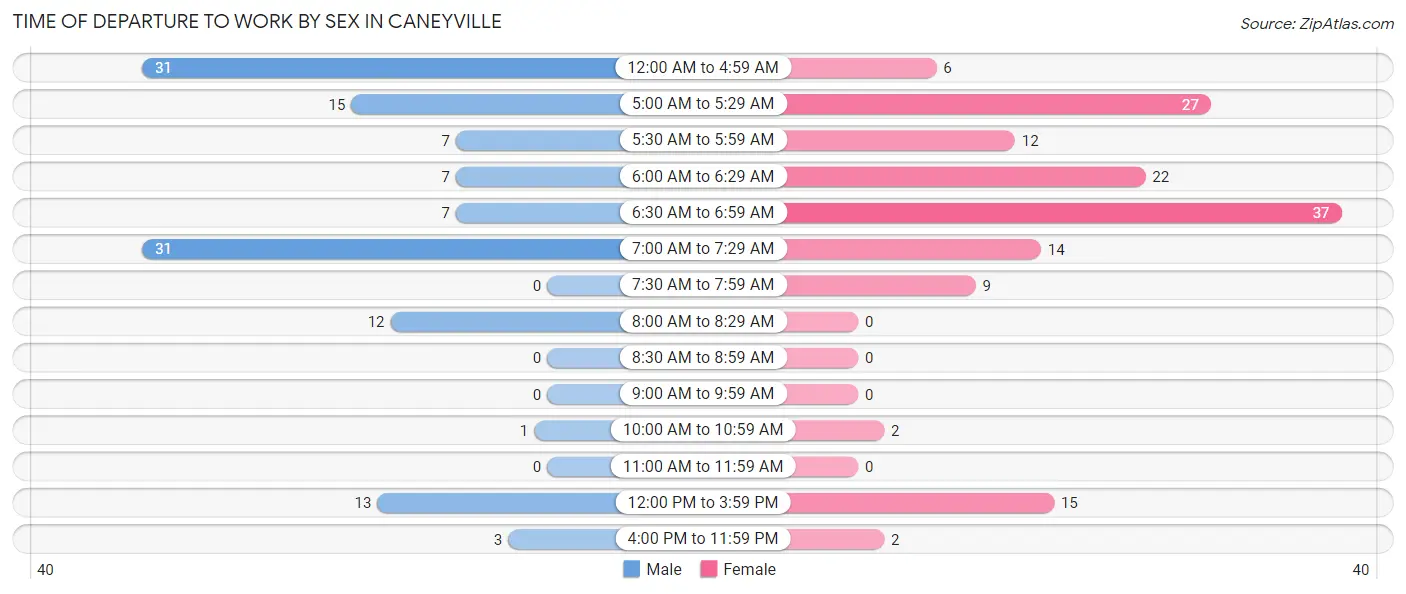
| Time of Departure | Male | Female |
| 12:00 AM to 4:59 AM | 31 (24.4%) | 6 (4.1%) |
| 5:00 AM to 5:29 AM | 15 (11.8%) | 27 (18.5%) |
| 5:30 AM to 5:59 AM | 7 (5.5%) | 12 (8.2%) |
| 6:00 AM to 6:29 AM | 7 (5.5%) | 22 (15.1%) |
| 6:30 AM to 6:59 AM | 7 (5.5%) | 37 (25.3%) |
| 7:00 AM to 7:29 AM | 31 (24.4%) | 14 (9.6%) |
| 7:30 AM to 7:59 AM | 0 (0.0%) | 9 (6.2%) |
| 8:00 AM to 8:29 AM | 12 (9.5%) | 0 (0.0%) |
| 8:30 AM to 8:59 AM | 0 (0.0%) | 0 (0.0%) |
| 9:00 AM to 9:59 AM | 0 (0.0%) | 0 (0.0%) |
| 10:00 AM to 10:59 AM | 1 (0.8%) | 2 (1.4%) |
| 11:00 AM to 11:59 AM | 0 (0.0%) | 0 (0.0%) |
| 12:00 PM to 3:59 PM | 13 (10.2%) | 15 (10.3%) |
| 4:00 PM to 11:59 PM | 3 (2.4%) | 2 (1.4%) |
| Total | 127 (100.0%) | 146 (100.0%) |
Housing Occupancy in Caneyville
Occupancy by Ownership in Caneyville
Of the total 235 dwellings in Caneyville, owner-occupied units account for 144 (61.3%), while renter-occupied units make up 91 (38.7%).
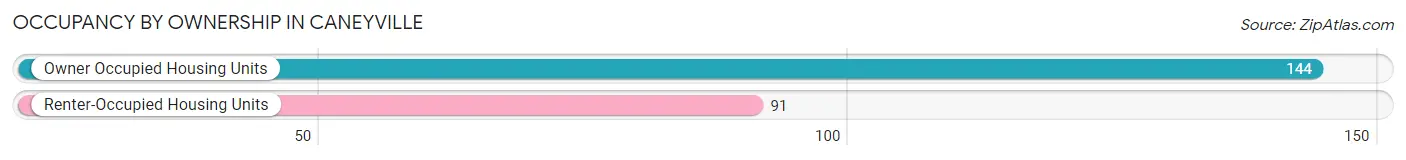
| Occupancy | # Housing Units | % Housing Units |
| Owner Occupied Housing Units | 144 | 61.3% |
| Renter-Occupied Housing Units | 91 | 38.7% |
| Total Occupied Housing Units | 235 | 100.0% |
Occupancy by Household Size in Caneyville
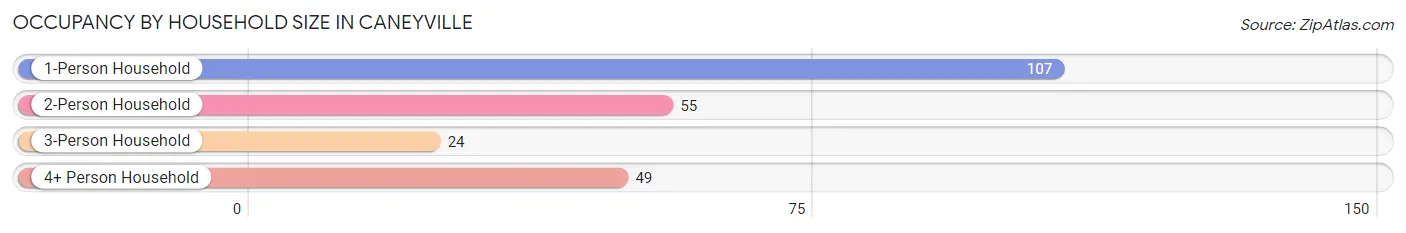
| Household Size | # Housing Units | % Housing Units |
| 1-Person Household | 107 | 45.5% |
| 2-Person Household | 55 | 23.4% |
| 3-Person Household | 24 | 10.2% |
| 4+ Person Household | 49 | 20.8% |
| Total Housing Units | 235 | 100.0% |
Occupancy by Ownership by Household Size in Caneyville
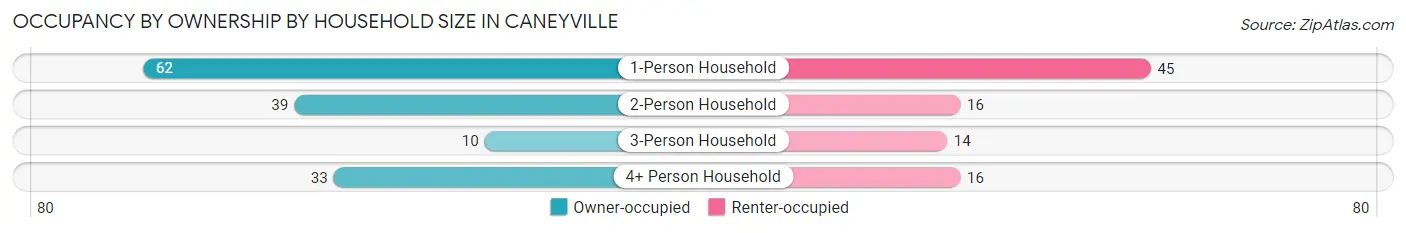
| Household Size | Owner-occupied | Renter-occupied |
| 1-Person Household | 62 (57.9%) | 45 (42.1%) |
| 2-Person Household | 39 (70.9%) | 16 (29.1%) |
| 3-Person Household | 10 (41.7%) | 14 (58.3%) |
| 4+ Person Household | 33 (67.3%) | 16 (32.7%) |
| Total Housing Units | 144 (61.3%) | 91 (38.7%) |
Occupancy by Educational Attainment in Caneyville
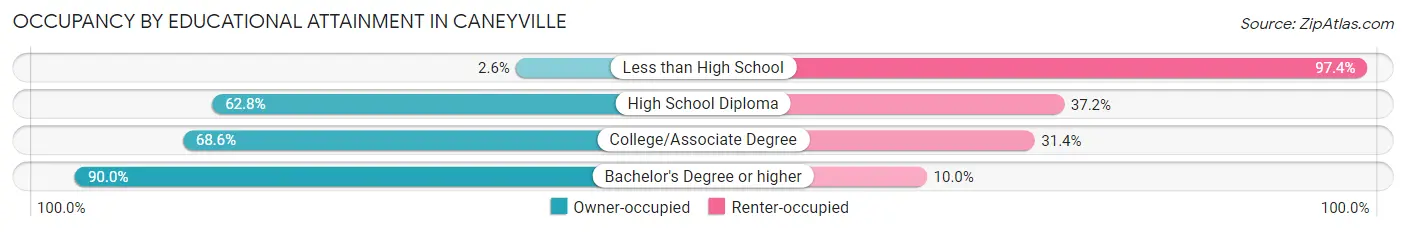
| Household Size | Owner-occupied | Renter-occupied |
| Less than High School | 1 (2.6%) | 37 (97.4%) |
| High School Diploma | 54 (62.8%) | 32 (37.2%) |
| College/Associate Degree | 35 (68.6%) | 16 (31.4%) |
| Bachelor's Degree or higher | 54 (90.0%) | 6 (10.0%) |
Occupancy by Age of Householder in Caneyville
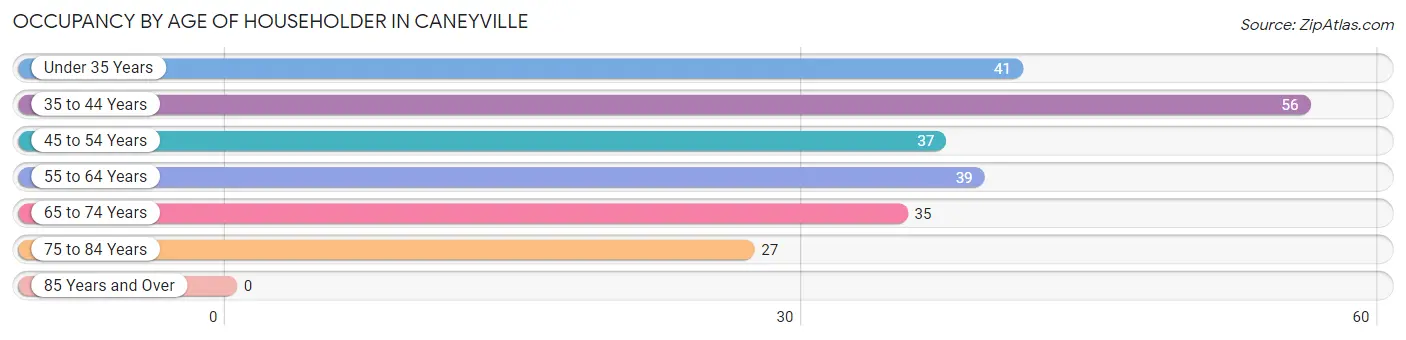
| Age Bracket | # Households | % Households |
| Under 35 Years | 41 | 17.4% |
| 35 to 44 Years | 56 | 23.8% |
| 45 to 54 Years | 37 | 15.7% |
| 55 to 64 Years | 39 | 16.6% |
| 65 to 74 Years | 35 | 14.9% |
| 75 to 84 Years | 27 | 11.5% |
| 85 Years and Over | 0 | 0.0% |
| Total | 235 | 100.0% |
Housing Finances in Caneyville
Median Income by Occupancy in Caneyville
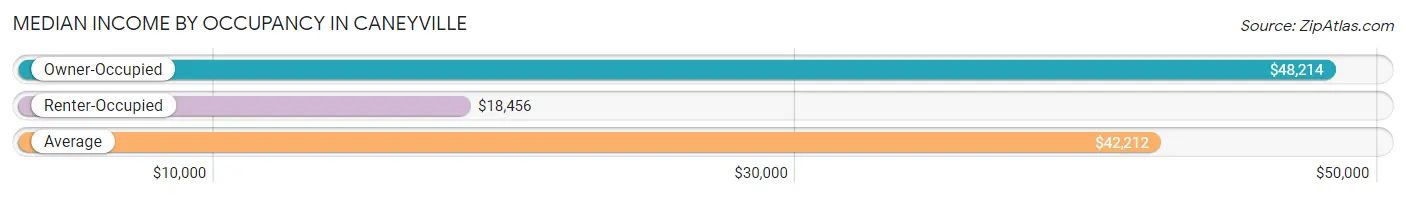
| Occupancy Type | # Households | Median Income |
| Owner-Occupied | 144 (61.3%) | $48,214 |
| Renter-Occupied | 91 (38.7%) | $18,456 |
| Average | 235 (100.0%) | $42,212 |
Occupancy by Householder Income Bracket in Caneyville
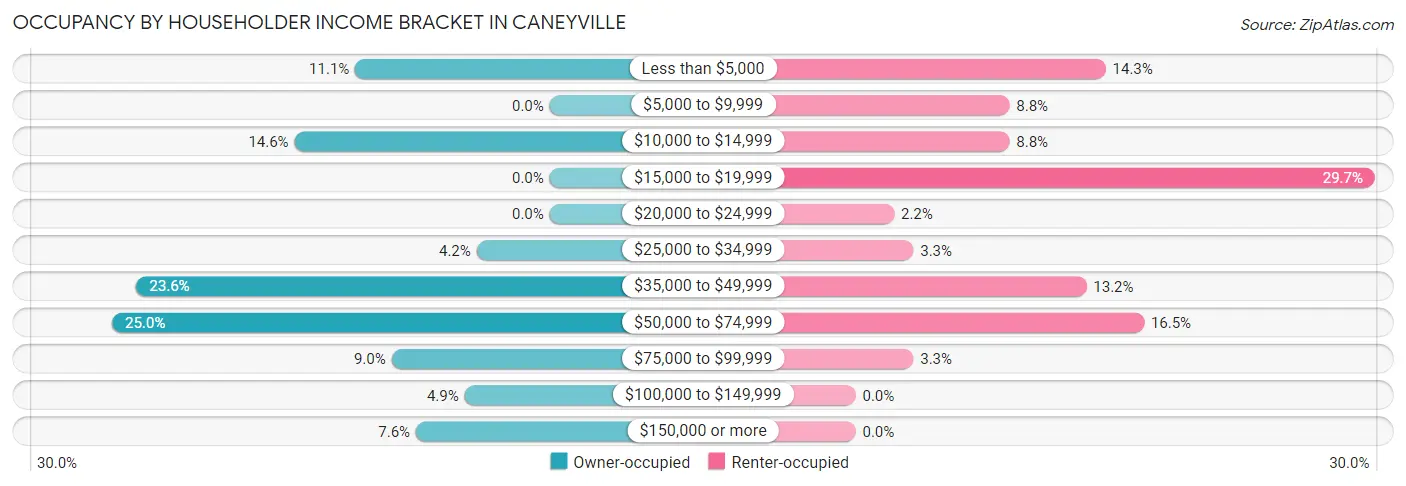
| Income Bracket | Owner-occupied | Renter-occupied |
| Less than $5,000 | 16 (11.1%) | 13 (14.3%) |
| $5,000 to $9,999 | 0 (0.0%) | 8 (8.8%) |
| $10,000 to $14,999 | 21 (14.6%) | 8 (8.8%) |
| $15,000 to $19,999 | 0 (0.0%) | 27 (29.7%) |
| $20,000 to $24,999 | 0 (0.0%) | 2 (2.2%) |
| $25,000 to $34,999 | 6 (4.2%) | 3 (3.3%) |
| $35,000 to $49,999 | 34 (23.6%) | 12 (13.2%) |
| $50,000 to $74,999 | 36 (25.0%) | 15 (16.5%) |
| $75,000 to $99,999 | 13 (9.0%) | 3 (3.3%) |
| $100,000 to $149,999 | 7 (4.9%) | 0 (0.0%) |
| $150,000 or more | 11 (7.6%) | 0 (0.0%) |
| Total | 144 (100.0%) | 91 (100.0%) |
Monthly Housing Cost Tiers in Caneyville
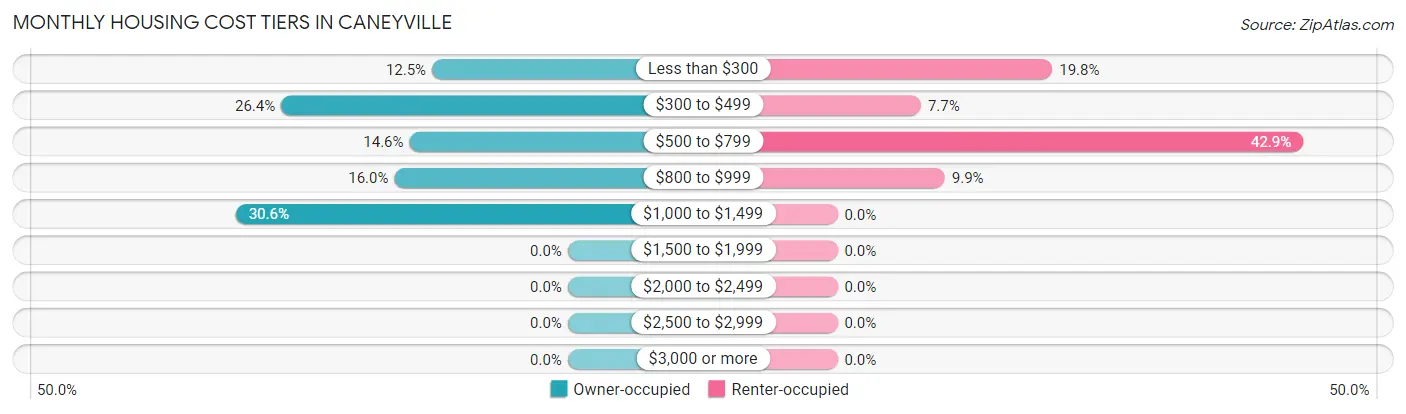
| Monthly Cost | Owner-occupied | Renter-occupied |
| Less than $300 | 18 (12.5%) | 18 (19.8%) |
| $300 to $499 | 38 (26.4%) | 7 (7.7%) |
| $500 to $799 | 21 (14.6%) | 39 (42.9%) |
| $800 to $999 | 23 (16.0%) | 9 (9.9%) |
| $1,000 to $1,499 | 44 (30.6%) | 0 (0.0%) |
| $1,500 to $1,999 | 0 (0.0%) | 0 (0.0%) |
| $2,000 to $2,499 | 0 (0.0%) | 0 (0.0%) |
| $2,500 to $2,999 | 0 (0.0%) | 0 (0.0%) |
| $3,000 or more | 0 (0.0%) | 0 (0.0%) |
| Total | 144 (100.0%) | 91 (100.0%) |
Physical Housing Characteristics in Caneyville
Housing Structures in Caneyville
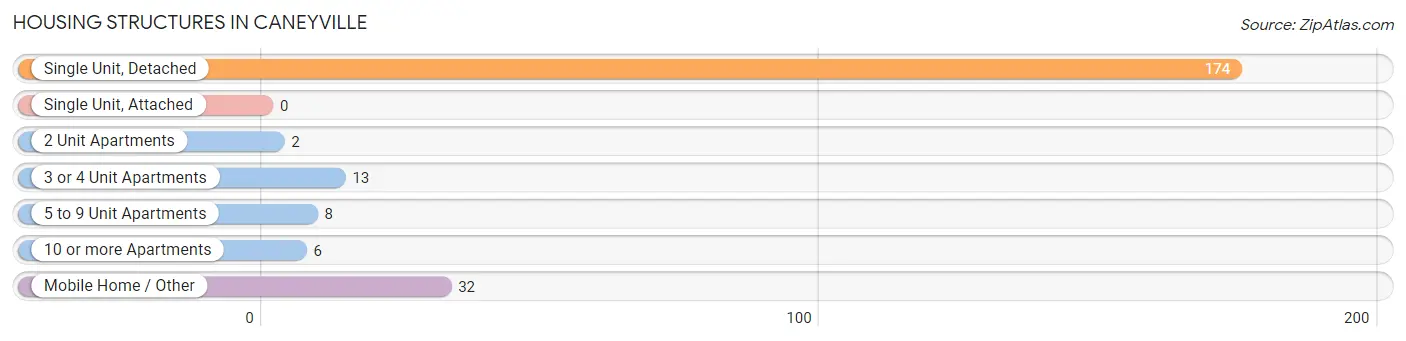
| Structure Type | # Housing Units | % Housing Units |
| Single Unit, Detached | 174 | 74.0% |
| Single Unit, Attached | 0 | 0.0% |
| 2 Unit Apartments | 2 | 0.9% |
| 3 or 4 Unit Apartments | 13 | 5.5% |
| 5 to 9 Unit Apartments | 8 | 3.4% |
| 10 or more Apartments | 6 | 2.5% |
| Mobile Home / Other | 32 | 13.6% |
| Total | 235 | 100.0% |
Housing Structures by Occupancy in Caneyville
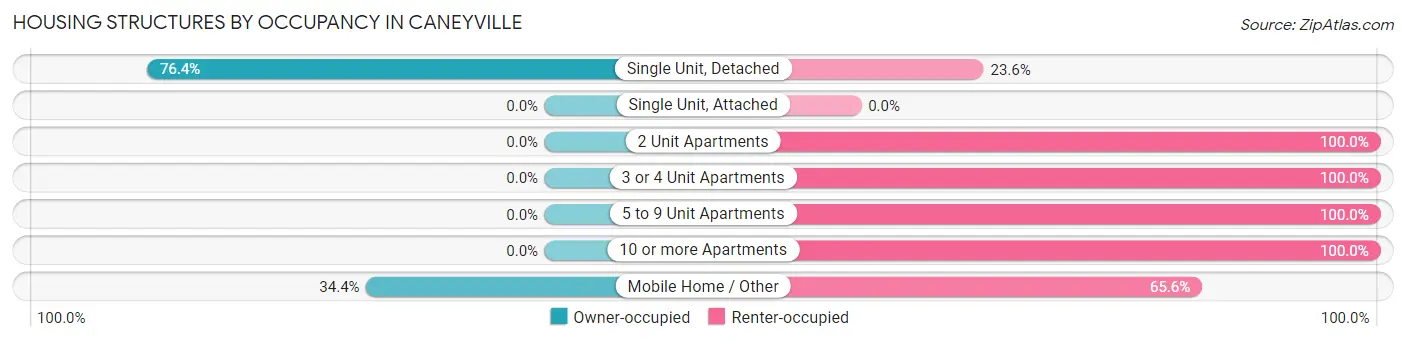
| Structure Type | Owner-occupied | Renter-occupied |
| Single Unit, Detached | 133 (76.4%) | 41 (23.6%) |
| Single Unit, Attached | 0 (0.0%) | 0 (0.0%) |
| 2 Unit Apartments | 0 (0.0%) | 2 (100.0%) |
| 3 or 4 Unit Apartments | 0 (0.0%) | 13 (100.0%) |
| 5 to 9 Unit Apartments | 0 (0.0%) | 8 (100.0%) |
| 10 or more Apartments | 0 (0.0%) | 6 (100.0%) |
| Mobile Home / Other | 11 (34.4%) | 21 (65.6%) |
| Total | 144 (61.3%) | 91 (38.7%) |
Housing Structures by Number of Rooms in Caneyville
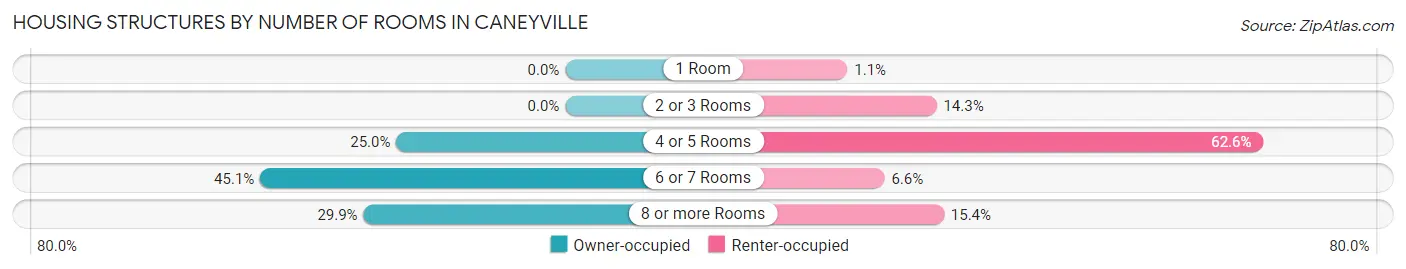
| Number of Rooms | Owner-occupied | Renter-occupied |
| 1 Room | 0 (0.0%) | 1 (1.1%) |
| 2 or 3 Rooms | 0 (0.0%) | 13 (14.3%) |
| 4 or 5 Rooms | 36 (25.0%) | 57 (62.6%) |
| 6 or 7 Rooms | 65 (45.1%) | 6 (6.6%) |
| 8 or more Rooms | 43 (29.9%) | 14 (15.4%) |
| Total | 144 (100.0%) | 91 (100.0%) |
Housing Structure by Heating Type in Caneyville
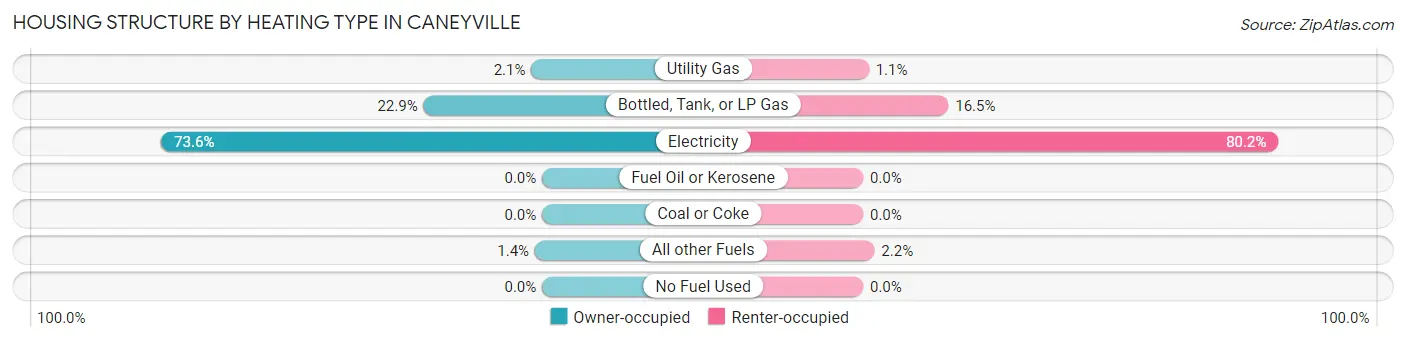
| Heating Type | Owner-occupied | Renter-occupied |
| Utility Gas | 3 (2.1%) | 1 (1.1%) |
| Bottled, Tank, or LP Gas | 33 (22.9%) | 15 (16.5%) |
| Electricity | 106 (73.6%) | 73 (80.2%) |
| Fuel Oil or Kerosene | 0 (0.0%) | 0 (0.0%) |
| Coal or Coke | 0 (0.0%) | 0 (0.0%) |
| All other Fuels | 2 (1.4%) | 2 (2.2%) |
| No Fuel Used | 0 (0.0%) | 0 (0.0%) |
| Total | 144 (100.0%) | 91 (100.0%) |
Household Vehicle Usage in Caneyville
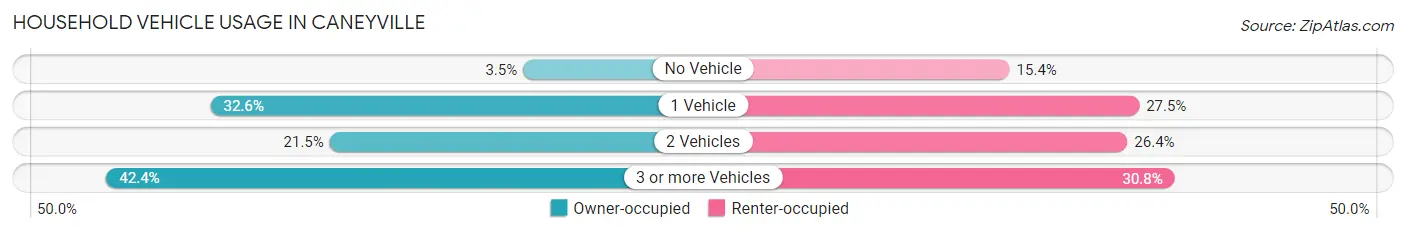
| Vehicles per Household | Owner-occupied | Renter-occupied |
| No Vehicle | 5 (3.5%) | 14 (15.4%) |
| 1 Vehicle | 47 (32.6%) | 25 (27.5%) |
| 2 Vehicles | 31 (21.5%) | 24 (26.4%) |
| 3 or more Vehicles | 61 (42.4%) | 28 (30.8%) |
| Total | 144 (100.0%) | 91 (100.0%) |
Real Estate & Mortgages in Caneyville
Real Estate and Mortgage Overview in Caneyville
| Characteristic | Without Mortgage | With Mortgage |
| Housing Units | 82 | 62 |
| Median Property Value | $113,000 | $104,500 |
| Median Household Income | $47,292 | $3 |
| Monthly Housing Costs | $355 | $0 |
| Real Estate Taxes | $815 | $11 |
Property Value by Mortgage Status in Caneyville
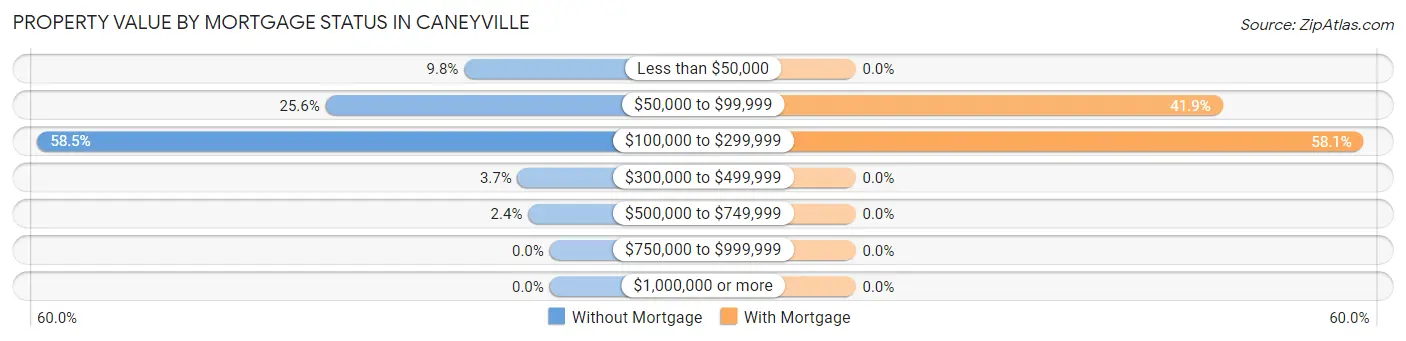
| Property Value | Without Mortgage | With Mortgage |
| Less than $50,000 | 8 (9.8%) | 0 (0.0%) |
| $50,000 to $99,999 | 21 (25.6%) | 26 (41.9%) |
| $100,000 to $299,999 | 48 (58.5%) | 36 (58.1%) |
| $300,000 to $499,999 | 3 (3.7%) | 0 (0.0%) |
| $500,000 to $749,999 | 2 (2.4%) | 0 (0.0%) |
| $750,000 to $999,999 | 0 (0.0%) | 0 (0.0%) |
| $1,000,000 or more | 0 (0.0%) | 0 (0.0%) |
| Total | 82 (100.0%) | 62 (100.0%) |
Household Income by Mortgage Status in Caneyville
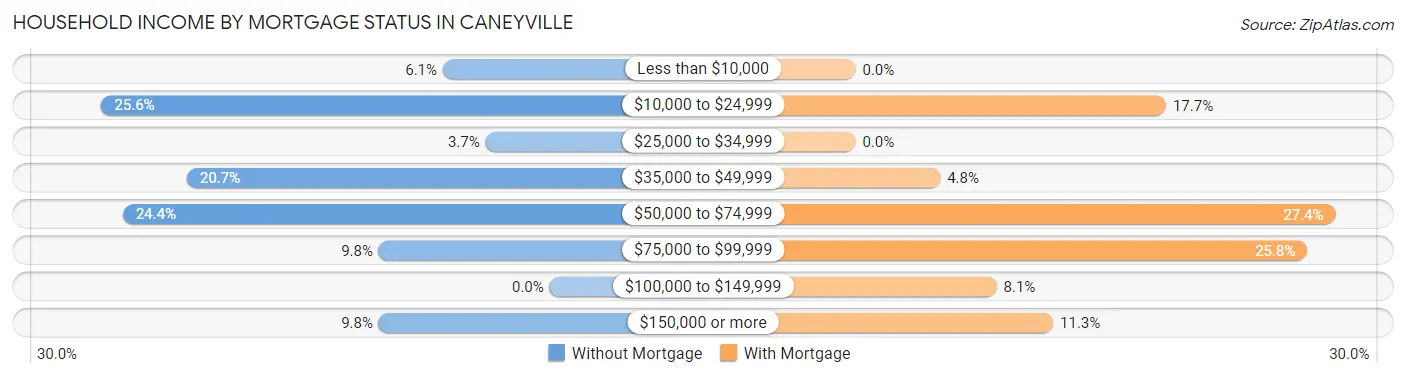
| Household Income | Without Mortgage | With Mortgage |
| Less than $10,000 | 5 (6.1%) | 0 (0.0%) |
| $10,000 to $24,999 | 21 (25.6%) | 11 (17.7%) |
| $25,000 to $34,999 | 3 (3.7%) | 0 (0.0%) |
| $35,000 to $49,999 | 17 (20.7%) | 3 (4.8%) |
| $50,000 to $74,999 | 20 (24.4%) | 17 (27.4%) |
| $75,000 to $99,999 | 8 (9.8%) | 16 (25.8%) |
| $100,000 to $149,999 | 0 (0.0%) | 5 (8.1%) |
| $150,000 or more | 8 (9.8%) | 7 (11.3%) |
| Total | 82 (100.0%) | 62 (100.0%) |
Property Value to Household Income Ratio in Caneyville
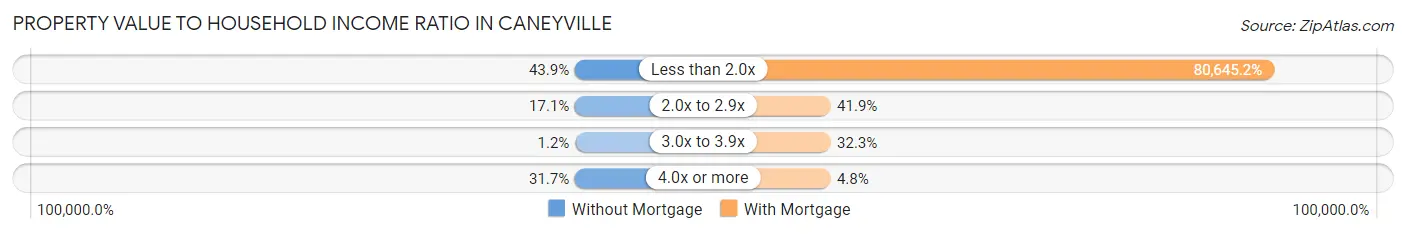
| Value-to-Income Ratio | Without Mortgage | With Mortgage |
| Less than 2.0x | 36 (43.9%) | 50,000 (80,645.2%) |
| 2.0x to 2.9x | 14 (17.1%) | 26 (41.9%) |
| 3.0x to 3.9x | 1 (1.2%) | 20 (32.3%) |
| 4.0x or more | 26 (31.7%) | 3 (4.8%) |
| Total | 82 (100.0%) | 62 (100.0%) |
Real Estate Taxes by Mortgage Status in Caneyville
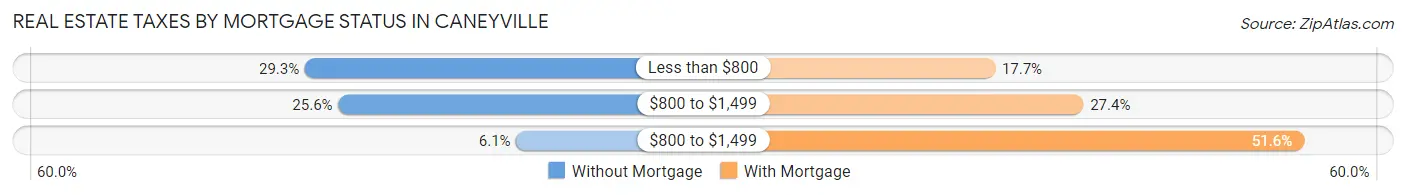
| Property Taxes | Without Mortgage | With Mortgage |
| Less than $800 | 24 (29.3%) | 11 (17.7%) |
| $800 to $1,499 | 21 (25.6%) | 17 (27.4%) |
| $800 to $1,499 | 5 (6.1%) | 32 (51.6%) |
| Total | 82 (100.0%) | 62 (100.0%) |
Health & Disability in Caneyville
Health Insurance Coverage by Age in Caneyville
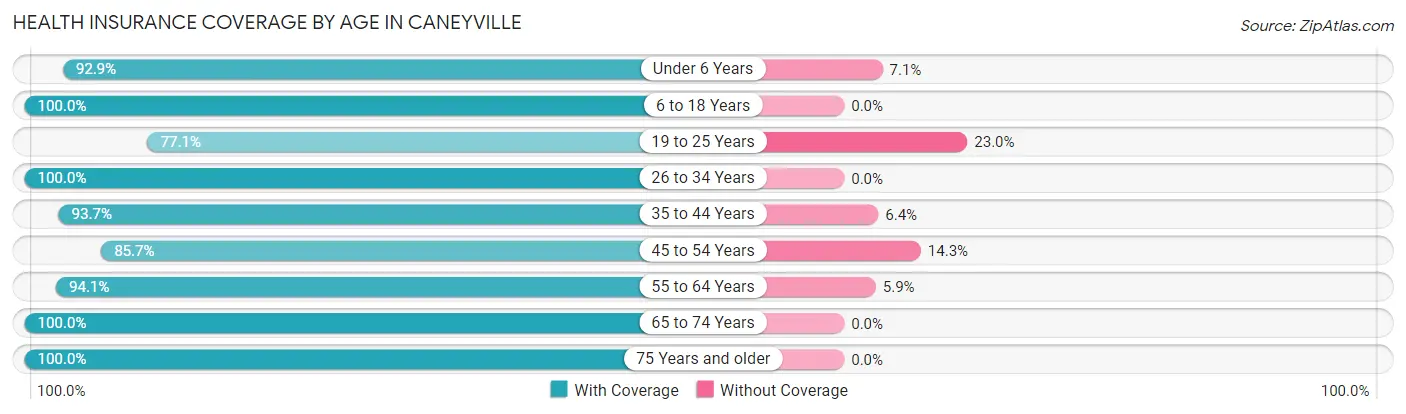
| Age Bracket | With Coverage | Without Coverage |
| Under 6 Years | 52 (92.9%) | 4 (7.1%) |
| 6 to 18 Years | 158 (100.0%) | 0 (0.0%) |
| 19 to 25 Years | 47 (77.0%) | 14 (23.0%) |
| 26 to 34 Years | 70 (100.0%) | 0 (0.0%) |
| 35 to 44 Years | 118 (93.6%) | 8 (6.4%) |
| 45 to 54 Years | 54 (85.7%) | 9 (14.3%) |
| 55 to 64 Years | 48 (94.1%) | 3 (5.9%) |
| 65 to 74 Years | 48 (100.0%) | 0 (0.0%) |
| 75 Years and older | 32 (100.0%) | 0 (0.0%) |
| Total | 627 (94.3%) | 38 (5.7%) |
Health Insurance Coverage by Citizenship Status in Caneyville
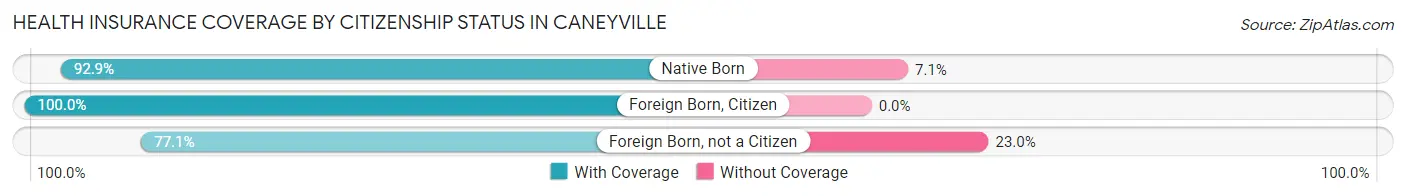
| Citizenship Status | With Coverage | Without Coverage |
| Native Born | 52 (92.9%) | 4 (7.1%) |
| Foreign Born, Citizen | 158 (100.0%) | 0 (0.0%) |
| Foreign Born, not a Citizen | 47 (77.0%) | 14 (23.0%) |
Health Insurance Coverage by Household Income in Caneyville
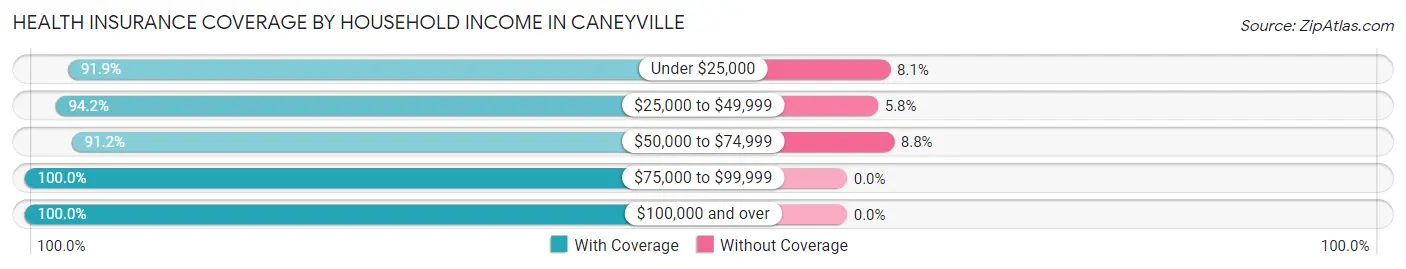
| Household Income | With Coverage | Without Coverage |
| Under $25,000 | 102 (91.9%) | 9 (8.1%) |
| $25,000 to $49,999 | 130 (94.2%) | 8 (5.8%) |
| $50,000 to $74,999 | 217 (91.2%) | 21 (8.8%) |
| $75,000 to $99,999 | 56 (100.0%) | 0 (0.0%) |
| $100,000 and over | 122 (100.0%) | 0 (0.0%) |
Public vs Private Health Insurance Coverage by Age in Caneyville
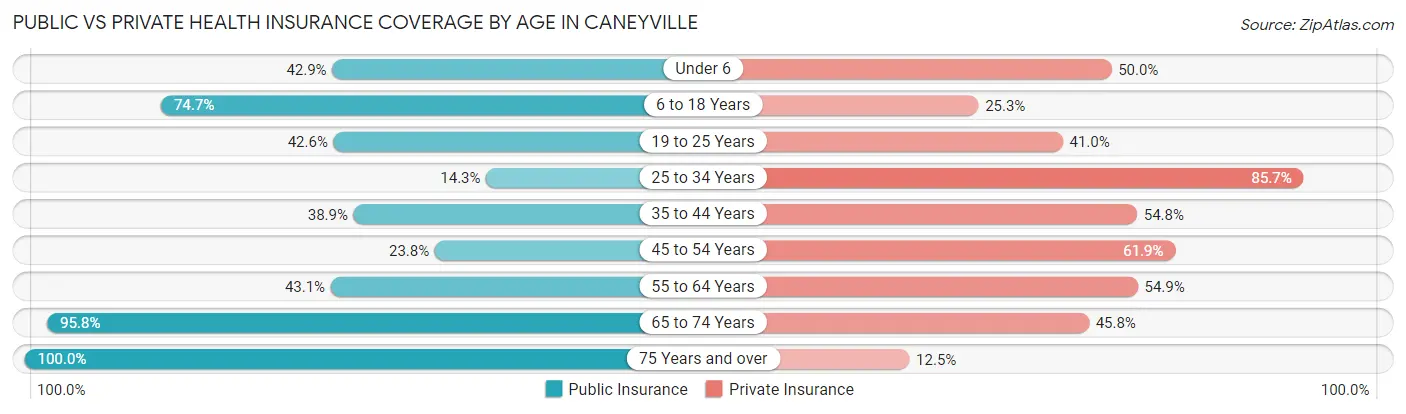
| Age Bracket | Public Insurance | Private Insurance |
| Under 6 | 24 (42.9%) | 28 (50.0%) |
| 6 to 18 Years | 118 (74.7%) | 40 (25.3%) |
| 19 to 25 Years | 26 (42.6%) | 25 (41.0%) |
| 25 to 34 Years | 10 (14.3%) | 60 (85.7%) |
| 35 to 44 Years | 49 (38.9%) | 69 (54.8%) |
| 45 to 54 Years | 15 (23.8%) | 39 (61.9%) |
| 55 to 64 Years | 22 (43.1%) | 28 (54.9%) |
| 65 to 74 Years | 46 (95.8%) | 22 (45.8%) |
| 75 Years and over | 32 (100.0%) | 4 (12.5%) |
| Total | 342 (51.4%) | 315 (47.4%) |
Disability Status by Sex by Age in Caneyville
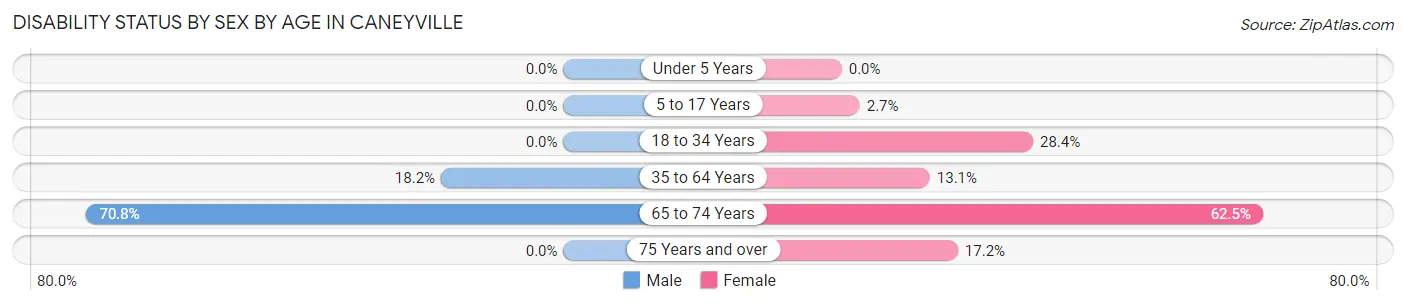
| Age Bracket | Male | Female |
| Under 5 Years | 0 (0.0%) | 0 (0.0%) |
| 5 to 17 Years | 0 (0.0%) | 2 (2.7%) |
| 18 to 34 Years | 0 (0.0%) | 23 (28.4%) |
| 35 to 64 Years | 20 (18.2%) | 17 (13.1%) |
| 65 to 74 Years | 17 (70.8%) | 15 (62.5%) |
| 75 Years and over | 0 (0.0%) | 5 (17.2%) |
Disability Class by Sex by Age in Caneyville
Disability Class: Hearing Difficulty
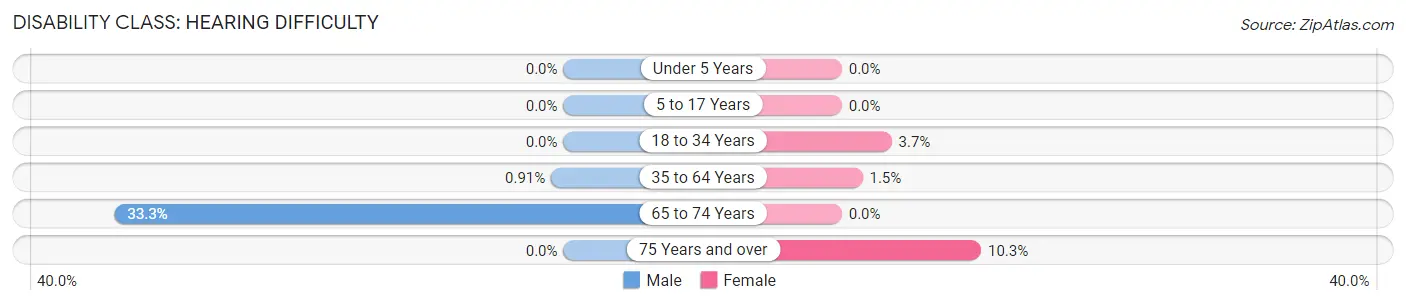
| Age Bracket | Male | Female |
| Under 5 Years | 0 (0.0%) | 0 (0.0%) |
| 5 to 17 Years | 0 (0.0%) | 0 (0.0%) |
| 18 to 34 Years | 0 (0.0%) | 3 (3.7%) |
| 35 to 64 Years | 1 (0.9%) | 2 (1.5%) |
| 65 to 74 Years | 8 (33.3%) | 0 (0.0%) |
| 75 Years and over | 0 (0.0%) | 3 (10.3%) |
Disability Class: Vision Difficulty
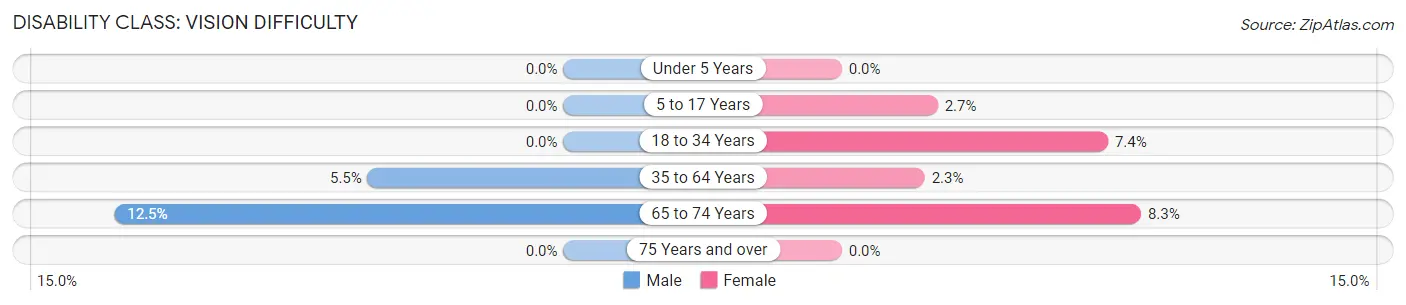
| Age Bracket | Male | Female |
| Under 5 Years | 0 (0.0%) | 0 (0.0%) |
| 5 to 17 Years | 0 (0.0%) | 2 (2.7%) |
| 18 to 34 Years | 0 (0.0%) | 6 (7.4%) |
| 35 to 64 Years | 6 (5.4%) | 3 (2.3%) |
| 65 to 74 Years | 3 (12.5%) | 2 (8.3%) |
| 75 Years and over | 0 (0.0%) | 0 (0.0%) |
Disability Class: Cognitive Difficulty
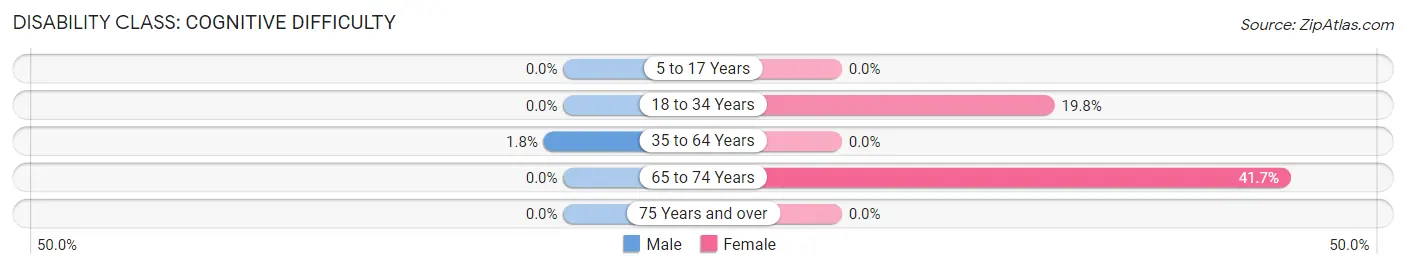
| Age Bracket | Male | Female |
| 5 to 17 Years | 0 (0.0%) | 0 (0.0%) |
| 18 to 34 Years | 0 (0.0%) | 16 (19.8%) |
| 35 to 64 Years | 2 (1.8%) | 0 (0.0%) |
| 65 to 74 Years | 0 (0.0%) | 10 (41.7%) |
| 75 Years and over | 0 (0.0%) | 0 (0.0%) |
Disability Class: Ambulatory Difficulty
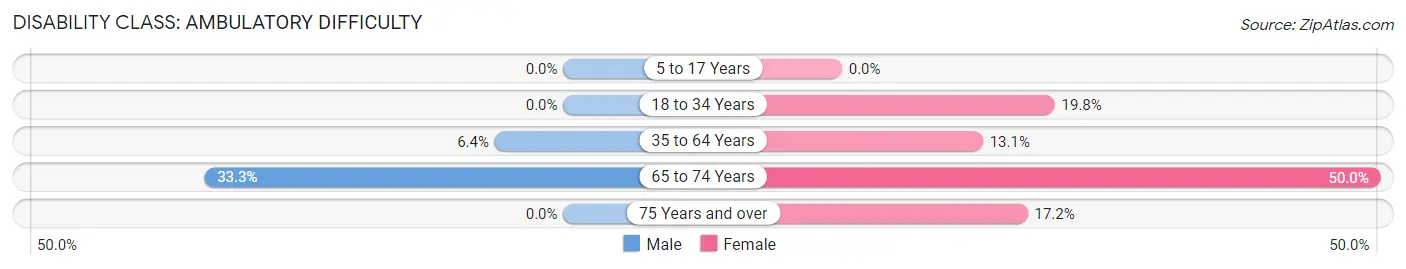
| Age Bracket | Male | Female |
| 5 to 17 Years | 0 (0.0%) | 0 (0.0%) |
| 18 to 34 Years | 0 (0.0%) | 16 (19.8%) |
| 35 to 64 Years | 7 (6.4%) | 17 (13.1%) |
| 65 to 74 Years | 8 (33.3%) | 12 (50.0%) |
| 75 Years and over | 0 (0.0%) | 5 (17.2%) |
Disability Class: Self-Care Difficulty
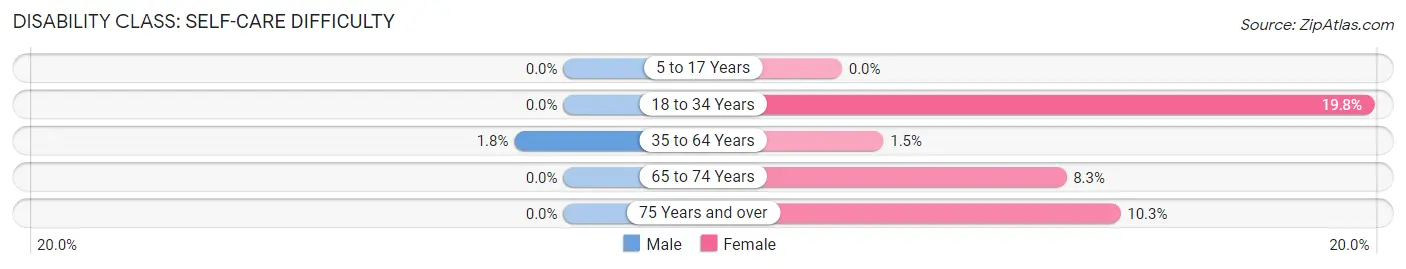
| Age Bracket | Male | Female |
| 5 to 17 Years | 0 (0.0%) | 0 (0.0%) |
| 18 to 34 Years | 0 (0.0%) | 16 (19.8%) |
| 35 to 64 Years | 2 (1.8%) | 2 (1.5%) |
| 65 to 74 Years | 0 (0.0%) | 2 (8.3%) |
| 75 Years and over | 0 (0.0%) | 3 (10.3%) |
Technology Access in Caneyville
Computing Device Access in Caneyville
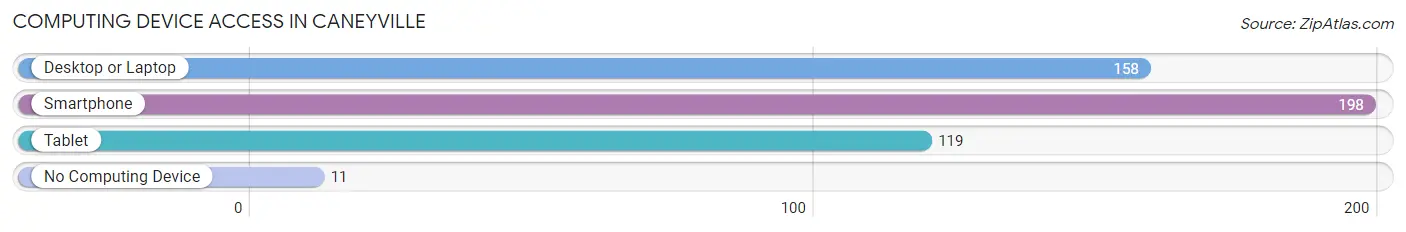
| Device Type | # Households | % Households |
| Desktop or Laptop | 158 | 67.2% |
| Smartphone | 198 | 84.3% |
| Tablet | 119 | 50.6% |
| No Computing Device | 11 | 4.7% |
| Total | 235 | 100.0% |
Internet Access in Caneyville
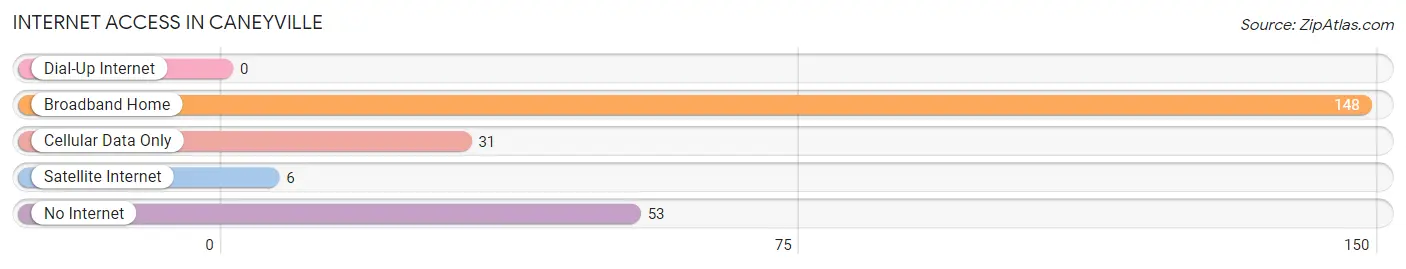
| Internet Type | # Households | % Households |
| Dial-Up Internet | 0 | 0.0% |
| Broadband Home | 148 | 63.0% |
| Cellular Data Only | 31 | 13.2% |
| Satellite Internet | 6 | 2.5% |
| No Internet | 53 | 22.6% |
| Total | 235 | 100.0% |
Caneyville Summary
Caneyville is a small town located in Grayson County, Kentucky. It is situated in the western part of the state, about 40 miles from Louisville. The town has a population of approximately 1,000 people and is part of the larger Bowling Green metropolitan area.
History
Caneyville was founded in 1818 by a group of settlers from Virginia. The town was named after the nearby Caney Creek, which was named after the Native American tribe that once lived in the area. The town was originally a farming community, but it soon developed into a small industrial center. In the late 19th century, the town was home to several factories, including a sawmill, a gristmill, and a woolen mill.
In the early 20th century, Caneyville experienced a period of growth and prosperity. The town was home to several businesses, including a bank, a hotel, a movie theater, and a variety of stores. The town also had a thriving agricultural industry, with several farms located in the area.
Geography
Caneyville is located in western Kentucky, about 40 miles from Louisville. The town is situated in the rolling hills of the Pennyrile region of the state. The town is located near the confluence of Caney Creek and the Green River. The town is surrounded by farmland and is home to several small lakes.
Economy
Caneyville’s economy is largely based on agriculture. The town is home to several farms, which produce a variety of crops, including corn, soybeans, and wheat. The town also has a thriving livestock industry, with several cattle and hog farms located in the area.
In addition to agriculture, Caneyville is home to several small businesses, including a grocery store, a hardware store, and a few restaurants. The town also has a few manufacturing companies, which produce a variety of products, including furniture and clothing.
Demographics
As of the 2010 census, Caneyville had a population of 1,000 people. The town is predominantly white, with about 95% of the population identifying as such. The town also has a small African American population, with about 4% of the population identifying as such. The town also has a small Hispanic population, with about 1% of the population identifying as such.
The median household income in Caneyville is $35,000, which is slightly lower than the national average. The town also has a higher poverty rate than the national average, with about 20% of the population living below the poverty line.
Conclusion
Caneyville is a small town located in western Kentucky. The town has a population of about 1,000 people and is part of the larger Bowling Green metropolitan area. The town’s economy is largely based on agriculture, with several farms located in the area. The town also has a few small businesses, including a grocery store, a hardware store, and a few restaurants. The town is predominantly white, with about 95% of the population identifying as such. The median household income in Caneyville is $35,000, which is slightly lower than the national average.
Common Questions
What is Per Capita Income in Caneyville?
Per Capita income in Caneyville is $18,015.
What is the Median Family Income in Caneyville?
Median Family Income in Caneyville is $57,917.
What is the Median Household income in Caneyville?
Median Household Income in Caneyville is $42,212.
What is Income or Wage Gap in Caneyville?
Income or Wage Gap in Caneyville is 26.2%.
Women in Caneyville earn 73.8 cents for every dollar earned by a man.
What is Inequality or Gini Index in Caneyville?
Inequality or Gini Index in Caneyville is 0.48.
What is the Total Population of Caneyville?
Total Population of Caneyville is 665.
What is the Total Male Population of Caneyville?
Total Male Population of Caneyville is 301.
What is the Total Female Population of Caneyville?
Total Female Population of Caneyville is 364.
What is the Ratio of Males per 100 Females in Caneyville?
There are 82.69 Males per 100 Females in Caneyville.
What is the Ratio of Females per 100 Males in Caneyville?
There are 120.93 Females per 100 Males in Caneyville.
What is the Median Population Age in Caneyville?
Median Population Age in Caneyville is 33.2 Years.
What is the Average Family Size in Caneyville
Average Family Size in Caneyville is 4.4 People.
What is the Average Household Size in Caneyville
Average Household Size in Caneyville is 2.8 People.
How Large is the Labor Force in Caneyville?
There are 285 People in the Labor Forcein in Caneyville.
What is the Percentage of People in the Labor Force in Caneyville?
62.0% of People are in the Labor Force in Caneyville.
What is the Unemployment Rate in Caneyville?
Unemployment Rate in Caneyville is 0.4%.