Elsmere, KY Map & Demographics
Elsmere Map
Elsmere Overview
$29,227
PER CAPITA INCOME
$67,387
AVG FAMILY INCOME
$61,890
AVG HOUSEHOLD INCOME
5.4%
WAGE / INCOME GAP [ % ]
94.6¢/ $1
WAGE / INCOME GAP [ $ ]
0.37
INEQUALITY / GINI INDEX
9,126
TOTAL POPULATION
4,400
MALE POPULATION
4,726
FEMALE POPULATION
93.10
MALES / 100 FEMALES
107.41
FEMALES / 100 MALES
30.9
MEDIAN AGE
3.2
AVG FAMILY SIZE
2.8
AVG HOUSEHOLD SIZE
5,527
LABOR FORCE [ PEOPLE ]
77.6%
PERCENT IN LABOR FORCE
5.8%
UNEMPLOYMENT RATE
Elsmere Area Codes
Income in Elsmere
Income Overview in Elsmere
Per Capita Income in Elsmere is $29,227, while median incomes of families and households are $67,387 and $61,890 respectively.
| Characteristic | Number | Measure |
| Per Capita Income | 9,126 | $29,227 |
| Median Family Income | 2,242 | $67,387 |
| Mean Family Income | 2,242 | $81,513 |
| Median Household Income | 3,271 | $61,890 |
| Mean Household Income | 3,271 | $78,917 |
| Income Deficit | 2,242 | $0 |
| Wage / Income Gap (%) | 9,126 | 5.41% |
| Wage / Income Gap ($) | 9,126 | 94.59¢ per $1 |
| Gini / Inequality Index | 9,126 | 0.37 |
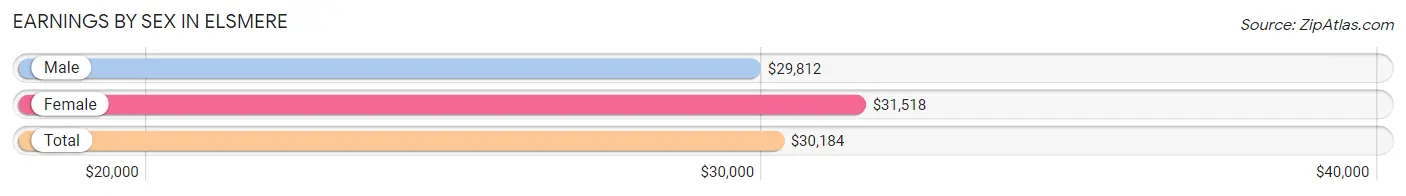
Earnings by Sex in Elsmere
Average Earnings in Elsmere are $30,184, $29,812 for men and $31,518 for women, a difference of 5.4%.
| Sex | Number | Average Earnings |
| Male | 2,901 (50.6%) | $29,812 |
| Female | 2,833 (49.4%) | $31,518 |
| Total | 5,734 (100.0%) | $30,184 |
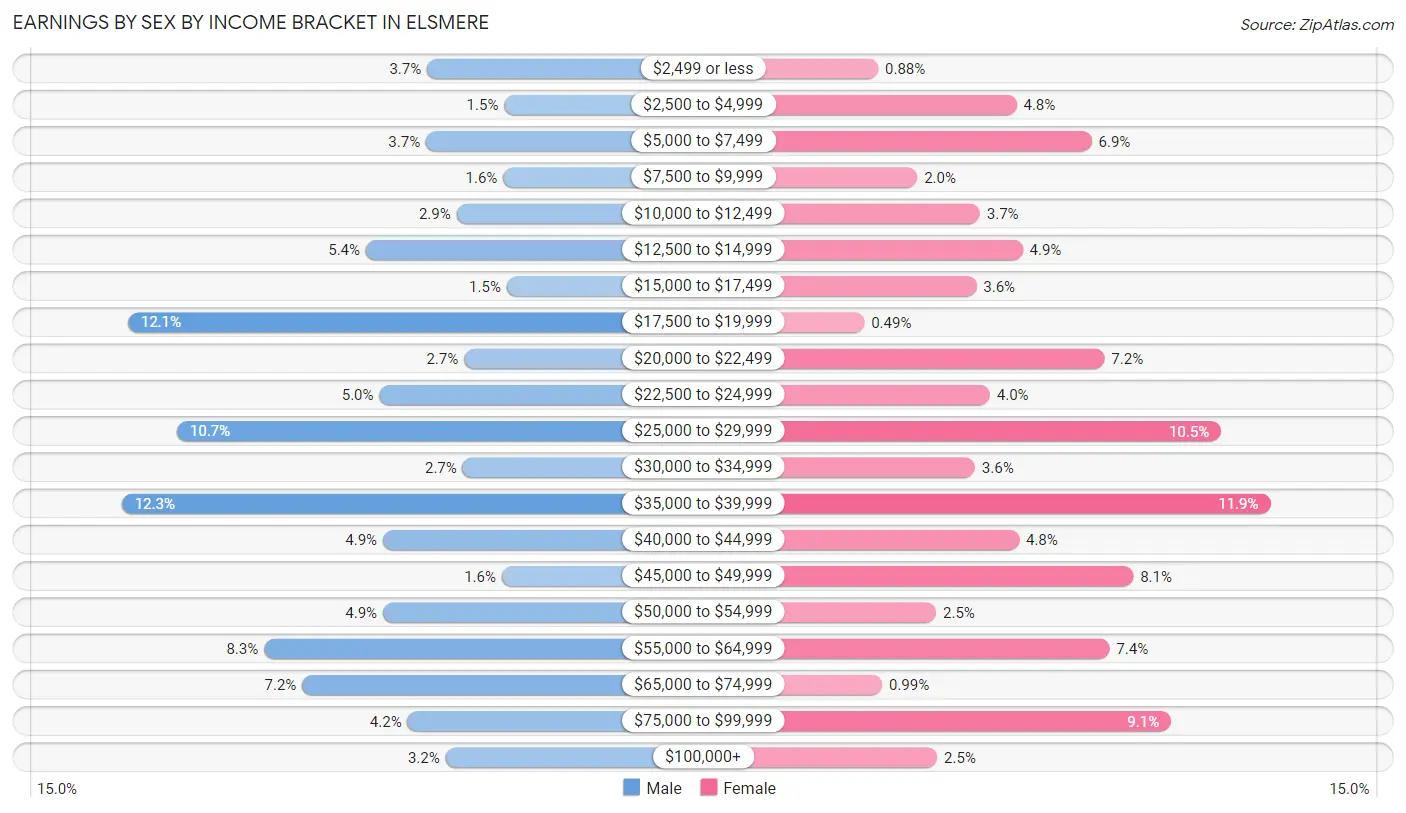
Earnings by Sex by Income Bracket in Elsmere
The most common earnings brackets in Elsmere are $35,000 to $39,999 for men (356 | 12.3%) and $35,000 to $39,999 for women (337 | 11.9%).
| Income | Male | Female |
| $2,499 or less | 107 (3.7%) | 25 (0.9%) |
| $2,500 to $4,999 | 44 (1.5%) | 135 (4.8%) |
| $5,000 to $7,499 | 108 (3.7%) | 195 (6.9%) |
| $7,500 to $9,999 | 45 (1.5%) | 56 (2.0%) |
| $10,000 to $12,499 | 83 (2.9%) | 106 (3.7%) |
| $12,500 to $14,999 | 157 (5.4%) | 140 (4.9%) |
| $15,000 to $17,499 | 42 (1.5%) | 103 (3.6%) |
| $17,500 to $19,999 | 351 (12.1%) | 14 (0.5%) |
| $20,000 to $22,499 | 77 (2.6%) | 205 (7.2%) |
| $22,500 to $24,999 | 146 (5.0%) | 114 (4.0%) |
| $25,000 to $29,999 | 311 (10.7%) | 298 (10.5%) |
| $30,000 to $34,999 | 78 (2.7%) | 102 (3.6%) |
| $35,000 to $39,999 | 356 (12.3%) | 337 (11.9%) |
| $40,000 to $44,999 | 143 (4.9%) | 137 (4.8%) |
| $45,000 to $49,999 | 46 (1.6%) | 228 (8.1%) |
| $50,000 to $54,999 | 143 (4.9%) | 71 (2.5%) |
| $55,000 to $64,999 | 240 (8.3%) | 209 (7.4%) |
| $65,000 to $74,999 | 209 (7.2%) | 28 (1.0%) |
| $75,000 to $99,999 | 123 (4.2%) | 258 (9.1%) |
| $100,000+ | 92 (3.2%) | 72 (2.5%) |
| Total | 2,901 (100.0%) | 2,833 (100.0%) |
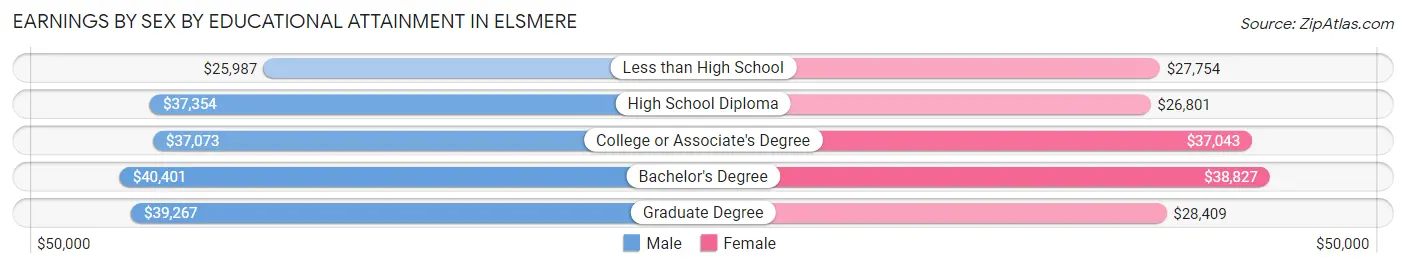
Earnings by Sex by Educational Attainment in Elsmere
Average earnings in Elsmere are $37,089 for men and $35,668 for women, a difference of 3.8%. Men with an educational attainment of bachelor's degree enjoy the highest average annual earnings of $40,401, while those with less than high school education earn the least with $25,987. Women with an educational attainment of bachelor's degree earn the most with the average annual earnings of $38,827, while those with high school diploma education have the smallest earnings of $26,801.
| Educational Attainment | Male Income | Female Income |
| Less than High School | $25,987 | $27,754 |
| High School Diploma | $37,354 | $26,801 |
| College or Associate's Degree | $37,073 | $37,043 |
| Bachelor's Degree | $40,401 | $38,827 |
| Graduate Degree | $39,267 | $28,409 |
| Total | $37,089 | $35,668 |
Family Income in Elsmere
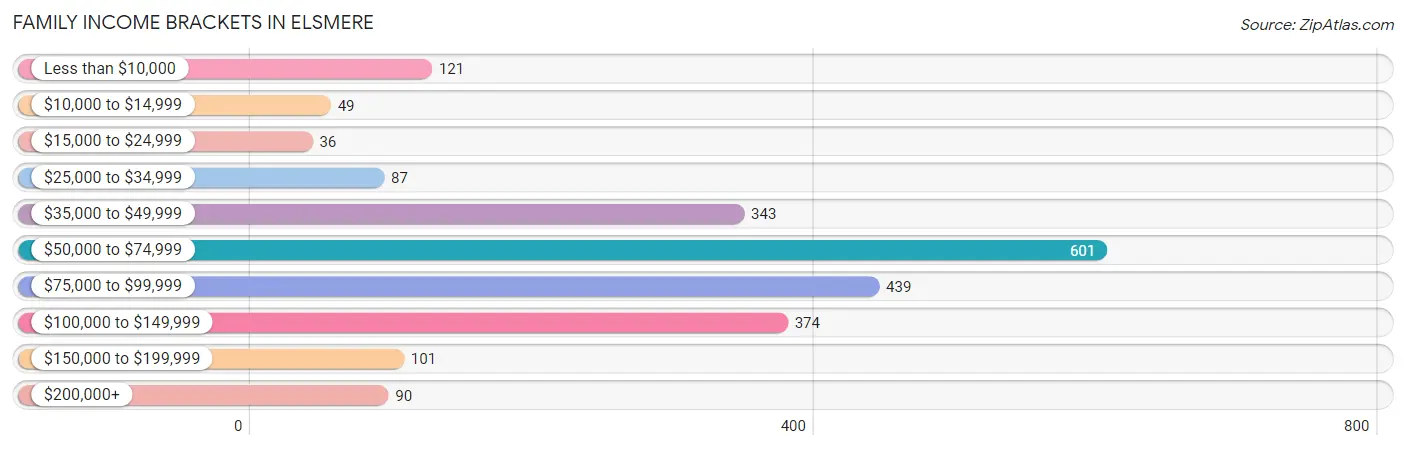
Family Income Brackets in Elsmere
According to the Elsmere family income data, there are 601 families falling into the $50,000 to $74,999 income range, which is the most common income bracket and makes up 26.8% of all families. Conversely, the $15,000 to $24,999 income bracket is the least frequent group with only 36 families (1.6%) belonging to this category.
| Income Bracket | # Families | % Families |
| Less than $10,000 | 121 | 5.4% |
| $10,000 to $14,999 | 49 | 2.2% |
| $15,000 to $24,999 | 36 | 1.6% |
| $25,000 to $34,999 | 87 | 3.9% |
| $35,000 to $49,999 | 343 | 15.3% |
| $50,000 to $74,999 | 601 | 26.8% |
| $75,000 to $99,999 | 439 | 19.6% |
| $100,000 to $149,999 | 374 | 16.7% |
| $150,000 to $199,999 | 101 | 4.5% |
| $200,000+ | 90 | 4.0% |
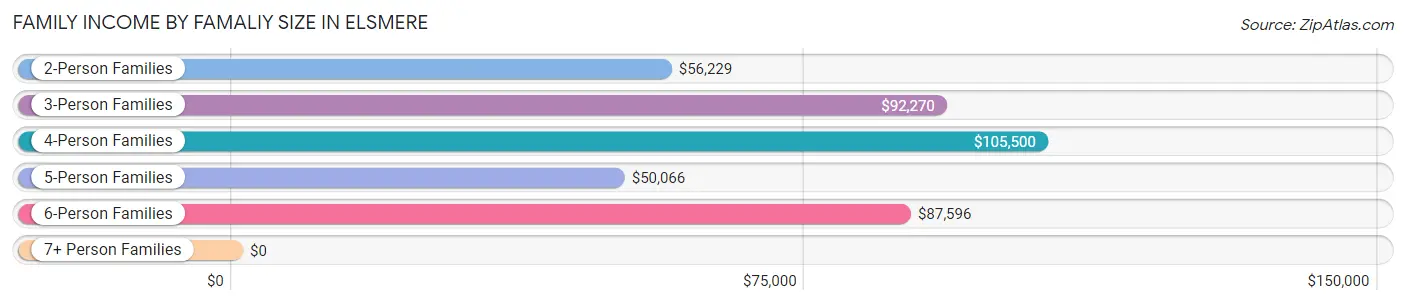
Family Income by Famaliy Size in Elsmere
4-person families (388 | 17.3%) account for the highest median family income in Elsmere with $105,500 per family, while 3-person families (411 | 18.3%) have the highest median income of $30,757 per family member.
| Income Bracket | # Families | Median Income |
| 2-Person Families | 1,124 (50.1%) | $56,229 |
| 3-Person Families | 411 (18.3%) | $92,270 |
| 4-Person Families | 388 (17.3%) | $105,500 |
| 5-Person Families | 191 (8.5%) | $50,066 |
| 6-Person Families | 65 (2.9%) | $87,596 |
| 7+ Person Families | 63 (2.8%) | $0 |
| Total | 2,242 (100.0%) | $67,387 |
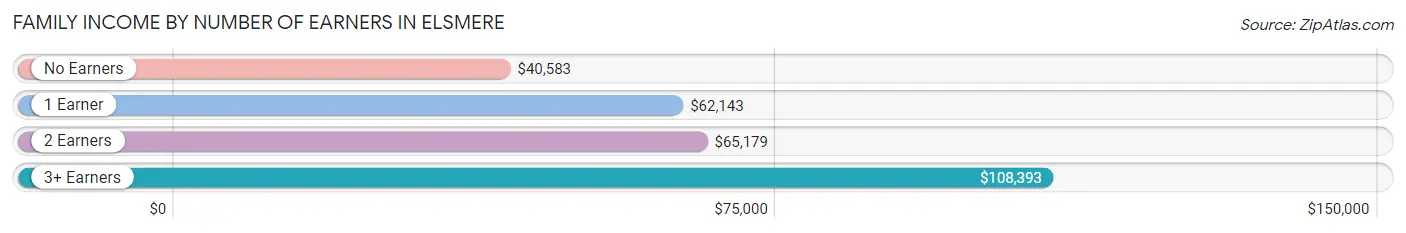
Family Income by Number of Earners in Elsmere
The median family income in Elsmere is $67,387, with families comprising 3+ earners (327) having the highest median family income of $108,393, while families with no earners (149) have the lowest median family income of $40,583, accounting for 14.6% and 6.7% of families, respectively.
| Number of Earners | # Families | Median Income |
| No Earners | 149 (6.7%) | $40,583 |
| 1 Earner | 670 (29.9%) | $62,143 |
| 2 Earners | 1,096 (48.9%) | $65,179 |
| 3+ Earners | 327 (14.6%) | $108,393 |
| Total | 2,242 (100.0%) | $67,387 |
Household Income in Elsmere
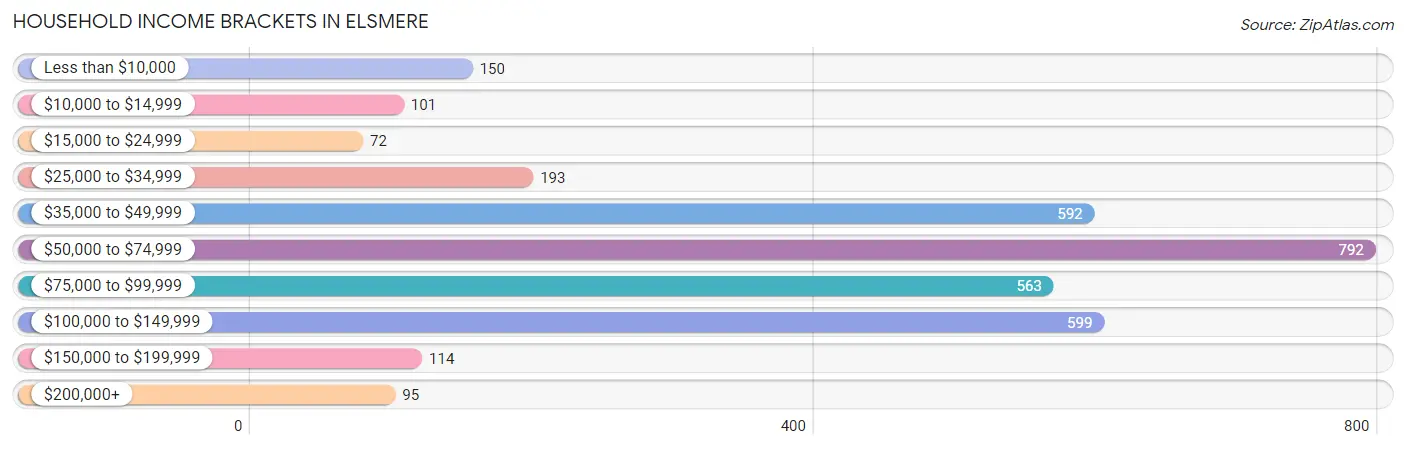
Household Income Brackets in Elsmere
With 792 households falling in the category, the $50,000 to $74,999 income range is the most frequent in Elsmere, accounting for 24.2% of all households. In contrast, only 72 households (2.2%) fall into the $15,000 to $24,999 income bracket, making it the least populous group.
| Income Bracket | # Households | % Households |
| Less than $10,000 | 150 | 4.6% |
| $10,000 to $14,999 | 101 | 3.1% |
| $15,000 to $24,999 | 72 | 2.2% |
| $25,000 to $34,999 | 193 | 5.9% |
| $35,000 to $49,999 | 592 | 18.1% |
| $50,000 to $74,999 | 792 | 24.2% |
| $75,000 to $99,999 | 563 | 17.2% |
| $100,000 to $149,999 | 599 | 18.3% |
| $150,000 to $199,999 | 114 | 3.5% |
| $200,000+ | 95 | 2.9% |
Household Income by Householder Age in Elsmere
The median household income in Elsmere is $61,890, with the highest median household income of $75,813 found in the 45 to 64 years age bracket for the primary householder. A total of 1,046 households (32.0%) fall into this category. Meanwhile, the 15 to 24 years age bracket for the primary householder has the lowest median household income of $0, with 300 households (9.2%) in this group.
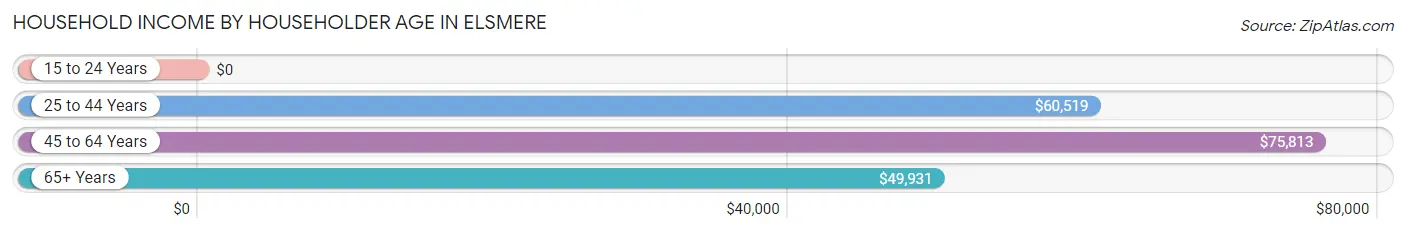
| Income Bracket | # Households | Median Income |
| 15 to 24 Years | 300 (9.2%) | $0 |
| 25 to 44 Years | 1,378 (42.1%) | $60,519 |
| 45 to 64 Years | 1,046 (32.0%) | $75,813 |
| 65+ Years | 547 (16.7%) | $49,931 |
| Total | 3,271 (100.0%) | $61,890 |
Poverty in Elsmere
Income Below Poverty by Sex and Age in Elsmere
With 17.3% poverty level for males and 9.6% for females among the residents of Elsmere, 12 to 14 year old males and 16 and 17 year old females are the most vulnerable to poverty, with 102 males (61.5%) and 55 females (51.4%) in their respective age groups living below the poverty level.
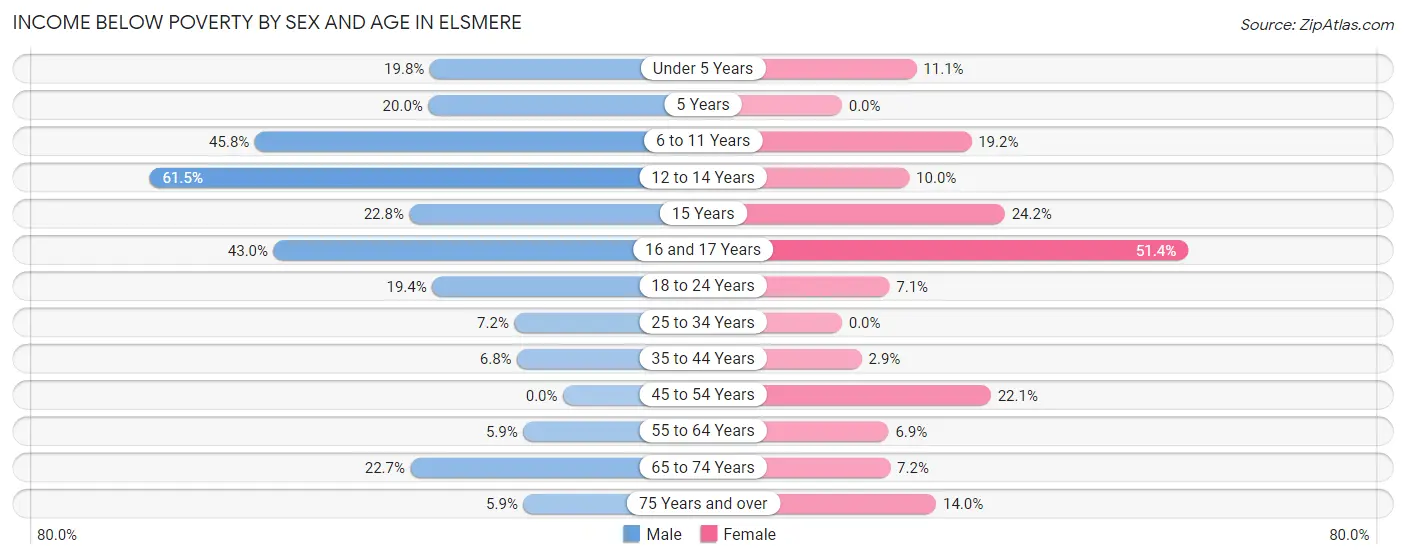
| Age Bracket | Male | Female |
| Under 5 Years | 55 (19.8%) | 41 (11.1%) |
| 5 Years | 14 (20.0%) | 0 (0.0%) |
| 6 to 11 Years | 205 (45.8%) | 49 (19.2%) |
| 12 to 14 Years | 102 (61.5%) | 26 (10.0%) |
| 15 Years | 13 (22.8%) | 15 (24.2%) |
| 16 and 17 Years | 92 (43.0%) | 55 (51.4%) |
| 18 to 24 Years | 74 (19.4%) | 44 (7.1%) |
| 25 to 34 Years | 70 (7.2%) | 0 (0.0%) |
| 35 to 44 Years | 49 (6.8%) | 14 (2.9%) |
| 45 to 54 Years | 0 (0.0%) | 123 (22.1%) |
| 55 to 64 Years | 25 (5.9%) | 35 (6.9%) |
| 65 to 74 Years | 53 (22.7%) | 27 (7.2%) |
| 75 Years and over | 6 (5.9%) | 14 (14.0%) |
| Total | 758 (17.3%) | 443 (9.6%) |
Income Above Poverty by Sex and Age in Elsmere
According to the poverty statistics in Elsmere, males aged 45 to 54 years and females aged 5 years are the age groups that are most secure financially, with 100.0% of males and 100.0% of females in these age groups living above the poverty line.
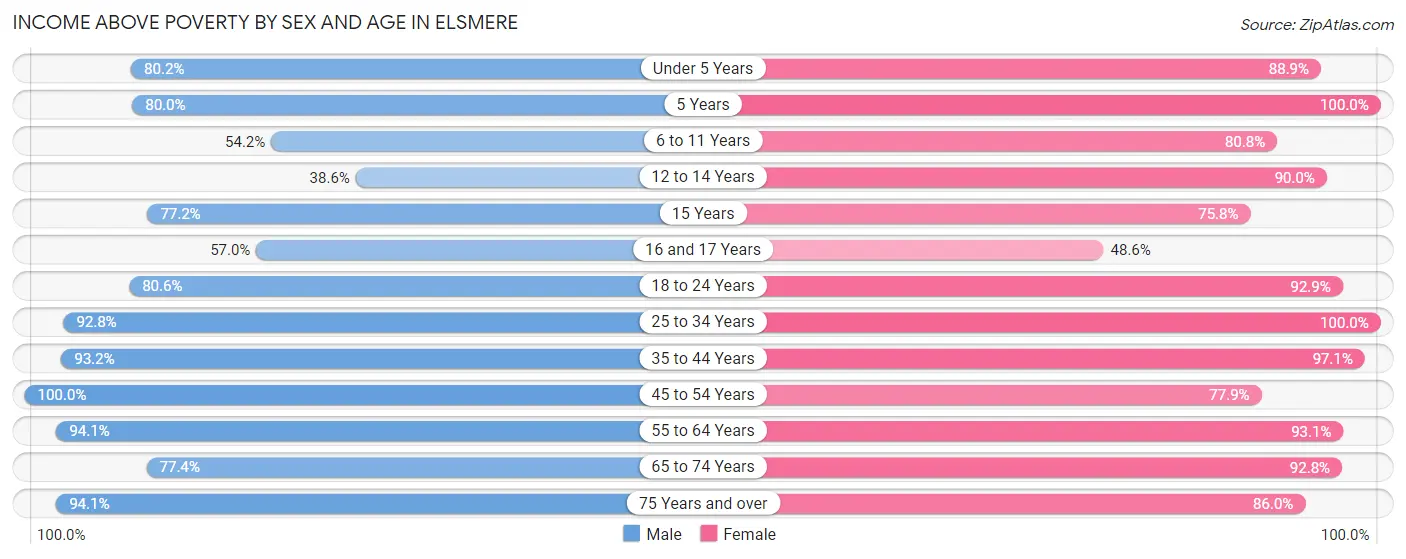
| Age Bracket | Male | Female |
| Under 5 Years | 223 (80.2%) | 329 (88.9%) |
| 5 Years | 56 (80.0%) | 29 (100.0%) |
| 6 to 11 Years | 243 (54.2%) | 206 (80.8%) |
| 12 to 14 Years | 64 (38.6%) | 234 (90.0%) |
| 15 Years | 44 (77.2%) | 47 (75.8%) |
| 16 and 17 Years | 122 (57.0%) | 52 (48.6%) |
| 18 to 24 Years | 307 (80.6%) | 579 (92.9%) |
| 25 to 34 Years | 900 (92.8%) | 905 (100.0%) |
| 35 to 44 Years | 670 (93.2%) | 463 (97.1%) |
| 45 to 54 Years | 307 (100.0%) | 433 (77.9%) |
| 55 to 64 Years | 398 (94.1%) | 470 (93.1%) |
| 65 to 74 Years | 181 (77.3%) | 349 (92.8%) |
| 75 Years and over | 96 (94.1%) | 86 (86.0%) |
| Total | 3,611 (82.7%) | 4,182 (90.4%) |
Income Below Poverty Among Married-Couple Families in Elsmere
The poverty statistics for married-couple families in Elsmere show that 0.6% or 10 of the total 1,610 families live below the poverty line. Families with no children have the highest poverty rate of 1.0%, comprising of 10 families. On the other hand, families with 1 or 2 children have the lowest poverty rate of 0.0%, which includes 0 families.
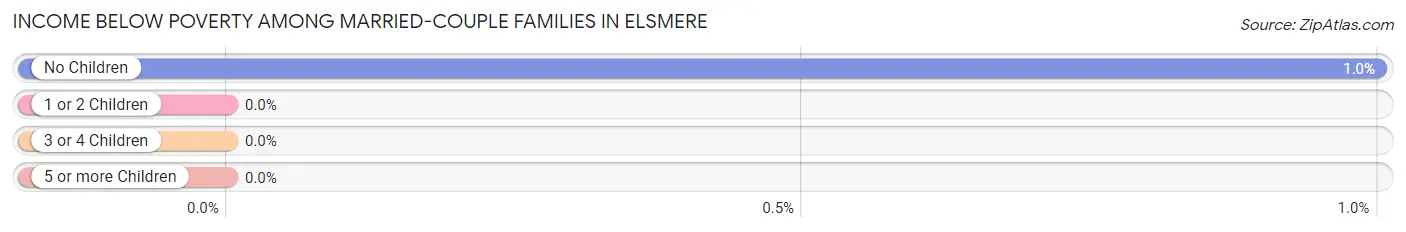
| Children | Above Poverty | Below Poverty |
| No Children | 990 (99.0%) | 10 (1.0%) |
| 1 or 2 Children | 435 (100.0%) | 0 (0.0%) |
| 3 or 4 Children | 175 (100.0%) | 0 (0.0%) |
| 5 or more Children | 0 (0.0%) | 0 (0.0%) |
| Total | 1,600 (99.4%) | 10 (0.6%) |
Income Below Poverty Among Single-Parent Households in Elsmere
According to the poverty data in Elsmere, 45.8% or 49 single-father households and 22.7% or 119 single-mother households are living below the poverty line. Among single-father households, those with 5 or more children have the highest poverty rate, with 49 households (100.0%) experiencing poverty. Likewise, among single-mother households, those with 5 or more children have the highest poverty rate, with 14 households (100.0%) falling below the poverty line.
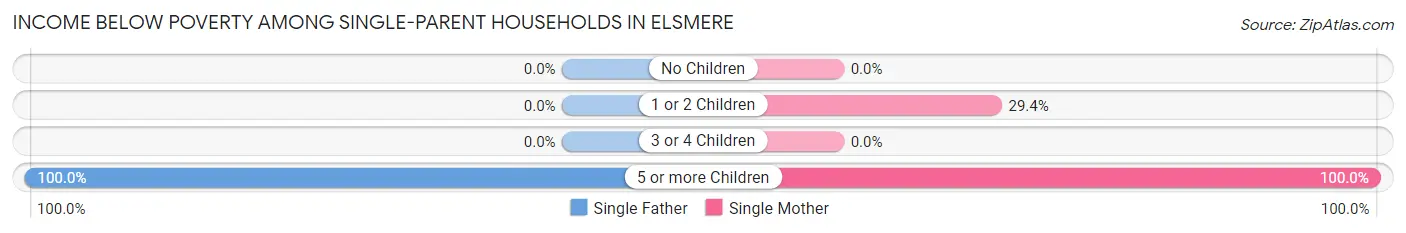
| Children | Single Father | Single Mother |
| No Children | 0 (0.0%) | 0 (0.0%) |
| 1 or 2 Children | 0 (0.0%) | 105 (29.4%) |
| 3 or 4 Children | 0 (0.0%) | 0 (0.0%) |
| 5 or more Children | 49 (100.0%) | 14 (100.0%) |
| Total | 49 (45.8%) | 119 (22.7%) |
Income Below Poverty Among Married-Couple vs Single-Parent Households in Elsmere
The poverty data for Elsmere shows that 10 of the married-couple family households (0.6%) and 168 of the single-parent households (26.6%) are living below the poverty level. Within the married-couple family households, those with no children have the highest poverty rate, with 10 households (1.0%) falling below the poverty line. Among the single-parent households, those with 5 or more children have the highest poverty rate, with 63 household (100.0%) living below poverty.
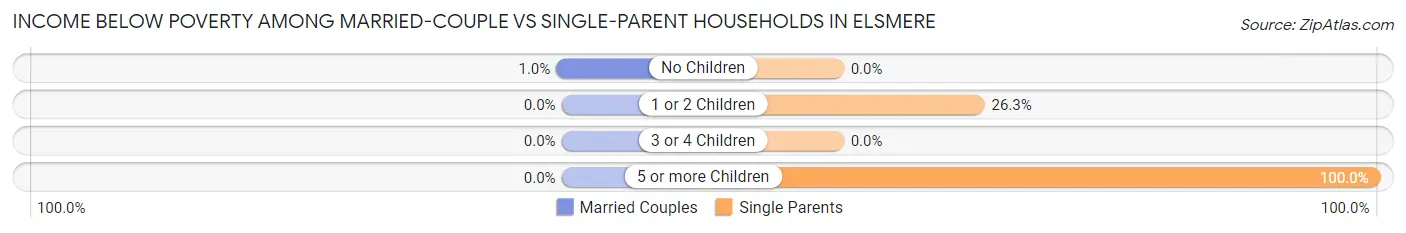
| Children | Married-Couple Families | Single-Parent Households |
| No Children | 10 (1.0%) | 0 (0.0%) |
| 1 or 2 Children | 0 (0.0%) | 105 (26.3%) |
| 3 or 4 Children | 0 (0.0%) | 0 (0.0%) |
| 5 or more Children | 0 (0.0%) | 63 (100.0%) |
| Total | 10 (0.6%) | 168 (26.6%) |
Race in Elsmere
The most populous races in Elsmere are White / Caucasian (7,507 | 82.3%), Black / African American (707 | 7.7%), and Two or more Races (636 | 7.0%).
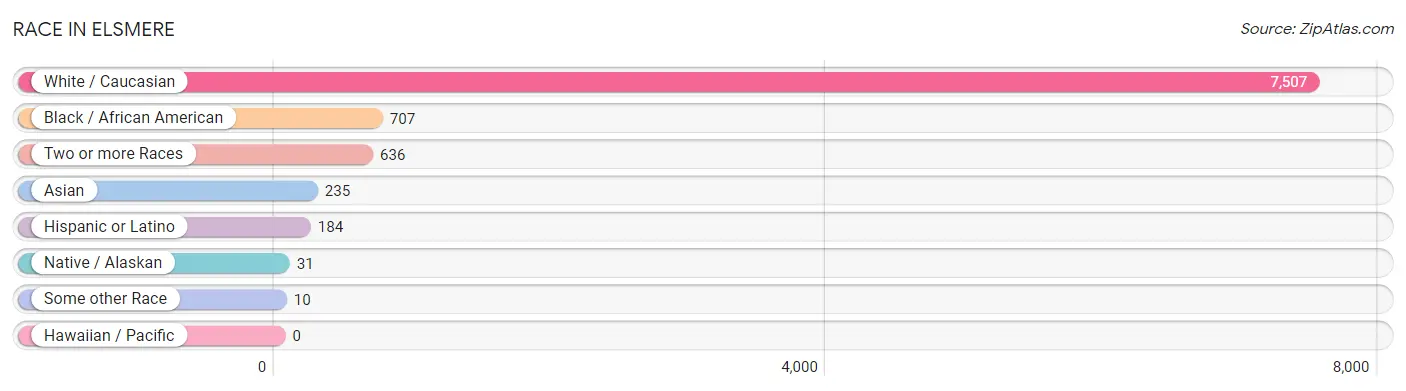
| Race | # Population | % Population |
| Asian | 235 | 2.6% |
| Black / African American | 707 | 7.7% |
| Hawaiian / Pacific | 0 | 0.0% |
| Hispanic or Latino | 184 | 2.0% |
| Native / Alaskan | 31 | 0.3% |
| White / Caucasian | 7,507 | 82.3% |
| Two or more Races | 636 | 7.0% |
| Some other Race | 10 | 0.1% |
| Total | 9,126 | 100.0% |
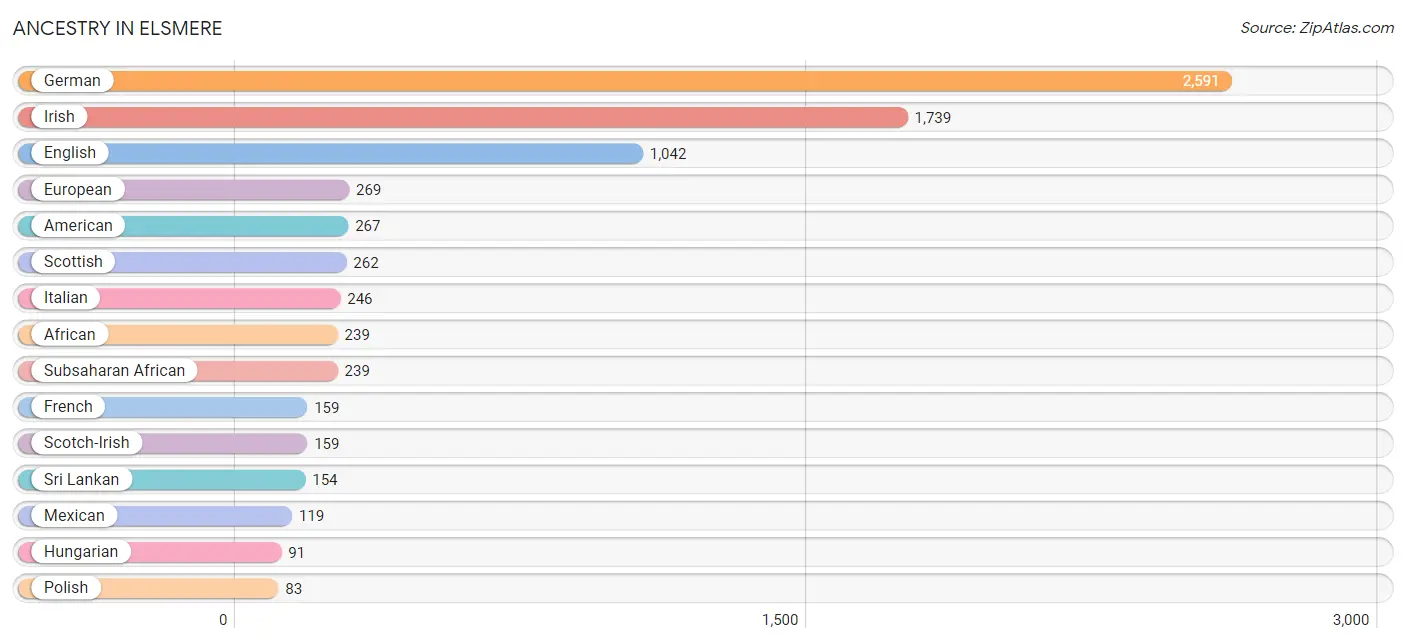
Ancestry in Elsmere
The most populous ancestries reported in Elsmere are German (2,591 | 28.4%), Irish (1,739 | 19.1%), English (1,042 | 11.4%), European (269 | 2.9%), and American (267 | 2.9%), together accounting for 64.7% of all Elsmere residents.
| Ancestry | # Population | % Population |
| African | 239 | 2.6% |
| American | 267 | 2.9% |
| Apache | 10 | 0.1% |
| Austrian | 18 | 0.2% |
| Bhutanese | 15 | 0.2% |
| Brazilian | 17 | 0.2% |
| British | 13 | 0.1% |
| Central American | 65 | 0.7% |
| Cherokee | 48 | 0.5% |
| Dutch | 54 | 0.6% |
| English | 1,042 | 11.4% |
| European | 269 | 2.9% |
| Finnish | 15 | 0.2% |
| French | 159 | 1.7% |
| German | 2,591 | 28.4% |
| Guatemalan | 65 | 0.7% |
| Hungarian | 91 | 1.0% |
| Irish | 1,739 | 19.1% |
| Italian | 246 | 2.7% |
| Korean | 12 | 0.1% |
| Mexican | 119 | 1.3% |
| Native Hawaiian | 8 | 0.1% |
| Pakistani | 9 | 0.1% |
| Polish | 83 | 0.9% |
| Portuguese | 19 | 0.2% |
| Russian | 20 | 0.2% |
| Scandinavian | 73 | 0.8% |
| Scotch-Irish | 159 | 1.7% |
| Scottish | 262 | 2.9% |
| Slovak | 18 | 0.2% |
| Sri Lankan | 154 | 1.7% |
| Subsaharan African | 239 | 2.6% |
| Swedish | 11 | 0.1% |
| Thai | 60 | 0.7% |
| Welsh | 16 | 0.2% | View All 35 Rows |
Immigrants in Elsmere
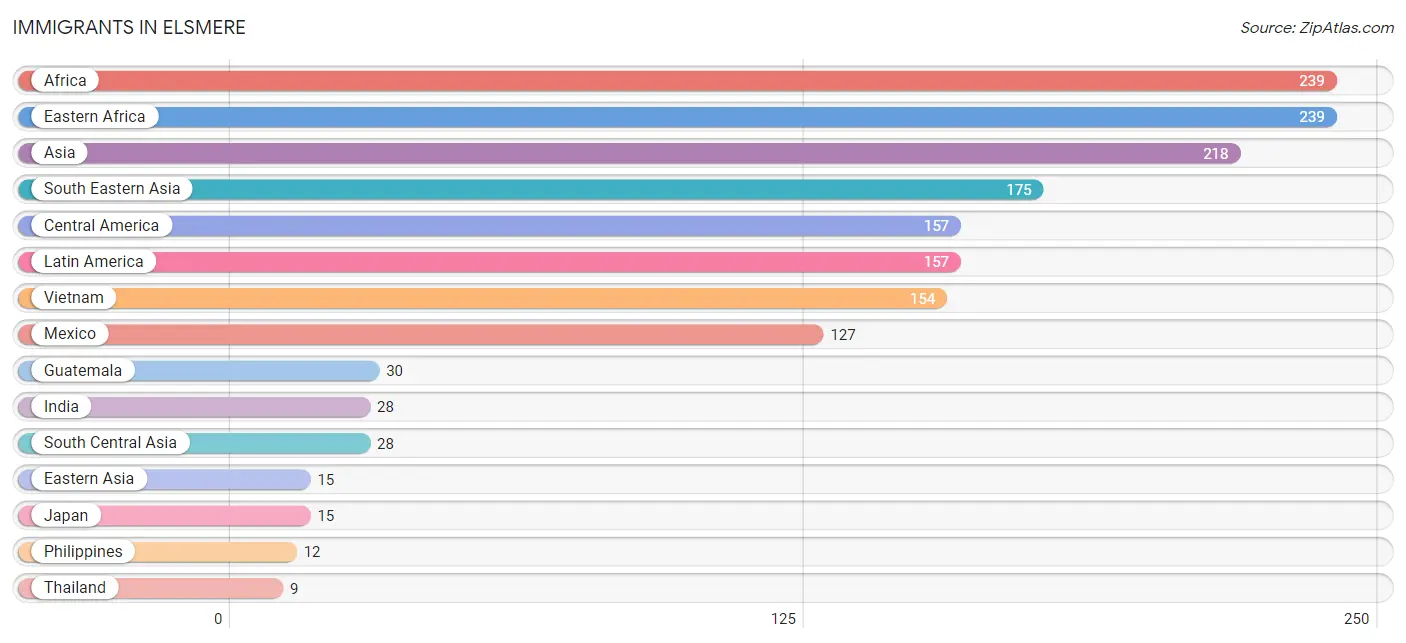
The most numerous immigrant groups reported in Elsmere came from Africa (239 | 2.6%), Eastern Africa (239 | 2.6%), Asia (218 | 2.4%), South Eastern Asia (175 | 1.9%), and Central America (157 | 1.7%), together accounting for 11.3% of all Elsmere residents.
| Immigration Origin | # Population | % Population |
| Africa | 239 | 2.6% |
| Asia | 218 | 2.4% |
| Central America | 157 | 1.7% |
| Eastern Africa | 239 | 2.6% |
| Eastern Asia | 15 | 0.2% |
| Guatemala | 30 | 0.3% |
| India | 28 | 0.3% |
| Japan | 15 | 0.2% |
| Latin America | 157 | 1.7% |
| Mexico | 127 | 1.4% |
| Philippines | 12 | 0.1% |
| South Central Asia | 28 | 0.3% |
| South Eastern Asia | 175 | 1.9% |
| Thailand | 9 | 0.1% |
| Vietnam | 154 | 1.7% | View All 15 Rows |
Sex and Age in Elsmere
Sex and Age in Elsmere
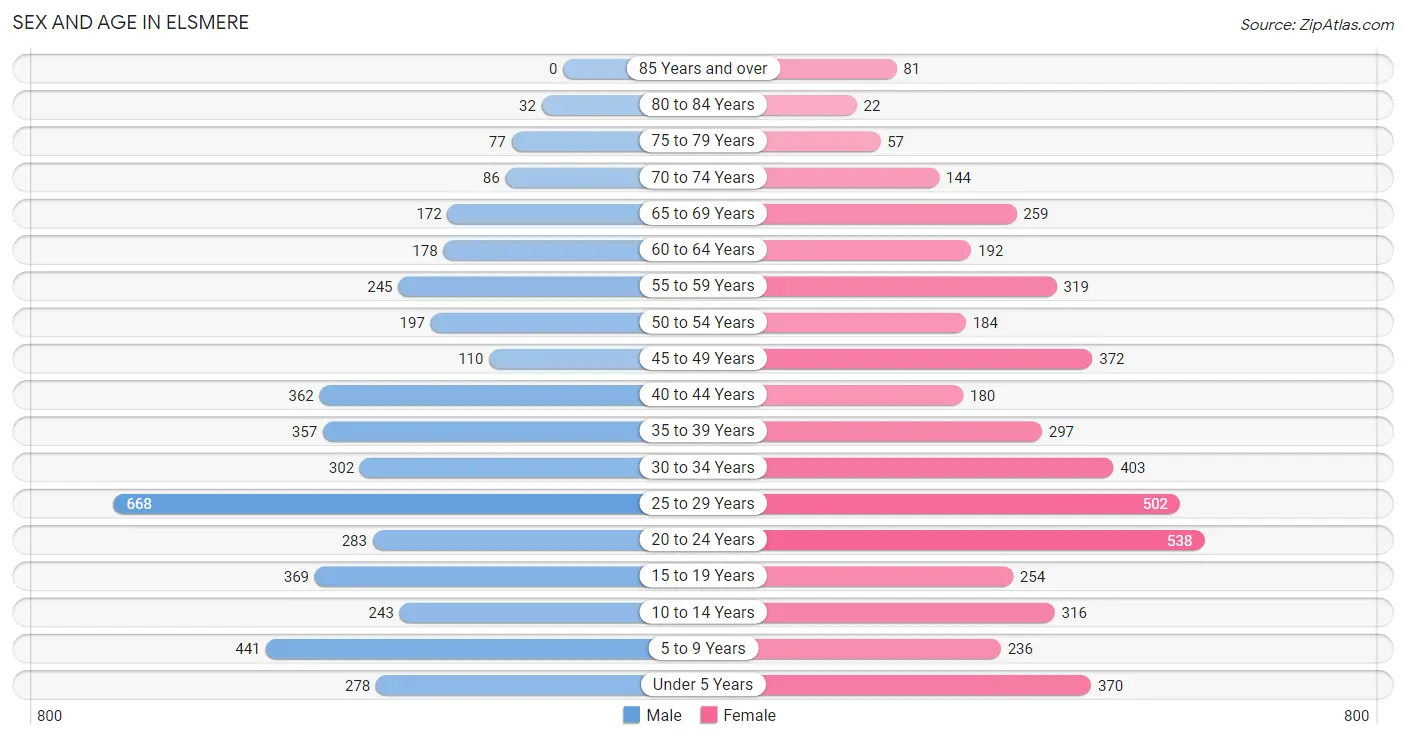
The most populous age groups in Elsmere are 25 to 29 Years (668 | 15.2%) for men and 20 to 24 Years (538 | 11.4%) for women.
| Age Bracket | Male | Female |
| Under 5 Years | 278 (6.3%) | 370 (7.8%) |
| 5 to 9 Years | 441 (10.0%) | 236 (5.0%) |
| 10 to 14 Years | 243 (5.5%) | 316 (6.7%) |
| 15 to 19 Years | 369 (8.4%) | 254 (5.4%) |
| 20 to 24 Years | 283 (6.4%) | 538 (11.4%) |
| 25 to 29 Years | 668 (15.2%) | 502 (10.6%) |
| 30 to 34 Years | 302 (6.9%) | 403 (8.5%) |
| 35 to 39 Years | 357 (8.1%) | 297 (6.3%) |
| 40 to 44 Years | 362 (8.2%) | 180 (3.8%) |
| 45 to 49 Years | 110 (2.5%) | 372 (7.9%) |
| 50 to 54 Years | 197 (4.5%) | 184 (3.9%) |
| 55 to 59 Years | 245 (5.6%) | 319 (6.8%) |
| 60 to 64 Years | 178 (4.1%) | 192 (4.1%) |
| 65 to 69 Years | 172 (3.9%) | 259 (5.5%) |
| 70 to 74 Years | 86 (1.9%) | 144 (3.0%) |
| 75 to 79 Years | 77 (1.8%) | 57 (1.2%) |
| 80 to 84 Years | 32 (0.7%) | 22 (0.5%) |
| 85 Years and over | 0 (0.0%) | 81 (1.7%) |
| Total | 4,400 (100.0%) | 4,726 (100.0%) |
Families and Households in Elsmere
Median Family Size in Elsmere
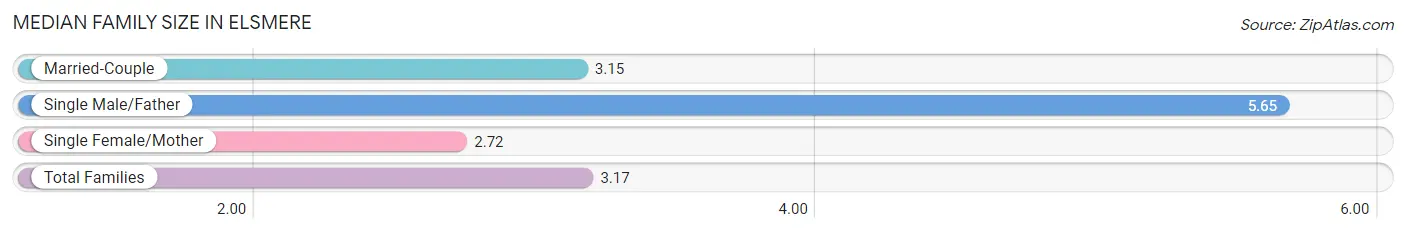
The median family size in Elsmere is 3.17 persons per family, with single male/father families (107 | 4.8%) accounting for the largest median family size of 5.65 persons per family. On the other hand, single female/mother families (525 | 23.4%) represent the smallest median family size with 2.72 persons per family.
| Family Type | # Families | Family Size |
| Married-Couple | 1,610 (71.8%) | 3.15 |
| Single Male/Father | 107 (4.8%) | 5.65 |
| Single Female/Mother | 525 (23.4%) | 2.72 |
| Total Families | 2,242 (100.0%) | 3.17 |
Median Household Size in Elsmere
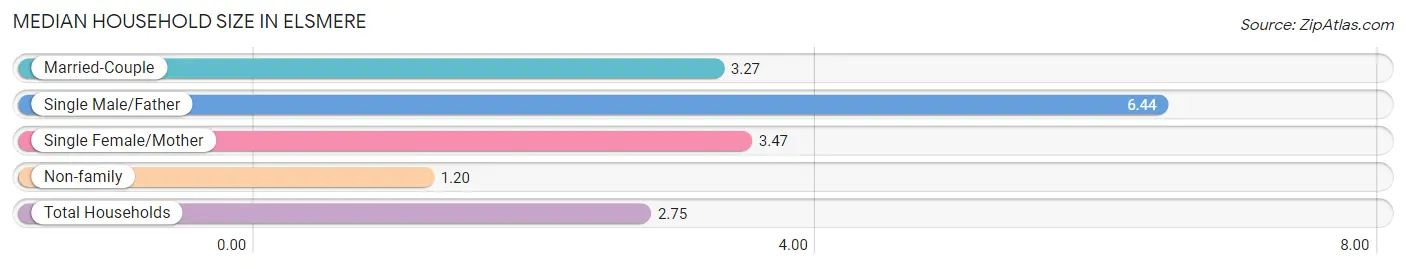
The median household size in Elsmere is 2.75 persons per household, with single male/father households (107 | 3.3%) accounting for the largest median household size of 6.44 persons per household. non-family households (1,029 | 31.5%) represent the smallest median household size with 1.20 persons per household.
| Household Type | # Households | Household Size |
| Married-Couple | 1,610 (49.2%) | 3.27 |
| Single Male/Father | 107 (3.3%) | 6.44 |
| Single Female/Mother | 525 (16.1%) | 3.47 |
| Non-family | 1,029 (31.5%) | 1.20 |
| Total Households | 3,271 (100.0%) | 2.75 |
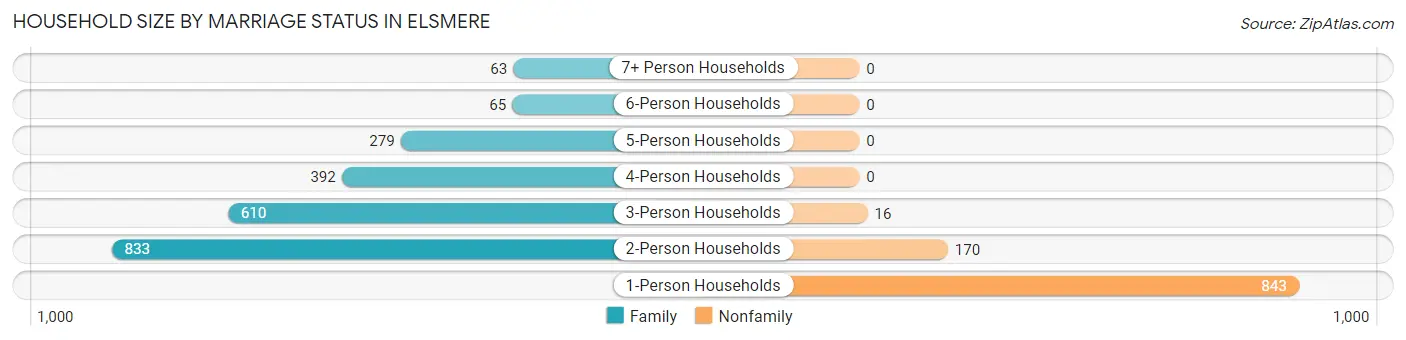
Household Size by Marriage Status in Elsmere
Out of a total of 3,271 households in Elsmere, 2,242 (68.5%) are family households, while 1,029 (31.5%) are nonfamily households. The most numerous type of family households are 2-person households, comprising 833, and the most common type of nonfamily households are 1-person households, comprising 843.
| Household Size | Family Households | Nonfamily Households |
| 1-Person Households | - | 843 (25.8%) |
| 2-Person Households | 833 (25.5%) | 170 (5.2%) |
| 3-Person Households | 610 (18.6%) | 16 (0.5%) |
| 4-Person Households | 392 (12.0%) | 0 (0.0%) |
| 5-Person Households | 279 (8.5%) | 0 (0.0%) |
| 6-Person Households | 65 (2.0%) | 0 (0.0%) |
| 7+ Person Households | 63 (1.9%) | 0 (0.0%) |
| Total | 2,242 (68.5%) | 1,029 (31.5%) |
Female Fertility in Elsmere
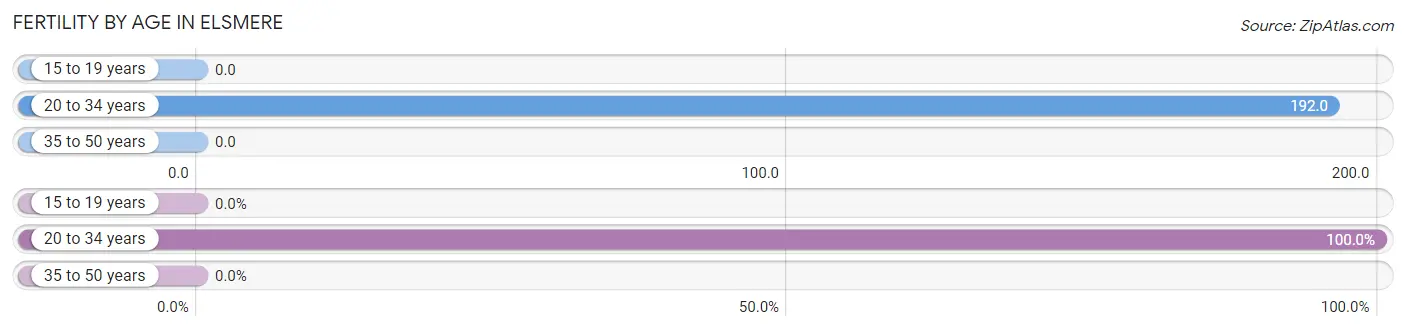
Fertility by Age in Elsmere
Average fertility rate in Elsmere is 107.0 births per 1,000 women. Women in the age bracket of 20 to 34 years have the highest fertility rate with 192.0 births per 1,000 women. Women in the age bracket of 20 to 34 years acount for 100.0% of all women with births.
| Age Bracket | Women with Births | Births / 1,000 Women |
| 15 to 19 years | 0 (0.0%) | 0.0 |
| 20 to 34 years | 277 (100.0%) | 192.0 |
| 35 to 50 years | 0 (0.0%) | 0.0 |
| Total | 277 (100.0%) | 107.0 |
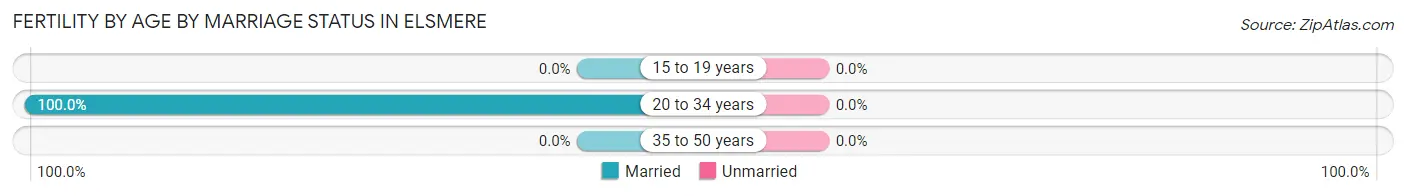
Fertility by Age by Marriage Status in Elsmere
| Age Bracket | Married | Unmarried |
| 15 to 19 years | 0 (0.0%) | 0 (0.0%) |
| 20 to 34 years | 277 (100.0%) | 0 (0.0%) |
| 35 to 50 years | 0 (0.0%) | 0 (0.0%) |
| Total | 277 (100.0%) | 0 (0.0%) |
Fertility by Education in Elsmere
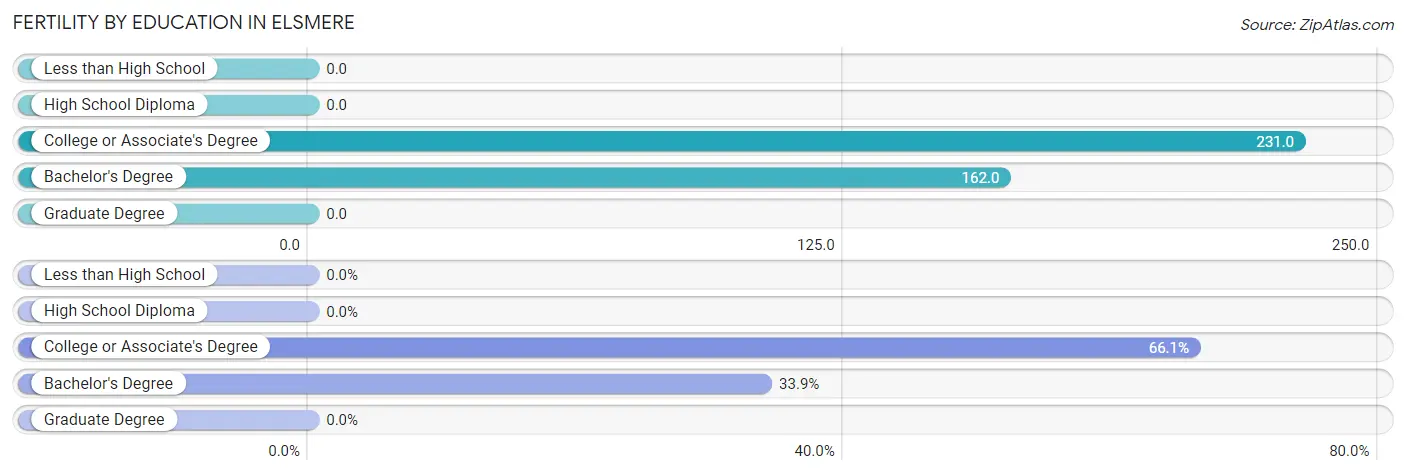
| Educational Attainment | Women with Births | Births / 1,000 Women |
| Less than High School | 0 (0.0%) | 0.0 |
| High School Diploma | 0 (0.0%) | 0.0 |
| College or Associate's Degree | 183 (66.1%) | 231.0 |
| Bachelor's Degree | 94 (33.9%) | 162.0 |
| Graduate Degree | 0 (0.0%) | 0.0 |
| Total | 277 (100.0%) | 107.0 |
Fertility by Education by Marriage Status in Elsmere
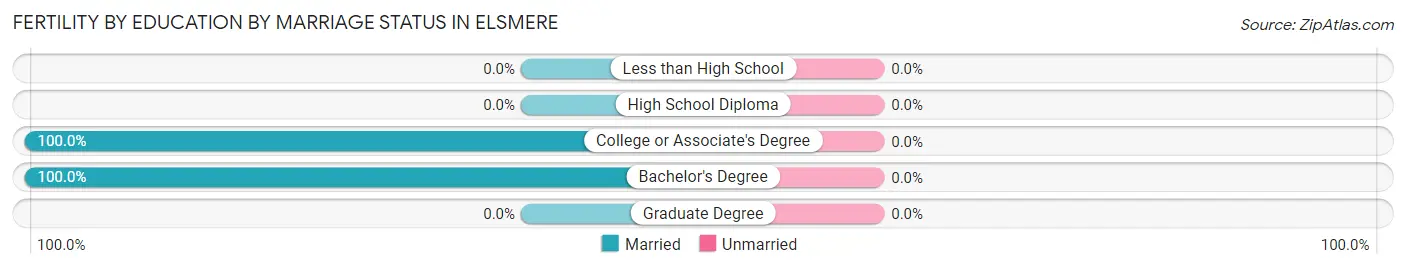
| Educational Attainment | Married | Unmarried |
| Less than High School | 0 (0.0%) | 0 (0.0%) |
| High School Diploma | 0 (0.0%) | 0 (0.0%) |
| College or Associate's Degree | 183 (100.0%) | 0 (0.0%) |
| Bachelor's Degree | 94 (100.0%) | 0 (0.0%) |
| Graduate Degree | 0 (0.0%) | 0 (0.0%) |
| Total | 277 (100.0%) | 0 (0.0%) |
Employment Characteristics in Elsmere
Employment by Class of Employer in Elsmere
Among the 5,121 employed individuals in Elsmere, private company employees (4,100 | 80.1%), not-for-profit organizations (491 | 9.6%), and self-employed (not incorporated) (194 | 3.8%) make up the most common classes of employment.
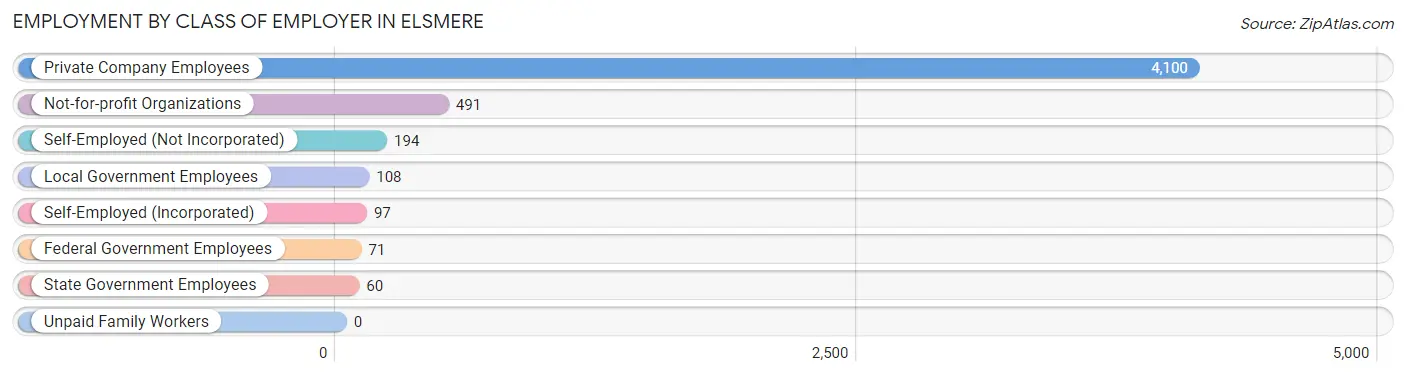
| Employer Class | # Employees | % Employees |
| Private Company Employees | 4,100 | 80.1% |
| Self-Employed (Incorporated) | 97 | 1.9% |
| Self-Employed (Not Incorporated) | 194 | 3.8% |
| Not-for-profit Organizations | 491 | 9.6% |
| Local Government Employees | 108 | 2.1% |
| State Government Employees | 60 | 1.2% |
| Federal Government Employees | 71 | 1.4% |
| Unpaid Family Workers | 0 | 0.0% |
| Total | 5,121 | 100.0% |
Employment Status by Age in Elsmere
According to the labor force statistics for Elsmere, out of the total population over 16 years of age (7,123), 77.6% or 5,527 individuals are in the labor force, with 5.8% or 321 of them unemployed. The age group with the highest labor force participation rate is 20 to 24 years, with 100.0% or 821 individuals in the labor force. Within the labor force, the 45 to 54 years age range has the highest percentage of unemployed individuals, with 13.2% or 101 of them being unemployed.
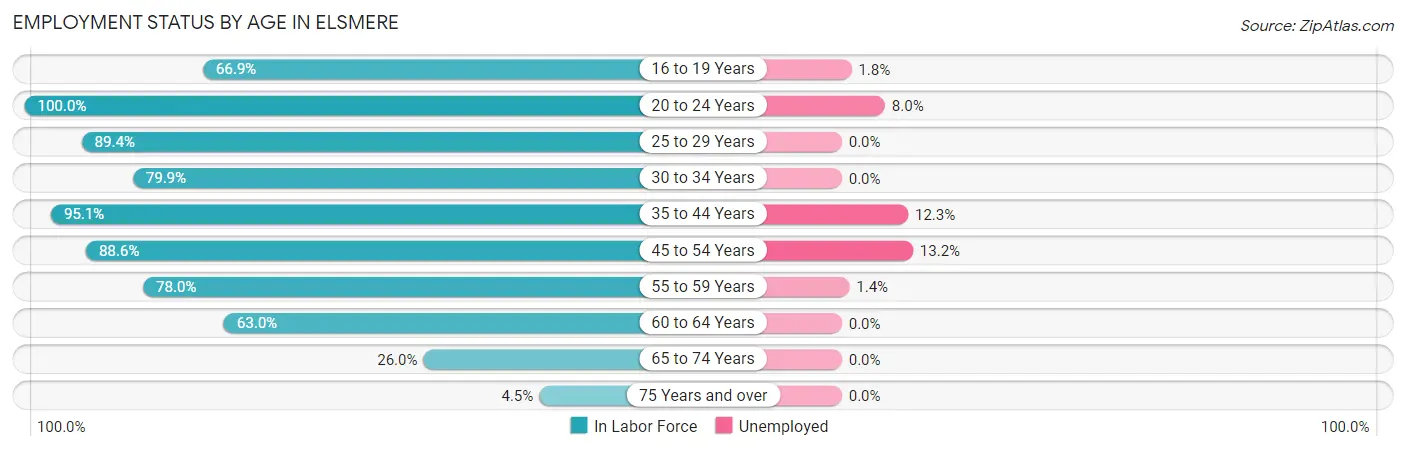
| Age Bracket | In Labor Force | Unemployed |
| 16 to 19 Years | 337 (66.9%) | 6 (1.8%) |
| 20 to 24 Years | 821 (100.0%) | 66 (8.0%) |
| 25 to 29 Years | 1,046 (89.4%) | 0 (0.0%) |
| 30 to 34 Years | 563 (79.9%) | 0 (0.0%) |
| 35 to 44 Years | 1,137 (95.1%) | 140 (12.3%) |
| 45 to 54 Years | 765 (88.6%) | 101 (13.2%) |
| 55 to 59 Years | 440 (78.0%) | 6 (1.4%) |
| 60 to 64 Years | 233 (63.0%) | 0 (0.0%) |
| 65 to 74 Years | 172 (26.0%) | 0 (0.0%) |
| 75 Years and over | 12 (4.5%) | 0 (0.0%) |
| Total | 5,527 (77.6%) | 321 (5.8%) |
Employment Status by Educational Attainment in Elsmere
According to labor force statistics for Elsmere, 85.9% of individuals (4,182) out of the total population between 25 and 64 years of age (4,868) are in the labor force, with 5.9% or 247 of them being unemployed. The group with the highest labor force participation rate are those with the educational attainment of bachelor's degree or higher, with 91.2% or 1,218 individuals in the labor force. Within the labor force, individuals with high school diploma education have the highest percentage of unemployment, with 8.9% or 122 of them being unemployed.
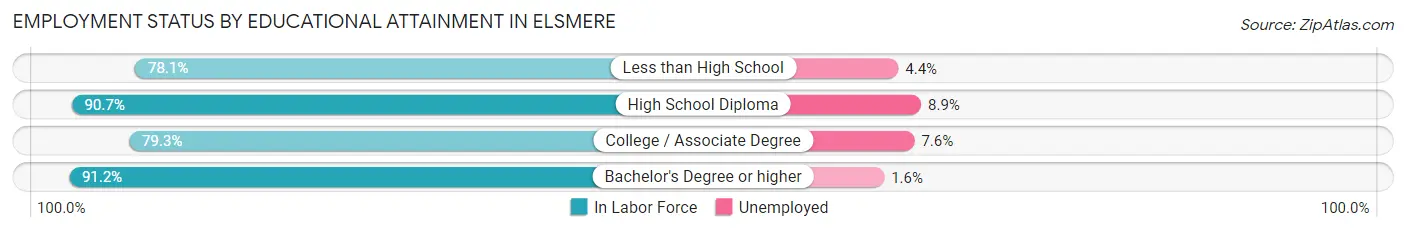
| Educational Attainment | In Labor Force | Unemployed |
| Less than High School | 503 (78.1%) | 28 (4.4%) |
| High School Diploma | 1,375 (90.7%) | 135 (8.9%) |
| College / Associate Degree | 1,089 (79.3%) | 104 (7.6%) |
| Bachelor's Degree or higher | 1,218 (91.2%) | 21 (1.6%) |
| Total | 4,182 (85.9%) | 287 (5.9%) |
Employment Occupations by Sex in Elsmere
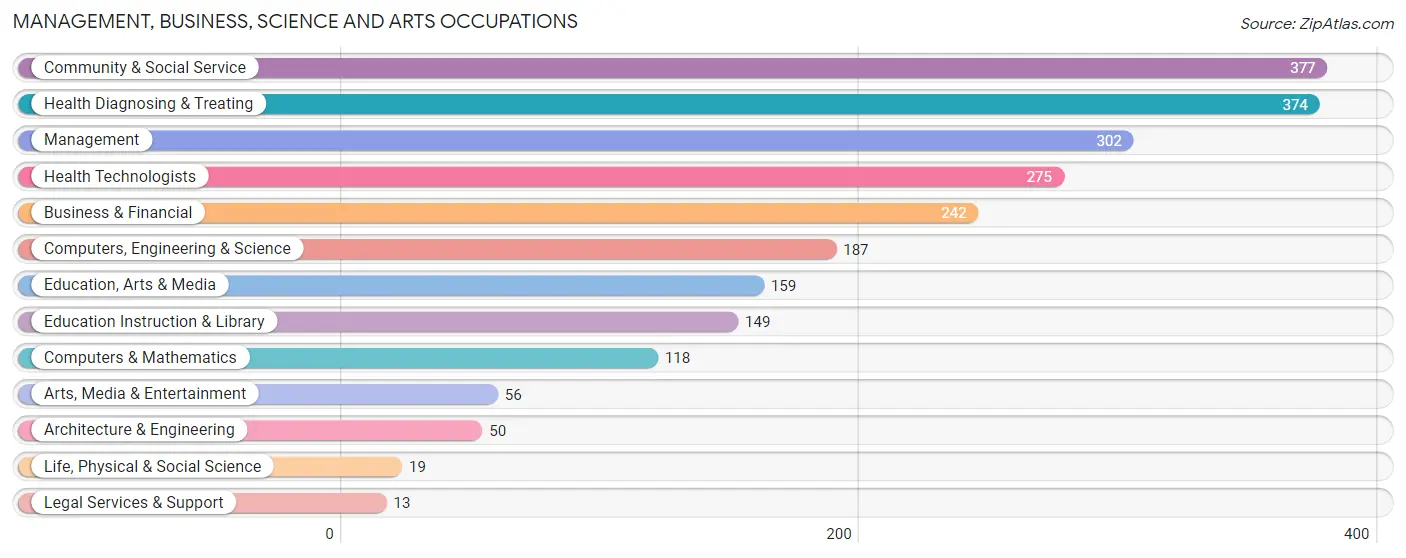
Management, Business, Science and Arts Occupations
The most common Management, Business, Science and Arts occupations in Elsmere are Community & Social Service (377 | 7.2%), Health Diagnosing & Treating (374 | 7.2%), Management (302 | 5.8%), Health Technologists (275 | 5.3%), and Business & Financial (242 | 4.6%).
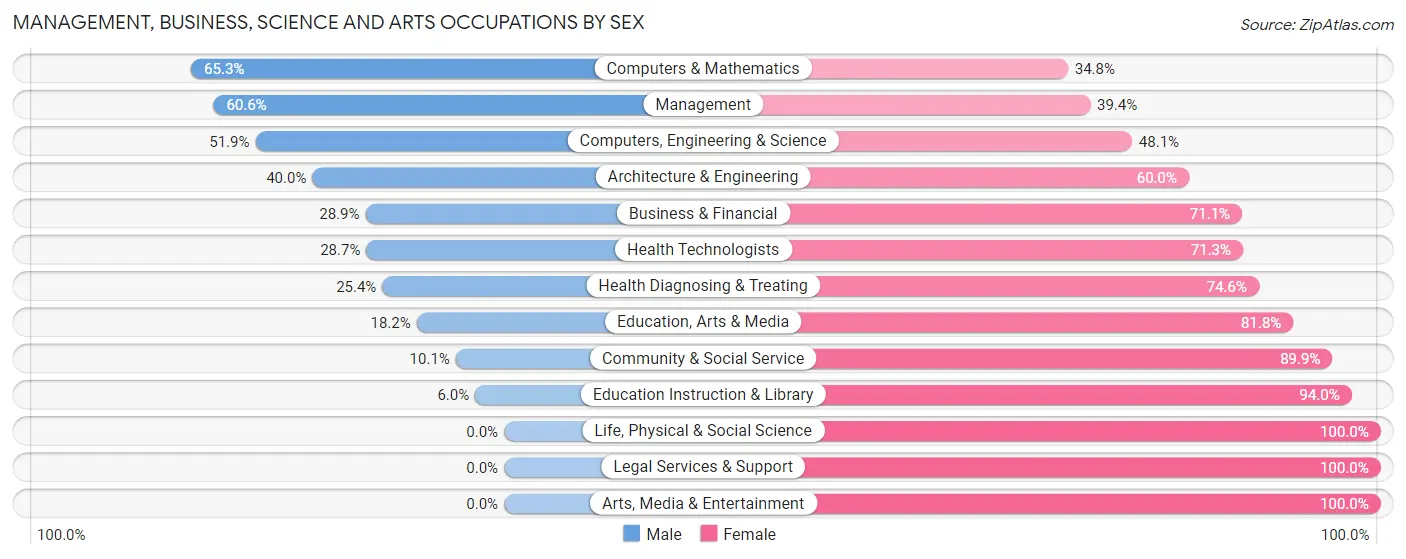
Management, Business, Science and Arts Occupations by Sex
Within the Management, Business, Science and Arts occupations in Elsmere, the most male-oriented occupations are Computers & Mathematics (65.2%), Management (60.6%), and Computers, Engineering & Science (51.9%), while the most female-oriented occupations are Life, Physical & Social Science (100.0%), Legal Services & Support (100.0%), and Arts, Media & Entertainment (100.0%).
| Occupation | Male | Female |
| Management | 183 (60.6%) | 119 (39.4%) |
| Business & Financial | 70 (28.9%) | 172 (71.1%) |
| Computers, Engineering & Science | 97 (51.9%) | 90 (48.1%) |
| Computers & Mathematics | 77 (65.2%) | 41 (34.7%) |
| Architecture & Engineering | 20 (40.0%) | 30 (60.0%) |
| Life, Physical & Social Science | 0 (0.0%) | 19 (100.0%) |
| Community & Social Service | 38 (10.1%) | 339 (89.9%) |
| Education, Arts & Media | 29 (18.2%) | 130 (81.8%) |
| Legal Services & Support | 0 (0.0%) | 13 (100.0%) |
| Education Instruction & Library | 9 (6.0%) | 140 (94.0%) |
| Arts, Media & Entertainment | 0 (0.0%) | 56 (100.0%) |
| Health Diagnosing & Treating | 95 (25.4%) | 279 (74.6%) |
| Health Technologists | 79 (28.7%) | 196 (71.3%) |
| Total (Category) | 483 (32.6%) | 999 (67.4%) |
| Total (Overall) | 2,681 (51.5%) | 2,526 (48.5%) |
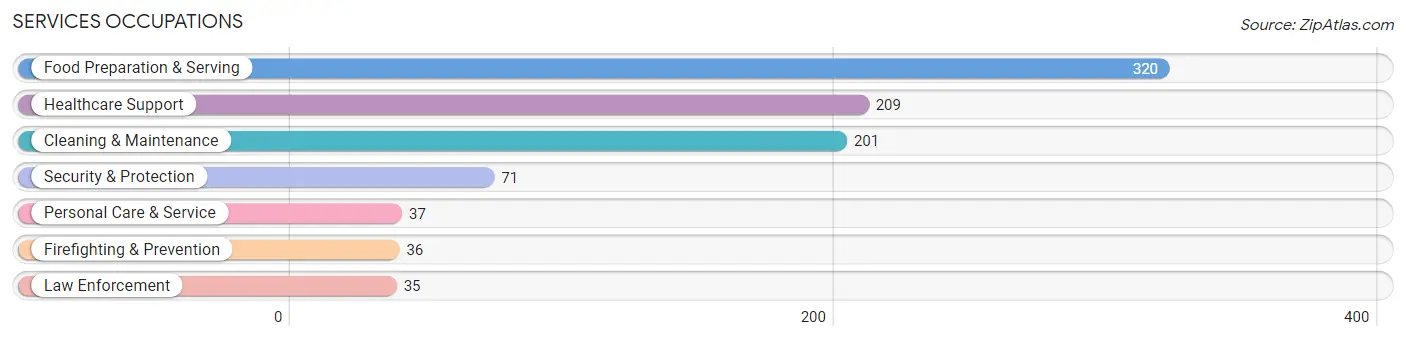
Services Occupations
The most common Services occupations in Elsmere are Food Preparation & Serving (320 | 6.1%), Healthcare Support (209 | 4.0%), Cleaning & Maintenance (201 | 3.9%), Security & Protection (71 | 1.4%), and Personal Care & Service (37 | 0.7%).
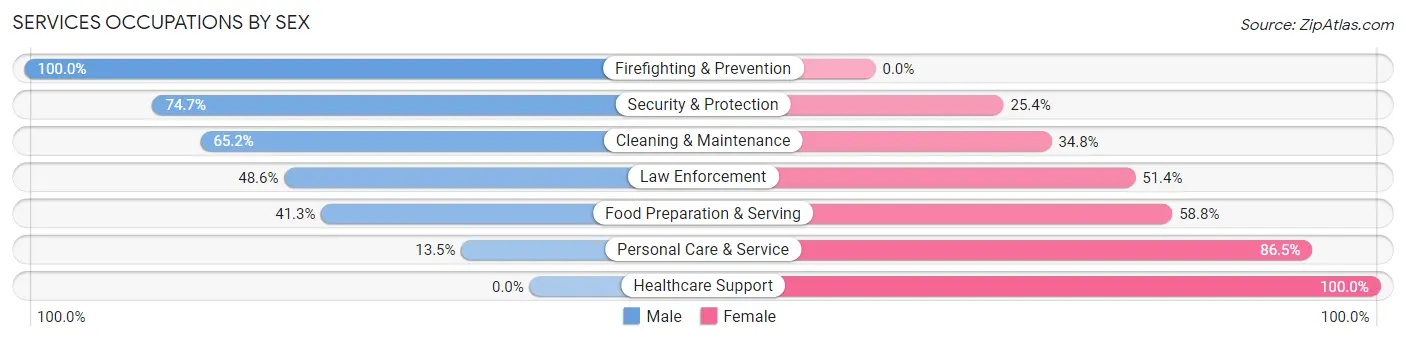
Services Occupations by Sex
Within the Services occupations in Elsmere, the most male-oriented occupations are Firefighting & Prevention (100.0%), Security & Protection (74.7%), and Cleaning & Maintenance (65.2%), while the most female-oriented occupations are Healthcare Support (100.0%), Personal Care & Service (86.5%), and Food Preparation & Serving (58.8%).
| Occupation | Male | Female |
| Healthcare Support | 0 (0.0%) | 209 (100.0%) |
| Security & Protection | 53 (74.7%) | 18 (25.4%) |
| Firefighting & Prevention | 36 (100.0%) | 0 (0.0%) |
| Law Enforcement | 17 (48.6%) | 18 (51.4%) |
| Food Preparation & Serving | 132 (41.2%) | 188 (58.8%) |
| Cleaning & Maintenance | 131 (65.2%) | 70 (34.8%) |
| Personal Care & Service | 5 (13.5%) | 32 (86.5%) |
| Total (Category) | 321 (38.3%) | 517 (61.7%) |
| Total (Overall) | 2,681 (51.5%) | 2,526 (48.5%) |
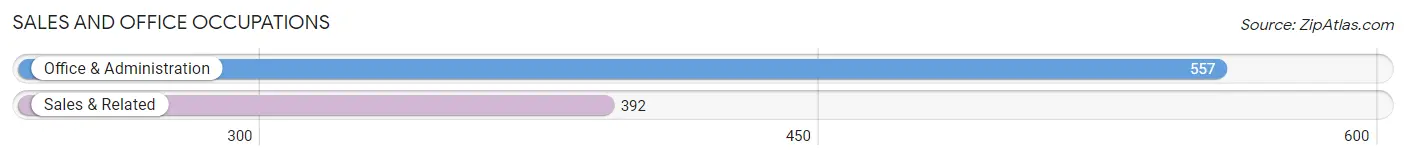
Sales and Office Occupations
The most common Sales and Office occupations in Elsmere are Office & Administration (557 | 10.7%), and Sales & Related (392 | 7.5%).
Sales and Office Occupations by Sex
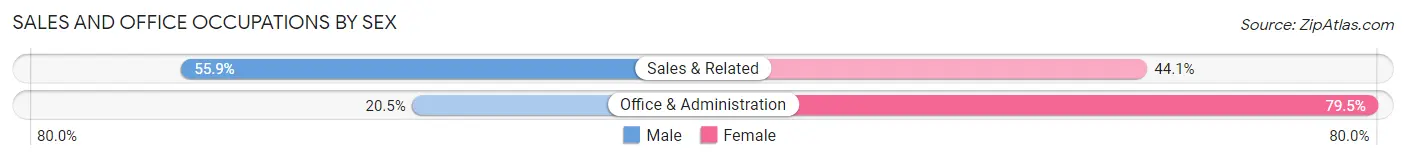
| Occupation | Male | Female |
| Sales & Related | 219 (55.9%) | 173 (44.1%) |
| Office & Administration | 114 (20.5%) | 443 (79.5%) |
| Total (Category) | 333 (35.1%) | 616 (64.9%) |
| Total (Overall) | 2,681 (51.5%) | 2,526 (48.5%) |
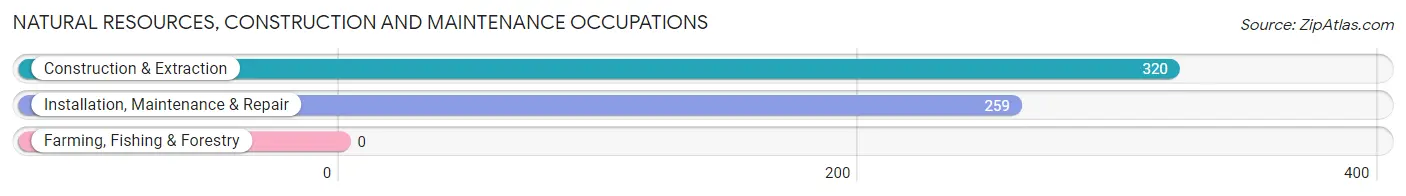
Natural Resources, Construction and Maintenance Occupations
The most common Natural Resources, Construction and Maintenance occupations in Elsmere are Construction & Extraction (320 | 6.1%), and Installation, Maintenance & Repair (259 | 5.0%).
Natural Resources, Construction and Maintenance Occupations by Sex
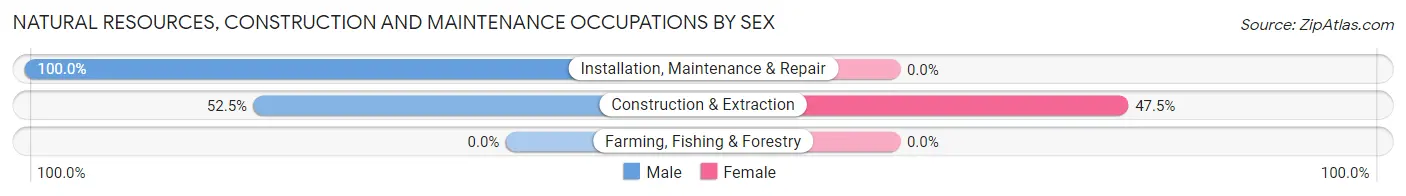
| Occupation | Male | Female |
| Farming, Fishing & Forestry | 0 (0.0%) | 0 (0.0%) |
| Construction & Extraction | 168 (52.5%) | 152 (47.5%) |
| Installation, Maintenance & Repair | 259 (100.0%) | 0 (0.0%) |
| Total (Category) | 427 (73.8%) | 152 (26.3%) |
| Total (Overall) | 2,681 (51.5%) | 2,526 (48.5%) |
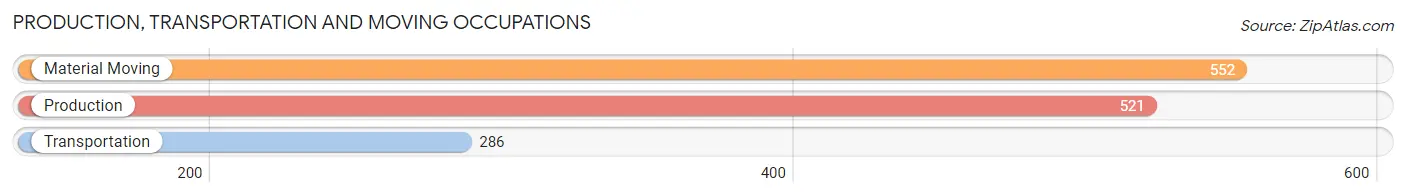
Production, Transportation and Moving Occupations
The most common Production, Transportation and Moving occupations in Elsmere are Material Moving (552 | 10.6%), Production (521 | 10.0%), and Transportation (286 | 5.5%).
Production, Transportation and Moving Occupations by Sex
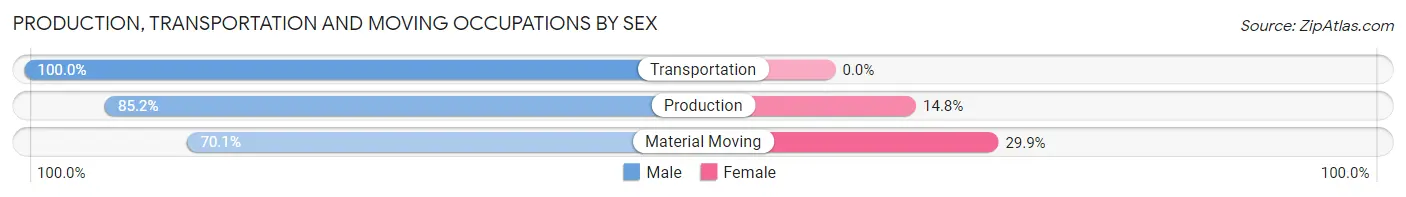
| Occupation | Male | Female |
| Production | 444 (85.2%) | 77 (14.8%) |
| Transportation | 286 (100.0%) | 0 (0.0%) |
| Material Moving | 387 (70.1%) | 165 (29.9%) |
| Total (Category) | 1,117 (82.2%) | 242 (17.8%) |
| Total (Overall) | 2,681 (51.5%) | 2,526 (48.5%) |
Employment Industries by Sex in Elsmere
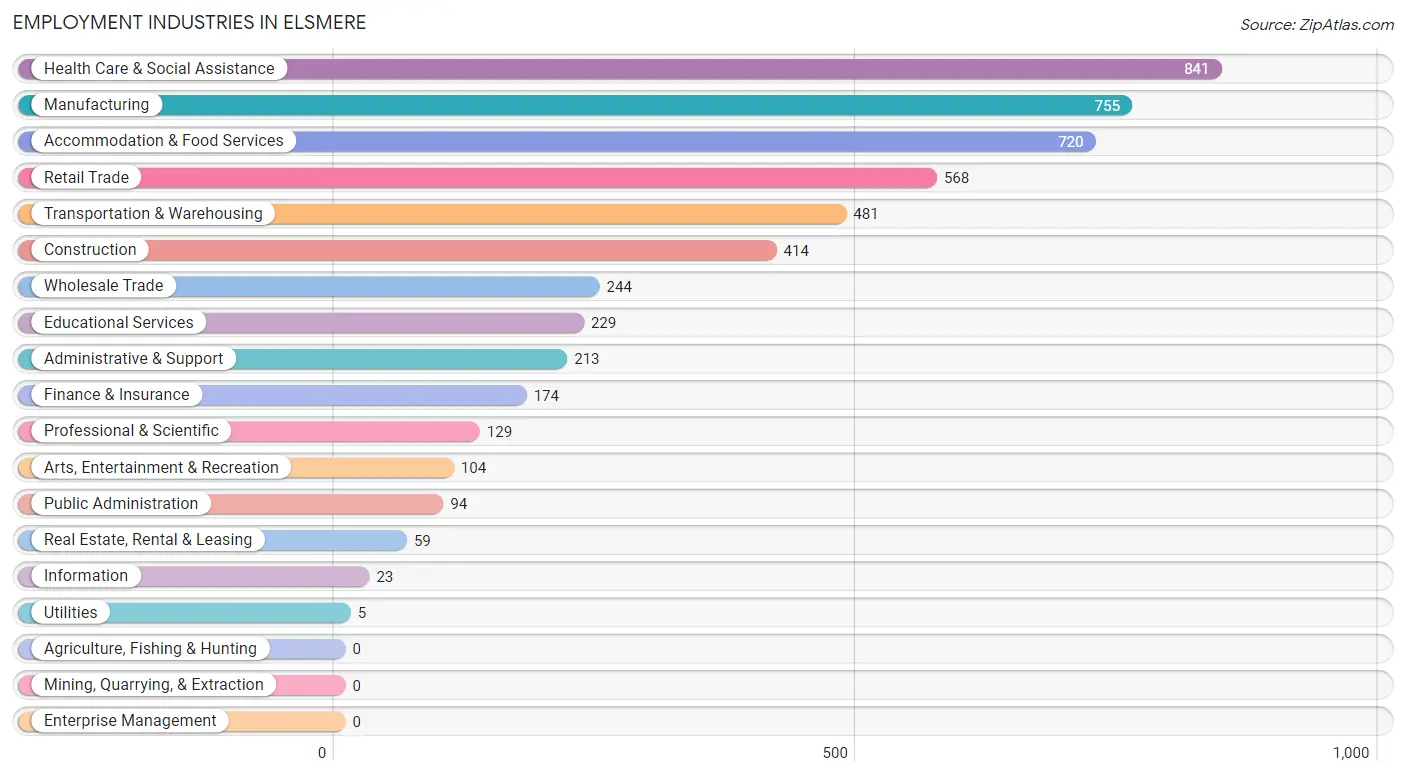
Employment Industries in Elsmere
The major employment industries in Elsmere include Health Care & Social Assistance (841 | 16.2%), Manufacturing (755 | 14.5%), Accommodation & Food Services (720 | 13.8%), Retail Trade (568 | 10.9%), and Transportation & Warehousing (481 | 9.2%).
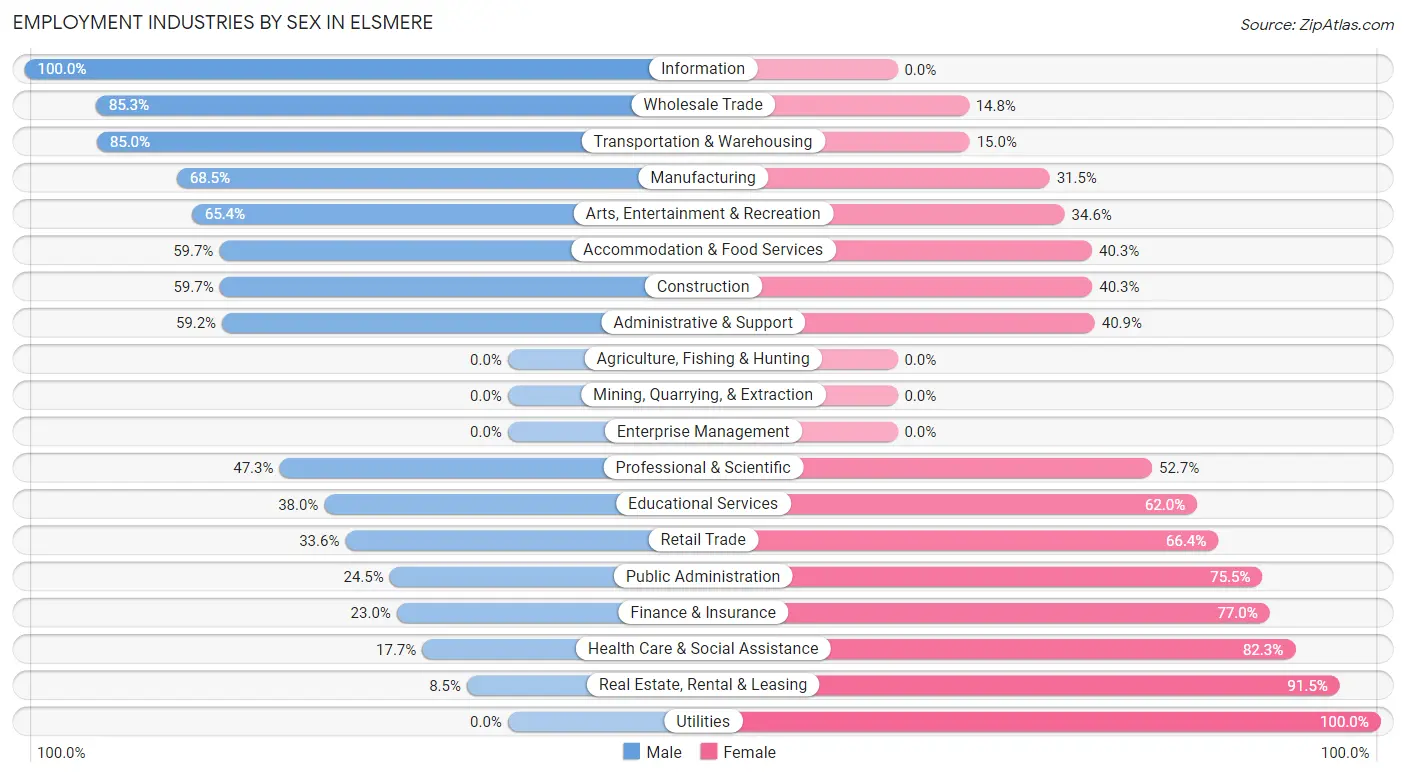
Employment Industries by Sex in Elsmere
The Elsmere industries that see more men than women are Information (100.0%), Wholesale Trade (85.3%), and Transportation & Warehousing (85.0%), whereas the industries that tend to have a higher number of women are Utilities (100.0%), Real Estate, Rental & Leasing (91.5%), and Health Care & Social Assistance (82.3%).
| Industry | Male | Female |
| Agriculture, Fishing & Hunting | 0 (0.0%) | 0 (0.0%) |
| Mining, Quarrying, & Extraction | 0 (0.0%) | 0 (0.0%) |
| Construction | 247 (59.7%) | 167 (40.3%) |
| Manufacturing | 517 (68.5%) | 238 (31.5%) |
| Wholesale Trade | 208 (85.3%) | 36 (14.7%) |
| Retail Trade | 191 (33.6%) | 377 (66.4%) |
| Transportation & Warehousing | 409 (85.0%) | 72 (15.0%) |
| Utilities | 0 (0.0%) | 5 (100.0%) |
| Information | 23 (100.0%) | 0 (0.0%) |
| Finance & Insurance | 40 (23.0%) | 134 (77.0%) |
| Real Estate, Rental & Leasing | 5 (8.5%) | 54 (91.5%) |
| Professional & Scientific | 61 (47.3%) | 68 (52.7%) |
| Enterprise Management | 0 (0.0%) | 0 (0.0%) |
| Administrative & Support | 126 (59.2%) | 87 (40.8%) |
| Educational Services | 87 (38.0%) | 142 (62.0%) |
| Health Care & Social Assistance | 149 (17.7%) | 692 (82.3%) |
| Arts, Entertainment & Recreation | 68 (65.4%) | 36 (34.6%) |
| Accommodation & Food Services | 430 (59.7%) | 290 (40.3%) |
| Public Administration | 23 (24.5%) | 71 (75.5%) |
| Total | 2,681 (51.5%) | 2,526 (48.5%) |
Education in Elsmere
School Enrollment in Elsmere
The most common levels of schooling among the 2,545 students in Elsmere are high school (579 | 22.8%), college / undergraduate (570 | 22.4%), and elementary school (468 | 18.4%).
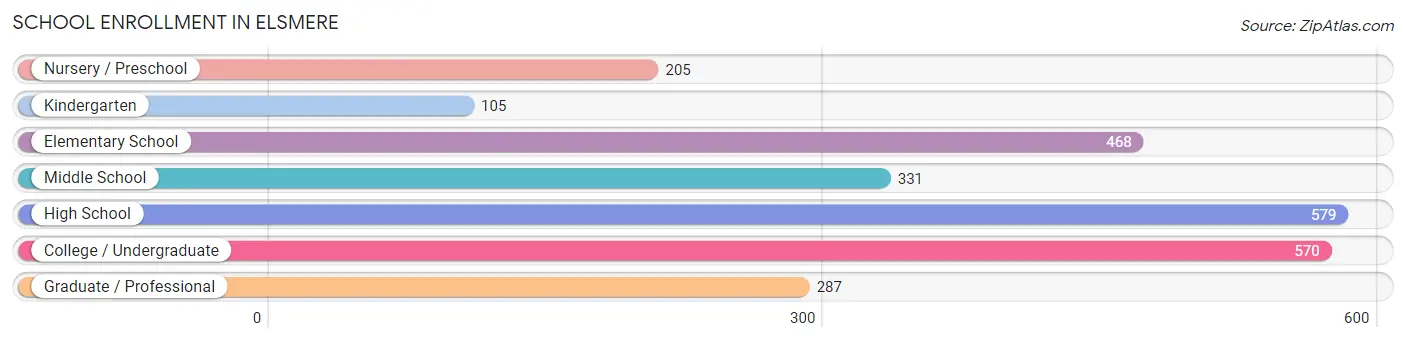
| School Level | # Students | % Students |
| Nursery / Preschool | 205 | 8.1% |
| Kindergarten | 105 | 4.1% |
| Elementary School | 468 | 18.4% |
| Middle School | 331 | 13.0% |
| High School | 579 | 22.8% |
| College / Undergraduate | 570 | 22.4% |
| Graduate / Professional | 287 | 11.3% |
| Total | 2,545 | 100.0% |
School Enrollment by Age by Funding Source in Elsmere
Out of a total of 2,545 students who are enrolled in schools in Elsmere, 336 (13.2%) attend a private institution, while the remaining 2,209 (86.8%) are enrolled in public schools. The age group of 3 to 4 year olds has the highest likelihood of being enrolled in private schools, with 86 (55.8% in the age bracket) enrolled. Conversely, the age group of 35 years and over has the lowest likelihood of being enrolled in a private school, with 70 (100.0% in the age bracket) attending a public institution.
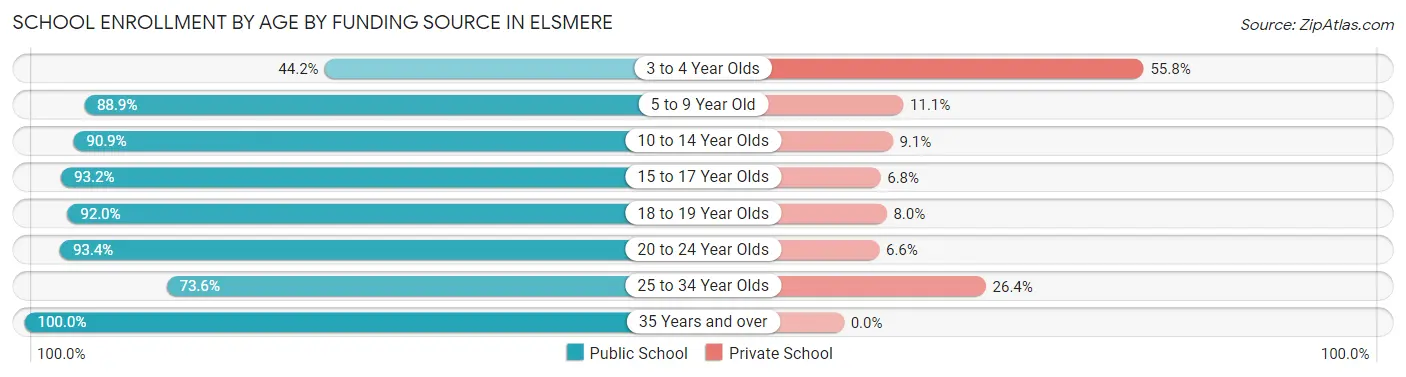
| Age Bracket | Public School | Private School |
| 3 to 4 Year Olds | 68 (44.2%) | 86 (55.8%) |
| 5 to 9 Year Old | 466 (88.9%) | 58 (11.1%) |
| 10 to 14 Year Olds | 440 (90.9%) | 44 (9.1%) |
| 15 to 17 Year Olds | 410 (93.2%) | 30 (6.8%) |
| 18 to 19 Year Olds | 127 (92.0%) | 11 (8.0%) |
| 20 to 24 Year Olds | 411 (93.4%) | 29 (6.6%) |
| 25 to 34 Year Olds | 217 (73.6%) | 78 (26.4%) |
| 35 Years and over | 70 (100.0%) | 0 (0.0%) |
| Total | 2,209 (86.8%) | 336 (13.2%) |
Educational Attainment by Field of Study in Elsmere
Arts & humanities (481 | 31.0%), business (240 | 15.5%), psychology (189 | 12.2%), science & technology (175 | 11.3%), and liberal arts & history (89 | 5.7%) are the most common fields of study among 1,552 individuals in Elsmere who have obtained a bachelor's degree or higher.
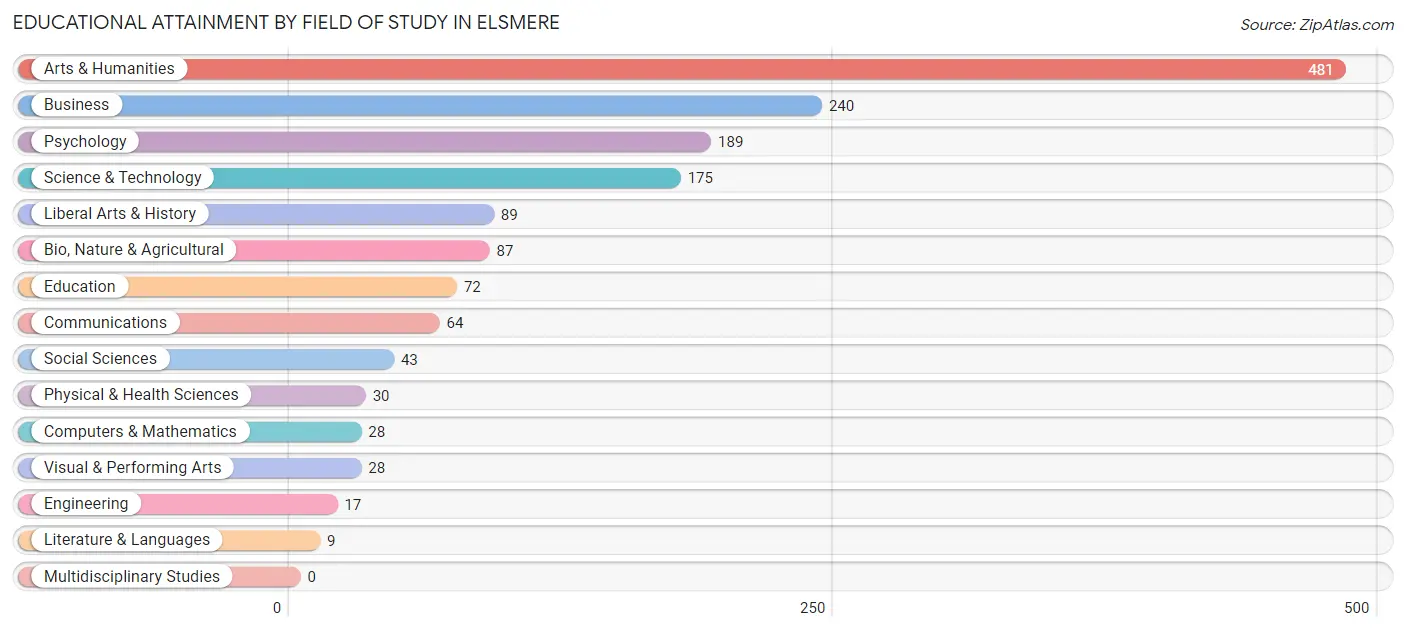
| Field of Study | # Graduates | % Graduates |
| Computers & Mathematics | 28 | 1.8% |
| Bio, Nature & Agricultural | 87 | 5.6% |
| Physical & Health Sciences | 30 | 1.9% |
| Psychology | 189 | 12.2% |
| Social Sciences | 43 | 2.8% |
| Engineering | 17 | 1.1% |
| Multidisciplinary Studies | 0 | 0.0% |
| Science & Technology | 175 | 11.3% |
| Business | 240 | 15.5% |
| Education | 72 | 4.6% |
| Literature & Languages | 9 | 0.6% |
| Liberal Arts & History | 89 | 5.7% |
| Visual & Performing Arts | 28 | 1.8% |
| Communications | 64 | 4.1% |
| Arts & Humanities | 481 | 31.0% |
| Total | 1,552 | 100.0% |
Transportation & Commute in Elsmere
Vehicle Availability by Sex in Elsmere
The most prevalent vehicle ownership categories in Elsmere are males with 2 vehicles (1,220, accounting for 45.5%) and females with 2 vehicles (908, making up 50.0%).
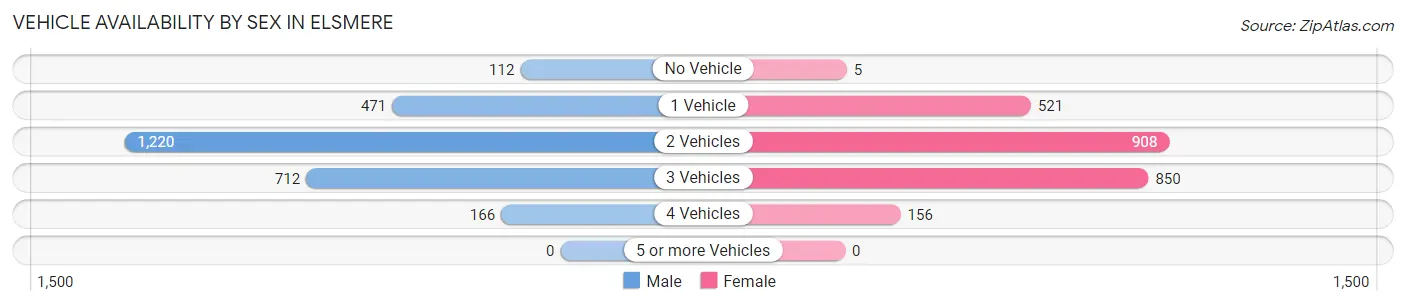
| Vehicles Available | Male | Female |
| No Vehicle | 112 (4.2%) | 5 (0.2%) |
| 1 Vehicle | 471 (17.6%) | 521 (21.3%) |
| 2 Vehicles | 1,220 (45.5%) | 908 (37.2%) |
| 3 Vehicles | 712 (26.6%) | 850 (34.8%) |
| 4 Vehicles | 166 (6.2%) | 156 (6.4%) |
| 5 or more Vehicles | 0 (0.0%) | 0 (0.0%) |
| Total | 2,681 (100.0%) | 2,440 (100.0%) |
Commute Time in Elsmere
The most frequently occuring commute durations in Elsmere are 10 to 14 minutes (1,586 commuters, 32.9%), 15 to 19 minutes (977 commuters, 20.3%), and 20 to 24 minutes (637 commuters, 13.2%).
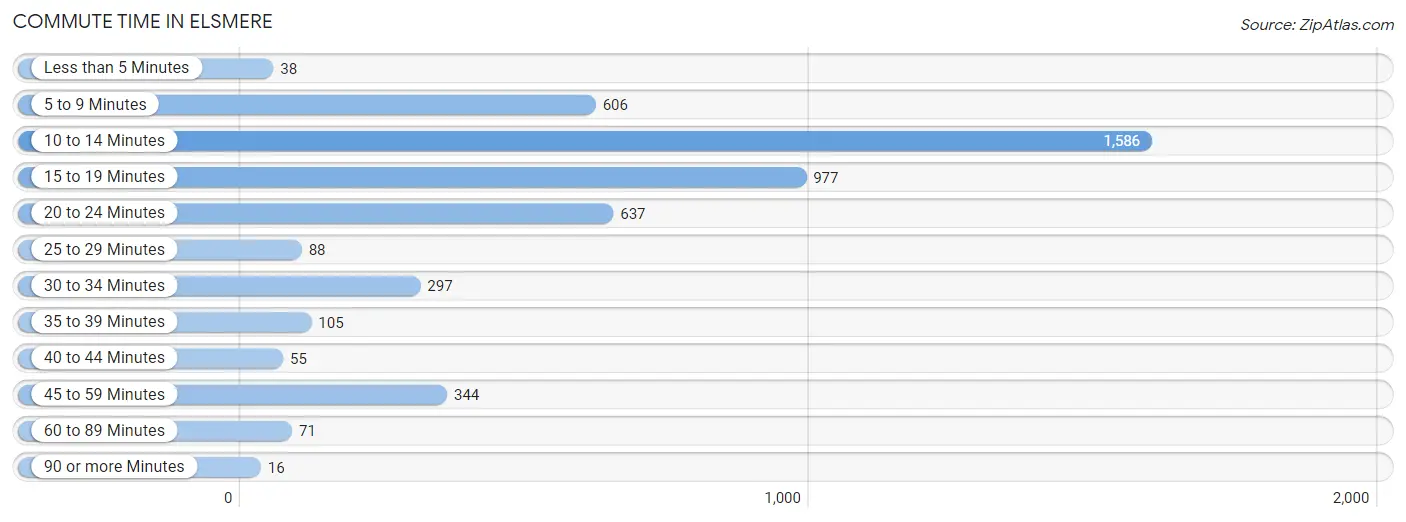
| Commute Time | # Commuters | % Commuters |
| Less than 5 Minutes | 38 | 0.8% |
| 5 to 9 Minutes | 606 | 12.6% |
| 10 to 14 Minutes | 1,586 | 32.9% |
| 15 to 19 Minutes | 977 | 20.3% |
| 20 to 24 Minutes | 637 | 13.2% |
| 25 to 29 Minutes | 88 | 1.8% |
| 30 to 34 Minutes | 297 | 6.2% |
| 35 to 39 Minutes | 105 | 2.2% |
| 40 to 44 Minutes | 55 | 1.1% |
| 45 to 59 Minutes | 344 | 7.1% |
| 60 to 89 Minutes | 71 | 1.5% |
| 90 or more Minutes | 16 | 0.3% |
Commute Time by Sex in Elsmere
The most common commute times in Elsmere are 10 to 14 minutes (782 commuters, 29.9%) for males and 10 to 14 minutes (804 commuters, 36.4%) for females.
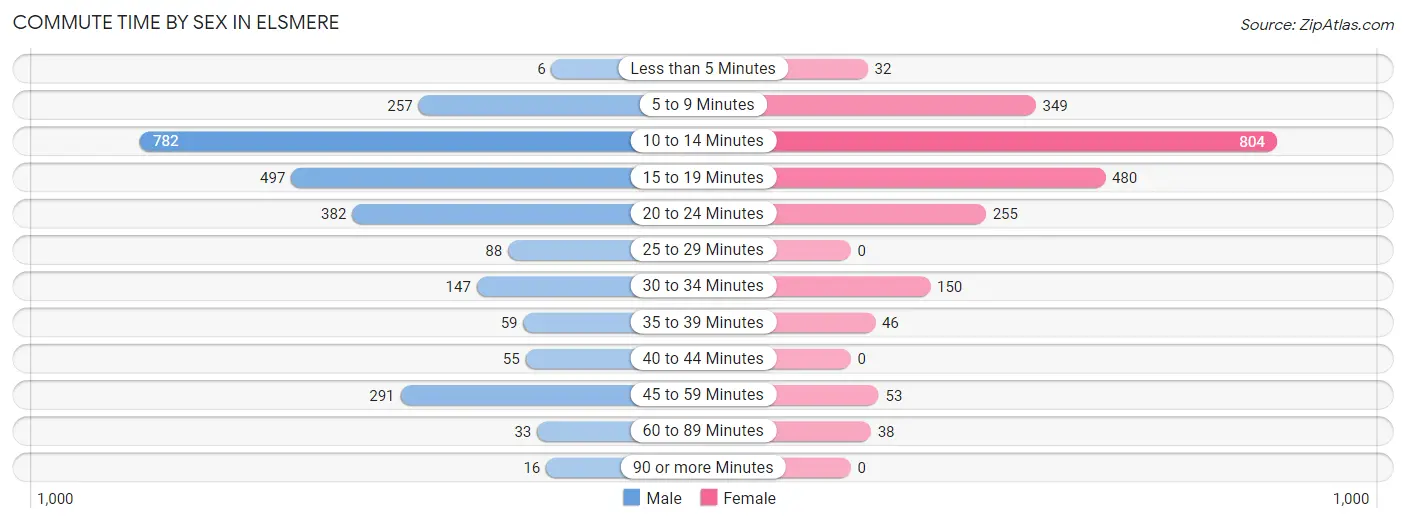
| Commute Time | Male | Female |
| Less than 5 Minutes | 6 (0.2%) | 32 (1.5%) |
| 5 to 9 Minutes | 257 (9.8%) | 349 (15.8%) |
| 10 to 14 Minutes | 782 (29.9%) | 804 (36.4%) |
| 15 to 19 Minutes | 497 (19.0%) | 480 (21.7%) |
| 20 to 24 Minutes | 382 (14.6%) | 255 (11.6%) |
| 25 to 29 Minutes | 88 (3.4%) | 0 (0.0%) |
| 30 to 34 Minutes | 147 (5.6%) | 150 (6.8%) |
| 35 to 39 Minutes | 59 (2.3%) | 46 (2.1%) |
| 40 to 44 Minutes | 55 (2.1%) | 0 (0.0%) |
| 45 to 59 Minutes | 291 (11.1%) | 53 (2.4%) |
| 60 to 89 Minutes | 33 (1.3%) | 38 (1.7%) |
| 90 or more Minutes | 16 (0.6%) | 0 (0.0%) |
Time of Departure to Work by Sex in Elsmere
The most frequent times of departure to work in Elsmere are 4:00 PM to 11:59 PM (543, 20.8%) for males and 7:30 AM to 7:59 AM (508, 23.0%) for females.
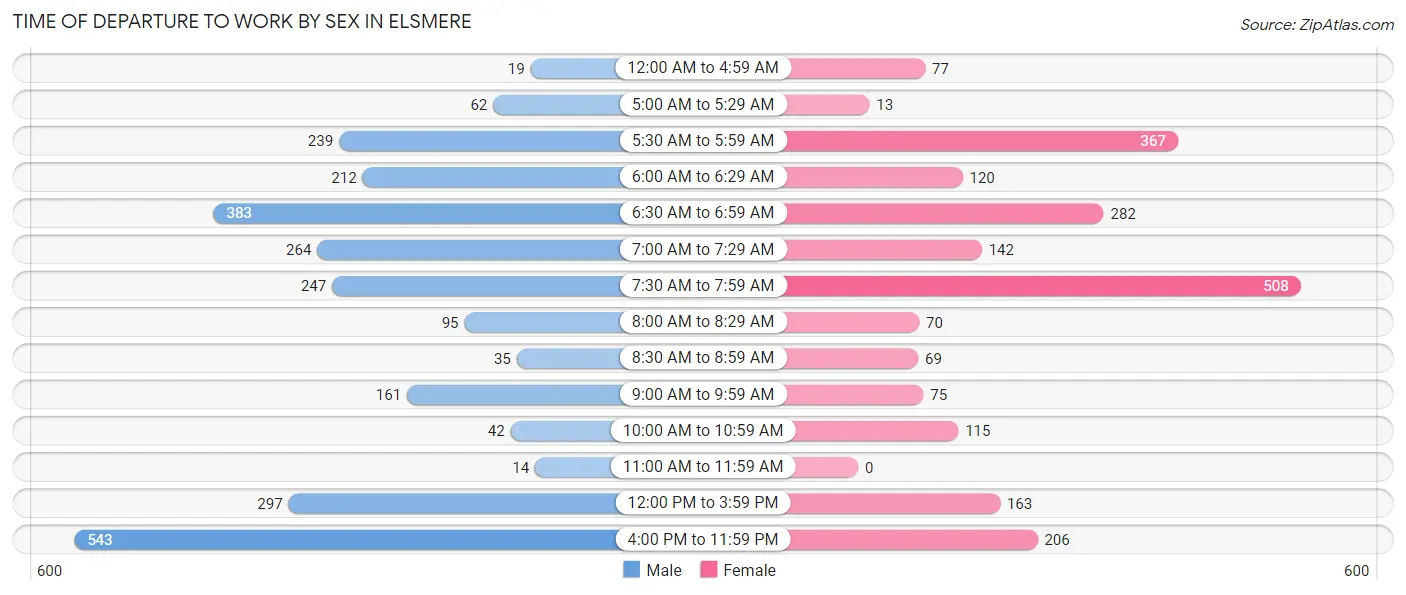
| Time of Departure | Male | Female |
| 12:00 AM to 4:59 AM | 19 (0.7%) | 77 (3.5%) |
| 5:00 AM to 5:29 AM | 62 (2.4%) | 13 (0.6%) |
| 5:30 AM to 5:59 AM | 239 (9.1%) | 367 (16.6%) |
| 6:00 AM to 6:29 AM | 212 (8.1%) | 120 (5.4%) |
| 6:30 AM to 6:59 AM | 383 (14.7%) | 282 (12.8%) |
| 7:00 AM to 7:29 AM | 264 (10.1%) | 142 (6.4%) |
| 7:30 AM to 7:59 AM | 247 (9.5%) | 508 (23.0%) |
| 8:00 AM to 8:29 AM | 95 (3.6%) | 70 (3.2%) |
| 8:30 AM to 8:59 AM | 35 (1.3%) | 69 (3.1%) |
| 9:00 AM to 9:59 AM | 161 (6.2%) | 75 (3.4%) |
| 10:00 AM to 10:59 AM | 42 (1.6%) | 115 (5.2%) |
| 11:00 AM to 11:59 AM | 14 (0.5%) | 0 (0.0%) |
| 12:00 PM to 3:59 PM | 297 (11.4%) | 163 (7.4%) |
| 4:00 PM to 11:59 PM | 543 (20.8%) | 206 (9.3%) |
| Total | 2,613 (100.0%) | 2,207 (100.0%) |
Housing Occupancy in Elsmere
Occupancy by Ownership in Elsmere
Of the total 3,271 dwellings in Elsmere, owner-occupied units account for 2,156 (65.9%), while renter-occupied units make up 1,115 (34.1%).
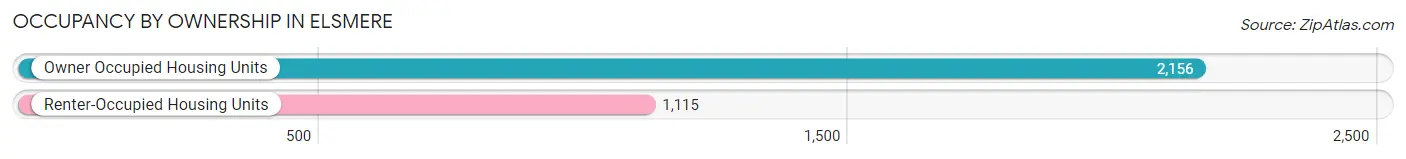
| Occupancy | # Housing Units | % Housing Units |
| Owner Occupied Housing Units | 2,156 | 65.9% |
| Renter-Occupied Housing Units | 1,115 | 34.1% |
| Total Occupied Housing Units | 3,271 | 100.0% |
Occupancy by Household Size in Elsmere
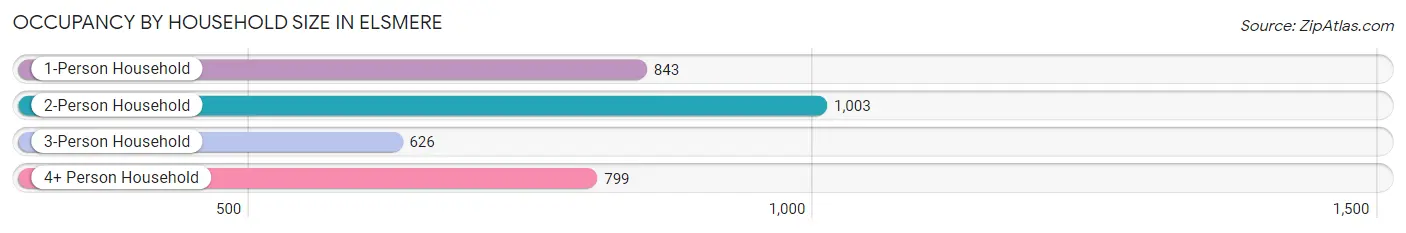
| Household Size | # Housing Units | % Housing Units |
| 1-Person Household | 843 | 25.8% |
| 2-Person Household | 1,003 | 30.7% |
| 3-Person Household | 626 | 19.1% |
| 4+ Person Household | 799 | 24.4% |
| Total Housing Units | 3,271 | 100.0% |
Occupancy by Ownership by Household Size in Elsmere
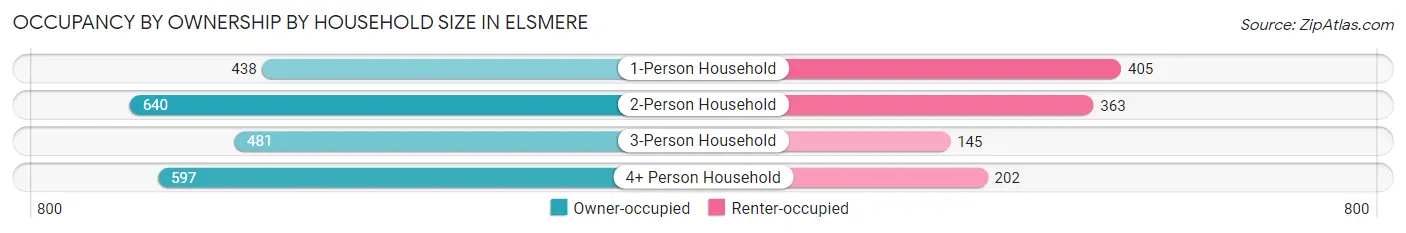
| Household Size | Owner-occupied | Renter-occupied |
| 1-Person Household | 438 (52.0%) | 405 (48.0%) |
| 2-Person Household | 640 (63.8%) | 363 (36.2%) |
| 3-Person Household | 481 (76.8%) | 145 (23.2%) |
| 4+ Person Household | 597 (74.7%) | 202 (25.3%) |
| Total Housing Units | 2,156 (65.9%) | 1,115 (34.1%) |
Occupancy by Educational Attainment in Elsmere
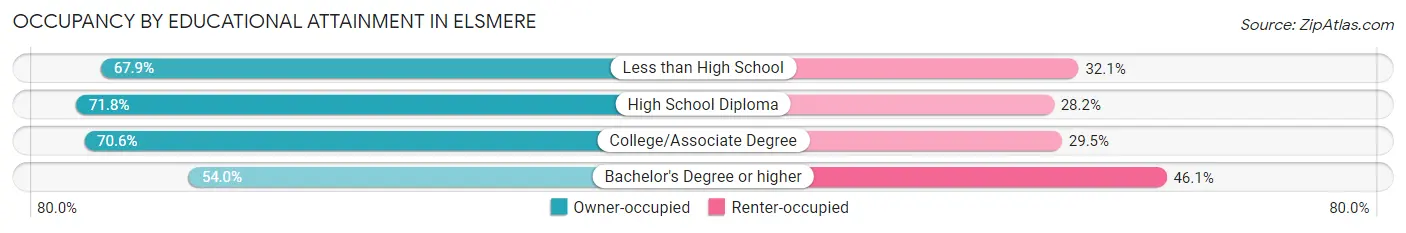
| Household Size | Owner-occupied | Renter-occupied |
| Less than High School | 218 (67.9%) | 103 (32.1%) |
| High School Diploma | 676 (71.8%) | 265 (28.2%) |
| College/Associate Degree | 757 (70.6%) | 316 (29.4%) |
| Bachelor's Degree or higher | 505 (53.9%) | 431 (46.1%) |
Occupancy by Age of Householder in Elsmere
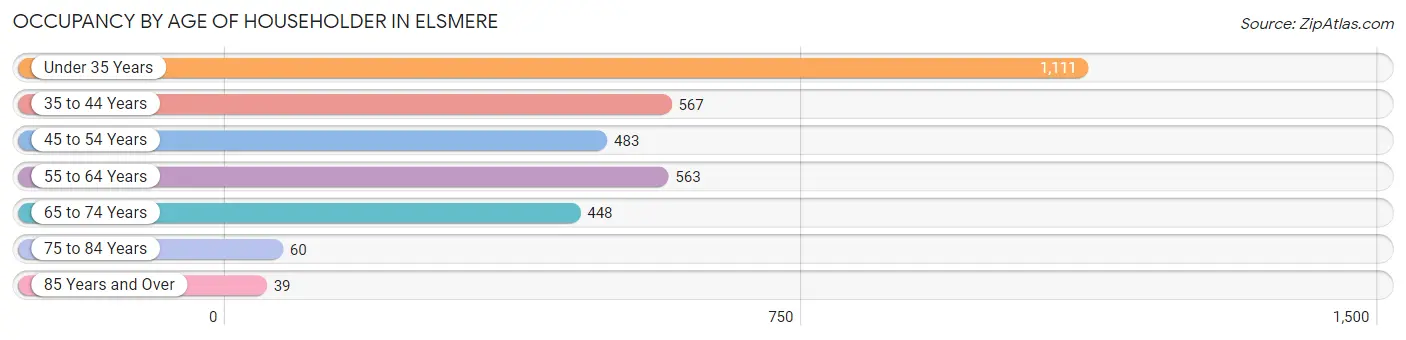
| Age Bracket | # Households | % Households |
| Under 35 Years | 1,111 | 34.0% |
| 35 to 44 Years | 567 | 17.3% |
| 45 to 54 Years | 483 | 14.8% |
| 55 to 64 Years | 563 | 17.2% |
| 65 to 74 Years | 448 | 13.7% |
| 75 to 84 Years | 60 | 1.8% |
| 85 Years and Over | 39 | 1.2% |
| Total | 3,271 | 100.0% |
Housing Finances in Elsmere
Median Income by Occupancy in Elsmere
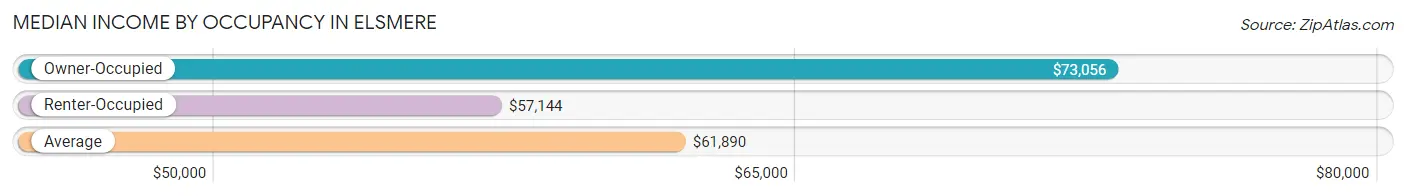
| Occupancy Type | # Households | Median Income |
| Owner-Occupied | 2,156 (65.9%) | $73,056 |
| Renter-Occupied | 1,115 (34.1%) | $57,144 |
| Average | 3,271 (100.0%) | $61,890 |
Occupancy by Householder Income Bracket in Elsmere
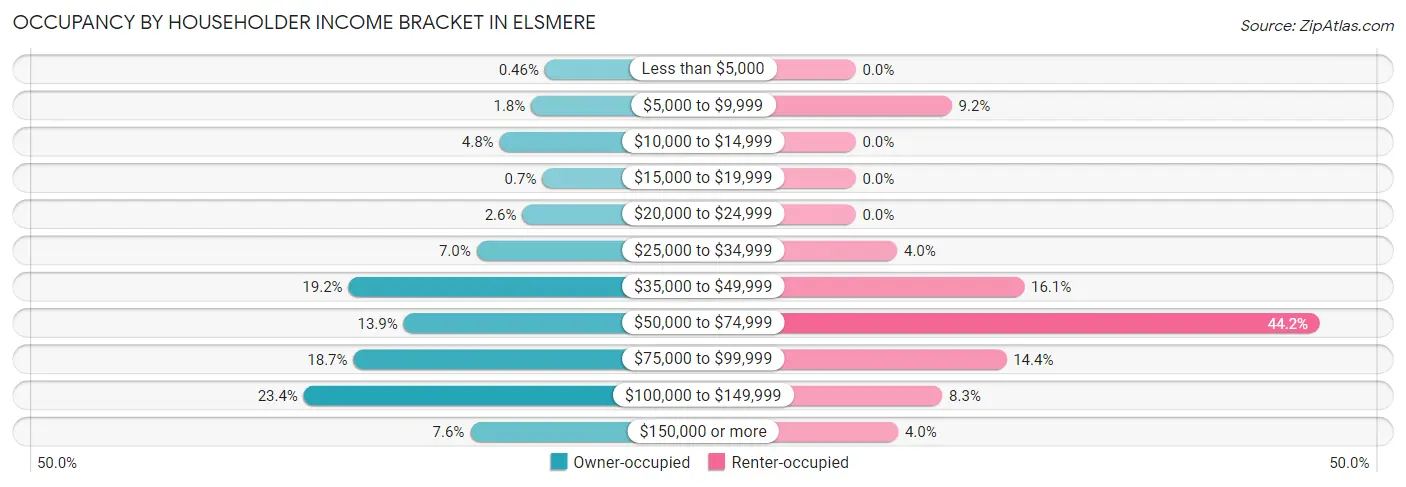
| Income Bracket | Owner-occupied | Renter-occupied |
| Less than $5,000 | 10 (0.5%) | 0 (0.0%) |
| $5,000 to $9,999 | 38 (1.8%) | 102 (9.1%) |
| $10,000 to $14,999 | 103 (4.8%) | 0 (0.0%) |
| $15,000 to $19,999 | 15 (0.7%) | 0 (0.0%) |
| $20,000 to $24,999 | 56 (2.6%) | 0 (0.0%) |
| $25,000 to $34,999 | 150 (7.0%) | 44 (4.0%) |
| $35,000 to $49,999 | 413 (19.2%) | 179 (16.1%) |
| $50,000 to $74,999 | 300 (13.9%) | 493 (44.2%) |
| $75,000 to $99,999 | 403 (18.7%) | 160 (14.3%) |
| $100,000 to $149,999 | 505 (23.4%) | 92 (8.3%) |
| $150,000 or more | 163 (7.6%) | 45 (4.0%) |
| Total | 2,156 (100.0%) | 1,115 (100.0%) |
Monthly Housing Cost Tiers in Elsmere
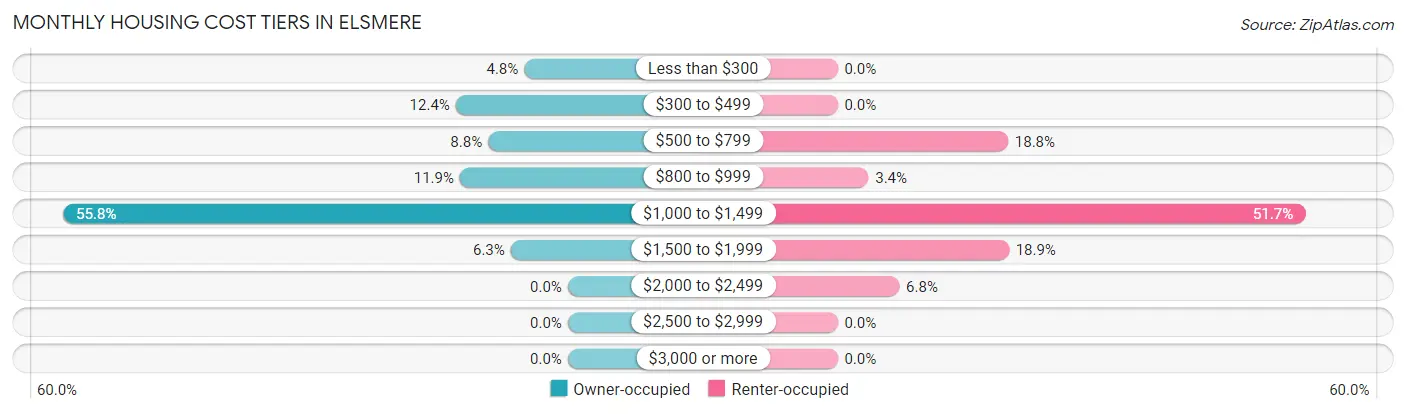
| Monthly Cost | Owner-occupied | Renter-occupied |
| Less than $300 | 104 (4.8%) | 0 (0.0%) |
| $300 to $499 | 267 (12.4%) | 0 (0.0%) |
| $500 to $799 | 190 (8.8%) | 210 (18.8%) |
| $800 to $999 | 257 (11.9%) | 38 (3.4%) |
| $1,000 to $1,499 | 1,202 (55.7%) | 576 (51.7%) |
| $1,500 to $1,999 | 136 (6.3%) | 211 (18.9%) |
| $2,000 to $2,499 | 0 (0.0%) | 76 (6.8%) |
| $2,500 to $2,999 | 0 (0.0%) | 0 (0.0%) |
| $3,000 or more | 0 (0.0%) | 0 (0.0%) |
| Total | 2,156 (100.0%) | 1,115 (100.0%) |
Physical Housing Characteristics in Elsmere
Housing Structures in Elsmere
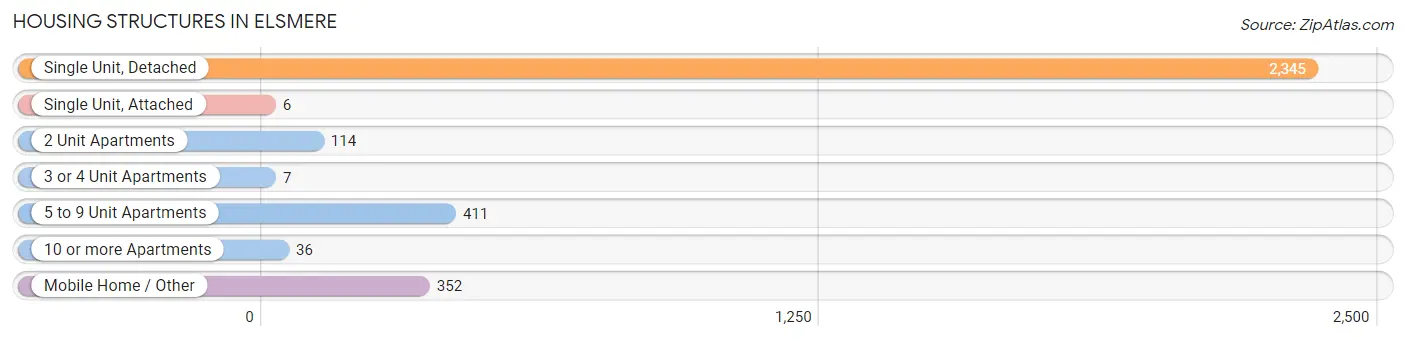
| Structure Type | # Housing Units | % Housing Units |
| Single Unit, Detached | 2,345 | 71.7% |
| Single Unit, Attached | 6 | 0.2% |
| 2 Unit Apartments | 114 | 3.5% |
| 3 or 4 Unit Apartments | 7 | 0.2% |
| 5 to 9 Unit Apartments | 411 | 12.6% |
| 10 or more Apartments | 36 | 1.1% |
| Mobile Home / Other | 352 | 10.8% |
| Total | 3,271 | 100.0% |
Housing Structures by Occupancy in Elsmere
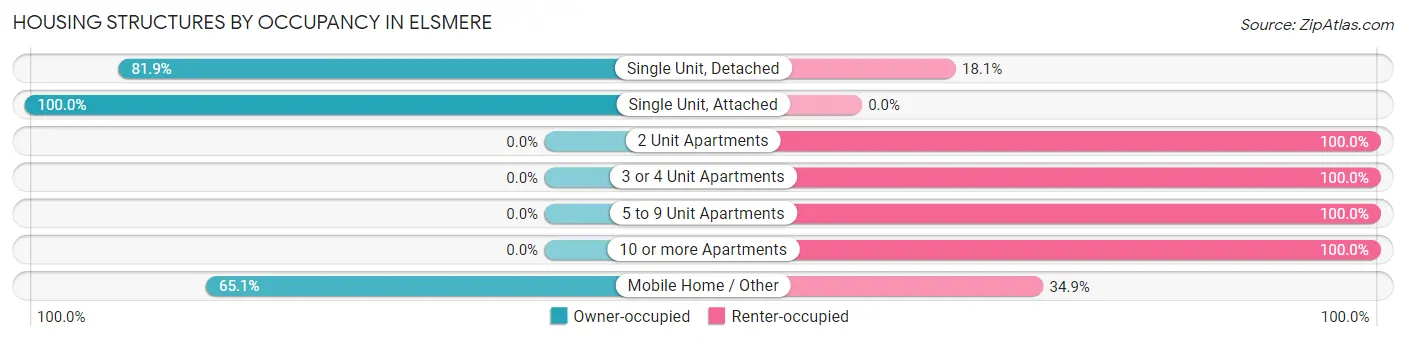
| Structure Type | Owner-occupied | Renter-occupied |
| Single Unit, Detached | 1,921 (81.9%) | 424 (18.1%) |
| Single Unit, Attached | 6 (100.0%) | 0 (0.0%) |
| 2 Unit Apartments | 0 (0.0%) | 114 (100.0%) |
| 3 or 4 Unit Apartments | 0 (0.0%) | 7 (100.0%) |
| 5 to 9 Unit Apartments | 0 (0.0%) | 411 (100.0%) |
| 10 or more Apartments | 0 (0.0%) | 36 (100.0%) |
| Mobile Home / Other | 229 (65.1%) | 123 (34.9%) |
| Total | 2,156 (65.9%) | 1,115 (34.1%) |
Housing Structures by Number of Rooms in Elsmere
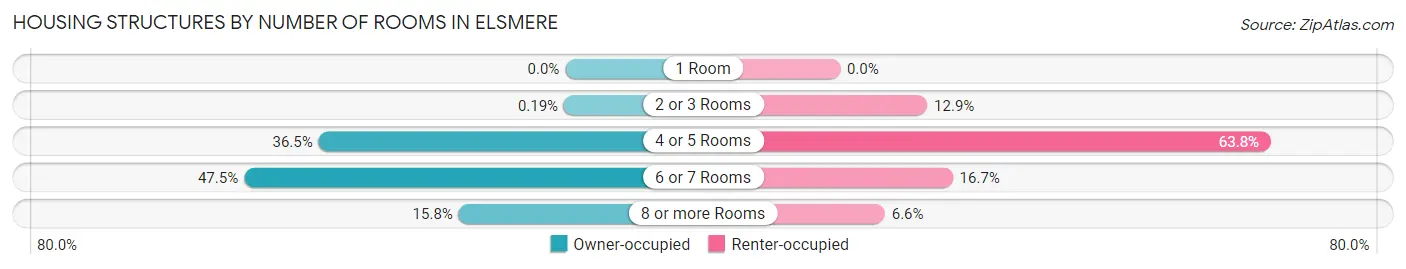
| Number of Rooms | Owner-occupied | Renter-occupied |
| 1 Room | 0 (0.0%) | 0 (0.0%) |
| 2 or 3 Rooms | 4 (0.2%) | 144 (12.9%) |
| 4 or 5 Rooms | 787 (36.5%) | 711 (63.8%) |
| 6 or 7 Rooms | 1,025 (47.5%) | 186 (16.7%) |
| 8 or more Rooms | 340 (15.8%) | 74 (6.6%) |
| Total | 2,156 (100.0%) | 1,115 (100.0%) |
Housing Structure by Heating Type in Elsmere
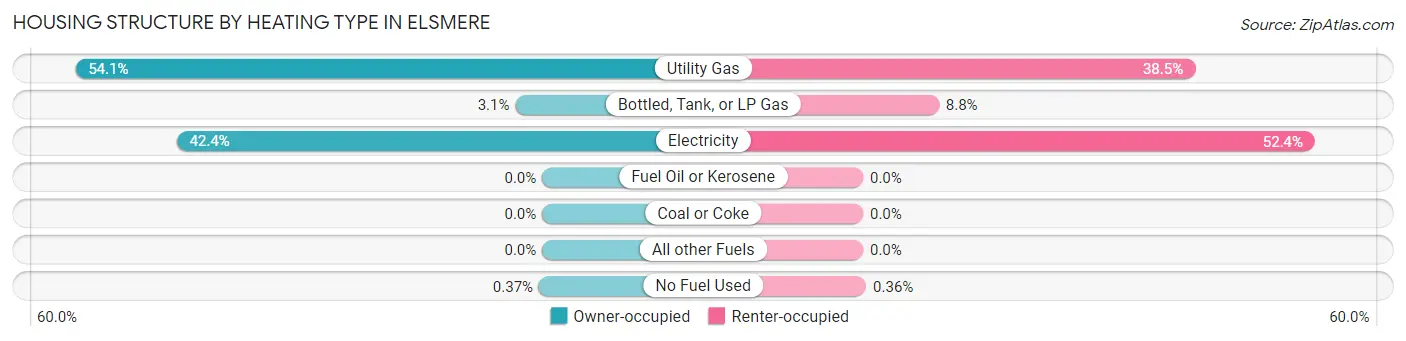
| Heating Type | Owner-occupied | Renter-occupied |
| Utility Gas | 1,167 (54.1%) | 429 (38.5%) |
| Bottled, Tank, or LP Gas | 67 (3.1%) | 98 (8.8%) |
| Electricity | 914 (42.4%) | 584 (52.4%) |
| Fuel Oil or Kerosene | 0 (0.0%) | 0 (0.0%) |
| Coal or Coke | 0 (0.0%) | 0 (0.0%) |
| All other Fuels | 0 (0.0%) | 0 (0.0%) |
| No Fuel Used | 8 (0.4%) | 4 (0.4%) |
| Total | 2,156 (100.0%) | 1,115 (100.0%) |
Household Vehicle Usage in Elsmere
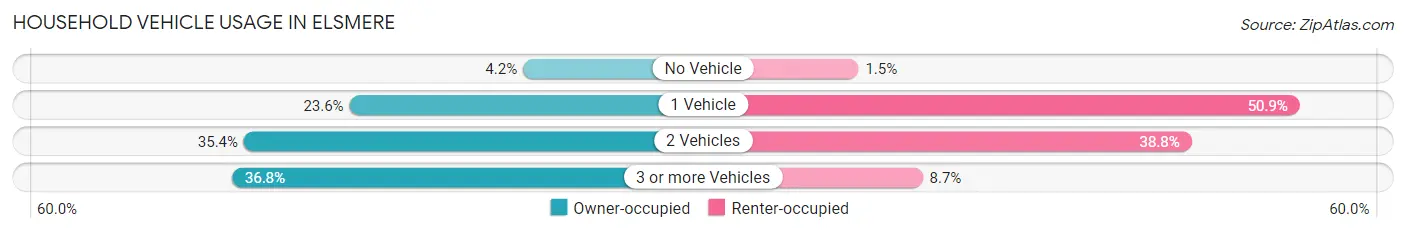
| Vehicles per Household | Owner-occupied | Renter-occupied |
| No Vehicle | 90 (4.2%) | 17 (1.5%) |
| 1 Vehicle | 509 (23.6%) | 568 (50.9%) |
| 2 Vehicles | 764 (35.4%) | 433 (38.8%) |
| 3 or more Vehicles | 793 (36.8%) | 97 (8.7%) |
| Total | 2,156 (100.0%) | 1,115 (100.0%) |
Real Estate & Mortgages in Elsmere
Real Estate and Mortgage Overview in Elsmere
| Characteristic | Without Mortgage | With Mortgage |
| Housing Units | 605 | 1,551 |
| Median Property Value | $126,200 | $153,200 |
| Median Household Income | $47,846 | $112 |
| Monthly Housing Costs | $447 | $0 |
| Real Estate Taxes | $1,204 | $40 |
Property Value by Mortgage Status in Elsmere
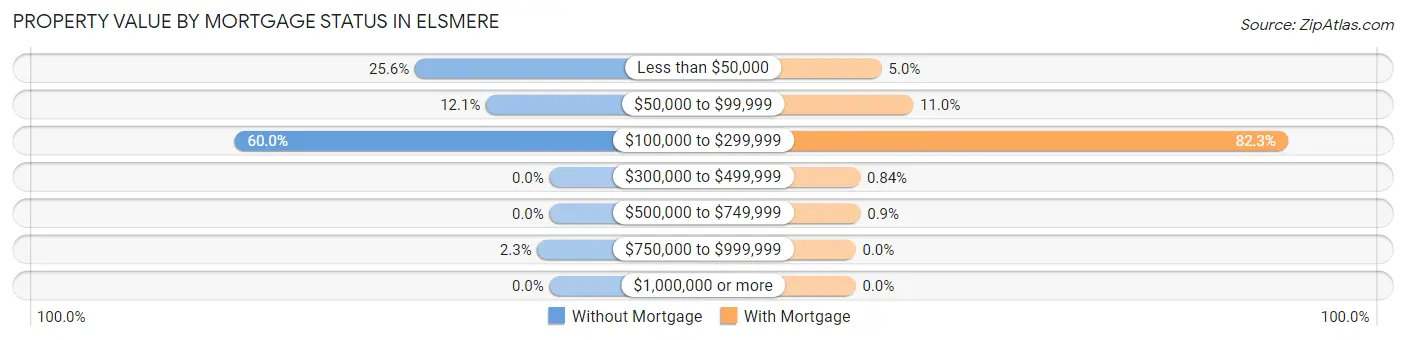
| Property Value | Without Mortgage | With Mortgage |
| Less than $50,000 | 155 (25.6%) | 77 (5.0%) |
| $50,000 to $99,999 | 73 (12.1%) | 170 (11.0%) |
| $100,000 to $299,999 | 363 (60.0%) | 1,277 (82.3%) |
| $300,000 to $499,999 | 0 (0.0%) | 13 (0.8%) |
| $500,000 to $749,999 | 0 (0.0%) | 14 (0.9%) |
| $750,000 to $999,999 | 14 (2.3%) | 0 (0.0%) |
| $1,000,000 or more | 0 (0.0%) | 0 (0.0%) |
| Total | 605 (100.0%) | 1,551 (100.0%) |
Household Income by Mortgage Status in Elsmere
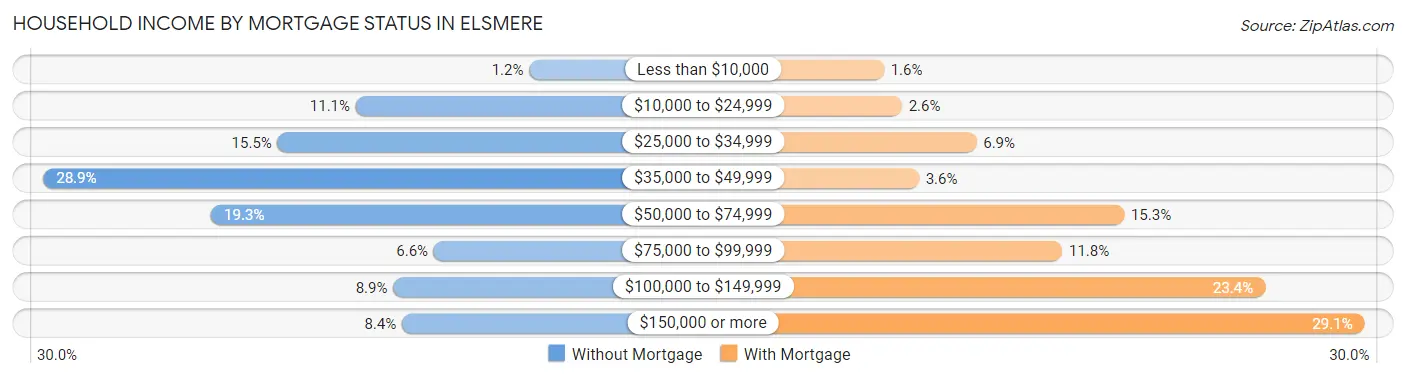
| Household Income | Without Mortgage | With Mortgage |
| Less than $10,000 | 7 (1.2%) | 25 (1.6%) |
| $10,000 to $24,999 | 67 (11.1%) | 41 (2.6%) |
| $25,000 to $34,999 | 94 (15.5%) | 107 (6.9%) |
| $35,000 to $49,999 | 175 (28.9%) | 56 (3.6%) |
| $50,000 to $74,999 | 117 (19.3%) | 238 (15.3%) |
| $75,000 to $99,999 | 40 (6.6%) | 183 (11.8%) |
| $100,000 to $149,999 | 54 (8.9%) | 363 (23.4%) |
| $150,000 or more | 51 (8.4%) | 451 (29.1%) |
| Total | 605 (100.0%) | 1,551 (100.0%) |
Property Value to Household Income Ratio in Elsmere
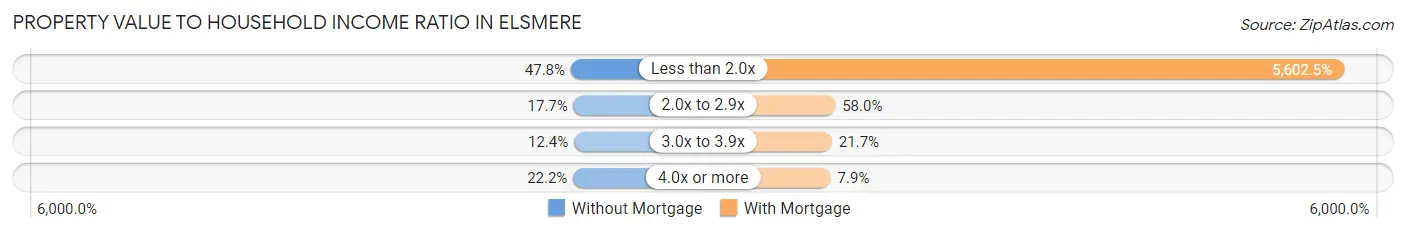
| Value-to-Income Ratio | Without Mortgage | With Mortgage |
| Less than 2.0x | 289 (47.8%) | 86,894 (5,602.5%) |
| 2.0x to 2.9x | 107 (17.7%) | 900 (58.0%) |
| 3.0x to 3.9x | 75 (12.4%) | 337 (21.7%) |
| 4.0x or more | 134 (22.2%) | 123 (7.9%) |
| Total | 605 (100.0%) | 1,551 (100.0%) |
Real Estate Taxes by Mortgage Status in Elsmere
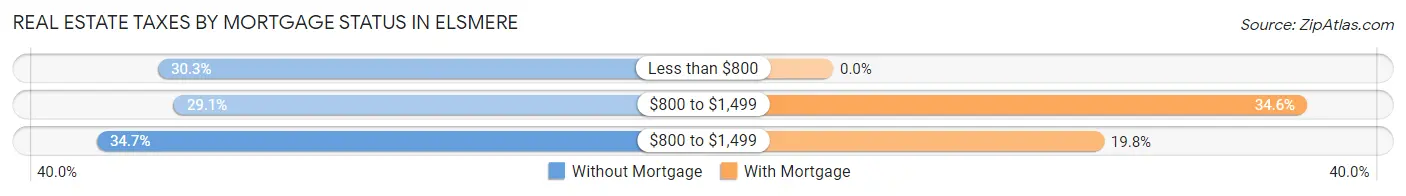
| Property Taxes | Without Mortgage | With Mortgage |
| Less than $800 | 183 (30.2%) | 0 (0.0%) |
| $800 to $1,499 | 176 (29.1%) | 537 (34.6%) |
| $800 to $1,499 | 210 (34.7%) | 307 (19.8%) |
| Total | 605 (100.0%) | 1,551 (100.0%) |
Health & Disability in Elsmere
Health Insurance Coverage by Age in Elsmere
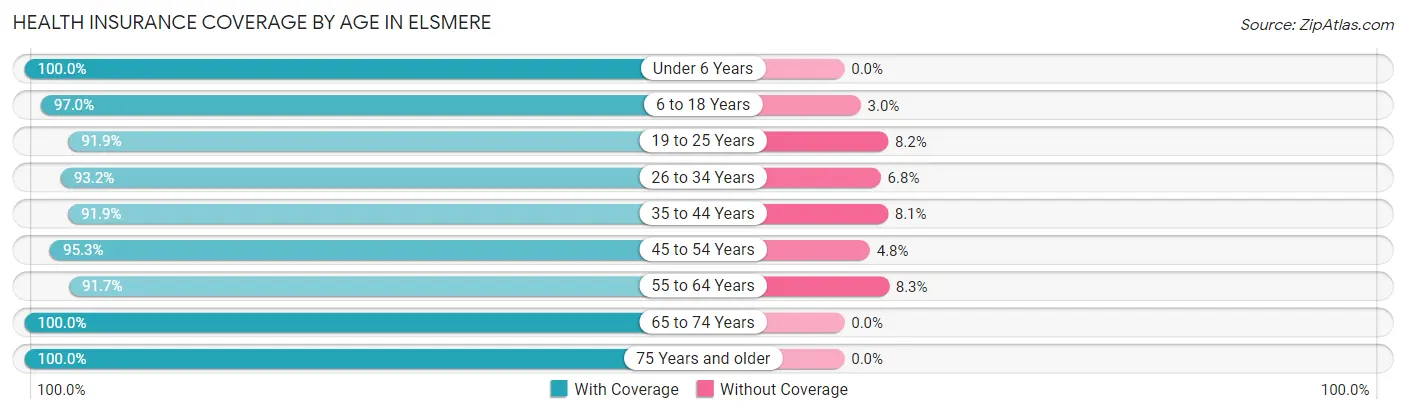
| Age Bracket | With Coverage | Without Coverage |
| Under 6 Years | 747 (100.0%) | 0 (0.0%) |
| 6 to 18 Years | 1,596 (97.0%) | 50 (3.0%) |
| 19 to 25 Years | 969 (91.8%) | 86 (8.2%) |
| 26 to 34 Years | 1,636 (93.2%) | 119 (6.8%) |
| 35 to 44 Years | 1,099 (91.9%) | 97 (8.1%) |
| 45 to 54 Years | 822 (95.3%) | 41 (4.8%) |
| 55 to 64 Years | 851 (91.7%) | 77 (8.3%) |
| 65 to 74 Years | 610 (100.0%) | 0 (0.0%) |
| 75 Years and older | 202 (100.0%) | 0 (0.0%) |
| Total | 8,532 (94.8%) | 470 (5.2%) |
Health Insurance Coverage by Citizenship Status in Elsmere
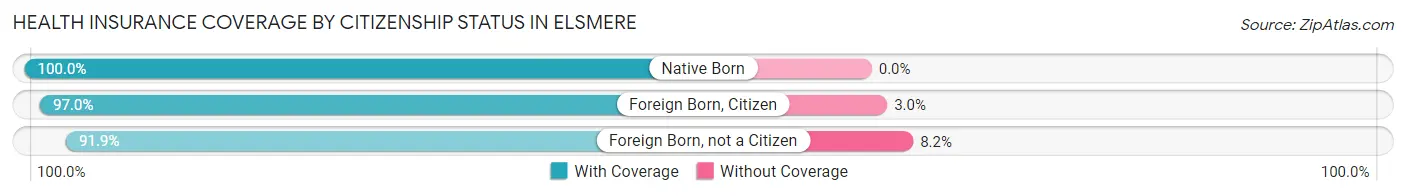
| Citizenship Status | With Coverage | Without Coverage |
| Native Born | 747 (100.0%) | 0 (0.0%) |
| Foreign Born, Citizen | 1,596 (97.0%) | 50 (3.0%) |
| Foreign Born, not a Citizen | 969 (91.8%) | 86 (8.2%) |
Health Insurance Coverage by Household Income in Elsmere
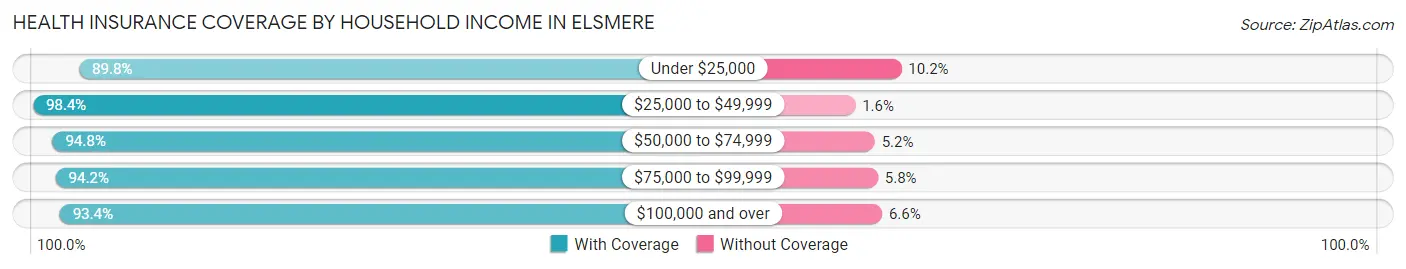
| Household Income | With Coverage | Without Coverage |
| Under $25,000 | 430 (89.8%) | 49 (10.2%) |
| $25,000 to $49,999 | 1,949 (98.4%) | 31 (1.6%) |
| $50,000 to $74,999 | 1,776 (94.8%) | 98 (5.2%) |
| $75,000 to $99,999 | 1,924 (94.2%) | 119 (5.8%) |
| $100,000 and over | 2,453 (93.4%) | 173 (6.6%) |
Public vs Private Health Insurance Coverage by Age in Elsmere
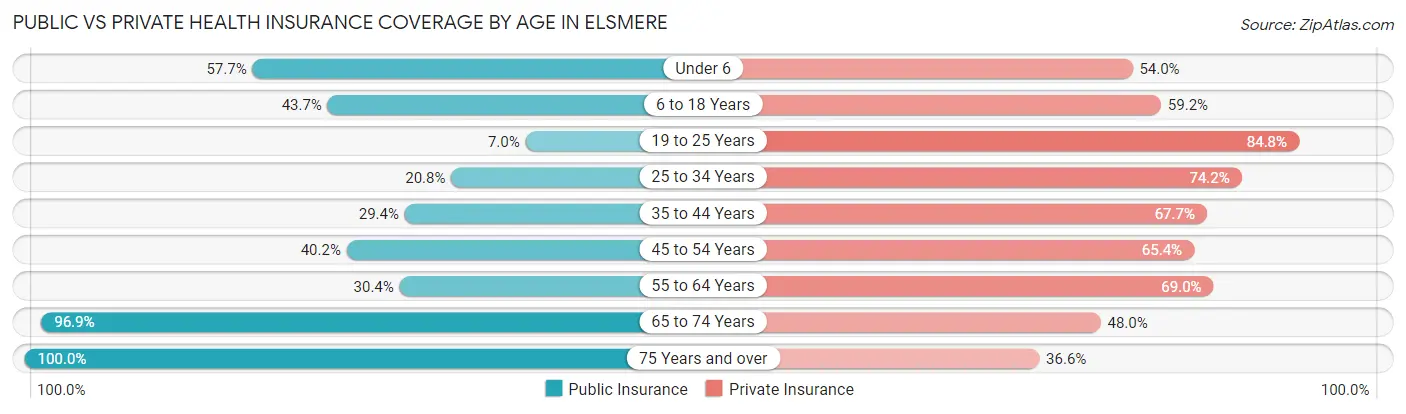
| Age Bracket | Public Insurance | Private Insurance |
| Under 6 | 431 (57.7%) | 403 (53.9%) |
| 6 to 18 Years | 720 (43.7%) | 975 (59.2%) |
| 19 to 25 Years | 74 (7.0%) | 895 (84.8%) |
| 25 to 34 Years | 365 (20.8%) | 1,302 (74.2%) |
| 35 to 44 Years | 352 (29.4%) | 810 (67.7%) |
| 45 to 54 Years | 347 (40.2%) | 564 (65.3%) |
| 55 to 64 Years | 282 (30.4%) | 640 (69.0%) |
| 65 to 74 Years | 591 (96.9%) | 293 (48.0%) |
| 75 Years and over | 202 (100.0%) | 74 (36.6%) |
| Total | 3,364 (37.4%) | 5,956 (66.2%) |
Disability Status by Sex by Age in Elsmere
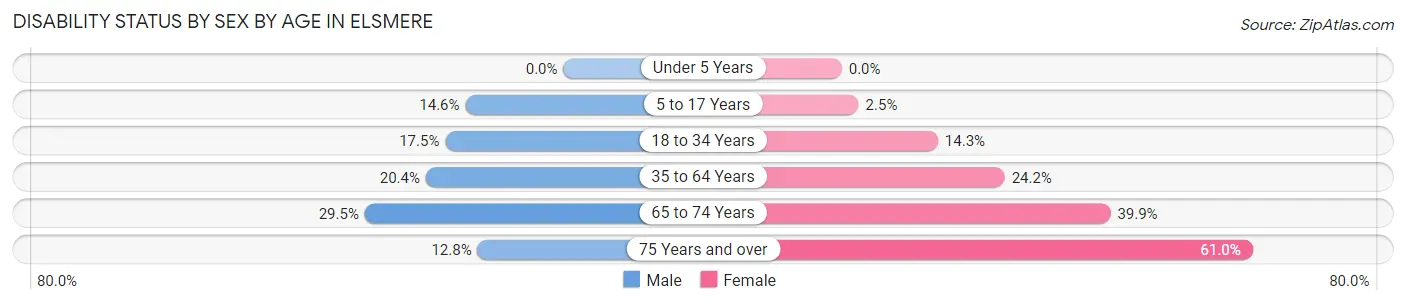
| Age Bracket | Male | Female |
| Under 5 Years | 0 (0.0%) | 0 (0.0%) |
| 5 to 17 Years | 139 (14.5%) | 18 (2.5%) |
| 18 to 34 Years | 237 (17.5%) | 218 (14.3%) |
| 35 to 64 Years | 296 (20.4%) | 372 (24.2%) |
| 65 to 74 Years | 69 (29.5%) | 150 (39.9%) |
| 75 Years and over | 13 (12.8%) | 61 (61.0%) |
Disability Class by Sex by Age in Elsmere
Disability Class: Hearing Difficulty
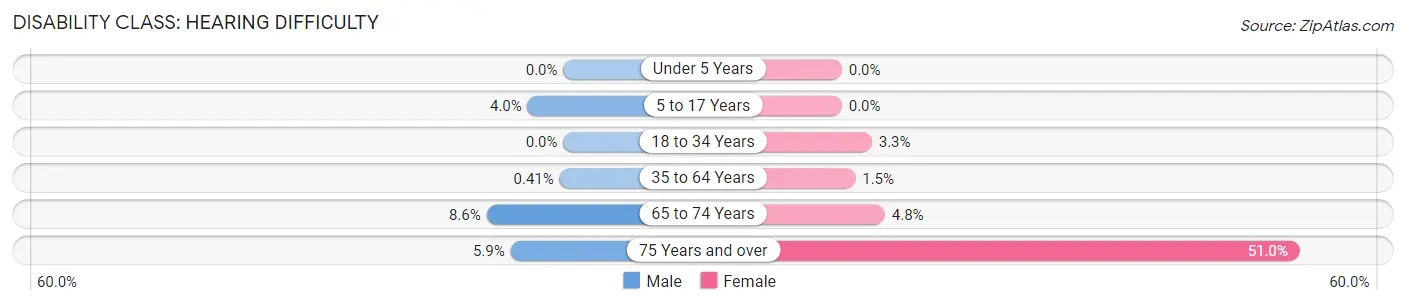
| Age Bracket | Male | Female |
| Under 5 Years | 0 (0.0%) | 0 (0.0%) |
| 5 to 17 Years | 38 (4.0%) | 0 (0.0%) |
| 18 to 34 Years | 0 (0.0%) | 51 (3.3%) |
| 35 to 64 Years | 6 (0.4%) | 23 (1.5%) |
| 65 to 74 Years | 20 (8.6%) | 18 (4.8%) |
| 75 Years and over | 6 (5.9%) | 51 (51.0%) |
Disability Class: Vision Difficulty
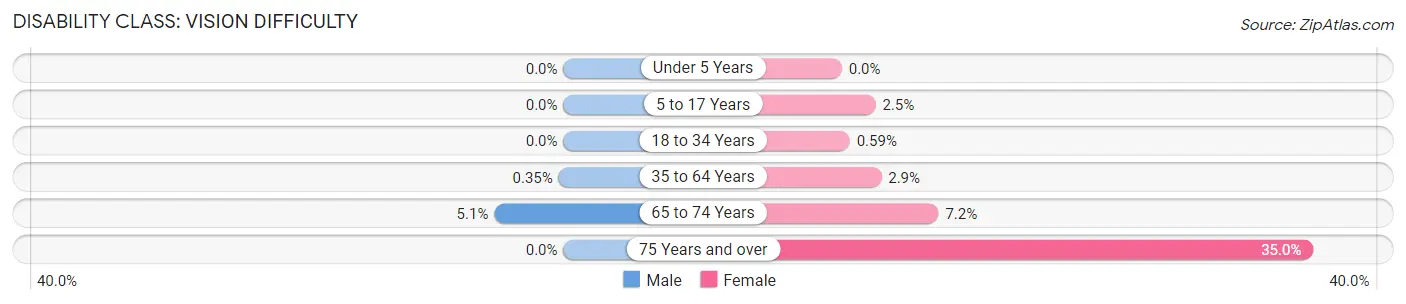
| Age Bracket | Male | Female |
| Under 5 Years | 0 (0.0%) | 0 (0.0%) |
| 5 to 17 Years | 0 (0.0%) | 18 (2.5%) |
| 18 to 34 Years | 0 (0.0%) | 9 (0.6%) |
| 35 to 64 Years | 5 (0.4%) | 45 (2.9%) |
| 65 to 74 Years | 12 (5.1%) | 27 (7.2%) |
| 75 Years and over | 0 (0.0%) | 35 (35.0%) |
Disability Class: Cognitive Difficulty
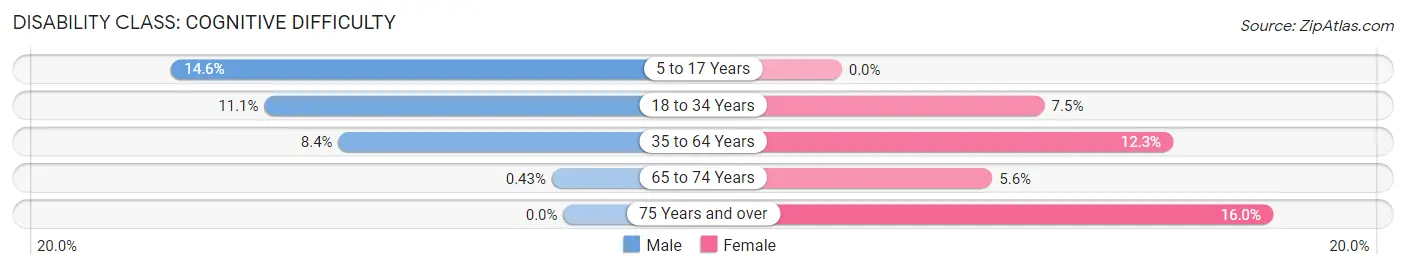
| Age Bracket | Male | Female |
| 5 to 17 Years | 139 (14.5%) | 0 (0.0%) |
| 18 to 34 Years | 150 (11.1%) | 115 (7.5%) |
| 35 to 64 Years | 121 (8.4%) | 189 (12.3%) |
| 65 to 74 Years | 1 (0.4%) | 21 (5.6%) |
| 75 Years and over | 0 (0.0%) | 16 (16.0%) |
Disability Class: Ambulatory Difficulty
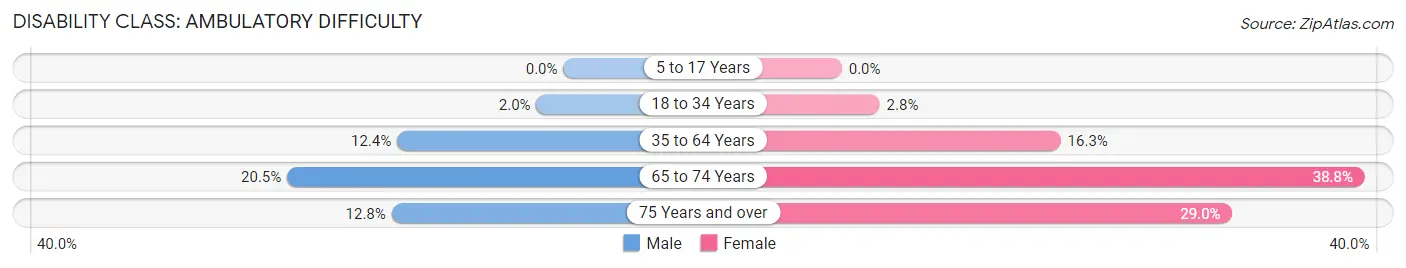
| Age Bracket | Male | Female |
| 5 to 17 Years | 0 (0.0%) | 0 (0.0%) |
| 18 to 34 Years | 27 (2.0%) | 43 (2.8%) |
| 35 to 64 Years | 179 (12.3%) | 250 (16.3%) |
| 65 to 74 Years | 48 (20.5%) | 146 (38.8%) |
| 75 Years and over | 13 (12.8%) | 29 (29.0%) |
Disability Class: Self-Care Difficulty
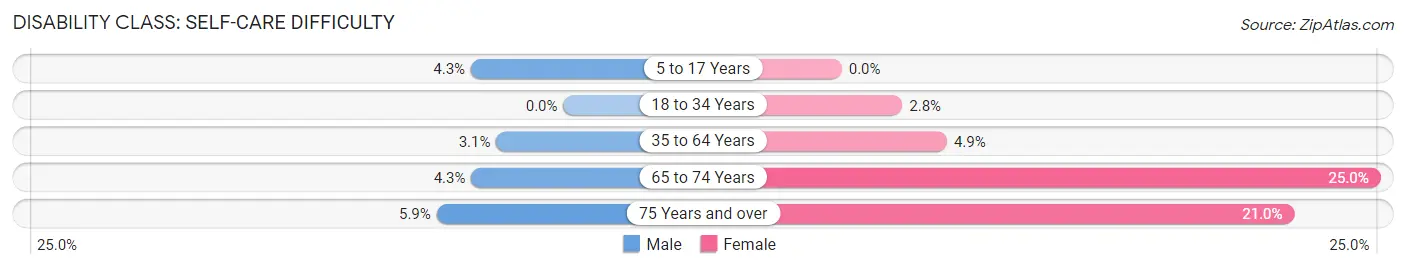
| Age Bracket | Male | Female |
| 5 to 17 Years | 41 (4.3%) | 0 (0.0%) |
| 18 to 34 Years | 0 (0.0%) | 43 (2.8%) |
| 35 to 64 Years | 45 (3.1%) | 75 (4.9%) |
| 65 to 74 Years | 10 (4.3%) | 94 (25.0%) |
| 75 Years and over | 6 (5.9%) | 21 (21.0%) |
Technology Access in Elsmere
Computing Device Access in Elsmere
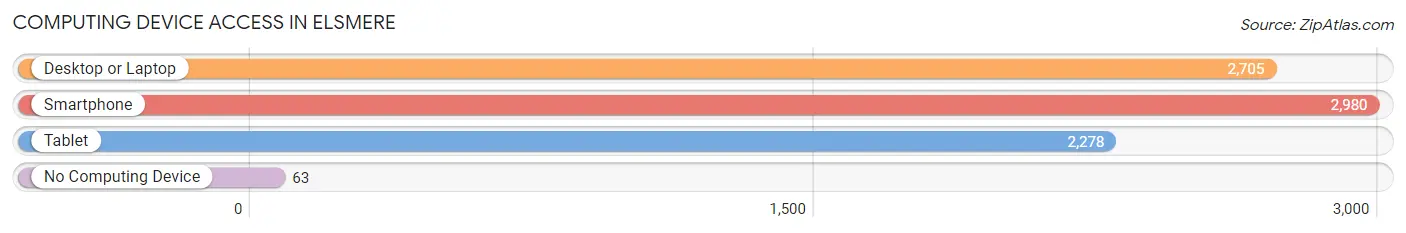
| Device Type | # Households | % Households |
| Desktop or Laptop | 2,705 | 82.7% |
| Smartphone | 2,980 | 91.1% |
| Tablet | 2,278 | 69.6% |
| No Computing Device | 63 | 1.9% |
| Total | 3,271 | 100.0% |
Internet Access in Elsmere
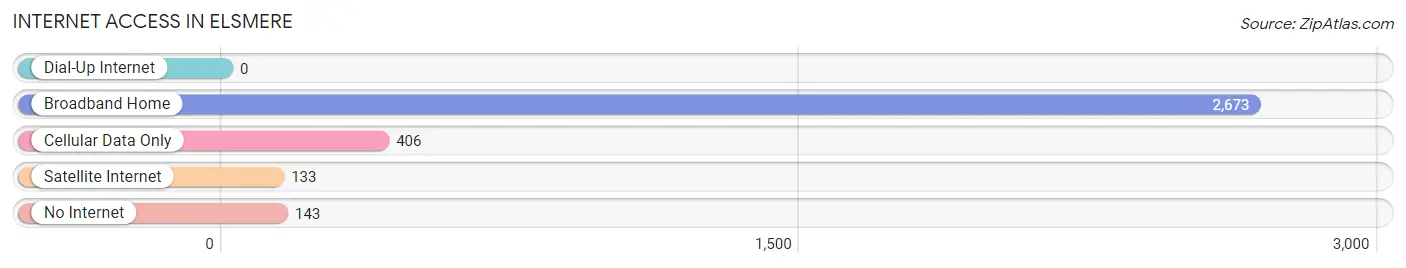
| Internet Type | # Households | % Households |
| Dial-Up Internet | 0 | 0.0% |
| Broadband Home | 2,673 | 81.7% |
| Cellular Data Only | 406 | 12.4% |
| Satellite Internet | 133 | 4.1% |
| No Internet | 143 | 4.4% |
| Total | 3,271 | 100.0% |
Elsmere Summary
Elsmere, Kentucky is a small city located in the northern part of the state, just south of Cincinnati, Ohio. It is part of the Cincinnati metropolitan area and is located in Kenton County. The city has a population of approximately 8,000 people and is known for its small-town charm and friendly atmosphere.
History
Elsmere was founded in 1883 by a group of German immigrants who were looking for a place to settle and start a new life. The city was named after a small village in Germany and was originally known as “Elsmere Station”. The city was incorporated in 1891 and has since grown to become a thriving community.
Geography
Elsmere is located in the northern part of Kentucky, just south of Cincinnati, Ohio. It is part of the Cincinnati metropolitan area and is located in Kenton County. The city is situated on the banks of the Ohio River and is surrounded by rolling hills and lush forests. The city has a total area of 4.2 square miles, all of which is land.
Economy
Elsmere’s economy is largely based on manufacturing and retail. The city is home to several large manufacturing companies, including General Electric, Procter & Gamble, and Kroger. The city also has a thriving retail sector, with several large shopping centers and malls. The city is also home to several small businesses, including restaurants, bars, and other local businesses.
Demographics
As of the 2010 census, Elsmere had a population of 8,000 people. The racial makeup of the city was 87.3% White, 8.2% African American, 0.3% Native American, 0.7% Asian, 0.1% Pacific Islander, and 2.4% from other races. The median household income was $41,945 and the median family income was $50,945. The per capita income was $20,945.
Elsmere is a small city with a big heart. It is a great place to live, work, and raise a family. The city has a rich history and a vibrant economy. It is a great place to call home.
Common Questions
What is Per Capita Income in Elsmere?
Per Capita income in Elsmere is $29,227.
What is the Median Family Income in Elsmere?
Median Family Income in Elsmere is $67,387.
What is the Median Household income in Elsmere?
Median Household Income in Elsmere is $61,890.
What is Income or Wage Gap in Elsmere?
Income or Wage Gap in Elsmere is 5.4%.
Women in Elsmere earn 94.6 cents for every dollar earned by a man.
What is Inequality or Gini Index in Elsmere?
Inequality or Gini Index in Elsmere is 0.37.
What is the Total Population of Elsmere?
Total Population of Elsmere is 9,126.
What is the Total Male Population of Elsmere?
Total Male Population of Elsmere is 4,400.
What is the Total Female Population of Elsmere?
Total Female Population of Elsmere is 4,726.
What is the Ratio of Males per 100 Females in Elsmere?
There are 93.10 Males per 100 Females in Elsmere.
What is the Ratio of Females per 100 Males in Elsmere?
There are 107.41 Females per 100 Males in Elsmere.
What is the Median Population Age in Elsmere?
Median Population Age in Elsmere is 30.9 Years.
What is the Average Family Size in Elsmere
Average Family Size in Elsmere is 3.2 People.
What is the Average Household Size in Elsmere
Average Household Size in Elsmere is 2.8 People.
How Large is the Labor Force in Elsmere?
There are 5,527 People in the Labor Forcein in Elsmere.
What is the Percentage of People in the Labor Force in Elsmere?
77.6% of People are in the Labor Force in Elsmere.
What is the Unemployment Rate in Elsmere?
Unemployment Rate in Elsmere is 5.8%.