Ledbetter, KY Map & Demographics
Ledbetter Map
Ledbetter Overview
$21,320
PER CAPITA INCOME
$68,750
AVG FAMILY INCOME
$60,667
AVG HOUSEHOLD INCOME
0.30
INEQUALITY / GINI INDEX
1,815
TOTAL POPULATION
779
MALE POPULATION
1,036
FEMALE POPULATION
75.19
MALES / 100 FEMALES
132.99
FEMALES / 100 MALES
33.3
MEDIAN AGE
3.6
AVG FAMILY SIZE
2.9
AVG HOUSEHOLD SIZE
939
LABOR FORCE [ PEOPLE ]
69.0%
PERCENT IN LABOR FORCE
9.6%
UNEMPLOYMENT RATE
Ledbetter Zip Codes
Ledbetter Area Codes
Income in Ledbetter
Income Overview in Ledbetter
Per Capita Income in Ledbetter is $21,320, while median incomes of families and households are $68,750 and $60,667 respectively.
| Characteristic | Number | Measure |
| Per Capita Income | 1,815 | $21,320 |
| Median Family Income | 412 | $68,750 |
| Mean Family Income | 412 | $64,821 |
| Median Household Income | 634 | $60,667 |
| Mean Household Income | 634 | $58,558 |
| Income Deficit | 412 | $0 |
| Wage / Income Gap (%) | 1,815 | 0.00% |
| Wage / Income Gap ($) | 1,815 | 100.00¢ per $1 |
| Gini / Inequality Index | 1,815 | 0.30 |
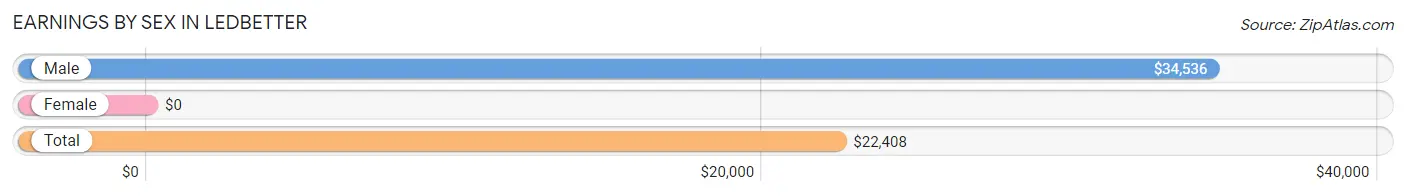
Earnings by Sex in Ledbetter
| Sex | Number | Average Earnings |
| Male | 495 (49.6%) | $34,536 |
| Female | 503 (50.4%) | $0 |
| Total | 998 (100.0%) | $22,408 |
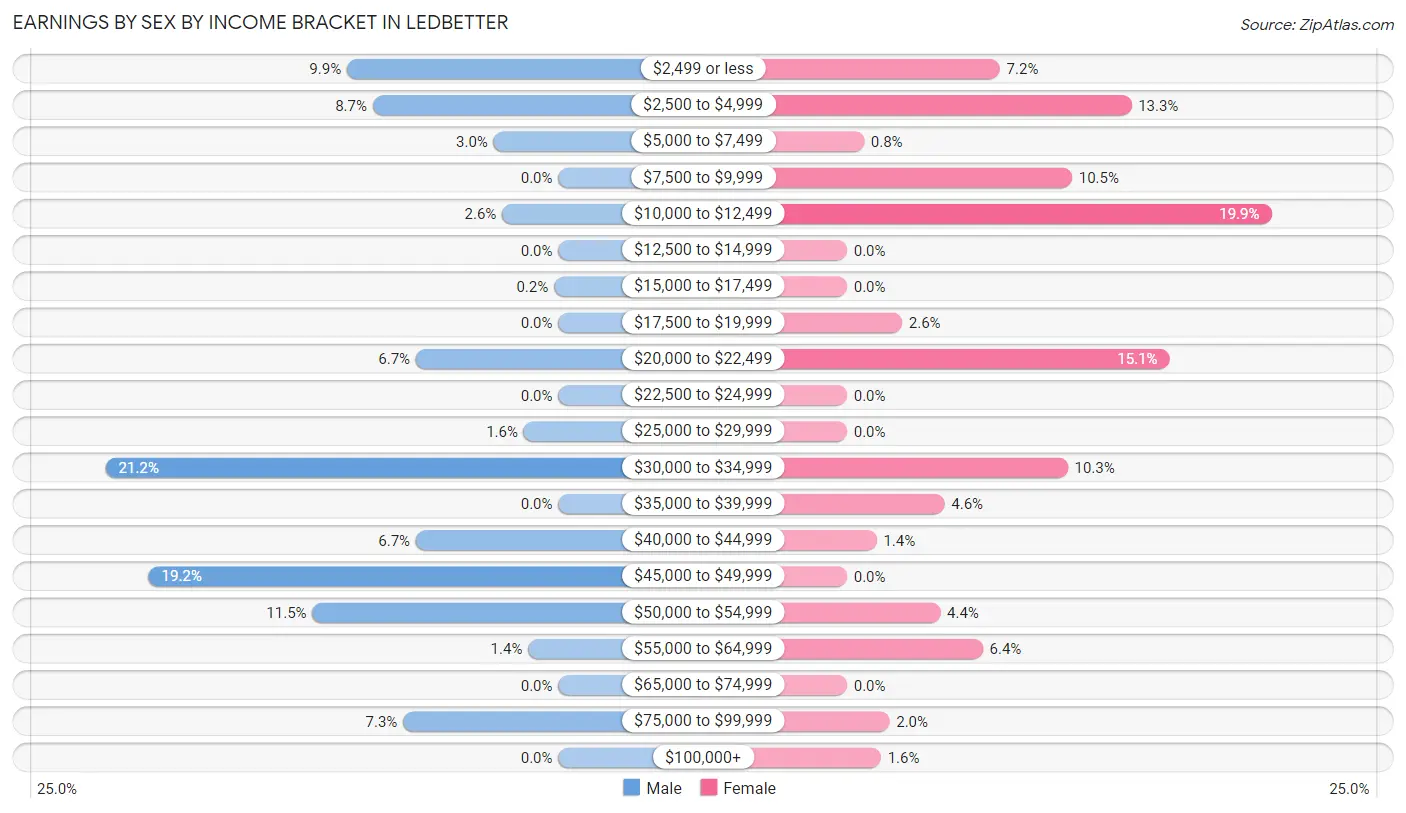
Earnings by Sex by Income Bracket in Ledbetter
The most common earnings brackets in Ledbetter are $30,000 to $34,999 for men (105 | 21.2%) and $10,000 to $12,499 for women (100 | 19.9%).
| Income | Male | Female |
| $2,499 or less | 49 (9.9%) | 36 (7.2%) |
| $2,500 to $4,999 | 43 (8.7%) | 67 (13.3%) |
| $5,000 to $7,499 | 15 (3.0%) | 4 (0.8%) |
| $7,500 to $9,999 | 0 (0.0%) | 53 (10.5%) |
| $10,000 to $12,499 | 13 (2.6%) | 100 (19.9%) |
| $12,500 to $14,999 | 0 (0.0%) | 0 (0.0%) |
| $15,000 to $17,499 | 1 (0.2%) | 0 (0.0%) |
| $17,500 to $19,999 | 0 (0.0%) | 13 (2.6%) |
| $20,000 to $22,499 | 33 (6.7%) | 76 (15.1%) |
| $22,500 to $24,999 | 0 (0.0%) | 0 (0.0%) |
| $25,000 to $29,999 | 8 (1.6%) | 0 (0.0%) |
| $30,000 to $34,999 | 105 (21.2%) | 52 (10.3%) |
| $35,000 to $39,999 | 0 (0.0%) | 23 (4.6%) |
| $40,000 to $44,999 | 33 (6.7%) | 7 (1.4%) |
| $45,000 to $49,999 | 95 (19.2%) | 0 (0.0%) |
| $50,000 to $54,999 | 57 (11.5%) | 22 (4.4%) |
| $55,000 to $64,999 | 7 (1.4%) | 32 (6.4%) |
| $65,000 to $74,999 | 0 (0.0%) | 0 (0.0%) |
| $75,000 to $99,999 | 36 (7.3%) | 10 (2.0%) |
| $100,000+ | 0 (0.0%) | 8 (1.6%) |
| Total | 495 (100.0%) | 503 (100.0%) |
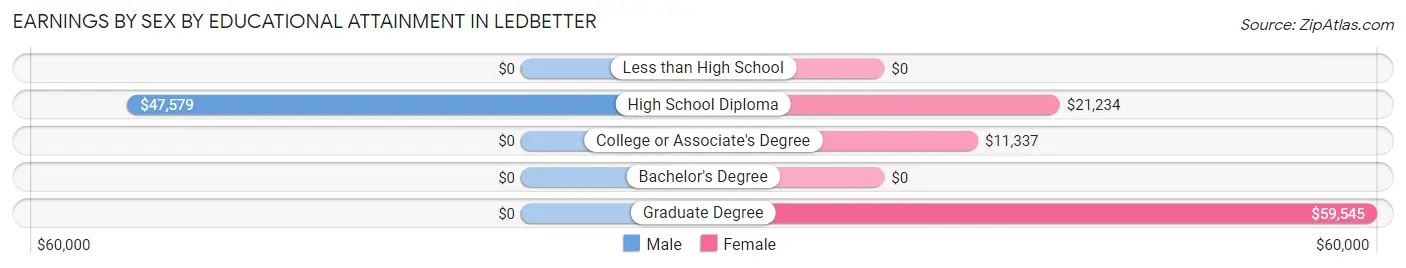
Earnings by Sex by Educational Attainment in Ledbetter
Average earnings in Ledbetter are $34,548 for men and $20,855 for women, a difference of 39.6%. Men with an educational attainment of high school diploma enjoy the highest average annual earnings of $47,579, while those with high school diploma education earn the least with $47,579. Women with an educational attainment of graduate degree earn the most with the average annual earnings of $59,545, while those with college or associate's degree education have the smallest earnings of $11,337.
| Educational Attainment | Male Income | Female Income |
| Less than High School | - | - |
| High School Diploma | $47,579 | $21,234 |
| College or Associate's Degree | - | - |
| Bachelor's Degree | - | - |
| Graduate Degree | - | - |
| Total | $34,548 | $20,855 |
Family Income in Ledbetter
Family Income Brackets in Ledbetter
According to the Ledbetter family income data, there are 189 families falling into the $50,000 to $74,999 income range, which is the most common income bracket and makes up 45.9% of all families.
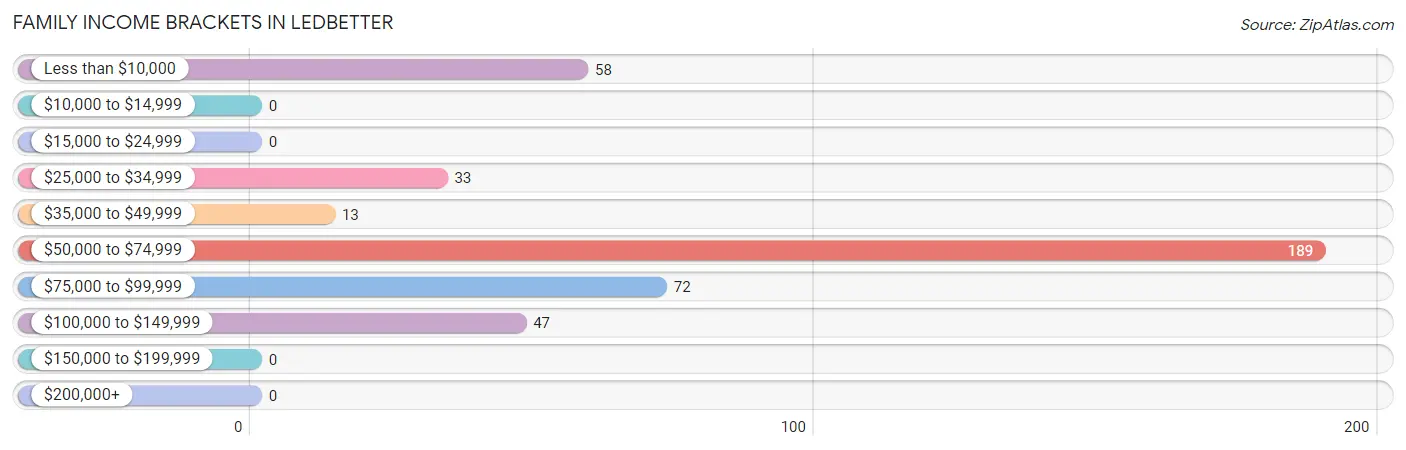
| Income Bracket | # Families | % Families |
| Less than $10,000 | 58 | 14.1% |
| $10,000 to $14,999 | 0 | 0.0% |
| $15,000 to $24,999 | 0 | 0.0% |
| $25,000 to $34,999 | 33 | 8.0% |
| $35,000 to $49,999 | 13 | 3.2% |
| $50,000 to $74,999 | 189 | 45.9% |
| $75,000 to $99,999 | 72 | 17.5% |
| $100,000 to $149,999 | 47 | 11.4% |
| $150,000 to $199,999 | 0 | 0.0% |
| $200,000+ | 0 | 0.0% |
Family Income by Famaliy Size in Ledbetter
3-person families (139 | 33.7%) account for the highest median family income in Ledbetter with $92,774 per family, while 2-person families (89 | 21.6%) have the highest median income of $34,943 per family member.
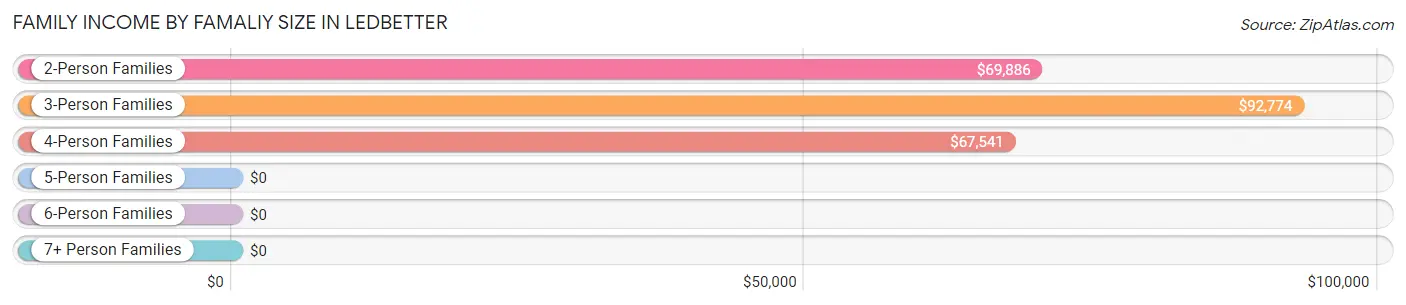
| Income Bracket | # Families | Median Income |
| 2-Person Families | 89 (21.6%) | $69,886 |
| 3-Person Families | 139 (33.7%) | $92,774 |
| 4-Person Families | 160 (38.8%) | $67,541 |
| 5-Person Families | 24 (5.8%) | $0 |
| 6-Person Families | 0 (0.0%) | $0 |
| 7+ Person Families | 0 (0.0%) | $0 |
| Total | 412 (100.0%) | $68,750 |
Family Income by Number of Earners in Ledbetter
The median family income in Ledbetter is $68,750, with families comprising 3+ earners (55) having the highest median family income of $93,323, while families with no earners (83) have the lowest median family income of $2,499, accounting for 13.4% and 20.2% of families, respectively.
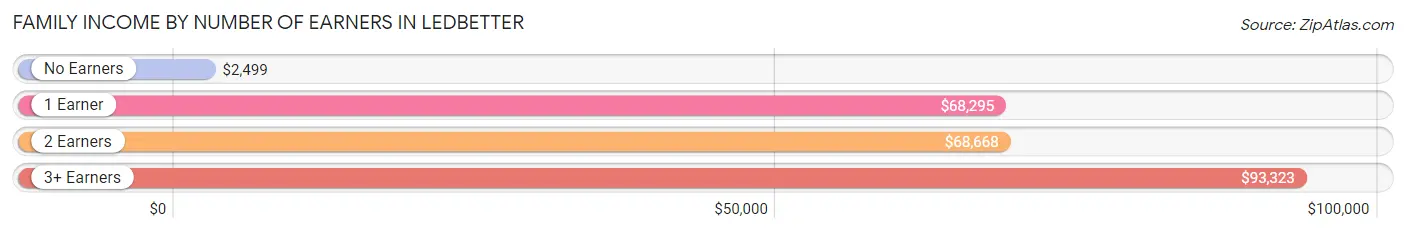
| Number of Earners | # Families | Median Income |
| No Earners | 83 (20.2%) | $2,499 |
| 1 Earner | 115 (27.9%) | $68,295 |
| 2 Earners | 159 (38.6%) | $68,668 |
| 3+ Earners | 55 (13.4%) | $93,323 |
| Total | 412 (100.0%) | $68,750 |
Household Income in Ledbetter
Household Income Brackets in Ledbetter
With 236 households falling in the category, the $50,000 to $74,999 income range is the most frequent in Ledbetter, accounting for 37.2% of all households.
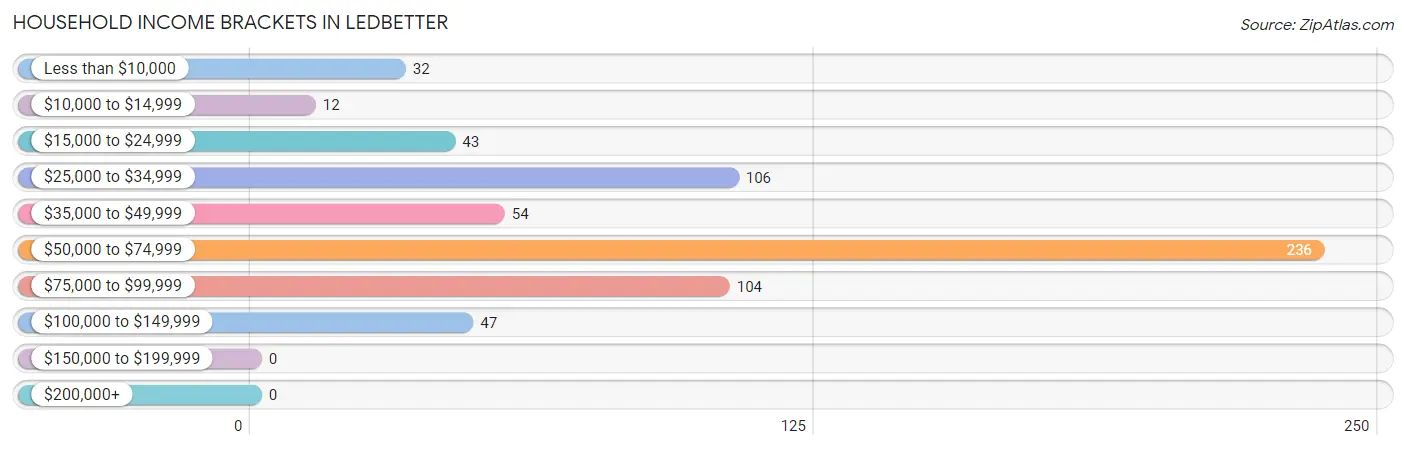
| Income Bracket | # Households | % Households |
| Less than $10,000 | 32 | 5.0% |
| $10,000 to $14,999 | 12 | 1.9% |
| $15,000 to $24,999 | 43 | 6.8% |
| $25,000 to $34,999 | 106 | 16.7% |
| $35,000 to $49,999 | 54 | 8.5% |
| $50,000 to $74,999 | 236 | 37.2% |
| $75,000 to $99,999 | 104 | 16.4% |
| $100,000 to $149,999 | 47 | 7.4% |
| $150,000 to $199,999 | 0 | 0.0% |
| $200,000+ | 0 | 0.0% |
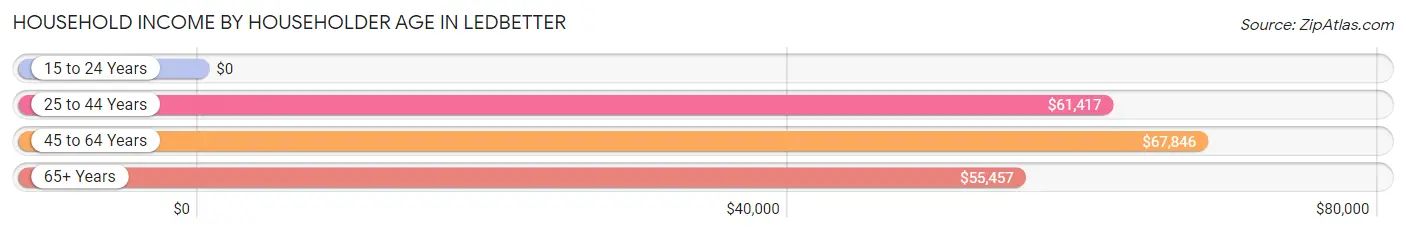
Household Income by Householder Age in Ledbetter
The median household income in Ledbetter is $60,667, with the highest median household income of $67,846 found in the 45 to 64 years age bracket for the primary householder. A total of 254 households (40.1%) fall into this category. Meanwhile, the 15 to 24 years age bracket for the primary householder has the lowest median household income of $0, with 17 households (2.7%) in this group.
| Income Bracket | # Households | Median Income |
| 15 to 24 Years | 17 (2.7%) | $0 |
| 25 to 44 Years | 236 (37.2%) | $61,417 |
| 45 to 64 Years | 254 (40.1%) | $67,846 |
| 65+ Years | 127 (20.0%) | $55,457 |
| Total | 634 (100.0%) | $60,667 |
Poverty in Ledbetter
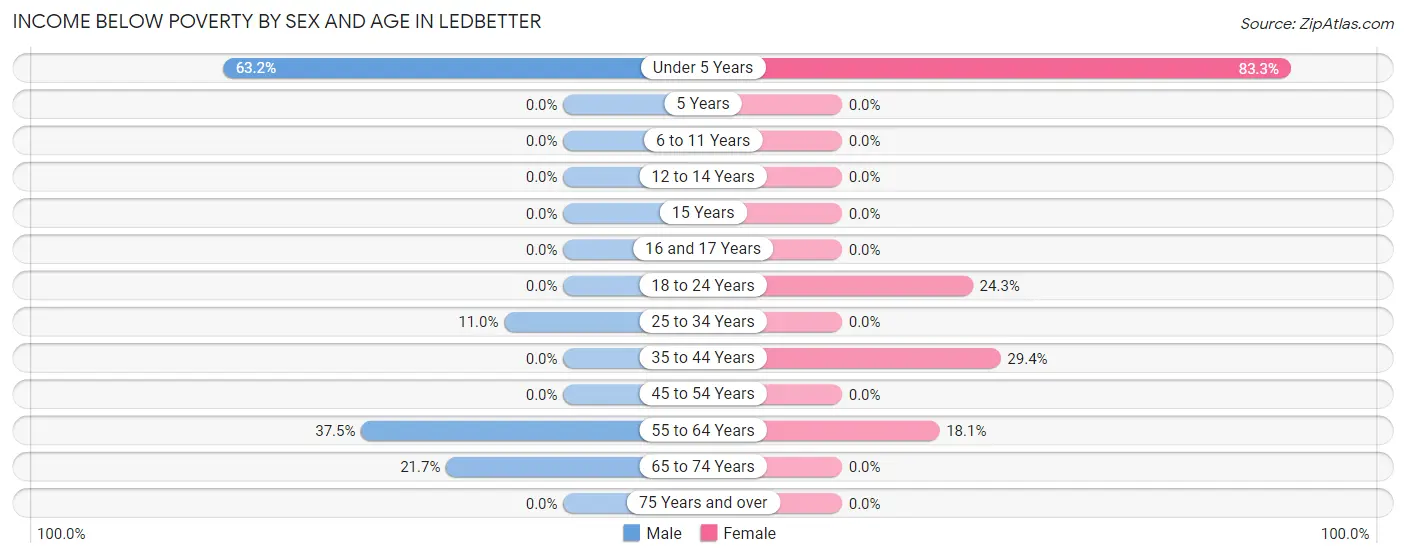
Income Below Poverty by Sex and Age in Ledbetter
With 14.8% poverty level for males and 19.5% for females among the residents of Ledbetter, under 5 year old males and under 5 year old females are the most vulnerable to poverty, with 55 males (63.2%) and 110 females (83.3%) in their respective age groups living below the poverty level.
| Age Bracket | Male | Female |
| Under 5 Years | 55 (63.2%) | 110 (83.3%) |
| 5 Years | 0 (0.0%) | 0 (0.0%) |
| 6 to 11 Years | 0 (0.0%) | 0 (0.0%) |
| 12 to 14 Years | 0 (0.0%) | 0 (0.0%) |
| 15 Years | 0 (0.0%) | 0 (0.0%) |
| 16 and 17 Years | 0 (0.0%) | 0 (0.0%) |
| 18 to 24 Years | 0 (0.0%) | 17 (24.3%) |
| 25 to 34 Years | 24 (11.0%) | 0 (0.0%) |
| 35 to 44 Years | 0 (0.0%) | 58 (29.4%) |
| 45 to 54 Years | 0 (0.0%) | 0 (0.0%) |
| 55 to 64 Years | 21 (37.5%) | 17 (18.1%) |
| 65 to 74 Years | 15 (21.7%) | 0 (0.0%) |
| 75 Years and over | 0 (0.0%) | 0 (0.0%) |
| Total | 115 (14.8%) | 202 (19.5%) |
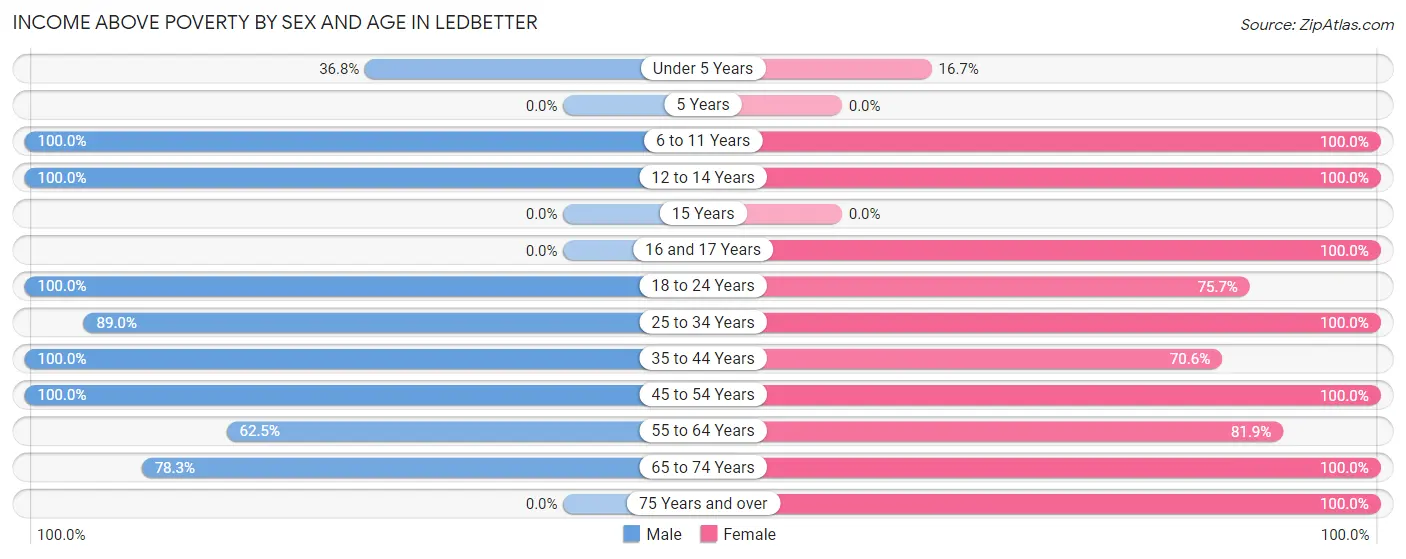
Income Above Poverty by Sex and Age in Ledbetter
According to the poverty statistics in Ledbetter, males aged 6 to 11 years and females aged 6 to 11 years are the age groups that are most secure financially, with 100.0% of males and 100.0% of females in these age groups living above the poverty line.
| Age Bracket | Male | Female |
| Under 5 Years | 32 (36.8%) | 22 (16.7%) |
| 5 Years | 0 (0.0%) | 0 (0.0%) |
| 6 to 11 Years | 56 (100.0%) | 102 (100.0%) |
| 12 to 14 Years | 29 (100.0%) | 48 (100.0%) |
| 15 Years | 0 (0.0%) | 0 (0.0%) |
| 16 and 17 Years | 0 (0.0%) | 37 (100.0%) |
| 18 to 24 Years | 1 (100.0%) | 53 (75.7%) |
| 25 to 34 Years | 195 (89.0%) | 172 (100.0%) |
| 35 to 44 Years | 168 (100.0%) | 139 (70.6%) |
| 45 to 54 Years | 94 (100.0%) | 85 (100.0%) |
| 55 to 64 Years | 35 (62.5%) | 77 (81.9%) |
| 65 to 74 Years | 54 (78.3%) | 80 (100.0%) |
| 75 Years and over | 0 (0.0%) | 19 (100.0%) |
| Total | 664 (85.2%) | 834 (80.5%) |
Income Below Poverty Among Married-Couple Families in Ledbetter
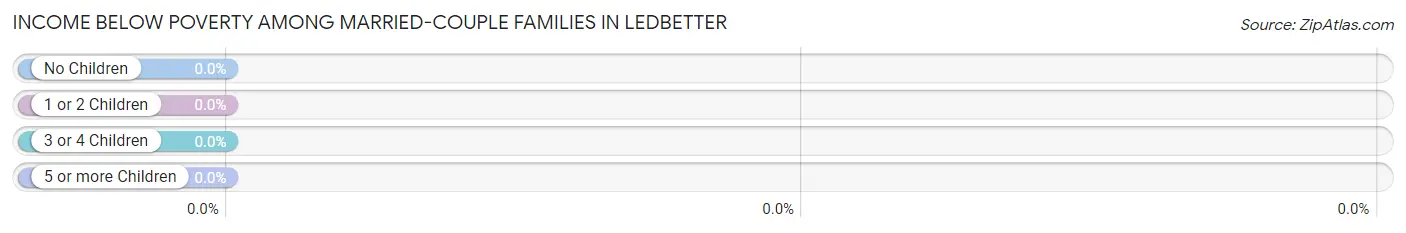
| Children | Above Poverty | Below Poverty |
| No Children | 118 (100.0%) | 0 (0.0%) |
| 1 or 2 Children | 128 (100.0%) | 0 (0.0%) |
| 3 or 4 Children | 11 (100.0%) | 0 (0.0%) |
| 5 or more Children | 0 (0.0%) | 0 (0.0%) |
| Total | 257 (100.0%) | 0 (0.0%) |
Income Below Poverty Among Single-Parent Households in Ledbetter
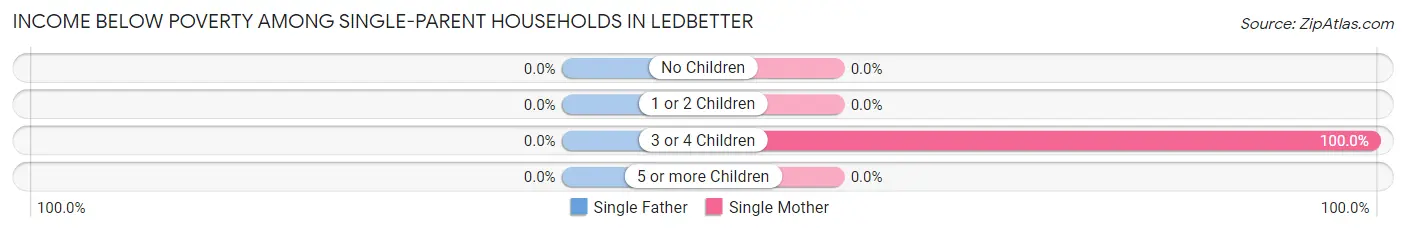
| Children | Single Father | Single Mother |
| No Children | 0 (0.0%) | 0 (0.0%) |
| 1 or 2 Children | 0 (0.0%) | 0 (0.0%) |
| 3 or 4 Children | 0 (0.0%) | 58 (100.0%) |
| 5 or more Children | 0 (0.0%) | 0 (0.0%) |
| Total | 0 (0.0%) | 58 (40.8%) |
Income Below Poverty Among Married-Couple vs Single-Parent Households in Ledbetter
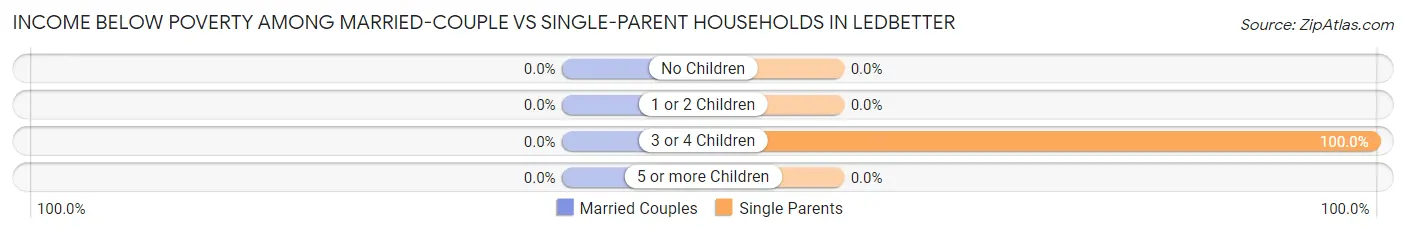
| Children | Married-Couple Families | Single-Parent Households |
| No Children | 0 (0.0%) | 0 (0.0%) |
| 1 or 2 Children | 0 (0.0%) | 0 (0.0%) |
| 3 or 4 Children | 0 (0.0%) | 58 (100.0%) |
| 5 or more Children | 0 (0.0%) | 0 (0.0%) |
| Total | 0 (0.0%) | 58 (37.4%) |
Race in Ledbetter
The most populous races in Ledbetter are White / Caucasian (1,755 | 96.7%), Hispanic or Latino (57 | 3.1%), and Two or more Races (46 | 2.5%).
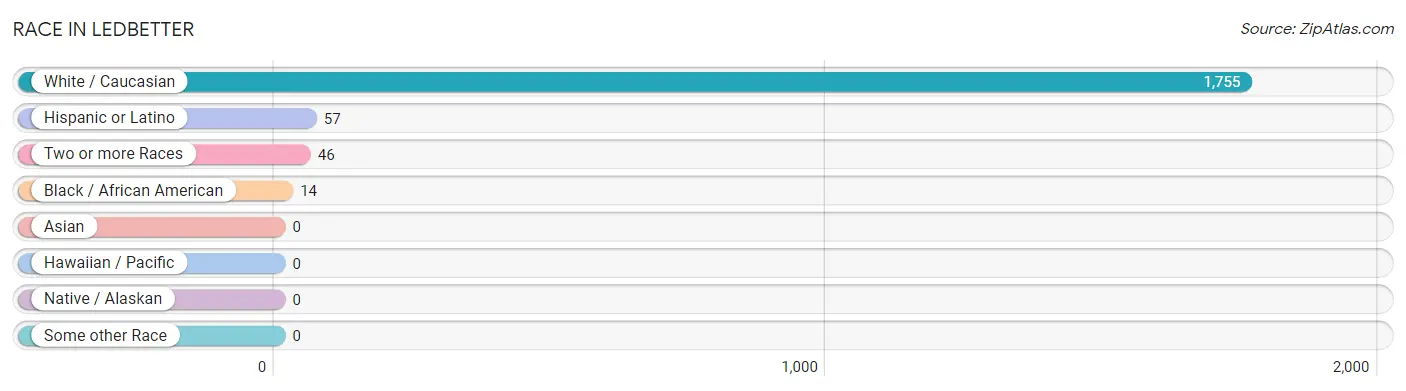
| Race | # Population | % Population |
| Asian | 0 | 0.0% |
| Black / African American | 14 | 0.8% |
| Hawaiian / Pacific | 0 | 0.0% |
| Hispanic or Latino | 57 | 3.1% |
| Native / Alaskan | 0 | 0.0% |
| White / Caucasian | 1,755 | 96.7% |
| Two or more Races | 46 | 2.5% |
| Some other Race | 0 | 0.0% |
| Total | 1,815 | 100.0% |
Ancestry in Ledbetter
The most populous ancestries reported in Ledbetter are European (372 | 20.5%), American (154 | 8.5%), English (90 | 5.0%), Irish (90 | 5.0%), and Mexican (33 | 1.8%), together accounting for 40.7% of all Ledbetter residents.
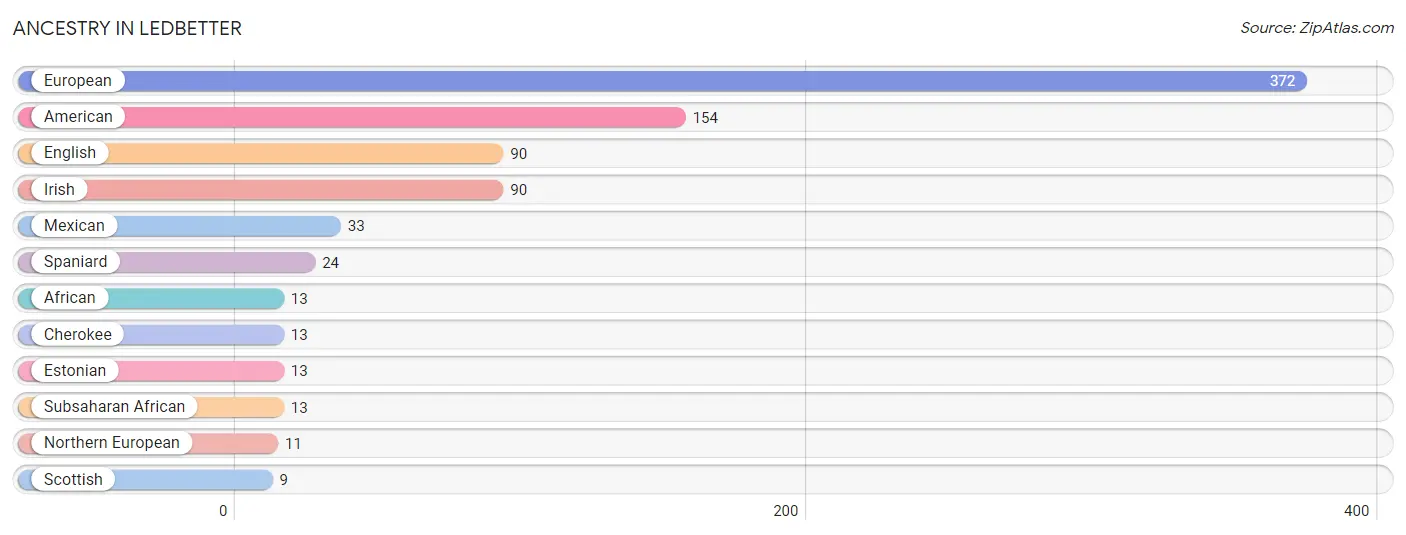
| Ancestry | # Population | % Population |
| African | 13 | 0.7% |
| American | 154 | 8.5% |
| Cherokee | 13 | 0.7% |
| English | 90 | 5.0% |
| Estonian | 13 | 0.7% |
| European | 372 | 20.5% |
| Irish | 90 | 5.0% |
| Mexican | 33 | 1.8% |
| Northern European | 11 | 0.6% |
| Scottish | 9 | 0.5% |
| Spaniard | 24 | 1.3% |
| Subsaharan African | 13 | 0.7% | View All 12 Rows |
Immigrants in Ledbetter
The most numerous immigrant groups reported in Ledbetter came from Eastern Europe (4 | 0.2%), Europe (4 | 0.2%), and Ukraine (4 | 0.2%), together accounting for 0.7% of all Ledbetter residents.
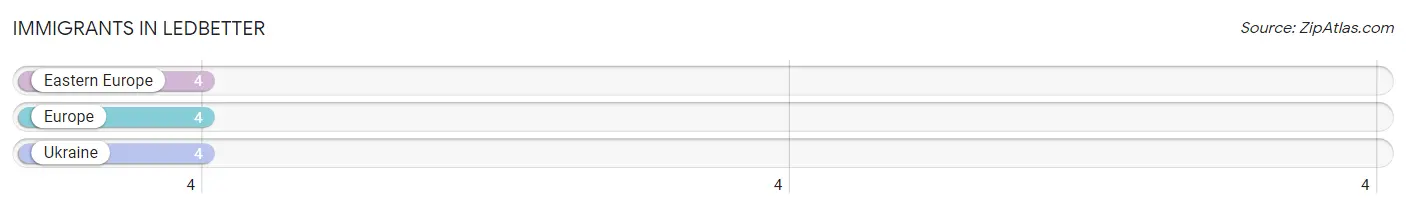
| Immigration Origin | # Population | % Population |
| Eastern Europe | 4 | 0.2% |
| Europe | 4 | 0.2% |
| Ukraine | 4 | 0.2% | View All 3 Rows |
Sex and Age in Ledbetter
Sex and Age in Ledbetter
The most populous age groups in Ledbetter are 25 to 29 Years (141 | 18.1%) for men and Under 5 Years (132 | 12.7%) for women.
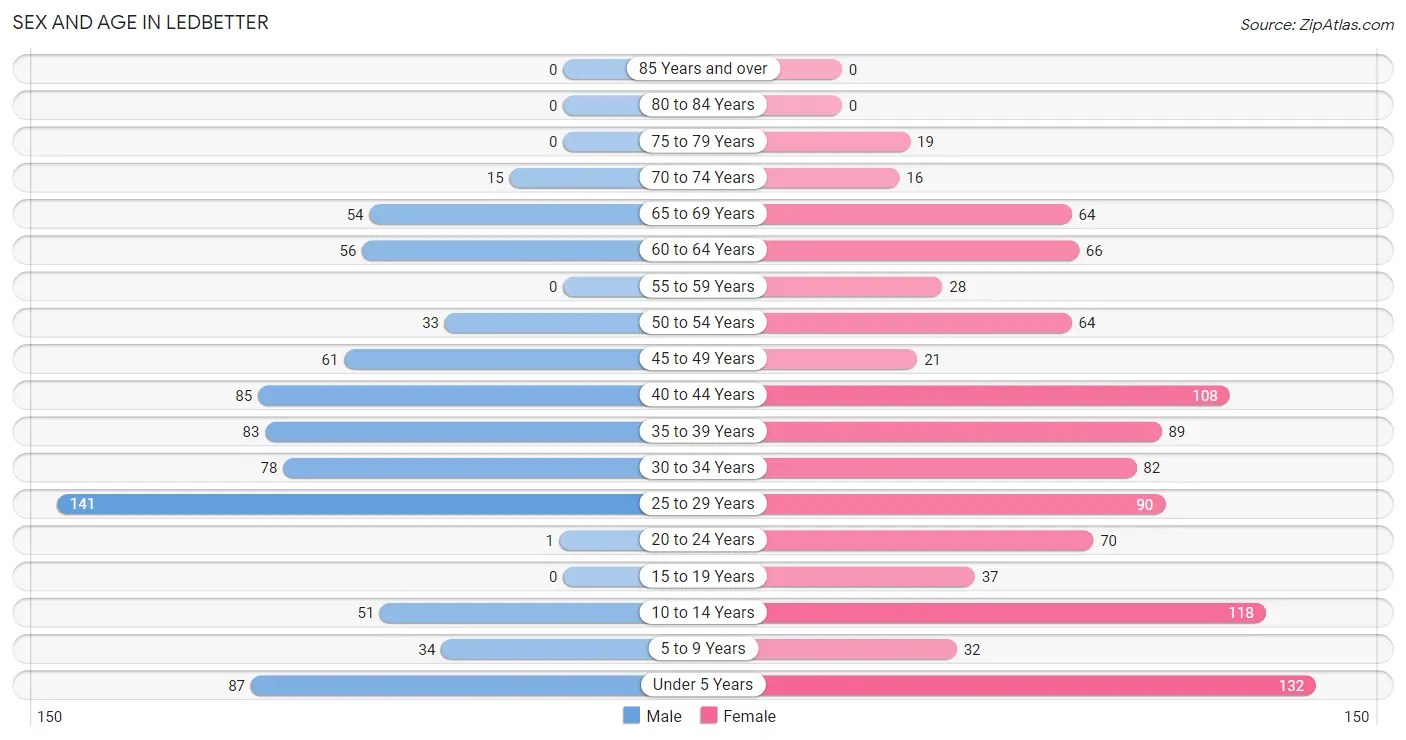
| Age Bracket | Male | Female |
| Under 5 Years | 87 (11.2%) | 132 (12.7%) |
| 5 to 9 Years | 34 (4.4%) | 32 (3.1%) |
| 10 to 14 Years | 51 (6.6%) | 118 (11.4%) |
| 15 to 19 Years | 0 (0.0%) | 37 (3.6%) |
| 20 to 24 Years | 1 (0.1%) | 70 (6.8%) |
| 25 to 29 Years | 141 (18.1%) | 90 (8.7%) |
| 30 to 34 Years | 78 (10.0%) | 82 (7.9%) |
| 35 to 39 Years | 83 (10.6%) | 89 (8.6%) |
| 40 to 44 Years | 85 (10.9%) | 108 (10.4%) |
| 45 to 49 Years | 61 (7.8%) | 21 (2.0%) |
| 50 to 54 Years | 33 (4.2%) | 64 (6.2%) |
| 55 to 59 Years | 0 (0.0%) | 28 (2.7%) |
| 60 to 64 Years | 56 (7.2%) | 66 (6.4%) |
| 65 to 69 Years | 54 (6.9%) | 64 (6.2%) |
| 70 to 74 Years | 15 (1.9%) | 16 (1.5%) |
| 75 to 79 Years | 0 (0.0%) | 19 (1.8%) |
| 80 to 84 Years | 0 (0.0%) | 0 (0.0%) |
| 85 Years and over | 0 (0.0%) | 0 (0.0%) |
| Total | 779 (100.0%) | 1,036 (100.0%) |
Families and Households in Ledbetter
Median Family Size in Ledbetter
The median family size in Ledbetter is 3.56 persons per family, with single male/father families (13 | 3.2%) accounting for the largest median family size of 15.62 persons per family. On the other hand, married-couple families (257 | 62.4%) represent the smallest median family size with 3.07 persons per family.
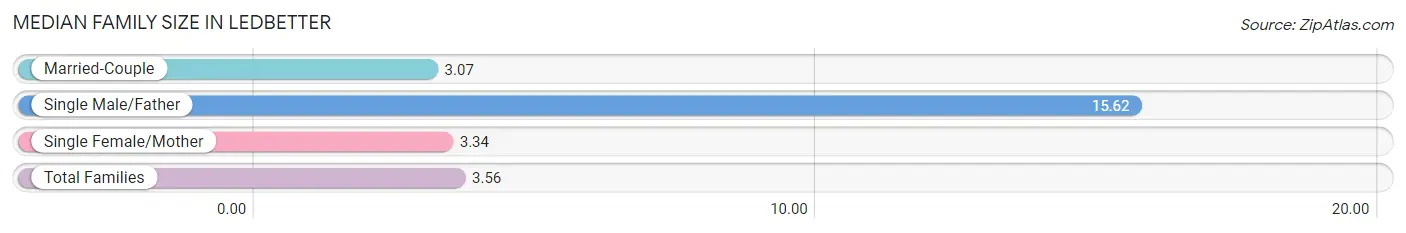
| Family Type | # Families | Family Size |
| Married-Couple | 257 (62.4%) | 3.07 |
| Single Male/Father | 13 (3.2%) | 15.62 |
| Single Female/Mother | 142 (34.5%) | 3.34 |
| Total Families | 412 (100.0%) | 3.56 |
Median Household Size in Ledbetter
The median household size in Ledbetter is 2.86 persons per household, with single male/father households (13 | 2.1%) accounting for the largest median household size of 15.62 persons per household. non-family households (222 | 35.0%) represent the smallest median household size with 1.05 persons per household.
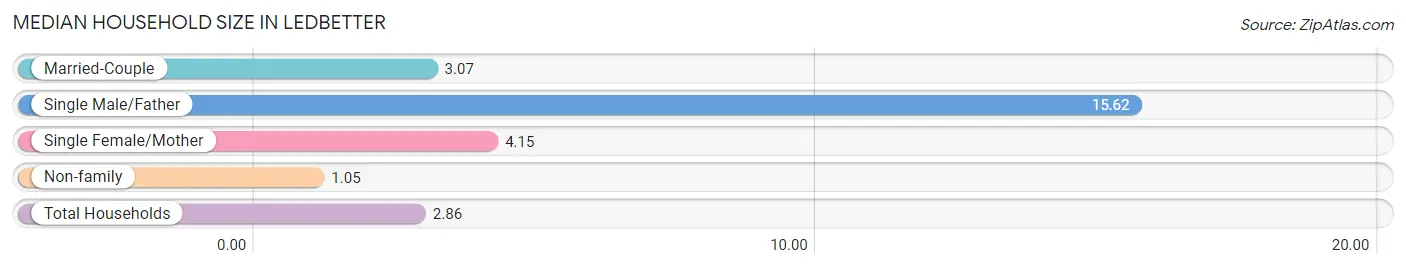
| Household Type | # Households | Household Size |
| Married-Couple | 257 (40.5%) | 3.07 |
| Single Male/Father | 13 (2.1%) | 15.62 |
| Single Female/Mother | 142 (22.4%) | 4.15 |
| Non-family | 222 (35.0%) | 1.05 |
| Total Households | 634 (100.0%) | 2.86 |
Household Size by Marriage Status in Ledbetter
Out of a total of 634 households in Ledbetter, 412 (65.0%) are family households, while 222 (35.0%) are nonfamily households. The most numerous type of family households are 3-person households, comprising 158, and the most common type of nonfamily households are 1-person households, comprising 205.
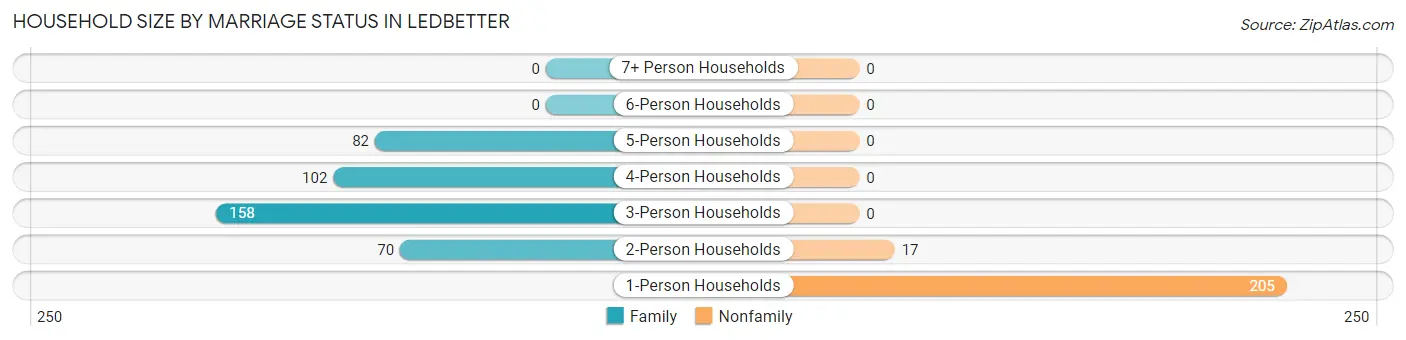
| Household Size | Family Households | Nonfamily Households |
| 1-Person Households | - | 205 (32.3%) |
| 2-Person Households | 70 (11.0%) | 17 (2.7%) |
| 3-Person Households | 158 (24.9%) | 0 (0.0%) |
| 4-Person Households | 102 (16.1%) | 0 (0.0%) |
| 5-Person Households | 82 (12.9%) | 0 (0.0%) |
| 6-Person Households | 0 (0.0%) | 0 (0.0%) |
| 7+ Person Households | 0 (0.0%) | 0 (0.0%) |
| Total | 412 (65.0%) | 222 (35.0%) |
Female Fertility in Ledbetter
Fertility by Age in Ledbetter
Average fertility rate in Ledbetter is 107.0 births per 1,000 women. Women in the age bracket of 35 to 50 years have the highest fertility rate with 222.0 births per 1,000 women. Women in the age bracket of 35 to 50 years acount for 100.0% of all women with births.
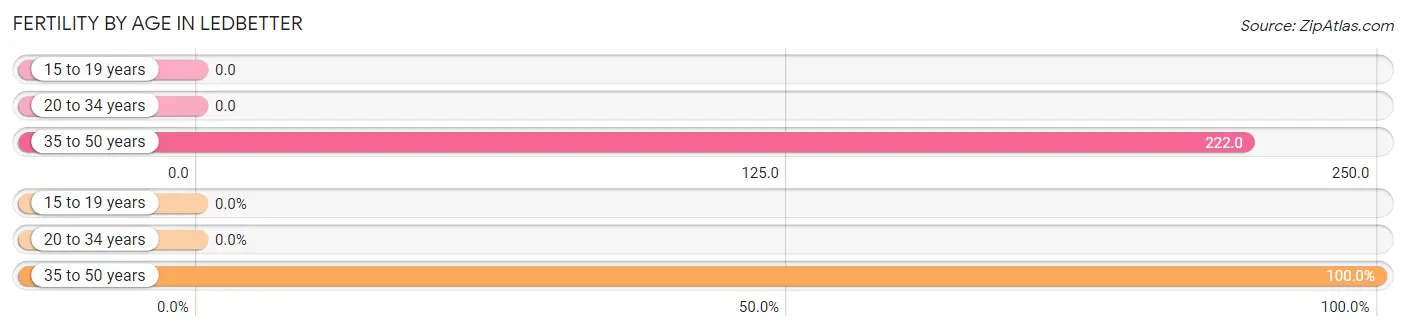
| Age Bracket | Women with Births | Births / 1,000 Women |
| 15 to 19 years | 0 (0.0%) | 0.0 |
| 20 to 34 years | 0 (0.0%) | 0.0 |
| 35 to 50 years | 58 (100.0%) | 222.0 |
| Total | 58 (100.0%) | 107.0 |
Fertility by Age by Marriage Status in Ledbetter
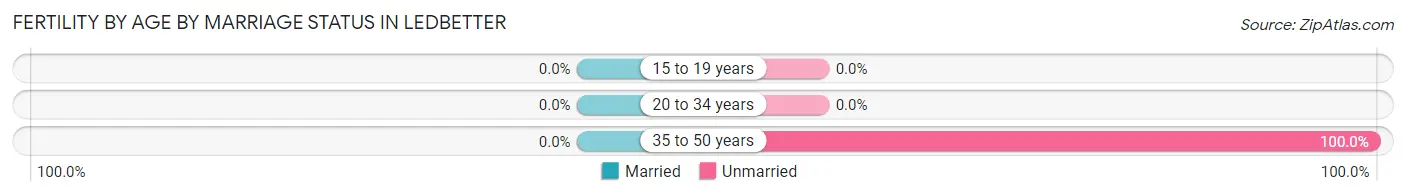
| Age Bracket | Married | Unmarried |
| 15 to 19 years | 0 (0.0%) | 0 (0.0%) |
| 20 to 34 years | 0 (0.0%) | 0 (0.0%) |
| 35 to 50 years | 0 (0.0%) | 58 (100.0%) |
| Total | 0 (0.0%) | 58 (100.0%) |
Fertility by Education in Ledbetter
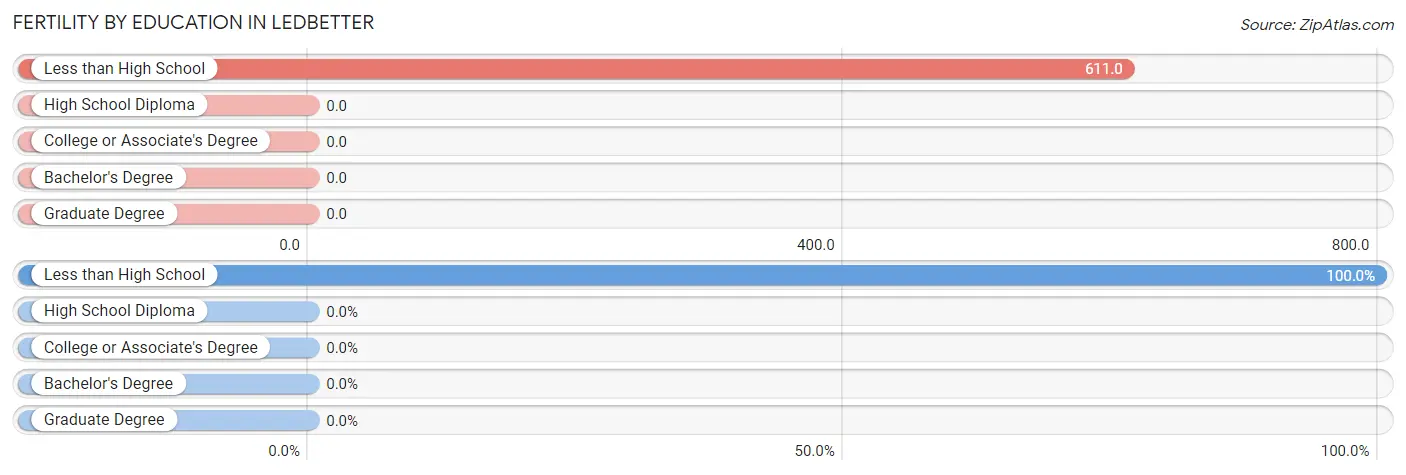
| Educational Attainment | Women with Births | Births / 1,000 Women |
| Less than High School | 58 (100.0%) | 611.0 |
| High School Diploma | 0 (0.0%) | 0.0 |
| College or Associate's Degree | 0 (0.0%) | 0.0 |
| Bachelor's Degree | 0 (0.0%) | 0.0 |
| Graduate Degree | 0 (0.0%) | 0.0 |
| Total | 58 (100.0%) | 107.0 |
Fertility by Education by Marriage Status in Ledbetter
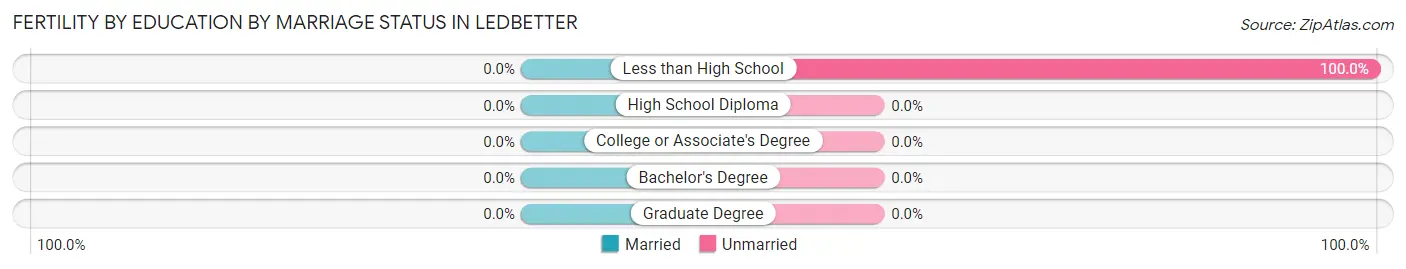
| Educational Attainment | Married | Unmarried |
| Less than High School | 0 (0.0%) | 58 (100.0%) |
| High School Diploma | 0 (0.0%) | 0 (0.0%) |
| College or Associate's Degree | 0 (0.0%) | 0 (0.0%) |
| Bachelor's Degree | 0 (0.0%) | 0 (0.0%) |
| Graduate Degree | 0 (0.0%) | 0 (0.0%) |
| Total | 0 (0.0%) | 58 (100.0%) |
Employment Characteristics in Ledbetter
Employment by Class of Employer in Ledbetter
Among the 849 employed individuals in Ledbetter, private company employees (704 | 82.9%), self-employed (not incorporated) (85 | 10.0%), and state government employees (54 | 6.4%) make up the most common classes of employment.
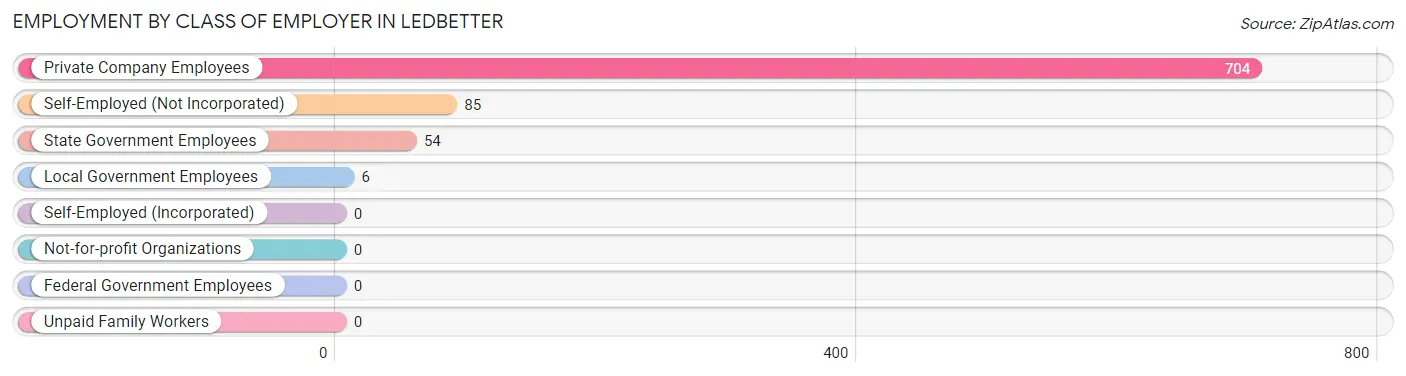
| Employer Class | # Employees | % Employees |
| Private Company Employees | 704 | 82.9% |
| Self-Employed (Incorporated) | 0 | 0.0% |
| Self-Employed (Not Incorporated) | 85 | 10.0% |
| Not-for-profit Organizations | 0 | 0.0% |
| Local Government Employees | 6 | 0.7% |
| State Government Employees | 54 | 6.4% |
| Federal Government Employees | 0 | 0.0% |
| Unpaid Family Workers | 0 | 0.0% |
| Total | 849 | 100.0% |
Employment Status by Age in Ledbetter
According to the labor force statistics for Ledbetter, out of the total population over 16 years of age (1,361), 69.0% or 939 individuals are in the labor force, with 9.6% or 90 of them unemployed. The age group with the highest labor force participation rate is 25 to 29 years, with 100.0% or 231 individuals in the labor force. Within the labor force, the 25 to 29 years age range has the highest percentage of unemployed individuals, with 29.0% or 67 of them being unemployed.
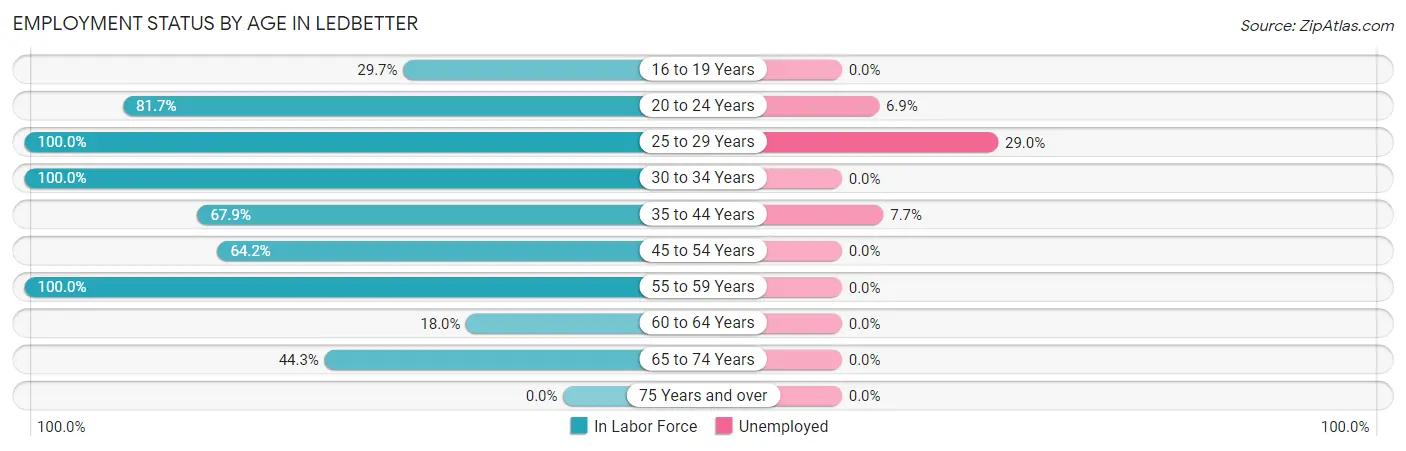
| Age Bracket | In Labor Force | Unemployed |
| 16 to 19 Years | 11 (29.7%) | 0 (0.0%) |
| 20 to 24 Years | 58 (81.7%) | 4 (6.9%) |
| 25 to 29 Years | 231 (100.0%) | 67 (29.0%) |
| 30 to 34 Years | 160 (100.0%) | 0 (0.0%) |
| 35 to 44 Years | 248 (67.9%) | 19 (7.7%) |
| 45 to 54 Years | 115 (64.2%) | 0 (0.0%) |
| 55 to 59 Years | 28 (100.0%) | 0 (0.0%) |
| 60 to 64 Years | 22 (18.0%) | 0 (0.0%) |
| 65 to 74 Years | 66 (44.3%) | 0 (0.0%) |
| 75 Years and over | 0 (0.0%) | 0 (0.0%) |
| Total | 939 (69.0%) | 90 (9.6%) |
Employment Status by Educational Attainment in Ledbetter
According to labor force statistics for Ledbetter, 74.1% of individuals (804) out of the total population between 25 and 64 years of age (1,085) are in the labor force, with 10.7% or 86 of them being unemployed. The group with the highest labor force participation rate are those with the educational attainment of high school diploma, with 88.1% or 384 individuals in the labor force. Within the labor force, individuals with college / associate degree education have the highest percentage of unemployment, with 22.3% or 67 of them being unemployed.
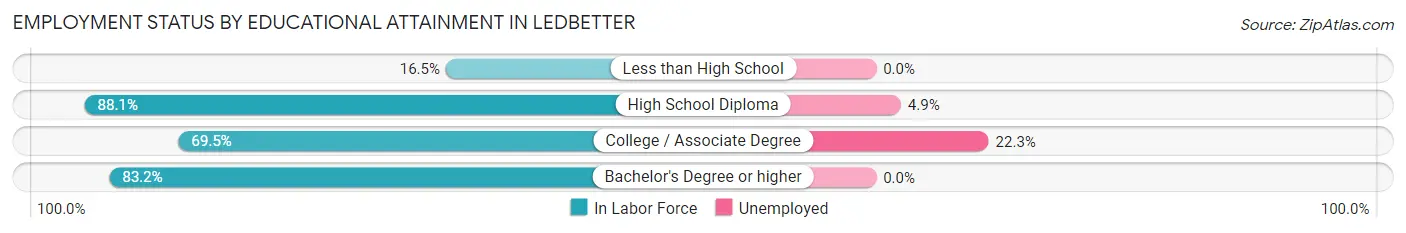
| Educational Attainment | In Labor Force | Unemployed |
| Less than High School | 15 (16.5%) | 0 (0.0%) |
| High School Diploma | 384 (88.1%) | 21 (4.9%) |
| College / Associate Degree | 301 (69.5%) | 97 (22.3%) |
| Bachelor's Degree or higher | 104 (83.2%) | 0 (0.0%) |
| Total | 804 (74.1%) | 116 (10.7%) |
Employment Occupations by Sex in Ledbetter
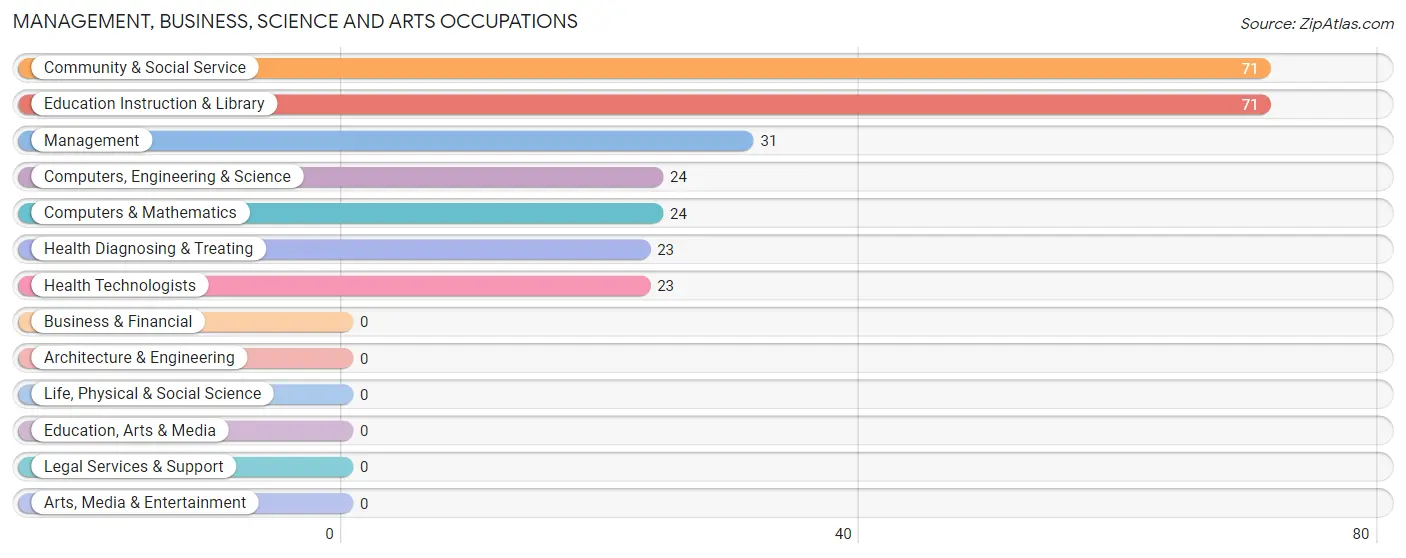
Management, Business, Science and Arts Occupations
The most common Management, Business, Science and Arts occupations in Ledbetter are Community & Social Service (71 | 8.4%), Education Instruction & Library (71 | 8.4%), Management (31 | 3.6%), Computers, Engineering & Science (24 | 2.8%), and Computers & Mathematics (24 | 2.8%).
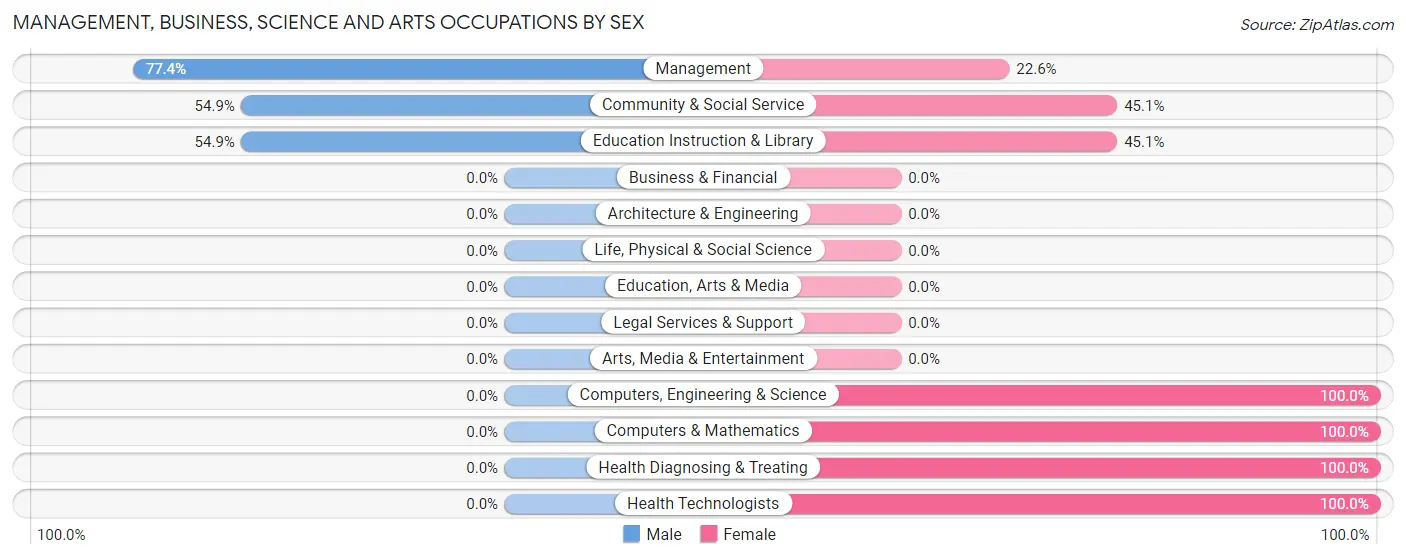
Management, Business, Science and Arts Occupations by Sex
Within the Management, Business, Science and Arts occupations in Ledbetter, the most male-oriented occupations are Management (77.4%), Community & Social Service (54.9%), and Education Instruction & Library (54.9%), while the most female-oriented occupations are Computers, Engineering & Science (100.0%), Computers & Mathematics (100.0%), and Health Diagnosing & Treating (100.0%).
| Occupation | Male | Female |
| Management | 24 (77.4%) | 7 (22.6%) |
| Business & Financial | 0 (0.0%) | 0 (0.0%) |
| Computers, Engineering & Science | 0 (0.0%) | 24 (100.0%) |
| Computers & Mathematics | 0 (0.0%) | 24 (100.0%) |
| Architecture & Engineering | 0 (0.0%) | 0 (0.0%) |
| Life, Physical & Social Science | 0 (0.0%) | 0 (0.0%) |
| Community & Social Service | 39 (54.9%) | 32 (45.1%) |
| Education, Arts & Media | 0 (0.0%) | 0 (0.0%) |
| Legal Services & Support | 0 (0.0%) | 0 (0.0%) |
| Education Instruction & Library | 39 (54.9%) | 32 (45.1%) |
| Arts, Media & Entertainment | 0 (0.0%) | 0 (0.0%) |
| Health Diagnosing & Treating | 0 (0.0%) | 23 (100.0%) |
| Health Technologists | 0 (0.0%) | 23 (100.0%) |
| Total (Category) | 63 (42.3%) | 86 (57.7%) |
| Total (Overall) | 455 (53.6%) | 394 (46.4%) |
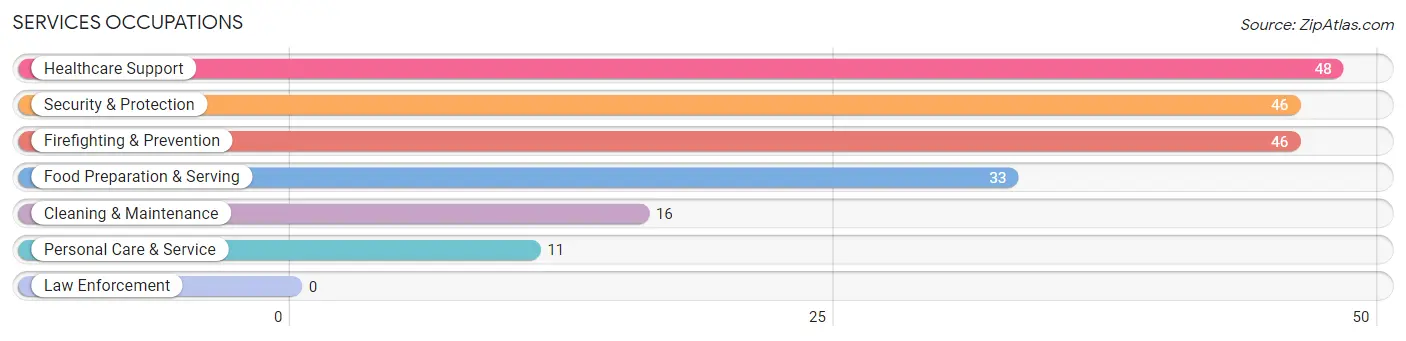
Services Occupations
The most common Services occupations in Ledbetter are Healthcare Support (48 | 5.7%), Security & Protection (46 | 5.4%), Firefighting & Prevention (46 | 5.4%), Food Preparation & Serving (33 | 3.9%), and Cleaning & Maintenance (16 | 1.9%).
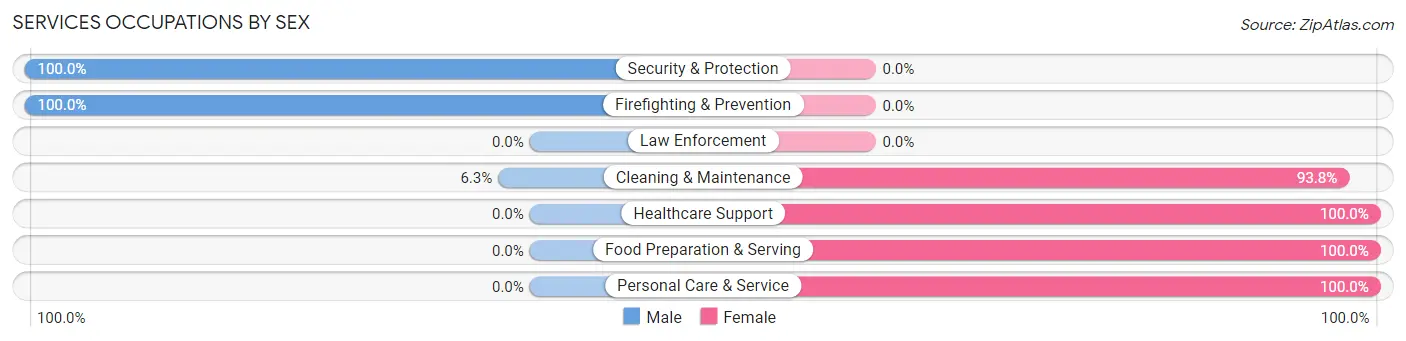
Services Occupations by Sex
Within the Services occupations in Ledbetter, the most male-oriented occupations are Security & Protection (100.0%), Firefighting & Prevention (100.0%), and Cleaning & Maintenance (6.2%), while the most female-oriented occupations are Healthcare Support (100.0%), Food Preparation & Serving (100.0%), and Personal Care & Service (100.0%).
| Occupation | Male | Female |
| Healthcare Support | 0 (0.0%) | 48 (100.0%) |
| Security & Protection | 46 (100.0%) | 0 (0.0%) |
| Firefighting & Prevention | 46 (100.0%) | 0 (0.0%) |
| Law Enforcement | 0 (0.0%) | 0 (0.0%) |
| Food Preparation & Serving | 0 (0.0%) | 33 (100.0%) |
| Cleaning & Maintenance | 1 (6.2%) | 15 (93.8%) |
| Personal Care & Service | 0 (0.0%) | 11 (100.0%) |
| Total (Category) | 47 (30.5%) | 107 (69.5%) |
| Total (Overall) | 455 (53.6%) | 394 (46.4%) |
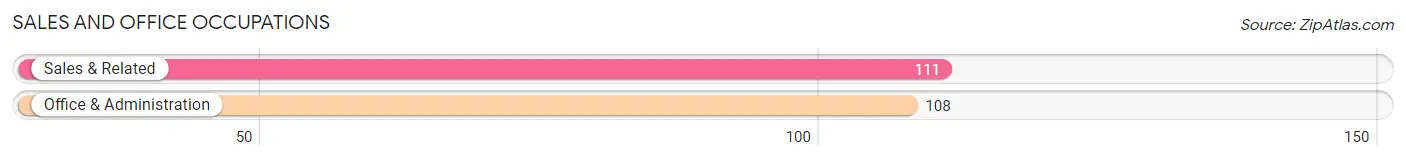
Sales and Office Occupations
The most common Sales and Office occupations in Ledbetter are Sales & Related (111 | 13.1%), and Office & Administration (108 | 12.7%).
Sales and Office Occupations by Sex
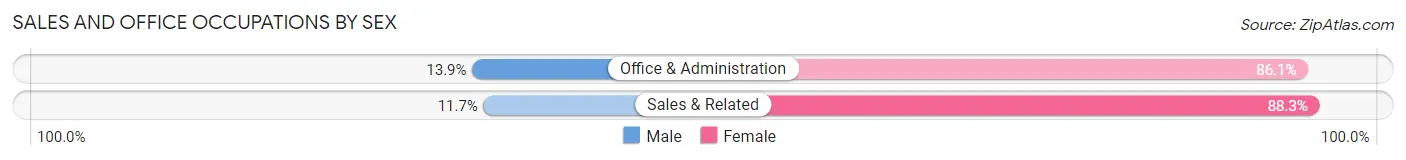
| Occupation | Male | Female |
| Sales & Related | 13 (11.7%) | 98 (88.3%) |
| Office & Administration | 15 (13.9%) | 93 (86.1%) |
| Total (Category) | 28 (12.8%) | 191 (87.2%) |
| Total (Overall) | 455 (53.6%) | 394 (46.4%) |
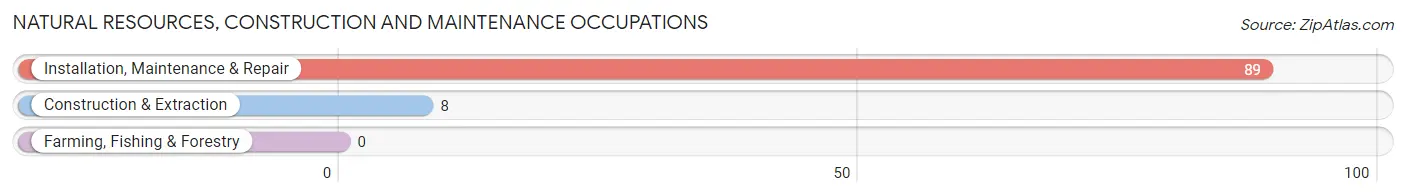
Natural Resources, Construction and Maintenance Occupations
The most common Natural Resources, Construction and Maintenance occupations in Ledbetter are Installation, Maintenance & Repair (89 | 10.5%), and Construction & Extraction (8 | 0.9%).
Natural Resources, Construction and Maintenance Occupations by Sex
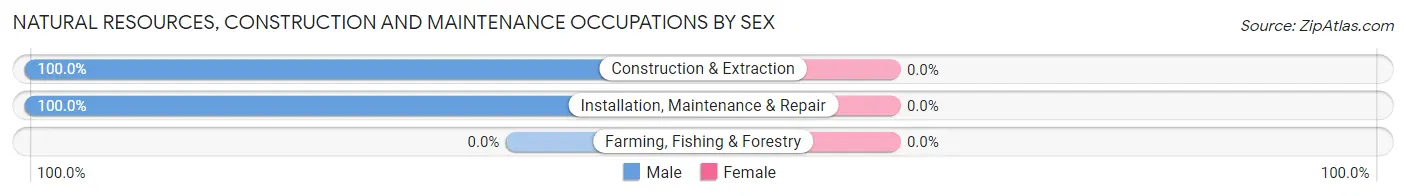
| Occupation | Male | Female |
| Farming, Fishing & Forestry | 0 (0.0%) | 0 (0.0%) |
| Construction & Extraction | 8 (100.0%) | 0 (0.0%) |
| Installation, Maintenance & Repair | 89 (100.0%) | 0 (0.0%) |
| Total (Category) | 97 (100.0%) | 0 (0.0%) |
| Total (Overall) | 455 (53.6%) | 394 (46.4%) |
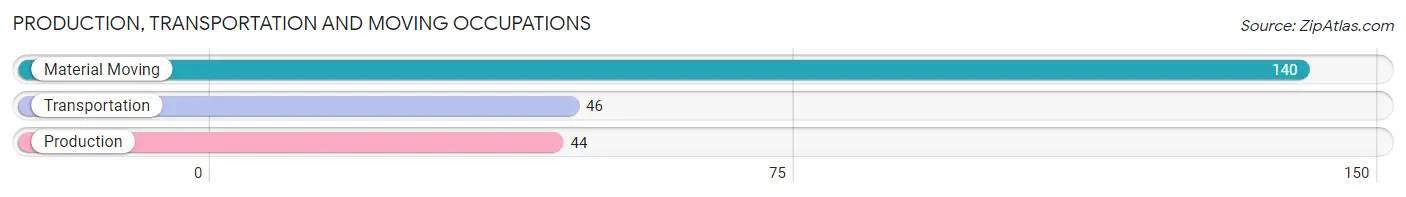
Production, Transportation and Moving Occupations
The most common Production, Transportation and Moving occupations in Ledbetter are Material Moving (140 | 16.5%), Transportation (46 | 5.4%), and Production (44 | 5.2%).
Production, Transportation and Moving Occupations by Sex
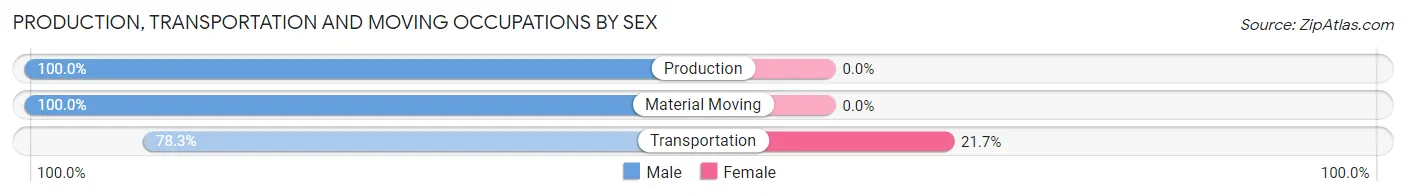
| Occupation | Male | Female |
| Production | 44 (100.0%) | 0 (0.0%) |
| Transportation | 36 (78.3%) | 10 (21.7%) |
| Material Moving | 140 (100.0%) | 0 (0.0%) |
| Total (Category) | 220 (95.7%) | 10 (4.3%) |
| Total (Overall) | 455 (53.6%) | 394 (46.4%) |
Employment Industries by Sex in Ledbetter
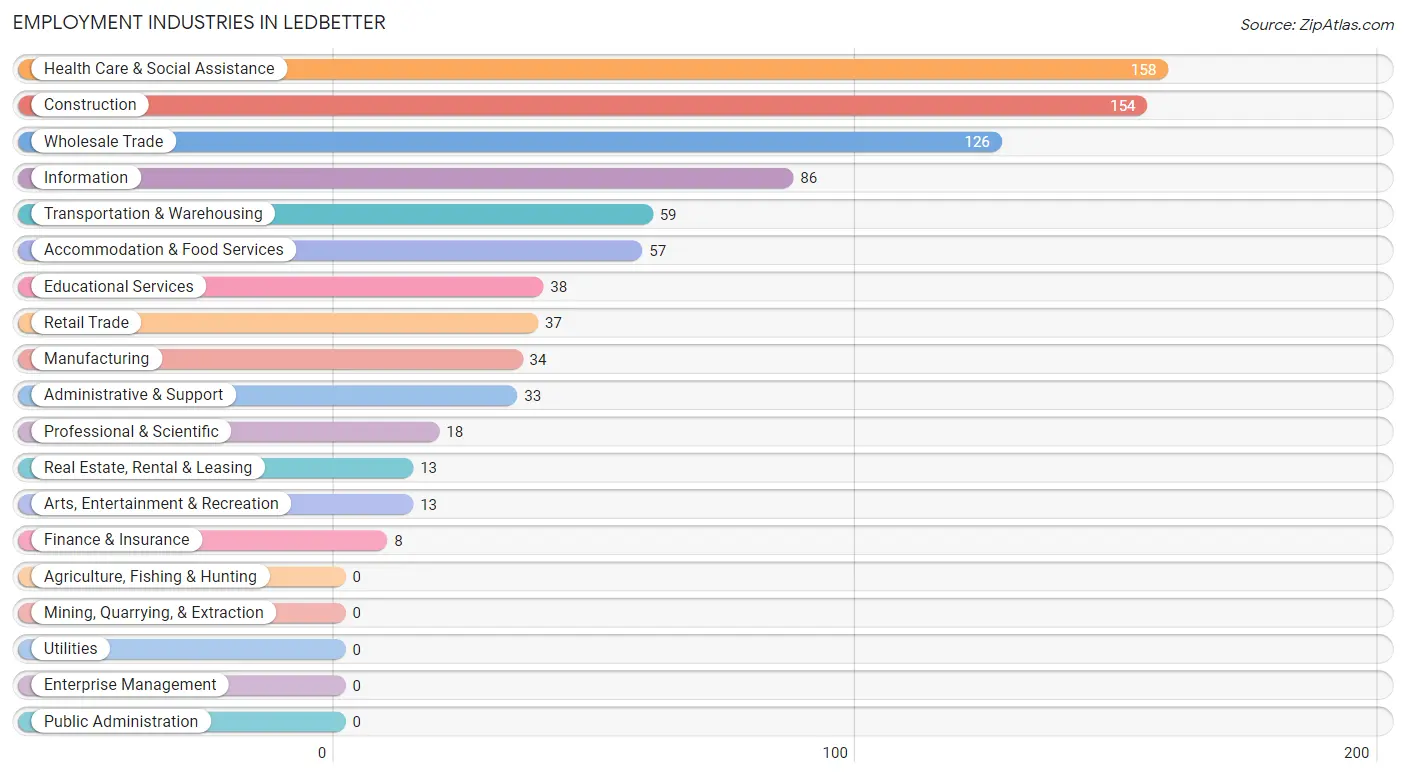
Employment Industries in Ledbetter
The major employment industries in Ledbetter include Health Care & Social Assistance (158 | 18.6%), Construction (154 | 18.1%), Wholesale Trade (126 | 14.8%), Information (86 | 10.1%), and Transportation & Warehousing (59 | 7.0%).
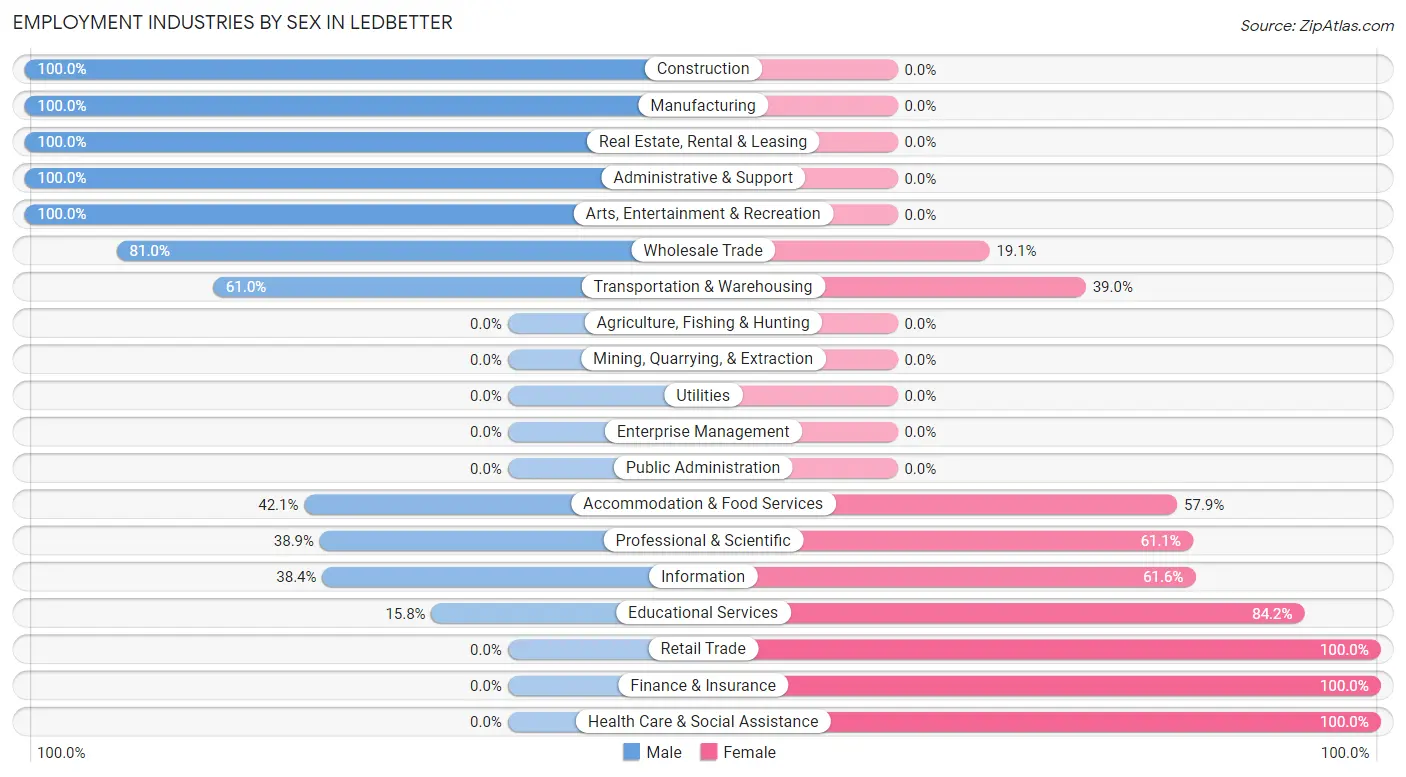
Employment Industries by Sex in Ledbetter
The Ledbetter industries that see more men than women are Construction (100.0%), Manufacturing (100.0%), and Real Estate, Rental & Leasing (100.0%), whereas the industries that tend to have a higher number of women are Retail Trade (100.0%), Finance & Insurance (100.0%), and Health Care & Social Assistance (100.0%).
| Industry | Male | Female |
| Agriculture, Fishing & Hunting | 0 (0.0%) | 0 (0.0%) |
| Mining, Quarrying, & Extraction | 0 (0.0%) | 0 (0.0%) |
| Construction | 154 (100.0%) | 0 (0.0%) |
| Manufacturing | 34 (100.0%) | 0 (0.0%) |
| Wholesale Trade | 102 (80.9%) | 24 (19.1%) |
| Retail Trade | 0 (0.0%) | 37 (100.0%) |
| Transportation & Warehousing | 36 (61.0%) | 23 (39.0%) |
| Utilities | 0 (0.0%) | 0 (0.0%) |
| Information | 33 (38.4%) | 53 (61.6%) |
| Finance & Insurance | 0 (0.0%) | 8 (100.0%) |
| Real Estate, Rental & Leasing | 13 (100.0%) | 0 (0.0%) |
| Professional & Scientific | 7 (38.9%) | 11 (61.1%) |
| Enterprise Management | 0 (0.0%) | 0 (0.0%) |
| Administrative & Support | 33 (100.0%) | 0 (0.0%) |
| Educational Services | 6 (15.8%) | 32 (84.2%) |
| Health Care & Social Assistance | 0 (0.0%) | 158 (100.0%) |
| Arts, Entertainment & Recreation | 13 (100.0%) | 0 (0.0%) |
| Accommodation & Food Services | 24 (42.1%) | 33 (57.9%) |
| Public Administration | 0 (0.0%) | 0 (0.0%) |
| Total | 455 (53.6%) | 394 (46.4%) |
Education in Ledbetter
School Enrollment in Ledbetter
The most common levels of schooling among the 395 students in Ledbetter are elementary school (123 | 31.1%), middle school (112 | 28.3%), and college / undergraduate (67 | 17.0%).
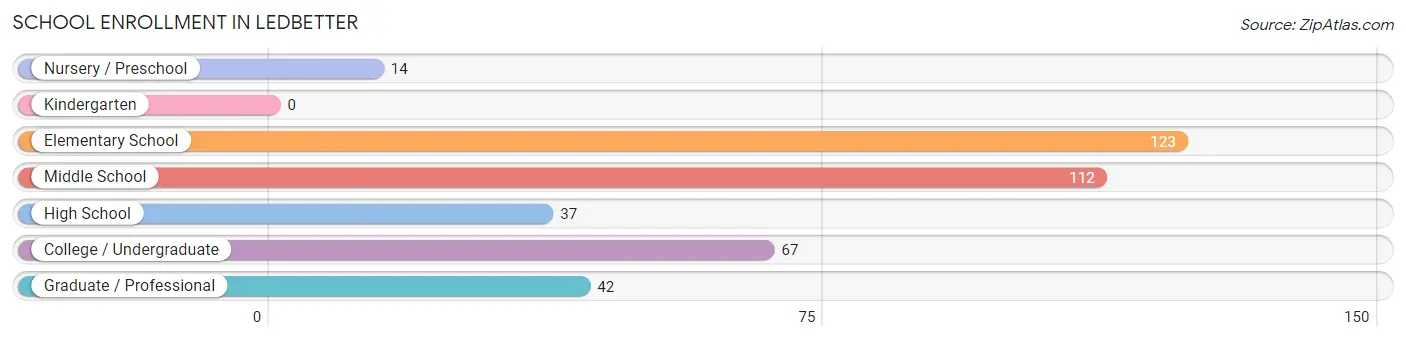
| School Level | # Students | % Students |
| Nursery / Preschool | 14 | 3.5% |
| Kindergarten | 0 | 0.0% |
| Elementary School | 123 | 31.1% |
| Middle School | 112 | 28.3% |
| High School | 37 | 9.4% |
| College / Undergraduate | 67 | 17.0% |
| Graduate / Professional | 42 | 10.6% |
| Total | 395 | 100.0% |
School Enrollment by Age by Funding Source in Ledbetter
Out of a total of 395 students who are enrolled in schools in Ledbetter, 109 (27.6%) attend a private institution, while the remaining 286 (72.4%) are enrolled in public schools. The age group of 10 to 14 year olds has the highest likelihood of being enrolled in private schools, with 96 (56.8% in the age bracket) enrolled. Conversely, the age group of 15 to 17 year olds has the lowest likelihood of being enrolled in a private school, with 37 (100.0% in the age bracket) attending a public institution.
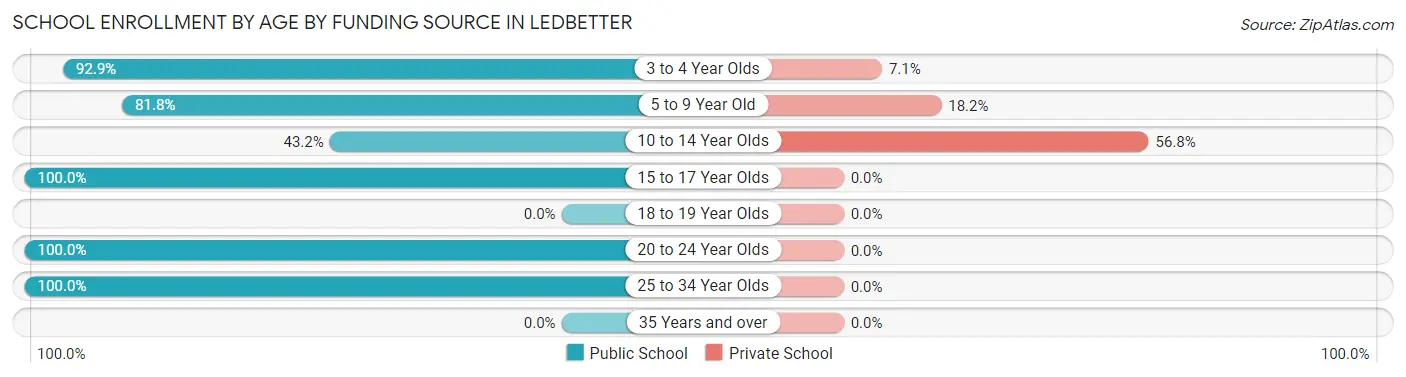
| Age Bracket | Public School | Private School |
| 3 to 4 Year Olds | 13 (92.9%) | 1 (7.1%) |
| 5 to 9 Year Old | 54 (81.8%) | 12 (18.2%) |
| 10 to 14 Year Olds | 73 (43.2%) | 96 (56.8%) |
| 15 to 17 Year Olds | 37 (100.0%) | 0 (0.0%) |
| 18 to 19 Year Olds | 0 (0.0%) | 0 (0.0%) |
| 20 to 24 Year Olds | 13 (100.0%) | 0 (0.0%) |
| 25 to 34 Year Olds | 96 (100.0%) | 0 (0.0%) |
| 35 Years and over | 0 (0.0%) | 0 (0.0%) |
| Total | 286 (72.4%) | 109 (27.6%) |
Educational Attainment by Field of Study in Ledbetter
Business (54 | 36.5%), science & technology (23 | 15.5%), social sciences (21 | 14.2%), communications (21 | 14.2%), and education (16 | 10.8%) are the most common fields of study among 148 individuals in Ledbetter who have obtained a bachelor's degree or higher.
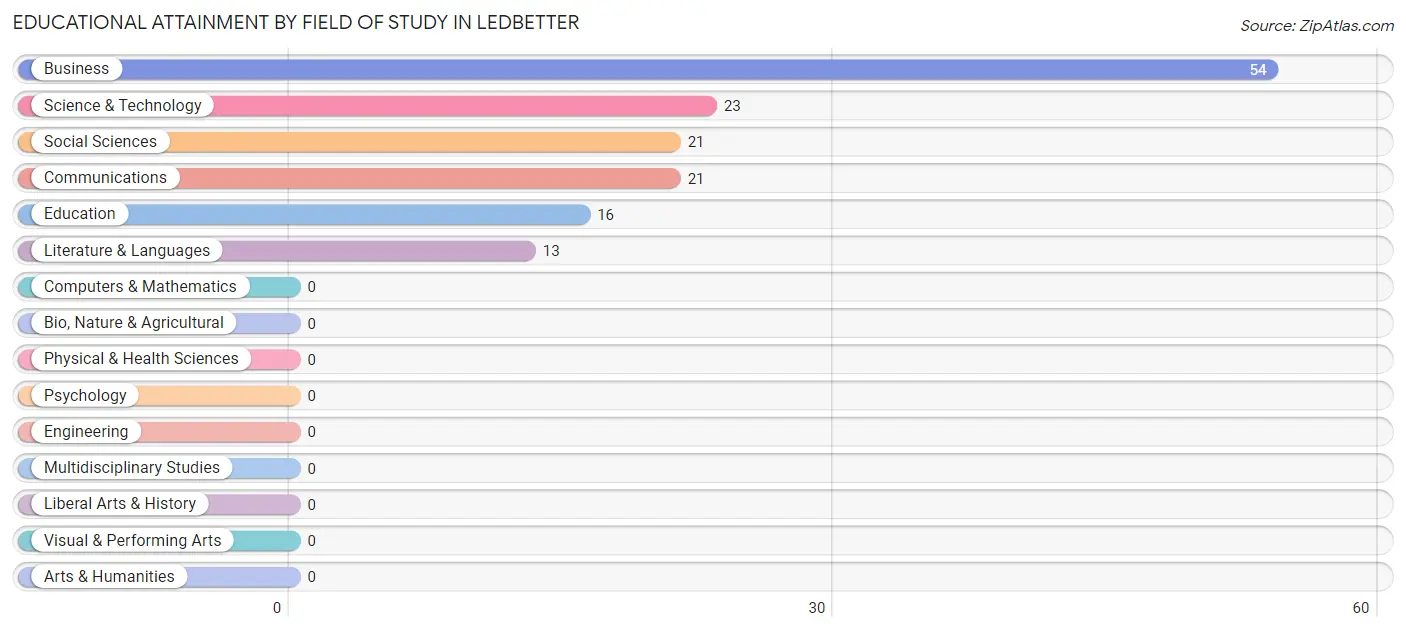
| Field of Study | # Graduates | % Graduates |
| Computers & Mathematics | 0 | 0.0% |
| Bio, Nature & Agricultural | 0 | 0.0% |
| Physical & Health Sciences | 0 | 0.0% |
| Psychology | 0 | 0.0% |
| Social Sciences | 21 | 14.2% |
| Engineering | 0 | 0.0% |
| Multidisciplinary Studies | 0 | 0.0% |
| Science & Technology | 23 | 15.5% |
| Business | 54 | 36.5% |
| Education | 16 | 10.8% |
| Literature & Languages | 13 | 8.8% |
| Liberal Arts & History | 0 | 0.0% |
| Visual & Performing Arts | 0 | 0.0% |
| Communications | 21 | 14.2% |
| Arts & Humanities | 0 | 0.0% |
| Total | 148 | 100.0% |
Transportation & Commute in Ledbetter
Vehicle Availability by Sex in Ledbetter
The most prevalent vehicle ownership categories in Ledbetter are males with 2 vehicles (271, accounting for 59.6%) and females with 2 vehicles (142, making up 68.8%).
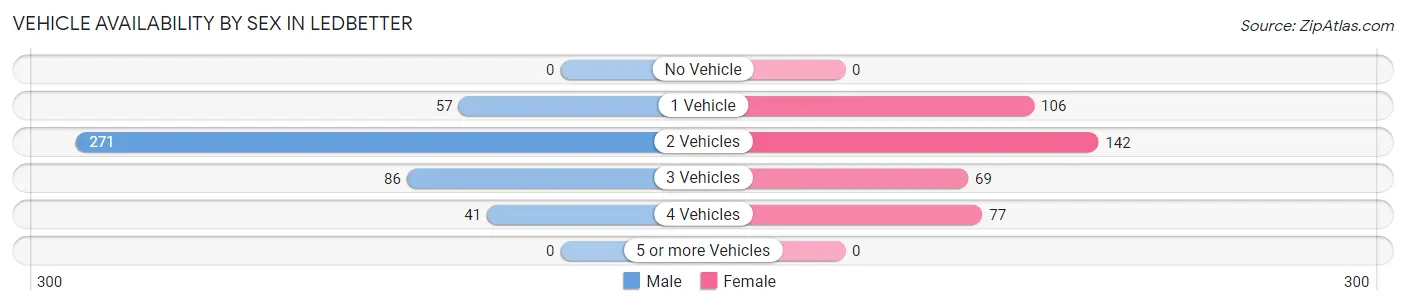
| Vehicles Available | Male | Female |
| No Vehicle | 0 (0.0%) | 0 (0.0%) |
| 1 Vehicle | 57 (12.5%) | 106 (26.9%) |
| 2 Vehicles | 271 (59.6%) | 142 (36.0%) |
| 3 Vehicles | 86 (18.9%) | 69 (17.5%) |
| 4 Vehicles | 41 (9.0%) | 77 (19.5%) |
| 5 or more Vehicles | 0 (0.0%) | 0 (0.0%) |
| Total | 455 (100.0%) | 394 (100.0%) |
Commute Time in Ledbetter
The most frequently occuring commute durations in Ledbetter are 20 to 24 minutes (412 commuters, 49.9%), 15 to 19 minutes (154 commuters, 18.7%), and 5 to 9 minutes (86 commuters, 10.4%).
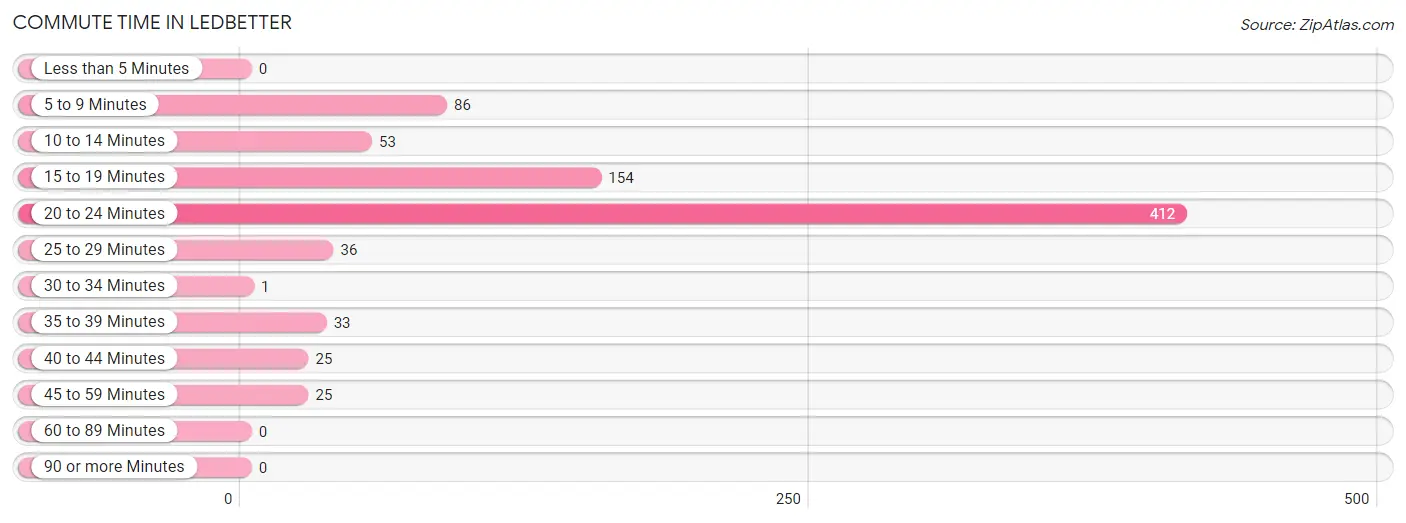
| Commute Time | # Commuters | % Commuters |
| Less than 5 Minutes | 0 | 0.0% |
| 5 to 9 Minutes | 86 | 10.4% |
| 10 to 14 Minutes | 53 | 6.4% |
| 15 to 19 Minutes | 154 | 18.7% |
| 20 to 24 Minutes | 412 | 49.9% |
| 25 to 29 Minutes | 36 | 4.4% |
| 30 to 34 Minutes | 1 | 0.1% |
| 35 to 39 Minutes | 33 | 4.0% |
| 40 to 44 Minutes | 25 | 3.0% |
| 45 to 59 Minutes | 25 | 3.0% |
| 60 to 89 Minutes | 0 | 0.0% |
| 90 or more Minutes | 0 | 0.0% |
Commute Time by Sex in Ledbetter
The most common commute times in Ledbetter are 20 to 24 minutes (272 commuters, 59.8%) for males and 20 to 24 minutes (140 commuters, 37.8%) for females.
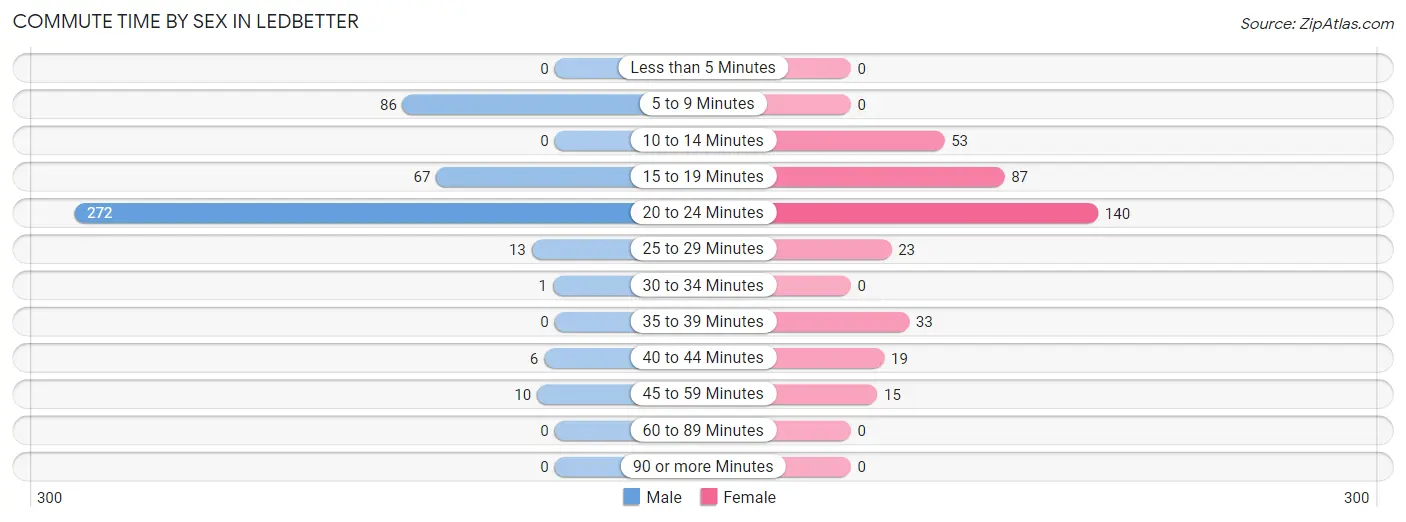
| Commute Time | Male | Female |
| Less than 5 Minutes | 0 (0.0%) | 0 (0.0%) |
| 5 to 9 Minutes | 86 (18.9%) | 0 (0.0%) |
| 10 to 14 Minutes | 0 (0.0%) | 53 (14.3%) |
| 15 to 19 Minutes | 67 (14.7%) | 87 (23.5%) |
| 20 to 24 Minutes | 272 (59.8%) | 140 (37.8%) |
| 25 to 29 Minutes | 13 (2.9%) | 23 (6.2%) |
| 30 to 34 Minutes | 1 (0.2%) | 0 (0.0%) |
| 35 to 39 Minutes | 0 (0.0%) | 33 (8.9%) |
| 40 to 44 Minutes | 6 (1.3%) | 19 (5.1%) |
| 45 to 59 Minutes | 10 (2.2%) | 15 (4.1%) |
| 60 to 89 Minutes | 0 (0.0%) | 0 (0.0%) |
| 90 or more Minutes | 0 (0.0%) | 0 (0.0%) |
Time of Departure to Work by Sex in Ledbetter
The most frequent times of departure to work in Ledbetter are 7:00 AM to 7:29 AM (133, 29.2%) for males and 7:00 AM to 7:29 AM (94, 25.4%) for females.
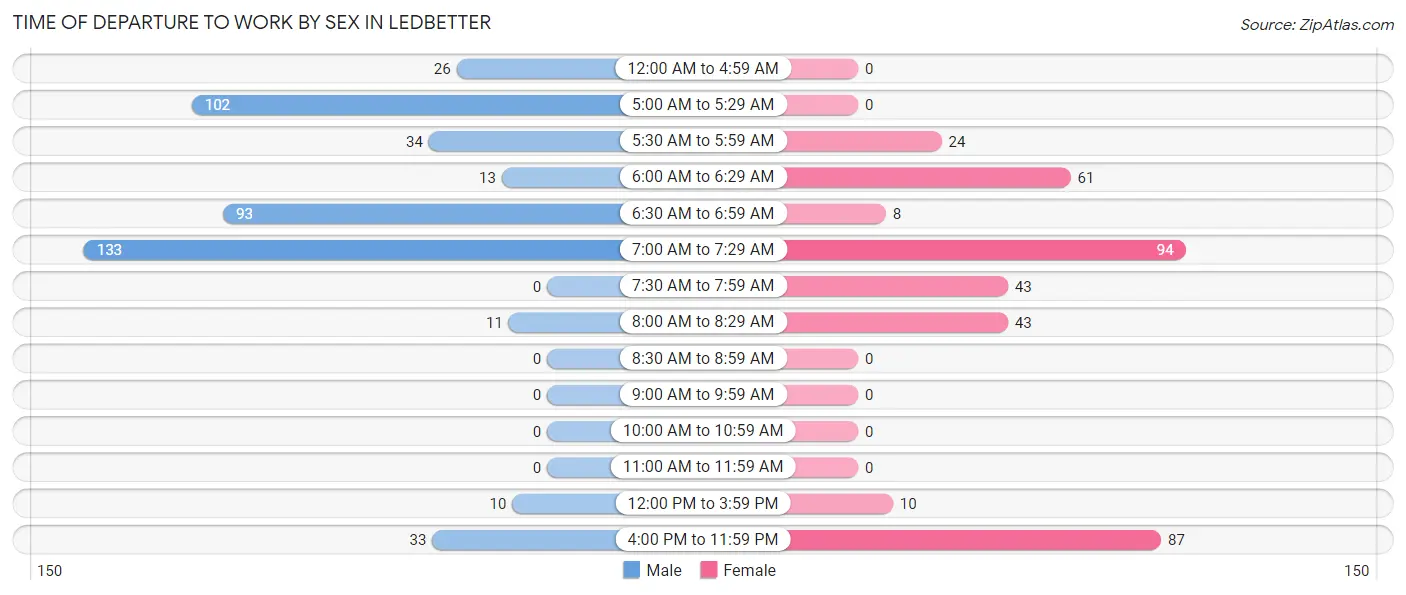
| Time of Departure | Male | Female |
| 12:00 AM to 4:59 AM | 26 (5.7%) | 0 (0.0%) |
| 5:00 AM to 5:29 AM | 102 (22.4%) | 0 (0.0%) |
| 5:30 AM to 5:59 AM | 34 (7.5%) | 24 (6.5%) |
| 6:00 AM to 6:29 AM | 13 (2.9%) | 61 (16.5%) |
| 6:30 AM to 6:59 AM | 93 (20.4%) | 8 (2.2%) |
| 7:00 AM to 7:29 AM | 133 (29.2%) | 94 (25.4%) |
| 7:30 AM to 7:59 AM | 0 (0.0%) | 43 (11.6%) |
| 8:00 AM to 8:29 AM | 11 (2.4%) | 43 (11.6%) |
| 8:30 AM to 8:59 AM | 0 (0.0%) | 0 (0.0%) |
| 9:00 AM to 9:59 AM | 0 (0.0%) | 0 (0.0%) |
| 10:00 AM to 10:59 AM | 0 (0.0%) | 0 (0.0%) |
| 11:00 AM to 11:59 AM | 0 (0.0%) | 0 (0.0%) |
| 12:00 PM to 3:59 PM | 10 (2.2%) | 10 (2.7%) |
| 4:00 PM to 11:59 PM | 33 (7.2%) | 87 (23.5%) |
| Total | 455 (100.0%) | 370 (100.0%) |
Housing Occupancy in Ledbetter
Occupancy by Ownership in Ledbetter
Of the total 634 dwellings in Ledbetter, owner-occupied units account for 529 (83.4%), while renter-occupied units make up 105 (16.6%).
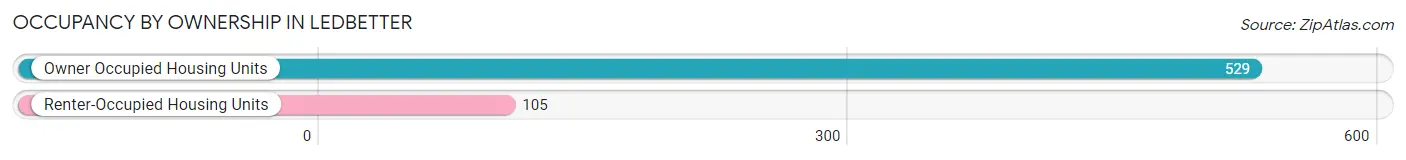
| Occupancy | # Housing Units | % Housing Units |
| Owner Occupied Housing Units | 529 | 83.4% |
| Renter-Occupied Housing Units | 105 | 16.6% |
| Total Occupied Housing Units | 634 | 100.0% |
Occupancy by Household Size in Ledbetter
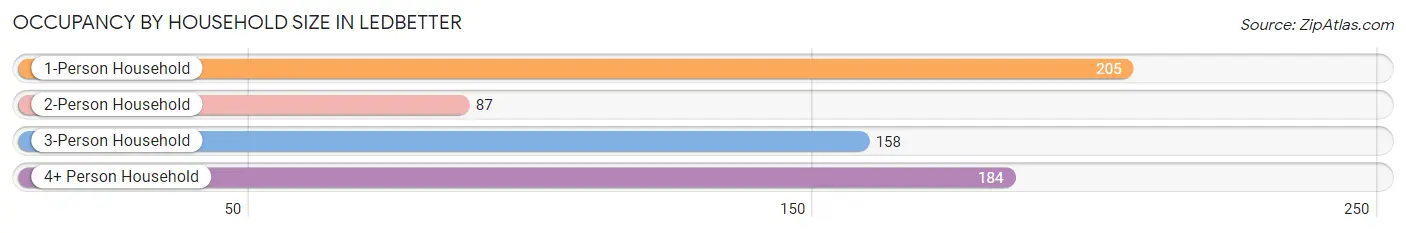
| Household Size | # Housing Units | % Housing Units |
| 1-Person Household | 205 | 32.3% |
| 2-Person Household | 87 | 13.7% |
| 3-Person Household | 158 | 24.9% |
| 4+ Person Household | 184 | 29.0% |
| Total Housing Units | 634 | 100.0% |
Occupancy by Ownership by Household Size in Ledbetter
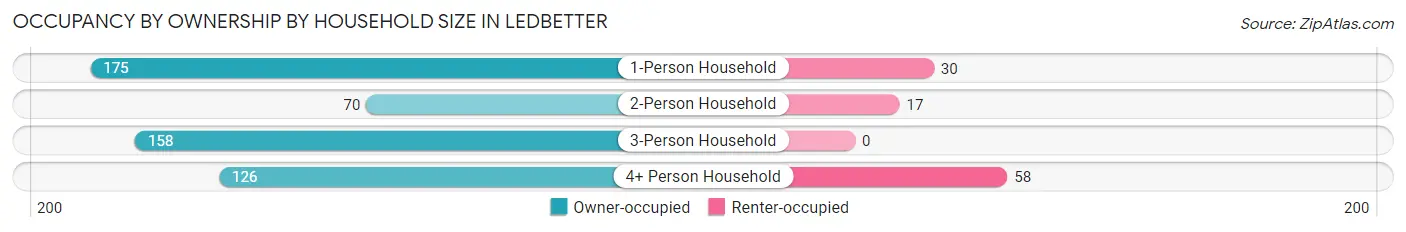
| Household Size | Owner-occupied | Renter-occupied |
| 1-Person Household | 175 (85.4%) | 30 (14.6%) |
| 2-Person Household | 70 (80.5%) | 17 (19.5%) |
| 3-Person Household | 158 (100.0%) | 0 (0.0%) |
| 4+ Person Household | 126 (68.5%) | 58 (31.5%) |
| Total Housing Units | 529 (83.4%) | 105 (16.6%) |
Occupancy by Educational Attainment in Ledbetter
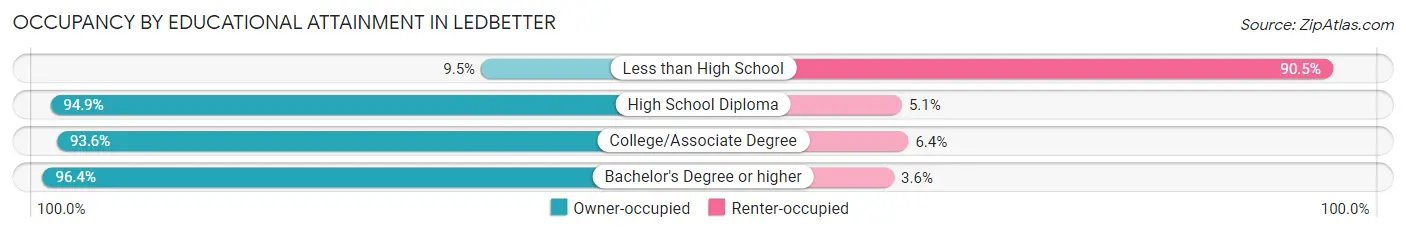
| Household Size | Owner-occupied | Renter-occupied |
| Less than High School | 8 (9.5%) | 76 (90.5%) |
| High School Diploma | 223 (94.9%) | 12 (5.1%) |
| College/Associate Degree | 190 (93.6%) | 13 (6.4%) |
| Bachelor's Degree or higher | 108 (96.4%) | 4 (3.6%) |
Occupancy by Age of Householder in Ledbetter
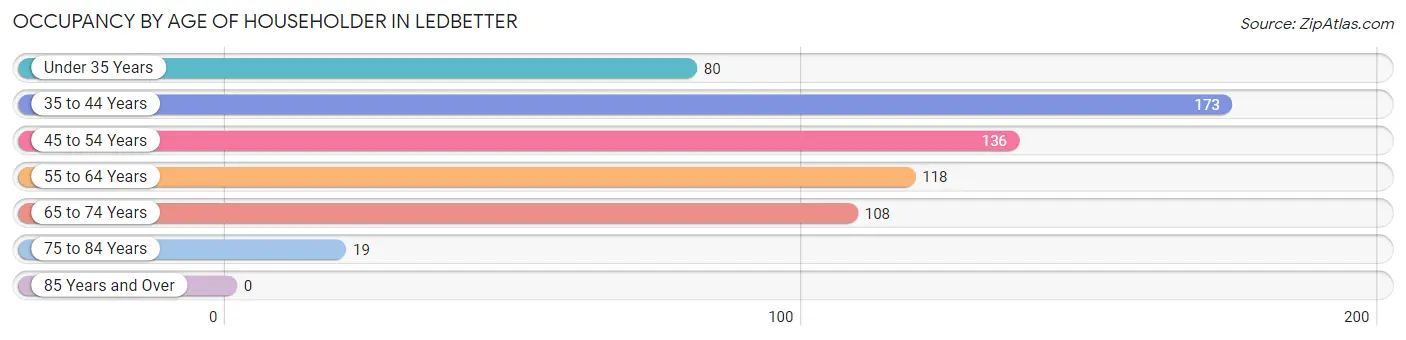
| Age Bracket | # Households | % Households |
| Under 35 Years | 80 | 12.6% |
| 35 to 44 Years | 173 | 27.3% |
| 45 to 54 Years | 136 | 21.4% |
| 55 to 64 Years | 118 | 18.6% |
| 65 to 74 Years | 108 | 17.0% |
| 75 to 84 Years | 19 | 3.0% |
| 85 Years and Over | 0 | 0.0% |
| Total | 634 | 100.0% |
Housing Finances in Ledbetter
Median Income by Occupancy in Ledbetter
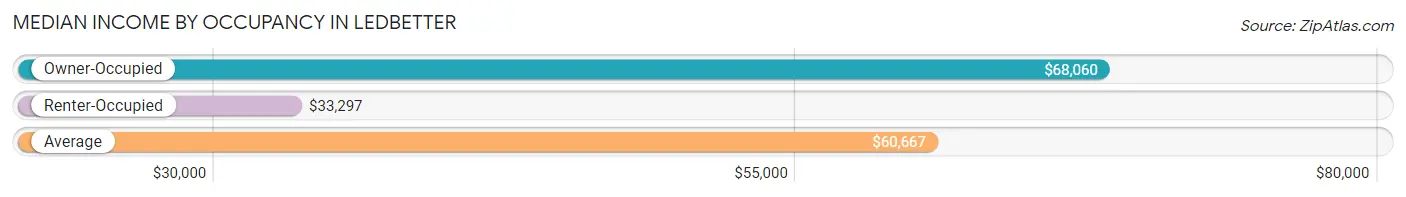
| Occupancy Type | # Households | Median Income |
| Owner-Occupied | 529 (83.4%) | $68,060 |
| Renter-Occupied | 105 (16.6%) | $33,297 |
| Average | 634 (100.0%) | $60,667 |
Occupancy by Householder Income Bracket in Ledbetter
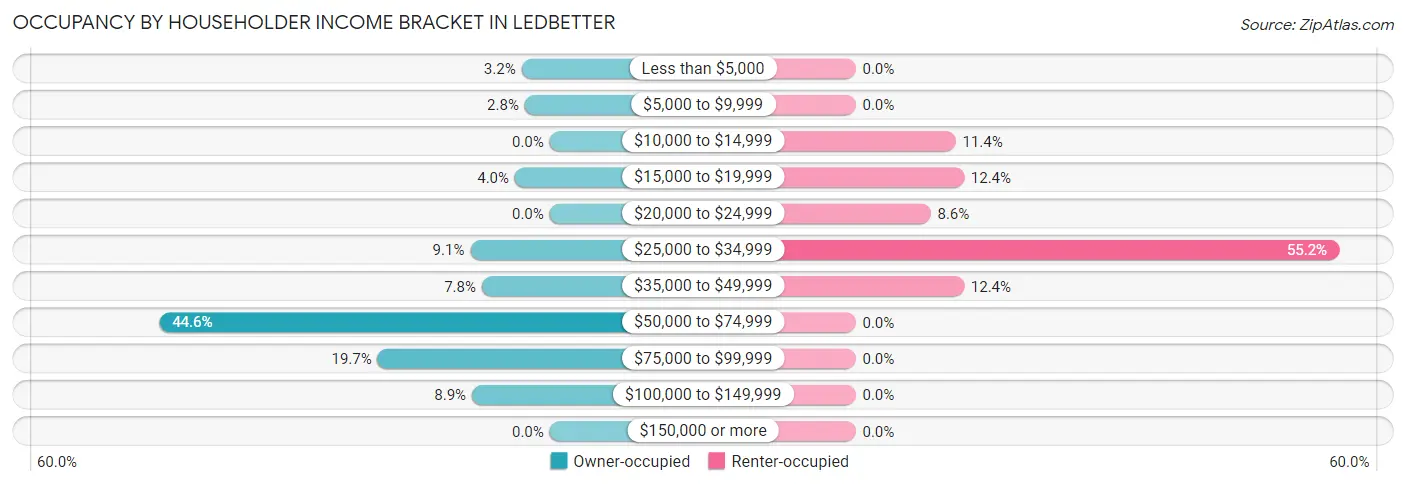
| Income Bracket | Owner-occupied | Renter-occupied |
| Less than $5,000 | 17 (3.2%) | 0 (0.0%) |
| $5,000 to $9,999 | 15 (2.8%) | 0 (0.0%) |
| $10,000 to $14,999 | 0 (0.0%) | 12 (11.4%) |
| $15,000 to $19,999 | 21 (4.0%) | 13 (12.4%) |
| $20,000 to $24,999 | 0 (0.0%) | 9 (8.6%) |
| $25,000 to $34,999 | 48 (9.1%) | 58 (55.2%) |
| $35,000 to $49,999 | 41 (7.7%) | 13 (12.4%) |
| $50,000 to $74,999 | 236 (44.6%) | 0 (0.0%) |
| $75,000 to $99,999 | 104 (19.7%) | 0 (0.0%) |
| $100,000 to $149,999 | 47 (8.9%) | 0 (0.0%) |
| $150,000 or more | 0 (0.0%) | 0 (0.0%) |
| Total | 529 (100.0%) | 105 (100.0%) |
Monthly Housing Cost Tiers in Ledbetter
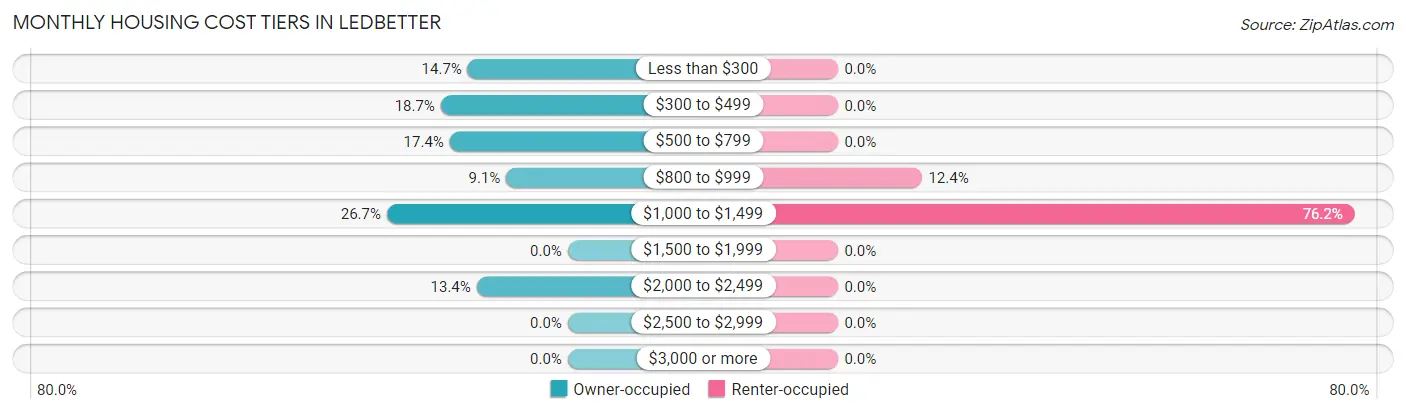
| Monthly Cost | Owner-occupied | Renter-occupied |
| Less than $300 | 78 (14.7%) | 0 (0.0%) |
| $300 to $499 | 99 (18.7%) | 0 (0.0%) |
| $500 to $799 | 92 (17.4%) | 0 (0.0%) |
| $800 to $999 | 48 (9.1%) | 13 (12.4%) |
| $1,000 to $1,499 | 141 (26.7%) | 80 (76.2%) |
| $1,500 to $1,999 | 0 (0.0%) | 0 (0.0%) |
| $2,000 to $2,499 | 71 (13.4%) | 0 (0.0%) |
| $2,500 to $2,999 | 0 (0.0%) | 0 (0.0%) |
| $3,000 or more | 0 (0.0%) | 0 (0.0%) |
| Total | 529 (100.0%) | 105 (100.0%) |
Physical Housing Characteristics in Ledbetter
Housing Structures in Ledbetter
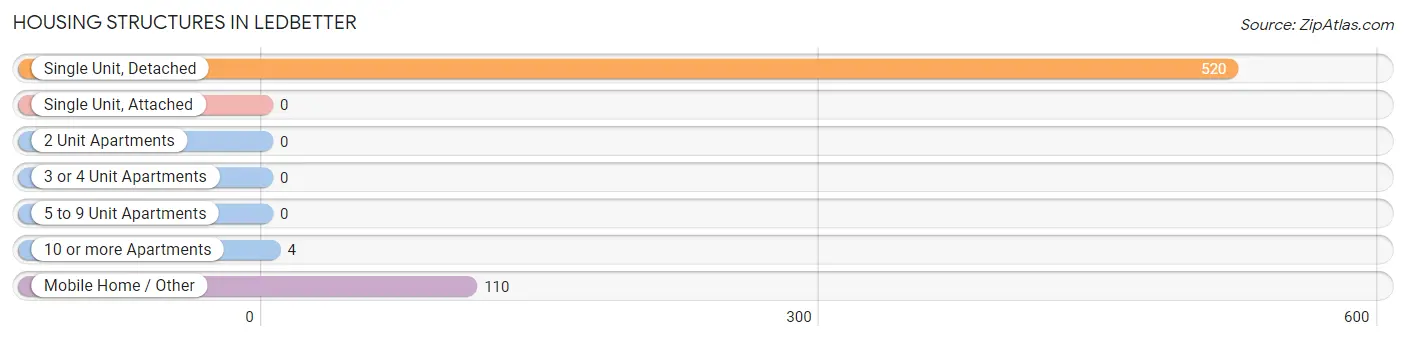
| Structure Type | # Housing Units | % Housing Units |
| Single Unit, Detached | 520 | 82.0% |
| Single Unit, Attached | 0 | 0.0% |
| 2 Unit Apartments | 0 | 0.0% |
| 3 or 4 Unit Apartments | 0 | 0.0% |
| 5 to 9 Unit Apartments | 0 | 0.0% |
| 10 or more Apartments | 4 | 0.6% |
| Mobile Home / Other | 110 | 17.3% |
| Total | 634 | 100.0% |
Housing Structures by Occupancy in Ledbetter
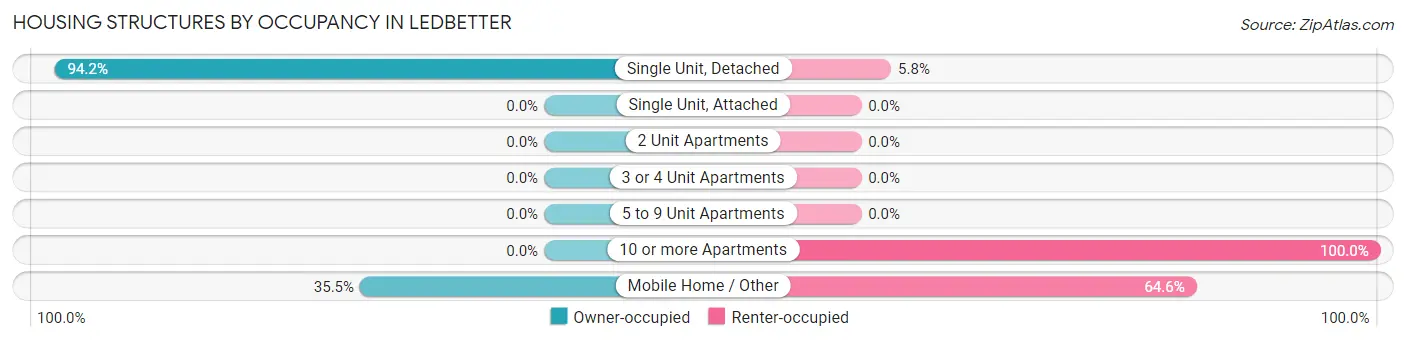
| Structure Type | Owner-occupied | Renter-occupied |
| Single Unit, Detached | 490 (94.2%) | 30 (5.8%) |
| Single Unit, Attached | 0 (0.0%) | 0 (0.0%) |
| 2 Unit Apartments | 0 (0.0%) | 0 (0.0%) |
| 3 or 4 Unit Apartments | 0 (0.0%) | 0 (0.0%) |
| 5 to 9 Unit Apartments | 0 (0.0%) | 0 (0.0%) |
| 10 or more Apartments | 0 (0.0%) | 4 (100.0%) |
| Mobile Home / Other | 39 (35.4%) | 71 (64.5%) |
| Total | 529 (83.4%) | 105 (16.6%) |
Housing Structures by Number of Rooms in Ledbetter
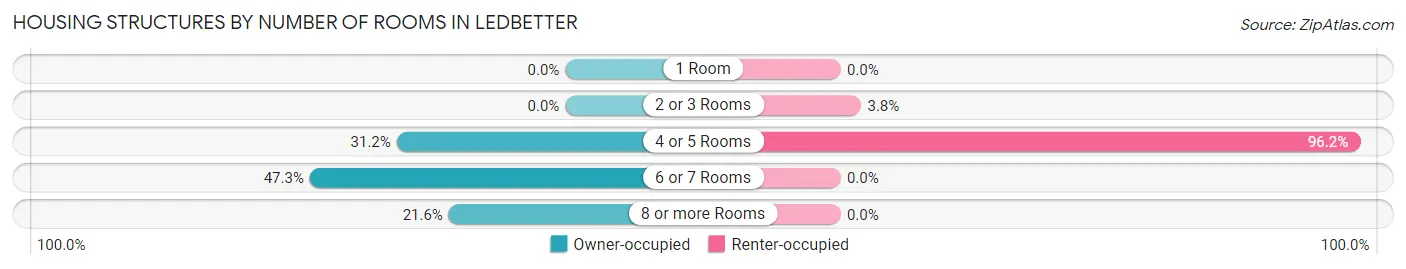
| Number of Rooms | Owner-occupied | Renter-occupied |
| 1 Room | 0 (0.0%) | 0 (0.0%) |
| 2 or 3 Rooms | 0 (0.0%) | 4 (3.8%) |
| 4 or 5 Rooms | 165 (31.2%) | 101 (96.2%) |
| 6 or 7 Rooms | 250 (47.3%) | 0 (0.0%) |
| 8 or more Rooms | 114 (21.5%) | 0 (0.0%) |
| Total | 529 (100.0%) | 105 (100.0%) |
Housing Structure by Heating Type in Ledbetter
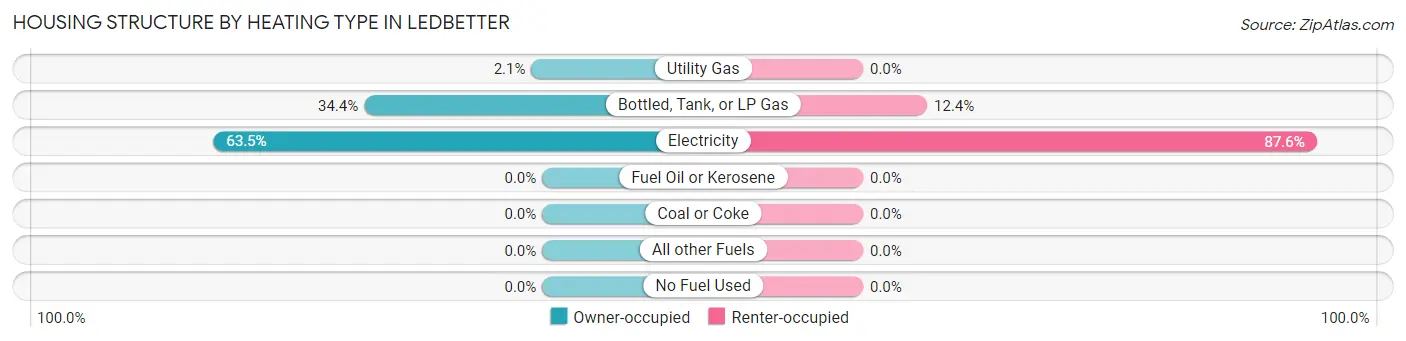
| Heating Type | Owner-occupied | Renter-occupied |
| Utility Gas | 11 (2.1%) | 0 (0.0%) |
| Bottled, Tank, or LP Gas | 182 (34.4%) | 13 (12.4%) |
| Electricity | 336 (63.5%) | 92 (87.6%) |
| Fuel Oil or Kerosene | 0 (0.0%) | 0 (0.0%) |
| Coal or Coke | 0 (0.0%) | 0 (0.0%) |
| All other Fuels | 0 (0.0%) | 0 (0.0%) |
| No Fuel Used | 0 (0.0%) | 0 (0.0%) |
| Total | 529 (100.0%) | 105 (100.0%) |
Household Vehicle Usage in Ledbetter
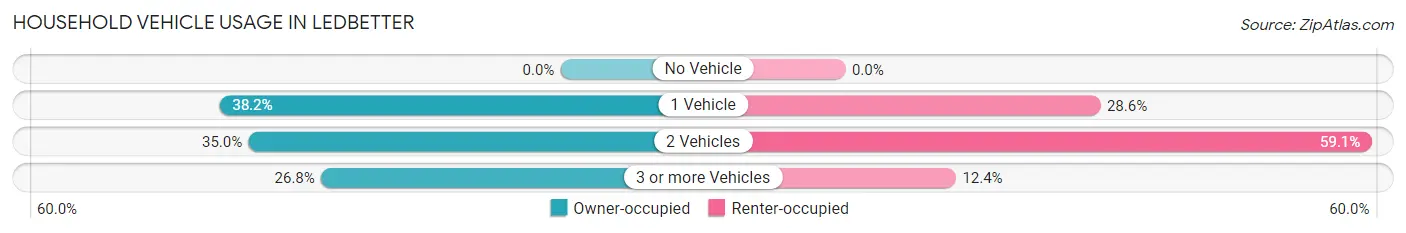
| Vehicles per Household | Owner-occupied | Renter-occupied |
| No Vehicle | 0 (0.0%) | 0 (0.0%) |
| 1 Vehicle | 202 (38.2%) | 30 (28.6%) |
| 2 Vehicles | 185 (35.0%) | 62 (59.1%) |
| 3 or more Vehicles | 142 (26.8%) | 13 (12.4%) |
| Total | 529 (100.0%) | 105 (100.0%) |
Real Estate & Mortgages in Ledbetter
Real Estate and Mortgage Overview in Ledbetter
| Characteristic | Without Mortgage | With Mortgage |
| Housing Units | 233 | 296 |
| Median Property Value | $105,600 | $124,100 |
| Median Household Income | $60,781 | $0 |
| Monthly Housing Costs | $431 | $0 |
| Real Estate Taxes | $757 | $74 |
Property Value by Mortgage Status in Ledbetter
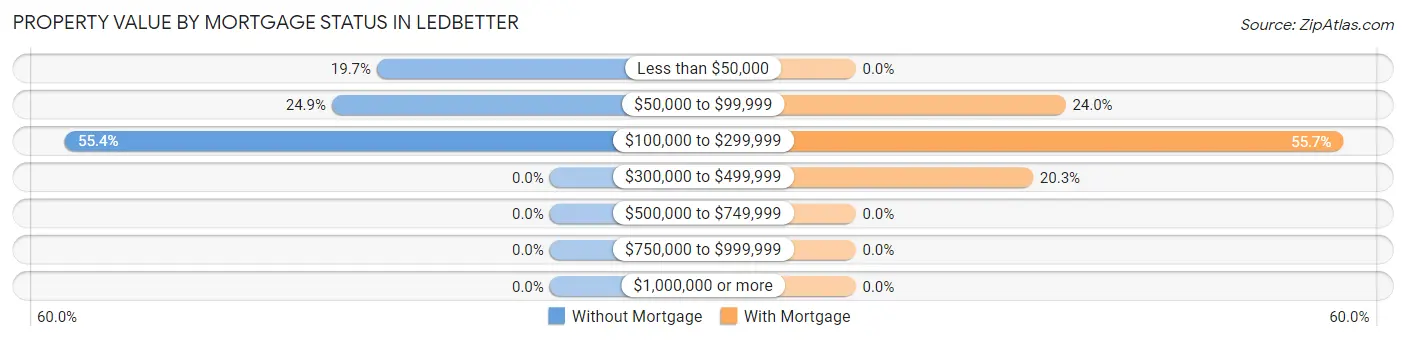
| Property Value | Without Mortgage | With Mortgage |
| Less than $50,000 | 46 (19.7%) | 0 (0.0%) |
| $50,000 to $99,999 | 58 (24.9%) | 71 (24.0%) |
| $100,000 to $299,999 | 129 (55.4%) | 165 (55.7%) |
| $300,000 to $499,999 | 0 (0.0%) | 60 (20.3%) |
| $500,000 to $749,999 | 0 (0.0%) | 0 (0.0%) |
| $750,000 to $999,999 | 0 (0.0%) | 0 (0.0%) |
| $1,000,000 or more | 0 (0.0%) | 0 (0.0%) |
| Total | 233 (100.0%) | 296 (100.0%) |
Household Income by Mortgage Status in Ledbetter
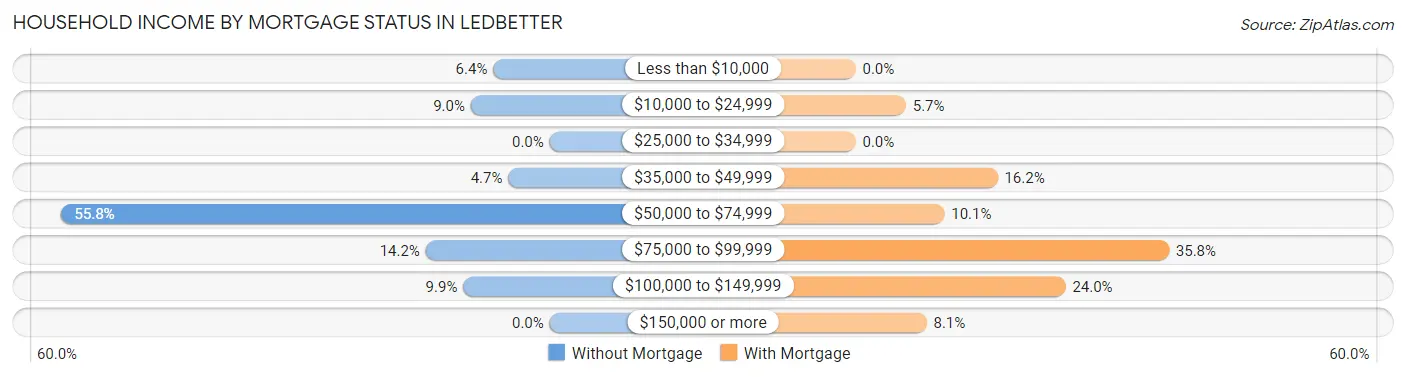
| Household Income | Without Mortgage | With Mortgage |
| Less than $10,000 | 15 (6.4%) | 0 (0.0%) |
| $10,000 to $24,999 | 21 (9.0%) | 17 (5.7%) |
| $25,000 to $34,999 | 0 (0.0%) | 0 (0.0%) |
| $35,000 to $49,999 | 11 (4.7%) | 48 (16.2%) |
| $50,000 to $74,999 | 130 (55.8%) | 30 (10.1%) |
| $75,000 to $99,999 | 33 (14.2%) | 106 (35.8%) |
| $100,000 to $149,999 | 23 (9.9%) | 71 (24.0%) |
| $150,000 or more | 0 (0.0%) | 24 (8.1%) |
| Total | 233 (100.0%) | 296 (100.0%) |
Property Value to Household Income Ratio in Ledbetter
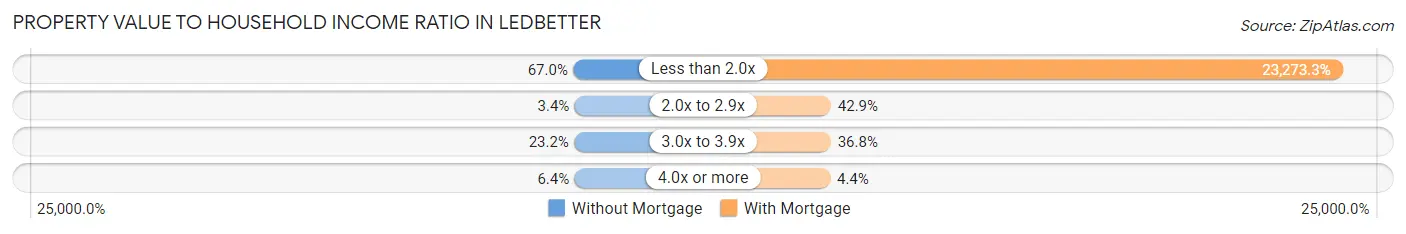
| Value-to-Income Ratio | Without Mortgage | With Mortgage |
| Less than 2.0x | 156 (66.9%) | 68,889 (23,273.3%) |
| 2.0x to 2.9x | 8 (3.4%) | 127 (42.9%) |
| 3.0x to 3.9x | 54 (23.2%) | 109 (36.8%) |
| 4.0x or more | 15 (6.4%) | 13 (4.4%) |
| Total | 233 (100.0%) | 296 (100.0%) |
Real Estate Taxes by Mortgage Status in Ledbetter
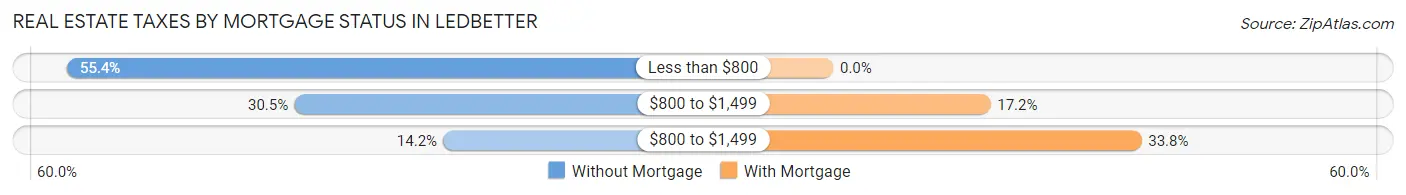
| Property Taxes | Without Mortgage | With Mortgage |
| Less than $800 | 129 (55.4%) | 0 (0.0%) |
| $800 to $1,499 | 71 (30.5%) | 51 (17.2%) |
| $800 to $1,499 | 33 (14.2%) | 100 (33.8%) |
| Total | 233 (100.0%) | 296 (100.0%) |
Health & Disability in Ledbetter
Health Insurance Coverage by Age in Ledbetter
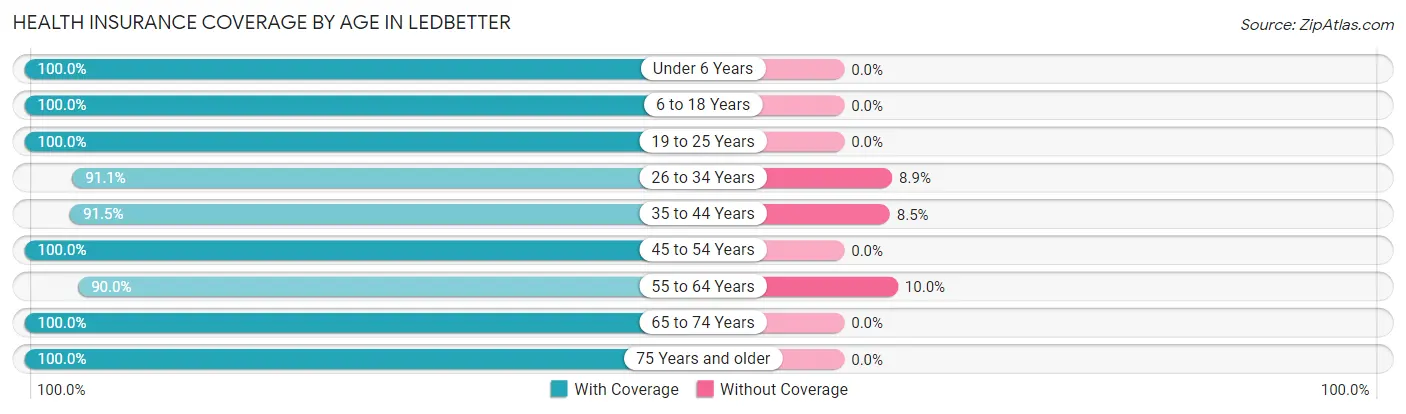
| Age Bracket | With Coverage | Without Coverage |
| Under 6 Years | 219 (100.0%) | 0 (0.0%) |
| 6 to 18 Years | 272 (100.0%) | 0 (0.0%) |
| 19 to 25 Years | 148 (100.0%) | 0 (0.0%) |
| 26 to 34 Years | 286 (91.1%) | 28 (8.9%) |
| 35 to 44 Years | 334 (91.5%) | 31 (8.5%) |
| 45 to 54 Years | 179 (100.0%) | 0 (0.0%) |
| 55 to 64 Years | 135 (90.0%) | 15 (10.0%) |
| 65 to 74 Years | 149 (100.0%) | 0 (0.0%) |
| 75 Years and older | 19 (100.0%) | 0 (0.0%) |
| Total | 1,741 (95.9%) | 74 (4.1%) |
Health Insurance Coverage by Citizenship Status in Ledbetter
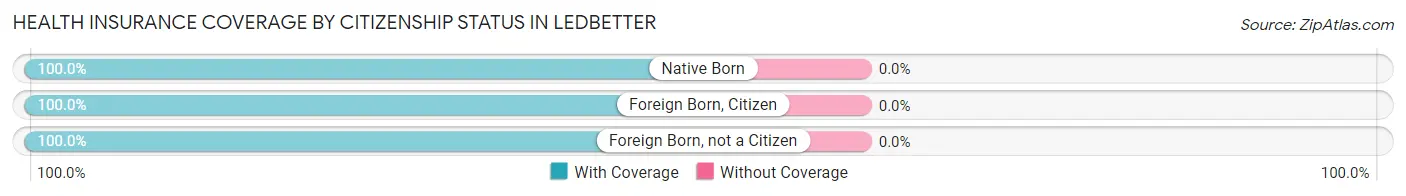
| Citizenship Status | With Coverage | Without Coverage |
| Native Born | 219 (100.0%) | 0 (0.0%) |
| Foreign Born, Citizen | 272 (100.0%) | 0 (0.0%) |
| Foreign Born, not a Citizen | 148 (100.0%) | 0 (0.0%) |
Health Insurance Coverage by Household Income in Ledbetter
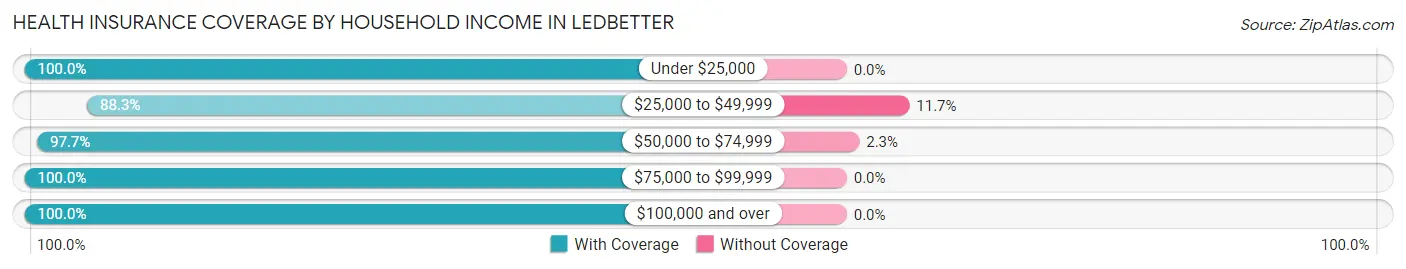
| Household Income | With Coverage | Without Coverage |
| Under $25,000 | 88 (100.0%) | 0 (0.0%) |
| $25,000 to $49,999 | 422 (88.3%) | 56 (11.7%) |
| $50,000 to $74,999 | 750 (97.7%) | 18 (2.3%) |
| $75,000 to $99,999 | 310 (100.0%) | 0 (0.0%) |
| $100,000 and over | 171 (100.0%) | 0 (0.0%) |
Public vs Private Health Insurance Coverage by Age in Ledbetter
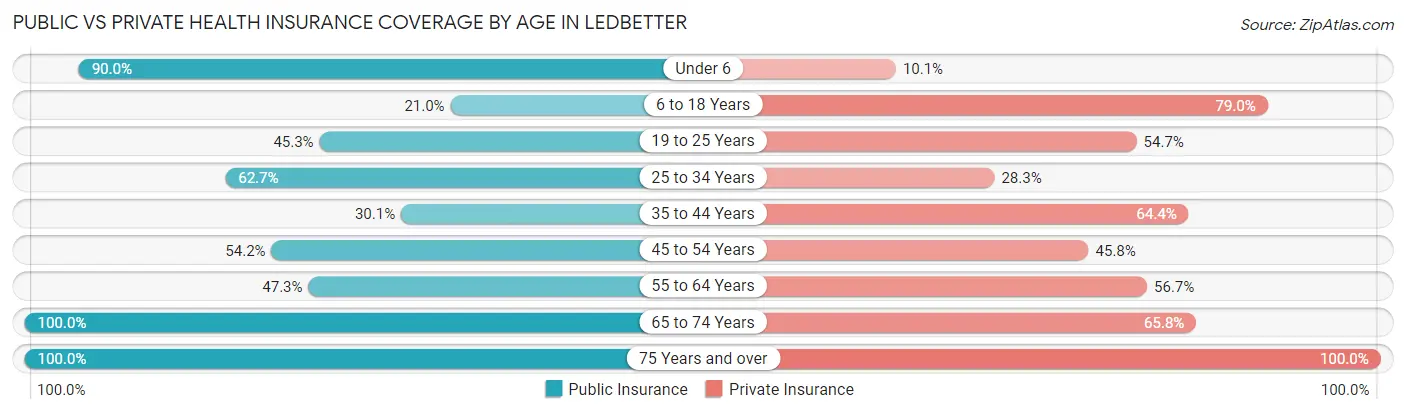
| Age Bracket | Public Insurance | Private Insurance |
| Under 6 | 197 (89.9%) | 22 (10.1%) |
| 6 to 18 Years | 57 (21.0%) | 215 (79.0%) |
| 19 to 25 Years | 67 (45.3%) | 81 (54.7%) |
| 25 to 34 Years | 197 (62.7%) | 89 (28.3%) |
| 35 to 44 Years | 110 (30.1%) | 235 (64.4%) |
| 45 to 54 Years | 97 (54.2%) | 82 (45.8%) |
| 55 to 64 Years | 71 (47.3%) | 85 (56.7%) |
| 65 to 74 Years | 149 (100.0%) | 98 (65.8%) |
| 75 Years and over | 19 (100.0%) | 19 (100.0%) |
| Total | 964 (53.1%) | 926 (51.0%) |
Disability Status by Sex by Age in Ledbetter
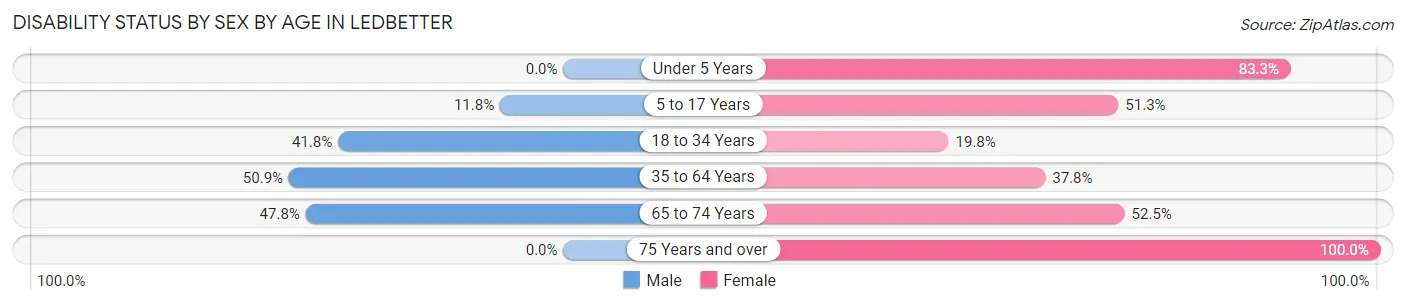
| Age Bracket | Male | Female |
| Under 5 Years | 0 (0.0%) | 110 (83.3%) |
| 5 to 17 Years | 10 (11.8%) | 96 (51.3%) |
| 18 to 34 Years | 92 (41.8%) | 48 (19.8%) |
| 35 to 64 Years | 162 (50.9%) | 142 (37.8%) |
| 65 to 74 Years | 33 (47.8%) | 42 (52.5%) |
| 75 Years and over | 0 (0.0%) | 19 (100.0%) |
Disability Class by Sex by Age in Ledbetter
Disability Class: Hearing Difficulty
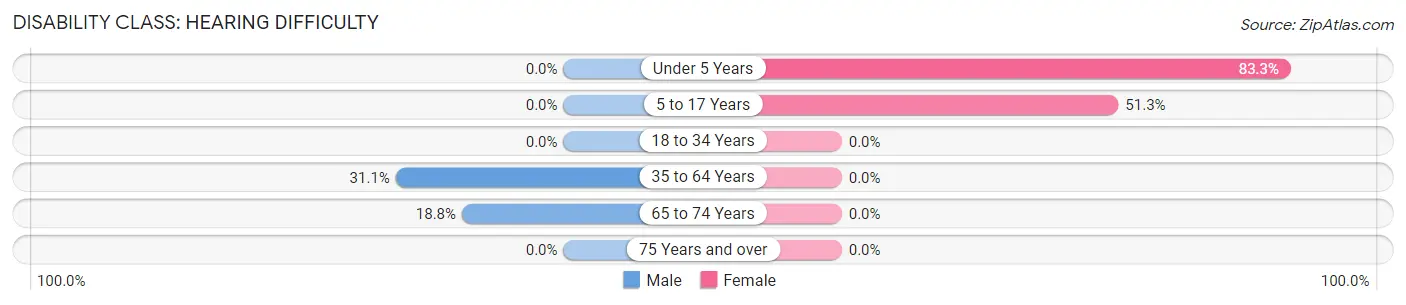
| Age Bracket | Male | Female |
| Under 5 Years | 0 (0.0%) | 110 (83.3%) |
| 5 to 17 Years | 0 (0.0%) | 96 (51.3%) |
| 18 to 34 Years | 0 (0.0%) | 0 (0.0%) |
| 35 to 64 Years | 99 (31.1%) | 0 (0.0%) |
| 65 to 74 Years | 13 (18.8%) | 0 (0.0%) |
| 75 Years and over | 0 (0.0%) | 0 (0.0%) |
Disability Class: Vision Difficulty
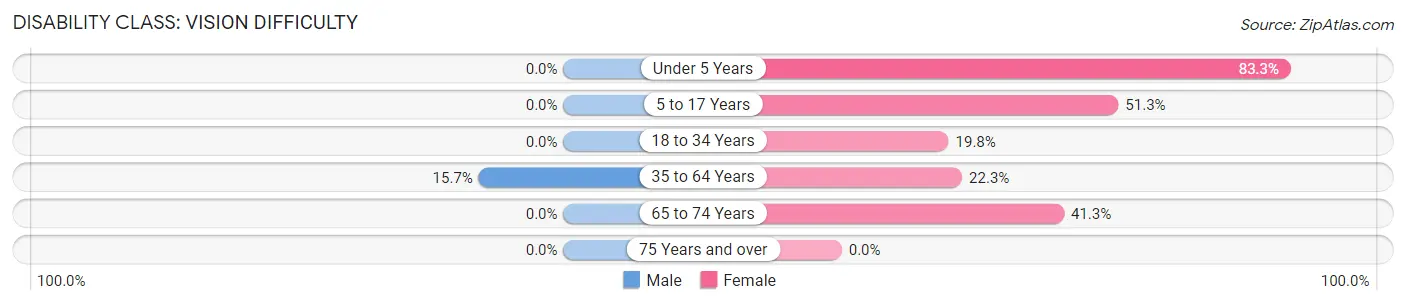
| Age Bracket | Male | Female |
| Under 5 Years | 0 (0.0%) | 110 (83.3%) |
| 5 to 17 Years | 0 (0.0%) | 96 (51.3%) |
| 18 to 34 Years | 0 (0.0%) | 48 (19.8%) |
| 35 to 64 Years | 50 (15.7%) | 84 (22.3%) |
| 65 to 74 Years | 0 (0.0%) | 33 (41.2%) |
| 75 Years and over | 0 (0.0%) | 0 (0.0%) |
Disability Class: Cognitive Difficulty
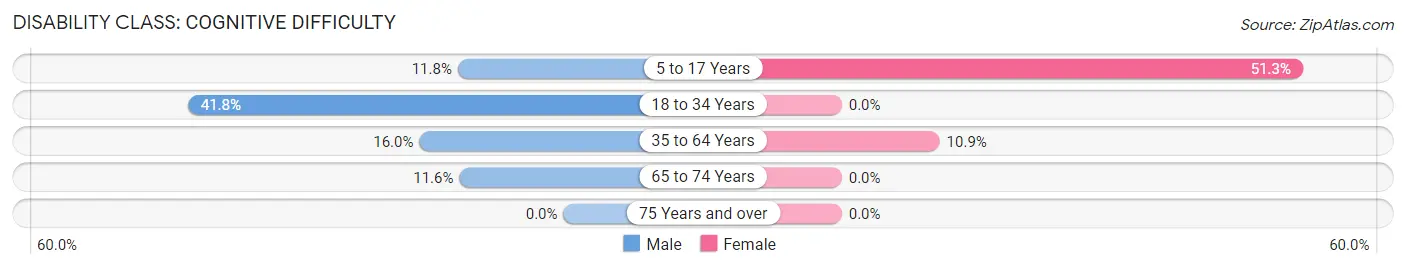
| Age Bracket | Male | Female |
| 5 to 17 Years | 10 (11.8%) | 96 (51.3%) |
| 18 to 34 Years | 92 (41.8%) | 0 (0.0%) |
| 35 to 64 Years | 51 (16.0%) | 41 (10.9%) |
| 65 to 74 Years | 8 (11.6%) | 0 (0.0%) |
| 75 Years and over | 0 (0.0%) | 0 (0.0%) |
Disability Class: Ambulatory Difficulty
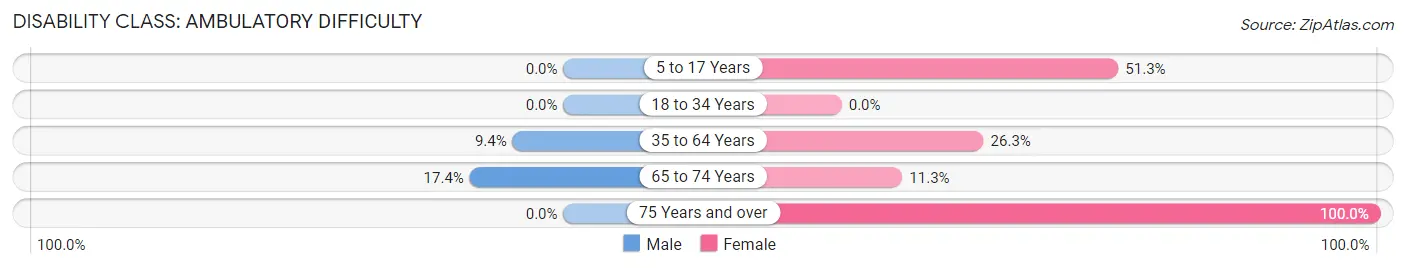
| Age Bracket | Male | Female |
| 5 to 17 Years | 0 (0.0%) | 96 (51.3%) |
| 18 to 34 Years | 0 (0.0%) | 0 (0.0%) |
| 35 to 64 Years | 30 (9.4%) | 99 (26.3%) |
| 65 to 74 Years | 12 (17.4%) | 9 (11.3%) |
| 75 Years and over | 0 (0.0%) | 19 (100.0%) |
Disability Class: Self-Care Difficulty

| Age Bracket | Male | Female |
| 5 to 17 Years | 0 (0.0%) | 96 (51.3%) |
| 18 to 34 Years | 0 (0.0%) | 0 (0.0%) |
| 35 to 64 Years | 30 (9.4%) | 0 (0.0%) |
| 65 to 74 Years | 0 (0.0%) | 0 (0.0%) |
| 75 Years and over | 0 (0.0%) | 0 (0.0%) |
Technology Access in Ledbetter
Computing Device Access in Ledbetter
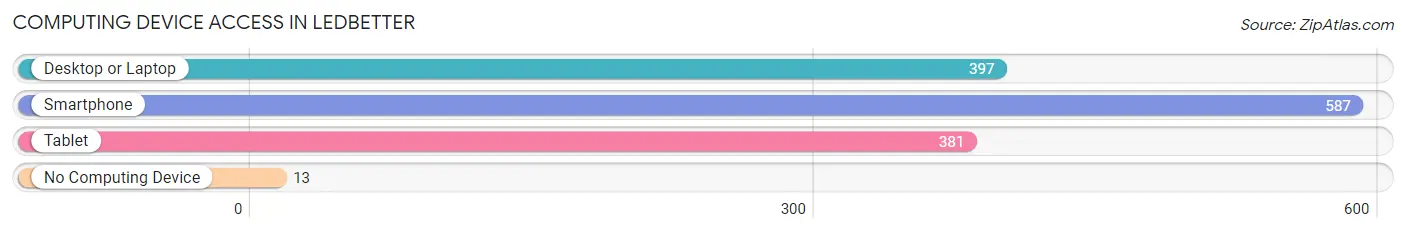
| Device Type | # Households | % Households |
| Desktop or Laptop | 397 | 62.6% |
| Smartphone | 587 | 92.6% |
| Tablet | 381 | 60.1% |
| No Computing Device | 13 | 2.1% |
| Total | 634 | 100.0% |
Internet Access in Ledbetter
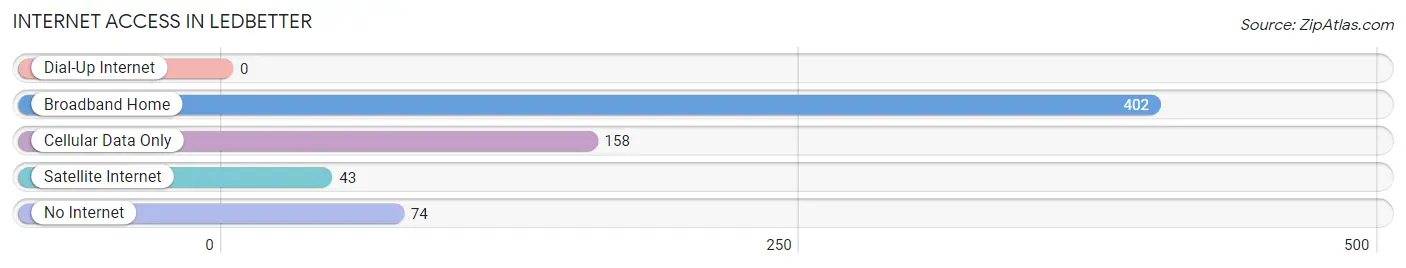
| Internet Type | # Households | % Households |
| Dial-Up Internet | 0 | 0.0% |
| Broadband Home | 402 | 63.4% |
| Cellular Data Only | 158 | 24.9% |
| Satellite Internet | 43 | 6.8% |
| No Internet | 74 | 11.7% |
| Total | 634 | 100.0% |
Ledbetter Summary
History
The small town of Ledbetter, Kentucky is located in the western part of the state, in the county of Livingston. It is situated on the banks of the Ohio River, and is part of the Paducah, Kentucky metropolitan area. The town was founded in 1818 by William Ledbetter, a Revolutionary War veteran, and was originally known as Ledbetter’s Landing. The town was incorporated in 1845, and has since grown to a population of around 1,000 people.
The town has a rich history, and was an important stop on the Underground Railroad. It was also the site of a major Civil War battle in 1862, when Confederate forces attempted to take control of the town. The Union forces were successful in defending the town, and the battle is remembered today with a monument in the town square.
Geography
Ledbetter is located in western Kentucky, in the county of Livingston. It is situated on the banks of the Ohio River, and is part of the Paducah, Kentucky metropolitan area. The town is located in a rural area, and is surrounded by rolling hills and farmland. The town is located about 30 miles from the nearest major city, Paducah.
The climate in Ledbetter is humid subtropical, with hot summers and mild winters. The average temperature in the summer is around 80 degrees Fahrenheit, and the average temperature in the winter is around 40 degrees Fahrenheit. The town receives an average of 45 inches of precipitation per year.
Economy
The economy of Ledbetter is largely based on agriculture and tourism. The town is home to several farms, which produce a variety of crops, including corn, soybeans, and wheat. The town is also home to several small businesses, including restaurants, shops, and a few small manufacturing companies.
The town is also a popular tourist destination, due to its proximity to the Ohio River and its historic sites. The town is home to several historic sites, including the Ledbetter Civil War Monument, the Ledbetter House, and the Ledbetter Cemetery. The town also hosts several festivals and events throughout the year, including the Ledbetter Days Festival and the Ledbetter County Fair.
Demographics
As of the 2010 census, the population of Ledbetter was 1,039. The racial makeup of the town was 97.3% White, 0.9% African American, 0.3% Native American, 0.2% Asian, and 1.3% from other races. The median household income in the town was $35,938, and the median family income was $41,250. The per capita income in the town was $17,845.
Conclusion
Ledbetter, Kentucky is a small town with a rich history and a vibrant economy. The town is home to several farms, businesses, and historic sites, and is a popular tourist destination. The town has a diverse population, and a median household income that is slightly higher than the national average. Ledbetter is a great place to live, work, and visit, and is a great example of small-town life in Kentucky.
Common Questions
What is Per Capita Income in Ledbetter?
Per Capita income in Ledbetter is $21,320.
What is the Median Family Income in Ledbetter?
Median Family Income in Ledbetter is $68,750.
What is the Median Household income in Ledbetter?
Median Household Income in Ledbetter is $60,667.
What is Inequality or Gini Index in Ledbetter?
Inequality or Gini Index in Ledbetter is 0.30.
What is the Total Population of Ledbetter?
Total Population of Ledbetter is 1,815.
What is the Total Male Population of Ledbetter?
Total Male Population of Ledbetter is 779.
What is the Total Female Population of Ledbetter?
Total Female Population of Ledbetter is 1,036.
What is the Ratio of Males per 100 Females in Ledbetter?
There are 75.19 Males per 100 Females in Ledbetter.
What is the Ratio of Females per 100 Males in Ledbetter?
There are 132.99 Females per 100 Males in Ledbetter.
What is the Median Population Age in Ledbetter?
Median Population Age in Ledbetter is 33.3 Years.
What is the Average Family Size in Ledbetter
Average Family Size in Ledbetter is 3.6 People.
What is the Average Household Size in Ledbetter
Average Household Size in Ledbetter is 2.9 People.
How Large is the Labor Force in Ledbetter?
There are 939 People in the Labor Forcein in Ledbetter.
What is the Percentage of People in the Labor Force in Ledbetter?
69.0% of People are in the Labor Force in Ledbetter.
What is the Unemployment Rate in Ledbetter?
Unemployment Rate in Ledbetter is 9.6%.