Robards, KY Map & Demographics
Robards Map
Robards Overview
$29,340
PER CAPITA INCOME
$76,000
AVG FAMILY INCOME
$64,750
AVG HOUSEHOLD INCOME
40.2%
WAGE / INCOME GAP [ % ]
59.8¢/ $1
WAGE / INCOME GAP [ $ ]
0.32
INEQUALITY / GINI INDEX
550
TOTAL POPULATION
263
MALE POPULATION
287
FEMALE POPULATION
91.64
MALES / 100 FEMALES
109.13
FEMALES / 100 MALES
49.0
MEDIAN AGE
2.8
AVG FAMILY SIZE
2.5
AVG HOUSEHOLD SIZE
277
LABOR FORCE [ PEOPLE ]
57.0%
PERCENT IN LABOR FORCE
6.9%
UNEMPLOYMENT RATE
Robards Zip Codes
Robards Area Codes
Income in Robards
Income Overview in Robards
Per Capita Income in Robards is $29,340, while median incomes of families and households are $76,000 and $64,750 respectively.
| Characteristic | Number | Measure |
| Per Capita Income | 550 | $29,340 |
| Median Family Income | 172 | $76,000 |
| Mean Family Income | 172 | $78,665 |
| Median Household Income | 219 | $64,750 |
| Mean Household Income | 219 | $71,492 |
| Income Deficit | 172 | $0 |
| Wage / Income Gap (%) | 550 | 40.18% |
| Wage / Income Gap ($) | 550 | 59.82¢ per $1 |
| Gini / Inequality Index | 550 | 0.32 |
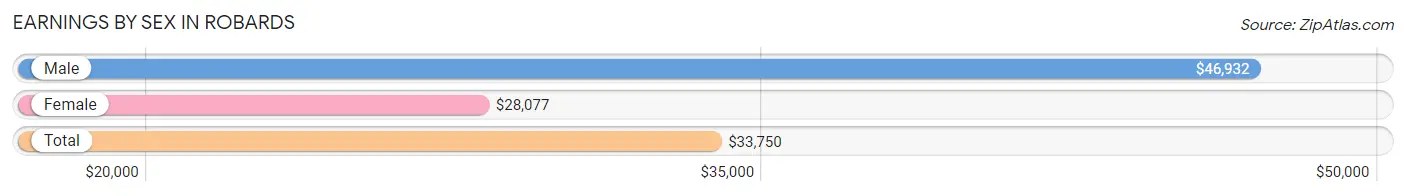
Earnings by Sex in Robards
Average Earnings in Robards are $33,750, $46,932 for men and $28,077 for women, a difference of 40.2%.
| Sex | Number | Average Earnings |
| Male | 149 (51.9%) | $46,932 |
| Female | 138 (48.1%) | $28,077 |
| Total | 287 (100.0%) | $33,750 |
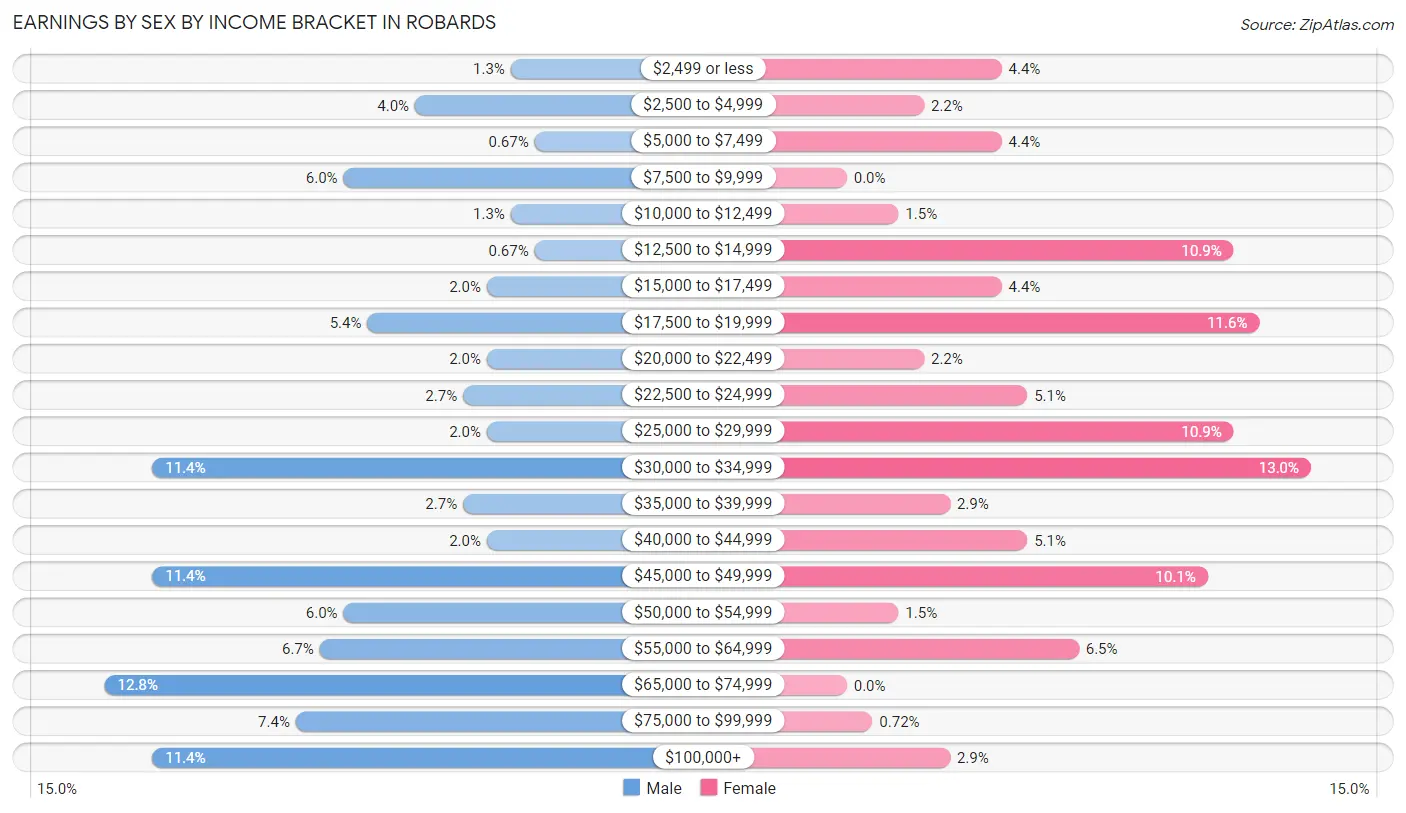
Earnings by Sex by Income Bracket in Robards
The most common earnings brackets in Robards are $65,000 to $74,999 for men (19 | 12.8%) and $30,000 to $34,999 for women (18 | 13.0%).
| Income | Male | Female |
| $2,499 or less | 2 (1.3%) | 6 (4.3%) |
| $2,500 to $4,999 | 6 (4.0%) | 3 (2.2%) |
| $5,000 to $7,499 | 1 (0.7%) | 6 (4.3%) |
| $7,500 to $9,999 | 9 (6.0%) | 0 (0.0%) |
| $10,000 to $12,499 | 2 (1.3%) | 2 (1.5%) |
| $12,500 to $14,999 | 1 (0.7%) | 15 (10.9%) |
| $15,000 to $17,499 | 3 (2.0%) | 6 (4.3%) |
| $17,500 to $19,999 | 8 (5.4%) | 16 (11.6%) |
| $20,000 to $22,499 | 3 (2.0%) | 3 (2.2%) |
| $22,500 to $24,999 | 4 (2.7%) | 7 (5.1%) |
| $25,000 to $29,999 | 3 (2.0%) | 15 (10.9%) |
| $30,000 to $34,999 | 17 (11.4%) | 18 (13.0%) |
| $35,000 to $39,999 | 4 (2.7%) | 4 (2.9%) |
| $40,000 to $44,999 | 3 (2.0%) | 7 (5.1%) |
| $45,000 to $49,999 | 17 (11.4%) | 14 (10.1%) |
| $50,000 to $54,999 | 9 (6.0%) | 2 (1.5%) |
| $55,000 to $64,999 | 10 (6.7%) | 9 (6.5%) |
| $65,000 to $74,999 | 19 (12.8%) | 0 (0.0%) |
| $75,000 to $99,999 | 11 (7.4%) | 1 (0.7%) |
| $100,000+ | 17 (11.4%) | 4 (2.9%) |
| Total | 149 (100.0%) | 138 (100.0%) |
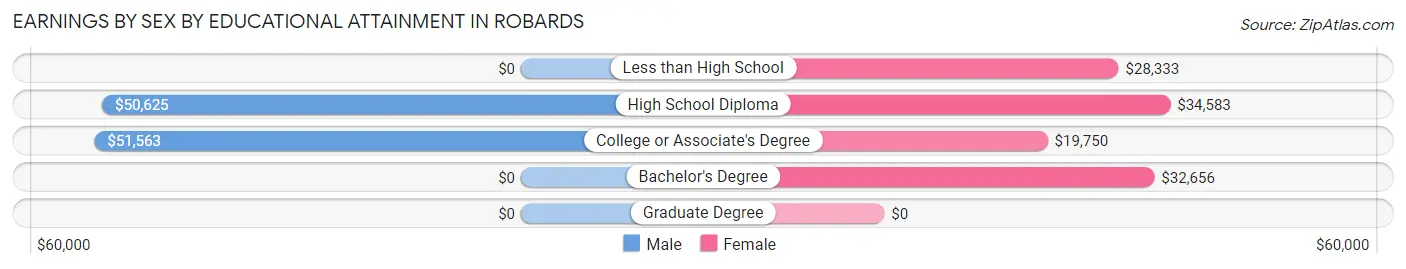
Earnings by Sex by Educational Attainment in Robards
Average earnings in Robards are $51,875 for men and $31,250 for women, a difference of 39.8%. Men with an educational attainment of college or associate's degree enjoy the highest average annual earnings of $51,563, while those with high school diploma education earn the least with $50,625. Women with an educational attainment of high school diploma earn the most with the average annual earnings of $34,583, while those with college or associate's degree education have the smallest earnings of $19,750.
| Educational Attainment | Male Income | Female Income |
| Less than High School | - | - |
| High School Diploma | $50,625 | $34,583 |
| College or Associate's Degree | $51,563 | $19,750 |
| Bachelor's Degree | - | - |
| Graduate Degree | - | - |
| Total | $51,875 | $31,250 |
Family Income in Robards
Family Income Brackets in Robards
According to the Robards family income data, there are 43 families falling into the $75,000 to $99,999 income range, which is the most common income bracket and makes up 25.0% of all families.
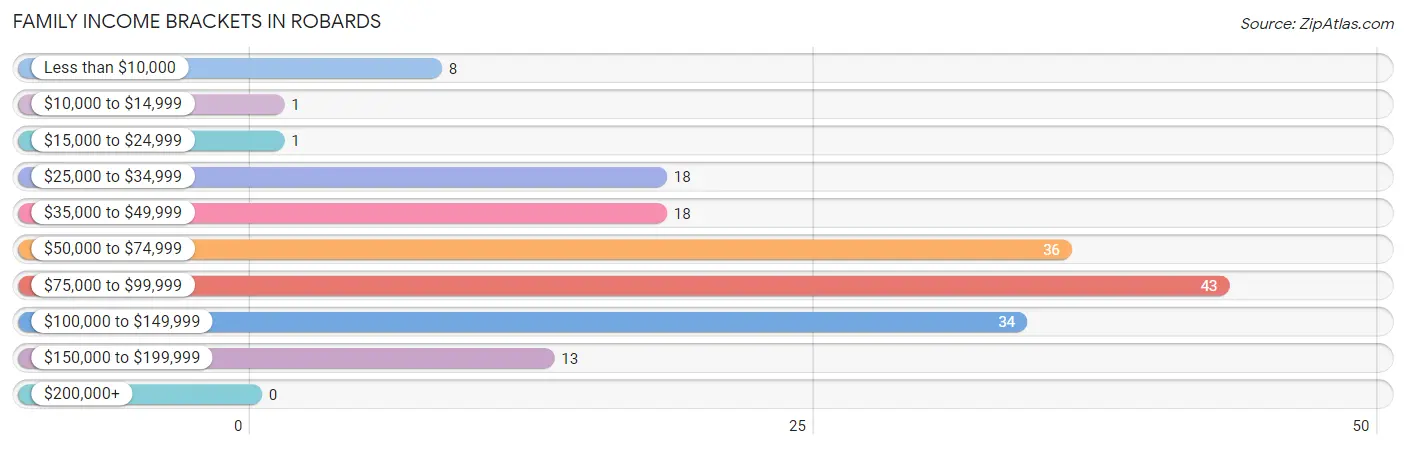
| Income Bracket | # Families | % Families |
| Less than $10,000 | 8 | 4.7% |
| $10,000 to $14,999 | 1 | 0.6% |
| $15,000 to $24,999 | 1 | 0.6% |
| $25,000 to $34,999 | 18 | 10.5% |
| $35,000 to $49,999 | 18 | 10.5% |
| $50,000 to $74,999 | 36 | 20.9% |
| $75,000 to $99,999 | 43 | 25.0% |
| $100,000 to $149,999 | 34 | 19.8% |
| $150,000 to $199,999 | 13 | 7.6% |
| $200,000+ | 0 | 0.0% |
Family Income by Famaliy Size in Robards
5-person families (11 | 6.4%) account for the highest median family income in Robards with $111,964 per family, while 2-person families (105 | 61.1%) have the highest median income of $33,438 per family member.
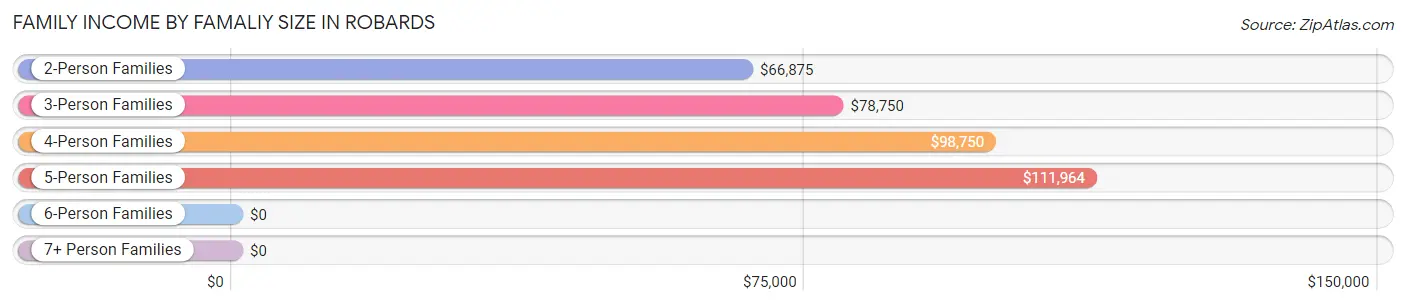
| Income Bracket | # Families | Median Income |
| 2-Person Families | 105 (61.1%) | $66,875 |
| 3-Person Families | 35 (20.3%) | $78,750 |
| 4-Person Families | 16 (9.3%) | $98,750 |
| 5-Person Families | 11 (6.4%) | $111,964 |
| 6-Person Families | 1 (0.6%) | $0 |
| 7+ Person Families | 4 (2.3%) | $0 |
| Total | 172 (100.0%) | $76,000 |
Family Income by Number of Earners in Robards
The median family income in Robards is $76,000, with families comprising 3+ earners (33) having the highest median family income of $110,625, while families with no earners (42) have the lowest median family income of $43,750, accounting for 19.2% and 24.4% of families, respectively.
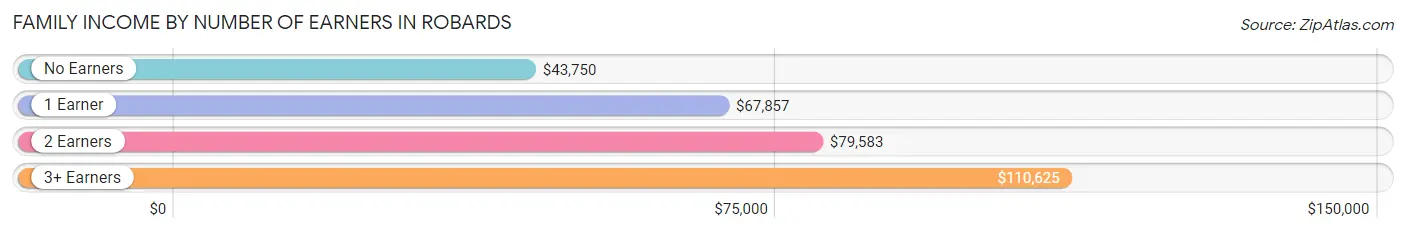
| Number of Earners | # Families | Median Income |
| No Earners | 42 (24.4%) | $43,750 |
| 1 Earner | 44 (25.6%) | $67,857 |
| 2 Earners | 53 (30.8%) | $79,583 |
| 3+ Earners | 33 (19.2%) | $110,625 |
| Total | 172 (100.0%) | $76,000 |
Household Income in Robards
Household Income Brackets in Robards
With 45 households falling in the category, the $75,000 to $99,999 income range is the most frequent in Robards, accounting for 20.5% of all households.
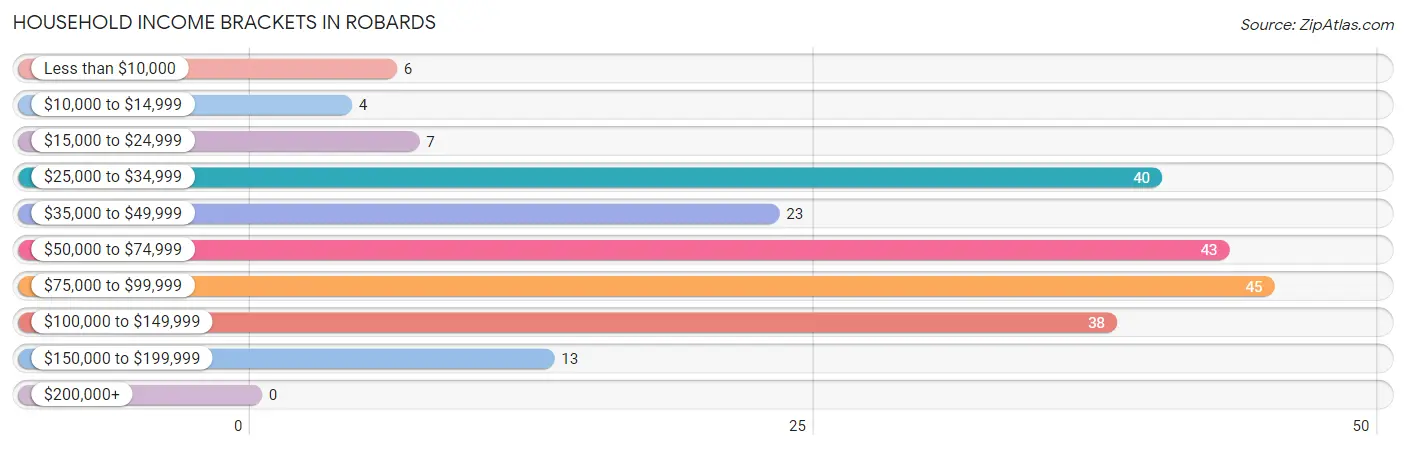
| Income Bracket | # Households | % Households |
| Less than $10,000 | 6 | 2.7% |
| $10,000 to $14,999 | 4 | 1.8% |
| $15,000 to $24,999 | 7 | 3.2% |
| $25,000 to $34,999 | 40 | 18.3% |
| $35,000 to $49,999 | 23 | 10.5% |
| $50,000 to $74,999 | 43 | 19.6% |
| $75,000 to $99,999 | 45 | 20.5% |
| $100,000 to $149,999 | 38 | 17.4% |
| $150,000 to $199,999 | 13 | 5.9% |
| $200,000+ | 0 | 0.0% |
Household Income by Householder Age in Robards
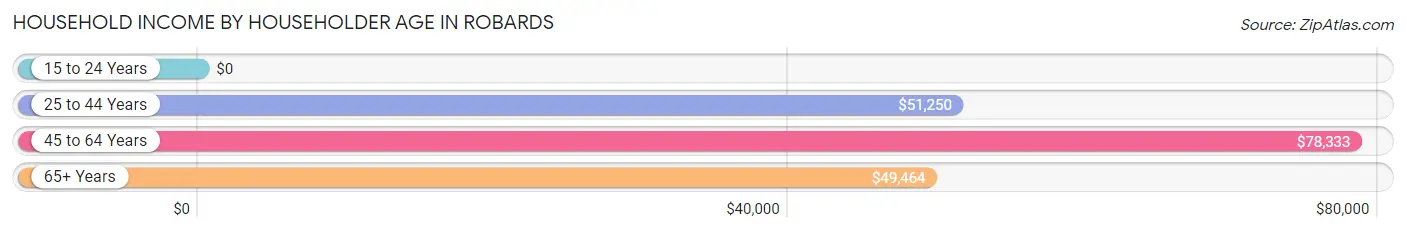
The median household income in Robards is $64,750, with the highest median household income of $78,333 found in the 45 to 64 years age bracket for the primary householder. A total of 112 households (51.1%) fall into this category. Meanwhile, the 15 to 24 years age bracket for the primary householder has the lowest median household income of $0, with 4 households (1.8%) in this group.
| Income Bracket | # Households | Median Income |
| 15 to 24 Years | 4 (1.8%) | $0 |
| 25 to 44 Years | 54 (24.7%) | $51,250 |
| 45 to 64 Years | 112 (51.1%) | $78,333 |
| 65+ Years | 49 (22.4%) | $49,464 |
| Total | 219 (100.0%) | $64,750 |
Poverty in Robards
Income Below Poverty by Sex and Age in Robards
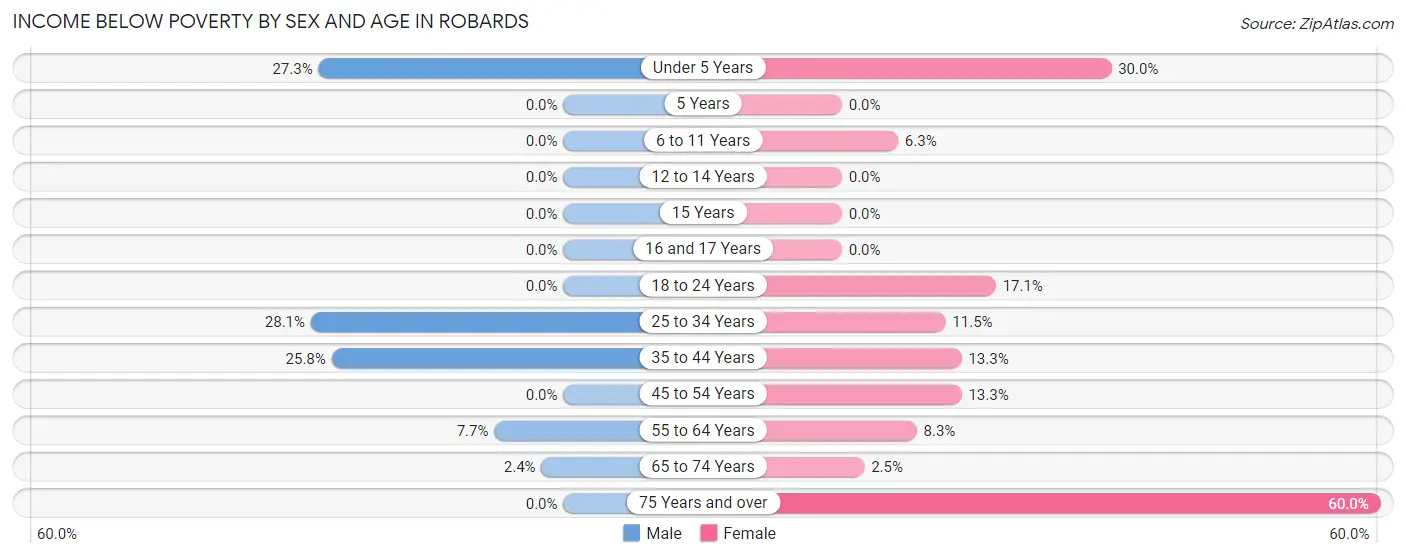
With 9.7% poverty level for males and 11.2% for females among the residents of Robards, 25 to 34 year old males and 75 year old and over females are the most vulnerable to poverty, with 9 males (28.1%) and 3 females (60.0%) in their respective age groups living below the poverty level.
| Age Bracket | Male | Female |
| Under 5 Years | 3 (27.3%) | 3 (30.0%) |
| 5 Years | 0 (0.0%) | 0 (0.0%) |
| 6 to 11 Years | 0 (0.0%) | 1 (6.2%) |
| 12 to 14 Years | 0 (0.0%) | 0 (0.0%) |
| 15 Years | 0 (0.0%) | 0 (0.0%) |
| 16 and 17 Years | 0 (0.0%) | 0 (0.0%) |
| 18 to 24 Years | 0 (0.0%) | 6 (17.1%) |
| 25 to 34 Years | 9 (28.1%) | 3 (11.5%) |
| 35 to 44 Years | 8 (25.8%) | 4 (13.3%) |
| 45 to 54 Years | 0 (0.0%) | 6 (13.3%) |
| 55 to 64 Years | 4 (7.7%) | 5 (8.3%) |
| 65 to 74 Years | 1 (2.4%) | 1 (2.5%) |
| 75 Years and over | 0 (0.0%) | 3 (60.0%) |
| Total | 25 (9.7%) | 32 (11.2%) |
Income Above Poverty by Sex and Age in Robards
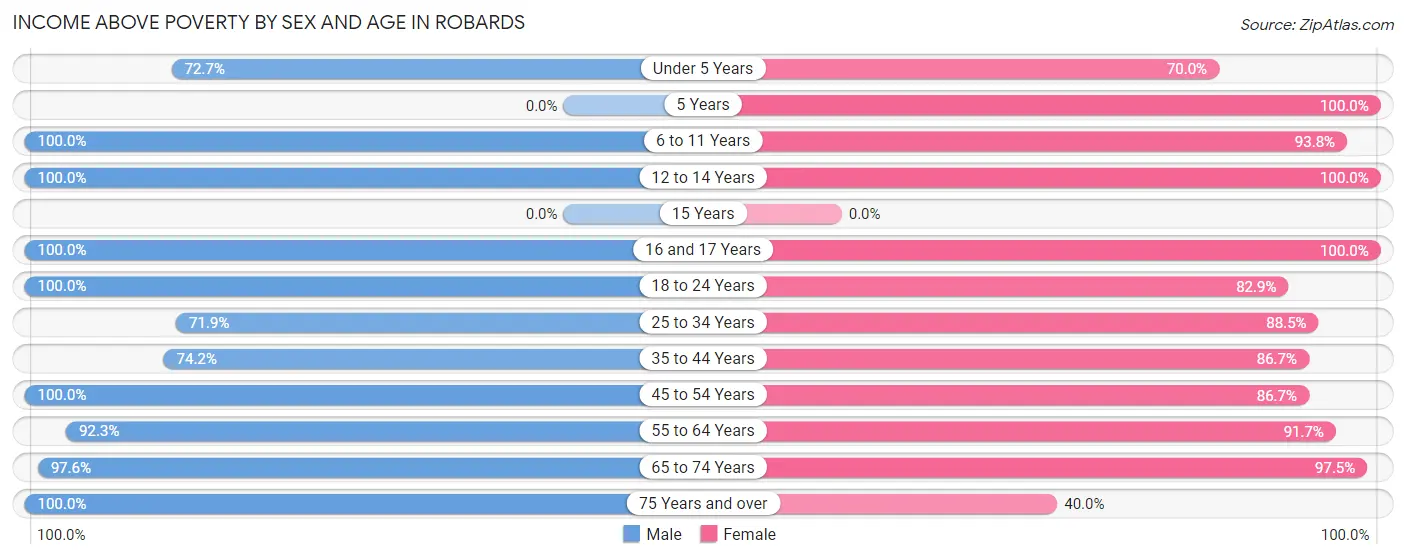
According to the poverty statistics in Robards, males aged 6 to 11 years and females aged 5 years are the age groups that are most secure financially, with 100.0% of males and 100.0% of females in these age groups living above the poverty line.
| Age Bracket | Male | Female |
| Under 5 Years | 8 (72.7%) | 7 (70.0%) |
| 5 Years | 0 (0.0%) | 1 (100.0%) |
| 6 to 11 Years | 5 (100.0%) | 15 (93.8%) |
| 12 to 14 Years | 5 (100.0%) | 11 (100.0%) |
| 15 Years | 0 (0.0%) | 0 (0.0%) |
| 16 and 17 Years | 2 (100.0%) | 8 (100.0%) |
| 18 to 24 Years | 32 (100.0%) | 29 (82.9%) |
| 25 to 34 Years | 23 (71.9%) | 23 (88.5%) |
| 35 to 44 Years | 23 (74.2%) | 26 (86.7%) |
| 45 to 54 Years | 40 (100.0%) | 39 (86.7%) |
| 55 to 64 Years | 48 (92.3%) | 55 (91.7%) |
| 65 to 74 Years | 40 (97.6%) | 39 (97.5%) |
| 75 Years and over | 7 (100.0%) | 2 (40.0%) |
| Total | 233 (90.3%) | 255 (88.8%) |
Income Below Poverty Among Married-Couple Families in Robards
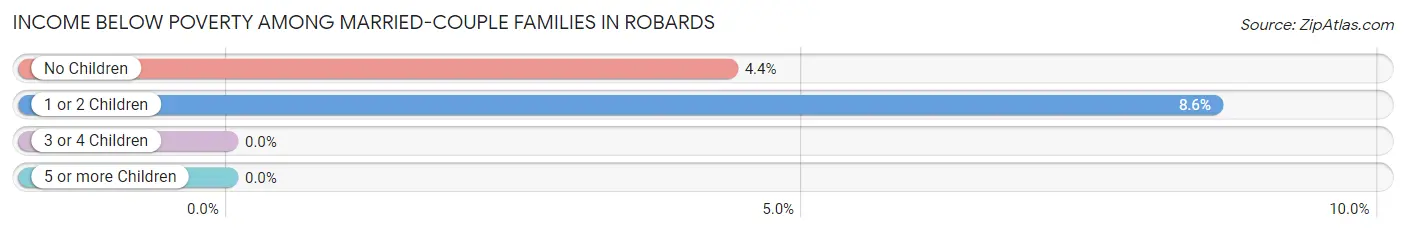
The poverty statistics for married-couple families in Robards show that 5.2% or 8 of the total 154 families live below the poverty line. Families with 1 or 2 children have the highest poverty rate of 8.6%, comprising of 3 families. On the other hand, families with 3 or 4 children have the lowest poverty rate of 0.0%, which includes 0 families.
| Children | Above Poverty | Below Poverty |
| No Children | 110 (95.7%) | 5 (4.3%) |
| 1 or 2 Children | 32 (91.4%) | 3 (8.6%) |
| 3 or 4 Children | 3 (100.0%) | 0 (0.0%) |
| 5 or more Children | 1 (100.0%) | 0 (0.0%) |
| Total | 146 (94.8%) | 8 (5.2%) |
Income Below Poverty Among Single-Parent Households in Robards
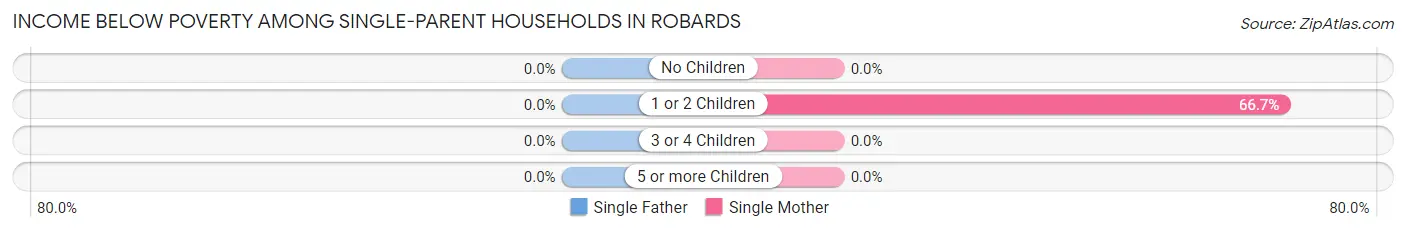
| Children | Single Father | Single Mother |
| No Children | 0 (0.0%) | 0 (0.0%) |
| 1 or 2 Children | 0 (0.0%) | 4 (66.7%) |
| 3 or 4 Children | 0 (0.0%) | 0 (0.0%) |
| 5 or more Children | 0 (0.0%) | 0 (0.0%) |
| Total | 0 (0.0%) | 4 (44.4%) |
Income Below Poverty Among Married-Couple vs Single-Parent Households in Robards
The poverty data for Robards shows that 8 of the married-couple family households (5.2%) and 4 of the single-parent households (22.2%) are living below the poverty level. Within the married-couple family households, those with 1 or 2 children have the highest poverty rate, with 3 households (8.6%) falling below the poverty line. Among the single-parent households, those with 1 or 2 children have the highest poverty rate, with 4 household (57.1%) living below poverty.
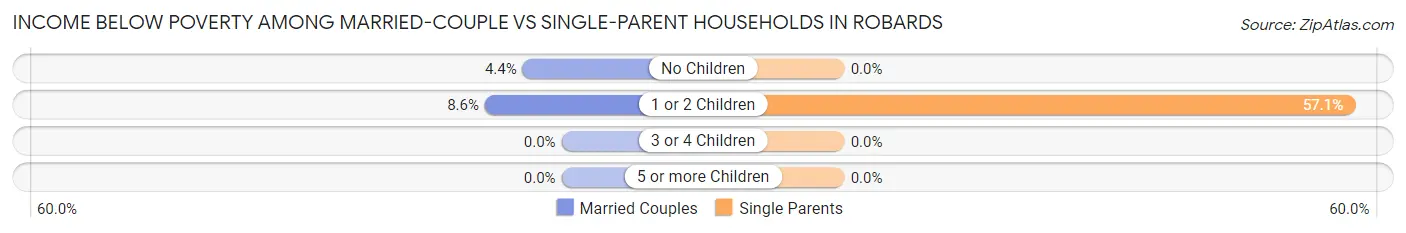
| Children | Married-Couple Families | Single-Parent Households |
| No Children | 5 (4.3%) | 0 (0.0%) |
| 1 or 2 Children | 3 (8.6%) | 4 (57.1%) |
| 3 or 4 Children | 0 (0.0%) | 0 (0.0%) |
| 5 or more Children | 0 (0.0%) | 0 (0.0%) |
| Total | 8 (5.2%) | 4 (22.2%) |
Race in Robards
The most populous races in Robards are White / Caucasian (516 | 93.8%), Two or more Races (14 | 2.5%), and Black / African American (11 | 2.0%).
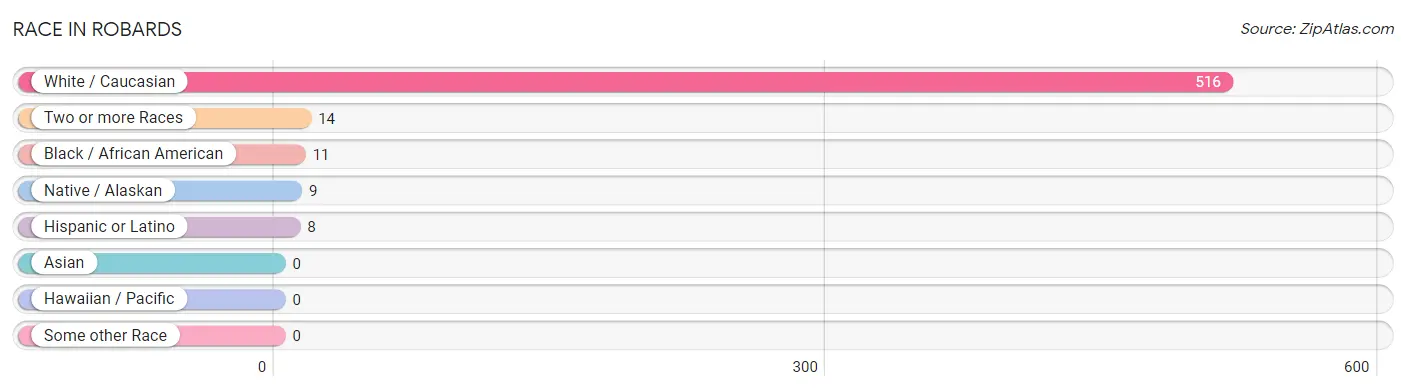
| Race | # Population | % Population |
| Asian | 0 | 0.0% |
| Black / African American | 11 | 2.0% |
| Hawaiian / Pacific | 0 | 0.0% |
| Hispanic or Latino | 8 | 1.5% |
| Native / Alaskan | 9 | 1.6% |
| White / Caucasian | 516 | 93.8% |
| Two or more Races | 14 | 2.5% |
| Some other Race | 0 | 0.0% |
| Total | 550 | 100.0% |
Ancestry in Robards
The most populous ancestries reported in Robards are American (122 | 22.2%), German (98 | 17.8%), English (65 | 11.8%), Irish (53 | 9.6%), and French (13 | 2.4%), together accounting for 63.8% of all Robards residents.
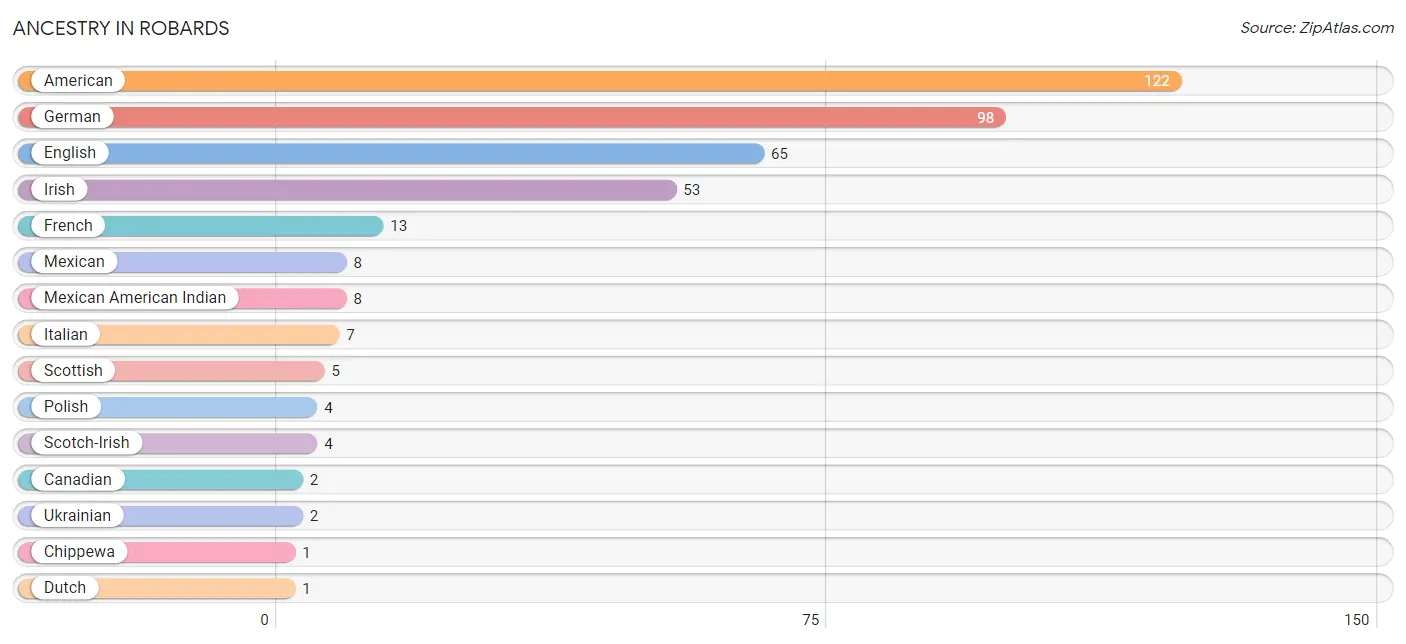
| Ancestry | # Population | % Population |
| American | 122 | 22.2% |
| Canadian | 2 | 0.4% |
| Chippewa | 1 | 0.2% |
| Dutch | 1 | 0.2% |
| English | 65 | 11.8% |
| European | 1 | 0.2% |
| French | 13 | 2.4% |
| German | 98 | 17.8% |
| Irish | 53 | 9.6% |
| Italian | 7 | 1.3% |
| Luxembourger | 1 | 0.2% |
| Mexican | 8 | 1.5% |
| Mexican American Indian | 8 | 1.5% |
| Polish | 4 | 0.7% |
| Scotch-Irish | 4 | 0.7% |
| Scottish | 5 | 0.9% |
| Swedish | 1 | 0.2% |
| Ukrainian | 2 | 0.4% | View All 18 Rows |
Immigrants in Robards
The most numerous immigrant groups reported in Robards came from Central America (6 | 1.1%), Latin America (6 | 1.1%), Mexico (6 | 1.1%), and Canada (2 | 0.4%), together accounting for 3.6% of all Robards residents.
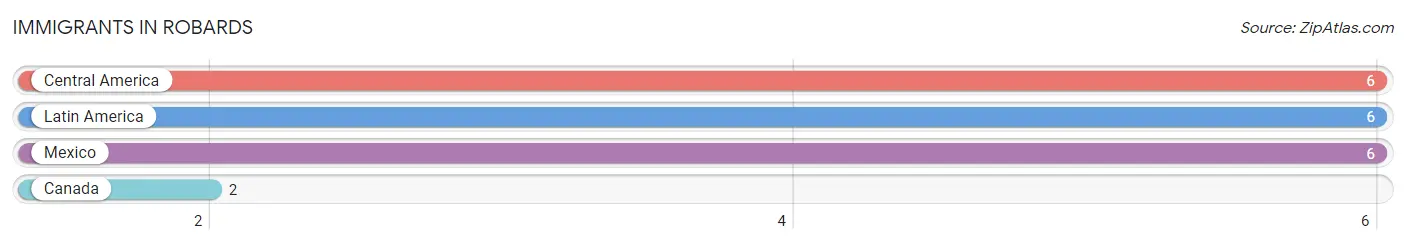
| Immigration Origin | # Population | % Population |
| Canada | 2 | 0.4% |
| Central America | 6 | 1.1% |
| Latin America | 6 | 1.1% |
| Mexico | 6 | 1.1% | View All 4 Rows |
Sex and Age in Robards
Sex and Age in Robards
The most populous age groups in Robards are 50 to 54 Years (36 | 13.7%) for men and 50 to 54 Years (33 | 11.5%) for women.
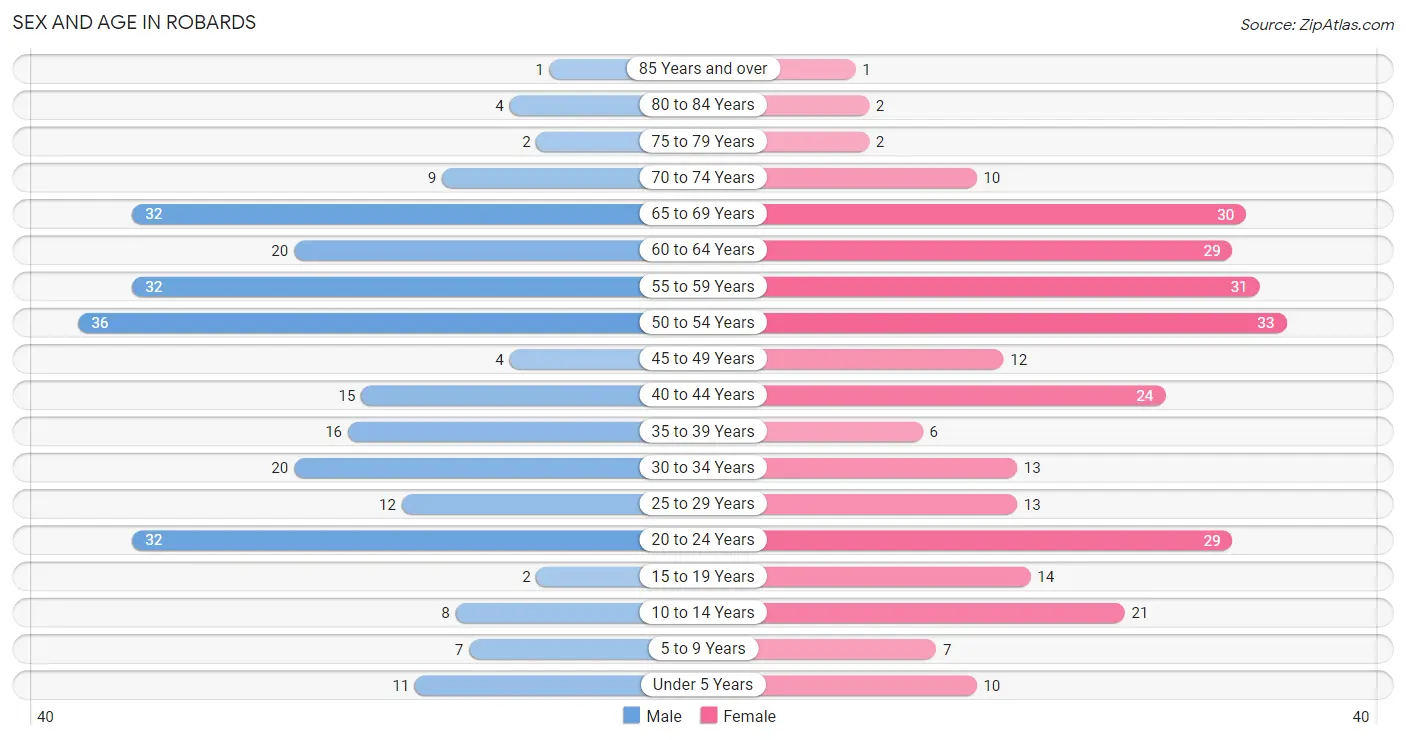
| Age Bracket | Male | Female |
| Under 5 Years | 11 (4.2%) | 10 (3.5%) |
| 5 to 9 Years | 7 (2.7%) | 7 (2.4%) |
| 10 to 14 Years | 8 (3.0%) | 21 (7.3%) |
| 15 to 19 Years | 2 (0.8%) | 14 (4.9%) |
| 20 to 24 Years | 32 (12.2%) | 29 (10.1%) |
| 25 to 29 Years | 12 (4.6%) | 13 (4.5%) |
| 30 to 34 Years | 20 (7.6%) | 13 (4.5%) |
| 35 to 39 Years | 16 (6.1%) | 6 (2.1%) |
| 40 to 44 Years | 15 (5.7%) | 24 (8.4%) |
| 45 to 49 Years | 4 (1.5%) | 12 (4.2%) |
| 50 to 54 Years | 36 (13.7%) | 33 (11.5%) |
| 55 to 59 Years | 32 (12.2%) | 31 (10.8%) |
| 60 to 64 Years | 20 (7.6%) | 29 (10.1%) |
| 65 to 69 Years | 32 (12.2%) | 30 (10.4%) |
| 70 to 74 Years | 9 (3.4%) | 10 (3.5%) |
| 75 to 79 Years | 2 (0.8%) | 2 (0.7%) |
| 80 to 84 Years | 4 (1.5%) | 2 (0.7%) |
| 85 Years and over | 1 (0.4%) | 1 (0.4%) |
| Total | 263 (100.0%) | 287 (100.0%) |
Families and Households in Robards
Median Family Size in Robards
The median family size in Robards is 2.77 persons per family, with married-couple families (154 | 89.5%) accounting for the largest median family size of 2.84 persons per family. On the other hand, single male/father families (9 | 5.2%) represent the smallest median family size with 2.11 persons per family.
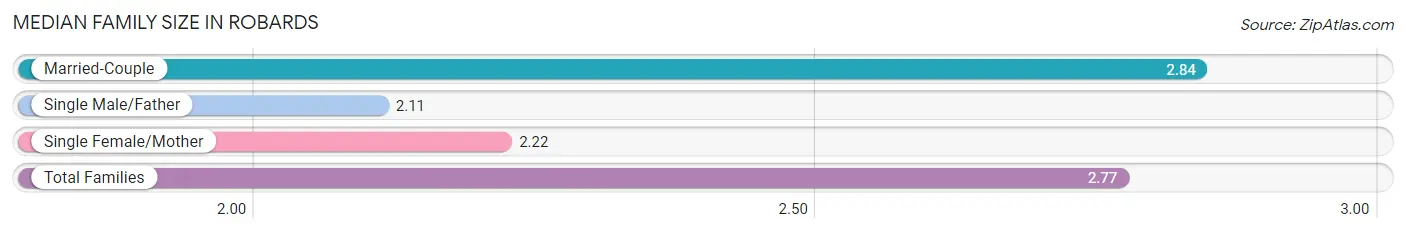
| Family Type | # Families | Family Size |
| Married-Couple | 154 (89.5%) | 2.84 |
| Single Male/Father | 9 (5.2%) | 2.11 |
| Single Female/Mother | 9 (5.2%) | 2.22 |
| Total Families | 172 (100.0%) | 2.77 |
Median Household Size in Robards
The median household size in Robards is 2.51 persons per household, with married-couple households (154 | 70.3%) accounting for the largest median household size of 2.84 persons per household. non-family households (47 | 21.5%) represent the smallest median household size with 1.45 persons per household.
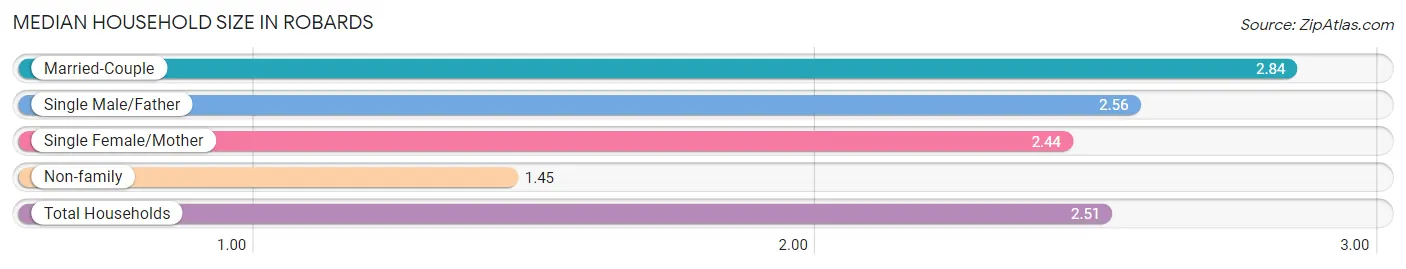
| Household Type | # Households | Household Size |
| Married-Couple | 154 (70.3%) | 2.84 |
| Single Male/Father | 9 (4.1%) | 2.56 |
| Single Female/Mother | 9 (4.1%) | 2.44 |
| Non-family | 47 (21.5%) | 1.45 |
| Total Households | 219 (100.0%) | 2.51 |
Household Size by Marriage Status in Robards
Out of a total of 219 households in Robards, 172 (78.5%) are family households, while 47 (21.5%) are nonfamily households. The most numerous type of family households are 2-person households, comprising 98, and the most common type of nonfamily households are 1-person households, comprising 35.
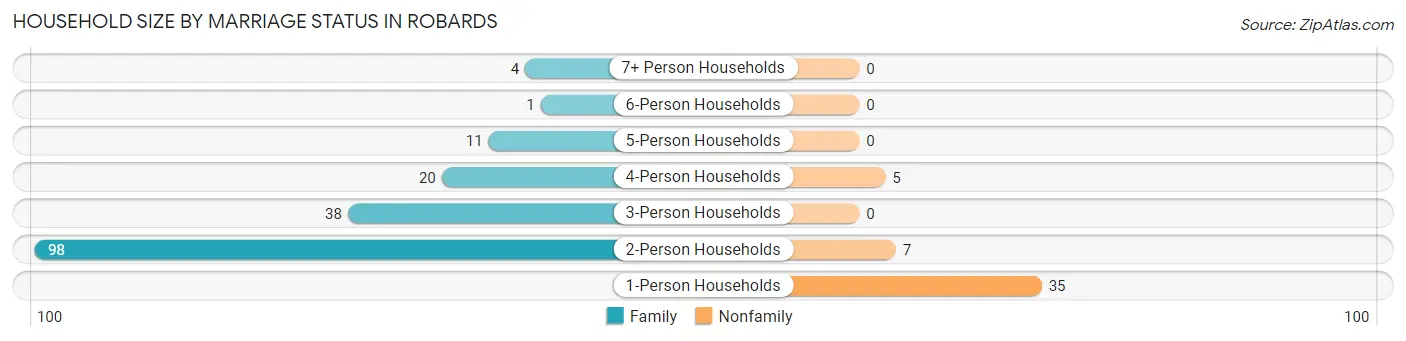
| Household Size | Family Households | Nonfamily Households |
| 1-Person Households | - | 35 (16.0%) |
| 2-Person Households | 98 (44.8%) | 7 (3.2%) |
| 3-Person Households | 38 (17.3%) | 0 (0.0%) |
| 4-Person Households | 20 (9.1%) | 5 (2.3%) |
| 5-Person Households | 11 (5.0%) | 0 (0.0%) |
| 6-Person Households | 1 (0.5%) | 0 (0.0%) |
| 7+ Person Households | 4 (1.8%) | 0 (0.0%) |
| Total | 172 (78.5%) | 47 (21.5%) |
Female Fertility in Robards
Fertility by Age in Robards
Average fertility rate in Robards is 102.0 births per 1,000 women. Women in the age bracket of 20 to 34 years have the highest fertility rate with 200.0 births per 1,000 women. Women in the age bracket of 20 to 34 years acount for 91.7% of all women with births.
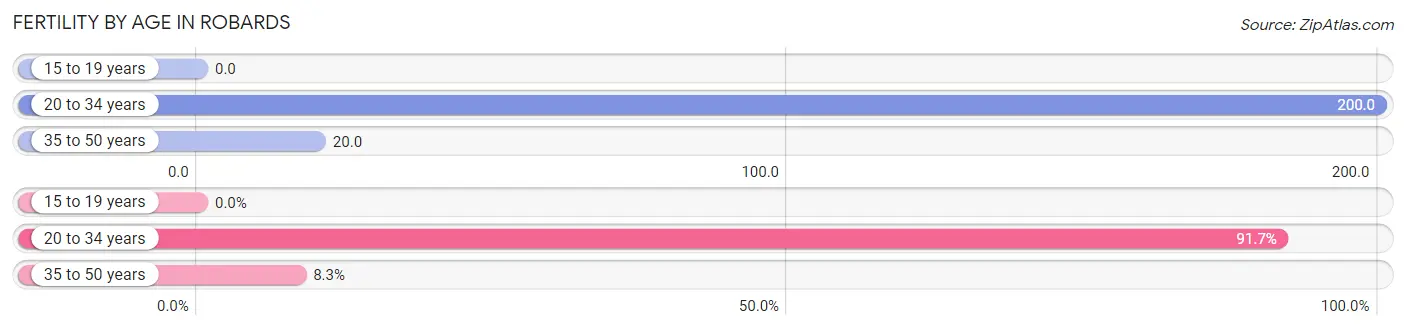
| Age Bracket | Women with Births | Births / 1,000 Women |
| 15 to 19 years | 0 (0.0%) | 0.0 |
| 20 to 34 years | 11 (91.7%) | 200.0 |
| 35 to 50 years | 1 (8.3%) | 20.0 |
| Total | 12 (100.0%) | 102.0 |
Fertility by Age by Marriage Status in Robards
33.3% of women with births (12) in Robards are married. The highest percentage of unmarried women with births falls into 20 to 34 years age bracket with 72.7% of them unmarried at the time of birth, while the lowest percentage of unmarried women with births belong to 35 to 50 years age bracket with 0.0% of them unmarried.
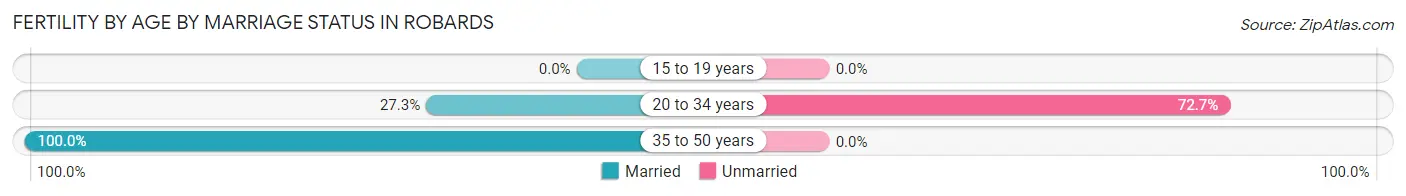
| Age Bracket | Married | Unmarried |
| 15 to 19 years | 0 (0.0%) | 0 (0.0%) |
| 20 to 34 years | 3 (27.3%) | 8 (72.7%) |
| 35 to 50 years | 1 (100.0%) | 0 (0.0%) |
| Total | 4 (33.3%) | 8 (66.7%) |
Fertility by Education in Robards
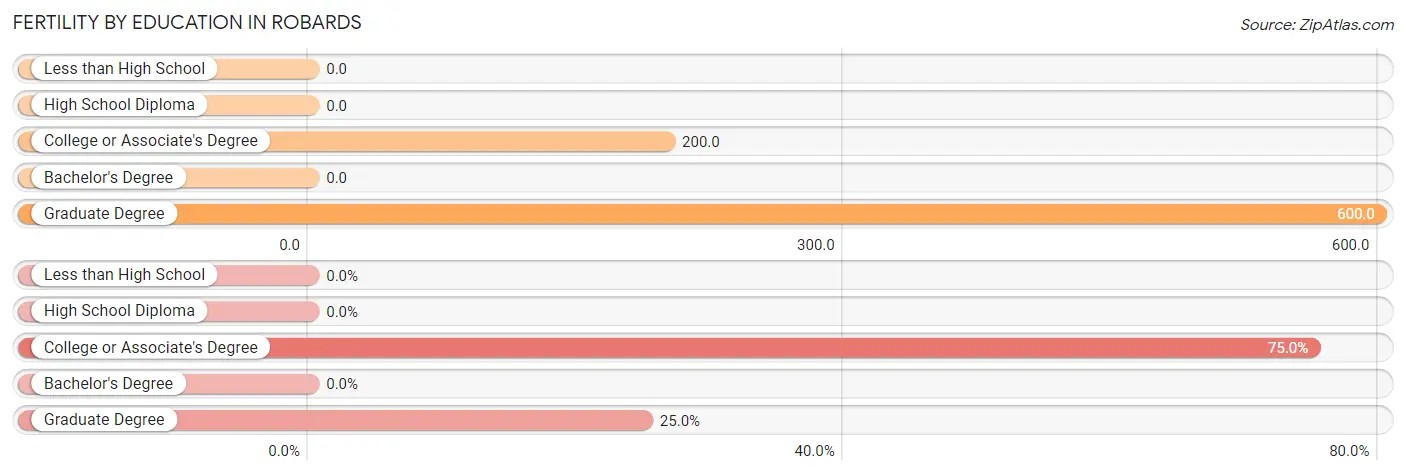
| Educational Attainment | Women with Births | Births / 1,000 Women |
| Less than High School | 0 (0.0%) | 0.0 |
| High School Diploma | 0 (0.0%) | 0.0 |
| College or Associate's Degree | 9 (75.0%) | 200.0 |
| Bachelor's Degree | 0 (0.0%) | 0.0 |
| Graduate Degree | 3 (25.0%) | 600.0 |
| Total | 12 (100.0%) | 102.0 |
Fertility by Education by Marriage Status in Robards
66.7% of women with births in Robards are unmarried. Women with the educational attainment of graduate degree are most likely to be married with 100.0% of them married at childbirth, while women with the educational attainment of college or associate's degree are least likely to be married with 88.9% of them unmarried at childbirth.
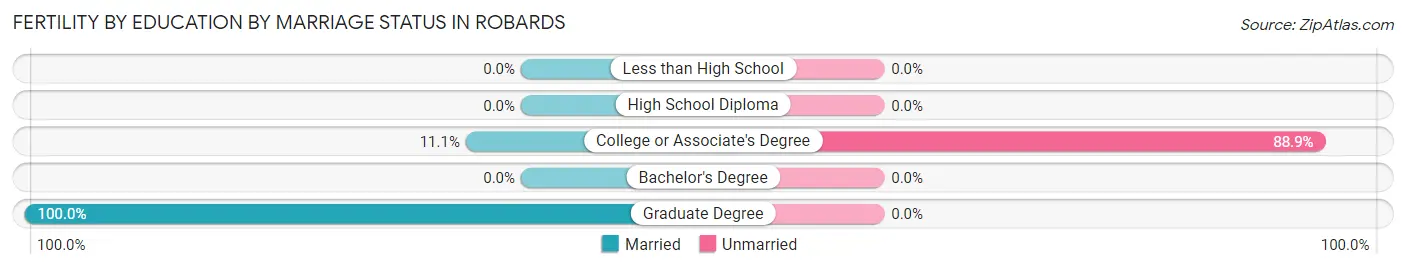
| Educational Attainment | Married | Unmarried |
| Less than High School | 0 (0.0%) | 0 (0.0%) |
| High School Diploma | 0 (0.0%) | 0 (0.0%) |
| College or Associate's Degree | 1 (11.1%) | 8 (88.9%) |
| Bachelor's Degree | 0 (0.0%) | 0 (0.0%) |
| Graduate Degree | 3 (100.0%) | 0 (0.0%) |
| Total | 4 (33.3%) | 8 (66.7%) |
Employment Characteristics in Robards
Employment by Class of Employer in Robards
Among the 258 employed individuals in Robards, private company employees (206 | 79.8%), self-employed (incorporated) (21 | 8.1%), and not-for-profit organizations (9 | 3.5%) make up the most common classes of employment.
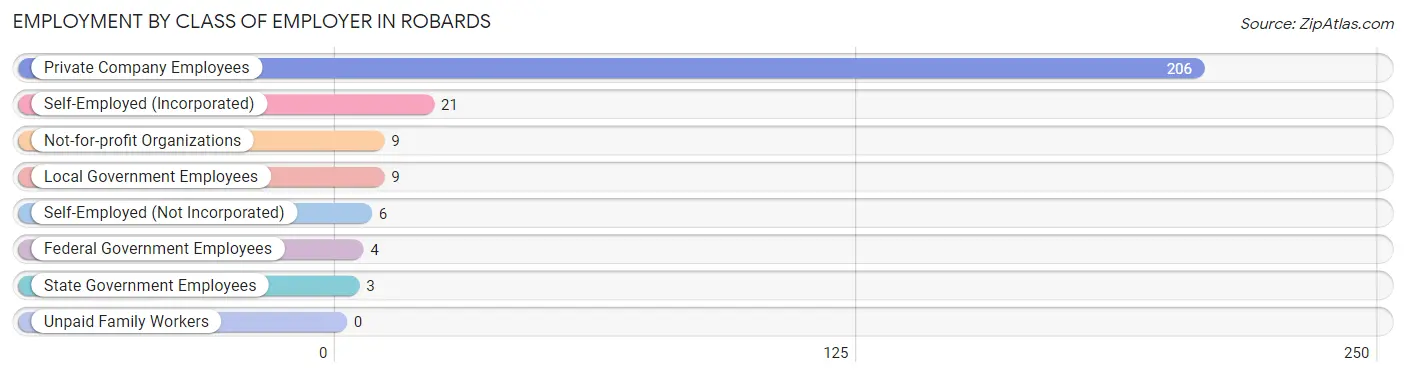
| Employer Class | # Employees | % Employees |
| Private Company Employees | 206 | 79.8% |
| Self-Employed (Incorporated) | 21 | 8.1% |
| Self-Employed (Not Incorporated) | 6 | 2.3% |
| Not-for-profit Organizations | 9 | 3.5% |
| Local Government Employees | 9 | 3.5% |
| State Government Employees | 3 | 1.2% |
| Federal Government Employees | 4 | 1.5% |
| Unpaid Family Workers | 0 | 0.0% |
| Total | 258 | 100.0% |
Employment Status by Age in Robards
According to the labor force statistics for Robards, out of the total population over 16 years of age (486), 57.0% or 277 individuals are in the labor force, with 6.9% or 19 of them unemployed. The age group with the highest labor force participation rate is 45 to 54 years, with 82.4% or 70 individuals in the labor force. Within the labor force, the 55 to 59 years age range has the highest percentage of unemployed individuals, with 23.3% or 7 of them being unemployed.
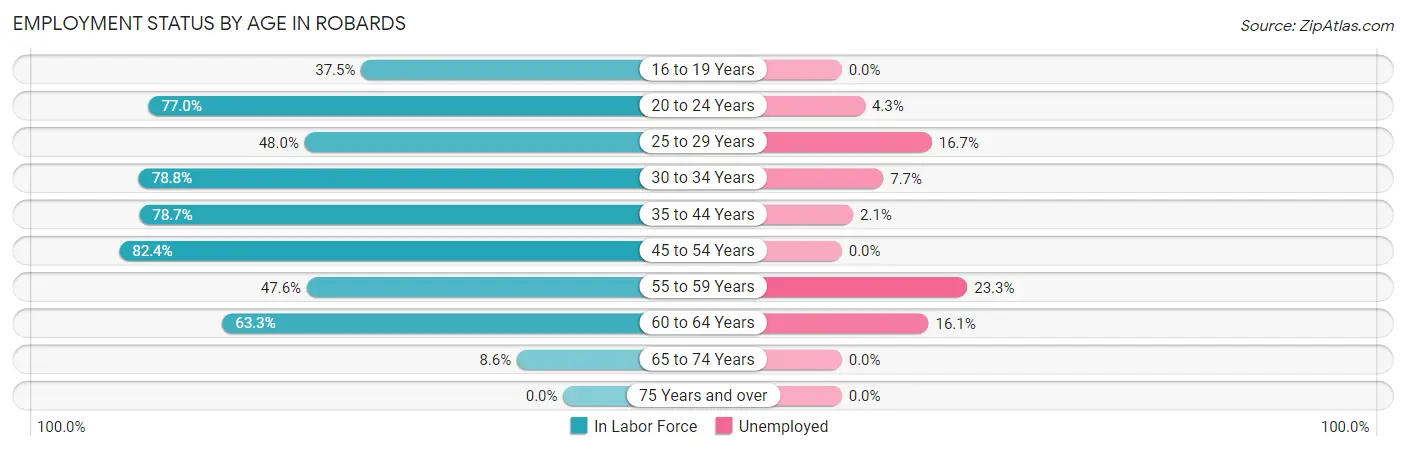
| Age Bracket | In Labor Force | Unemployed |
| 16 to 19 Years | 6 (37.5%) | 0 (0.0%) |
| 20 to 24 Years | 47 (77.0%) | 2 (4.3%) |
| 25 to 29 Years | 12 (48.0%) | 2 (16.7%) |
| 30 to 34 Years | 26 (78.8%) | 2 (7.7%) |
| 35 to 44 Years | 48 (78.7%) | 1 (2.1%) |
| 45 to 54 Years | 70 (82.4%) | 0 (0.0%) |
| 55 to 59 Years | 30 (47.6%) | 7 (23.3%) |
| 60 to 64 Years | 31 (63.3%) | 5 (16.1%) |
| 65 to 74 Years | 7 (8.6%) | 0 (0.0%) |
| 75 Years and over | 0 (0.0%) | 0 (0.0%) |
| Total | 277 (57.0%) | 19 (6.9%) |
Employment Status by Educational Attainment in Robards
According to labor force statistics for Robards, 68.7% of individuals (217) out of the total population between 25 and 64 years of age (316) are in the labor force, with 7.9% or 17 of them being unemployed. The group with the highest labor force participation rate are those with the educational attainment of college / associate degree, with 76.3% or 74 individuals in the labor force. Within the labor force, individuals with college / associate degree education have the highest percentage of unemployment, with 17.8% or 13 of them being unemployed.
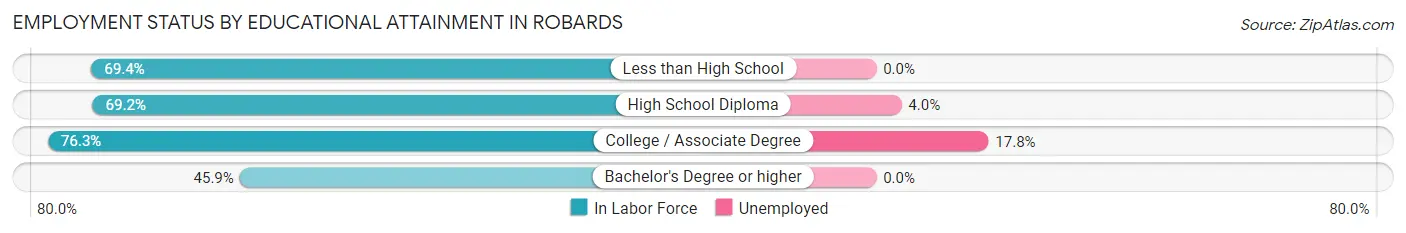
| Educational Attainment | In Labor Force | Unemployed |
| Less than High School | 25 (69.4%) | 0 (0.0%) |
| High School Diploma | 101 (69.2%) | 6 (4.0%) |
| College / Associate Degree | 74 (76.3%) | 17 (17.8%) |
| Bachelor's Degree or higher | 17 (45.9%) | 0 (0.0%) |
| Total | 217 (68.7%) | 25 (7.9%) |
Employment Occupations by Sex in Robards
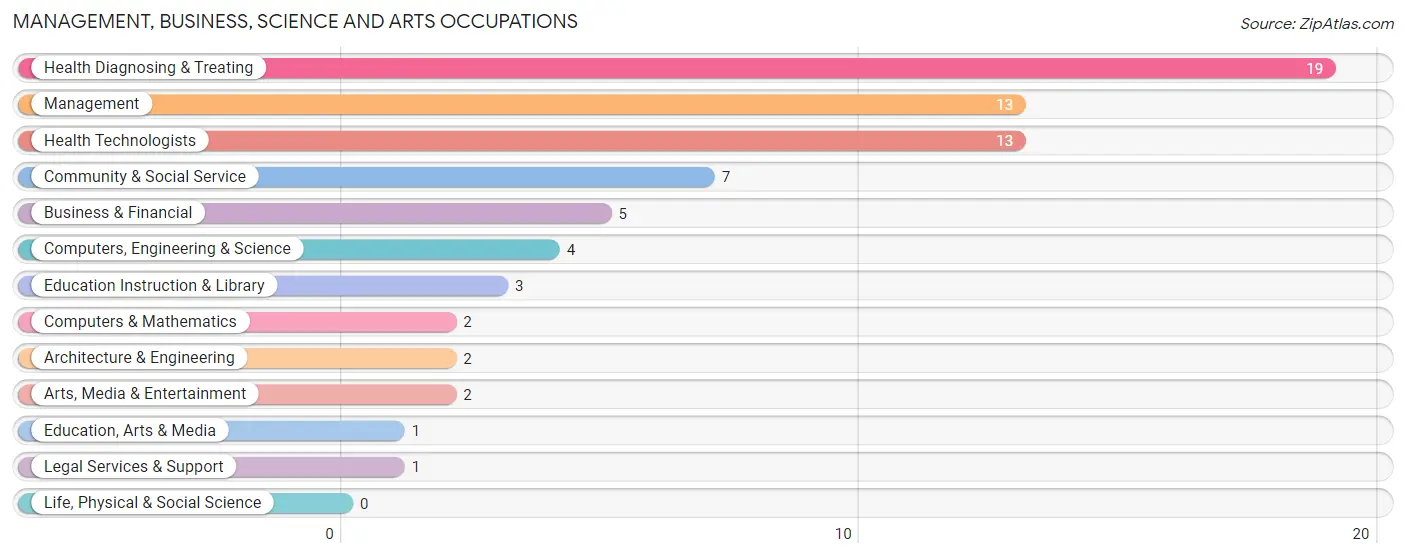
Management, Business, Science and Arts Occupations
The most common Management, Business, Science and Arts occupations in Robards are Health Diagnosing & Treating (19 | 7.4%), Management (13 | 5.1%), Health Technologists (13 | 5.1%), Community & Social Service (7 | 2.7%), and Business & Financial (5 | 1.9%).
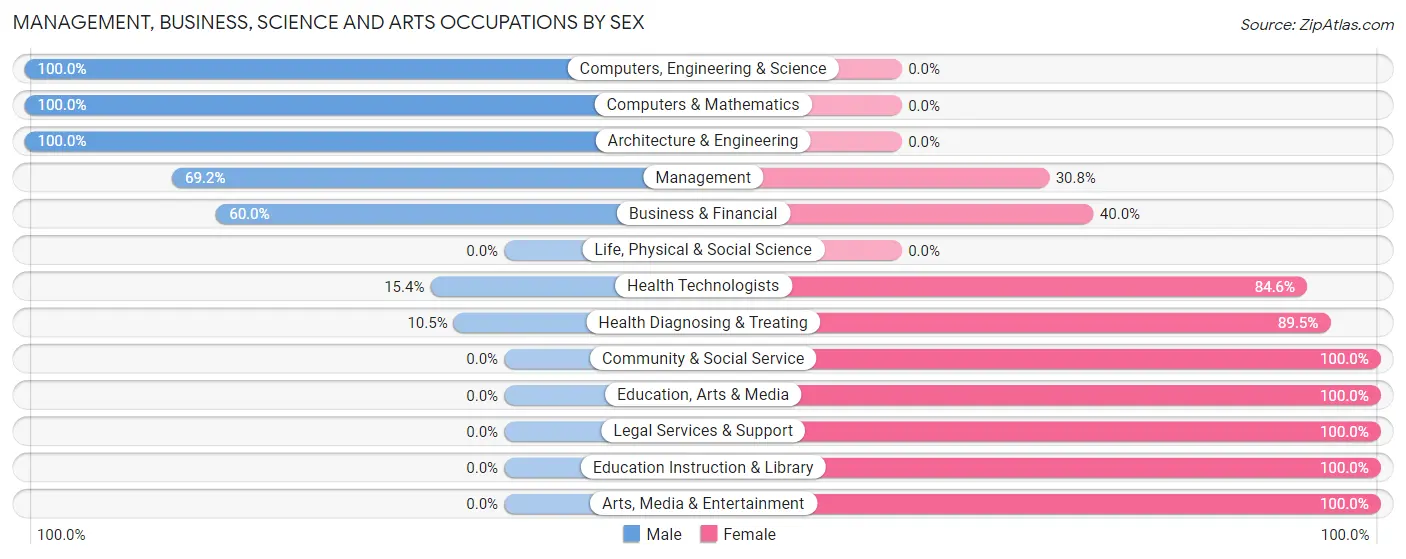
Management, Business, Science and Arts Occupations by Sex
Within the Management, Business, Science and Arts occupations in Robards, the most male-oriented occupations are Computers, Engineering & Science (100.0%), Computers & Mathematics (100.0%), and Architecture & Engineering (100.0%), while the most female-oriented occupations are Community & Social Service (100.0%), Education, Arts & Media (100.0%), and Legal Services & Support (100.0%).
| Occupation | Male | Female |
| Management | 9 (69.2%) | 4 (30.8%) |
| Business & Financial | 3 (60.0%) | 2 (40.0%) |
| Computers, Engineering & Science | 4 (100.0%) | 0 (0.0%) |
| Computers & Mathematics | 2 (100.0%) | 0 (0.0%) |
| Architecture & Engineering | 2 (100.0%) | 0 (0.0%) |
| Life, Physical & Social Science | 0 (0.0%) | 0 (0.0%) |
| Community & Social Service | 0 (0.0%) | 7 (100.0%) |
| Education, Arts & Media | 0 (0.0%) | 1 (100.0%) |
| Legal Services & Support | 0 (0.0%) | 1 (100.0%) |
| Education Instruction & Library | 0 (0.0%) | 3 (100.0%) |
| Arts, Media & Entertainment | 0 (0.0%) | 2 (100.0%) |
| Health Diagnosing & Treating | 2 (10.5%) | 17 (89.5%) |
| Health Technologists | 2 (15.4%) | 11 (84.6%) |
| Total (Category) | 18 (37.5%) | 30 (62.5%) |
| Total (Overall) | 139 (54.1%) | 118 (45.9%) |
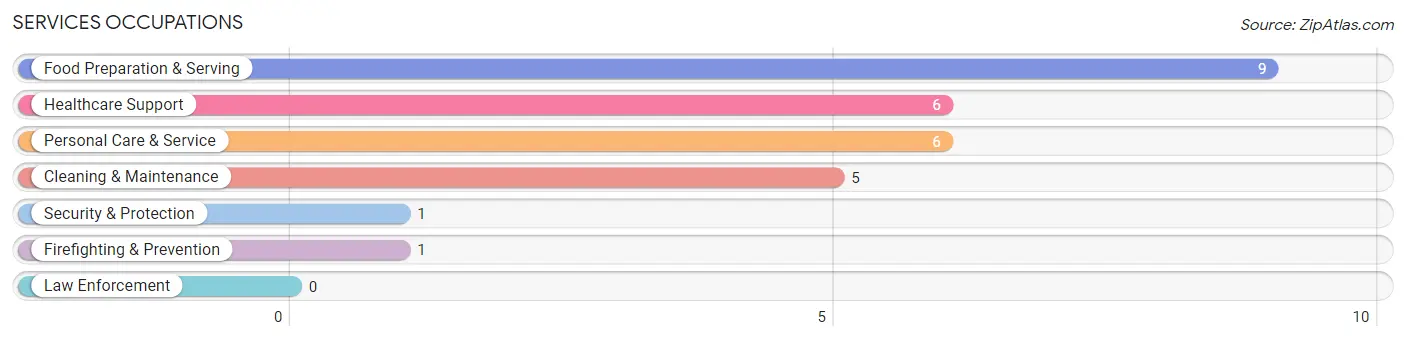
Services Occupations
The most common Services occupations in Robards are Food Preparation & Serving (9 | 3.5%), Healthcare Support (6 | 2.3%), Personal Care & Service (6 | 2.3%), Cleaning & Maintenance (5 | 1.9%), and Security & Protection (1 | 0.4%).
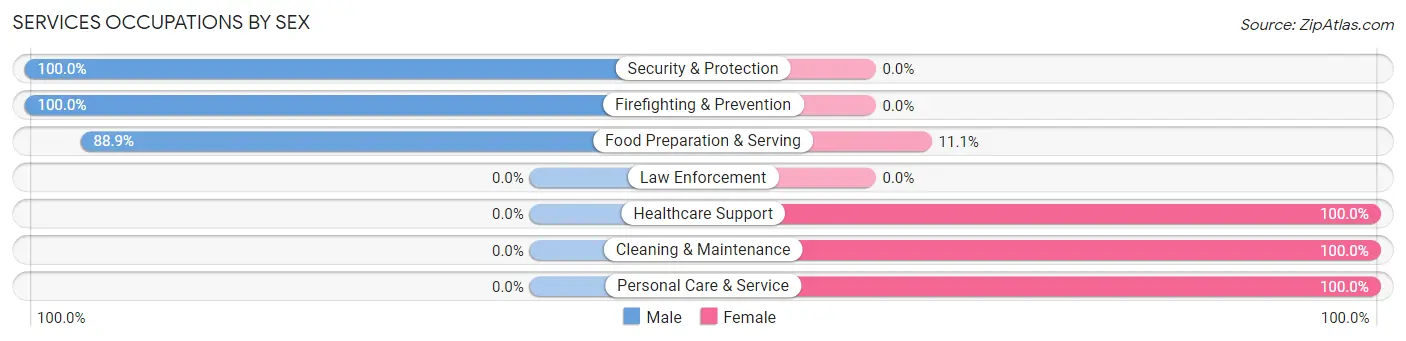
Services Occupations by Sex
Within the Services occupations in Robards, the most male-oriented occupations are Security & Protection (100.0%), Firefighting & Prevention (100.0%), and Food Preparation & Serving (88.9%), while the most female-oriented occupations are Healthcare Support (100.0%), Cleaning & Maintenance (100.0%), and Personal Care & Service (100.0%).
| Occupation | Male | Female |
| Healthcare Support | 0 (0.0%) | 6 (100.0%) |
| Security & Protection | 1 (100.0%) | 0 (0.0%) |
| Firefighting & Prevention | 1 (100.0%) | 0 (0.0%) |
| Law Enforcement | 0 (0.0%) | 0 (0.0%) |
| Food Preparation & Serving | 8 (88.9%) | 1 (11.1%) |
| Cleaning & Maintenance | 0 (0.0%) | 5 (100.0%) |
| Personal Care & Service | 0 (0.0%) | 6 (100.0%) |
| Total (Category) | 9 (33.3%) | 18 (66.7%) |
| Total (Overall) | 139 (54.1%) | 118 (45.9%) |
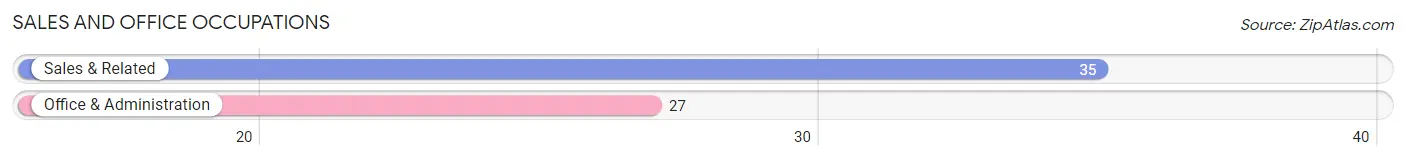
Sales and Office Occupations
The most common Sales and Office occupations in Robards are Sales & Related (35 | 13.6%), and Office & Administration (27 | 10.5%).
Sales and Office Occupations by Sex
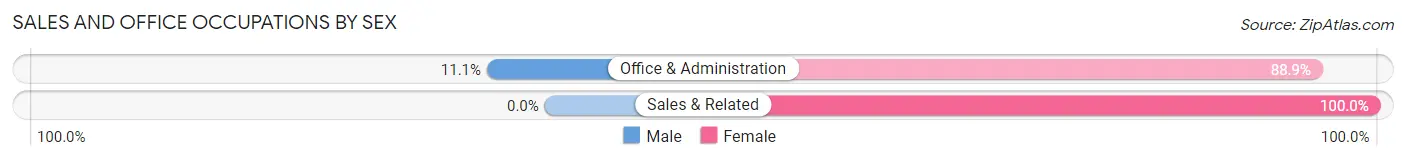
| Occupation | Male | Female |
| Sales & Related | 0 (0.0%) | 35 (100.0%) |
| Office & Administration | 3 (11.1%) | 24 (88.9%) |
| Total (Category) | 3 (4.8%) | 59 (95.2%) |
| Total (Overall) | 139 (54.1%) | 118 (45.9%) |
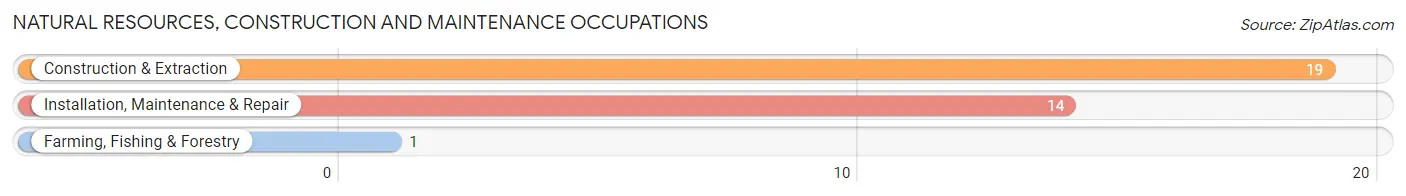
Natural Resources, Construction and Maintenance Occupations
The most common Natural Resources, Construction and Maintenance occupations in Robards are Construction & Extraction (19 | 7.4%), Installation, Maintenance & Repair (14 | 5.4%), and Farming, Fishing & Forestry (1 | 0.4%).
Natural Resources, Construction and Maintenance Occupations by Sex
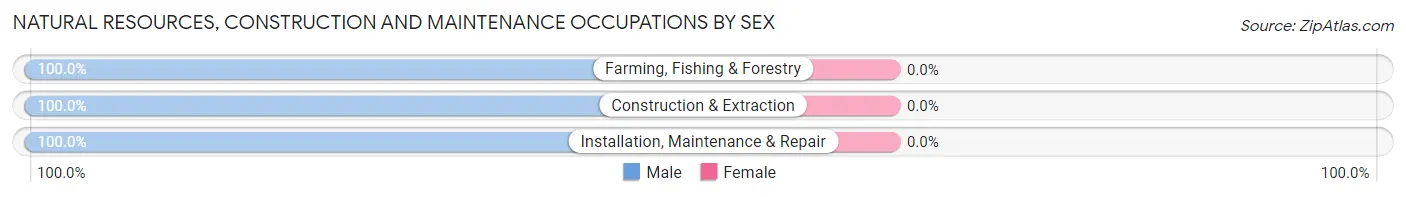
| Occupation | Male | Female |
| Farming, Fishing & Forestry | 1 (100.0%) | 0 (0.0%) |
| Construction & Extraction | 19 (100.0%) | 0 (0.0%) |
| Installation, Maintenance & Repair | 14 (100.0%) | 0 (0.0%) |
| Total (Category) | 34 (100.0%) | 0 (0.0%) |
| Total (Overall) | 139 (54.1%) | 118 (45.9%) |
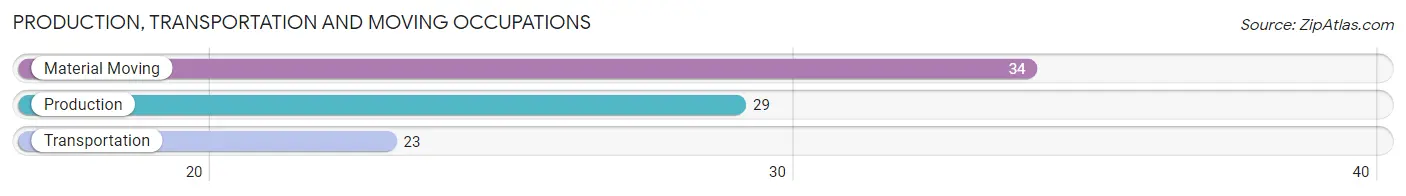
Production, Transportation and Moving Occupations
The most common Production, Transportation and Moving occupations in Robards are Material Moving (34 | 13.2%), Production (29 | 11.3%), and Transportation (23 | 8.9%).
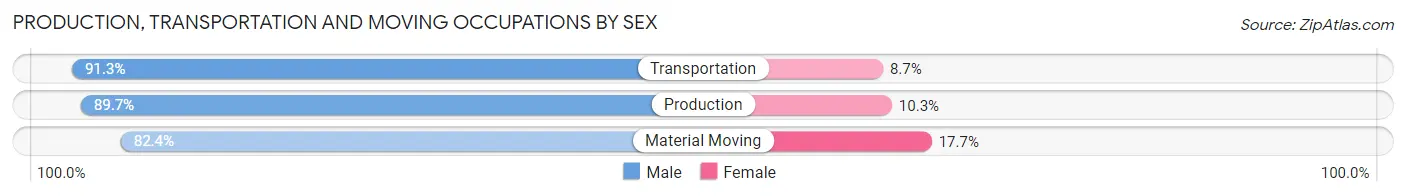
Production, Transportation and Moving Occupations by Sex
| Occupation | Male | Female |
| Production | 26 (89.7%) | 3 (10.3%) |
| Transportation | 21 (91.3%) | 2 (8.7%) |
| Material Moving | 28 (82.4%) | 6 (17.6%) |
| Total (Category) | 75 (87.2%) | 11 (12.8%) |
| Total (Overall) | 139 (54.1%) | 118 (45.9%) |
Employment Industries by Sex in Robards
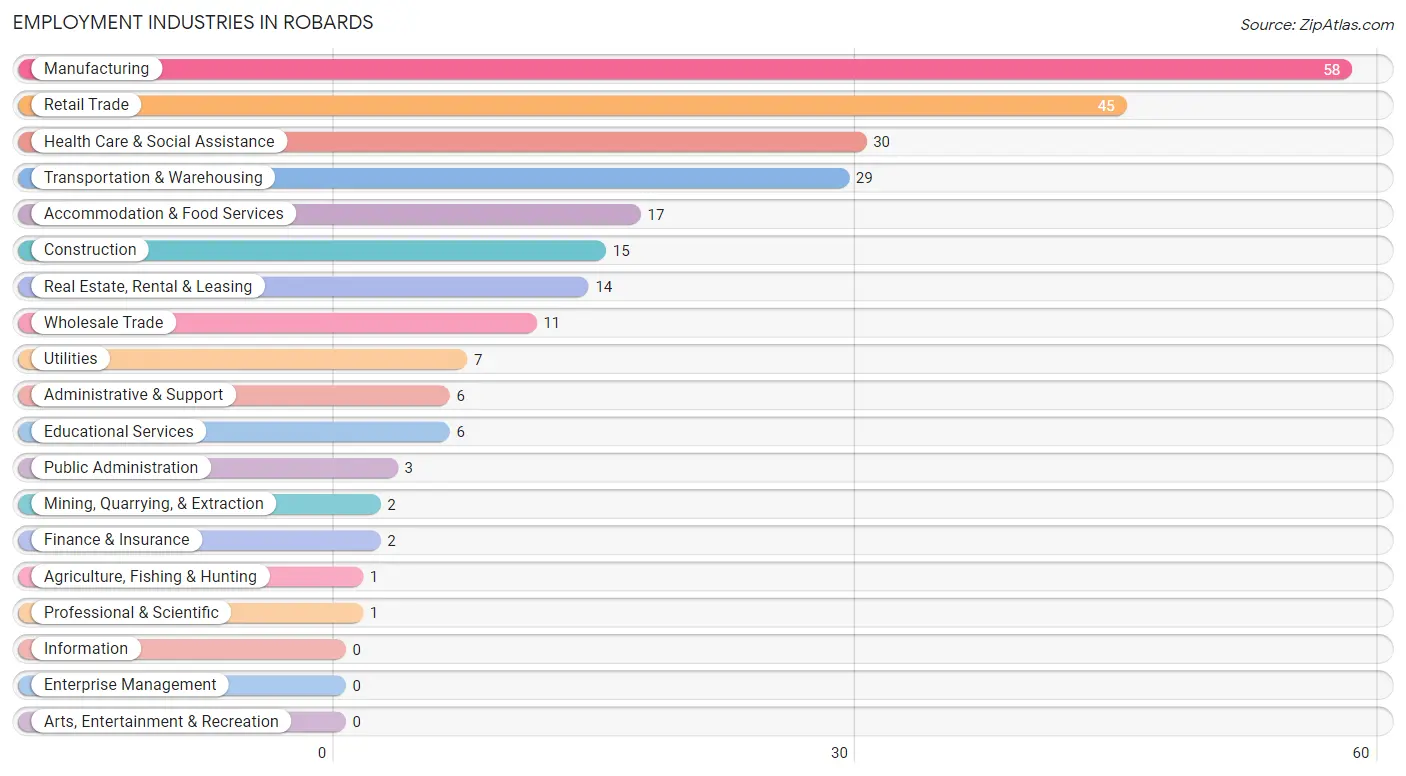
Employment Industries in Robards
The major employment industries in Robards include Manufacturing (58 | 22.6%), Retail Trade (45 | 17.5%), Health Care & Social Assistance (30 | 11.7%), Transportation & Warehousing (29 | 11.3%), and Accommodation & Food Services (17 | 6.6%).
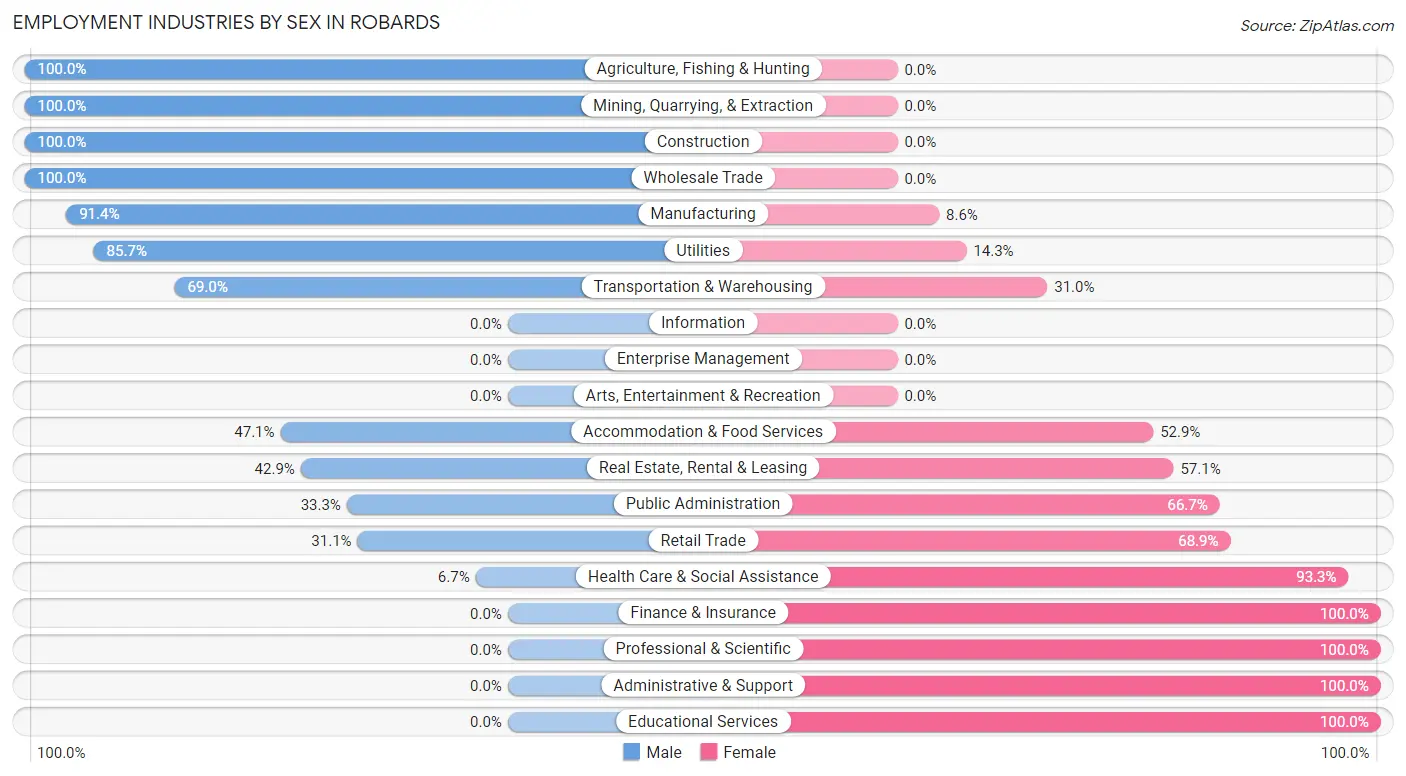
Employment Industries by Sex in Robards
The Robards industries that see more men than women are Agriculture, Fishing & Hunting (100.0%), Mining, Quarrying, & Extraction (100.0%), and Construction (100.0%), whereas the industries that tend to have a higher number of women are Finance & Insurance (100.0%), Professional & Scientific (100.0%), and Administrative & Support (100.0%).
| Industry | Male | Female |
| Agriculture, Fishing & Hunting | 1 (100.0%) | 0 (0.0%) |
| Mining, Quarrying, & Extraction | 2 (100.0%) | 0 (0.0%) |
| Construction | 15 (100.0%) | 0 (0.0%) |
| Manufacturing | 53 (91.4%) | 5 (8.6%) |
| Wholesale Trade | 11 (100.0%) | 0 (0.0%) |
| Retail Trade | 14 (31.1%) | 31 (68.9%) |
| Transportation & Warehousing | 20 (69.0%) | 9 (31.0%) |
| Utilities | 6 (85.7%) | 1 (14.3%) |
| Information | 0 (0.0%) | 0 (0.0%) |
| Finance & Insurance | 0 (0.0%) | 2 (100.0%) |
| Real Estate, Rental & Leasing | 6 (42.9%) | 8 (57.1%) |
| Professional & Scientific | 0 (0.0%) | 1 (100.0%) |
| Enterprise Management | 0 (0.0%) | 0 (0.0%) |
| Administrative & Support | 0 (0.0%) | 6 (100.0%) |
| Educational Services | 0 (0.0%) | 6 (100.0%) |
| Health Care & Social Assistance | 2 (6.7%) | 28 (93.3%) |
| Arts, Entertainment & Recreation | 0 (0.0%) | 0 (0.0%) |
| Accommodation & Food Services | 8 (47.1%) | 9 (52.9%) |
| Public Administration | 1 (33.3%) | 2 (66.7%) |
| Total | 139 (54.1%) | 118 (45.9%) |
Education in Robards
School Enrollment in Robards
The most common levels of schooling among the 67 students in Robards are middle school (23 | 34.3%), high school (16 | 23.9%), and college / undergraduate (14 | 20.9%).
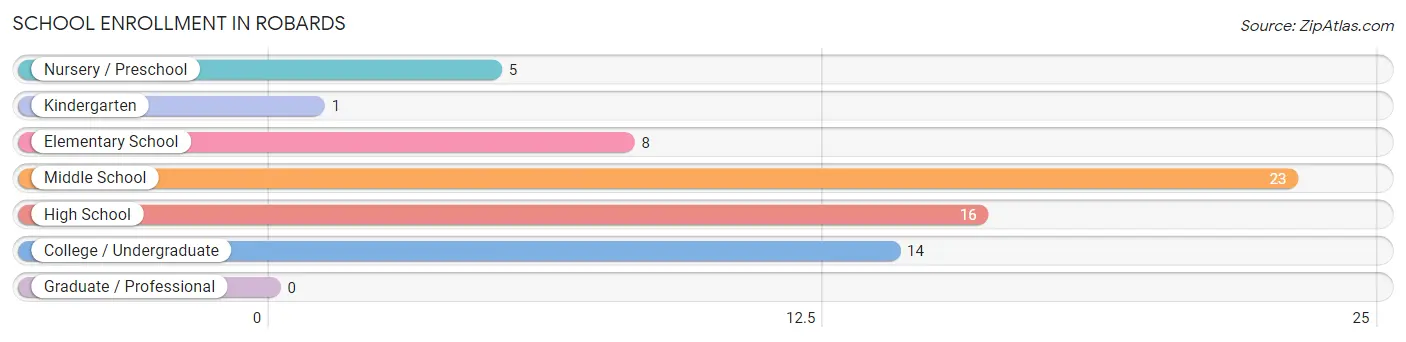
| School Level | # Students | % Students |
| Nursery / Preschool | 5 | 7.5% |
| Kindergarten | 1 | 1.5% |
| Elementary School | 8 | 11.9% |
| Middle School | 23 | 34.3% |
| High School | 16 | 23.9% |
| College / Undergraduate | 14 | 20.9% |
| Graduate / Professional | 0 | 0.0% |
| Total | 67 | 100.0% |
School Enrollment by Age by Funding Source in Robards
Out of a total of 67 students who are enrolled in schools in Robards, 19 (28.4%) attend a private institution, while the remaining 48 (71.6%) are enrolled in public schools. The age group of 10 to 14 year olds has the highest likelihood of being enrolled in private schools, with 13 (48.1% in the age bracket) enrolled. Conversely, the age group of 15 to 17 year olds has the lowest likelihood of being enrolled in a private school, with 10 (100.0% in the age bracket) attending a public institution.
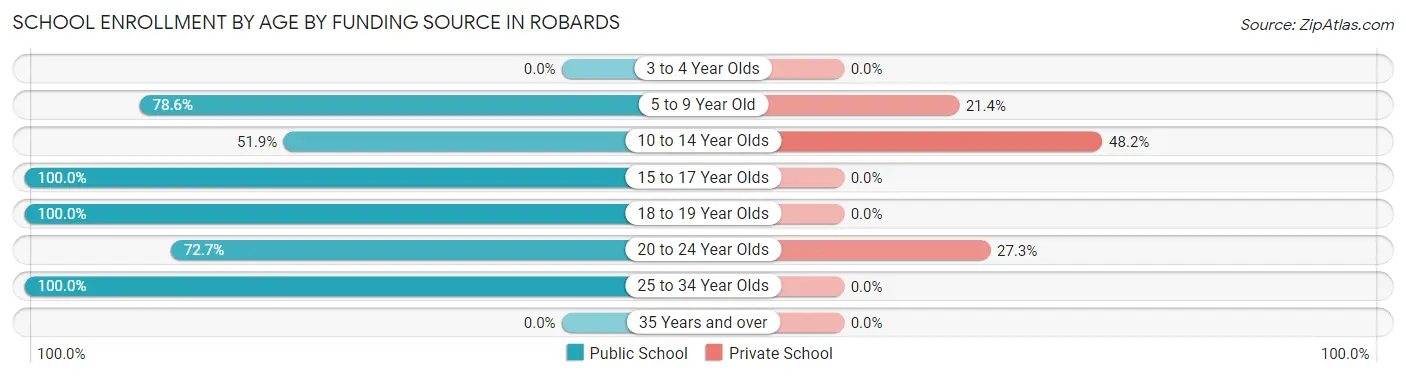
| Age Bracket | Public School | Private School |
| 3 to 4 Year Olds | 0 (0.0%) | 0 (0.0%) |
| 5 to 9 Year Old | 11 (78.6%) | 3 (21.4%) |
| 10 to 14 Year Olds | 14 (51.8%) | 13 (48.1%) |
| 15 to 17 Year Olds | 10 (100.0%) | 0 (0.0%) |
| 18 to 19 Year Olds | 3 (100.0%) | 0 (0.0%) |
| 20 to 24 Year Olds | 8 (72.7%) | 3 (27.3%) |
| 25 to 34 Year Olds | 2 (100.0%) | 0 (0.0%) |
| 35 Years and over | 0 (0.0%) | 0 (0.0%) |
| Total | 48 (71.6%) | 19 (28.4%) |
Educational Attainment by Field of Study in Robards
Education (23 | 47.9%), science & technology (9 | 18.8%), business (6 | 12.5%), bio, nature & agricultural (2 | 4.2%), and liberal arts & history (2 | 4.2%) are the most common fields of study among 48 individuals in Robards who have obtained a bachelor's degree or higher.
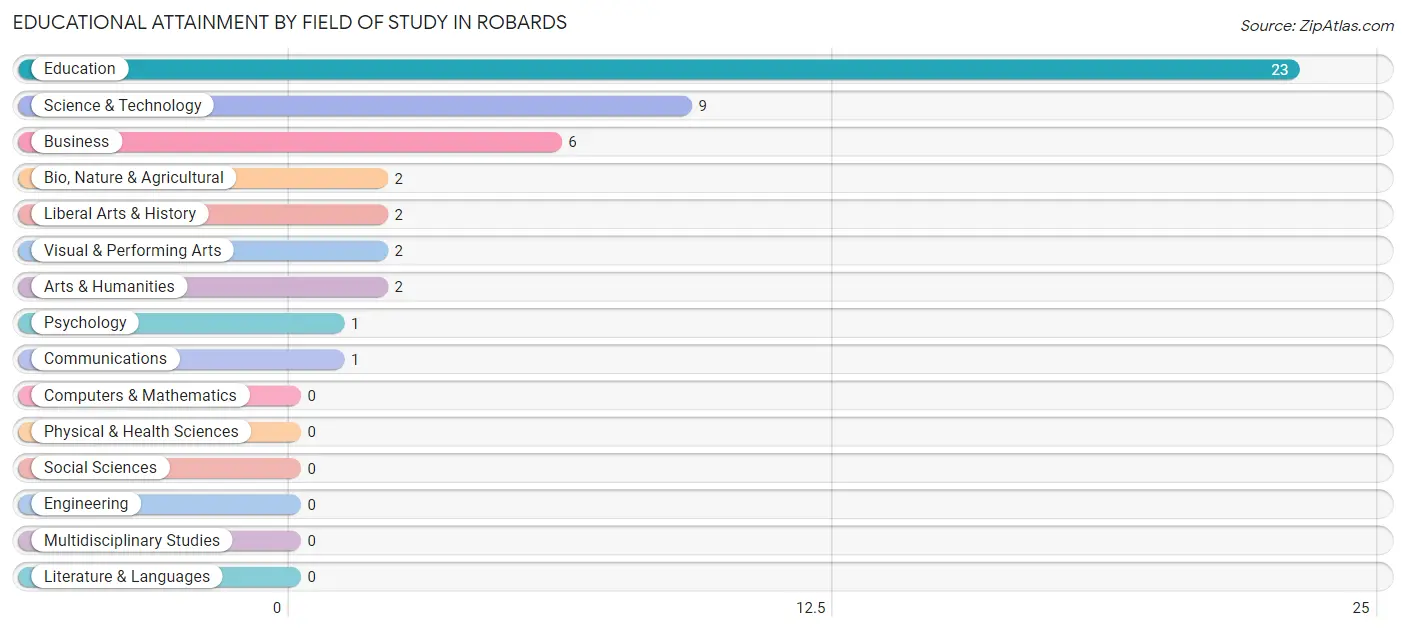
| Field of Study | # Graduates | % Graduates |
| Computers & Mathematics | 0 | 0.0% |
| Bio, Nature & Agricultural | 2 | 4.2% |
| Physical & Health Sciences | 0 | 0.0% |
| Psychology | 1 | 2.1% |
| Social Sciences | 0 | 0.0% |
| Engineering | 0 | 0.0% |
| Multidisciplinary Studies | 0 | 0.0% |
| Science & Technology | 9 | 18.8% |
| Business | 6 | 12.5% |
| Education | 23 | 47.9% |
| Literature & Languages | 0 | 0.0% |
| Liberal Arts & History | 2 | 4.2% |
| Visual & Performing Arts | 2 | 4.2% |
| Communications | 1 | 2.1% |
| Arts & Humanities | 2 | 4.2% |
| Total | 48 | 100.0% |
Transportation & Commute in Robards
Vehicle Availability by Sex in Robards
The most prevalent vehicle ownership categories in Robards are males with 2 vehicles (64, accounting for 45.7%) and females with 2 vehicles (59, making up 54.2%).
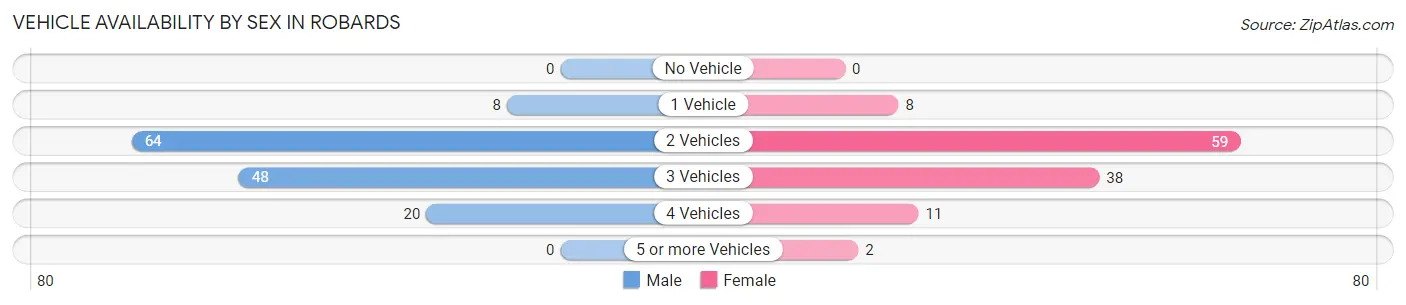
| Vehicles Available | Male | Female |
| No Vehicle | 0 (0.0%) | 0 (0.0%) |
| 1 Vehicle | 8 (5.7%) | 8 (6.8%) |
| 2 Vehicles | 64 (45.7%) | 59 (50.0%) |
| 3 Vehicles | 48 (34.3%) | 38 (32.2%) |
| 4 Vehicles | 20 (14.3%) | 11 (9.3%) |
| 5 or more Vehicles | 0 (0.0%) | 2 (1.7%) |
| Total | 140 (100.0%) | 118 (100.0%) |
Commute Time in Robards
The most frequently occuring commute durations in Robards are 20 to 24 minutes (51 commuters, 19.8%), 15 to 19 minutes (49 commuters, 19.0%), and 30 to 34 minutes (46 commuters, 17.8%).
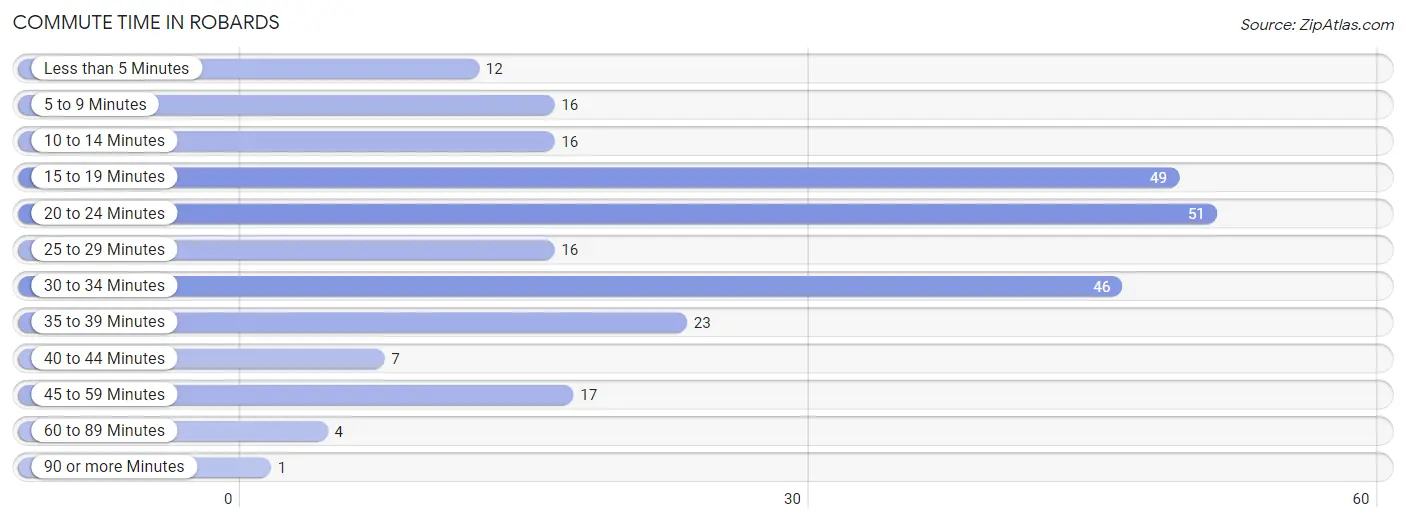
| Commute Time | # Commuters | % Commuters |
| Less than 5 Minutes | 12 | 4.6% |
| 5 to 9 Minutes | 16 | 6.2% |
| 10 to 14 Minutes | 16 | 6.2% |
| 15 to 19 Minutes | 49 | 19.0% |
| 20 to 24 Minutes | 51 | 19.8% |
| 25 to 29 Minutes | 16 | 6.2% |
| 30 to 34 Minutes | 46 | 17.8% |
| 35 to 39 Minutes | 23 | 8.9% |
| 40 to 44 Minutes | 7 | 2.7% |
| 45 to 59 Minutes | 17 | 6.6% |
| 60 to 89 Minutes | 4 | 1.5% |
| 90 or more Minutes | 1 | 0.4% |
Commute Time by Sex in Robards
The most common commute times in Robards are 15 to 19 minutes (32 commuters, 22.9%) for males and 20 to 24 minutes (35 commuters, 29.7%) for females.
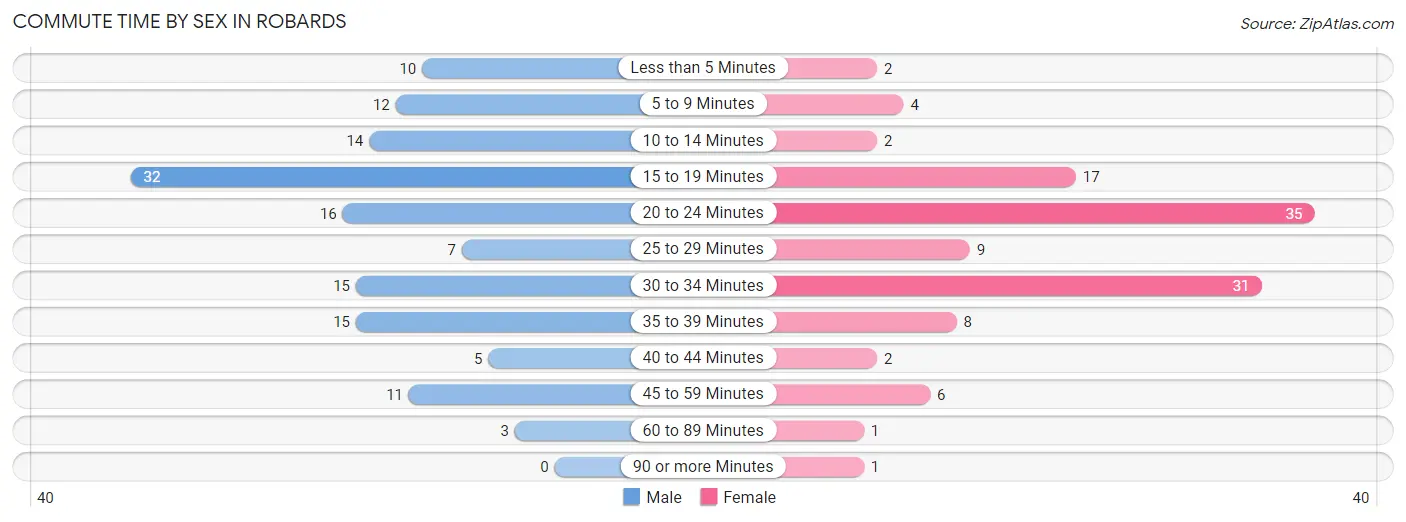
| Commute Time | Male | Female |
| Less than 5 Minutes | 10 (7.1%) | 2 (1.7%) |
| 5 to 9 Minutes | 12 (8.6%) | 4 (3.4%) |
| 10 to 14 Minutes | 14 (10.0%) | 2 (1.7%) |
| 15 to 19 Minutes | 32 (22.9%) | 17 (14.4%) |
| 20 to 24 Minutes | 16 (11.4%) | 35 (29.7%) |
| 25 to 29 Minutes | 7 (5.0%) | 9 (7.6%) |
| 30 to 34 Minutes | 15 (10.7%) | 31 (26.3%) |
| 35 to 39 Minutes | 15 (10.7%) | 8 (6.8%) |
| 40 to 44 Minutes | 5 (3.6%) | 2 (1.7%) |
| 45 to 59 Minutes | 11 (7.9%) | 6 (5.1%) |
| 60 to 89 Minutes | 3 (2.1%) | 1 (0.9%) |
| 90 or more Minutes | 0 (0.0%) | 1 (0.9%) |
Time of Departure to Work by Sex in Robards
The most frequent times of departure to work in Robards are 5:30 AM to 5:59 AM (32, 22.9%) for males and 7:30 AM to 7:59 AM (25, 21.2%) for females.
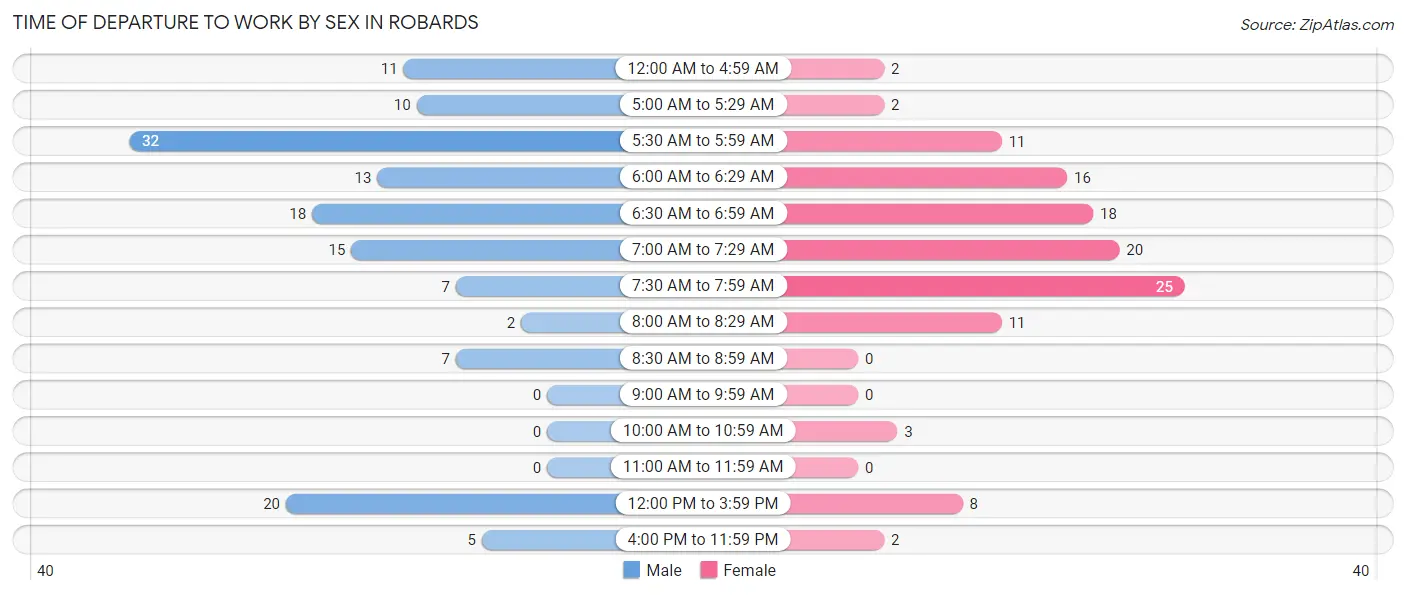
| Time of Departure | Male | Female |
| 12:00 AM to 4:59 AM | 11 (7.9%) | 2 (1.7%) |
| 5:00 AM to 5:29 AM | 10 (7.1%) | 2 (1.7%) |
| 5:30 AM to 5:59 AM | 32 (22.9%) | 11 (9.3%) |
| 6:00 AM to 6:29 AM | 13 (9.3%) | 16 (13.6%) |
| 6:30 AM to 6:59 AM | 18 (12.9%) | 18 (15.2%) |
| 7:00 AM to 7:29 AM | 15 (10.7%) | 20 (17.0%) |
| 7:30 AM to 7:59 AM | 7 (5.0%) | 25 (21.2%) |
| 8:00 AM to 8:29 AM | 2 (1.4%) | 11 (9.3%) |
| 8:30 AM to 8:59 AM | 7 (5.0%) | 0 (0.0%) |
| 9:00 AM to 9:59 AM | 0 (0.0%) | 0 (0.0%) |
| 10:00 AM to 10:59 AM | 0 (0.0%) | 3 (2.5%) |
| 11:00 AM to 11:59 AM | 0 (0.0%) | 0 (0.0%) |
| 12:00 PM to 3:59 PM | 20 (14.3%) | 8 (6.8%) |
| 4:00 PM to 11:59 PM | 5 (3.6%) | 2 (1.7%) |
| Total | 140 (100.0%) | 118 (100.0%) |
Housing Occupancy in Robards
Occupancy by Ownership in Robards
Of the total 219 dwellings in Robards, owner-occupied units account for 173 (79.0%), while renter-occupied units make up 46 (21.0%).
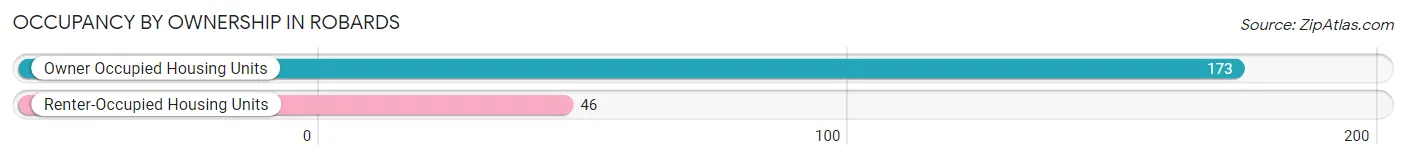
| Occupancy | # Housing Units | % Housing Units |
| Owner Occupied Housing Units | 173 | 79.0% |
| Renter-Occupied Housing Units | 46 | 21.0% |
| Total Occupied Housing Units | 219 | 100.0% |
Occupancy by Household Size in Robards
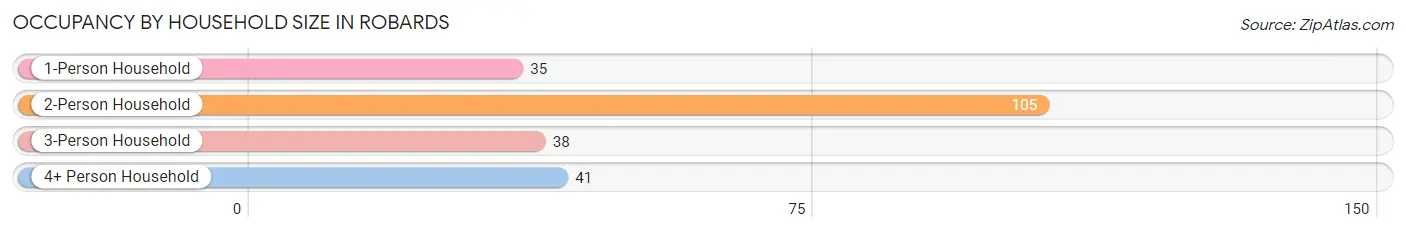
| Household Size | # Housing Units | % Housing Units |
| 1-Person Household | 35 | 16.0% |
| 2-Person Household | 105 | 47.9% |
| 3-Person Household | 38 | 17.3% |
| 4+ Person Household | 41 | 18.7% |
| Total Housing Units | 219 | 100.0% |
Occupancy by Ownership by Household Size in Robards
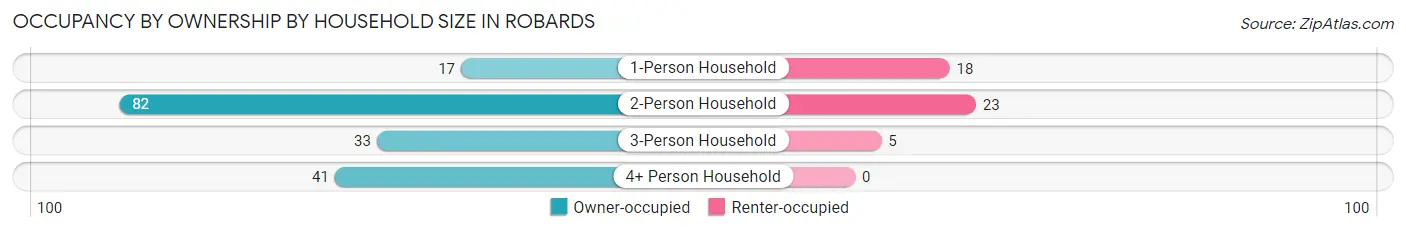
| Household Size | Owner-occupied | Renter-occupied |
| 1-Person Household | 17 (48.6%) | 18 (51.4%) |
| 2-Person Household | 82 (78.1%) | 23 (21.9%) |
| 3-Person Household | 33 (86.8%) | 5 (13.2%) |
| 4+ Person Household | 41 (100.0%) | 0 (0.0%) |
| Total Housing Units | 173 (79.0%) | 46 (21.0%) |
Occupancy by Educational Attainment in Robards
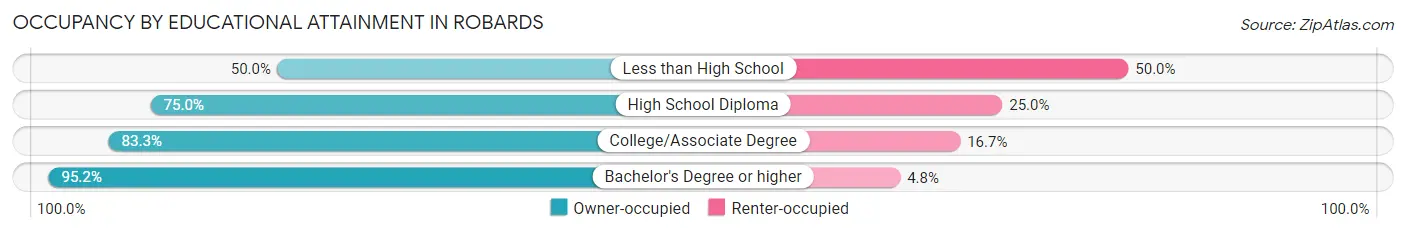
| Household Size | Owner-occupied | Renter-occupied |
| Less than High School | 4 (50.0%) | 4 (50.0%) |
| High School Diploma | 84 (75.0%) | 28 (25.0%) |
| College/Associate Degree | 65 (83.3%) | 13 (16.7%) |
| Bachelor's Degree or higher | 20 (95.2%) | 1 (4.8%) |
Occupancy by Age of Householder in Robards
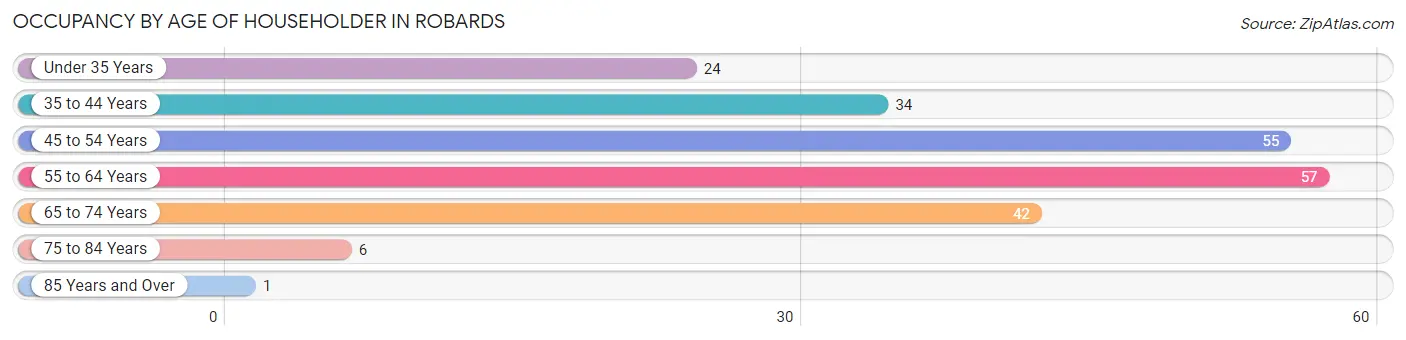
| Age Bracket | # Households | % Households |
| Under 35 Years | 24 | 11.0% |
| 35 to 44 Years | 34 | 15.5% |
| 45 to 54 Years | 55 | 25.1% |
| 55 to 64 Years | 57 | 26.0% |
| 65 to 74 Years | 42 | 19.2% |
| 75 to 84 Years | 6 | 2.7% |
| 85 Years and Over | 1 | 0.5% |
| Total | 219 | 100.0% |
Housing Finances in Robards
Median Income by Occupancy in Robards
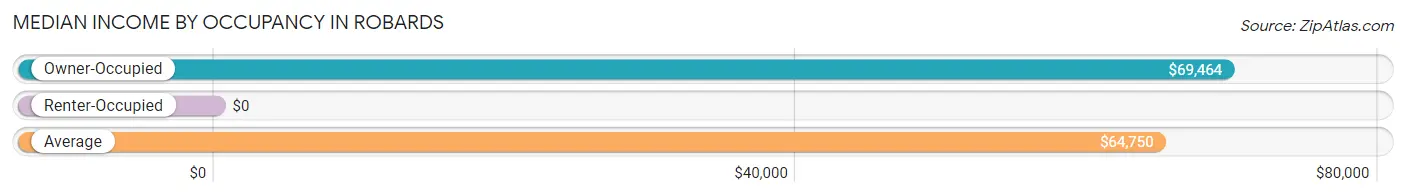
| Occupancy Type | # Households | Median Income |
| Owner-Occupied | 173 (79.0%) | $69,464 |
| Renter-Occupied | 46 (21.0%) | $0 |
| Average | 219 (100.0%) | $64,750 |
Occupancy by Householder Income Bracket in Robards
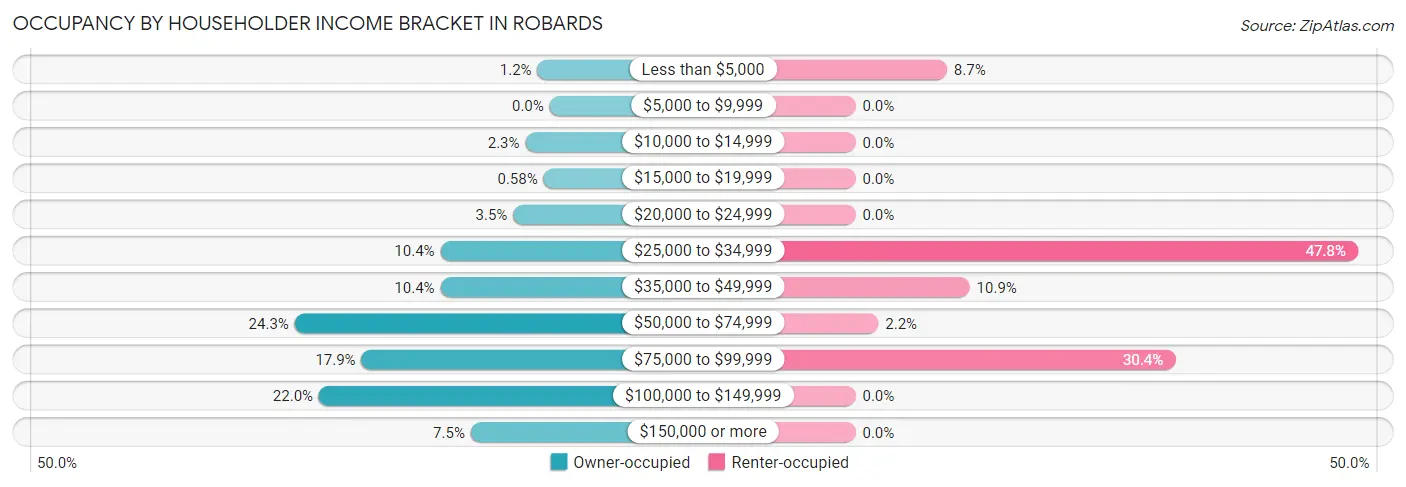
| Income Bracket | Owner-occupied | Renter-occupied |
| Less than $5,000 | 2 (1.2%) | 4 (8.7%) |
| $5,000 to $9,999 | 0 (0.0%) | 0 (0.0%) |
| $10,000 to $14,999 | 4 (2.3%) | 0 (0.0%) |
| $15,000 to $19,999 | 1 (0.6%) | 0 (0.0%) |
| $20,000 to $24,999 | 6 (3.5%) | 0 (0.0%) |
| $25,000 to $34,999 | 18 (10.4%) | 22 (47.8%) |
| $35,000 to $49,999 | 18 (10.4%) | 5 (10.9%) |
| $50,000 to $74,999 | 42 (24.3%) | 1 (2.2%) |
| $75,000 to $99,999 | 31 (17.9%) | 14 (30.4%) |
| $100,000 to $149,999 | 38 (22.0%) | 0 (0.0%) |
| $150,000 or more | 13 (7.5%) | 0 (0.0%) |
| Total | 173 (100.0%) | 46 (100.0%) |
Monthly Housing Cost Tiers in Robards
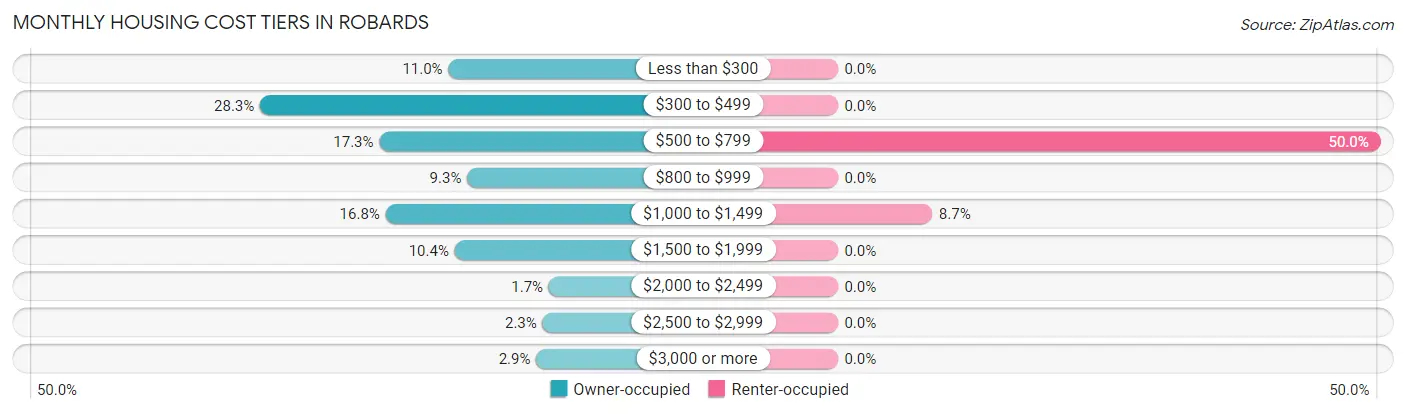
| Monthly Cost | Owner-occupied | Renter-occupied |
| Less than $300 | 19 (11.0%) | 0 (0.0%) |
| $300 to $499 | 49 (28.3%) | 0 (0.0%) |
| $500 to $799 | 30 (17.3%) | 23 (50.0%) |
| $800 to $999 | 16 (9.2%) | 0 (0.0%) |
| $1,000 to $1,499 | 29 (16.8%) | 4 (8.7%) |
| $1,500 to $1,999 | 18 (10.4%) | 0 (0.0%) |
| $2,000 to $2,499 | 3 (1.7%) | 0 (0.0%) |
| $2,500 to $2,999 | 4 (2.3%) | 0 (0.0%) |
| $3,000 or more | 5 (2.9%) | 0 (0.0%) |
| Total | 173 (100.0%) | 46 (100.0%) |
Physical Housing Characteristics in Robards
Housing Structures in Robards
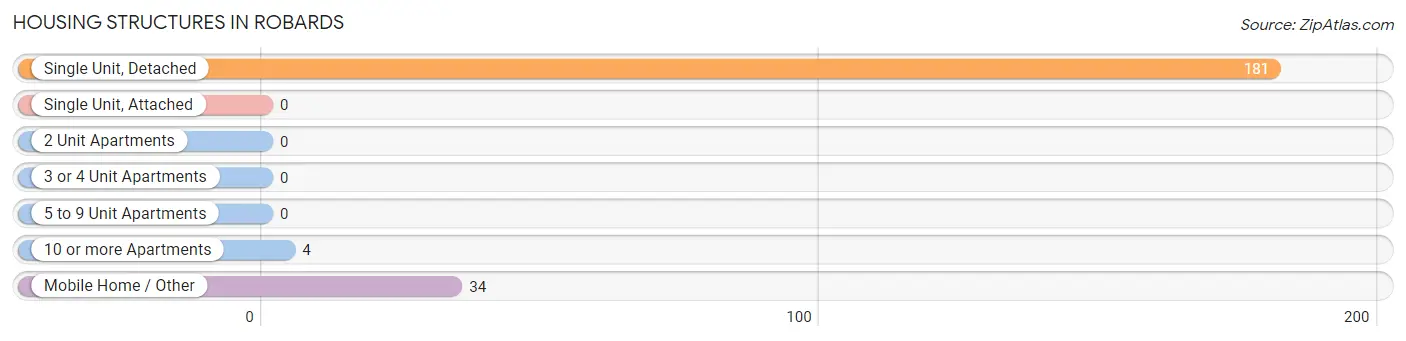
| Structure Type | # Housing Units | % Housing Units |
| Single Unit, Detached | 181 | 82.7% |
| Single Unit, Attached | 0 | 0.0% |
| 2 Unit Apartments | 0 | 0.0% |
| 3 or 4 Unit Apartments | 0 | 0.0% |
| 5 to 9 Unit Apartments | 0 | 0.0% |
| 10 or more Apartments | 4 | 1.8% |
| Mobile Home / Other | 34 | 15.5% |
| Total | 219 | 100.0% |
Housing Structures by Occupancy in Robards
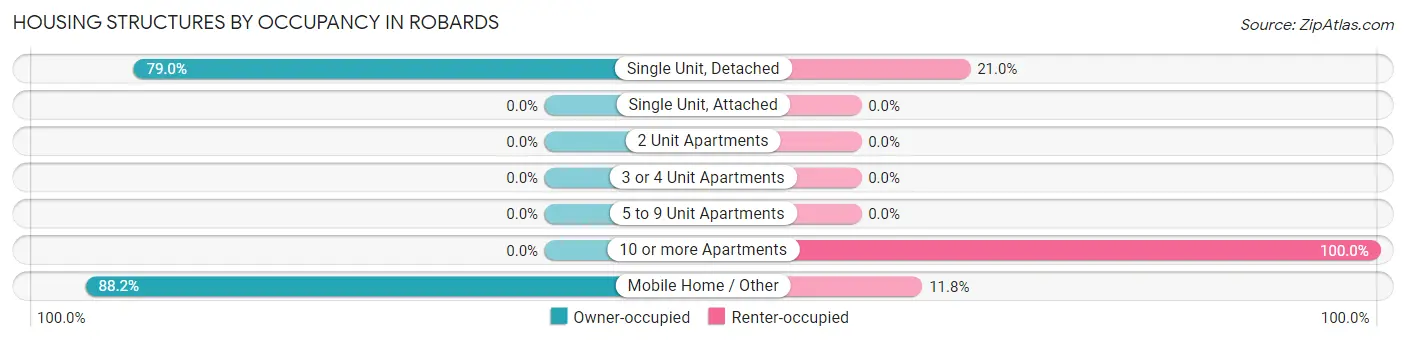
| Structure Type | Owner-occupied | Renter-occupied |
| Single Unit, Detached | 143 (79.0%) | 38 (21.0%) |
| Single Unit, Attached | 0 (0.0%) | 0 (0.0%) |
| 2 Unit Apartments | 0 (0.0%) | 0 (0.0%) |
| 3 or 4 Unit Apartments | 0 (0.0%) | 0 (0.0%) |
| 5 to 9 Unit Apartments | 0 (0.0%) | 0 (0.0%) |
| 10 or more Apartments | 0 (0.0%) | 4 (100.0%) |
| Mobile Home / Other | 30 (88.2%) | 4 (11.8%) |
| Total | 173 (79.0%) | 46 (21.0%) |
Housing Structures by Number of Rooms in Robards
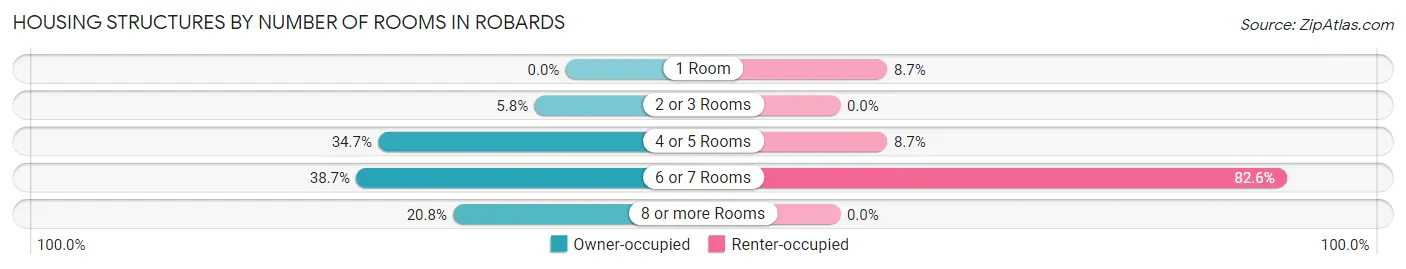
| Number of Rooms | Owner-occupied | Renter-occupied |
| 1 Room | 0 (0.0%) | 4 (8.7%) |
| 2 or 3 Rooms | 10 (5.8%) | 0 (0.0%) |
| 4 or 5 Rooms | 60 (34.7%) | 4 (8.7%) |
| 6 or 7 Rooms | 67 (38.7%) | 38 (82.6%) |
| 8 or more Rooms | 36 (20.8%) | 0 (0.0%) |
| Total | 173 (100.0%) | 46 (100.0%) |
Housing Structure by Heating Type in Robards
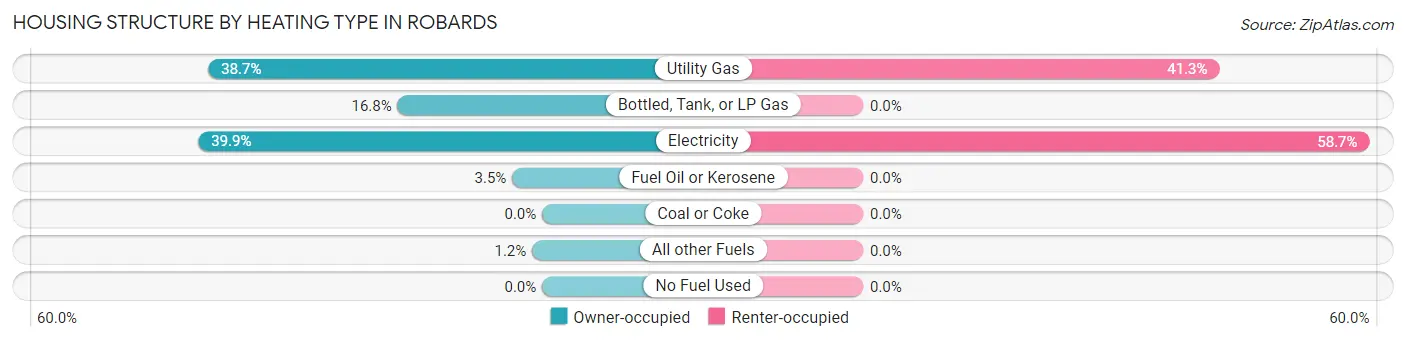
| Heating Type | Owner-occupied | Renter-occupied |
| Utility Gas | 67 (38.7%) | 19 (41.3%) |
| Bottled, Tank, or LP Gas | 29 (16.8%) | 0 (0.0%) |
| Electricity | 69 (39.9%) | 27 (58.7%) |
| Fuel Oil or Kerosene | 6 (3.5%) | 0 (0.0%) |
| Coal or Coke | 0 (0.0%) | 0 (0.0%) |
| All other Fuels | 2 (1.2%) | 0 (0.0%) |
| No Fuel Used | 0 (0.0%) | 0 (0.0%) |
| Total | 173 (100.0%) | 46 (100.0%) |
Household Vehicle Usage in Robards
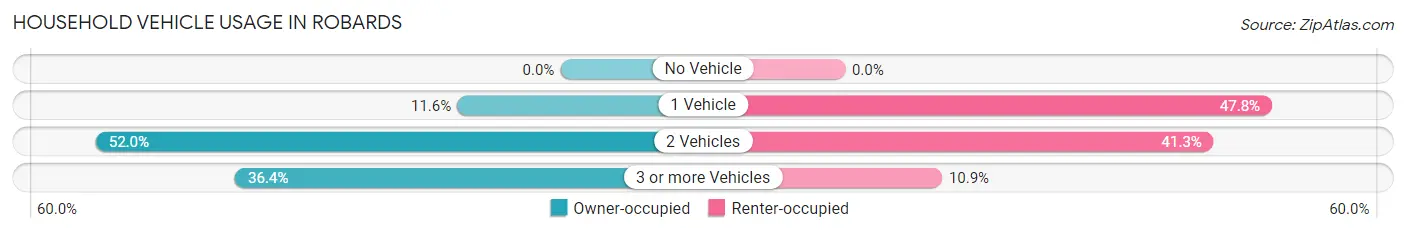
| Vehicles per Household | Owner-occupied | Renter-occupied |
| No Vehicle | 0 (0.0%) | 0 (0.0%) |
| 1 Vehicle | 20 (11.6%) | 22 (47.8%) |
| 2 Vehicles | 90 (52.0%) | 19 (41.3%) |
| 3 or more Vehicles | 63 (36.4%) | 5 (10.9%) |
| Total | 173 (100.0%) | 46 (100.0%) |
Real Estate & Mortgages in Robards
Real Estate and Mortgage Overview in Robards
| Characteristic | Without Mortgage | With Mortgage |
| Housing Units | 75 | 98 |
| Median Property Value | $76,100 | $137,500 |
| Median Household Income | $56,964 | $6 |
| Monthly Housing Costs | $344 | $5 |
| Real Estate Taxes | $454 | $1 |
Property Value by Mortgage Status in Robards
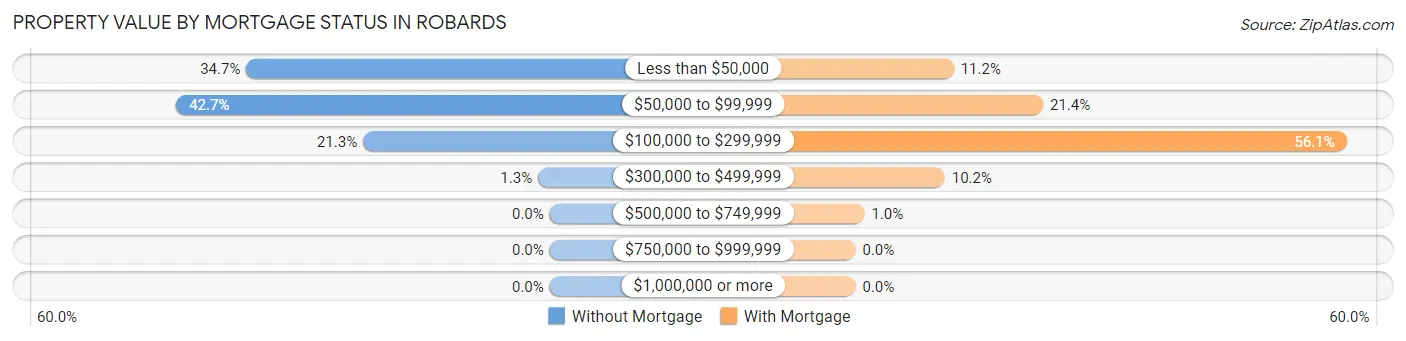
| Property Value | Without Mortgage | With Mortgage |
| Less than $50,000 | 26 (34.7%) | 11 (11.2%) |
| $50,000 to $99,999 | 32 (42.7%) | 21 (21.4%) |
| $100,000 to $299,999 | 16 (21.3%) | 55 (56.1%) |
| $300,000 to $499,999 | 1 (1.3%) | 10 (10.2%) |
| $500,000 to $749,999 | 0 (0.0%) | 1 (1.0%) |
| $750,000 to $999,999 | 0 (0.0%) | 0 (0.0%) |
| $1,000,000 or more | 0 (0.0%) | 0 (0.0%) |
| Total | 75 (100.0%) | 98 (100.0%) |
Household Income by Mortgage Status in Robards
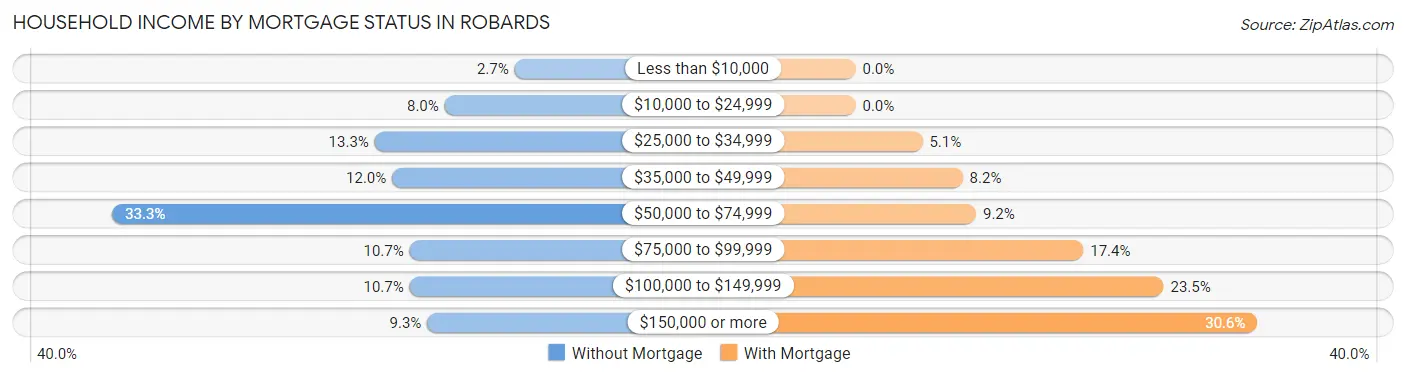
| Household Income | Without Mortgage | With Mortgage |
| Less than $10,000 | 2 (2.7%) | 0 (0.0%) |
| $10,000 to $24,999 | 6 (8.0%) | 0 (0.0%) |
| $25,000 to $34,999 | 10 (13.3%) | 5 (5.1%) |
| $35,000 to $49,999 | 9 (12.0%) | 8 (8.2%) |
| $50,000 to $74,999 | 25 (33.3%) | 9 (9.2%) |
| $75,000 to $99,999 | 8 (10.7%) | 17 (17.3%) |
| $100,000 to $149,999 | 8 (10.7%) | 23 (23.5%) |
| $150,000 or more | 7 (9.3%) | 30 (30.6%) |
| Total | 75 (100.0%) | 98 (100.0%) |
Property Value to Household Income Ratio in Robards
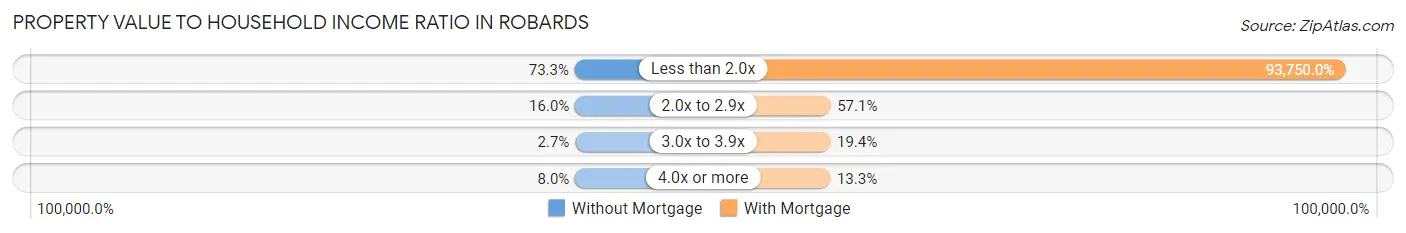
| Value-to-Income Ratio | Without Mortgage | With Mortgage |
| Less than 2.0x | 55 (73.3%) | 91,875 (93,750.0%) |
| 2.0x to 2.9x | 12 (16.0%) | 56 (57.1%) |
| 3.0x to 3.9x | 2 (2.7%) | 19 (19.4%) |
| 4.0x or more | 6 (8.0%) | 13 (13.3%) |
| Total | 75 (100.0%) | 98 (100.0%) |
Real Estate Taxes by Mortgage Status in Robards
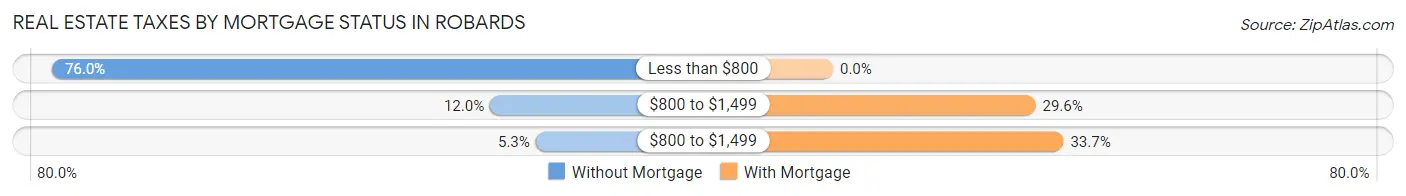
| Property Taxes | Without Mortgage | With Mortgage |
| Less than $800 | 57 (76.0%) | 0 (0.0%) |
| $800 to $1,499 | 9 (12.0%) | 29 (29.6%) |
| $800 to $1,499 | 4 (5.3%) | 33 (33.7%) |
| Total | 75 (100.0%) | 98 (100.0%) |
Health & Disability in Robards
Health Insurance Coverage by Age in Robards
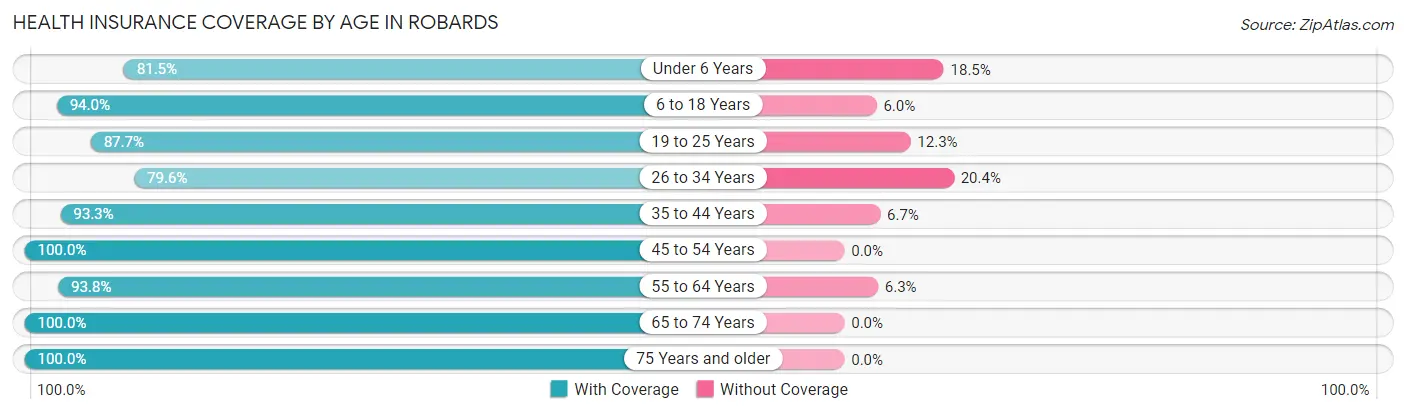
| Age Bracket | With Coverage | Without Coverage |
| Under 6 Years | 22 (81.5%) | 5 (18.5%) |
| 6 to 18 Years | 47 (94.0%) | 3 (6.0%) |
| 19 to 25 Years | 64 (87.7%) | 9 (12.3%) |
| 26 to 34 Years | 39 (79.6%) | 10 (20.4%) |
| 35 to 44 Years | 56 (93.3%) | 4 (6.7%) |
| 45 to 54 Years | 85 (100.0%) | 0 (0.0%) |
| 55 to 64 Years | 105 (93.8%) | 7 (6.2%) |
| 65 to 74 Years | 81 (100.0%) | 0 (0.0%) |
| 75 Years and older | 12 (100.0%) | 0 (0.0%) |
| Total | 511 (93.1%) | 38 (6.9%) |
Health Insurance Coverage by Citizenship Status in Robards
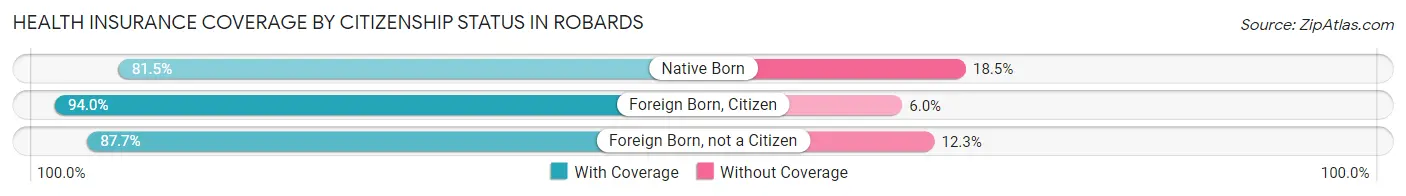
| Citizenship Status | With Coverage | Without Coverage |
| Native Born | 22 (81.5%) | 5 (18.5%) |
| Foreign Born, Citizen | 47 (94.0%) | 3 (6.0%) |
| Foreign Born, not a Citizen | 64 (87.7%) | 9 (12.3%) |
Health Insurance Coverage by Household Income in Robards
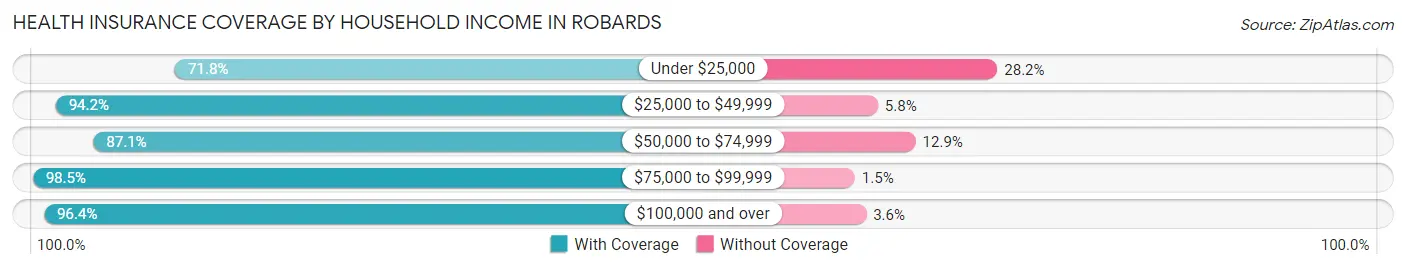
| Household Income | With Coverage | Without Coverage |
| Under $25,000 | 28 (71.8%) | 11 (28.2%) |
| $25,000 to $49,999 | 113 (94.2%) | 7 (5.8%) |
| $50,000 to $74,999 | 81 (87.1%) | 12 (12.9%) |
| $75,000 to $99,999 | 130 (98.5%) | 2 (1.5%) |
| $100,000 and over | 159 (96.4%) | 6 (3.6%) |
Public vs Private Health Insurance Coverage by Age in Robards
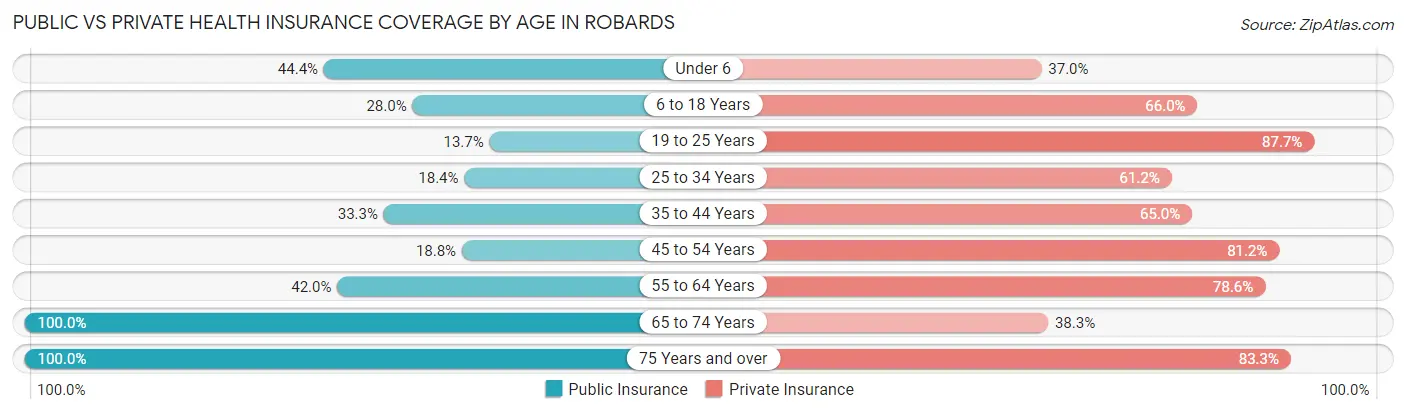
| Age Bracket | Public Insurance | Private Insurance |
| Under 6 | 12 (44.4%) | 10 (37.0%) |
| 6 to 18 Years | 14 (28.0%) | 33 (66.0%) |
| 19 to 25 Years | 10 (13.7%) | 64 (87.7%) |
| 25 to 34 Years | 9 (18.4%) | 30 (61.2%) |
| 35 to 44 Years | 20 (33.3%) | 39 (65.0%) |
| 45 to 54 Years | 16 (18.8%) | 69 (81.2%) |
| 55 to 64 Years | 47 (42.0%) | 88 (78.6%) |
| 65 to 74 Years | 81 (100.0%) | 31 (38.3%) |
| 75 Years and over | 12 (100.0%) | 10 (83.3%) |
| Total | 221 (40.3%) | 374 (68.1%) |
Disability Status by Sex by Age in Robards
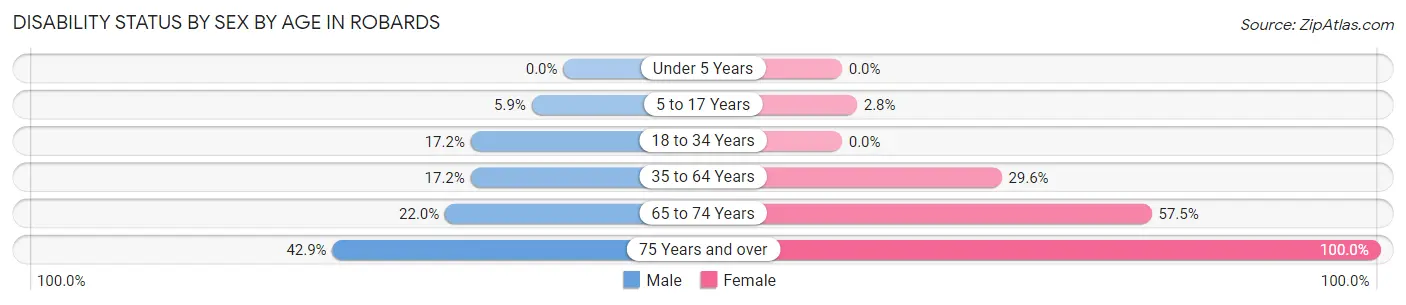
| Age Bracket | Male | Female |
| Under 5 Years | 0 (0.0%) | 0 (0.0%) |
| 5 to 17 Years | 1 (5.9%) | 1 (2.8%) |
| 18 to 34 Years | 11 (17.2%) | 0 (0.0%) |
| 35 to 64 Years | 21 (17.2%) | 40 (29.6%) |
| 65 to 74 Years | 9 (22.0%) | 23 (57.5%) |
| 75 Years and over | 3 (42.9%) | 5 (100.0%) |
Disability Class by Sex by Age in Robards
Disability Class: Hearing Difficulty
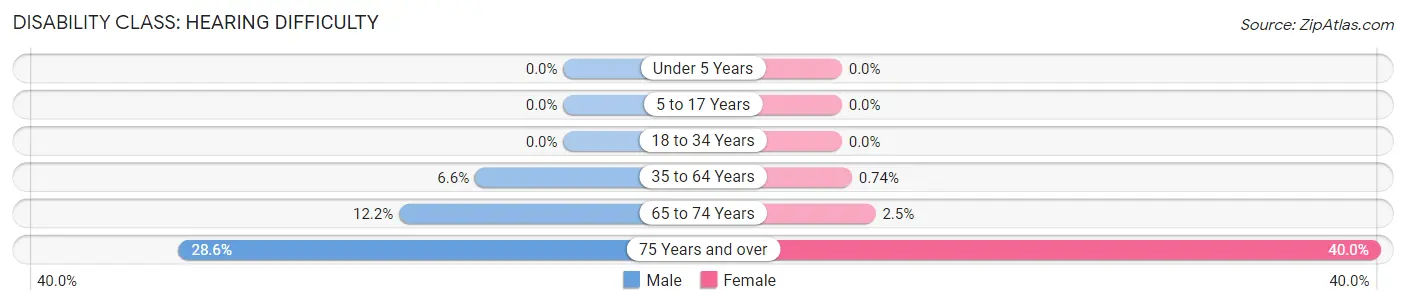
| Age Bracket | Male | Female |
| Under 5 Years | 0 (0.0%) | 0 (0.0%) |
| 5 to 17 Years | 0 (0.0%) | 0 (0.0%) |
| 18 to 34 Years | 0 (0.0%) | 0 (0.0%) |
| 35 to 64 Years | 8 (6.6%) | 1 (0.7%) |
| 65 to 74 Years | 5 (12.2%) | 1 (2.5%) |
| 75 Years and over | 2 (28.6%) | 2 (40.0%) |
Disability Class: Vision Difficulty
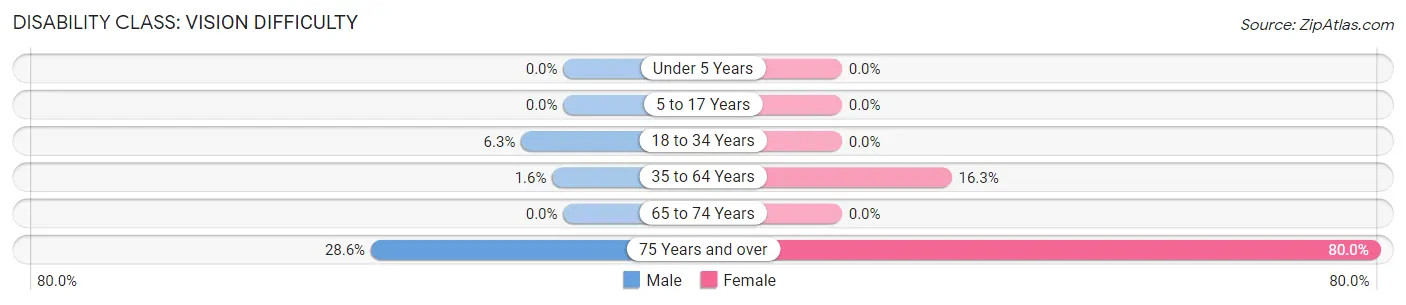
| Age Bracket | Male | Female |
| Under 5 Years | 0 (0.0%) | 0 (0.0%) |
| 5 to 17 Years | 0 (0.0%) | 0 (0.0%) |
| 18 to 34 Years | 4 (6.2%) | 0 (0.0%) |
| 35 to 64 Years | 2 (1.6%) | 22 (16.3%) |
| 65 to 74 Years | 0 (0.0%) | 0 (0.0%) |
| 75 Years and over | 2 (28.6%) | 4 (80.0%) |
Disability Class: Cognitive Difficulty
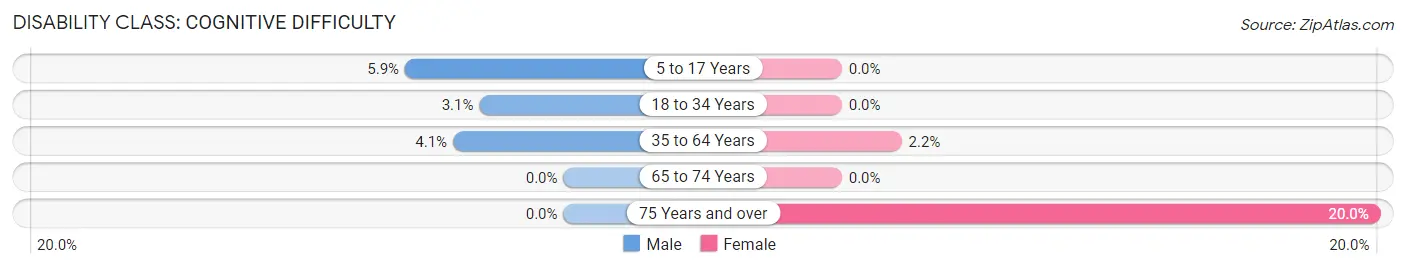
| Age Bracket | Male | Female |
| 5 to 17 Years | 1 (5.9%) | 0 (0.0%) |
| 18 to 34 Years | 2 (3.1%) | 0 (0.0%) |
| 35 to 64 Years | 5 (4.1%) | 3 (2.2%) |
| 65 to 74 Years | 0 (0.0%) | 0 (0.0%) |
| 75 Years and over | 0 (0.0%) | 1 (20.0%) |
Disability Class: Ambulatory Difficulty
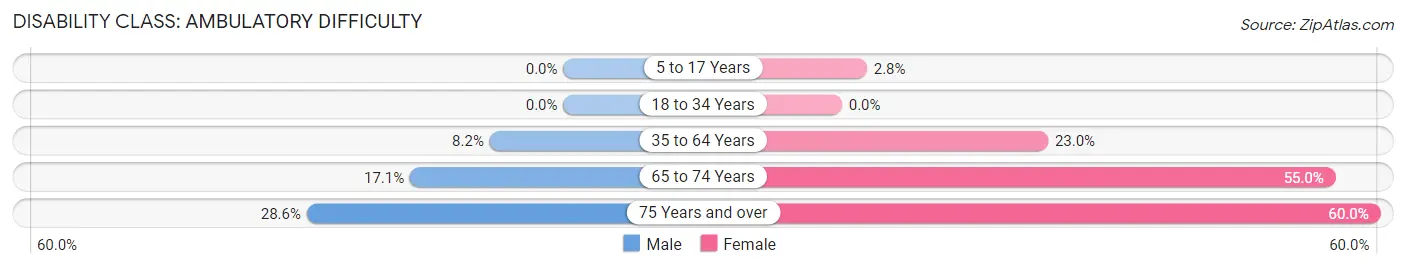
| Age Bracket | Male | Female |
| 5 to 17 Years | 0 (0.0%) | 1 (2.8%) |
| 18 to 34 Years | 0 (0.0%) | 0 (0.0%) |
| 35 to 64 Years | 10 (8.2%) | 31 (23.0%) |
| 65 to 74 Years | 7 (17.1%) | 22 (55.0%) |
| 75 Years and over | 2 (28.6%) | 3 (60.0%) |
Disability Class: Self-Care Difficulty
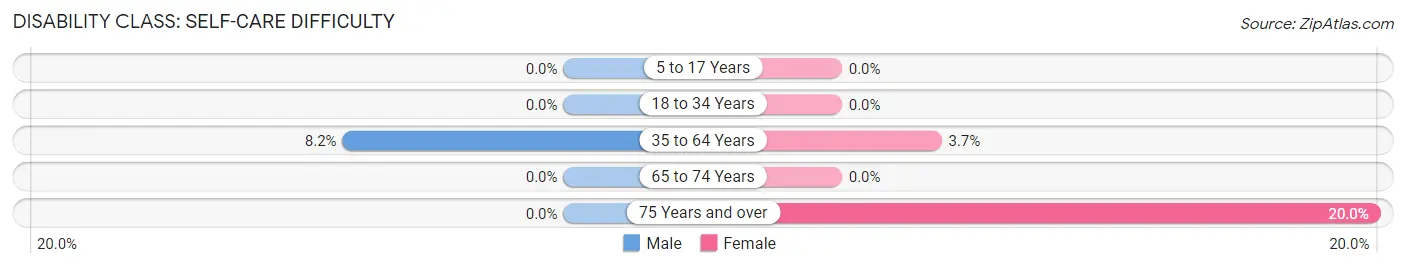
| Age Bracket | Male | Female |
| 5 to 17 Years | 0 (0.0%) | 0 (0.0%) |
| 18 to 34 Years | 0 (0.0%) | 0 (0.0%) |
| 35 to 64 Years | 10 (8.2%) | 5 (3.7%) |
| 65 to 74 Years | 0 (0.0%) | 0 (0.0%) |
| 75 Years and over | 0 (0.0%) | 1 (20.0%) |
Technology Access in Robards
Computing Device Access in Robards
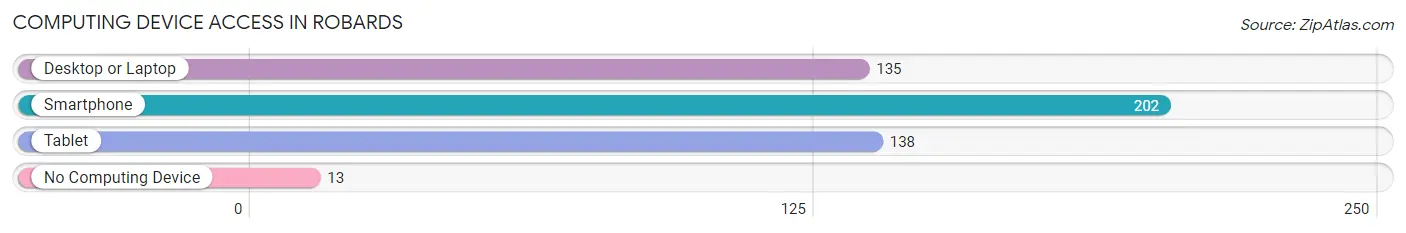
| Device Type | # Households | % Households |
| Desktop or Laptop | 135 | 61.6% |
| Smartphone | 202 | 92.2% |
| Tablet | 138 | 63.0% |
| No Computing Device | 13 | 5.9% |
| Total | 219 | 100.0% |
Internet Access in Robards
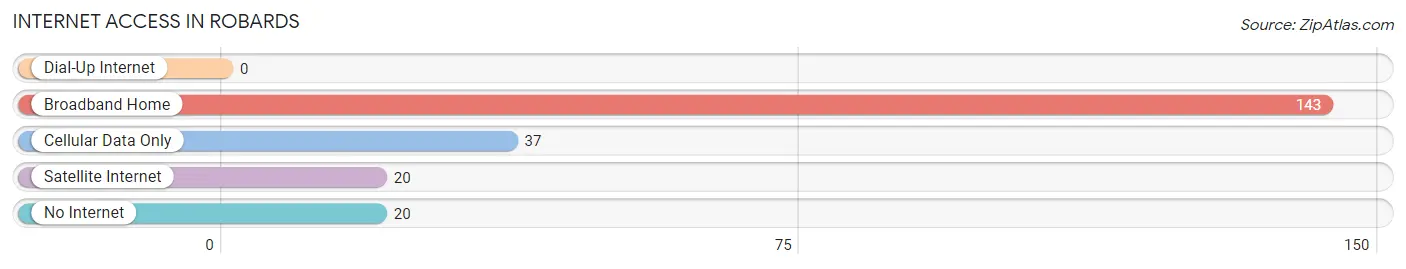
| Internet Type | # Households | % Households |
| Dial-Up Internet | 0 | 0.0% |
| Broadband Home | 143 | 65.3% |
| Cellular Data Only | 37 | 16.9% |
| Satellite Internet | 20 | 9.1% |
| No Internet | 20 | 9.1% |
| Total | 219 | 100.0% |
Robards Summary
Robards, Kentucky is a small unincorporated community located in Henderson County, Kentucky. It is situated on the banks of the Ohio River, just south of the city of Henderson. The population of Robards was estimated to be around 500 in 2020.
History
Robards was first settled in the early 1800s by a group of settlers from Virginia. The town was named after a local landowner, William Robards. The town was originally a small farming community, but it soon grew to become a bustling river port. The town was a major stop on the Ohio River, and it was a popular destination for steamboats and other river traffic.
In the late 1800s, Robards was a major hub for the tobacco industry. The town was home to several tobacco warehouses and factories, and it was a major center for the production of cigars. The town also had a large number of saloons and other businesses catering to the river traffic.
In the early 1900s, Robards was a major stop on the Louisville and Nashville Railroad. The railroad brought a great deal of economic activity to the town, and it helped to make Robards a major center for commerce and industry.
Geography
Robards is located in Henderson County, Kentucky, on the banks of the Ohio River. The town is situated on the western edge of the county, just south of the city of Henderson. The town is surrounded by rolling hills and farmland, and it is located near the confluence of the Ohio and Green Rivers.
The climate in Robards is humid subtropical, with hot summers and mild winters. The average annual temperature is around 60 degrees Fahrenheit, and the average annual precipitation is around 40 inches.
Economy
Robards is a small, rural community, and the economy is largely based on agriculture. The town is home to several farms, and the surrounding area is known for its production of tobacco, corn, and soybeans.
Robards is also home to several small businesses, including a few restaurants, a grocery store, and a few other retail stores. The town is also home to a few manufacturing companies, including a furniture factory and a plastics factory.
Demographics
Robards is a small, rural community, and the population is estimated to be around 500. The town is predominantly white, with a small African American population. The median household income in Robards is around $35,000, and the median home value is around $90,000.
Robards is a small, rural community, and it is a great place to live for those who enjoy a quiet, peaceful lifestyle. The town is surrounded by beautiful countryside, and it is a great place to raise a family. The town is also close to the city of Henderson, which offers a variety of amenities and attractions.
Common Questions
What is Per Capita Income in Robards?
Per Capita income in Robards is $29,340.
What is the Median Family Income in Robards?
Median Family Income in Robards is $76,000.
What is the Median Household income in Robards?
Median Household Income in Robards is $64,750.
What is Income or Wage Gap in Robards?
Income or Wage Gap in Robards is 40.2%.
Women in Robards earn 59.8 cents for every dollar earned by a man.
What is Inequality or Gini Index in Robards?
Inequality or Gini Index in Robards is 0.32.
What is the Total Population of Robards?
Total Population of Robards is 550.
What is the Total Male Population of Robards?
Total Male Population of Robards is 263.
What is the Total Female Population of Robards?
Total Female Population of Robards is 287.
What is the Ratio of Males per 100 Females in Robards?
There are 91.64 Males per 100 Females in Robards.
What is the Ratio of Females per 100 Males in Robards?
There are 109.13 Females per 100 Males in Robards.
What is the Median Population Age in Robards?
Median Population Age in Robards is 49.0 Years.
What is the Average Family Size in Robards
Average Family Size in Robards is 2.8 People.
What is the Average Household Size in Robards
Average Household Size in Robards is 2.5 People.
How Large is the Labor Force in Robards?
There are 277 People in the Labor Forcein in Robards.
What is the Percentage of People in the Labor Force in Robards?
57.0% of People are in the Labor Force in Robards.
What is the Unemployment Rate in Robards?
Unemployment Rate in Robards is 6.9%.