Corbin, KY Map & Demographics
Corbin Map
Corbin Overview
$26,822
PER CAPITA INCOME
$68,578
AVG FAMILY INCOME
$52,929
AVG HOUSEHOLD INCOME
50.8%
WAGE / INCOME GAP [ % ]
49.2¢/ $1
WAGE / INCOME GAP [ $ ]
0.49
INEQUALITY / GINI INDEX
8,611
TOTAL POPULATION
4,117
MALE POPULATION
4,494
FEMALE POPULATION
91.61
MALES / 100 FEMALES
109.16
FEMALES / 100 MALES
39.1
MEDIAN AGE
3.4
AVG FAMILY SIZE
2.8
AVG HOUSEHOLD SIZE
3,257
LABOR FORCE [ PEOPLE ]
50.1%
PERCENT IN LABOR FORCE
4.6%
UNEMPLOYMENT RATE
Corbin Zip Codes
Corbin Area Codes
Income in Corbin
Income Overview in Corbin
Per Capita Income in Corbin is $26,822, while median incomes of families and households are $68,578 and $52,929 respectively.
| Characteristic | Number | Measure |
| Per Capita Income | 8,611 | $26,822 |
| Median Family Income | 2,005 | $68,578 |
| Mean Family Income | 2,005 | $91,304 |
| Median Household Income | 2,984 | $52,929 |
| Mean Household Income | 2,984 | $74,186 |
| Income Deficit | 2,005 | $0 |
| Wage / Income Gap (%) | 8,611 | 50.76% |
| Wage / Income Gap ($) | 8,611 | 49.24¢ per $1 |
| Gini / Inequality Index | 8,611 | 0.49 |
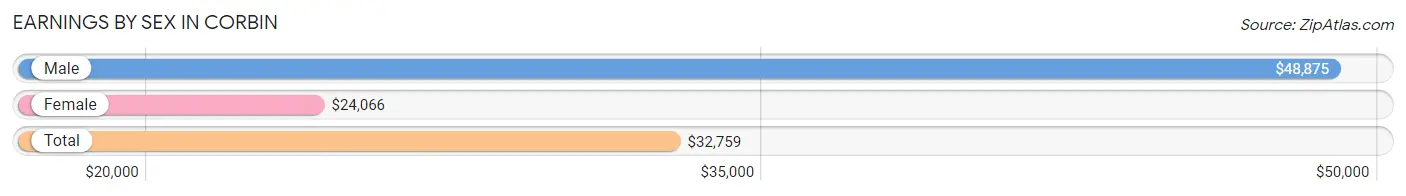
Earnings by Sex in Corbin
Average Earnings in Corbin are $32,759, $48,875 for men and $24,066 for women, a difference of 50.8%.
| Sex | Number | Average Earnings |
| Male | 1,777 (49.6%) | $48,875 |
| Female | 1,804 (50.4%) | $24,066 |
| Total | 3,581 (100.0%) | $32,759 |
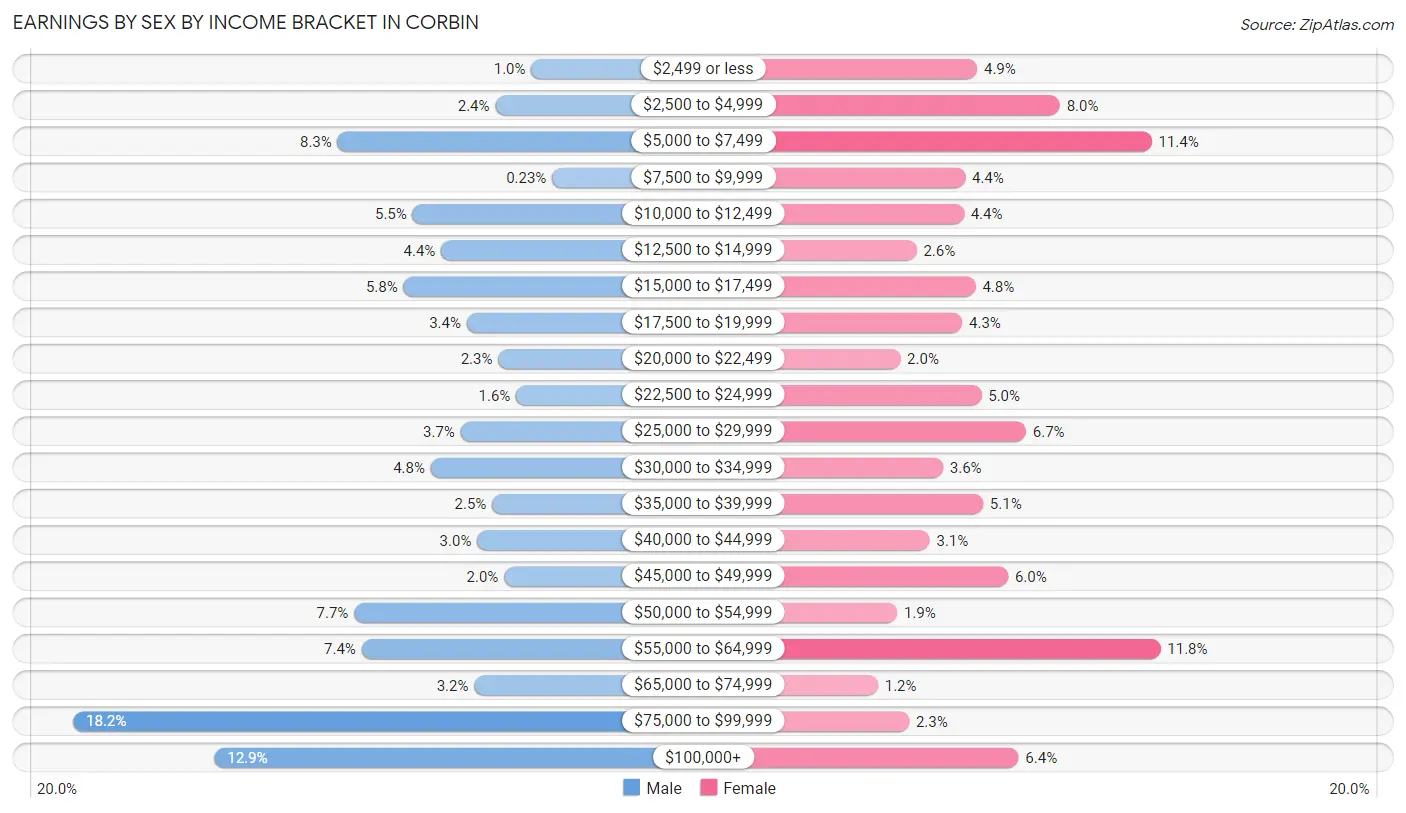
Earnings by Sex by Income Bracket in Corbin
The most common earnings brackets in Corbin are $75,000 to $99,999 for men (323 | 18.2%) and $55,000 to $64,999 for women (212 | 11.7%).
| Income | Male | Female |
| $2,499 or less | 18 (1.0%) | 88 (4.9%) |
| $2,500 to $4,999 | 42 (2.4%) | 144 (8.0%) |
| $5,000 to $7,499 | 147 (8.3%) | 206 (11.4%) |
| $7,500 to $9,999 | 4 (0.2%) | 80 (4.4%) |
| $10,000 to $12,499 | 97 (5.5%) | 79 (4.4%) |
| $12,500 to $14,999 | 78 (4.4%) | 47 (2.6%) |
| $15,000 to $17,499 | 103 (5.8%) | 87 (4.8%) |
| $17,500 to $19,999 | 61 (3.4%) | 78 (4.3%) |
| $20,000 to $22,499 | 40 (2.2%) | 36 (2.0%) |
| $22,500 to $24,999 | 28 (1.6%) | 91 (5.0%) |
| $25,000 to $29,999 | 65 (3.7%) | 121 (6.7%) |
| $30,000 to $34,999 | 85 (4.8%) | 65 (3.6%) |
| $35,000 to $39,999 | 44 (2.5%) | 92 (5.1%) |
| $40,000 to $44,999 | 54 (3.0%) | 56 (3.1%) |
| $45,000 to $49,999 | 36 (2.0%) | 109 (6.0%) |
| $50,000 to $54,999 | 136 (7.6%) | 34 (1.9%) |
| $55,000 to $64,999 | 131 (7.4%) | 212 (11.7%) |
| $65,000 to $74,999 | 56 (3.2%) | 21 (1.2%) |
| $75,000 to $99,999 | 323 (18.2%) | 42 (2.3%) |
| $100,000+ | 229 (12.9%) | 116 (6.4%) |
| Total | 1,777 (100.0%) | 1,804 (100.0%) |
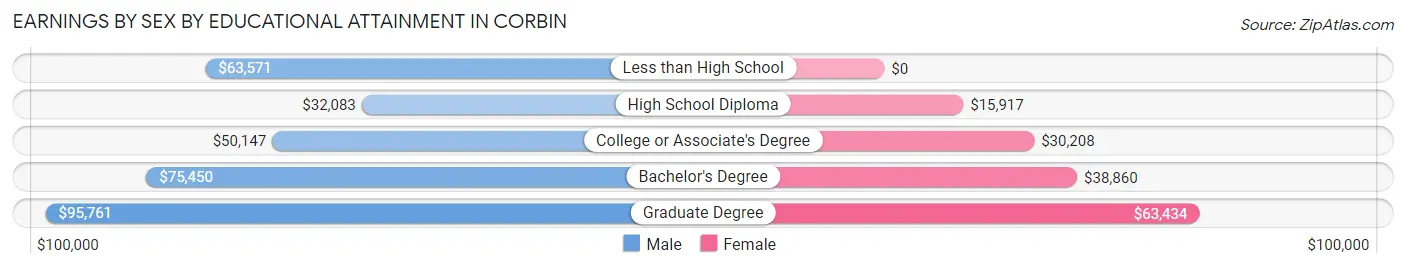
Earnings by Sex by Educational Attainment in Corbin
Average earnings in Corbin are $60,500 for men and $29,067 for women, a difference of 52.0%. Men with an educational attainment of graduate degree enjoy the highest average annual earnings of $95,761, while those with high school diploma education earn the least with $32,083. Women with an educational attainment of graduate degree earn the most with the average annual earnings of $63,434, while those with high school diploma education have the smallest earnings of $15,917.
| Educational Attainment | Male Income | Female Income |
| Less than High School | $63,571 | $0 |
| High School Diploma | $32,083 | $15,917 |
| College or Associate's Degree | $50,147 | $30,208 |
| Bachelor's Degree | $75,450 | $38,860 |
| Graduate Degree | $95,761 | $63,434 |
| Total | $60,500 | $29,067 |
Family Income in Corbin
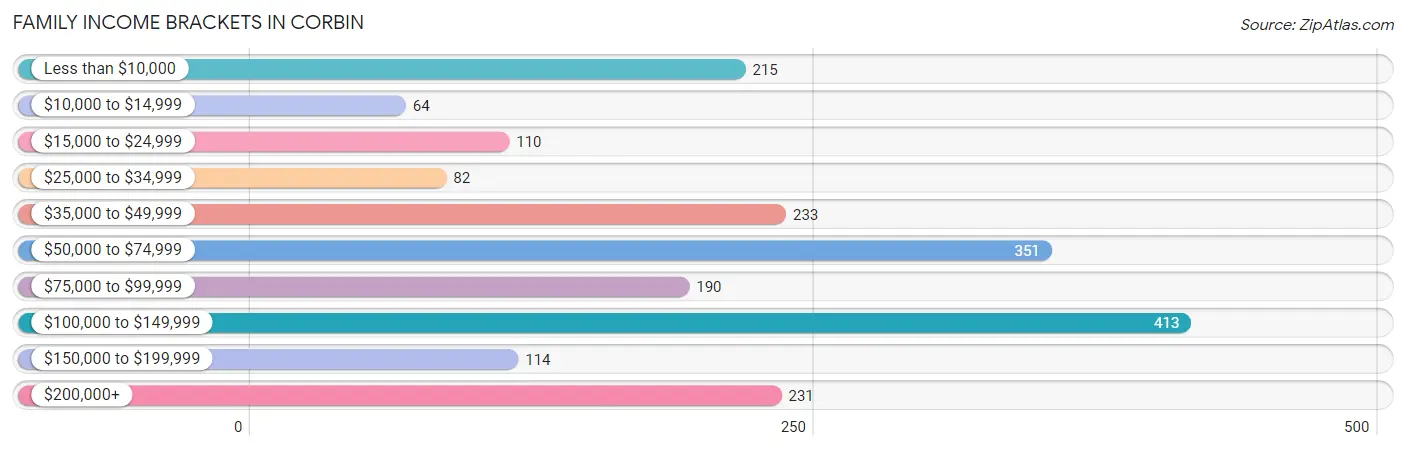
Family Income Brackets in Corbin
According to the Corbin family income data, there are 413 families falling into the $100,000 to $149,999 income range, which is the most common income bracket and makes up 20.6% of all families. Conversely, the $10,000 to $14,999 income bracket is the least frequent group with only 64 families (3.2%) belonging to this category.
| Income Bracket | # Families | % Families |
| Less than $10,000 | 215 | 10.7% |
| $10,000 to $14,999 | 64 | 3.2% |
| $15,000 to $24,999 | 110 | 5.5% |
| $25,000 to $34,999 | 82 | 4.1% |
| $35,000 to $49,999 | 233 | 11.6% |
| $50,000 to $74,999 | 351 | 17.5% |
| $75,000 to $99,999 | 190 | 9.5% |
| $100,000 to $149,999 | 413 | 20.6% |
| $150,000 to $199,999 | 114 | 5.7% |
| $200,000+ | 231 | 11.5% |
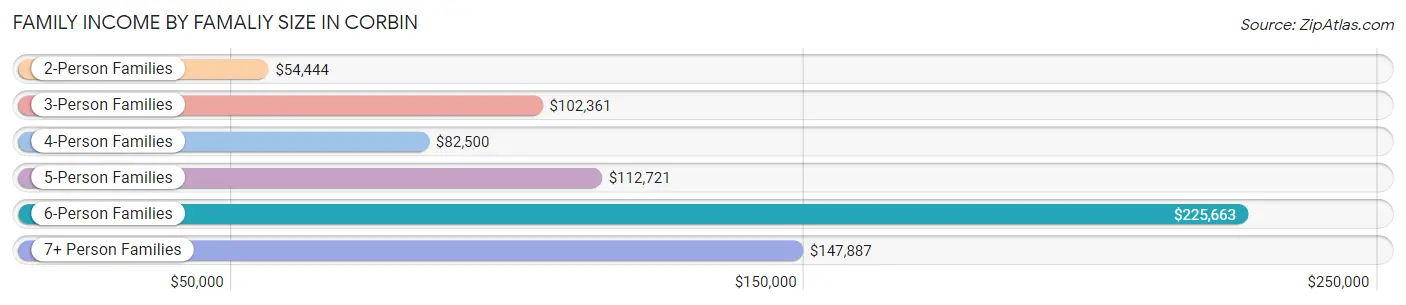
Family Income by Famaliy Size in Corbin
6-person families (72 | 3.6%) account for the highest median family income in Corbin with $225,663 per family, while 6-person families (72 | 3.6%) have the highest median income of $37,610 per family member.
| Income Bracket | # Families | Median Income |
| 2-Person Families | 920 (45.9%) | $54,444 |
| 3-Person Families | 433 (21.6%) | $102,361 |
| 4-Person Families | 376 (18.8%) | $82,500 |
| 5-Person Families | 62 (3.1%) | $112,721 |
| 6-Person Families | 72 (3.6%) | $225,663 |
| 7+ Person Families | 142 (7.1%) | $147,887 |
| Total | 2,005 (100.0%) | $68,578 |
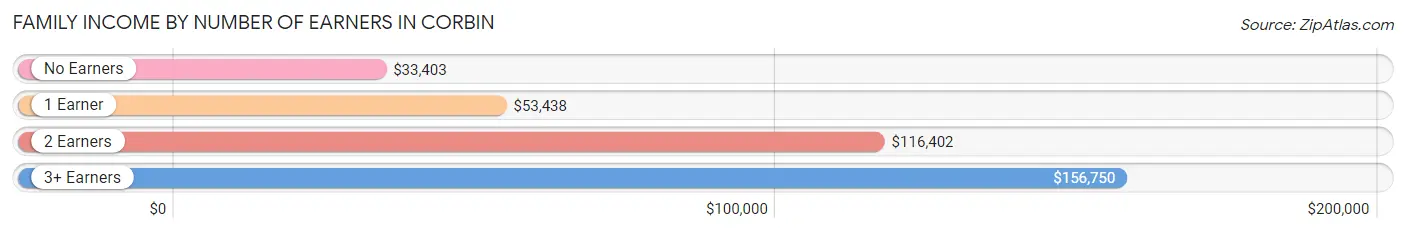
Family Income by Number of Earners in Corbin
The median family income in Corbin is $68,578, with families comprising 3+ earners (196) having the highest median family income of $156,750, while families with no earners (443) have the lowest median family income of $33,403, accounting for 9.8% and 22.1% of families, respectively.
| Number of Earners | # Families | Median Income |
| No Earners | 443 (22.1%) | $33,403 |
| 1 Earner | 732 (36.5%) | $53,438 |
| 2 Earners | 634 (31.6%) | $116,402 |
| 3+ Earners | 196 (9.8%) | $156,750 |
| Total | 2,005 (100.0%) | $68,578 |
Household Income in Corbin
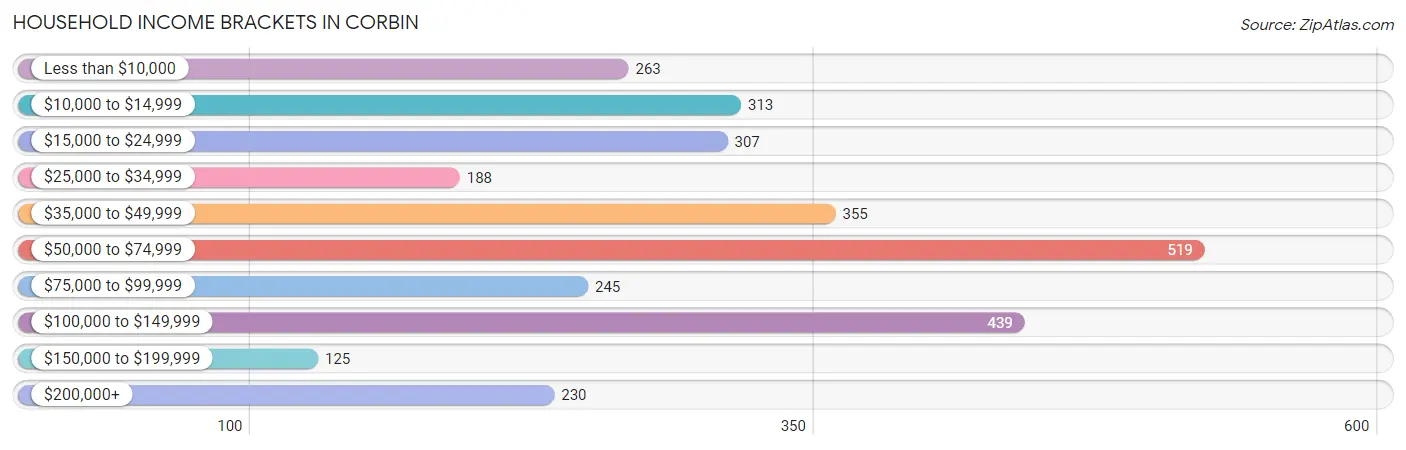
Household Income Brackets in Corbin
With 519 households falling in the category, the $50,000 to $74,999 income range is the most frequent in Corbin, accounting for 17.4% of all households. In contrast, only 125 households (4.2%) fall into the $150,000 to $199,999 income bracket, making it the least populous group.
| Income Bracket | # Households | % Households |
| Less than $10,000 | 263 | 8.8% |
| $10,000 to $14,999 | 313 | 10.5% |
| $15,000 to $24,999 | 307 | 10.3% |
| $25,000 to $34,999 | 188 | 6.3% |
| $35,000 to $49,999 | 355 | 11.9% |
| $50,000 to $74,999 | 519 | 17.4% |
| $75,000 to $99,999 | 245 | 8.2% |
| $100,000 to $149,999 | 439 | 14.7% |
| $150,000 to $199,999 | 125 | 4.2% |
| $200,000+ | 230 | 7.7% |
Household Income by Householder Age in Corbin
The median household income in Corbin is $52,929, with the highest median household income of $65,331 found in the 25 to 44 years age bracket for the primary householder. A total of 1,157 households (38.8%) fall into this category. Meanwhile, the 15 to 24 years age bracket for the primary householder has the lowest median household income of $0, with 160 households (5.4%) in this group.
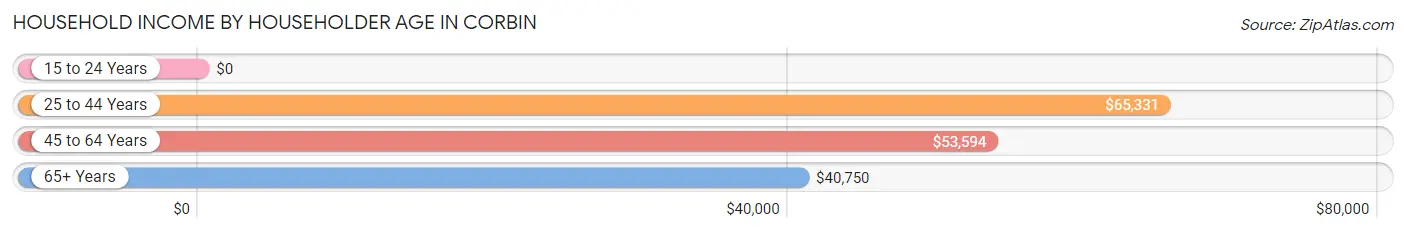
| Income Bracket | # Households | Median Income |
| 15 to 24 Years | 160 (5.4%) | $0 |
| 25 to 44 Years | 1,157 (38.8%) | $65,331 |
| 45 to 64 Years | 848 (28.4%) | $53,594 |
| 65+ Years | 819 (27.5%) | $40,750 |
| Total | 2,984 (100.0%) | $52,929 |
Poverty in Corbin
Income Below Poverty by Sex and Age in Corbin
With 18.5% poverty level for males and 23.2% for females among the residents of Corbin, 12 to 14 year old males and 15 year old females are the most vulnerable to poverty, with 53 males (40.5%) and 9 females (100.0%) in their respective age groups living below the poverty level.
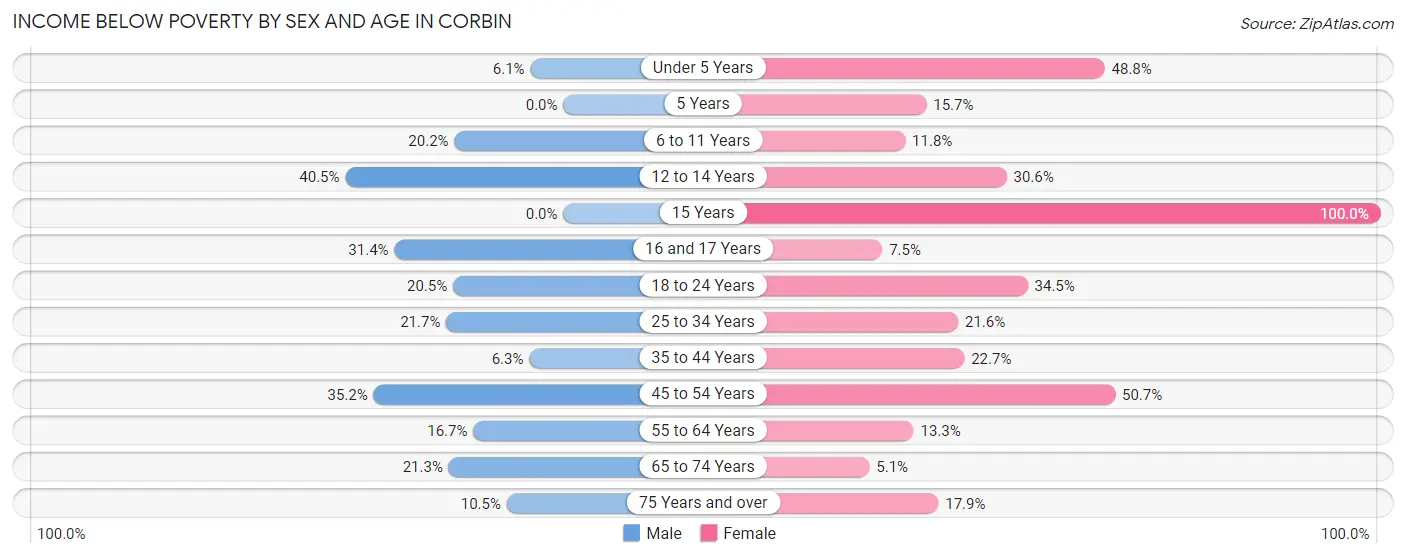
| Age Bracket | Male | Female |
| Under 5 Years | 24 (6.1%) | 120 (48.8%) |
| 5 Years | 0 (0.0%) | 8 (15.7%) |
| 6 to 11 Years | 75 (20.2%) | 54 (11.8%) |
| 12 to 14 Years | 53 (40.5%) | 74 (30.6%) |
| 15 Years | 0 (0.0%) | 9 (100.0%) |
| 16 and 17 Years | 37 (31.4%) | 6 (7.5%) |
| 18 to 24 Years | 104 (20.5%) | 99 (34.5%) |
| 25 to 34 Years | 70 (21.7%) | 101 (21.6%) |
| 35 to 44 Years | 34 (6.3%) | 143 (22.7%) |
| 45 to 54 Years | 199 (35.2%) | 211 (50.7%) |
| 55 to 64 Years | 51 (16.7%) | 67 (13.3%) |
| 65 to 74 Years | 77 (21.3%) | 24 (5.1%) |
| 75 Years and over | 25 (10.5%) | 72 (17.9%) |
| Total | 749 (18.5%) | 988 (23.2%) |
Income Above Poverty by Sex and Age in Corbin
According to the poverty statistics in Corbin, males aged 5 years and females aged 65 to 74 years are the age groups that are most secure financially, with 100.0% of males and 94.9% of females in these age groups living above the poverty line.
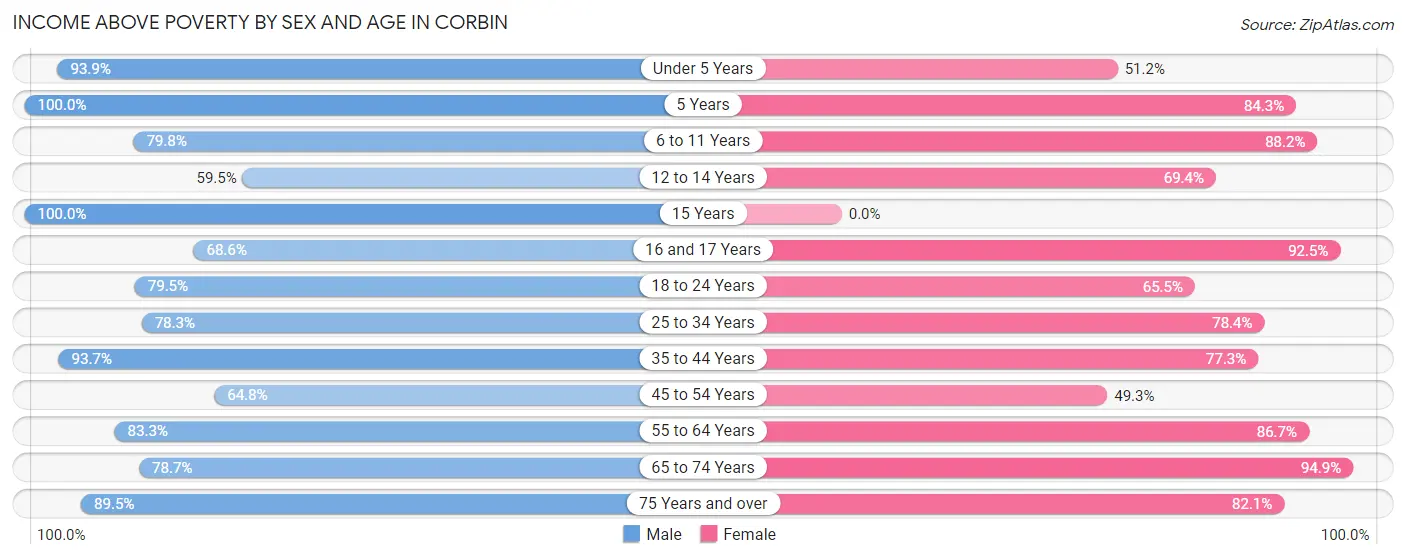
| Age Bracket | Male | Female |
| Under 5 Years | 369 (93.9%) | 126 (51.2%) |
| 5 Years | 176 (100.0%) | 43 (84.3%) |
| 6 to 11 Years | 296 (79.8%) | 405 (88.2%) |
| 12 to 14 Years | 78 (59.5%) | 168 (69.4%) |
| 15 Years | 23 (100.0%) | 0 (0.0%) |
| 16 and 17 Years | 81 (68.6%) | 74 (92.5%) |
| 18 to 24 Years | 404 (79.5%) | 188 (65.5%) |
| 25 to 34 Years | 252 (78.3%) | 367 (78.4%) |
| 35 to 44 Years | 504 (93.7%) | 486 (77.3%) |
| 45 to 54 Years | 366 (64.8%) | 205 (49.3%) |
| 55 to 64 Years | 254 (83.3%) | 436 (86.7%) |
| 65 to 74 Years | 285 (78.7%) | 446 (94.9%) |
| 75 Years and over | 213 (89.5%) | 330 (82.1%) |
| Total | 3,301 (81.5%) | 3,274 (76.8%) |
Income Below Poverty Among Married-Couple Families in Corbin
The poverty statistics for married-couple families in Corbin show that 4.9% or 71 of the total 1,460 families live below the poverty line. Families with 3 or 4 children have the highest poverty rate of 28.1%, comprising of 23 families. On the other hand, families with 5 or more children have the lowest poverty rate of 0.0%, which includes 0 families.
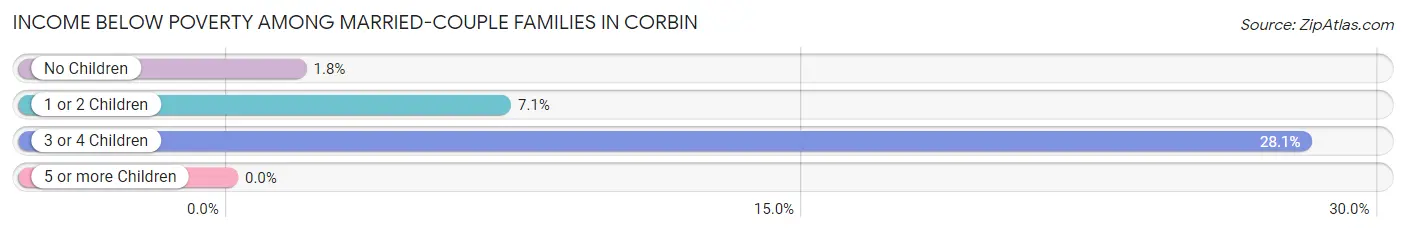
| Children | Above Poverty | Below Poverty |
| No Children | 767 (98.2%) | 14 (1.8%) |
| 1 or 2 Children | 443 (92.9%) | 34 (7.1%) |
| 3 or 4 Children | 59 (72.0%) | 23 (28.1%) |
| 5 or more Children | 120 (100.0%) | 0 (0.0%) |
| Total | 1,389 (95.1%) | 71 (4.9%) |
Income Below Poverty Among Single-Parent Households in Corbin
According to the poverty data in Corbin, 26.7% or 31 single-father households and 55.0% or 236 single-mother households are living below the poverty line. Among single-father households, those with 1 or 2 children have the highest poverty rate, with 22 households (34.9%) experiencing poverty. Likewise, among single-mother households, those with 5 or more children have the highest poverty rate, with 8 households (100.0%) falling below the poverty line.
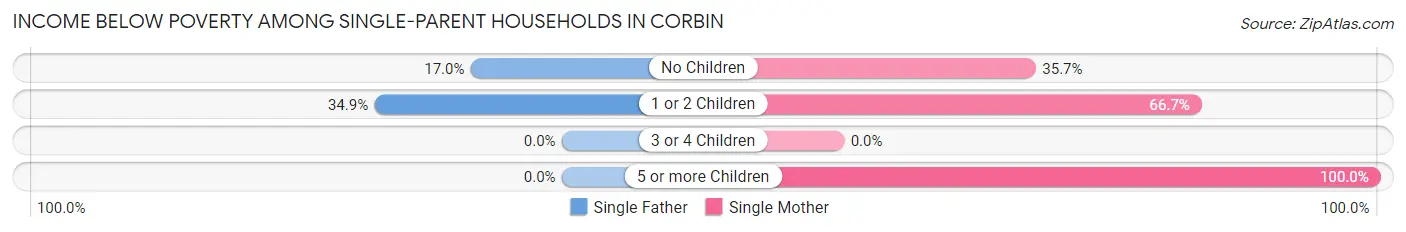
| Children | Single Father | Single Mother |
| No Children | 9 (17.0%) | 40 (35.7%) |
| 1 or 2 Children | 22 (34.9%) | 188 (66.7%) |
| 3 or 4 Children | 0 (0.0%) | 0 (0.0%) |
| 5 or more Children | 0 (0.0%) | 8 (100.0%) |
| Total | 31 (26.7%) | 236 (55.0%) |
Income Below Poverty Among Married-Couple vs Single-Parent Households in Corbin
The poverty data for Corbin shows that 71 of the married-couple family households (4.9%) and 267 of the single-parent households (49.0%) are living below the poverty level. Within the married-couple family households, those with 3 or 4 children have the highest poverty rate, with 23 households (28.1%) falling below the poverty line. Among the single-parent households, those with 5 or more children have the highest poverty rate, with 8 household (100.0%) living below poverty.
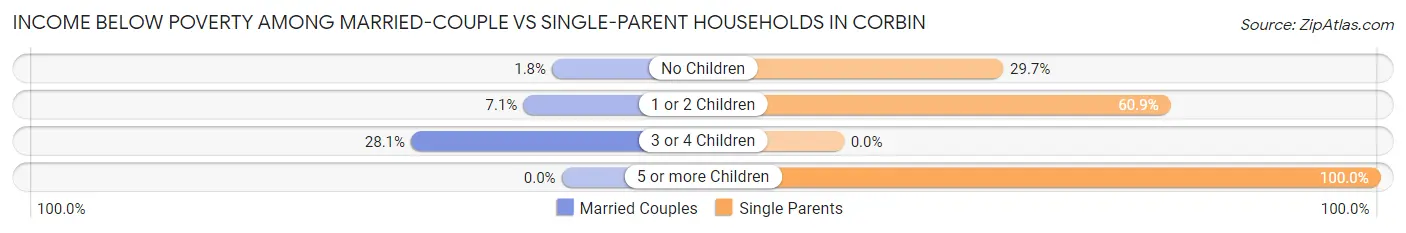
| Children | Married-Couple Families | Single-Parent Households |
| No Children | 14 (1.8%) | 49 (29.7%) |
| 1 or 2 Children | 34 (7.1%) | 210 (60.9%) |
| 3 or 4 Children | 23 (28.1%) | 0 (0.0%) |
| 5 or more Children | 0 (0.0%) | 8 (100.0%) |
| Total | 71 (4.9%) | 267 (49.0%) |
Race in Corbin
The most populous races in Corbin are White / Caucasian (8,061 | 93.6%), Two or more Races (395 | 4.6%), and Hispanic or Latino (189 | 2.2%).
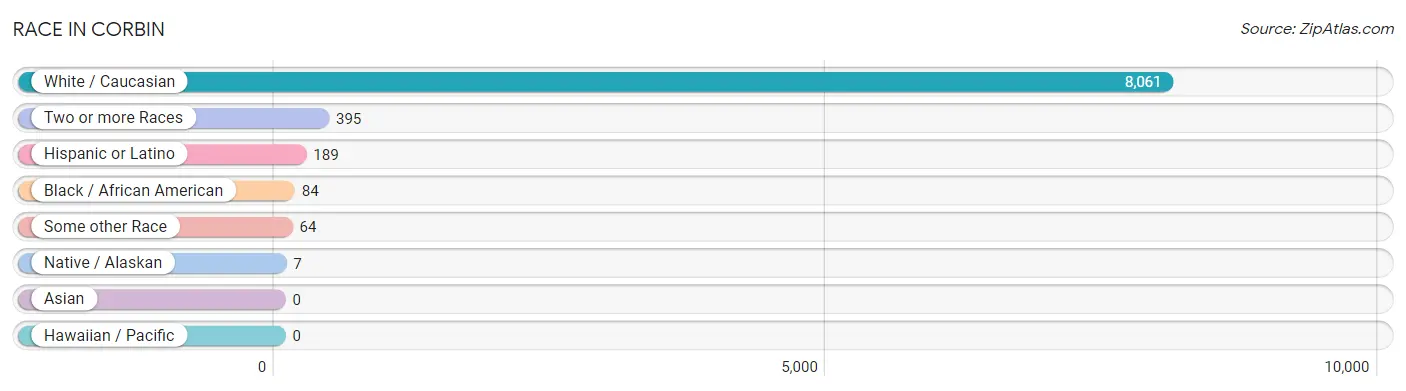
| Race | # Population | % Population |
| Asian | 0 | 0.0% |
| Black / African American | 84 | 1.0% |
| Hawaiian / Pacific | 0 | 0.0% |
| Hispanic or Latino | 189 | 2.2% |
| Native / Alaskan | 7 | 0.1% |
| White / Caucasian | 8,061 | 93.6% |
| Two or more Races | 395 | 4.6% |
| Some other Race | 64 | 0.7% |
| Total | 8,611 | 100.0% |
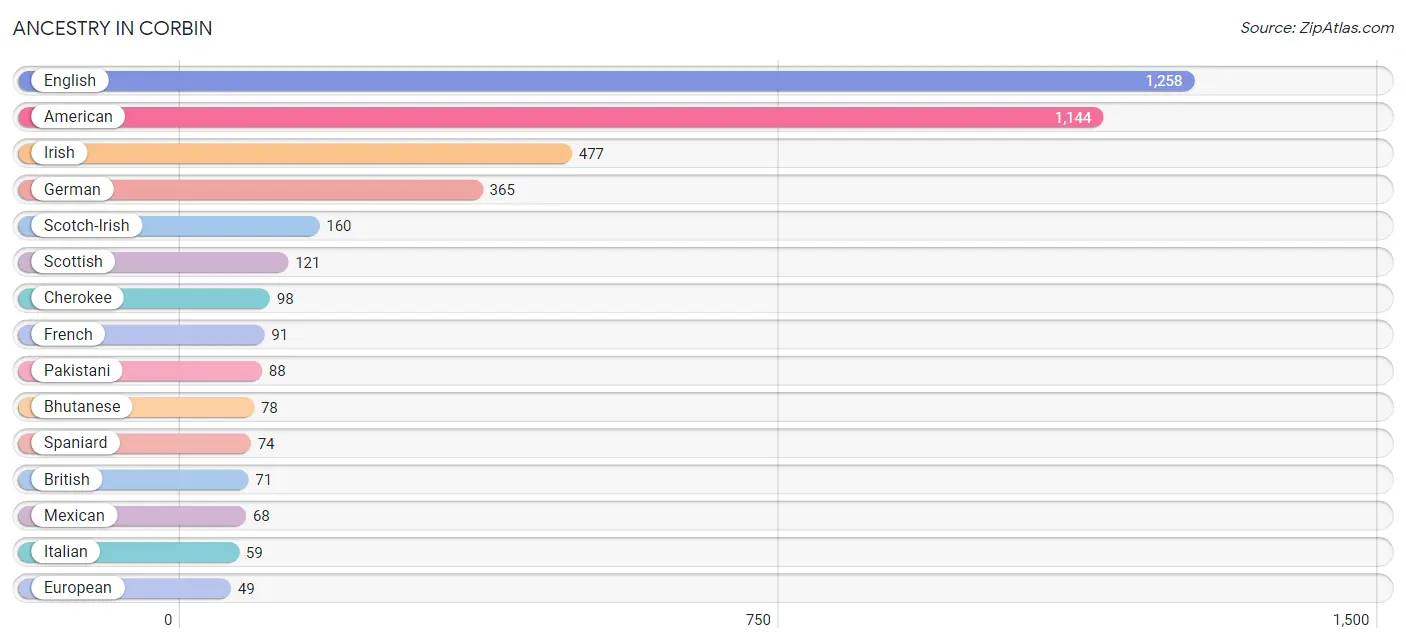
Ancestry in Corbin
The most populous ancestries reported in Corbin are English (1,258 | 14.6%), American (1,144 | 13.3%), Irish (477 | 5.5%), German (365 | 4.2%), and Scotch-Irish (160 | 1.9%), together accounting for 39.5% of all Corbin residents.
| Ancestry | # Population | % Population |
| African | 11 | 0.1% |
| American | 1,144 | 13.3% |
| Arab | 9 | 0.1% |
| Bhutanese | 78 | 0.9% |
| British | 71 | 0.8% |
| Central American | 24 | 0.3% |
| Cherokee | 98 | 1.1% |
| Chippewa | 9 | 0.1% |
| Czechoslovakian | 22 | 0.3% |
| Dutch | 21 | 0.2% |
| Eastern European | 13 | 0.2% |
| English | 1,258 | 14.6% |
| European | 49 | 0.6% |
| French | 91 | 1.1% |
| German | 365 | 4.2% |
| Guatemalan | 9 | 0.1% |
| Honduran | 15 | 0.2% |
| Hungarian | 18 | 0.2% |
| Irish | 477 | 5.5% |
| Italian | 59 | 0.7% |
| Lebanese | 9 | 0.1% |
| Mexican | 68 | 0.8% |
| Norwegian | 39 | 0.4% |
| Pakistani | 88 | 1.0% |
| Puerto Rican | 7 | 0.1% |
| Scotch-Irish | 160 | 1.9% |
| Scottish | 121 | 1.4% |
| Slovak | 18 | 0.2% |
| Spaniard | 74 | 0.9% |
| Spanish | 16 | 0.2% |
| Subsaharan African | 11 | 0.1% |
| Swedish | 43 | 0.5% |
| Swiss | 18 | 0.2% |
| Welsh | 24 | 0.3% | View All 34 Rows |
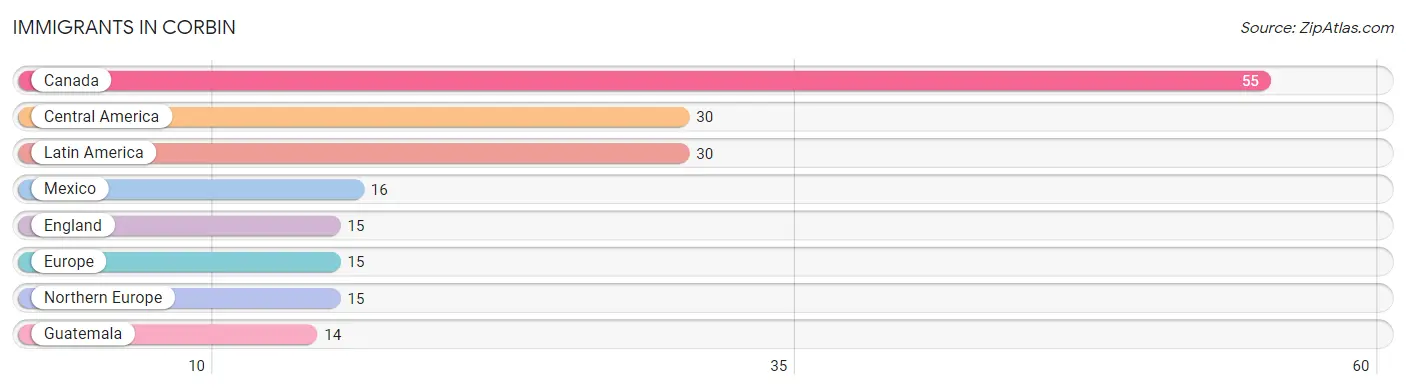
Immigrants in Corbin
The most numerous immigrant groups reported in Corbin came from Canada (55 | 0.6%), Central America (30 | 0.4%), Latin America (30 | 0.4%), Mexico (16 | 0.2%), and England (15 | 0.2%), together accounting for 1.7% of all Corbin residents.
| Immigration Origin | # Population | % Population |
| Canada | 55 | 0.6% |
| Central America | 30 | 0.4% |
| England | 15 | 0.2% |
| Europe | 15 | 0.2% |
| Guatemala | 14 | 0.2% |
| Latin America | 30 | 0.4% |
| Mexico | 16 | 0.2% |
| Northern Europe | 15 | 0.2% | View All 8 Rows |
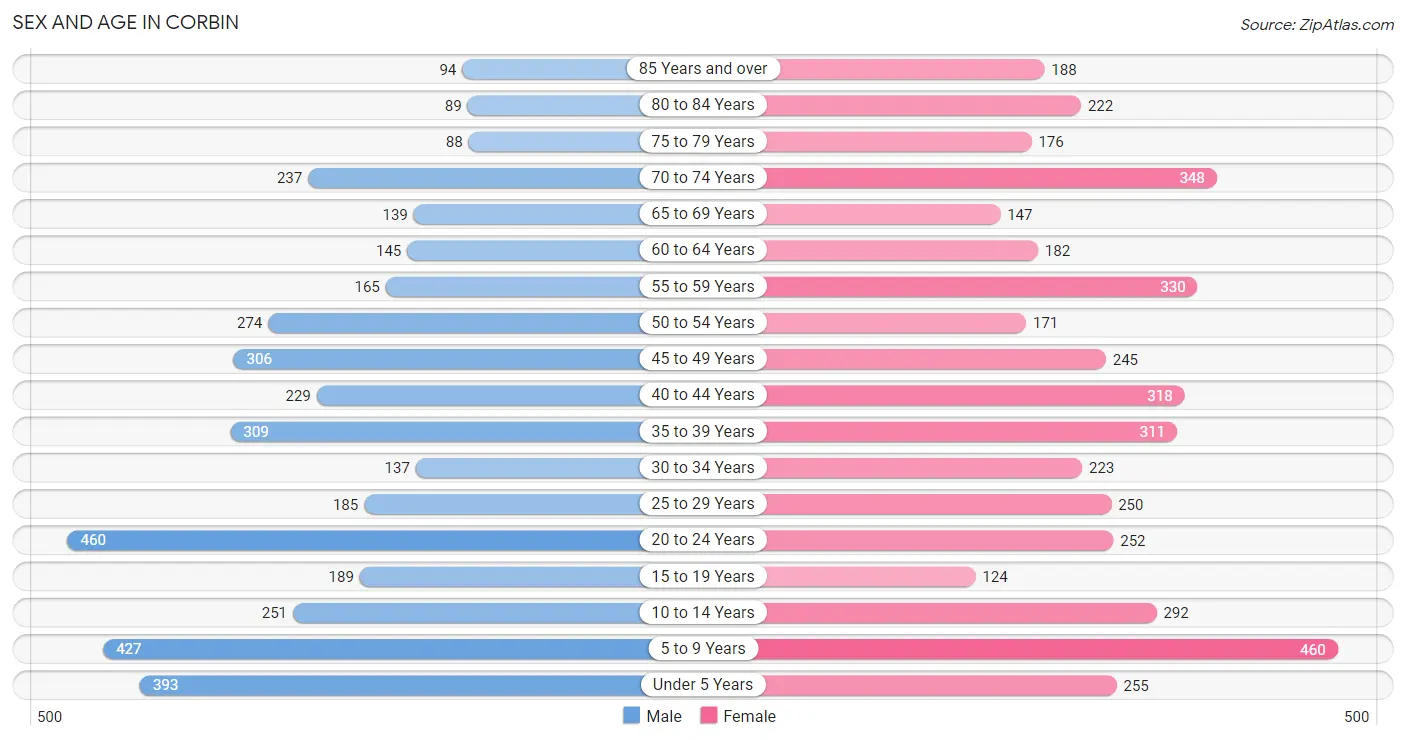
Sex and Age in Corbin
Sex and Age in Corbin
The most populous age groups in Corbin are 20 to 24 Years (460 | 11.2%) for men and 5 to 9 Years (460 | 10.2%) for women.
| Age Bracket | Male | Female |
| Under 5 Years | 393 (9.6%) | 255 (5.7%) |
| 5 to 9 Years | 427 (10.4%) | 460 (10.2%) |
| 10 to 14 Years | 251 (6.1%) | 292 (6.5%) |
| 15 to 19 Years | 189 (4.6%) | 124 (2.8%) |
| 20 to 24 Years | 460 (11.2%) | 252 (5.6%) |
| 25 to 29 Years | 185 (4.5%) | 250 (5.6%) |
| 30 to 34 Years | 137 (3.3%) | 223 (5.0%) |
| 35 to 39 Years | 309 (7.5%) | 311 (6.9%) |
| 40 to 44 Years | 229 (5.6%) | 318 (7.1%) |
| 45 to 49 Years | 306 (7.4%) | 245 (5.4%) |
| 50 to 54 Years | 274 (6.7%) | 171 (3.8%) |
| 55 to 59 Years | 165 (4.0%) | 330 (7.3%) |
| 60 to 64 Years | 145 (3.5%) | 182 (4.1%) |
| 65 to 69 Years | 139 (3.4%) | 147 (3.3%) |
| 70 to 74 Years | 237 (5.8%) | 348 (7.7%) |
| 75 to 79 Years | 88 (2.1%) | 176 (3.9%) |
| 80 to 84 Years | 89 (2.2%) | 222 (4.9%) |
| 85 Years and over | 94 (2.3%) | 188 (4.2%) |
| Total | 4,117 (100.0%) | 4,494 (100.0%) |
Families and Households in Corbin
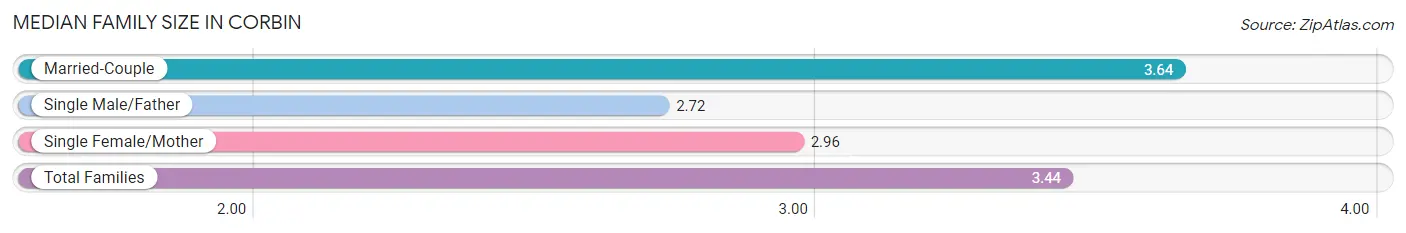
Median Family Size in Corbin
The median family size in Corbin is 3.44 persons per family, with married-couple families (1,460 | 72.8%) accounting for the largest median family size of 3.64 persons per family. On the other hand, single male/father families (116 | 5.8%) represent the smallest median family size with 2.72 persons per family.
| Family Type | # Families | Family Size |
| Married-Couple | 1,460 (72.8%) | 3.64 |
| Single Male/Father | 116 (5.8%) | 2.72 |
| Single Female/Mother | 429 (21.4%) | 2.96 |
| Total Families | 2,005 (100.0%) | 3.44 |
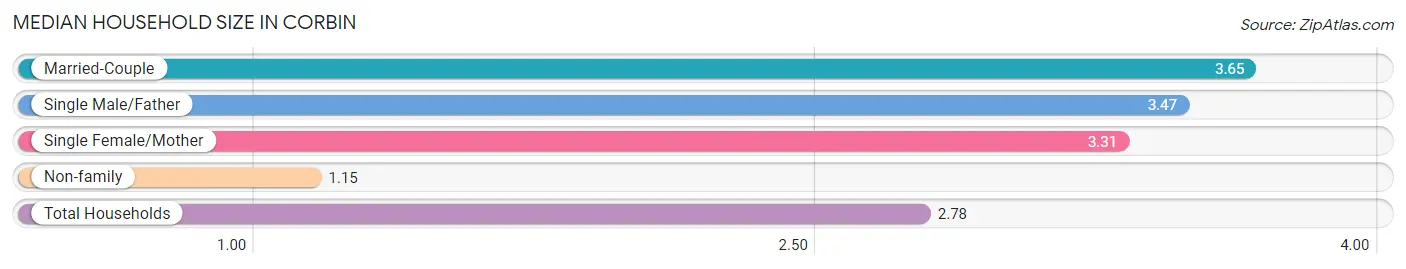
Median Household Size in Corbin
The median household size in Corbin is 2.78 persons per household, with married-couple households (1,460 | 48.9%) accounting for the largest median household size of 3.65 persons per household. non-family households (979 | 32.8%) represent the smallest median household size with 1.15 persons per household.
| Household Type | # Households | Household Size |
| Married-Couple | 1,460 (48.9%) | 3.65 |
| Single Male/Father | 116 (3.9%) | 3.47 |
| Single Female/Mother | 429 (14.4%) | 3.31 |
| Non-family | 979 (32.8%) | 1.15 |
| Total Households | 2,984 (100.0%) | 2.78 |
Household Size by Marriage Status in Corbin
Out of a total of 2,984 households in Corbin, 2,005 (67.2%) are family households, while 979 (32.8%) are nonfamily households. The most numerous type of family households are 2-person households, comprising 750, and the most common type of nonfamily households are 1-person households, comprising 828.
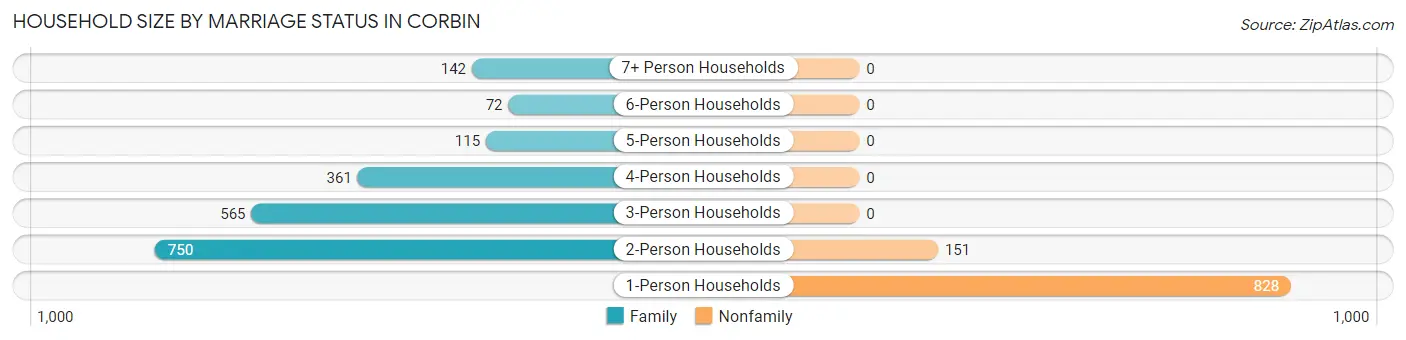
| Household Size | Family Households | Nonfamily Households |
| 1-Person Households | - | 828 (27.8%) |
| 2-Person Households | 750 (25.1%) | 151 (5.1%) |
| 3-Person Households | 565 (18.9%) | 0 (0.0%) |
| 4-Person Households | 361 (12.1%) | 0 (0.0%) |
| 5-Person Households | 115 (3.8%) | 0 (0.0%) |
| 6-Person Households | 72 (2.4%) | 0 (0.0%) |
| 7+ Person Households | 142 (4.8%) | 0 (0.0%) |
| Total | 2,005 (67.2%) | 979 (32.8%) |
Female Fertility in Corbin
Fertility by Age in Corbin
Average fertility rate in Corbin is 77.0 births per 1,000 women. Women in the age bracket of 20 to 34 years have the highest fertility rate with 164.0 births per 1,000 women. Women in the age bracket of 20 to 34 years acount for 86.9% of all women with births.
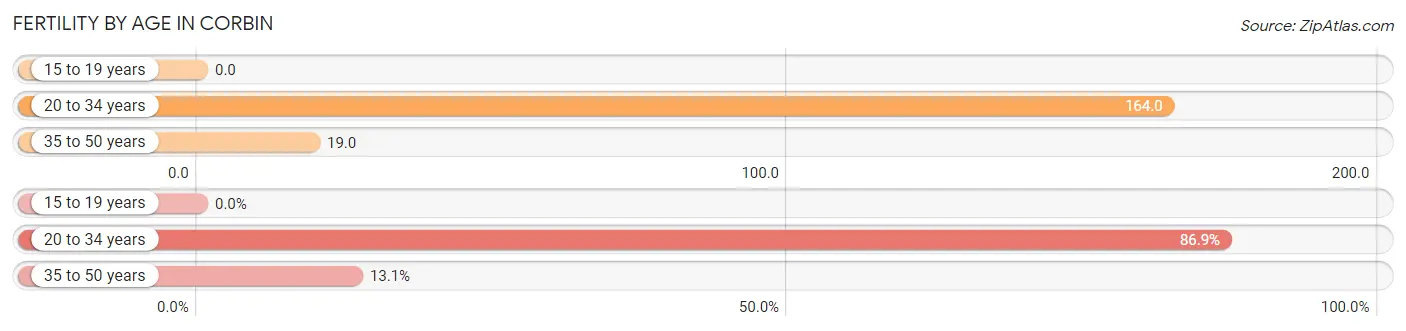
| Age Bracket | Women with Births | Births / 1,000 Women |
| 15 to 19 years | 0 (0.0%) | 0.0 |
| 20 to 34 years | 119 (86.9%) | 164.0 |
| 35 to 50 years | 18 (13.1%) | 19.0 |
| Total | 137 (100.0%) | 77.0 |
Fertility by Age by Marriage Status in Corbin
77.4% of women with births (137) in Corbin are married. The highest percentage of unmarried women with births falls into 20 to 34 years age bracket with 26.1% of them unmarried at the time of birth, while the lowest percentage of unmarried women with births belong to 35 to 50 years age bracket with 0.0% of them unmarried.
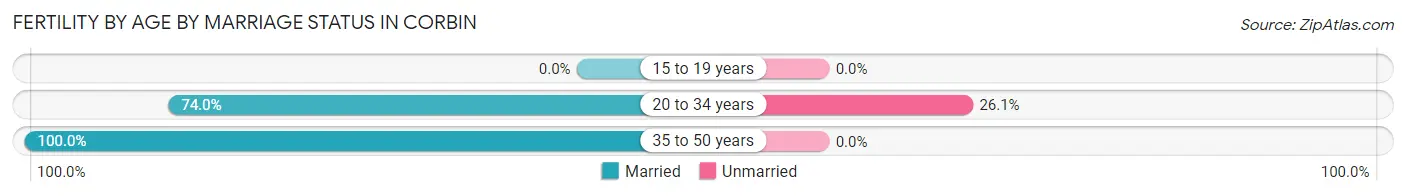
| Age Bracket | Married | Unmarried |
| 15 to 19 years | 0 (0.0%) | 0 (0.0%) |
| 20 to 34 years | 88 (74.0%) | 31 (26.1%) |
| 35 to 50 years | 18 (100.0%) | 0 (0.0%) |
| Total | 106 (77.4%) | 31 (22.6%) |
Fertility by Education in Corbin
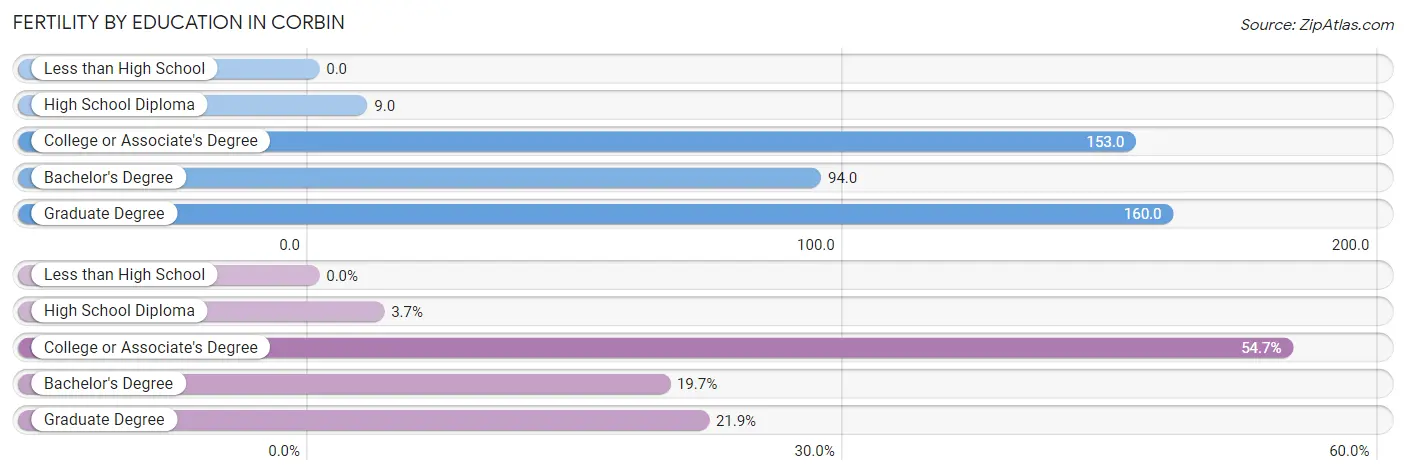
| Educational Attainment | Women with Births | Births / 1,000 Women |
| Less than High School | 0 (0.0%) | 0.0 |
| High School Diploma | 5 (3.6%) | 9.0 |
| College or Associate's Degree | 75 (54.7%) | 153.0 |
| Bachelor's Degree | 27 (19.7%) | 94.0 |
| Graduate Degree | 30 (21.9%) | 160.0 |
| Total | 137 (100.0%) | 77.0 |
Fertility by Education by Marriage Status in Corbin
22.6% of women with births in Corbin are unmarried. Women with the educational attainment of high school diploma are most likely to be married with 100.0% of them married at childbirth, while women with the educational attainment of college or associate's degree are least likely to be married with 41.3% of them unmarried at childbirth.
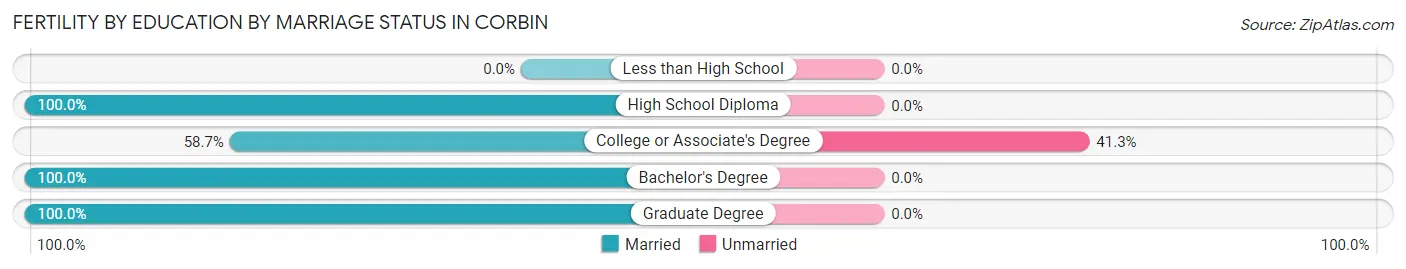
| Educational Attainment | Married | Unmarried |
| Less than High School | 0 (0.0%) | 0 (0.0%) |
| High School Diploma | 5 (100.0%) | 0 (0.0%) |
| College or Associate's Degree | 44 (58.7%) | 31 (41.3%) |
| Bachelor's Degree | 27 (100.0%) | 0 (0.0%) |
| Graduate Degree | 30 (100.0%) | 0 (0.0%) |
| Total | 106 (77.4%) | 31 (22.6%) |
Employment Characteristics in Corbin
Employment by Class of Employer in Corbin
Among the 3,068 employed individuals in Corbin, private company employees (1,687 | 55.0%), not-for-profit organizations (472 | 15.4%), and federal government employees (296 | 9.7%) make up the most common classes of employment.
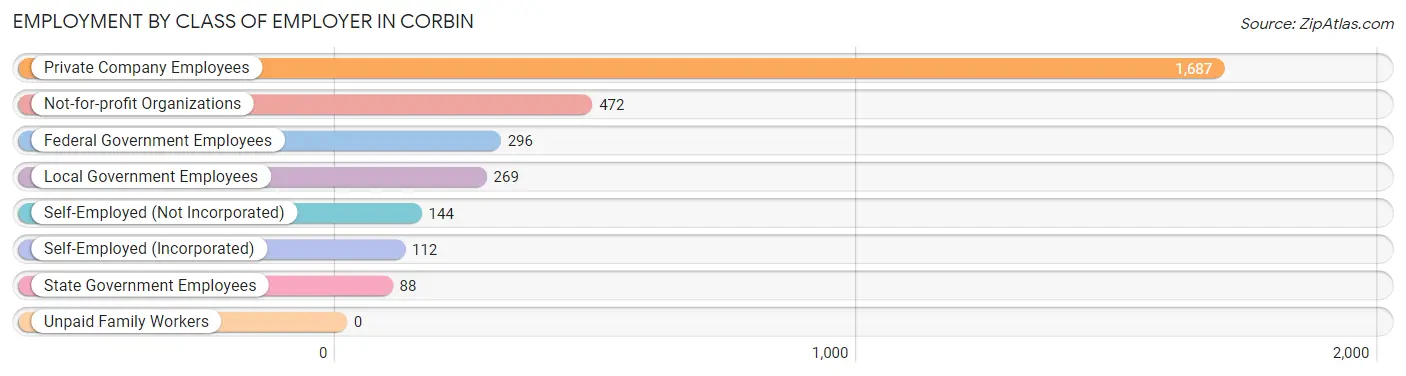
| Employer Class | # Employees | % Employees |
| Private Company Employees | 1,687 | 55.0% |
| Self-Employed (Incorporated) | 112 | 3.6% |
| Self-Employed (Not Incorporated) | 144 | 4.7% |
| Not-for-profit Organizations | 472 | 15.4% |
| Local Government Employees | 269 | 8.8% |
| State Government Employees | 88 | 2.9% |
| Federal Government Employees | 296 | 9.7% |
| Unpaid Family Workers | 0 | 0.0% |
| Total | 3,068 | 100.0% |
Employment Status by Age in Corbin
According to the labor force statistics for Corbin, out of the total population over 16 years of age (6,501), 50.1% or 3,257 individuals are in the labor force, with 4.6% or 150 of them unemployed. The age group with the highest labor force participation rate is 20 to 24 years, with 82.7% or 589 individuals in the labor force. Within the labor force, the 30 to 34 years age range has the highest percentage of unemployed individuals, with 18.3% or 47 of them being unemployed.
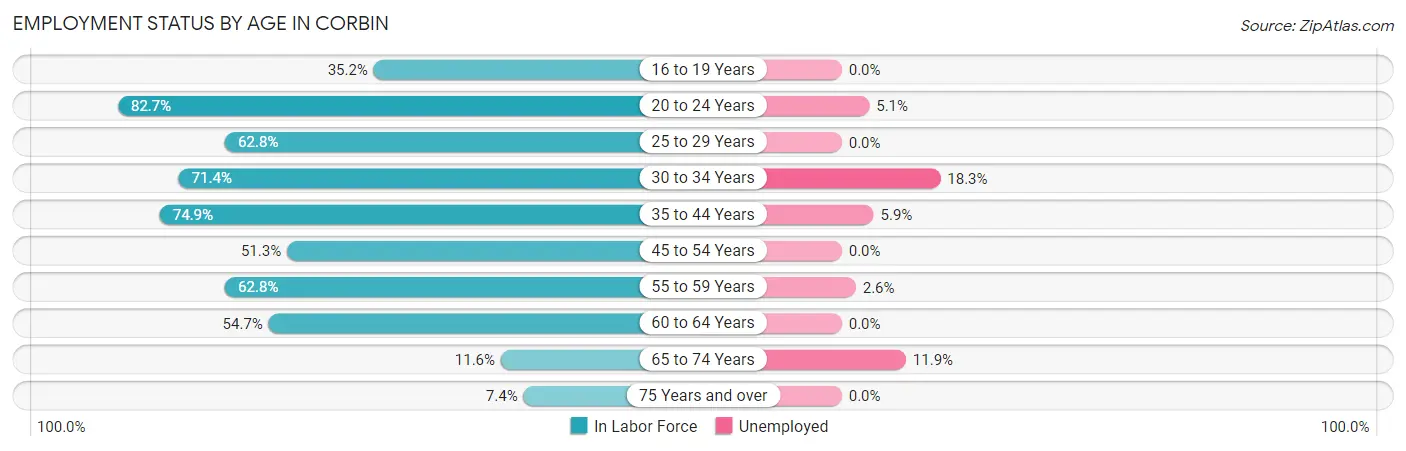
| Age Bracket | In Labor Force | Unemployed |
| 16 to 19 Years | 99 (35.2%) | 0 (0.0%) |
| 20 to 24 Years | 589 (82.7%) | 30 (5.1%) |
| 25 to 29 Years | 273 (62.8%) | 0 (0.0%) |
| 30 to 34 Years | 257 (71.4%) | 47 (18.3%) |
| 35 to 44 Years | 874 (74.9%) | 52 (5.9%) |
| 45 to 54 Years | 511 (51.3%) | 0 (0.0%) |
| 55 to 59 Years | 311 (62.8%) | 8 (2.6%) |
| 60 to 64 Years | 179 (54.7%) | 0 (0.0%) |
| 65 to 74 Years | 101 (11.6%) | 12 (11.9%) |
| 75 Years and over | 63 (7.4%) | 0 (0.0%) |
| Total | 3,257 (50.1%) | 150 (4.6%) |
Employment Status by Educational Attainment in Corbin
According to labor force statistics for Corbin, 63.6% of individuals (2,404) out of the total population between 25 and 64 years of age (3,780) are in the labor force, with 4.4% or 106 of them being unemployed. The group with the highest labor force participation rate are those with the educational attainment of bachelor's degree or higher, with 86.7% or 977 individuals in the labor force. Within the labor force, individuals with less than high school education have the highest percentage of unemployment, with 20.8% or 21 of them being unemployed.
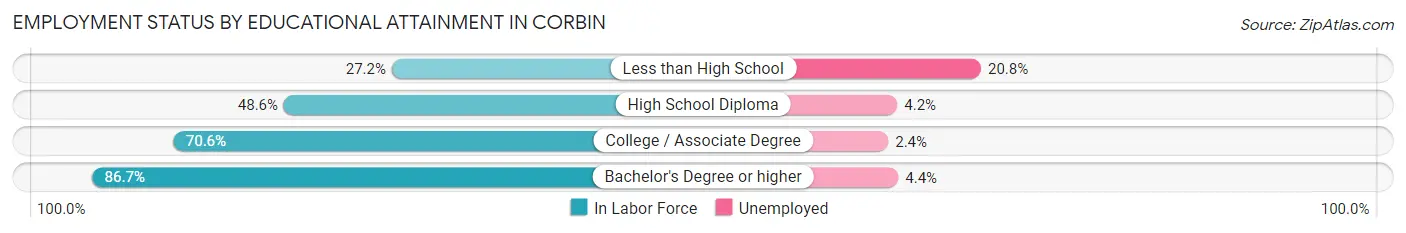
| Educational Attainment | In Labor Force | Unemployed |
| Less than High School | 101 (27.2%) | 77 (20.8%) |
| High School Diploma | 625 (48.6%) | 54 (4.2%) |
| College / Associate Degree | 702 (70.6%) | 24 (2.4%) |
| Bachelor's Degree or higher | 977 (86.7%) | 50 (4.4%) |
| Total | 2,404 (63.6%) | 166 (4.4%) |
Employment Occupations by Sex in Corbin
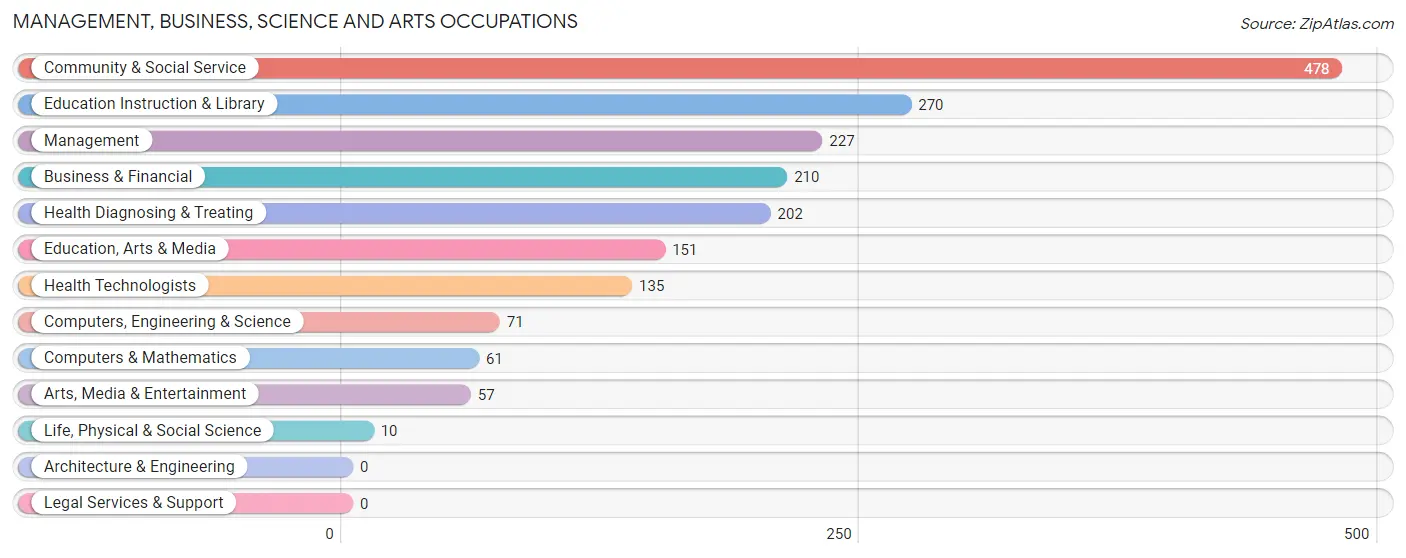
Management, Business, Science and Arts Occupations
The most common Management, Business, Science and Arts occupations in Corbin are Community & Social Service (478 | 15.4%), Education Instruction & Library (270 | 8.7%), Management (227 | 7.3%), Business & Financial (210 | 6.8%), and Health Diagnosing & Treating (202 | 6.5%).
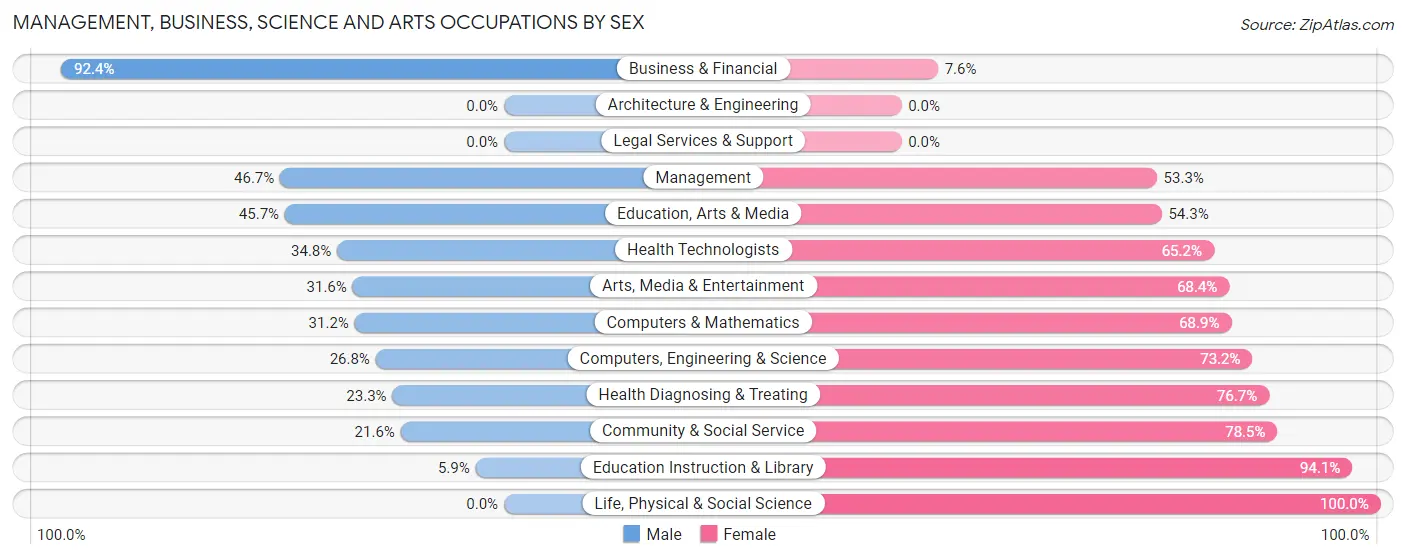
Management, Business, Science and Arts Occupations by Sex
Within the Management, Business, Science and Arts occupations in Corbin, the most male-oriented occupations are Business & Financial (92.4%), Management (46.7%), and Education, Arts & Media (45.7%), while the most female-oriented occupations are Life, Physical & Social Science (100.0%), Education Instruction & Library (94.1%), and Community & Social Service (78.4%).
| Occupation | Male | Female |
| Management | 106 (46.7%) | 121 (53.3%) |
| Business & Financial | 194 (92.4%) | 16 (7.6%) |
| Computers, Engineering & Science | 19 (26.8%) | 52 (73.2%) |
| Computers & Mathematics | 19 (31.1%) | 42 (68.9%) |
| Architecture & Engineering | 0 (0.0%) | 0 (0.0%) |
| Life, Physical & Social Science | 0 (0.0%) | 10 (100.0%) |
| Community & Social Service | 103 (21.5%) | 375 (78.4%) |
| Education, Arts & Media | 69 (45.7%) | 82 (54.3%) |
| Legal Services & Support | 0 (0.0%) | 0 (0.0%) |
| Education Instruction & Library | 16 (5.9%) | 254 (94.1%) |
| Arts, Media & Entertainment | 18 (31.6%) | 39 (68.4%) |
| Health Diagnosing & Treating | 47 (23.3%) | 155 (76.7%) |
| Health Technologists | 47 (34.8%) | 88 (65.2%) |
| Total (Category) | 469 (39.5%) | 719 (60.5%) |
| Total (Overall) | 1,701 (54.7%) | 1,407 (45.3%) |
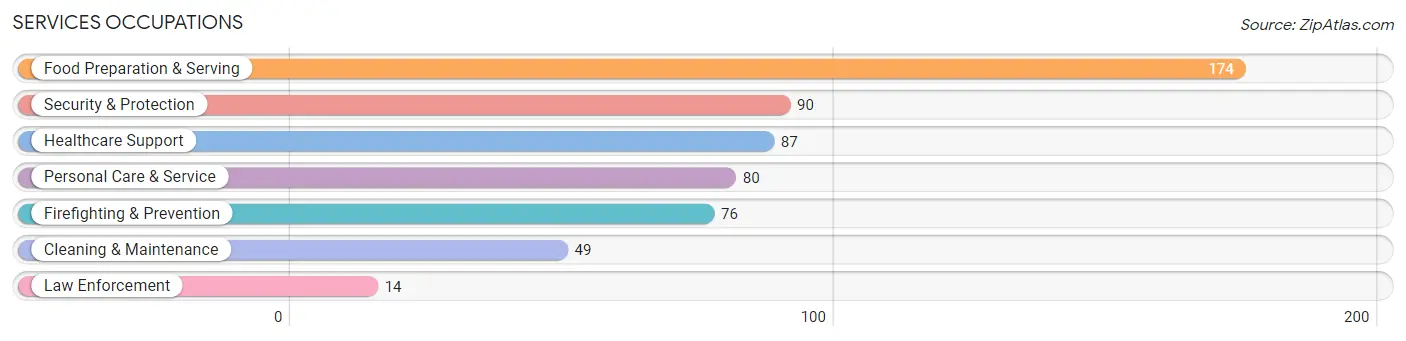
Services Occupations
The most common Services occupations in Corbin are Food Preparation & Serving (174 | 5.6%), Security & Protection (90 | 2.9%), Healthcare Support (87 | 2.8%), Personal Care & Service (80 | 2.6%), and Firefighting & Prevention (76 | 2.5%).
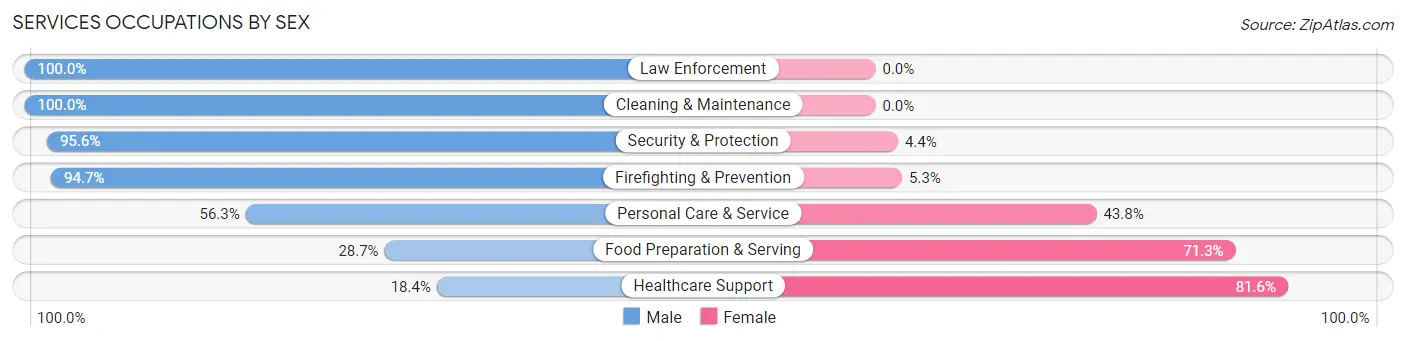
Services Occupations by Sex
Within the Services occupations in Corbin, the most male-oriented occupations are Law Enforcement (100.0%), Cleaning & Maintenance (100.0%), and Security & Protection (95.6%), while the most female-oriented occupations are Healthcare Support (81.6%), Food Preparation & Serving (71.3%), and Personal Care & Service (43.8%).
| Occupation | Male | Female |
| Healthcare Support | 16 (18.4%) | 71 (81.6%) |
| Security & Protection | 86 (95.6%) | 4 (4.4%) |
| Firefighting & Prevention | 72 (94.7%) | 4 (5.3%) |
| Law Enforcement | 14 (100.0%) | 0 (0.0%) |
| Food Preparation & Serving | 50 (28.7%) | 124 (71.3%) |
| Cleaning & Maintenance | 49 (100.0%) | 0 (0.0%) |
| Personal Care & Service | 45 (56.2%) | 35 (43.8%) |
| Total (Category) | 246 (51.2%) | 234 (48.7%) |
| Total (Overall) | 1,701 (54.7%) | 1,407 (45.3%) |
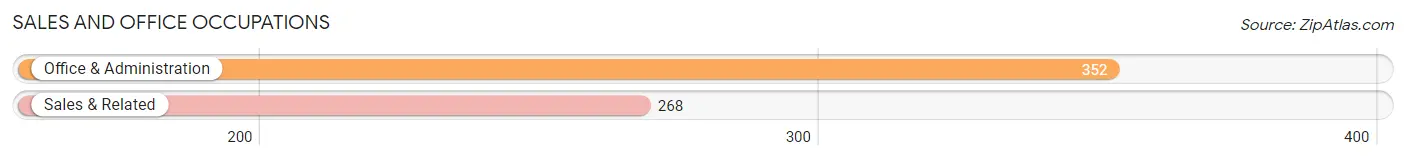
Sales and Office Occupations
The most common Sales and Office occupations in Corbin are Office & Administration (352 | 11.3%), and Sales & Related (268 | 8.6%).
Sales and Office Occupations by Sex
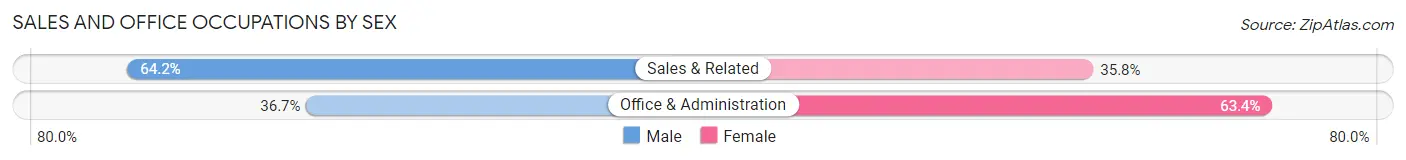
| Occupation | Male | Female |
| Sales & Related | 172 (64.2%) | 96 (35.8%) |
| Office & Administration | 129 (36.6%) | 223 (63.3%) |
| Total (Category) | 301 (48.5%) | 319 (51.4%) |
| Total (Overall) | 1,701 (54.7%) | 1,407 (45.3%) |
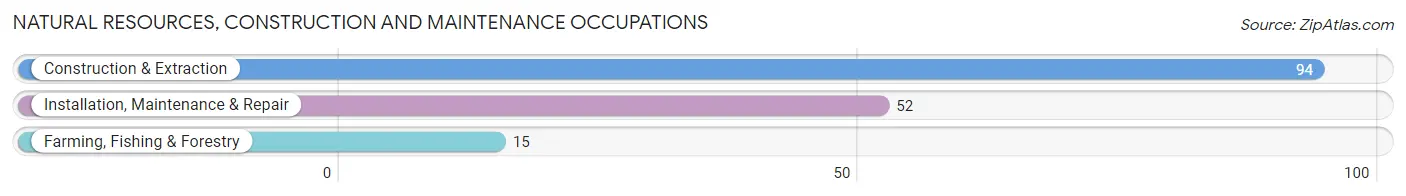
Natural Resources, Construction and Maintenance Occupations
The most common Natural Resources, Construction and Maintenance occupations in Corbin are Construction & Extraction (94 | 3.0%), Installation, Maintenance & Repair (52 | 1.7%), and Farming, Fishing & Forestry (15 | 0.5%).
Natural Resources, Construction and Maintenance Occupations by Sex
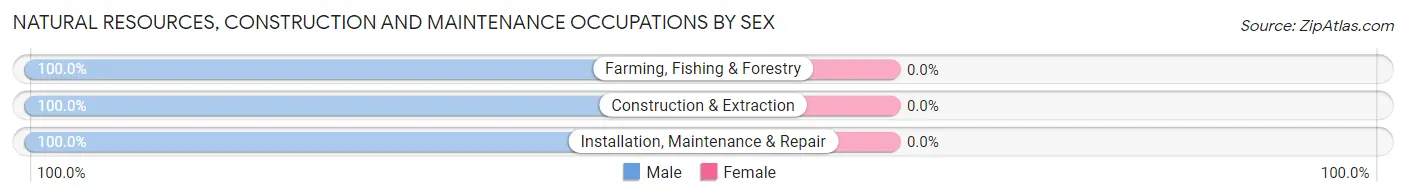
| Occupation | Male | Female |
| Farming, Fishing & Forestry | 15 (100.0%) | 0 (0.0%) |
| Construction & Extraction | 94 (100.0%) | 0 (0.0%) |
| Installation, Maintenance & Repair | 52 (100.0%) | 0 (0.0%) |
| Total (Category) | 161 (100.0%) | 0 (0.0%) |
| Total (Overall) | 1,701 (54.7%) | 1,407 (45.3%) |
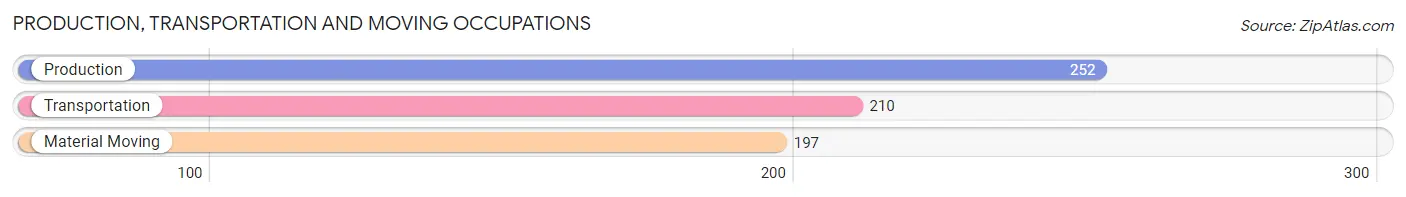
Production, Transportation and Moving Occupations
The most common Production, Transportation and Moving occupations in Corbin are Production (252 | 8.1%), Transportation (210 | 6.8%), and Material Moving (197 | 6.3%).
Production, Transportation and Moving Occupations by Sex
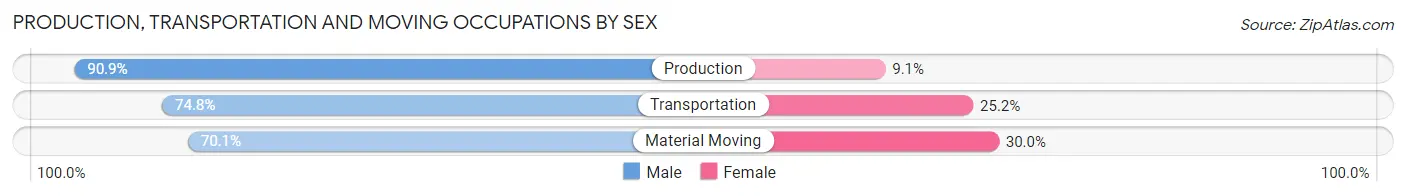
| Occupation | Male | Female |
| Production | 229 (90.9%) | 23 (9.1%) |
| Transportation | 157 (74.8%) | 53 (25.2%) |
| Material Moving | 138 (70.1%) | 59 (29.9%) |
| Total (Category) | 524 (79.5%) | 135 (20.5%) |
| Total (Overall) | 1,701 (54.7%) | 1,407 (45.3%) |
Employment Industries by Sex in Corbin
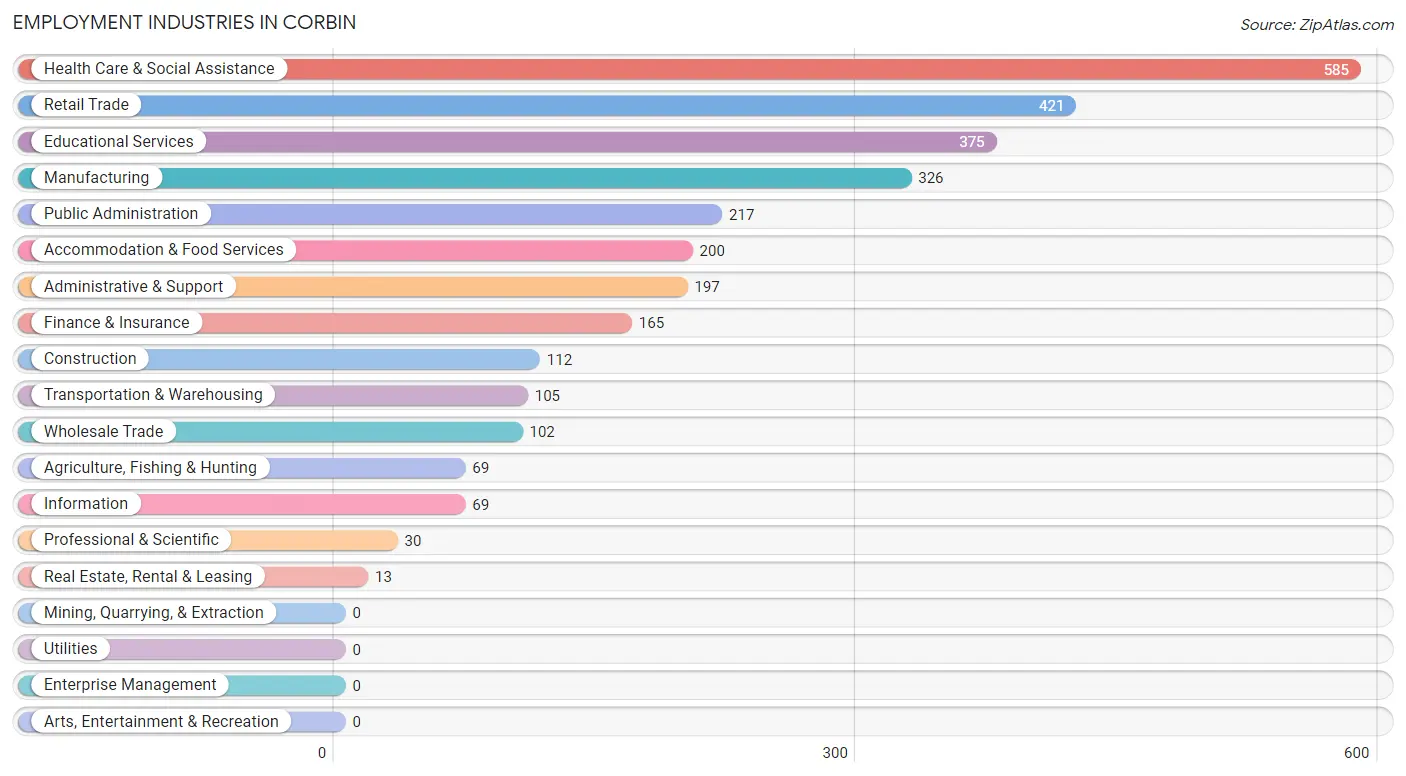
Employment Industries in Corbin
The major employment industries in Corbin include Health Care & Social Assistance (585 | 18.8%), Retail Trade (421 | 13.6%), Educational Services (375 | 12.1%), Manufacturing (326 | 10.5%), and Public Administration (217 | 7.0%).
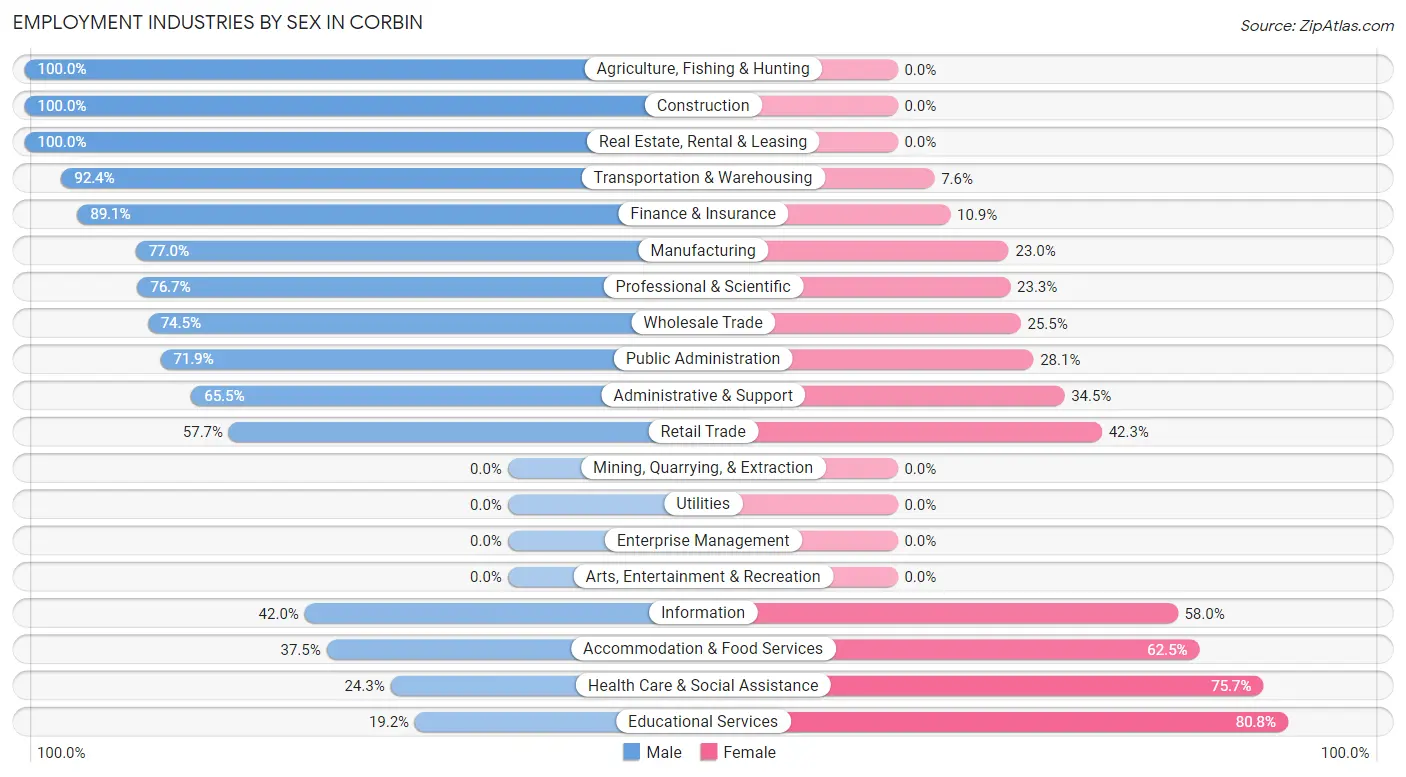
Employment Industries by Sex in Corbin
The Corbin industries that see more men than women are Agriculture, Fishing & Hunting (100.0%), Construction (100.0%), and Real Estate, Rental & Leasing (100.0%), whereas the industries that tend to have a higher number of women are Educational Services (80.8%), Health Care & Social Assistance (75.7%), and Accommodation & Food Services (62.5%).
| Industry | Male | Female |
| Agriculture, Fishing & Hunting | 69 (100.0%) | 0 (0.0%) |
| Mining, Quarrying, & Extraction | 0 (0.0%) | 0 (0.0%) |
| Construction | 112 (100.0%) | 0 (0.0%) |
| Manufacturing | 251 (77.0%) | 75 (23.0%) |
| Wholesale Trade | 76 (74.5%) | 26 (25.5%) |
| Retail Trade | 243 (57.7%) | 178 (42.3%) |
| Transportation & Warehousing | 97 (92.4%) | 8 (7.6%) |
| Utilities | 0 (0.0%) | 0 (0.0%) |
| Information | 29 (42.0%) | 40 (58.0%) |
| Finance & Insurance | 147 (89.1%) | 18 (10.9%) |
| Real Estate, Rental & Leasing | 13 (100.0%) | 0 (0.0%) |
| Professional & Scientific | 23 (76.7%) | 7 (23.3%) |
| Enterprise Management | 0 (0.0%) | 0 (0.0%) |
| Administrative & Support | 129 (65.5%) | 68 (34.5%) |
| Educational Services | 72 (19.2%) | 303 (80.8%) |
| Health Care & Social Assistance | 142 (24.3%) | 443 (75.7%) |
| Arts, Entertainment & Recreation | 0 (0.0%) | 0 (0.0%) |
| Accommodation & Food Services | 75 (37.5%) | 125 (62.5%) |
| Public Administration | 156 (71.9%) | 61 (28.1%) |
| Total | 1,701 (54.7%) | 1,407 (45.3%) |
Education in Corbin
School Enrollment in Corbin
The most common levels of schooling among the 1,981 students in Corbin are elementary school (659 | 33.3%), middle school (494 | 24.9%), and high school (251 | 12.7%).
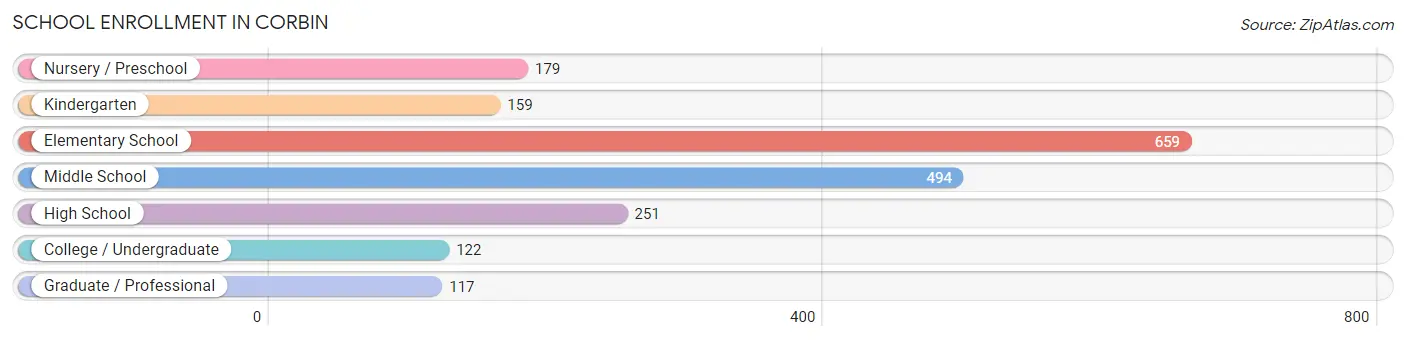
| School Level | # Students | % Students |
| Nursery / Preschool | 179 | 9.0% |
| Kindergarten | 159 | 8.0% |
| Elementary School | 659 | 33.3% |
| Middle School | 494 | 24.9% |
| High School | 251 | 12.7% |
| College / Undergraduate | 122 | 6.2% |
| Graduate / Professional | 117 | 5.9% |
| Total | 1,981 | 100.0% |
School Enrollment by Age by Funding Source in Corbin
Out of a total of 1,981 students who are enrolled in schools in Corbin, 44 (2.2%) attend a private institution, while the remaining 1,937 (97.8%) are enrolled in public schools. The age group of 25 to 34 year olds has the highest likelihood of being enrolled in private schools, with 13 (18.8% in the age bracket) enrolled. Conversely, the age group of 3 to 4 year olds has the lowest likelihood of being enrolled in a private school, with 106 (100.0% in the age bracket) attending a public institution.
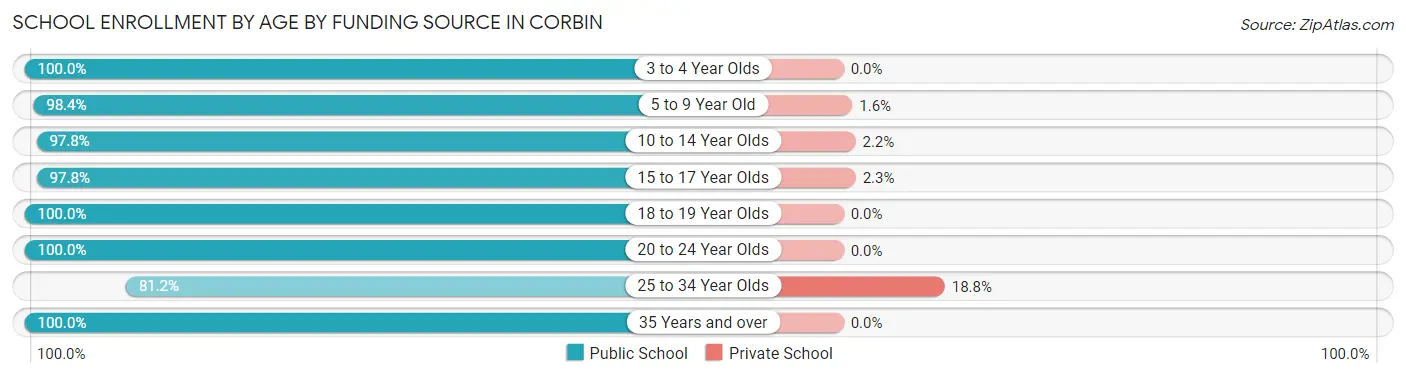
| Age Bracket | Public School | Private School |
| 3 to 4 Year Olds | 106 (100.0%) | 0 (0.0%) |
| 5 to 9 Year Old | 848 (98.4%) | 14 (1.6%) |
| 10 to 14 Year Olds | 531 (97.8%) | 12 (2.2%) |
| 15 to 17 Year Olds | 217 (97.8%) | 5 (2.2%) |
| 18 to 19 Year Olds | 33 (100.0%) | 0 (0.0%) |
| 20 to 24 Year Olds | 93 (100.0%) | 0 (0.0%) |
| 25 to 34 Year Olds | 56 (81.2%) | 13 (18.8%) |
| 35 Years and over | 53 (100.0%) | 0 (0.0%) |
| Total | 1,937 (97.8%) | 44 (2.2%) |
Educational Attainment by Field of Study in Corbin
Business (414 | 26.0%), education (387 | 24.3%), science & technology (308 | 19.4%), arts & humanities (170 | 10.7%), and psychology (88 | 5.5%) are the most common fields of study among 1,590 individuals in Corbin who have obtained a bachelor's degree or higher.
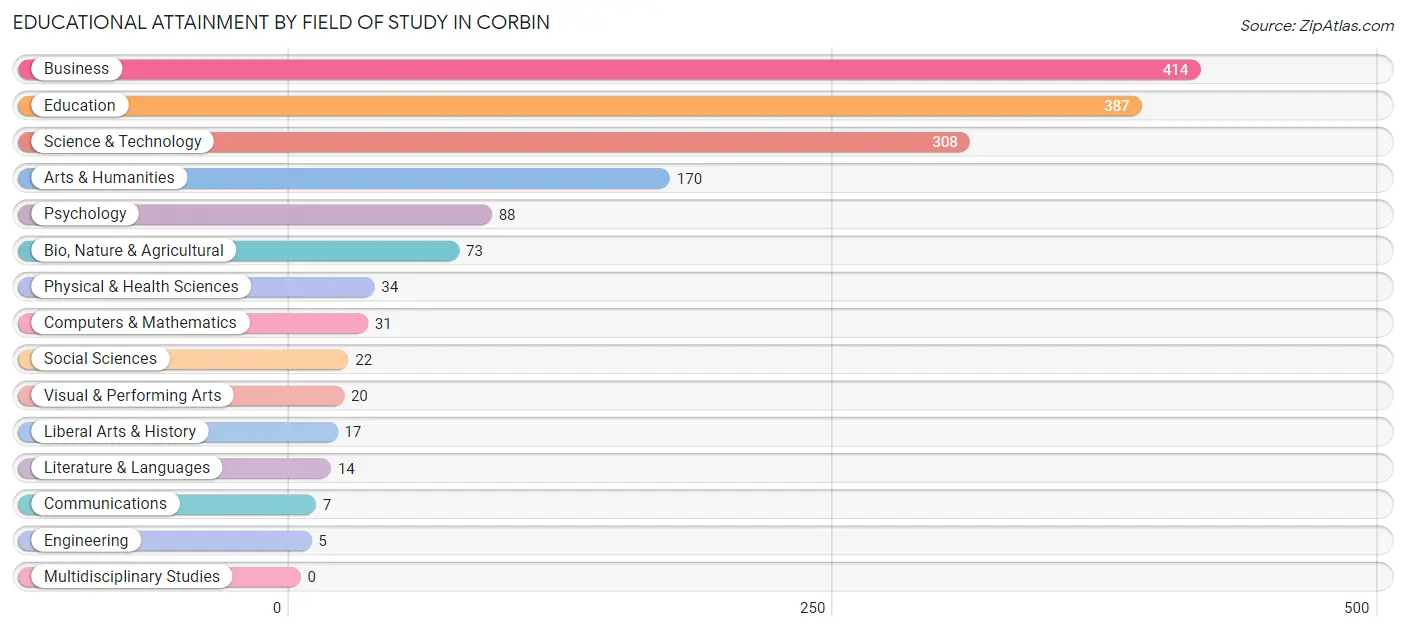
| Field of Study | # Graduates | % Graduates |
| Computers & Mathematics | 31 | 1.9% |
| Bio, Nature & Agricultural | 73 | 4.6% |
| Physical & Health Sciences | 34 | 2.1% |
| Psychology | 88 | 5.5% |
| Social Sciences | 22 | 1.4% |
| Engineering | 5 | 0.3% |
| Multidisciplinary Studies | 0 | 0.0% |
| Science & Technology | 308 | 19.4% |
| Business | 414 | 26.0% |
| Education | 387 | 24.3% |
| Literature & Languages | 14 | 0.9% |
| Liberal Arts & History | 17 | 1.1% |
| Visual & Performing Arts | 20 | 1.3% |
| Communications | 7 | 0.4% |
| Arts & Humanities | 170 | 10.7% |
| Total | 1,590 | 100.0% |
Transportation & Commute in Corbin
Vehicle Availability by Sex in Corbin
The most prevalent vehicle ownership categories in Corbin are males with 2 vehicles (674, accounting for 40.6%) and females with 2 vehicles (668, making up 48.3%).
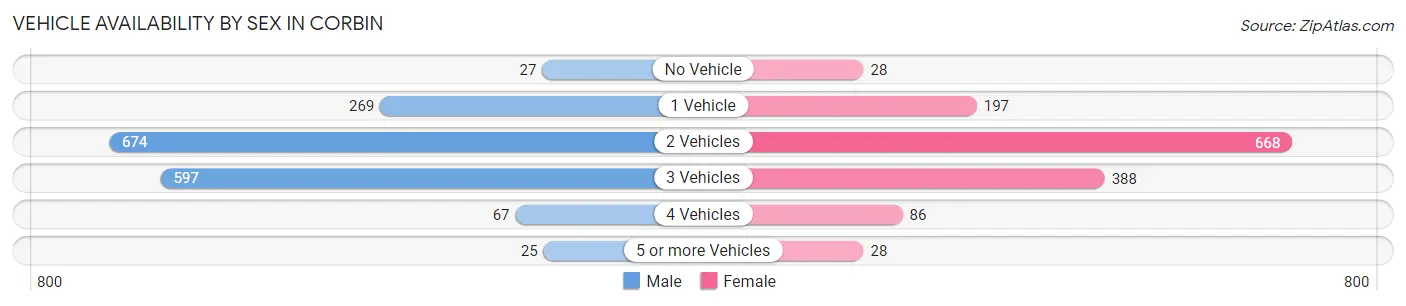
| Vehicles Available | Male | Female |
| No Vehicle | 27 (1.6%) | 28 (2.0%) |
| 1 Vehicle | 269 (16.2%) | 197 (14.1%) |
| 2 Vehicles | 674 (40.6%) | 668 (47.9%) |
| 3 Vehicles | 597 (36.0%) | 388 (27.8%) |
| 4 Vehicles | 67 (4.0%) | 86 (6.2%) |
| 5 or more Vehicles | 25 (1.5%) | 28 (2.0%) |
| Total | 1,659 (100.0%) | 1,395 (100.0%) |
Commute Time in Corbin
The most frequently occuring commute durations in Corbin are 10 to 14 minutes (627 commuters, 21.3%), 5 to 9 minutes (526 commuters, 17.9%), and 15 to 19 minutes (395 commuters, 13.4%).
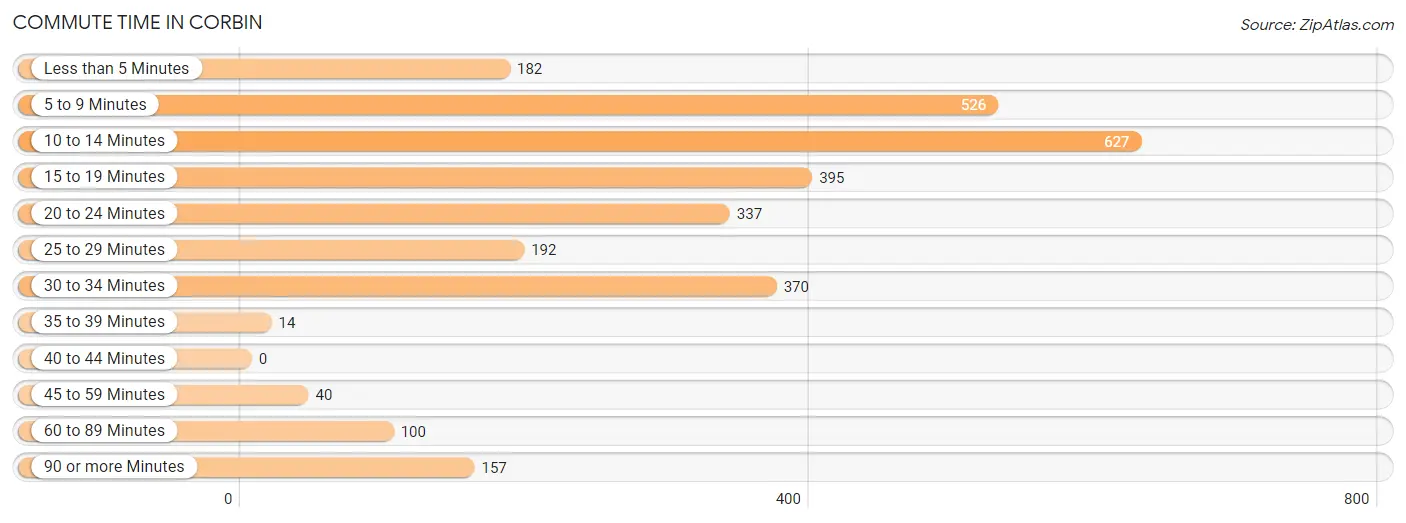
| Commute Time | # Commuters | % Commuters |
| Less than 5 Minutes | 182 | 6.2% |
| 5 to 9 Minutes | 526 | 17.9% |
| 10 to 14 Minutes | 627 | 21.3% |
| 15 to 19 Minutes | 395 | 13.4% |
| 20 to 24 Minutes | 337 | 11.5% |
| 25 to 29 Minutes | 192 | 6.5% |
| 30 to 34 Minutes | 370 | 12.6% |
| 35 to 39 Minutes | 14 | 0.5% |
| 40 to 44 Minutes | 0 | 0.0% |
| 45 to 59 Minutes | 40 | 1.4% |
| 60 to 89 Minutes | 100 | 3.4% |
| 90 or more Minutes | 157 | 5.3% |
Commute Time by Sex in Corbin
The most common commute times in Corbin are 10 to 14 minutes (423 commuters, 26.0%) for males and 5 to 9 minutes (320 commuters, 24.4%) for females.
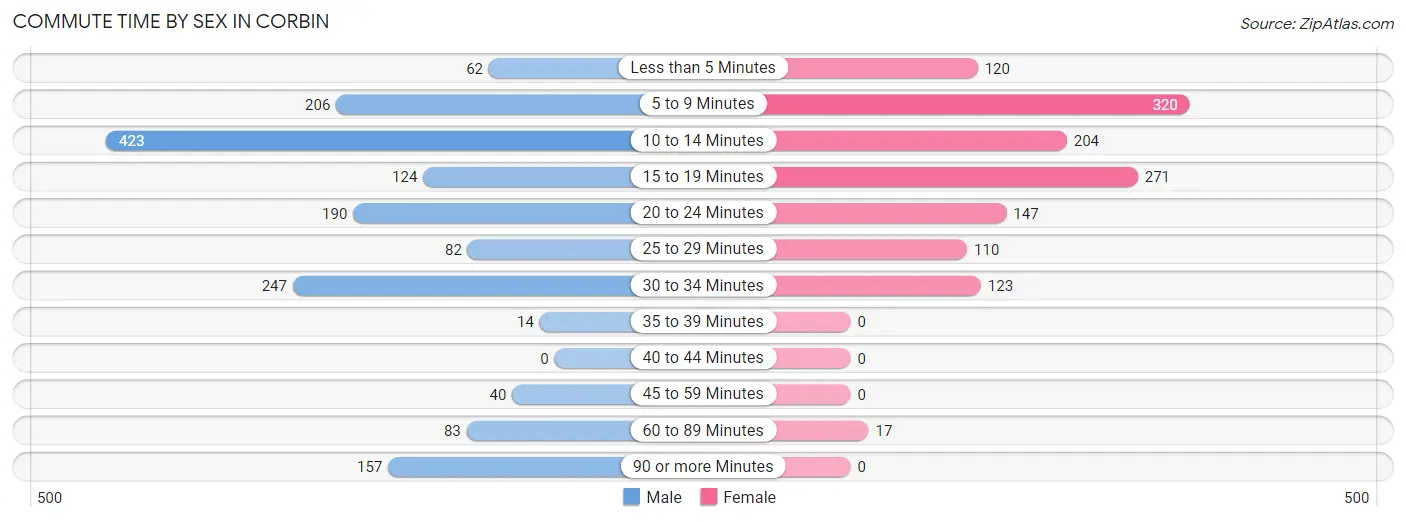
| Commute Time | Male | Female |
| Less than 5 Minutes | 62 (3.8%) | 120 (9.1%) |
| 5 to 9 Minutes | 206 (12.7%) | 320 (24.4%) |
| 10 to 14 Minutes | 423 (26.0%) | 204 (15.5%) |
| 15 to 19 Minutes | 124 (7.6%) | 271 (20.7%) |
| 20 to 24 Minutes | 190 (11.7%) | 147 (11.2%) |
| 25 to 29 Minutes | 82 (5.0%) | 110 (8.4%) |
| 30 to 34 Minutes | 247 (15.2%) | 123 (9.4%) |
| 35 to 39 Minutes | 14 (0.9%) | 0 (0.0%) |
| 40 to 44 Minutes | 0 (0.0%) | 0 (0.0%) |
| 45 to 59 Minutes | 40 (2.5%) | 0 (0.0%) |
| 60 to 89 Minutes | 83 (5.1%) | 17 (1.3%) |
| 90 or more Minutes | 157 (9.6%) | 0 (0.0%) |
Time of Departure to Work by Sex in Corbin
The most frequent times of departure to work in Corbin are 7:00 AM to 7:29 AM (322, 19.8%) for males and 7:30 AM to 7:59 AM (298, 22.7%) for females.
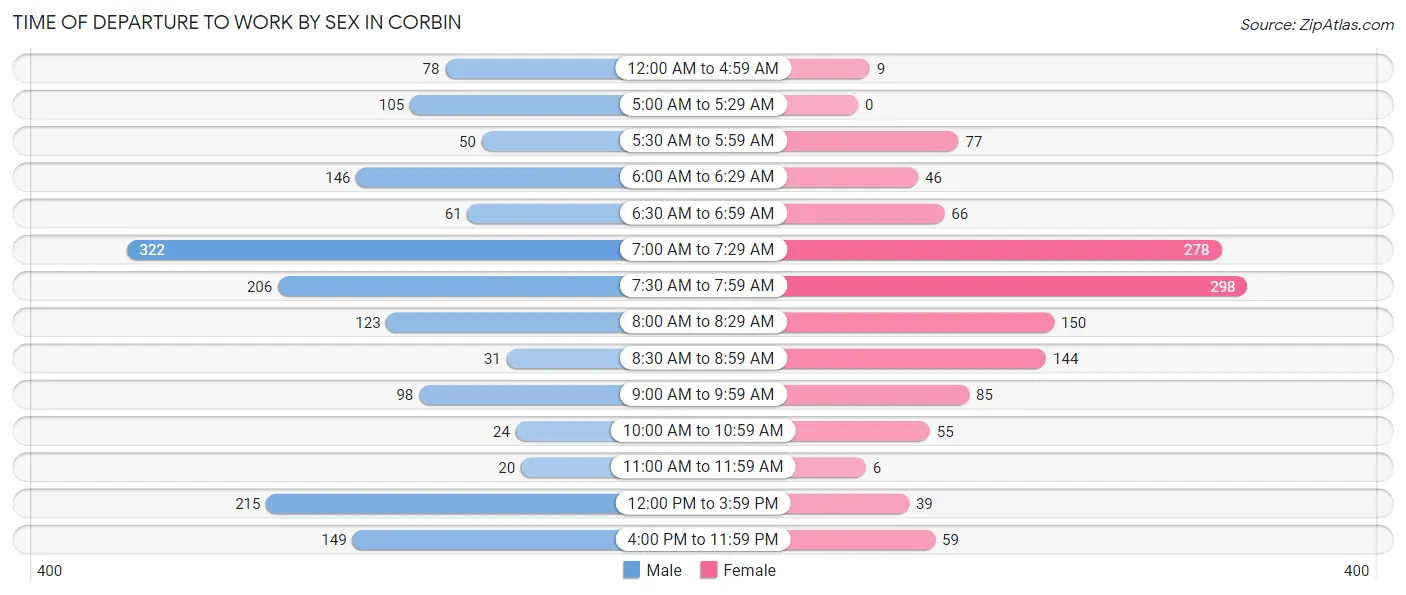
| Time of Departure | Male | Female |
| 12:00 AM to 4:59 AM | 78 (4.8%) | 9 (0.7%) |
| 5:00 AM to 5:29 AM | 105 (6.5%) | 0 (0.0%) |
| 5:30 AM to 5:59 AM | 50 (3.1%) | 77 (5.9%) |
| 6:00 AM to 6:29 AM | 146 (9.0%) | 46 (3.5%) |
| 6:30 AM to 6:59 AM | 61 (3.7%) | 66 (5.0%) |
| 7:00 AM to 7:29 AM | 322 (19.8%) | 278 (21.2%) |
| 7:30 AM to 7:59 AM | 206 (12.7%) | 298 (22.7%) |
| 8:00 AM to 8:29 AM | 123 (7.6%) | 150 (11.4%) |
| 8:30 AM to 8:59 AM | 31 (1.9%) | 144 (11.0%) |
| 9:00 AM to 9:59 AM | 98 (6.0%) | 85 (6.5%) |
| 10:00 AM to 10:59 AM | 24 (1.5%) | 55 (4.2%) |
| 11:00 AM to 11:59 AM | 20 (1.2%) | 6 (0.5%) |
| 12:00 PM to 3:59 PM | 215 (13.2%) | 39 (3.0%) |
| 4:00 PM to 11:59 PM | 149 (9.1%) | 59 (4.5%) |
| Total | 1,628 (100.0%) | 1,312 (100.0%) |
Housing Occupancy in Corbin
Occupancy by Ownership in Corbin
Of the total 2,984 dwellings in Corbin, owner-occupied units account for 1,652 (55.4%), while renter-occupied units make up 1,332 (44.6%).
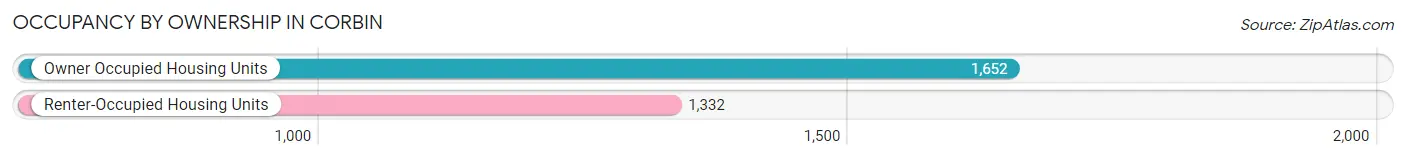
| Occupancy | # Housing Units | % Housing Units |
| Owner Occupied Housing Units | 1,652 | 55.4% |
| Renter-Occupied Housing Units | 1,332 | 44.6% |
| Total Occupied Housing Units | 2,984 | 100.0% |
Occupancy by Household Size in Corbin
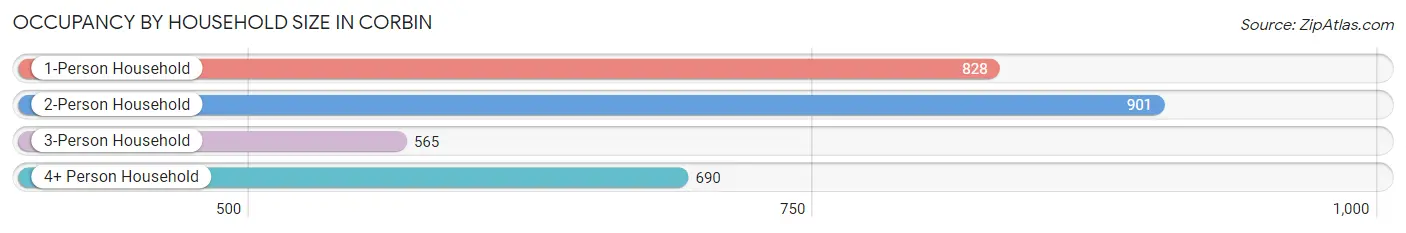
| Household Size | # Housing Units | % Housing Units |
| 1-Person Household | 828 | 27.8% |
| 2-Person Household | 901 | 30.2% |
| 3-Person Household | 565 | 18.9% |
| 4+ Person Household | 690 | 23.1% |
| Total Housing Units | 2,984 | 100.0% |
Occupancy by Ownership by Household Size in Corbin
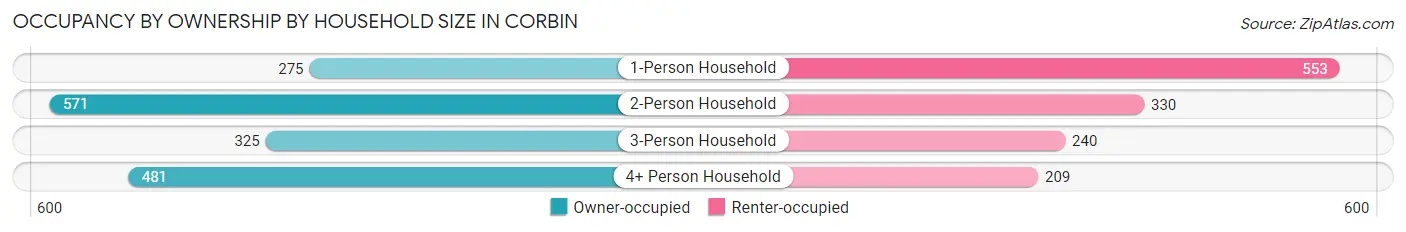
| Household Size | Owner-occupied | Renter-occupied |
| 1-Person Household | 275 (33.2%) | 553 (66.8%) |
| 2-Person Household | 571 (63.4%) | 330 (36.6%) |
| 3-Person Household | 325 (57.5%) | 240 (42.5%) |
| 4+ Person Household | 481 (69.7%) | 209 (30.3%) |
| Total Housing Units | 1,652 (55.4%) | 1,332 (44.6%) |
Occupancy by Educational Attainment in Corbin
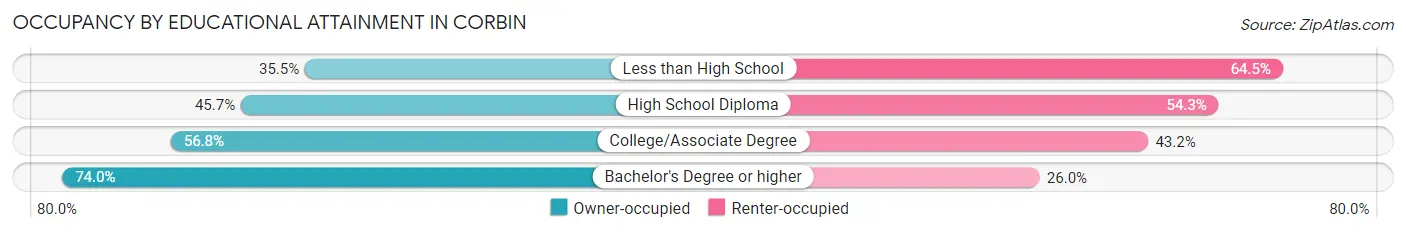
| Household Size | Owner-occupied | Renter-occupied |
| Less than High School | 103 (35.5%) | 187 (64.5%) |
| High School Diploma | 471 (45.7%) | 560 (54.3%) |
| College/Associate Degree | 505 (56.8%) | 384 (43.2%) |
| Bachelor's Degree or higher | 573 (74.0%) | 201 (26.0%) |
Occupancy by Age of Householder in Corbin
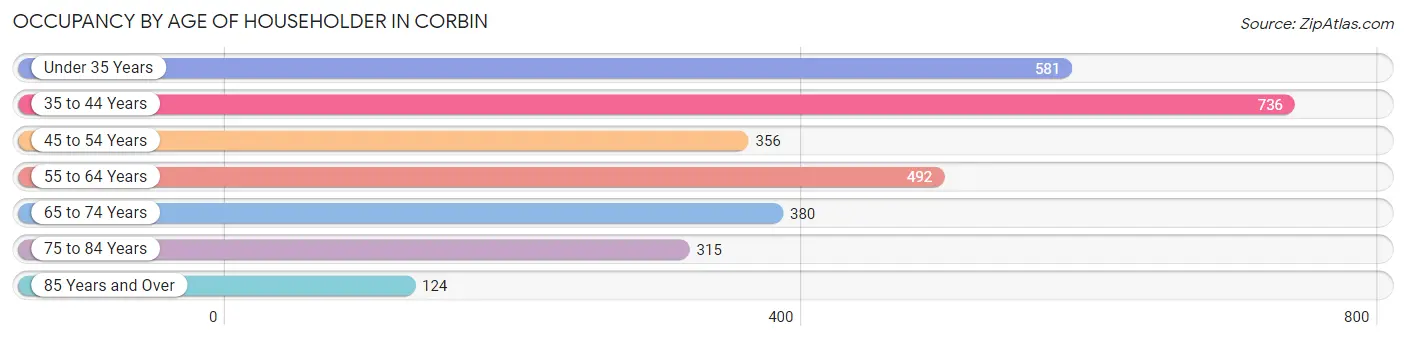
| Age Bracket | # Households | % Households |
| Under 35 Years | 581 | 19.5% |
| 35 to 44 Years | 736 | 24.7% |
| 45 to 54 Years | 356 | 11.9% |
| 55 to 64 Years | 492 | 16.5% |
| 65 to 74 Years | 380 | 12.7% |
| 75 to 84 Years | 315 | 10.6% |
| 85 Years and Over | 124 | 4.2% |
| Total | 2,984 | 100.0% |
Housing Finances in Corbin
Median Income by Occupancy in Corbin
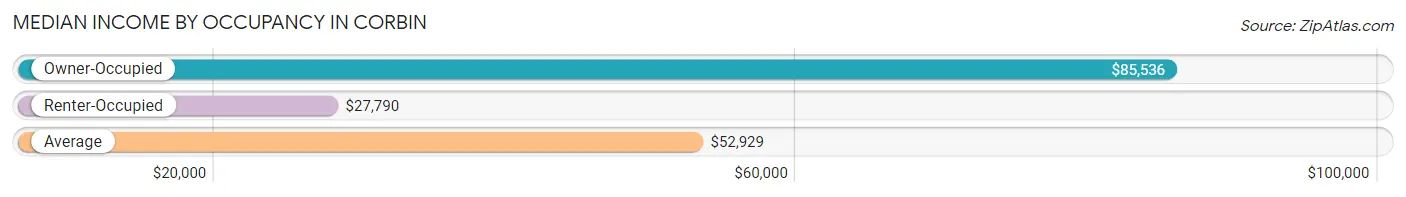
| Occupancy Type | # Households | Median Income |
| Owner-Occupied | 1,652 (55.4%) | $85,536 |
| Renter-Occupied | 1,332 (44.6%) | $27,790 |
| Average | 2,984 (100.0%) | $52,929 |
Occupancy by Householder Income Bracket in Corbin
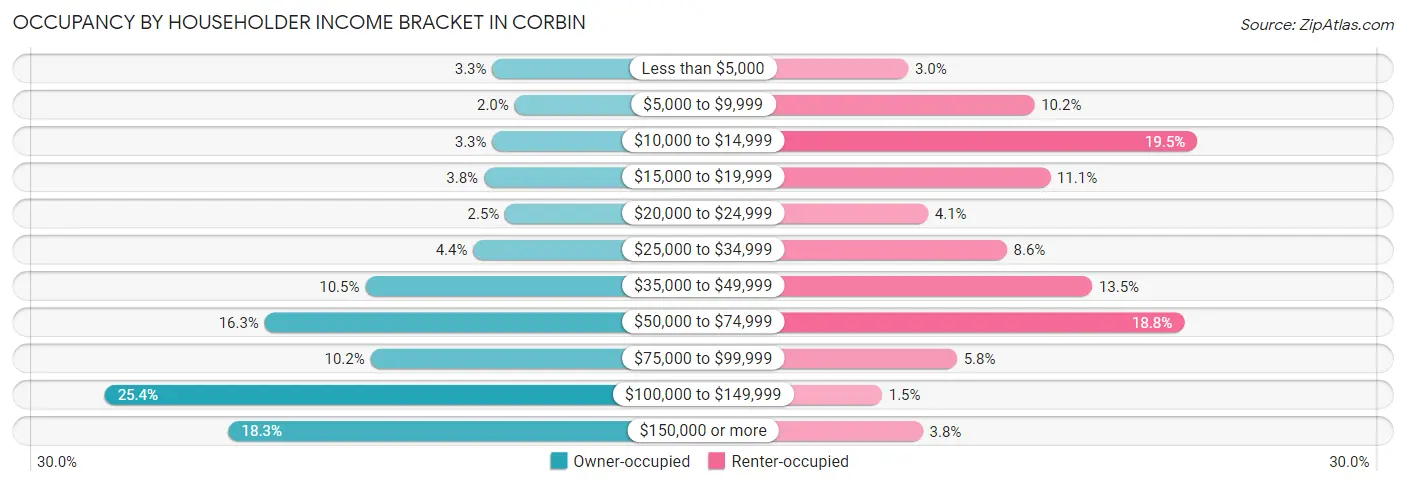
| Income Bracket | Owner-occupied | Renter-occupied |
| Less than $5,000 | 54 (3.3%) | 40 (3.0%) |
| $5,000 to $9,999 | 33 (2.0%) | 136 (10.2%) |
| $10,000 to $14,999 | 54 (3.3%) | 260 (19.5%) |
| $15,000 to $19,999 | 62 (3.7%) | 148 (11.1%) |
| $20,000 to $24,999 | 42 (2.5%) | 55 (4.1%) |
| $25,000 to $34,999 | 72 (4.4%) | 115 (8.6%) |
| $35,000 to $49,999 | 174 (10.5%) | 180 (13.5%) |
| $50,000 to $74,999 | 269 (16.3%) | 250 (18.8%) |
| $75,000 to $99,999 | 169 (10.2%) | 77 (5.8%) |
| $100,000 to $149,999 | 420 (25.4%) | 20 (1.5%) |
| $150,000 or more | 303 (18.3%) | 51 (3.8%) |
| Total | 1,652 (100.0%) | 1,332 (100.0%) |
Monthly Housing Cost Tiers in Corbin
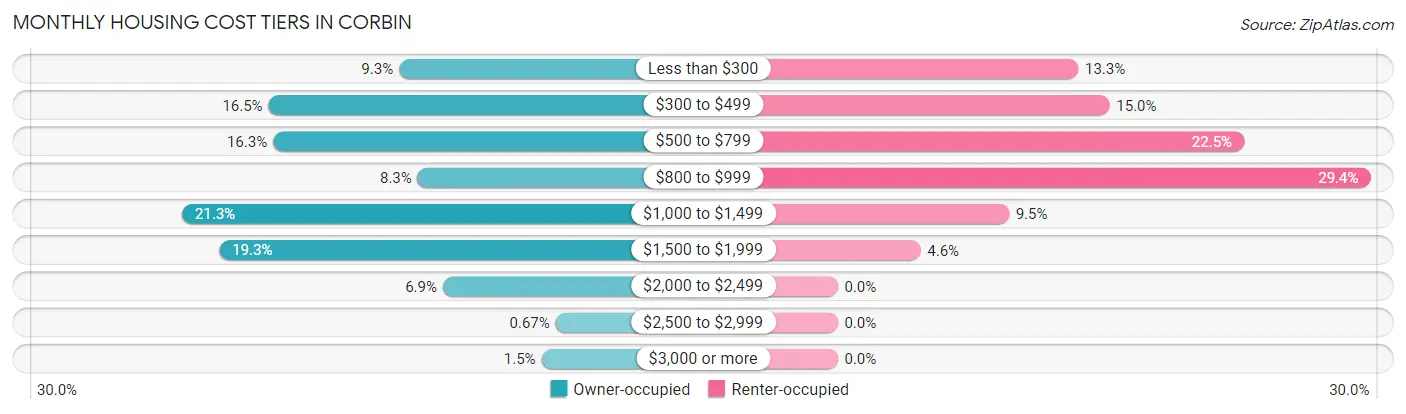
| Monthly Cost | Owner-occupied | Renter-occupied |
| Less than $300 | 154 (9.3%) | 177 (13.3%) |
| $300 to $499 | 273 (16.5%) | 200 (15.0%) |
| $500 to $799 | 269 (16.3%) | 299 (22.5%) |
| $800 to $999 | 137 (8.3%) | 392 (29.4%) |
| $1,000 to $1,499 | 352 (21.3%) | 126 (9.5%) |
| $1,500 to $1,999 | 318 (19.3%) | 61 (4.6%) |
| $2,000 to $2,499 | 114 (6.9%) | 0 (0.0%) |
| $2,500 to $2,999 | 11 (0.7%) | 0 (0.0%) |
| $3,000 or more | 24 (1.5%) | 0 (0.0%) |
| Total | 1,652 (100.0%) | 1,332 (100.0%) |
Physical Housing Characteristics in Corbin
Housing Structures in Corbin
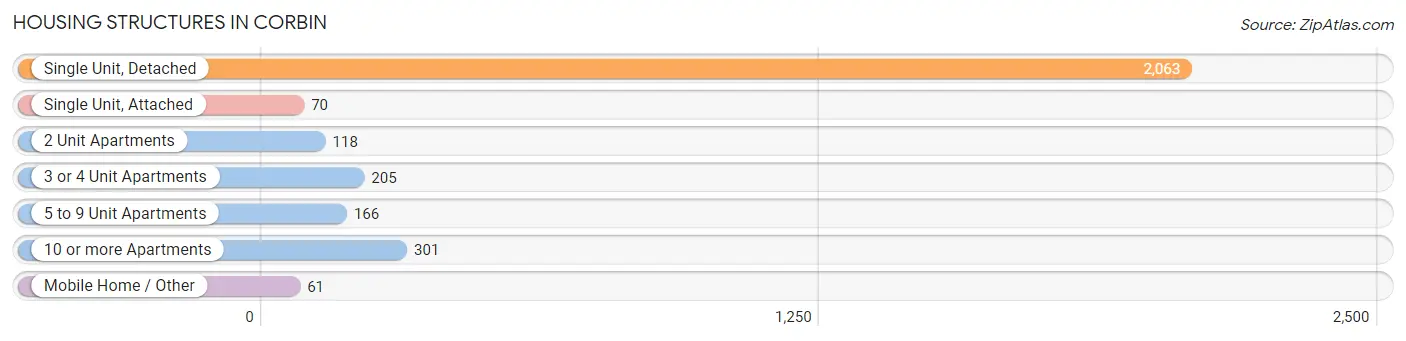
| Structure Type | # Housing Units | % Housing Units |
| Single Unit, Detached | 2,063 | 69.1% |
| Single Unit, Attached | 70 | 2.4% |
| 2 Unit Apartments | 118 | 4.0% |
| 3 or 4 Unit Apartments | 205 | 6.9% |
| 5 to 9 Unit Apartments | 166 | 5.6% |
| 10 or more Apartments | 301 | 10.1% |
| Mobile Home / Other | 61 | 2.0% |
| Total | 2,984 | 100.0% |
Housing Structures by Occupancy in Corbin
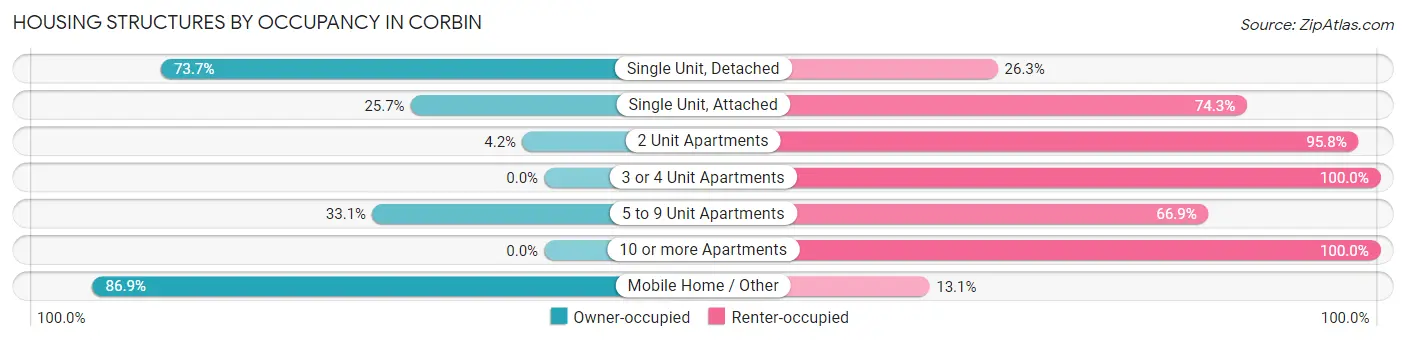
| Structure Type | Owner-occupied | Renter-occupied |
| Single Unit, Detached | 1,521 (73.7%) | 542 (26.3%) |
| Single Unit, Attached | 18 (25.7%) | 52 (74.3%) |
| 2 Unit Apartments | 5 (4.2%) | 113 (95.8%) |
| 3 or 4 Unit Apartments | 0 (0.0%) | 205 (100.0%) |
| 5 to 9 Unit Apartments | 55 (33.1%) | 111 (66.9%) |
| 10 or more Apartments | 0 (0.0%) | 301 (100.0%) |
| Mobile Home / Other | 53 (86.9%) | 8 (13.1%) |
| Total | 1,652 (55.4%) | 1,332 (44.6%) |
Housing Structures by Number of Rooms in Corbin
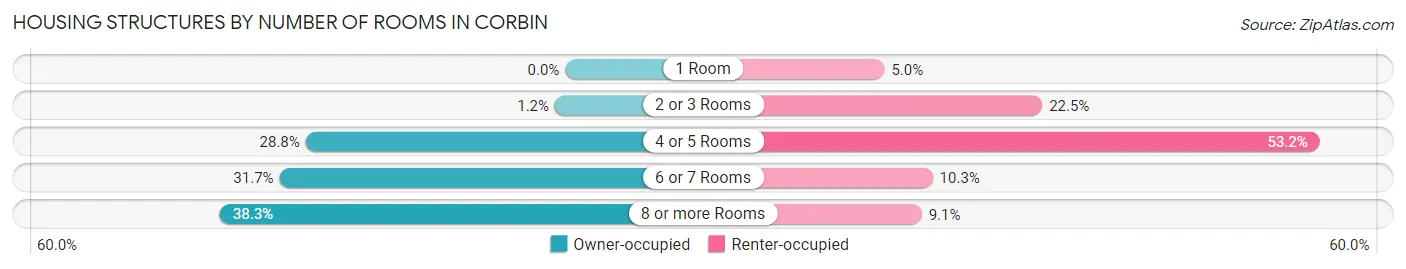
| Number of Rooms | Owner-occupied | Renter-occupied |
| 1 Room | 0 (0.0%) | 66 (5.0%) |
| 2 or 3 Rooms | 19 (1.1%) | 299 (22.5%) |
| 4 or 5 Rooms | 476 (28.8%) | 709 (53.2%) |
| 6 or 7 Rooms | 524 (31.7%) | 137 (10.3%) |
| 8 or more Rooms | 633 (38.3%) | 121 (9.1%) |
| Total | 1,652 (100.0%) | 1,332 (100.0%) |
Housing Structure by Heating Type in Corbin
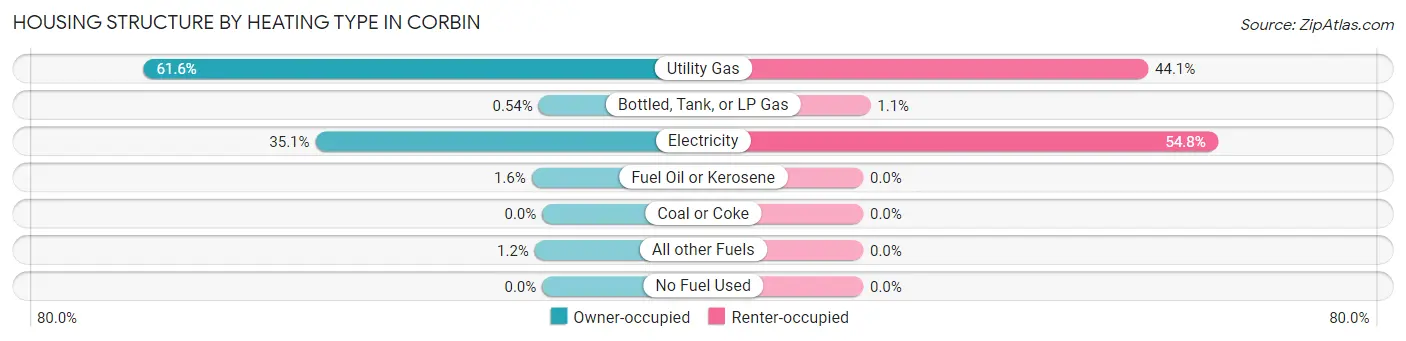
| Heating Type | Owner-occupied | Renter-occupied |
| Utility Gas | 1,018 (61.6%) | 587 (44.1%) |
| Bottled, Tank, or LP Gas | 9 (0.5%) | 15 (1.1%) |
| Electricity | 579 (35.0%) | 730 (54.8%) |
| Fuel Oil or Kerosene | 27 (1.6%) | 0 (0.0%) |
| Coal or Coke | 0 (0.0%) | 0 (0.0%) |
| All other Fuels | 19 (1.1%) | 0 (0.0%) |
| No Fuel Used | 0 (0.0%) | 0 (0.0%) |
| Total | 1,652 (100.0%) | 1,332 (100.0%) |
Household Vehicle Usage in Corbin
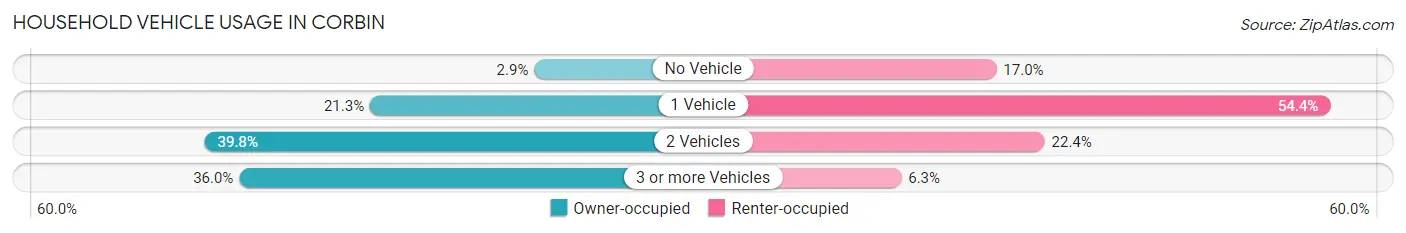
| Vehicles per Household | Owner-occupied | Renter-occupied |
| No Vehicle | 48 (2.9%) | 226 (17.0%) |
| 1 Vehicle | 352 (21.3%) | 724 (54.3%) |
| 2 Vehicles | 658 (39.8%) | 298 (22.4%) |
| 3 or more Vehicles | 594 (36.0%) | 84 (6.3%) |
| Total | 1,652 (100.0%) | 1,332 (100.0%) |
Real Estate & Mortgages in Corbin
Real Estate and Mortgage Overview in Corbin
| Characteristic | Without Mortgage | With Mortgage |
| Housing Units | 589 | 1,063 |
| Median Property Value | $110,600 | $172,600 |
| Median Household Income | $44,464 | $234 |
| Monthly Housing Costs | $393 | $24 |
| Real Estate Taxes | $800 | $18 |
Property Value by Mortgage Status in Corbin
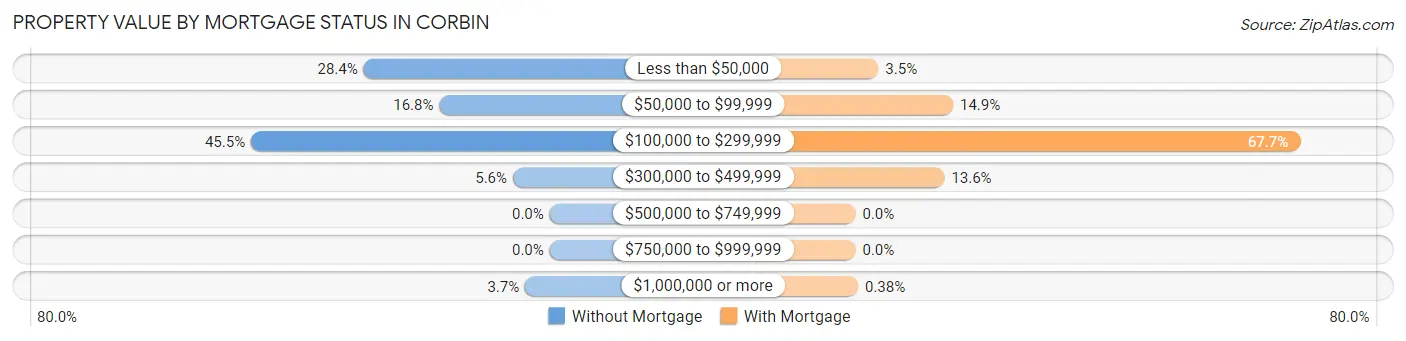
| Property Value | Without Mortgage | With Mortgage |
| Less than $50,000 | 167 (28.3%) | 37 (3.5%) |
| $50,000 to $99,999 | 99 (16.8%) | 158 (14.9%) |
| $100,000 to $299,999 | 268 (45.5%) | 720 (67.7%) |
| $300,000 to $499,999 | 33 (5.6%) | 144 (13.6%) |
| $500,000 to $749,999 | 0 (0.0%) | 0 (0.0%) |
| $750,000 to $999,999 | 0 (0.0%) | 0 (0.0%) |
| $1,000,000 or more | 22 (3.7%) | 4 (0.4%) |
| Total | 589 (100.0%) | 1,063 (100.0%) |
Household Income by Mortgage Status in Corbin
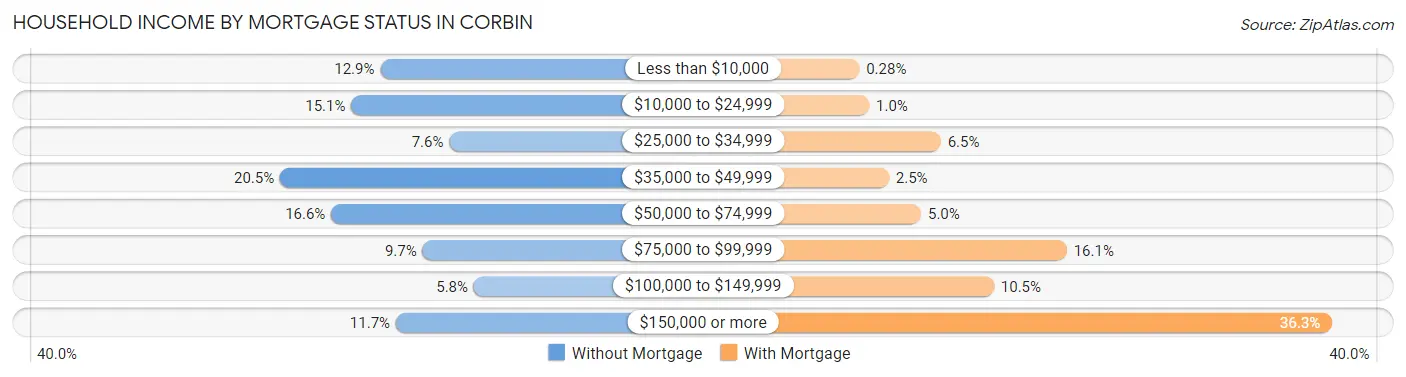
| Household Income | Without Mortgage | With Mortgage |
| Less than $10,000 | 76 (12.9%) | 3 (0.3%) |
| $10,000 to $24,999 | 89 (15.1%) | 11 (1.0%) |
| $25,000 to $34,999 | 45 (7.6%) | 69 (6.5%) |
| $35,000 to $49,999 | 121 (20.5%) | 27 (2.5%) |
| $50,000 to $74,999 | 98 (16.6%) | 53 (5.0%) |
| $75,000 to $99,999 | 57 (9.7%) | 171 (16.1%) |
| $100,000 to $149,999 | 34 (5.8%) | 112 (10.5%) |
| $150,000 or more | 69 (11.7%) | 386 (36.3%) |
| Total | 589 (100.0%) | 1,063 (100.0%) |
Property Value to Household Income Ratio in Corbin
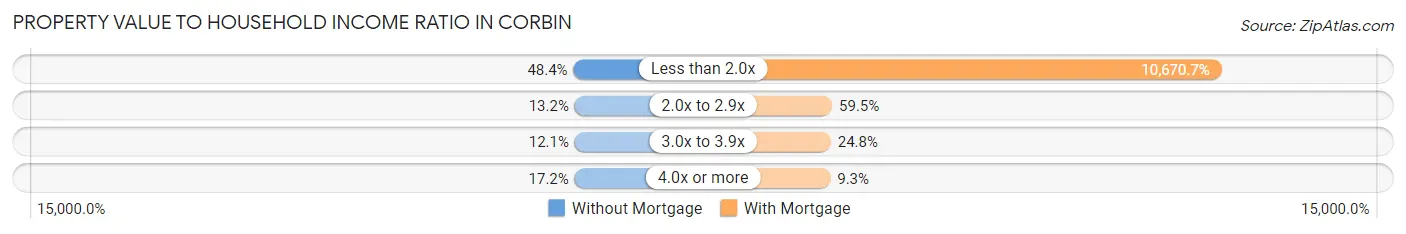
| Value-to-Income Ratio | Without Mortgage | With Mortgage |
| Less than 2.0x | 285 (48.4%) | 113,429 (10,670.7%) |
| 2.0x to 2.9x | 78 (13.2%) | 632 (59.5%) |
| 3.0x to 3.9x | 71 (12.0%) | 264 (24.8%) |
| 4.0x or more | 101 (17.2%) | 99 (9.3%) |
| Total | 589 (100.0%) | 1,063 (100.0%) |
Real Estate Taxes by Mortgage Status in Corbin
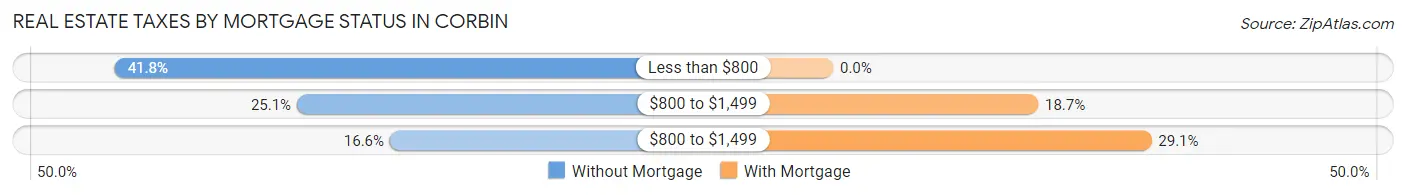
| Property Taxes | Without Mortgage | With Mortgage |
| Less than $800 | 246 (41.8%) | 0 (0.0%) |
| $800 to $1,499 | 148 (25.1%) | 199 (18.7%) |
| $800 to $1,499 | 98 (16.6%) | 309 (29.1%) |
| Total | 589 (100.0%) | 1,063 (100.0%) |
Health & Disability in Corbin
Health Insurance Coverage by Age in Corbin
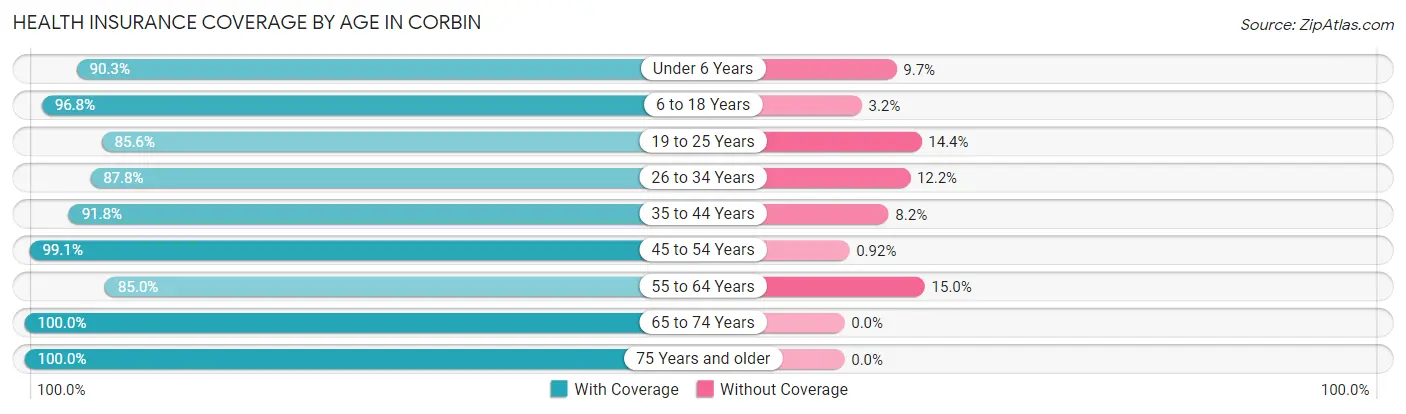
| Age Bracket | With Coverage | Without Coverage |
| Under 6 Years | 790 (90.3%) | 85 (9.7%) |
| 6 to 18 Years | 1,415 (96.8%) | 47 (3.2%) |
| 19 to 25 Years | 745 (85.6%) | 125 (14.4%) |
| 26 to 34 Years | 602 (87.8%) | 84 (12.2%) |
| 35 to 44 Years | 1,071 (91.8%) | 96 (8.2%) |
| 45 to 54 Years | 972 (99.1%) | 9 (0.9%) |
| 55 to 64 Years | 687 (85.0%) | 121 (15.0%) |
| 65 to 74 Years | 832 (100.0%) | 0 (0.0%) |
| 75 Years and older | 640 (100.0%) | 0 (0.0%) |
| Total | 7,754 (93.2%) | 567 (6.8%) |
Health Insurance Coverage by Citizenship Status in Corbin
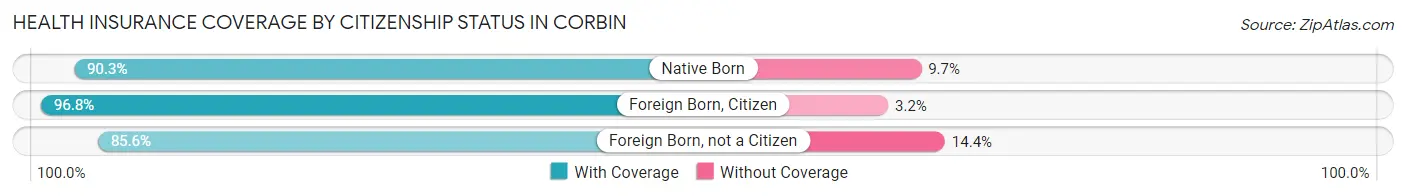
| Citizenship Status | With Coverage | Without Coverage |
| Native Born | 790 (90.3%) | 85 (9.7%) |
| Foreign Born, Citizen | 1,415 (96.8%) | 47 (3.2%) |
| Foreign Born, not a Citizen | 745 (85.6%) | 125 (14.4%) |
Health Insurance Coverage by Household Income in Corbin
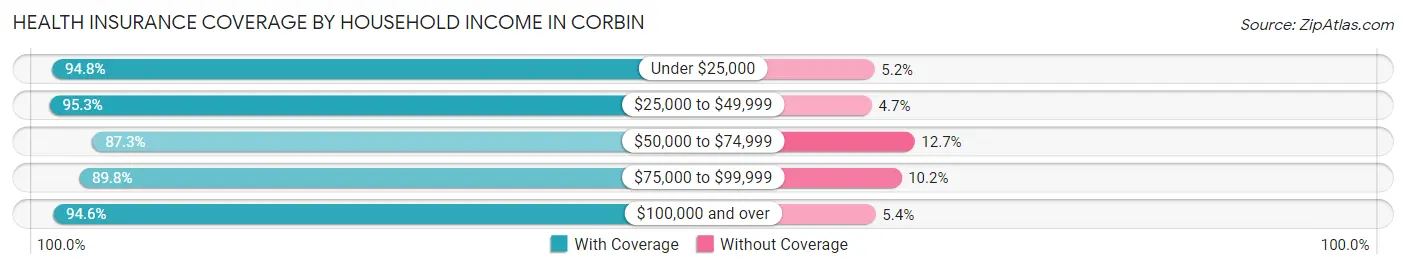
| Household Income | With Coverage | Without Coverage |
| Under $25,000 | 1,764 (94.8%) | 96 (5.2%) |
| $25,000 to $49,999 | 1,146 (95.3%) | 56 (4.7%) |
| $50,000 to $74,999 | 972 (87.3%) | 141 (12.7%) |
| $75,000 to $99,999 | 845 (89.8%) | 96 (10.2%) |
| $100,000 and over | 3,001 (94.6%) | 170 (5.4%) |
Public vs Private Health Insurance Coverage by Age in Corbin
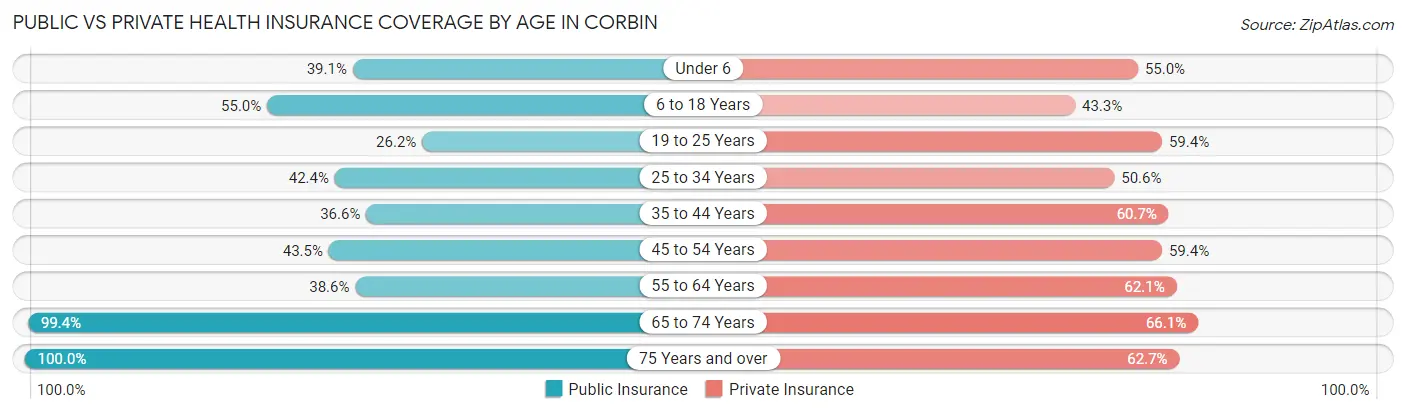
| Age Bracket | Public Insurance | Private Insurance |
| Under 6 | 342 (39.1%) | 481 (55.0%) |
| 6 to 18 Years | 804 (55.0%) | 633 (43.3%) |
| 19 to 25 Years | 228 (26.2%) | 517 (59.4%) |
| 25 to 34 Years | 291 (42.4%) | 347 (50.6%) |
| 35 to 44 Years | 427 (36.6%) | 708 (60.7%) |
| 45 to 54 Years | 427 (43.5%) | 583 (59.4%) |
| 55 to 64 Years | 312 (38.6%) | 502 (62.1%) |
| 65 to 74 Years | 827 (99.4%) | 550 (66.1%) |
| 75 Years and over | 640 (100.0%) | 401 (62.7%) |
| Total | 4,298 (51.6%) | 4,722 (56.8%) |
Disability Status by Sex by Age in Corbin
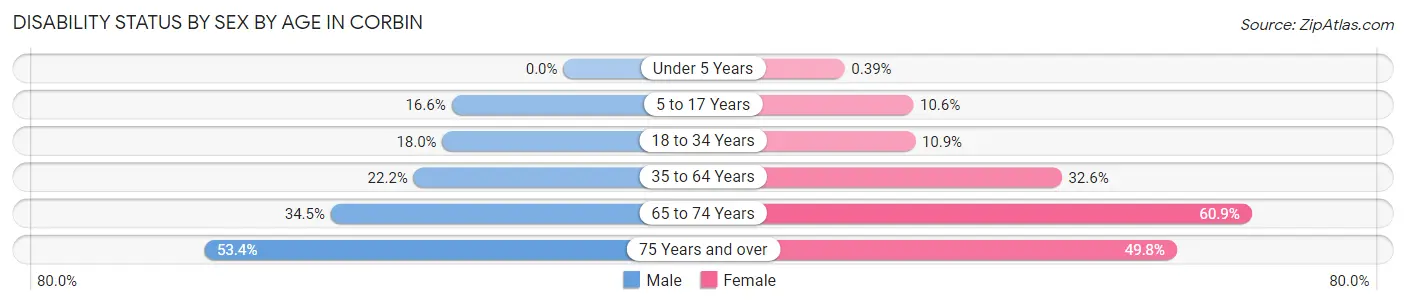
| Age Bracket | Male | Female |
| Under 5 Years | 0 (0.0%) | 1 (0.4%) |
| 5 to 17 Years | 136 (16.6%) | 89 (10.6%) |
| 18 to 34 Years | 149 (17.9%) | 82 (10.9%) |
| 35 to 64 Years | 313 (22.2%) | 505 (32.6%) |
| 65 to 74 Years | 125 (34.5%) | 286 (60.9%) |
| 75 Years and over | 127 (53.4%) | 200 (49.7%) |
Disability Class by Sex by Age in Corbin
Disability Class: Hearing Difficulty
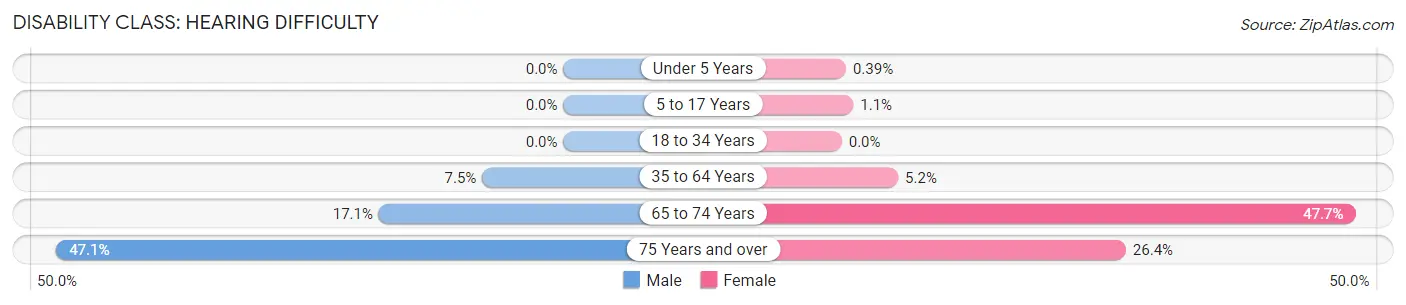
| Age Bracket | Male | Female |
| Under 5 Years | 0 (0.0%) | 1 (0.4%) |
| 5 to 17 Years | 0 (0.0%) | 9 (1.1%) |
| 18 to 34 Years | 0 (0.0%) | 0 (0.0%) |
| 35 to 64 Years | 106 (7.5%) | 81 (5.2%) |
| 65 to 74 Years | 62 (17.1%) | 224 (47.7%) |
| 75 Years and over | 112 (47.1%) | 106 (26.4%) |
Disability Class: Vision Difficulty
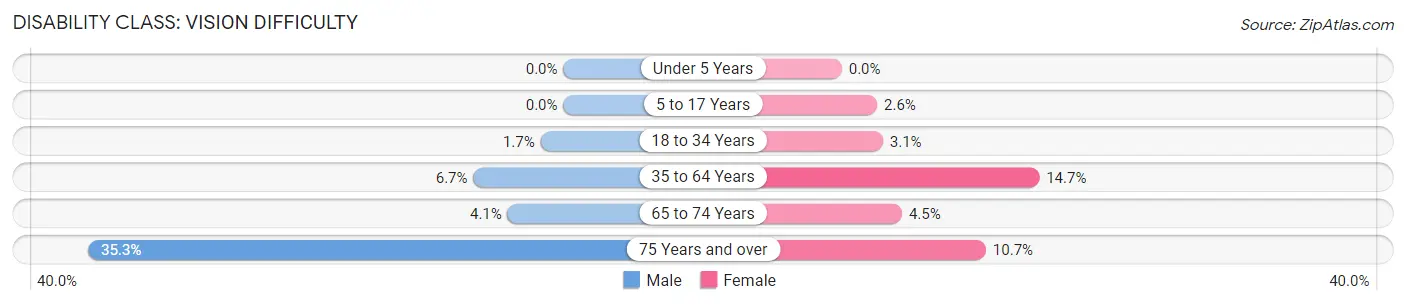
| Age Bracket | Male | Female |
| Under 5 Years | 0 (0.0%) | 0 (0.0%) |
| 5 to 17 Years | 0 (0.0%) | 22 (2.6%) |
| 18 to 34 Years | 14 (1.7%) | 23 (3.0%) |
| 35 to 64 Years | 94 (6.7%) | 227 (14.7%) |
| 65 to 74 Years | 15 (4.1%) | 21 (4.5%) |
| 75 Years and over | 84 (35.3%) | 43 (10.7%) |
Disability Class: Cognitive Difficulty
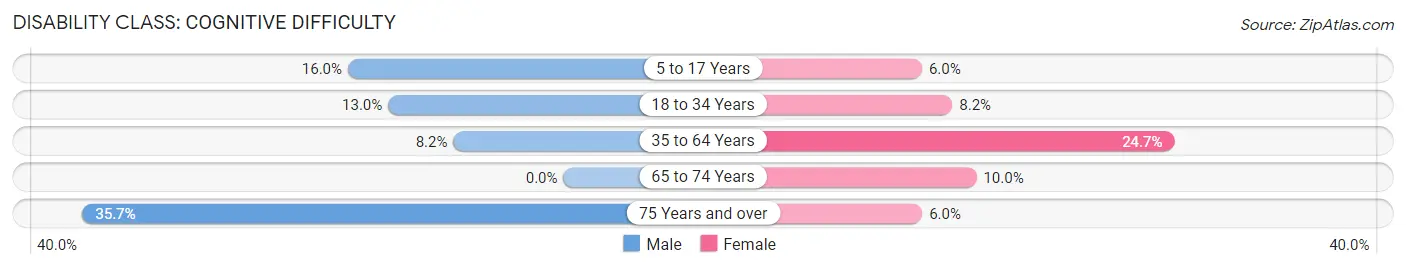
| Age Bracket | Male | Female |
| 5 to 17 Years | 131 (16.0%) | 50 (5.9%) |
| 18 to 34 Years | 108 (13.0%) | 62 (8.2%) |
| 35 to 64 Years | 115 (8.2%) | 382 (24.7%) |
| 65 to 74 Years | 0 (0.0%) | 47 (10.0%) |
| 75 Years and over | 85 (35.7%) | 24 (6.0%) |
Disability Class: Ambulatory Difficulty
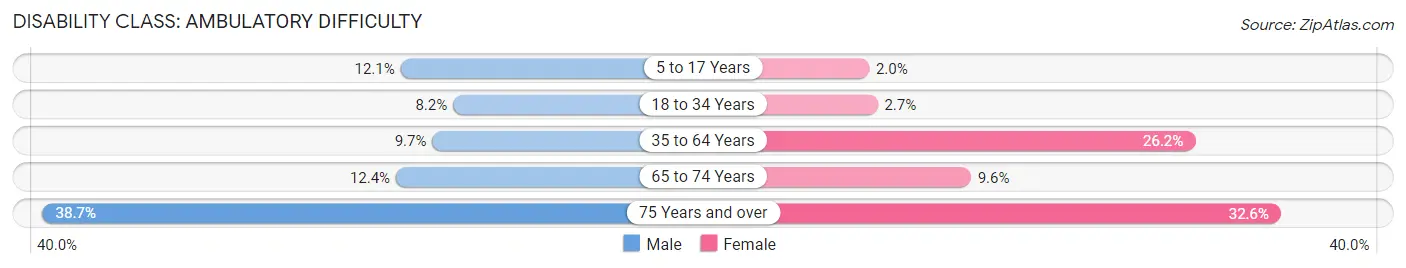
| Age Bracket | Male | Female |
| 5 to 17 Years | 99 (12.1%) | 17 (2.0%) |
| 18 to 34 Years | 68 (8.2%) | 20 (2.6%) |
| 35 to 64 Years | 137 (9.7%) | 406 (26.2%) |
| 65 to 74 Years | 45 (12.4%) | 45 (9.6%) |
| 75 Years and over | 92 (38.7%) | 131 (32.6%) |
Disability Class: Self-Care Difficulty

| Age Bracket | Male | Female |
| 5 to 17 Years | 105 (12.8%) | 9 (1.1%) |
| 18 to 34 Years | 23 (2.8%) | 3 (0.4%) |
| 35 to 64 Years | 99 (7.0%) | 243 (15.7%) |
| 65 to 74 Years | 0 (0.0%) | 0 (0.0%) |
| 75 Years and over | 29 (12.2%) | 38 (9.5%) |
Technology Access in Corbin
Computing Device Access in Corbin
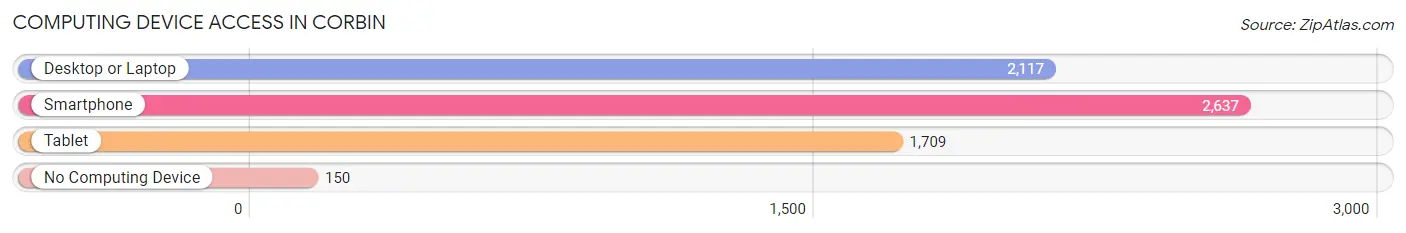
| Device Type | # Households | % Households |
| Desktop or Laptop | 2,117 | 71.0% |
| Smartphone | 2,637 | 88.4% |
| Tablet | 1,709 | 57.3% |
| No Computing Device | 150 | 5.0% |
| Total | 2,984 | 100.0% |
Internet Access in Corbin
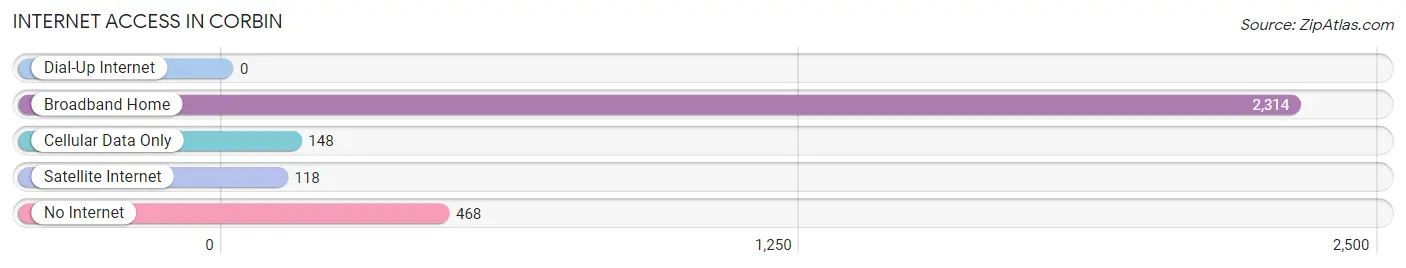
| Internet Type | # Households | % Households |
| Dial-Up Internet | 0 | 0.0% |
| Broadband Home | 2,314 | 77.5% |
| Cellular Data Only | 148 | 5.0% |
| Satellite Internet | 118 | 4.0% |
| No Internet | 468 | 15.7% |
| Total | 2,984 | 100.0% |
Corbin Summary
Corbin, Kentucky is a small city located in the southeastern part of the state, in the foothills of the Appalachian Mountains. It is the county seat of Whitley County and is situated along the Cumberland River. The city has a population of 7,304 as of the 2010 census, making it the largest city in the county.
History
Corbin was founded in 1883 by the Louisville and Nashville Railroad. The city was named after James Corbin, a railroad official. The city was incorporated in 1884 and quickly became a major hub for the railroad. The city was also home to a major lumber industry, which provided jobs for many of the city’s residents.
In the early 20th century, Corbin was a major stop on the Dixie Highway, a major north-south route that connected the Midwest to the South. The city was also home to a major tobacco industry, which provided jobs for many of the city’s residents.
Geography
Corbin is located in southeastern Kentucky, in the foothills of the Appalachian Mountains. The city is situated along the Cumberland River, which flows through the city. The city is located at the intersection of US 25 and US 25E, which connect the city to Lexington and Knoxville, Tennessee.
The city has a total area of 8.2 square miles, of which 8.1 square miles is land and 0.1 square miles is water. The city is located at an elevation of 890 feet above sea level.
Economy
Corbin’s economy is largely based on the service industry, with many of the city’s residents employed in retail, hospitality, and healthcare. The city is also home to a number of manufacturing companies, including Corbin Industries, which produces automotive parts, and Corbin Steel, which produces steel products.
The city is also home to a number of educational institutions, including the University of the Cumberlands, which is a private university, and Southeast Kentucky Community and Technical College, which is a public two-year college.
Demographics
As of the 2010 census, Corbin had a population of 7,304. The racial makeup of the city was 92.3% White, 4.3% African American, 0.3% Native American, 0.7% Asian, 0.1% Pacific Islander, 0.7% from other races, and 1.6% from two or more races. Hispanic or Latino of any race were 1.9% of the population.
The median income for a household in the city was $30,945, and the median income for a family was $37,917. The per capita income for the city was $17,845. About 17.2% of families and 20.3% of the population were below the poverty line, including 28.2% of those under age 18 and 14.2% of those age 65 or over.
Corbin is a small city with a rich history and a diverse economy. The city is home to a number of educational institutions, manufacturing companies, and service industry businesses, which provide jobs for many of the city’s residents. The city is also home to a number of cultural attractions, including the Corbin Arts Center and the Corbin Historic District.
Common Questions
What is Per Capita Income in Corbin?
Per Capita income in Corbin is $26,822.
What is the Median Family Income in Corbin?
Median Family Income in Corbin is $68,578.
What is the Median Household income in Corbin?
Median Household Income in Corbin is $52,929.
What is Income or Wage Gap in Corbin?
Income or Wage Gap in Corbin is 50.8%.
Women in Corbin earn 49.2 cents for every dollar earned by a man.
What is Inequality or Gini Index in Corbin?
Inequality or Gini Index in Corbin is 0.49.
What is the Total Population of Corbin?
Total Population of Corbin is 8,611.
What is the Total Male Population of Corbin?
Total Male Population of Corbin is 4,117.
What is the Total Female Population of Corbin?
Total Female Population of Corbin is 4,494.
What is the Ratio of Males per 100 Females in Corbin?
There are 91.61 Males per 100 Females in Corbin.
What is the Ratio of Females per 100 Males in Corbin?
There are 109.16 Females per 100 Males in Corbin.
What is the Median Population Age in Corbin?
Median Population Age in Corbin is 39.1 Years.
What is the Average Family Size in Corbin
Average Family Size in Corbin is 3.4 People.
What is the Average Household Size in Corbin
Average Household Size in Corbin is 2.8 People.
How Large is the Labor Force in Corbin?
There are 3,257 People in the Labor Forcein in Corbin.
What is the Percentage of People in the Labor Force in Corbin?
50.1% of People are in the Labor Force in Corbin.
What is the Unemployment Rate in Corbin?
Unemployment Rate in Corbin is 4.6%.