Providence, KY Map & Demographics
Providence Map
Providence Overview
$24,983
PER CAPITA INCOME
$55,711
AVG FAMILY INCOME
$49,954
AVG HOUSEHOLD INCOME
18.1%
WAGE / INCOME GAP [ % ]
81.9¢/ $1
WAGE / INCOME GAP [ $ ]
0.40
INEQUALITY / GINI INDEX
2,883
TOTAL POPULATION
1,586
MALE POPULATION
1,297
FEMALE POPULATION
122.28
MALES / 100 FEMALES
81.78
FEMALES / 100 MALES
46.3
MEDIAN AGE
2.5
AVG FAMILY SIZE
2.2
AVG HOUSEHOLD SIZE
1,303
LABOR FORCE [ PEOPLE ]
52.0%
PERCENT IN LABOR FORCE
8.2%
UNEMPLOYMENT RATE
Providence Zip Codes
Providence Area Codes
Income in Providence
Income Overview in Providence
Per Capita Income in Providence is $24,983, while median incomes of families and households are $55,711 and $49,954 respectively.
| Characteristic | Number | Measure |
| Per Capita Income | 2,883 | $24,983 |
| Median Family Income | 848 | $55,711 |
| Mean Family Income | 848 | $63,256 |
| Median Household Income | 1,297 | $49,954 |
| Mean Household Income | 1,297 | $55,054 |
| Income Deficit | 848 | $0 |
| Wage / Income Gap (%) | 2,883 | 18.07% |
| Wage / Income Gap ($) | 2,883 | 81.93¢ per $1 |
| Gini / Inequality Index | 2,883 | 0.40 |
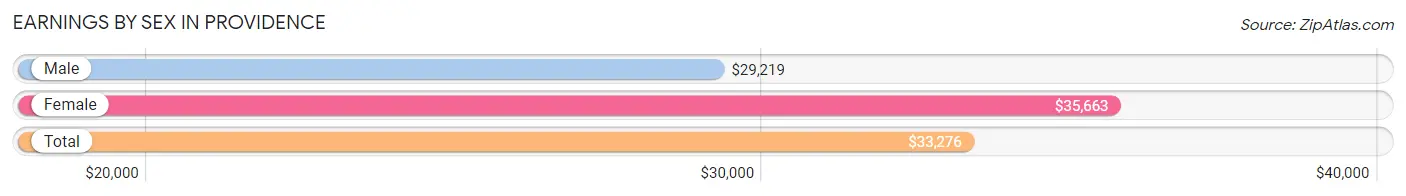
Earnings by Sex in Providence
Average Earnings in Providence are $33,276, $29,219 for men and $35,663 for women, a difference of 18.1%.
| Sex | Number | Average Earnings |
| Male | 755 (55.2%) | $29,219 |
| Female | 612 (44.8%) | $35,663 |
| Total | 1,367 (100.0%) | $33,276 |
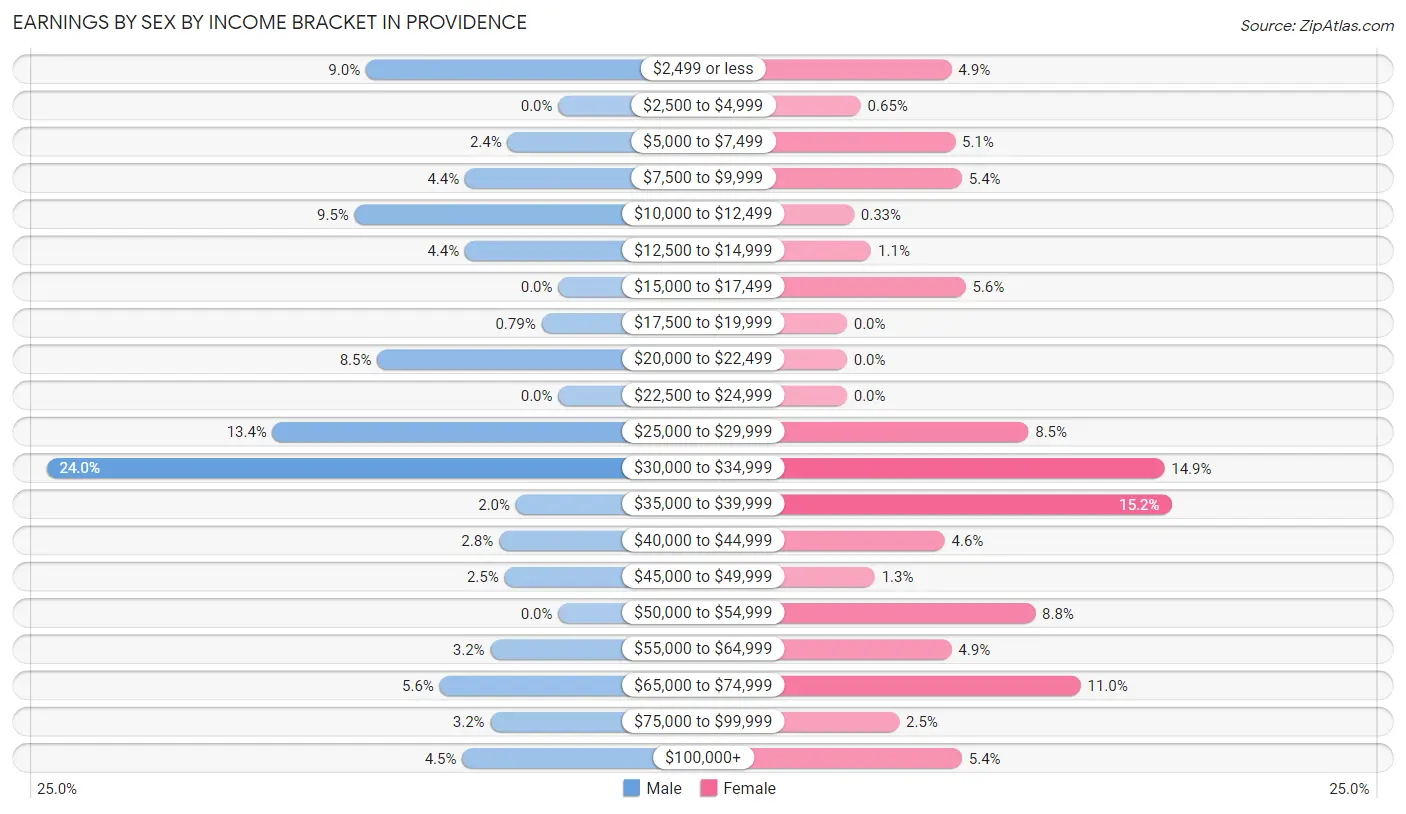
Earnings by Sex by Income Bracket in Providence
The most common earnings brackets in Providence are $30,000 to $34,999 for men (181 | 24.0%) and $35,000 to $39,999 for women (93 | 15.2%).
| Income | Male | Female |
| $2,499 or less | 68 (9.0%) | 30 (4.9%) |
| $2,500 to $4,999 | 0 (0.0%) | 4 (0.6%) |
| $5,000 to $7,499 | 18 (2.4%) | 31 (5.1%) |
| $7,500 to $9,999 | 33 (4.4%) | 33 (5.4%) |
| $10,000 to $12,499 | 72 (9.5%) | 2 (0.3%) |
| $12,500 to $14,999 | 33 (4.4%) | 7 (1.1%) |
| $15,000 to $17,499 | 0 (0.0%) | 34 (5.6%) |
| $17,500 to $19,999 | 6 (0.8%) | 0 (0.0%) |
| $20,000 to $22,499 | 64 (8.5%) | 0 (0.0%) |
| $22,500 to $24,999 | 0 (0.0%) | 0 (0.0%) |
| $25,000 to $29,999 | 101 (13.4%) | 52 (8.5%) |
| $30,000 to $34,999 | 181 (24.0%) | 91 (14.9%) |
| $35,000 to $39,999 | 15 (2.0%) | 93 (15.2%) |
| $40,000 to $44,999 | 21 (2.8%) | 28 (4.6%) |
| $45,000 to $49,999 | 19 (2.5%) | 8 (1.3%) |
| $50,000 to $54,999 | 0 (0.0%) | 54 (8.8%) |
| $55,000 to $64,999 | 24 (3.2%) | 30 (4.9%) |
| $65,000 to $74,999 | 42 (5.6%) | 67 (11.0%) |
| $75,000 to $99,999 | 24 (3.2%) | 15 (2.5%) |
| $100,000+ | 34 (4.5%) | 33 (5.4%) |
| Total | 755 (100.0%) | 612 (100.0%) |
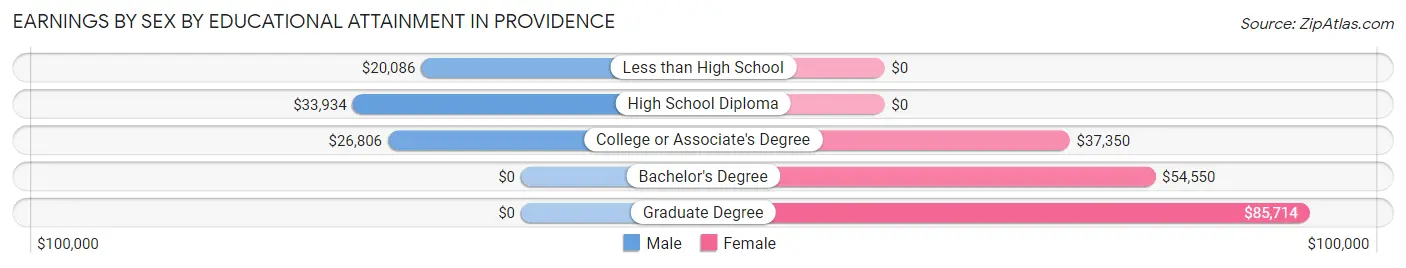
Earnings by Sex by Educational Attainment in Providence
Average earnings in Providence are $33,026 for men and $38,625 for women, a difference of 14.5%. Men with an educational attainment of high school diploma enjoy the highest average annual earnings of $33,934, while those with less than high school education earn the least with $20,086. Women with an educational attainment of graduate degree earn the most with the average annual earnings of $85,714, while those with college or associate's degree education have the smallest earnings of $37,350.
| Educational Attainment | Male Income | Female Income |
| Less than High School | $20,086 | $0 |
| High School Diploma | $33,934 | $0 |
| College or Associate's Degree | $26,806 | $37,350 |
| Bachelor's Degree | - | - |
| Graduate Degree | - | - |
| Total | $33,026 | $38,625 |
Family Income in Providence
Family Income Brackets in Providence
According to the Providence family income data, there are 228 families falling into the $50,000 to $74,999 income range, which is the most common income bracket and makes up 26.9% of all families.
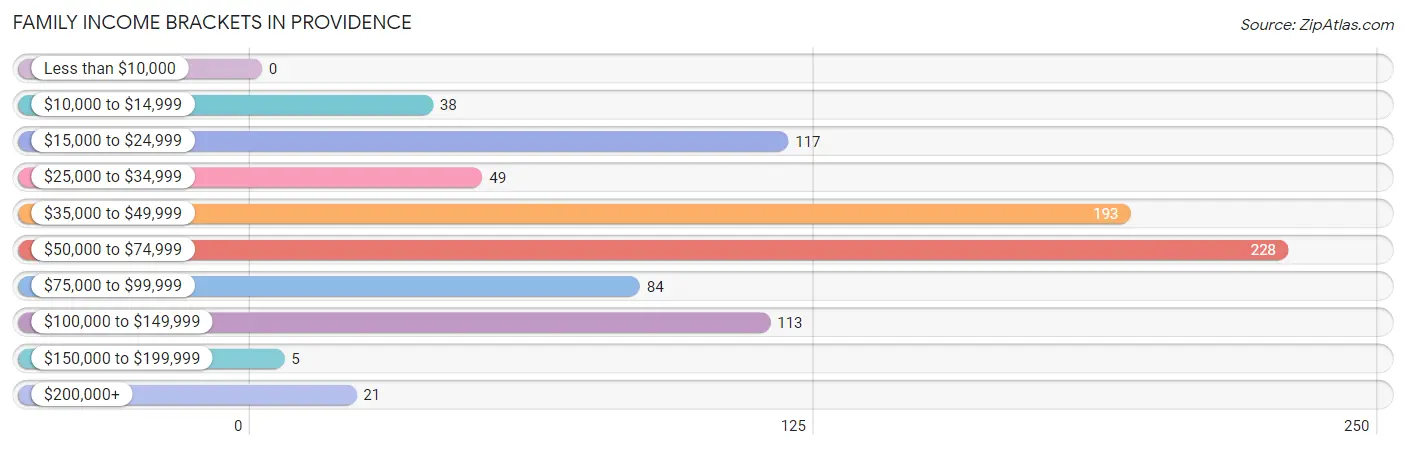
| Income Bracket | # Families | % Families |
| Less than $10,000 | 0 | 0.0% |
| $10,000 to $14,999 | 38 | 4.5% |
| $15,000 to $24,999 | 117 | 13.8% |
| $25,000 to $34,999 | 49 | 5.8% |
| $35,000 to $49,999 | 193 | 22.8% |
| $50,000 to $74,999 | 228 | 26.9% |
| $75,000 to $99,999 | 84 | 9.9% |
| $100,000 to $149,999 | 113 | 13.3% |
| $150,000 to $199,999 | 5 | 0.6% |
| $200,000+ | 21 | 2.5% |
Family Income by Famaliy Size in Providence
3-person families (191 | 22.5%) account for the highest median family income in Providence with $57,841 per family, while 2-person families (553 | 65.2%) have the highest median income of $27,817 per family member.
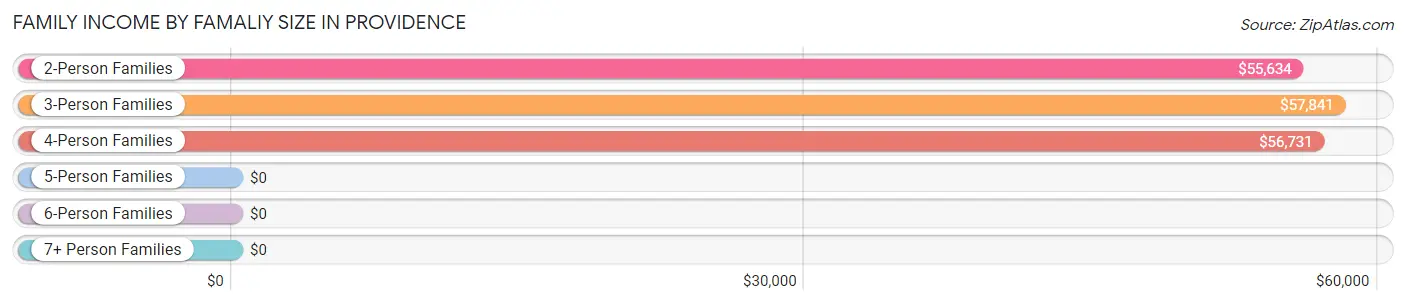
| Income Bracket | # Families | Median Income |
| 2-Person Families | 553 (65.2%) | $55,634 |
| 3-Person Families | 191 (22.5%) | $57,841 |
| 4-Person Families | 78 (9.2%) | $56,731 |
| 5-Person Families | 0 (0.0%) | $0 |
| 6-Person Families | 26 (3.1%) | $0 |
| 7+ Person Families | 0 (0.0%) | $0 |
| Total | 848 (100.0%) | $55,711 |
Family Income by Number of Earners in Providence
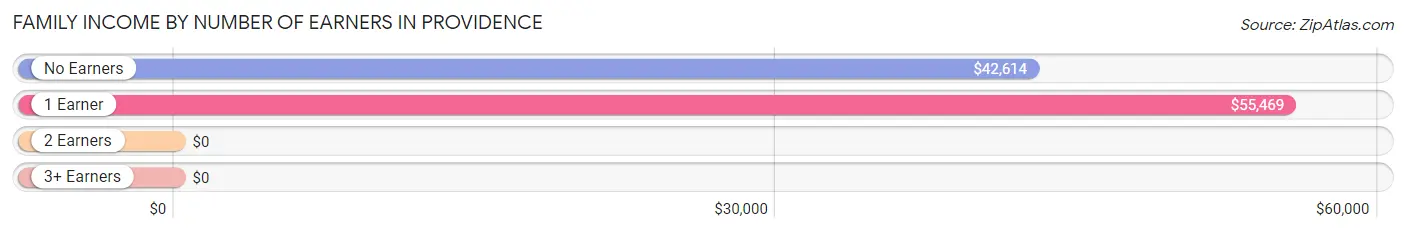
| Number of Earners | # Families | Median Income |
| No Earners | 199 (23.5%) | $42,614 |
| 1 Earner | 357 (42.1%) | $55,469 |
| 2 Earners | 169 (19.9%) | $0 |
| 3+ Earners | 123 (14.5%) | $0 |
| Total | 848 (100.0%) | $55,711 |
Household Income in Providence
Household Income Brackets in Providence
With 374 households falling in the category, the $50,000 to $74,999 income range is the most frequent in Providence, accounting for 28.8% of all households. In contrast, only 5 households (0.4%) fall into the $150,000 to $199,999 income bracket, making it the least populous group.
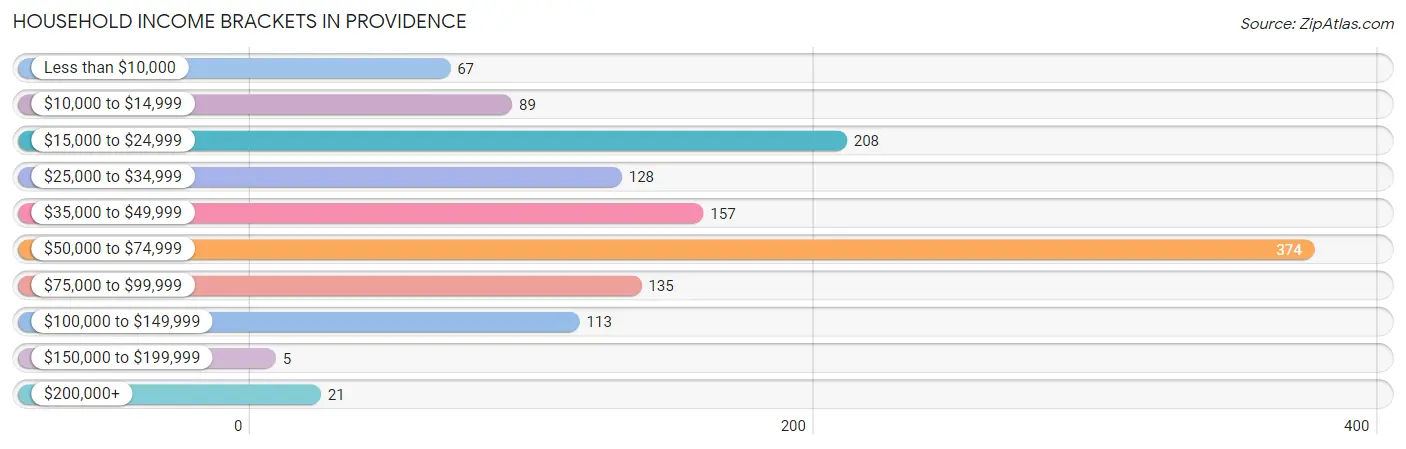
| Income Bracket | # Households | % Households |
| Less than $10,000 | 67 | 5.2% |
| $10,000 to $14,999 | 89 | 6.9% |
| $15,000 to $24,999 | 208 | 16.0% |
| $25,000 to $34,999 | 128 | 9.9% |
| $35,000 to $49,999 | 157 | 12.1% |
| $50,000 to $74,999 | 374 | 28.8% |
| $75,000 to $99,999 | 135 | 10.4% |
| $100,000 to $149,999 | 113 | 8.7% |
| $150,000 to $199,999 | 5 | 0.4% |
| $200,000+ | 21 | 1.6% |
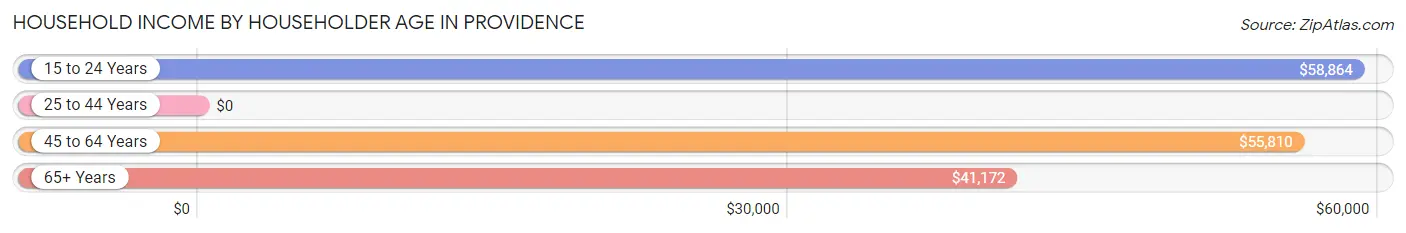
Household Income by Householder Age in Providence
The median household income in Providence is $49,954, with the highest median household income of $58,864 found in the 15 to 24 years age bracket for the primary householder. A total of 110 households (8.5%) fall into this category. Meanwhile, the 25 to 44 years age bracket for the primary householder has the lowest median household income of $0, with 275 households (21.2%) in this group.
| Income Bracket | # Households | Median Income |
| 15 to 24 Years | 110 (8.5%) | $58,864 |
| 25 to 44 Years | 275 (21.2%) | $0 |
| 45 to 64 Years | 547 (42.2%) | $55,810 |
| 65+ Years | 365 (28.1%) | $41,172 |
| Total | 1,297 (100.0%) | $49,954 |
Poverty in Providence
Income Below Poverty by Sex and Age in Providence
With 24.7% poverty level for males and 17.7% for females among the residents of Providence, 15 year old males and under 5 year old females are the most vulnerable to poverty, with 19 males (100.0%) and 24 females (100.0%) in their respective age groups living below the poverty level.
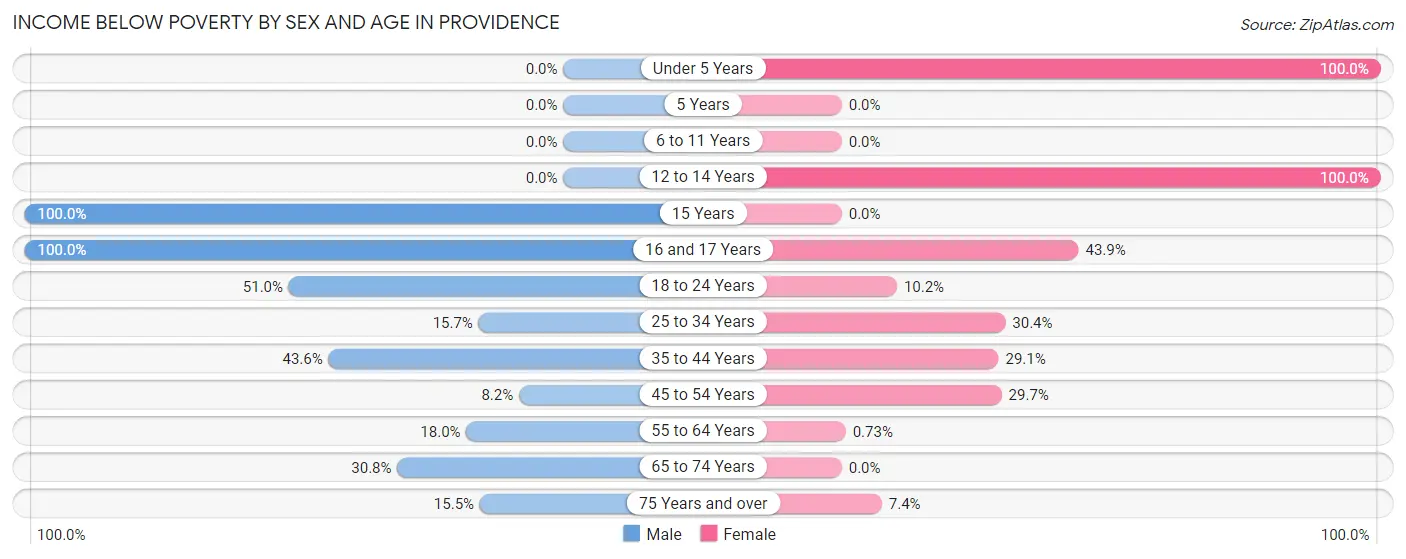
| Age Bracket | Male | Female |
| Under 5 Years | 0 (0.0%) | 24 (100.0%) |
| 5 Years | 0 (0.0%) | 0 (0.0%) |
| 6 to 11 Years | 0 (0.0%) | 0 (0.0%) |
| 12 to 14 Years | 0 (0.0%) | 24 (100.0%) |
| 15 Years | 19 (100.0%) | 0 (0.0%) |
| 16 and 17 Years | 29 (100.0%) | 29 (43.9%) |
| 18 to 24 Years | 107 (50.9%) | 13 (10.2%) |
| 25 to 34 Years | 11 (15.7%) | 17 (30.4%) |
| 35 to 44 Years | 85 (43.6%) | 55 (29.1%) |
| 45 to 54 Years | 24 (8.2%) | 54 (29.7%) |
| 55 to 64 Years | 50 (18.0%) | 2 (0.7%) |
| 65 to 74 Years | 53 (30.8%) | 0 (0.0%) |
| 75 Years and over | 11 (15.5%) | 9 (7.4%) |
| Total | 389 (24.7%) | 227 (17.7%) |
Income Above Poverty by Sex and Age in Providence
According to the poverty statistics in Providence, males aged under 5 years and females aged 6 to 11 years are the age groups that are most secure financially, with 100.0% of males and 100.0% of females in these age groups living above the poverty line.
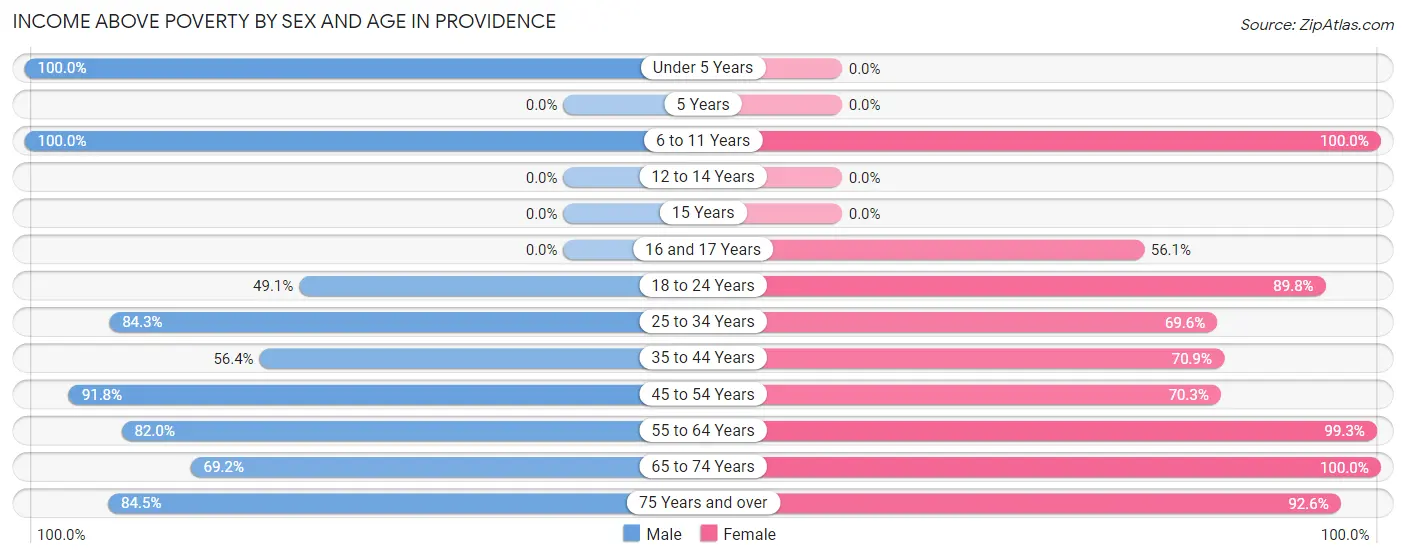
| Age Bracket | Male | Female |
| Under 5 Years | 89 (100.0%) | 0 (0.0%) |
| 5 Years | 0 (0.0%) | 0 (0.0%) |
| 6 to 11 Years | 152 (100.0%) | 69 (100.0%) |
| 12 to 14 Years | 0 (0.0%) | 0 (0.0%) |
| 15 Years | 0 (0.0%) | 0 (0.0%) |
| 16 and 17 Years | 0 (0.0%) | 37 (56.1%) |
| 18 to 24 Years | 103 (49.0%) | 114 (89.8%) |
| 25 to 34 Years | 59 (84.3%) | 39 (69.6%) |
| 35 to 44 Years | 110 (56.4%) | 134 (70.9%) |
| 45 to 54 Years | 268 (91.8%) | 128 (70.3%) |
| 55 to 64 Years | 228 (82.0%) | 271 (99.3%) |
| 65 to 74 Years | 119 (69.2%) | 153 (100.0%) |
| 75 Years and over | 60 (84.5%) | 112 (92.6%) |
| Total | 1,188 (75.3%) | 1,057 (82.3%) |
Income Below Poverty Among Married-Couple Families in Providence
The poverty statistics for married-couple families in Providence show that 11.5% or 54 of the total 470 families live below the poverty line. Families with 1 or 2 children have the highest poverty rate of 30.6%, comprising of 26 families. On the other hand, families with no children have the lowest poverty rate of 7.3%, which includes 28 families.
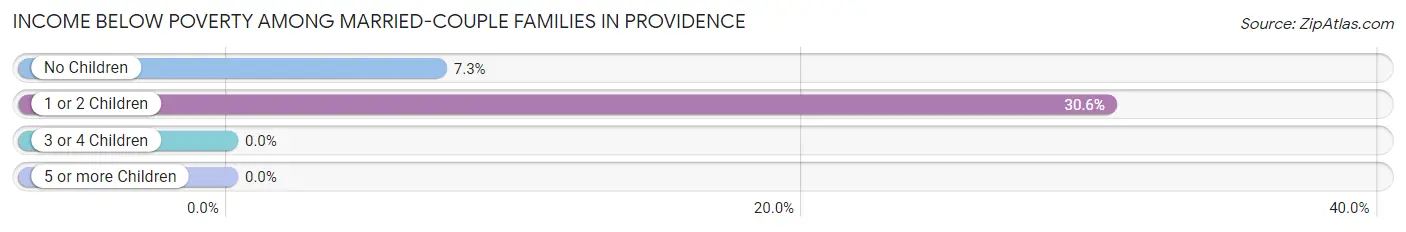
| Children | Above Poverty | Below Poverty |
| No Children | 357 (92.7%) | 28 (7.3%) |
| 1 or 2 Children | 59 (69.4%) | 26 (30.6%) |
| 3 or 4 Children | 0 (0.0%) | 0 (0.0%) |
| 5 or more Children | 0 (0.0%) | 0 (0.0%) |
| Total | 416 (88.5%) | 54 (11.5%) |
Income Below Poverty Among Single-Parent Households in Providence
According to the poverty data in Providence, 24.0% or 38 single-father households and 22.7% or 50 single-mother households are living below the poverty line. Among single-father households, those with 1 or 2 children have the highest poverty rate, with 38 households (100.0%) experiencing poverty. Likewise, among single-mother households, those with no children have the highest poverty rate, with 29 households (56.9%) falling below the poverty line.
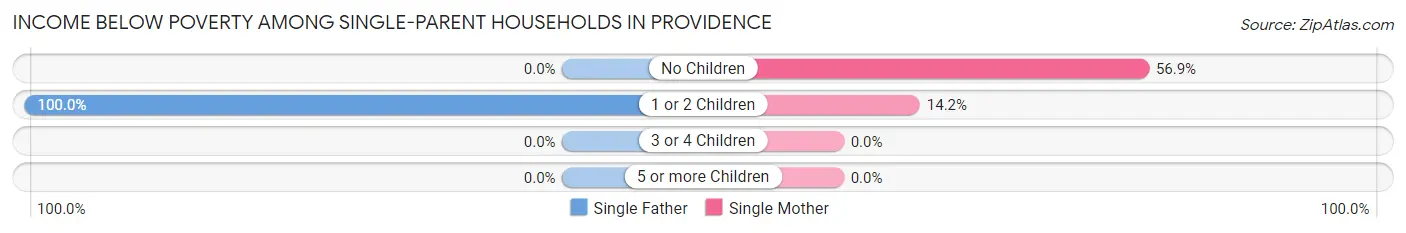
| Children | Single Father | Single Mother |
| No Children | 0 (0.0%) | 29 (56.9%) |
| 1 or 2 Children | 38 (100.0%) | 21 (14.2%) |
| 3 or 4 Children | 0 (0.0%) | 0 (0.0%) |
| 5 or more Children | 0 (0.0%) | 0 (0.0%) |
| Total | 38 (24.0%) | 50 (22.7%) |
Income Below Poverty Among Married-Couple vs Single-Parent Households in Providence
The poverty data for Providence shows that 54 of the married-couple family households (11.5%) and 88 of the single-parent households (23.3%) are living below the poverty level. Within the married-couple family households, those with 1 or 2 children have the highest poverty rate, with 26 households (30.6%) falling below the poverty line. Among the single-parent households, those with 1 or 2 children have the highest poverty rate, with 59 household (31.7%) living below poverty.
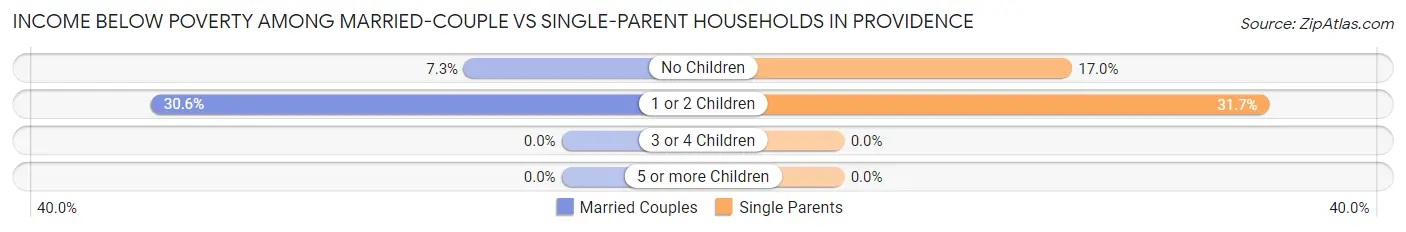
| Children | Married-Couple Families | Single-Parent Households |
| No Children | 28 (7.3%) | 29 (17.0%) |
| 1 or 2 Children | 26 (30.6%) | 59 (31.7%) |
| 3 or 4 Children | 0 (0.0%) | 0 (0.0%) |
| 5 or more Children | 0 (0.0%) | 0 (0.0%) |
| Total | 54 (11.5%) | 88 (23.3%) |
Race in Providence
The most populous races in Providence are White / Caucasian (2,455 | 85.2%), Black / African American (407 | 14.1%), and Two or more Races (21 | 0.7%).
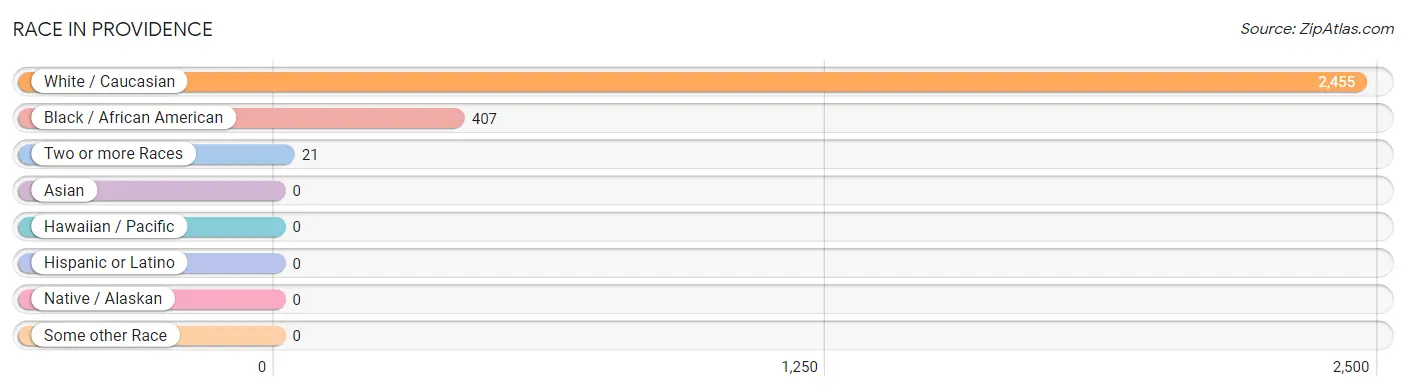
| Race | # Population | % Population |
| Asian | 0 | 0.0% |
| Black / African American | 407 | 14.1% |
| Hawaiian / Pacific | 0 | 0.0% |
| Hispanic or Latino | 0 | 0.0% |
| Native / Alaskan | 0 | 0.0% |
| White / Caucasian | 2,455 | 85.2% |
| Two or more Races | 21 | 0.7% |
| Some other Race | 0 | 0.0% |
| Total | 2,883 | 100.0% |
Ancestry in Providence
The most populous ancestries reported in Providence are English (579 | 20.1%), American (259 | 9.0%), Irish (219 | 7.6%), German (161 | 5.6%), and European (94 | 3.3%), together accounting for 45.5% of all Providence residents.
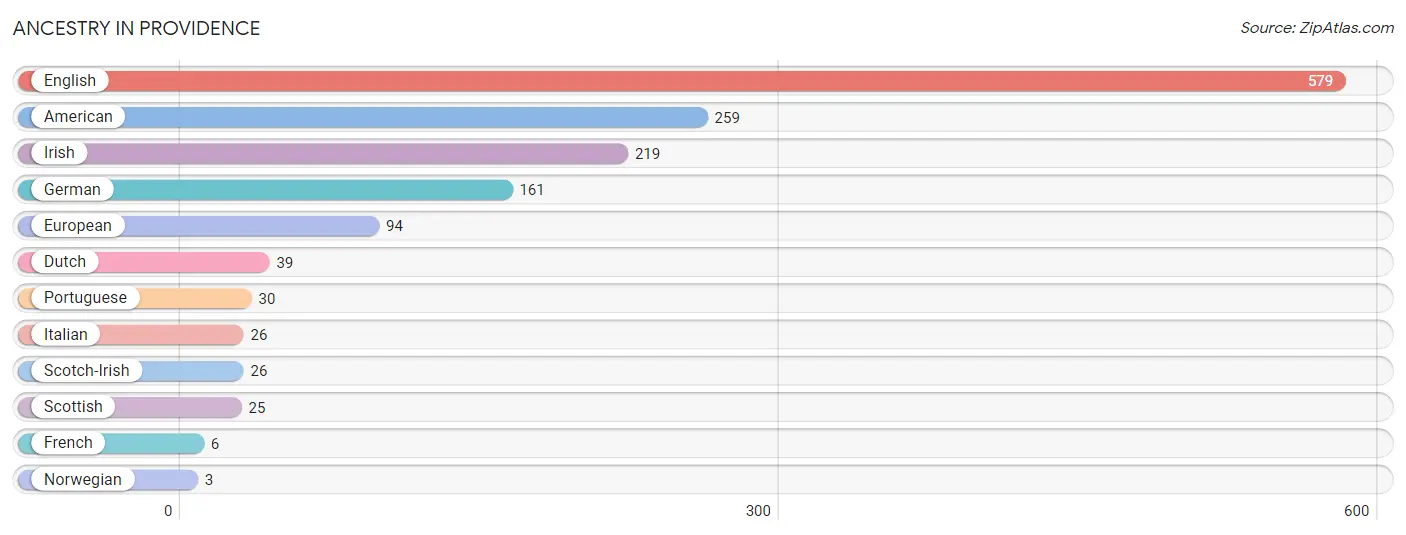
| Ancestry | # Population | % Population |
| American | 259 | 9.0% |
| Dutch | 39 | 1.3% |
| English | 579 | 20.1% |
| European | 94 | 3.3% |
| French | 6 | 0.2% |
| German | 161 | 5.6% |
| Irish | 219 | 7.6% |
| Italian | 26 | 0.9% |
| Norwegian | 3 | 0.1% |
| Portuguese | 30 | 1.0% |
| Scotch-Irish | 26 | 0.9% |
| Scottish | 25 | 0.9% | View All 12 Rows |
Immigrants in Providence

| Immigration Origin | # Population | % Population | View All 0 Rows |
Sex and Age in Providence
Sex and Age in Providence
The most populous age groups in Providence are 45 to 49 Years (172 | 10.8%) for men and 60 to 64 Years (198 | 15.3%) for women.
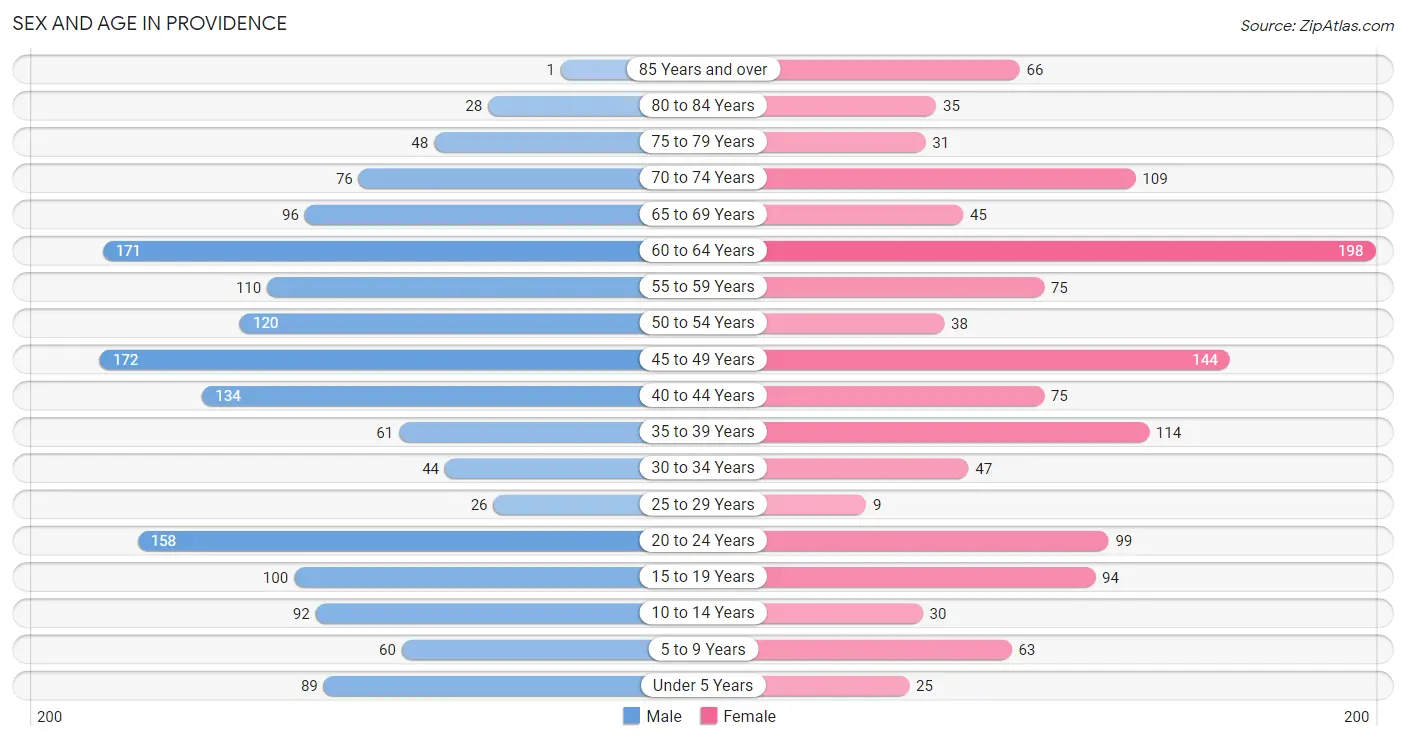
| Age Bracket | Male | Female |
| Under 5 Years | 89 (5.6%) | 25 (1.9%) |
| 5 to 9 Years | 60 (3.8%) | 63 (4.9%) |
| 10 to 14 Years | 92 (5.8%) | 30 (2.3%) |
| 15 to 19 Years | 100 (6.3%) | 94 (7.2%) |
| 20 to 24 Years | 158 (10.0%) | 99 (7.6%) |
| 25 to 29 Years | 26 (1.6%) | 9 (0.7%) |
| 30 to 34 Years | 44 (2.8%) | 47 (3.6%) |
| 35 to 39 Years | 61 (3.8%) | 114 (8.8%) |
| 40 to 44 Years | 134 (8.5%) | 75 (5.8%) |
| 45 to 49 Years | 172 (10.8%) | 144 (11.1%) |
| 50 to 54 Years | 120 (7.6%) | 38 (2.9%) |
| 55 to 59 Years | 110 (6.9%) | 75 (5.8%) |
| 60 to 64 Years | 171 (10.8%) | 198 (15.3%) |
| 65 to 69 Years | 96 (6.0%) | 45 (3.5%) |
| 70 to 74 Years | 76 (4.8%) | 109 (8.4%) |
| 75 to 79 Years | 48 (3.0%) | 31 (2.4%) |
| 80 to 84 Years | 28 (1.8%) | 35 (2.7%) |
| 85 Years and over | 1 (0.1%) | 66 (5.1%) |
| Total | 1,586 (100.0%) | 1,297 (100.0%) |
Families and Households in Providence
Median Family Size in Providence
The median family size in Providence is 2.55 persons per family, with married-couple families (470 | 55.4%) accounting for the largest median family size of 2.74 persons per family. On the other hand, single male/father families (158 | 18.6%) represent the smallest median family size with 1.73 persons per family.
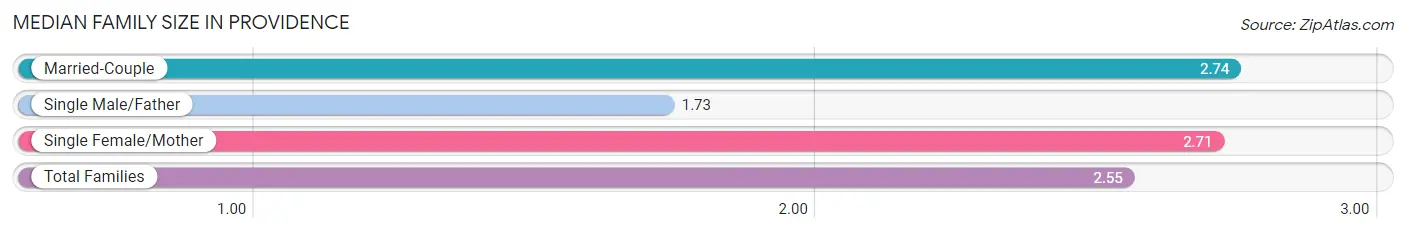
| Family Type | # Families | Family Size |
| Married-Couple | 470 (55.4%) | 2.74 |
| Single Male/Father | 158 (18.6%) | 1.73 |
| Single Female/Mother | 220 (25.9%) | 2.71 |
| Total Families | 848 (100.0%) | 2.55 |
Median Household Size in Providence
The median household size in Providence is 2.19 persons per household, with single female/mother households (220 | 17.0%) accounting for the largest median household size of 3.4 persons per household. non-family households (449 | 34.6%) represent the smallest median household size with 1.06 persons per household.
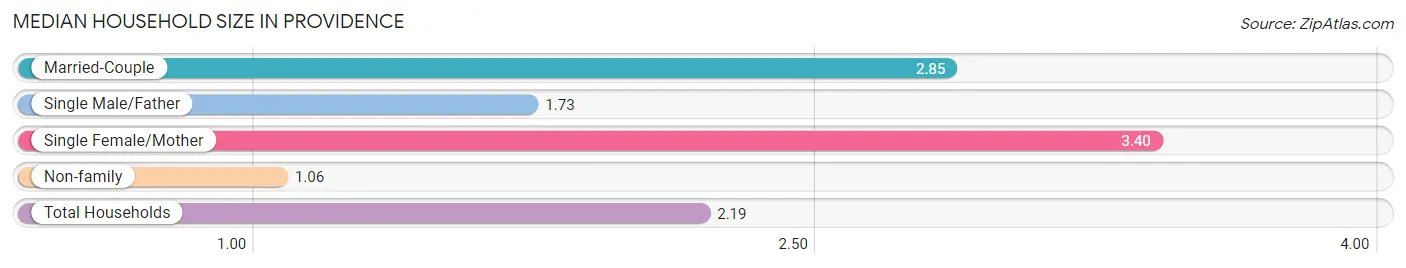
| Household Type | # Households | Household Size |
| Married-Couple | 470 (36.2%) | 2.85 |
| Single Male/Father | 158 (12.2%) | 1.73 |
| Single Female/Mother | 220 (17.0%) | 3.40 |
| Non-family | 449 (34.6%) | 1.06 |
| Total Households | 1,297 (100.0%) | 2.19 |
Household Size by Marriage Status in Providence
Out of a total of 1,297 households in Providence, 848 (65.4%) are family households, while 449 (34.6%) are nonfamily households. The most numerous type of family households are 2-person households, comprising 455, and the most common type of nonfamily households are 1-person households, comprising 423.
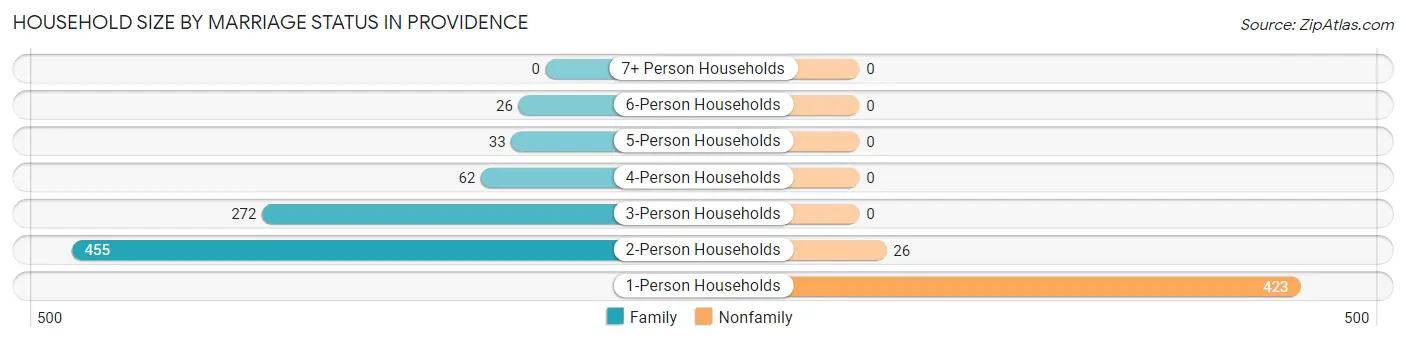
| Household Size | Family Households | Nonfamily Households |
| 1-Person Households | - | 423 (32.6%) |
| 2-Person Households | 455 (35.1%) | 26 (2.0%) |
| 3-Person Households | 272 (21.0%) | 0 (0.0%) |
| 4-Person Households | 62 (4.8%) | 0 (0.0%) |
| 5-Person Households | 33 (2.5%) | 0 (0.0%) |
| 6-Person Households | 26 (2.0%) | 0 (0.0%) |
| 7+ Person Households | 0 (0.0%) | 0 (0.0%) |
| Total | 848 (65.4%) | 449 (34.6%) |
Female Fertility in Providence
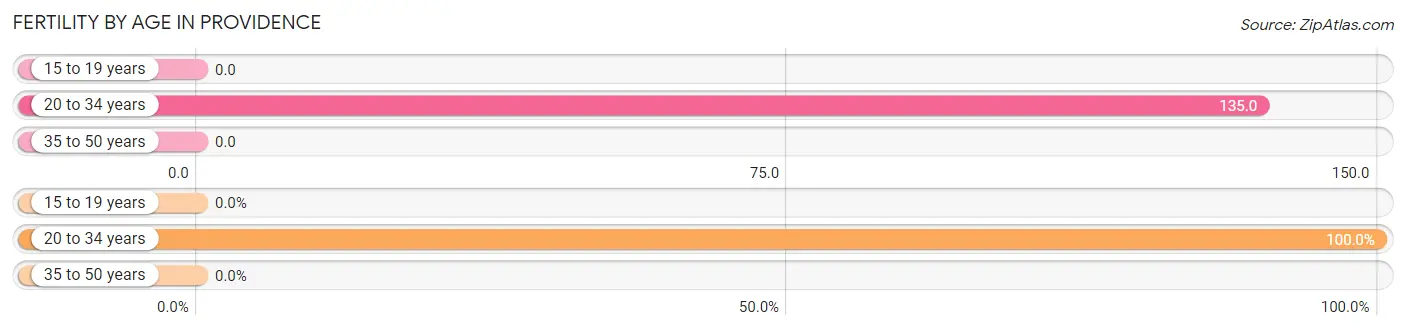
Fertility by Age in Providence
Average fertility rate in Providence is 36.0 births per 1,000 women. Women in the age bracket of 20 to 34 years have the highest fertility rate with 135.0 births per 1,000 women. Women in the age bracket of 20 to 34 years acount for 100.0% of all women with births.
| Age Bracket | Women with Births | Births / 1,000 Women |
| 15 to 19 years | 0 (0.0%) | 0.0 |
| 20 to 34 years | 21 (100.0%) | 135.0 |
| 35 to 50 years | 0 (0.0%) | 0.0 |
| Total | 21 (100.0%) | 36.0 |
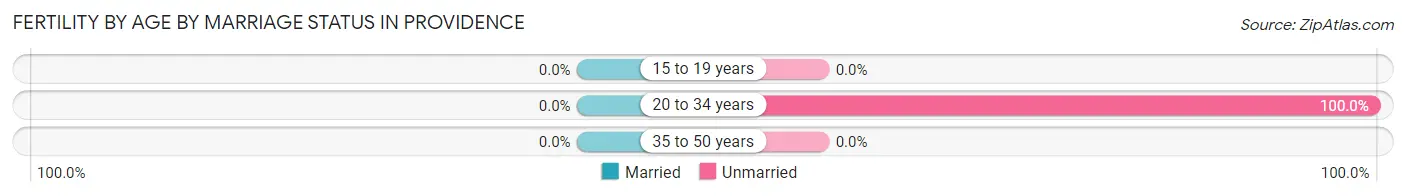
Fertility by Age by Marriage Status in Providence
| Age Bracket | Married | Unmarried |
| 15 to 19 years | 0 (0.0%) | 0 (0.0%) |
| 20 to 34 years | 0 (0.0%) | 21 (100.0%) |
| 35 to 50 years | 0 (0.0%) | 0 (0.0%) |
| Total | 0 (0.0%) | 21 (100.0%) |
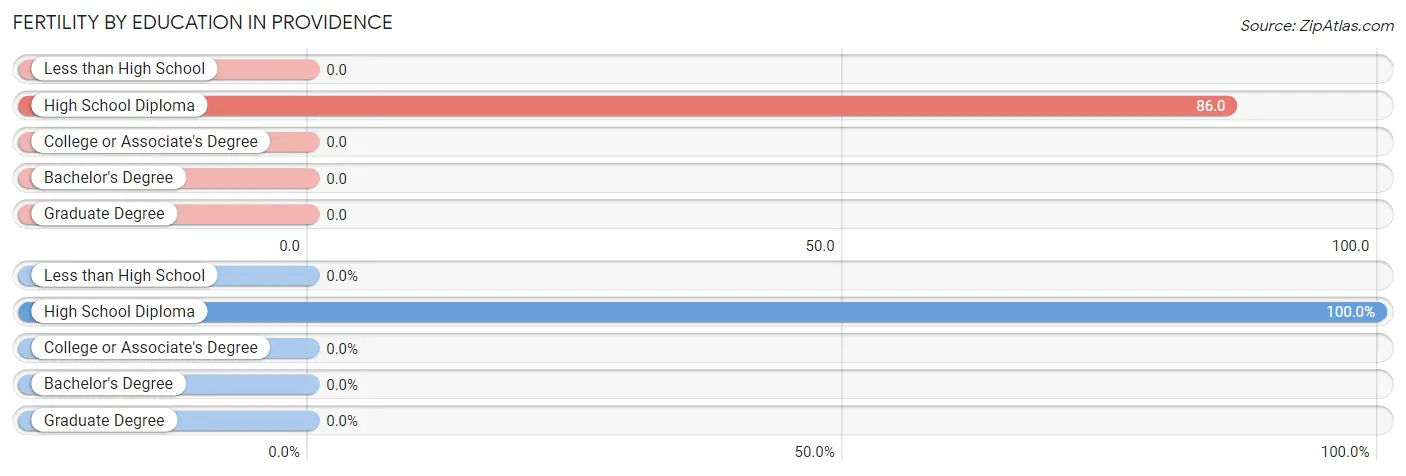
Fertility by Education in Providence
| Educational Attainment | Women with Births | Births / 1,000 Women |
| Less than High School | 0 (0.0%) | 0.0 |
| High School Diploma | 21 (100.0%) | 86.0 |
| College or Associate's Degree | 0 (0.0%) | 0.0 |
| Bachelor's Degree | 0 (0.0%) | 0.0 |
| Graduate Degree | 0 (0.0%) | 0.0 |
| Total | 21 (100.0%) | 36.0 |
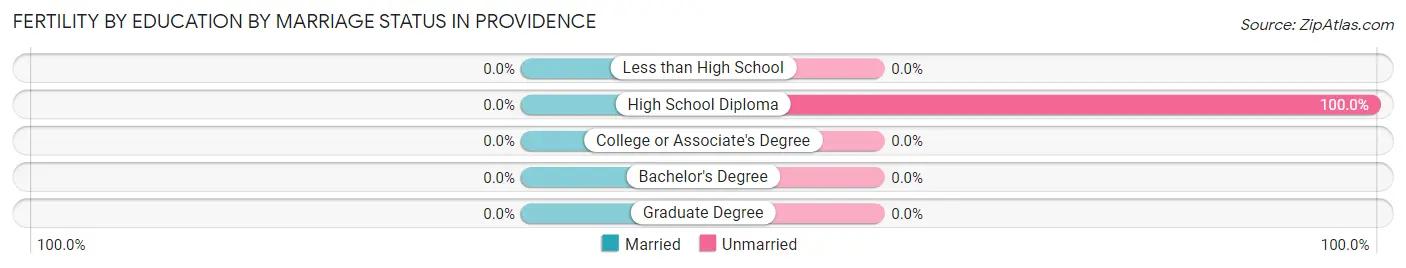
Fertility by Education by Marriage Status in Providence
| Educational Attainment | Married | Unmarried |
| Less than High School | 0 (0.0%) | 0 (0.0%) |
| High School Diploma | 0 (0.0%) | 21 (100.0%) |
| College or Associate's Degree | 0 (0.0%) | 0 (0.0%) |
| Bachelor's Degree | 0 (0.0%) | 0 (0.0%) |
| Graduate Degree | 0 (0.0%) | 0 (0.0%) |
| Total | 0 (0.0%) | 21 (100.0%) |
Employment Characteristics in Providence
Employment by Class of Employer in Providence
Among the 1,181 employed individuals in Providence, private company employees (905 | 76.6%), self-employed (not incorporated) (132 | 11.2%), and local government employees (95 | 8.0%) make up the most common classes of employment.
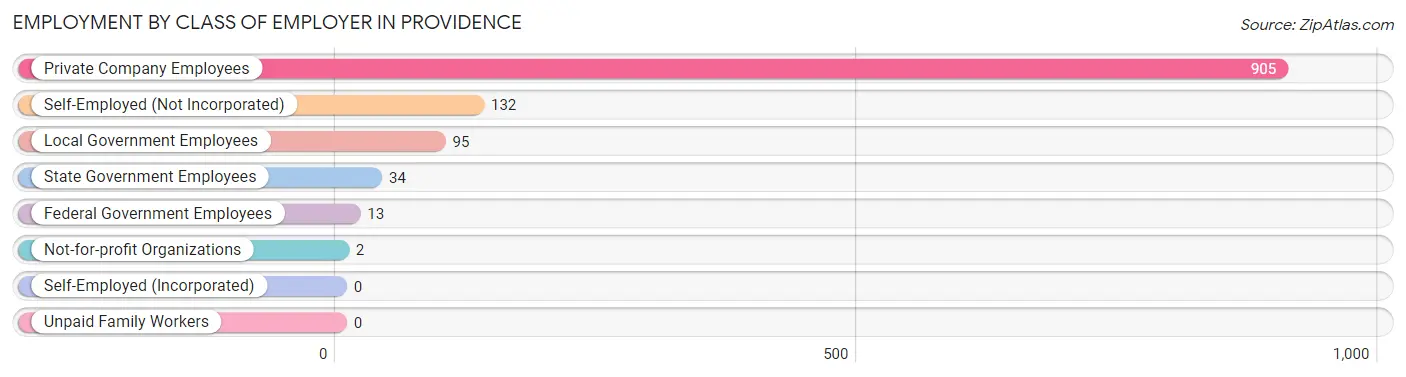
| Employer Class | # Employees | % Employees |
| Private Company Employees | 905 | 76.6% |
| Self-Employed (Incorporated) | 0 | 0.0% |
| Self-Employed (Not Incorporated) | 132 | 11.2% |
| Not-for-profit Organizations | 2 | 0.2% |
| Local Government Employees | 95 | 8.0% |
| State Government Employees | 34 | 2.9% |
| Federal Government Employees | 13 | 1.1% |
| Unpaid Family Workers | 0 | 0.0% |
| Total | 1,181 | 100.0% |
Employment Status by Age in Providence
According to the labor force statistics for Providence, out of the total population over 16 years of age (2,505), 52.0% or 1,303 individuals are in the labor force, with 8.2% or 107 of them unemployed. The age group with the highest labor force participation rate is 25 to 29 years, with 100.0% or 35 individuals in the labor force. Within the labor force, the 45 to 54 years age range has the highest percentage of unemployed individuals, with 14.8% or 58 of them being unemployed.
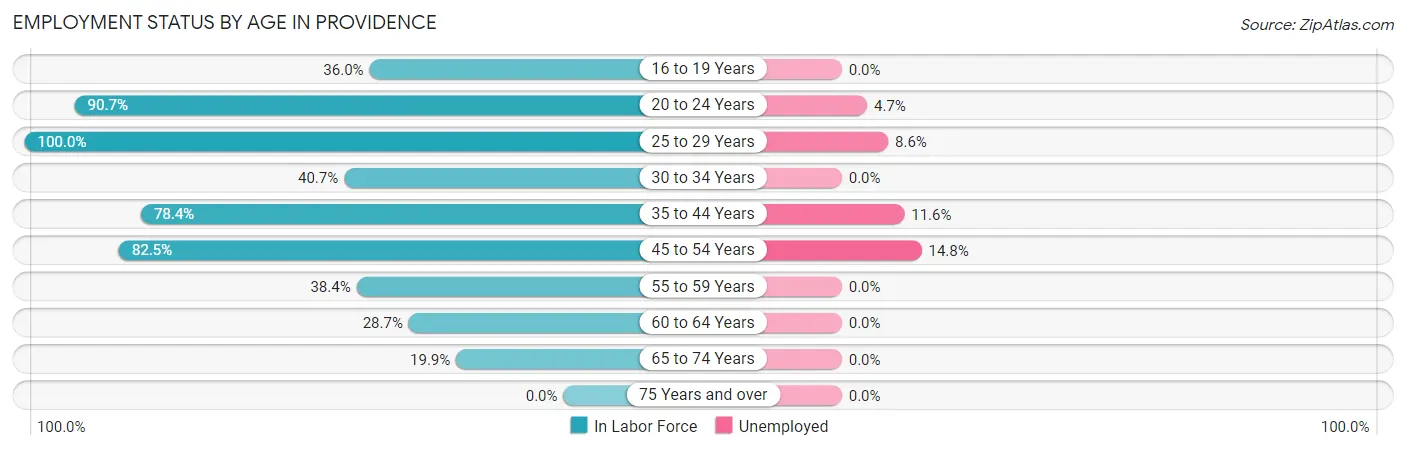
| Age Bracket | In Labor Force | Unemployed |
| 16 to 19 Years | 63 (36.0%) | 0 (0.0%) |
| 20 to 24 Years | 233 (90.7%) | 11 (4.7%) |
| 25 to 29 Years | 35 (100.0%) | 3 (8.6%) |
| 30 to 34 Years | 37 (40.7%) | 0 (0.0%) |
| 35 to 44 Years | 301 (78.4%) | 35 (11.6%) |
| 45 to 54 Years | 391 (82.5%) | 58 (14.8%) |
| 55 to 59 Years | 71 (38.4%) | 0 (0.0%) |
| 60 to 64 Years | 106 (28.7%) | 0 (0.0%) |
| 65 to 74 Years | 65 (19.9%) | 0 (0.0%) |
| 75 Years and over | 0 (0.0%) | 0 (0.0%) |
| Total | 1,303 (52.0%) | 107 (8.2%) |
Employment Status by Educational Attainment in Providence
According to labor force statistics for Providence, 61.2% of individuals (941) out of the total population between 25 and 64 years of age (1,538) are in the labor force, with 10.2% or 96 of them being unemployed. The group with the highest labor force participation rate are those with the educational attainment of bachelor's degree or higher, with 83.2% or 158 individuals in the labor force. Within the labor force, individuals with less than high school education have the highest percentage of unemployment, with 61.2% or 41 of them being unemployed.
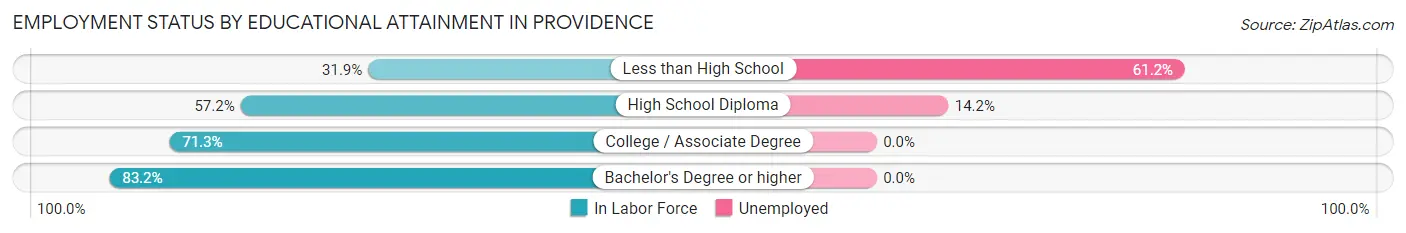
| Educational Attainment | In Labor Force | Unemployed |
| Less than High School | 67 (31.9%) | 129 (61.2%) |
| High School Diploma | 388 (57.2%) | 96 (14.2%) |
| College / Associate Degree | 328 (71.3%) | 0 (0.0%) |
| Bachelor's Degree or higher | 158 (83.2%) | 0 (0.0%) |
| Total | 941 (61.2%) | 157 (10.2%) |
Employment Occupations by Sex in Providence
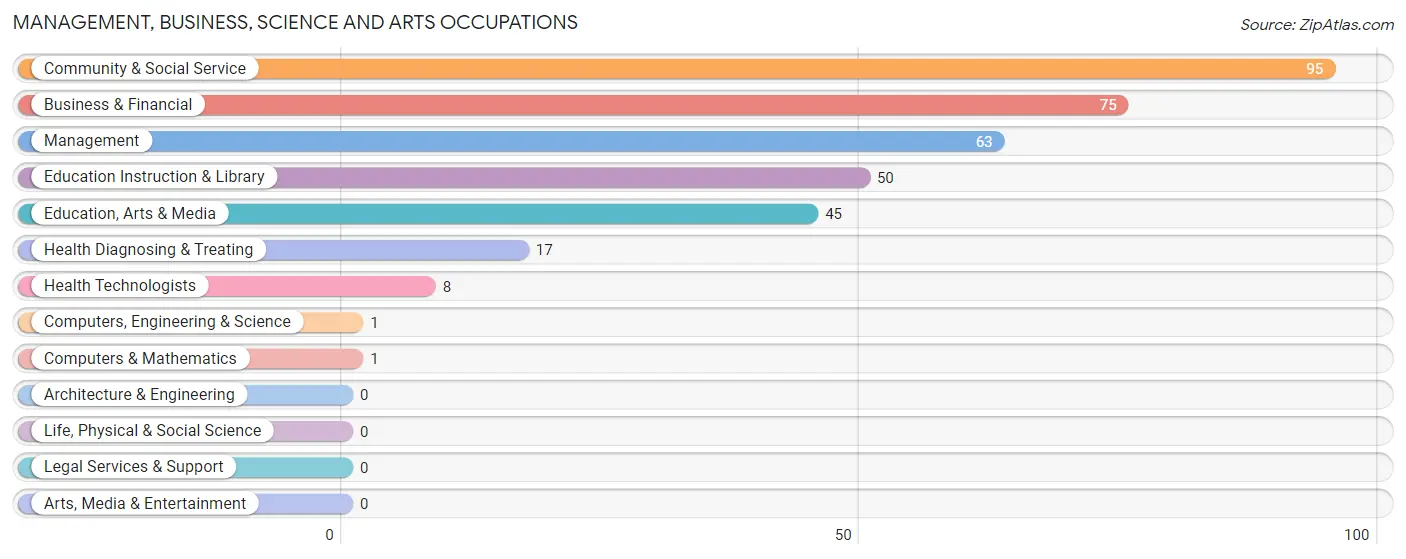
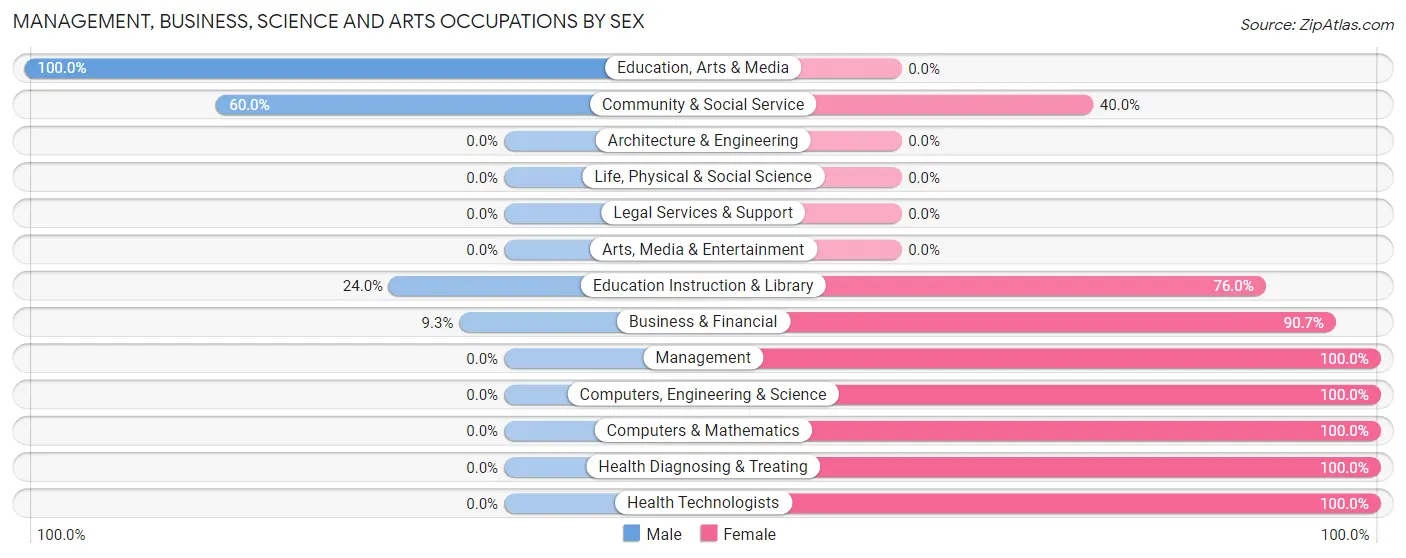
Management, Business, Science and Arts Occupations
The most common Management, Business, Science and Arts occupations in Providence are Community & Social Service (95 | 8.0%), Business & Financial (75 | 6.3%), Management (63 | 5.3%), Education Instruction & Library (50 | 4.2%), and Education, Arts & Media (45 | 3.8%).
Management, Business, Science and Arts Occupations by Sex
Within the Management, Business, Science and Arts occupations in Providence, the most male-oriented occupations are Education, Arts & Media (100.0%), Community & Social Service (60.0%), and Education Instruction & Library (24.0%), while the most female-oriented occupations are Management (100.0%), Computers, Engineering & Science (100.0%), and Computers & Mathematics (100.0%).
| Occupation | Male | Female |
| Management | 0 (0.0%) | 63 (100.0%) |
| Business & Financial | 7 (9.3%) | 68 (90.7%) |
| Computers, Engineering & Science | 0 (0.0%) | 1 (100.0%) |
| Computers & Mathematics | 0 (0.0%) | 1 (100.0%) |
| Architecture & Engineering | 0 (0.0%) | 0 (0.0%) |
| Life, Physical & Social Science | 0 (0.0%) | 0 (0.0%) |
| Community & Social Service | 57 (60.0%) | 38 (40.0%) |
| Education, Arts & Media | 45 (100.0%) | 0 (0.0%) |
| Legal Services & Support | 0 (0.0%) | 0 (0.0%) |
| Education Instruction & Library | 12 (24.0%) | 38 (76.0%) |
| Arts, Media & Entertainment | 0 (0.0%) | 0 (0.0%) |
| Health Diagnosing & Treating | 0 (0.0%) | 17 (100.0%) |
| Health Technologists | 0 (0.0%) | 8 (100.0%) |
| Total (Category) | 64 (25.5%) | 187 (74.5%) |
| Total (Overall) | 638 (53.4%) | 557 (46.6%) |
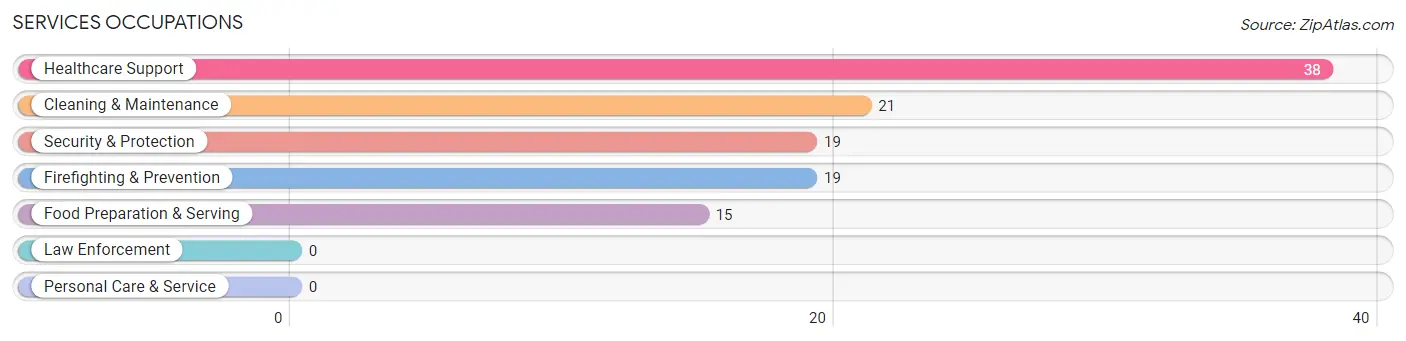
Services Occupations
The most common Services occupations in Providence are Healthcare Support (38 | 3.2%), Cleaning & Maintenance (21 | 1.8%), Security & Protection (19 | 1.6%), Firefighting & Prevention (19 | 1.6%), and Food Preparation & Serving (15 | 1.3%).
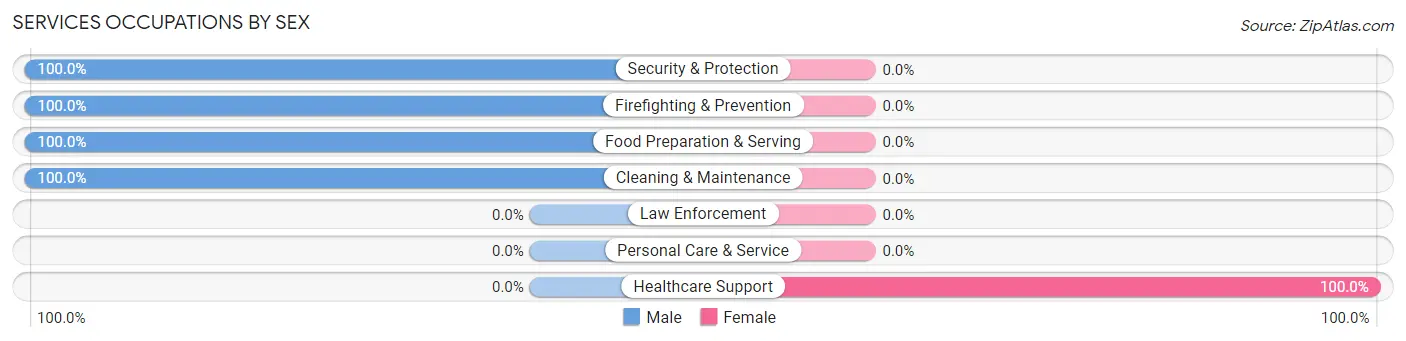
Services Occupations by Sex
| Occupation | Male | Female |
| Healthcare Support | 0 (0.0%) | 38 (100.0%) |
| Security & Protection | 19 (100.0%) | 0 (0.0%) |
| Firefighting & Prevention | 19 (100.0%) | 0 (0.0%) |
| Law Enforcement | 0 (0.0%) | 0 (0.0%) |
| Food Preparation & Serving | 15 (100.0%) | 0 (0.0%) |
| Cleaning & Maintenance | 21 (100.0%) | 0 (0.0%) |
| Personal Care & Service | 0 (0.0%) | 0 (0.0%) |
| Total (Category) | 55 (59.1%) | 38 (40.9%) |
| Total (Overall) | 638 (53.4%) | 557 (46.6%) |
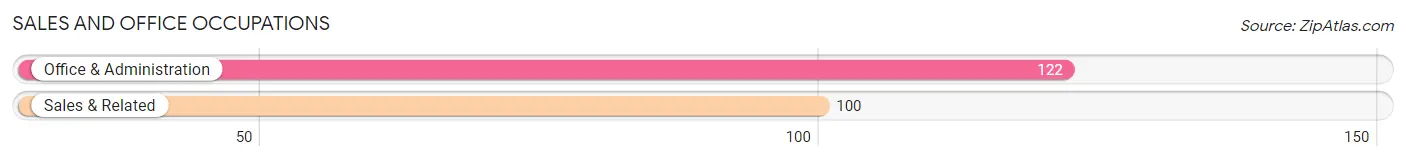
Sales and Office Occupations
The most common Sales and Office occupations in Providence are Office & Administration (122 | 10.2%), and Sales & Related (100 | 8.4%).
Sales and Office Occupations by Sex
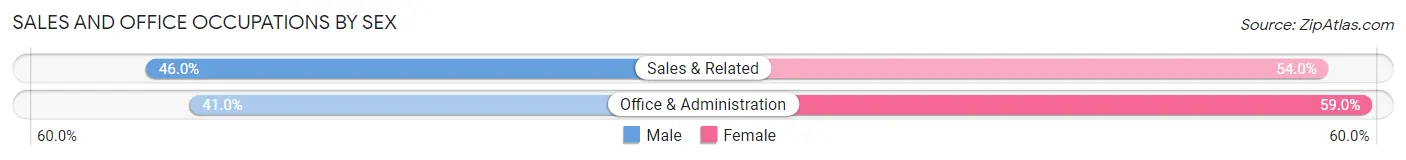
| Occupation | Male | Female |
| Sales & Related | 46 (46.0%) | 54 (54.0%) |
| Office & Administration | 50 (41.0%) | 72 (59.0%) |
| Total (Category) | 96 (43.2%) | 126 (56.8%) |
| Total (Overall) | 638 (53.4%) | 557 (46.6%) |
Natural Resources, Construction and Maintenance Occupations
The most common Natural Resources, Construction and Maintenance occupations in Providence are Construction & Extraction (60 | 5.0%), Installation, Maintenance & Repair (12 | 1.0%), and Farming, Fishing & Forestry (9 | 0.7%).
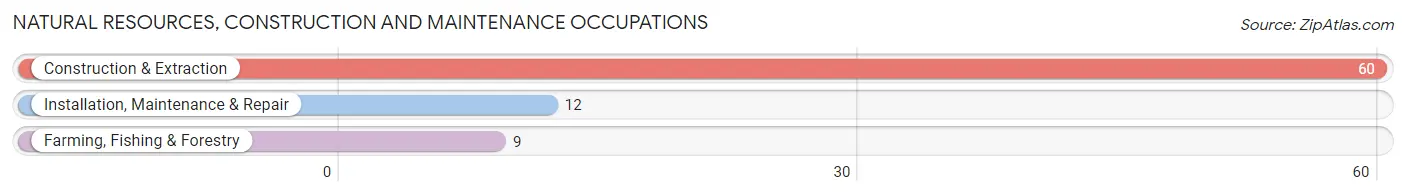
Natural Resources, Construction and Maintenance Occupations by Sex

| Occupation | Male | Female |
| Farming, Fishing & Forestry | 9 (100.0%) | 0 (0.0%) |
| Construction & Extraction | 60 (100.0%) | 0 (0.0%) |
| Installation, Maintenance & Repair | 12 (100.0%) | 0 (0.0%) |
| Total (Category) | 81 (100.0%) | 0 (0.0%) |
| Total (Overall) | 638 (53.4%) | 557 (46.6%) |
Production, Transportation and Moving Occupations
The most common Production, Transportation and Moving occupations in Providence are Production (378 | 31.6%), Transportation (91 | 7.6%), and Material Moving (79 | 6.6%).
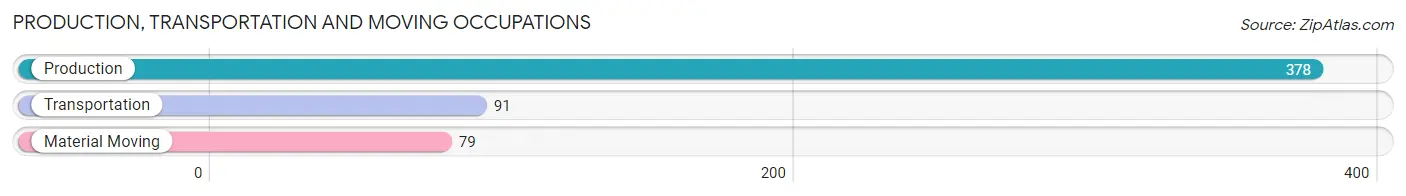
Production, Transportation and Moving Occupations by Sex
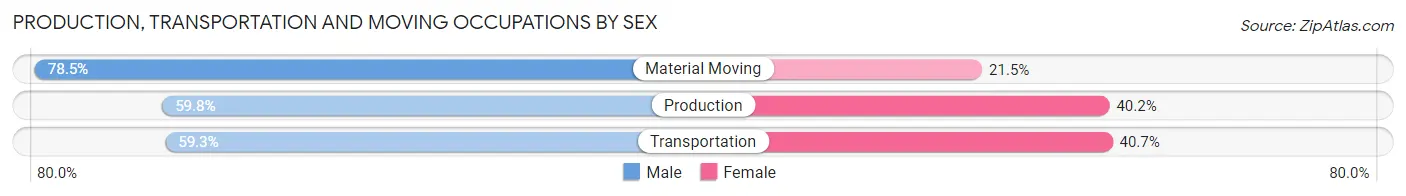
| Occupation | Male | Female |
| Production | 226 (59.8%) | 152 (40.2%) |
| Transportation | 54 (59.3%) | 37 (40.7%) |
| Material Moving | 62 (78.5%) | 17 (21.5%) |
| Total (Category) | 342 (62.4%) | 206 (37.6%) |
| Total (Overall) | 638 (53.4%) | 557 (46.6%) |
Employment Industries by Sex in Providence
Employment Industries in Providence
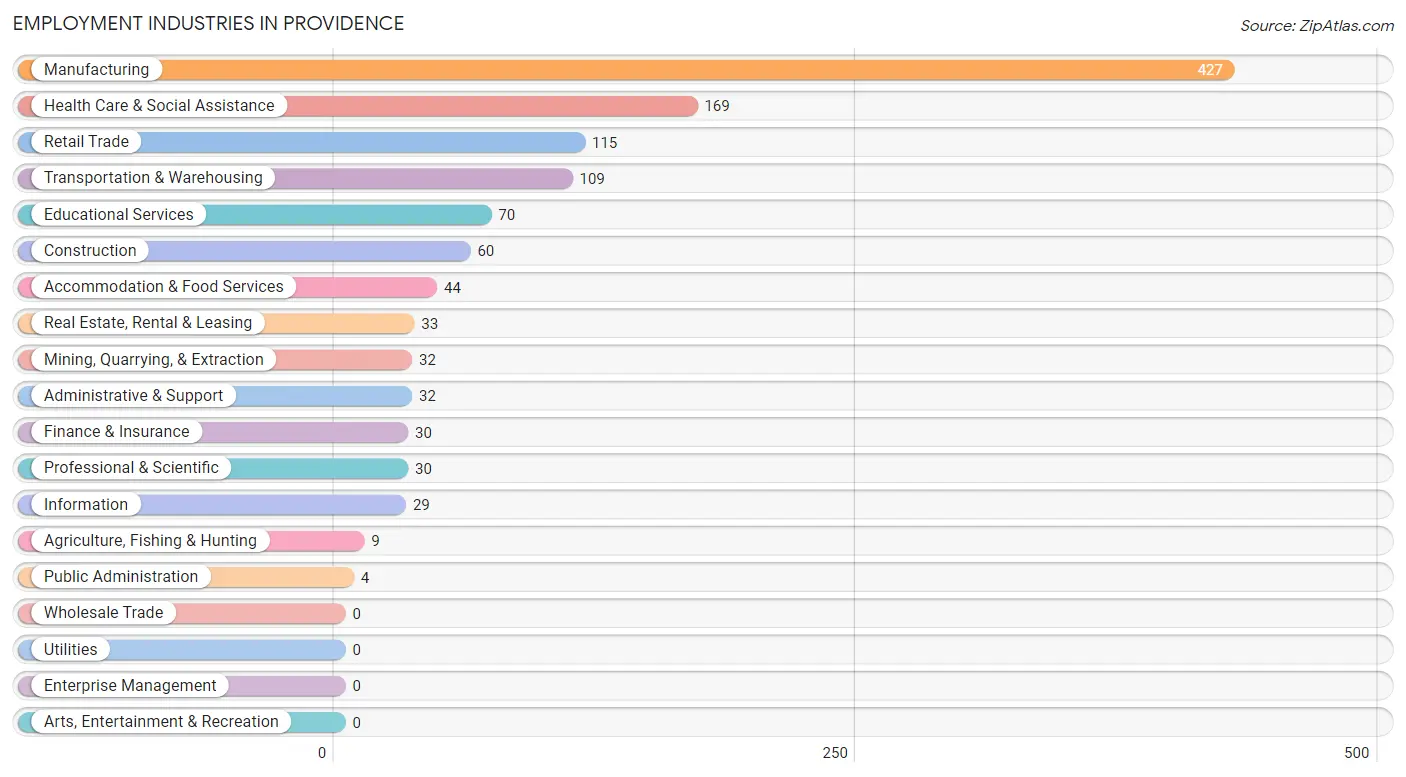
The major employment industries in Providence include Manufacturing (427 | 35.7%), Health Care & Social Assistance (169 | 14.1%), Retail Trade (115 | 9.6%), Transportation & Warehousing (109 | 9.1%), and Educational Services (70 | 5.9%).
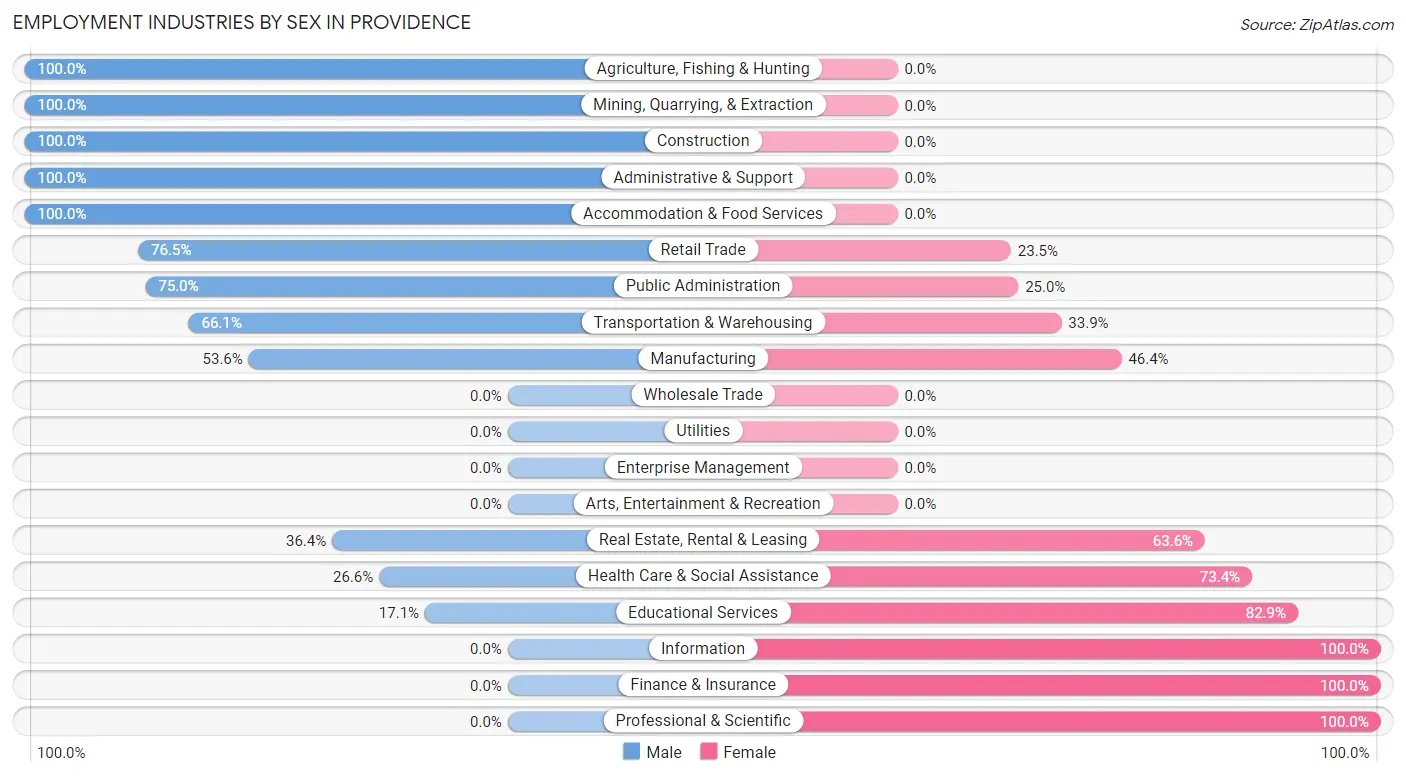
Employment Industries by Sex in Providence
The Providence industries that see more men than women are Agriculture, Fishing & Hunting (100.0%), Mining, Quarrying, & Extraction (100.0%), and Construction (100.0%), whereas the industries that tend to have a higher number of women are Information (100.0%), Finance & Insurance (100.0%), and Professional & Scientific (100.0%).
| Industry | Male | Female |
| Agriculture, Fishing & Hunting | 9 (100.0%) | 0 (0.0%) |
| Mining, Quarrying, & Extraction | 32 (100.0%) | 0 (0.0%) |
| Construction | 60 (100.0%) | 0 (0.0%) |
| Manufacturing | 229 (53.6%) | 198 (46.4%) |
| Wholesale Trade | 0 (0.0%) | 0 (0.0%) |
| Retail Trade | 88 (76.5%) | 27 (23.5%) |
| Transportation & Warehousing | 72 (66.1%) | 37 (33.9%) |
| Utilities | 0 (0.0%) | 0 (0.0%) |
| Information | 0 (0.0%) | 29 (100.0%) |
| Finance & Insurance | 0 (0.0%) | 30 (100.0%) |
| Real Estate, Rental & Leasing | 12 (36.4%) | 21 (63.6%) |
| Professional & Scientific | 0 (0.0%) | 30 (100.0%) |
| Enterprise Management | 0 (0.0%) | 0 (0.0%) |
| Administrative & Support | 32 (100.0%) | 0 (0.0%) |
| Educational Services | 12 (17.1%) | 58 (82.9%) |
| Health Care & Social Assistance | 45 (26.6%) | 124 (73.4%) |
| Arts, Entertainment & Recreation | 0 (0.0%) | 0 (0.0%) |
| Accommodation & Food Services | 44 (100.0%) | 0 (0.0%) |
| Public Administration | 3 (75.0%) | 1 (25.0%) |
| Total | 638 (53.4%) | 557 (46.6%) |
Education in Providence
School Enrollment in Providence
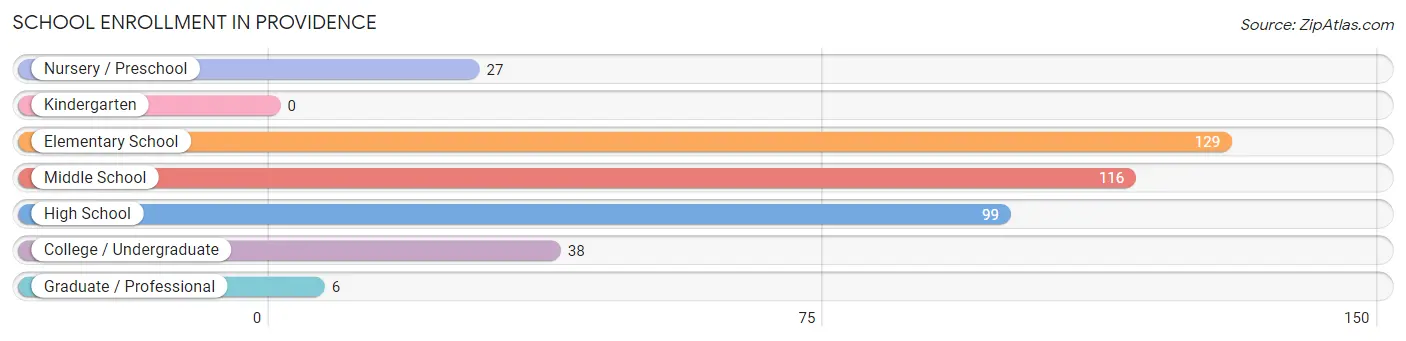
The most common levels of schooling among the 415 students in Providence are elementary school (129 | 31.1%), middle school (116 | 28.0%), and high school (99 | 23.9%).
| School Level | # Students | % Students |
| Nursery / Preschool | 27 | 6.5% |
| Kindergarten | 0 | 0.0% |
| Elementary School | 129 | 31.1% |
| Middle School | 116 | 28.0% |
| High School | 99 | 23.9% |
| College / Undergraduate | 38 | 9.2% |
| Graduate / Professional | 6 | 1.5% |
| Total | 415 | 100.0% |
School Enrollment by Age by Funding Source in Providence
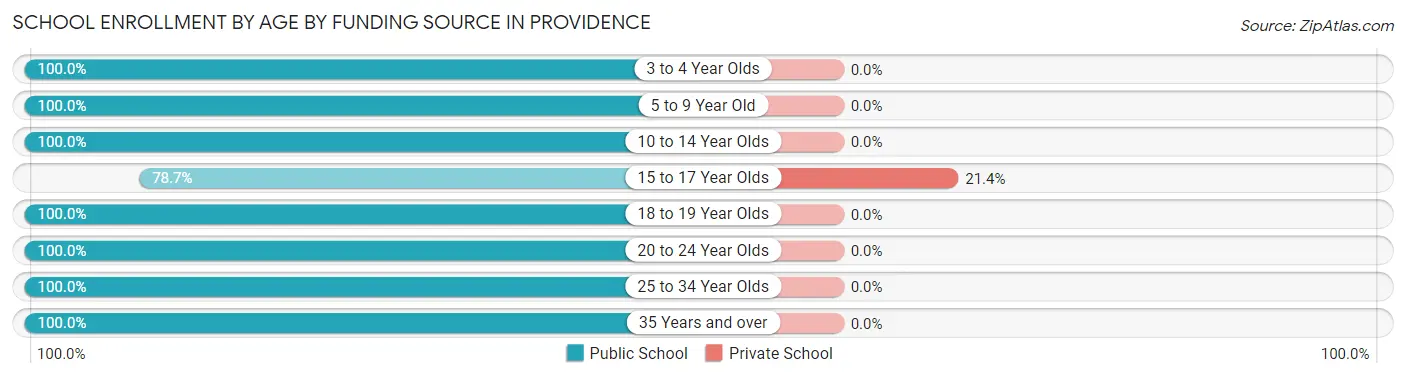
Out of a total of 415 students who are enrolled in schools in Providence, 19 (4.6%) attend a private institution, while the remaining 396 (95.4%) are enrolled in public schools. The age group of 15 to 17 year olds has the highest likelihood of being enrolled in private schools, with 19 (21.3% in the age bracket) enrolled. Conversely, the age group of 3 to 4 year olds has the lowest likelihood of being enrolled in a private school, with 27 (100.0% in the age bracket) attending a public institution.
| Age Bracket | Public School | Private School |
| 3 to 4 Year Olds | 27 (100.0%) | 0 (0.0%) |
| 5 to 9 Year Old | 123 (100.0%) | 0 (0.0%) |
| 10 to 14 Year Olds | 122 (100.0%) | 0 (0.0%) |
| 15 to 17 Year Olds | 70 (78.6%) | 19 (21.3%) |
| 18 to 19 Year Olds | 10 (100.0%) | 0 (0.0%) |
| 20 to 24 Year Olds | 9 (100.0%) | 0 (0.0%) |
| 25 to 34 Year Olds | 6 (100.0%) | 0 (0.0%) |
| 35 Years and over | 29 (100.0%) | 0 (0.0%) |
| Total | 396 (95.4%) | 19 (4.6%) |
Educational Attainment by Field of Study in Providence
Business (97 | 31.1%), education (69 | 22.1%), science & technology (43 | 13.8%), arts & humanities (33 | 10.6%), and communications (25 | 8.0%) are the most common fields of study among 312 individuals in Providence who have obtained a bachelor's degree or higher.
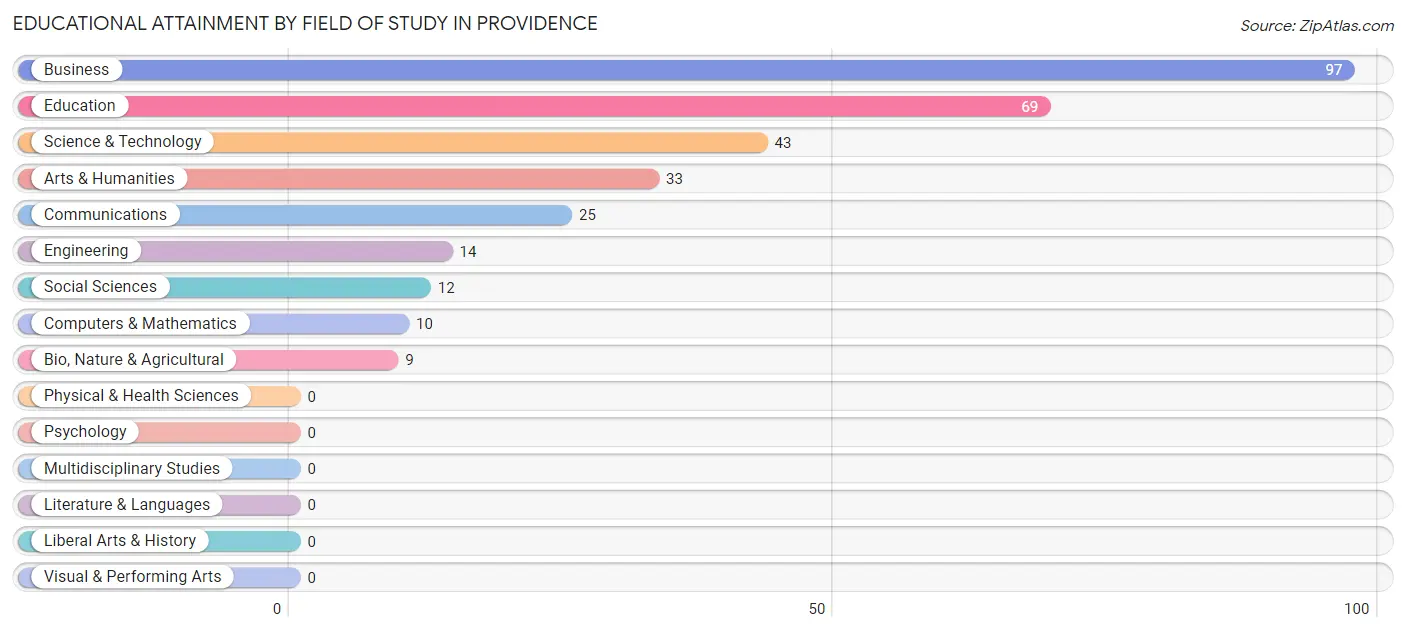
| Field of Study | # Graduates | % Graduates |
| Computers & Mathematics | 10 | 3.2% |
| Bio, Nature & Agricultural | 9 | 2.9% |
| Physical & Health Sciences | 0 | 0.0% |
| Psychology | 0 | 0.0% |
| Social Sciences | 12 | 3.8% |
| Engineering | 14 | 4.5% |
| Multidisciplinary Studies | 0 | 0.0% |
| Science & Technology | 43 | 13.8% |
| Business | 97 | 31.1% |
| Education | 69 | 22.1% |
| Literature & Languages | 0 | 0.0% |
| Liberal Arts & History | 0 | 0.0% |
| Visual & Performing Arts | 0 | 0.0% |
| Communications | 25 | 8.0% |
| Arts & Humanities | 33 | 10.6% |
| Total | 312 | 100.0% |
Transportation & Commute in Providence
Vehicle Availability by Sex in Providence
The most prevalent vehicle ownership categories in Providence are males with 2 vehicles (359, accounting for 57.5%) and females with 2 vehicles (256, making up 64.7%).
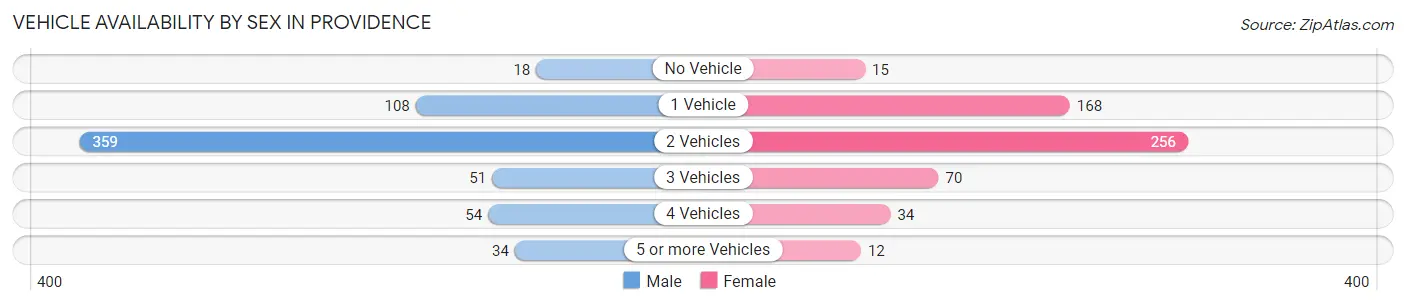
| Vehicles Available | Male | Female |
| No Vehicle | 18 (2.9%) | 15 (2.7%) |
| 1 Vehicle | 108 (17.3%) | 168 (30.3%) |
| 2 Vehicles | 359 (57.5%) | 256 (46.1%) |
| 3 Vehicles | 51 (8.2%) | 70 (12.6%) |
| 4 Vehicles | 54 (8.6%) | 34 (6.1%) |
| 5 or more Vehicles | 34 (5.4%) | 12 (2.2%) |
| Total | 624 (100.0%) | 555 (100.0%) |
Commute Time in Providence
The most frequently occuring commute durations in Providence are 30 to 34 minutes (236 commuters, 20.2%), 35 to 39 minutes (215 commuters, 18.4%), and 20 to 24 minutes (190 commuters, 16.3%).
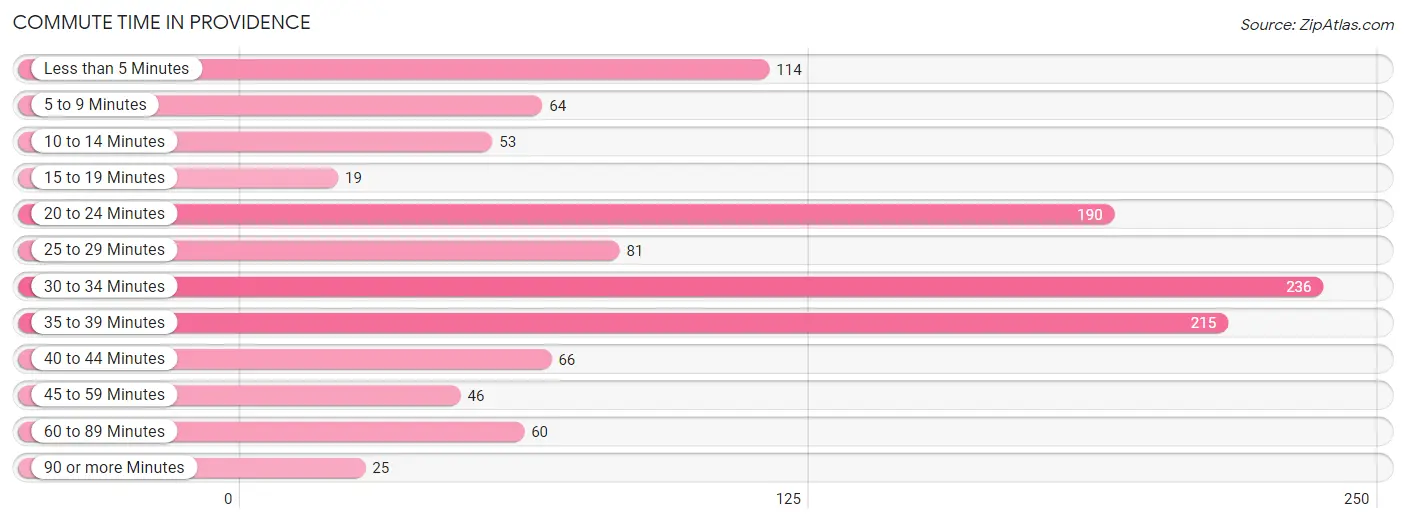
| Commute Time | # Commuters | % Commuters |
| Less than 5 Minutes | 114 | 9.8% |
| 5 to 9 Minutes | 64 | 5.5% |
| 10 to 14 Minutes | 53 | 4.5% |
| 15 to 19 Minutes | 19 | 1.6% |
| 20 to 24 Minutes | 190 | 16.3% |
| 25 to 29 Minutes | 81 | 6.9% |
| 30 to 34 Minutes | 236 | 20.2% |
| 35 to 39 Minutes | 215 | 18.4% |
| 40 to 44 Minutes | 66 | 5.7% |
| 45 to 59 Minutes | 46 | 3.9% |
| 60 to 89 Minutes | 60 | 5.1% |
| 90 or more Minutes | 25 | 2.1% |
Commute Time by Sex in Providence
The most common commute times in Providence are 35 to 39 minutes (129 commuters, 20.9%) for males and 30 to 34 minutes (127 commuters, 23.0%) for females.
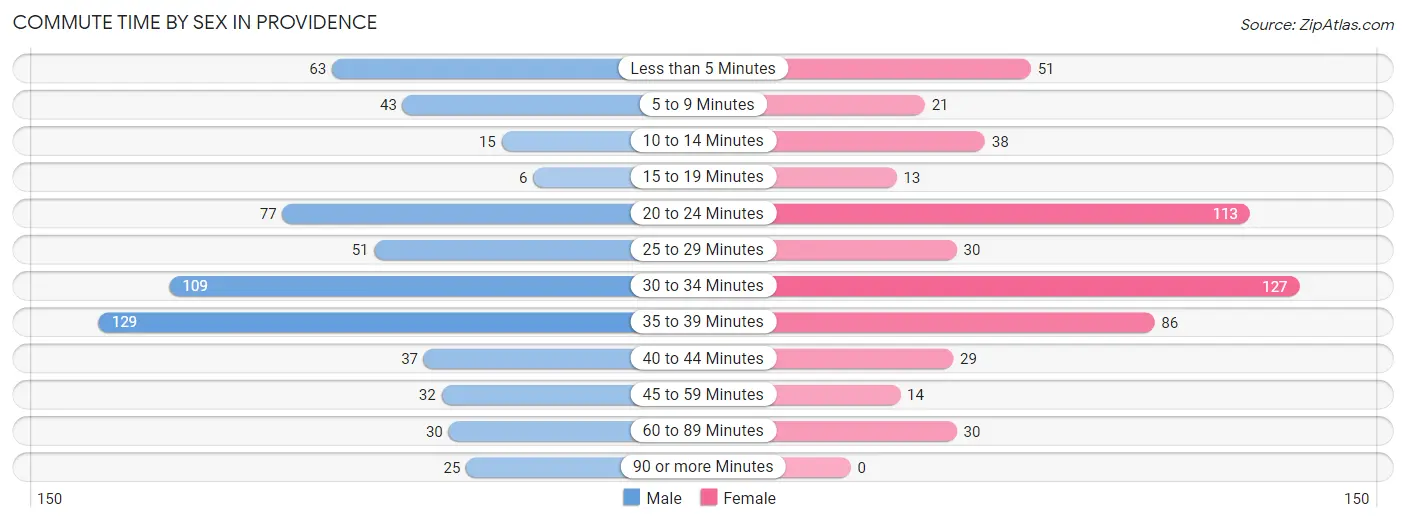
| Commute Time | Male | Female |
| Less than 5 Minutes | 63 (10.2%) | 51 (9.2%) |
| 5 to 9 Minutes | 43 (7.0%) | 21 (3.8%) |
| 10 to 14 Minutes | 15 (2.4%) | 38 (6.9%) |
| 15 to 19 Minutes | 6 (1.0%) | 13 (2.4%) |
| 20 to 24 Minutes | 77 (12.5%) | 113 (20.5%) |
| 25 to 29 Minutes | 51 (8.3%) | 30 (5.4%) |
| 30 to 34 Minutes | 109 (17.7%) | 127 (23.0%) |
| 35 to 39 Minutes | 129 (20.9%) | 86 (15.6%) |
| 40 to 44 Minutes | 37 (6.0%) | 29 (5.2%) |
| 45 to 59 Minutes | 32 (5.2%) | 14 (2.5%) |
| 60 to 89 Minutes | 30 (4.9%) | 30 (5.4%) |
| 90 or more Minutes | 25 (4.1%) | 0 (0.0%) |
Time of Departure to Work by Sex in Providence
The most frequent times of departure to work in Providence are 6:00 AM to 6:29 AM (194, 31.4%) for males and 7:00 AM to 7:29 AM (178, 32.3%) for females.
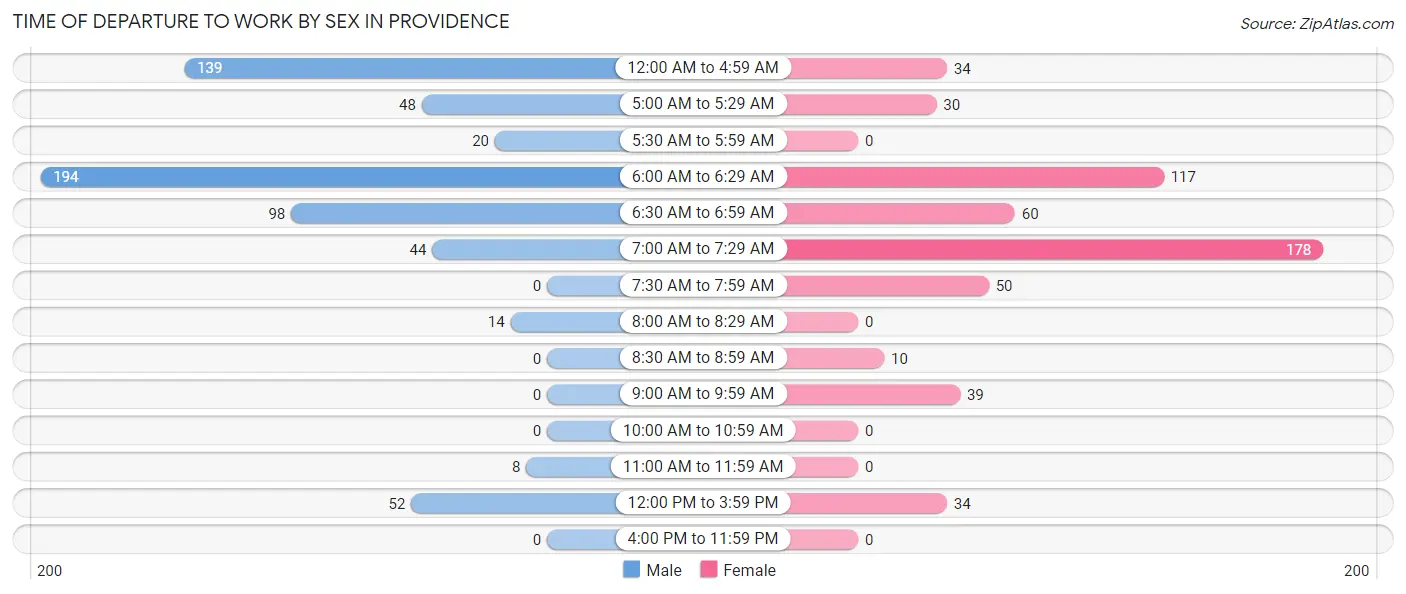
| Time of Departure | Male | Female |
| 12:00 AM to 4:59 AM | 139 (22.5%) | 34 (6.2%) |
| 5:00 AM to 5:29 AM | 48 (7.8%) | 30 (5.4%) |
| 5:30 AM to 5:59 AM | 20 (3.2%) | 0 (0.0%) |
| 6:00 AM to 6:29 AM | 194 (31.4%) | 117 (21.2%) |
| 6:30 AM to 6:59 AM | 98 (15.9%) | 60 (10.9%) |
| 7:00 AM to 7:29 AM | 44 (7.1%) | 178 (32.3%) |
| 7:30 AM to 7:59 AM | 0 (0.0%) | 50 (9.1%) |
| 8:00 AM to 8:29 AM | 14 (2.3%) | 0 (0.0%) |
| 8:30 AM to 8:59 AM | 0 (0.0%) | 10 (1.8%) |
| 9:00 AM to 9:59 AM | 0 (0.0%) | 39 (7.1%) |
| 10:00 AM to 10:59 AM | 0 (0.0%) | 0 (0.0%) |
| 11:00 AM to 11:59 AM | 8 (1.3%) | 0 (0.0%) |
| 12:00 PM to 3:59 PM | 52 (8.4%) | 34 (6.2%) |
| 4:00 PM to 11:59 PM | 0 (0.0%) | 0 (0.0%) |
| Total | 617 (100.0%) | 552 (100.0%) |
Housing Occupancy in Providence
Occupancy by Ownership in Providence
Of the total 1,297 dwellings in Providence, owner-occupied units account for 811 (62.5%), while renter-occupied units make up 486 (37.5%).
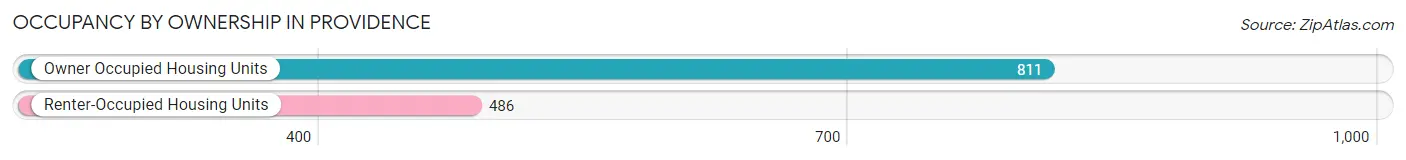
| Occupancy | # Housing Units | % Housing Units |
| Owner Occupied Housing Units | 811 | 62.5% |
| Renter-Occupied Housing Units | 486 | 37.5% |
| Total Occupied Housing Units | 1,297 | 100.0% |
Occupancy by Household Size in Providence
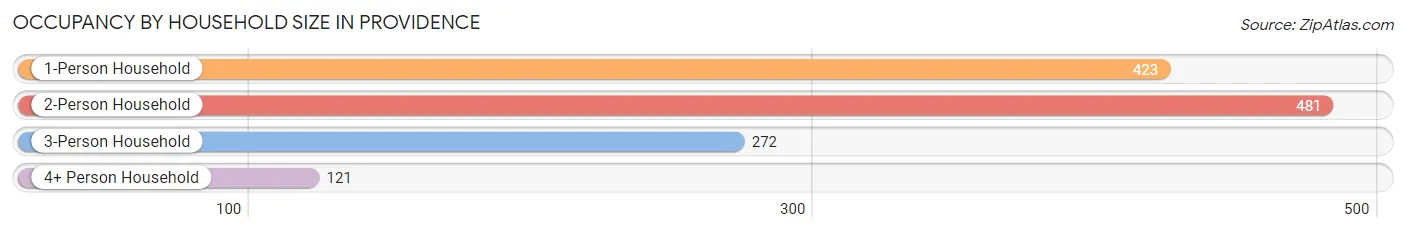
| Household Size | # Housing Units | % Housing Units |
| 1-Person Household | 423 | 32.6% |
| 2-Person Household | 481 | 37.1% |
| 3-Person Household | 272 | 21.0% |
| 4+ Person Household | 121 | 9.3% |
| Total Housing Units | 1,297 | 100.0% |
Occupancy by Ownership by Household Size in Providence
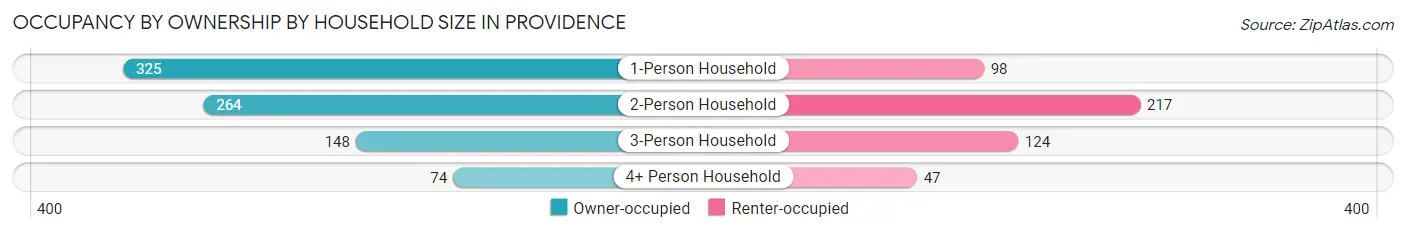
| Household Size | Owner-occupied | Renter-occupied |
| 1-Person Household | 325 (76.8%) | 98 (23.2%) |
| 2-Person Household | 264 (54.9%) | 217 (45.1%) |
| 3-Person Household | 148 (54.4%) | 124 (45.6%) |
| 4+ Person Household | 74 (61.2%) | 47 (38.8%) |
| Total Housing Units | 811 (62.5%) | 486 (37.5%) |
Occupancy by Educational Attainment in Providence
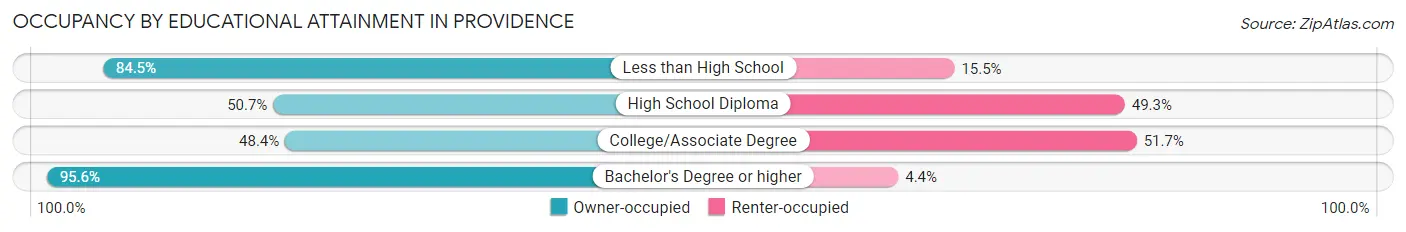
| Household Size | Owner-occupied | Renter-occupied |
| Less than High School | 147 (84.5%) | 27 (15.5%) |
| High School Diploma | 285 (50.7%) | 277 (49.3%) |
| College/Associate Degree | 161 (48.3%) | 172 (51.6%) |
| Bachelor's Degree or higher | 218 (95.6%) | 10 (4.4%) |
Occupancy by Age of Householder in Providence
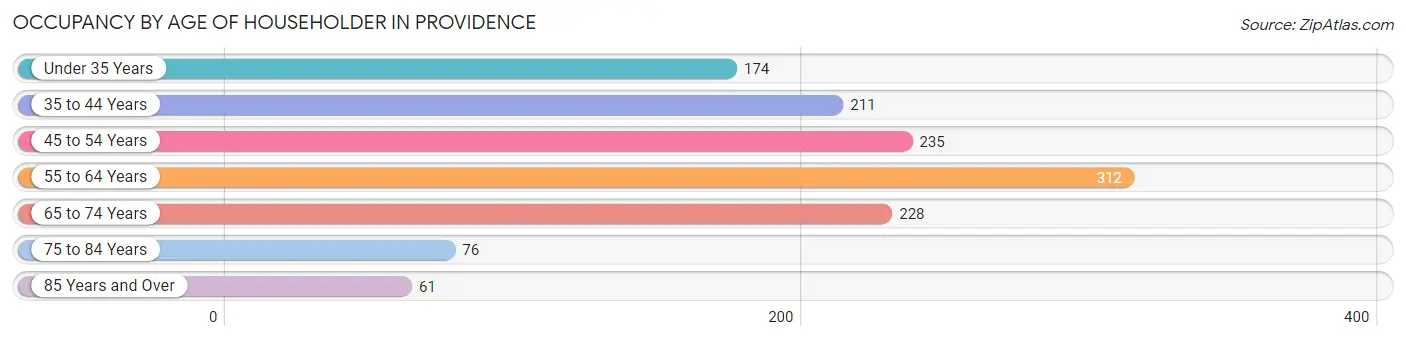
| Age Bracket | # Households | % Households |
| Under 35 Years | 174 | 13.4% |
| 35 to 44 Years | 211 | 16.3% |
| 45 to 54 Years | 235 | 18.1% |
| 55 to 64 Years | 312 | 24.1% |
| 65 to 74 Years | 228 | 17.6% |
| 75 to 84 Years | 76 | 5.9% |
| 85 Years and Over | 61 | 4.7% |
| Total | 1,297 | 100.0% |
Housing Finances in Providence
Median Income by Occupancy in Providence
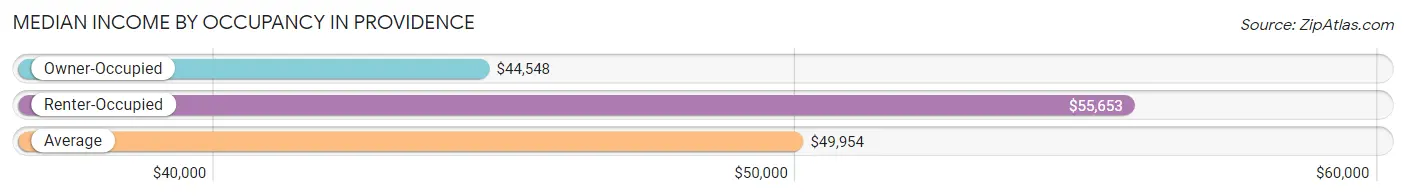
| Occupancy Type | # Households | Median Income |
| Owner-Occupied | 811 (62.5%) | $44,548 |
| Renter-Occupied | 486 (37.5%) | $55,653 |
| Average | 1,297 (100.0%) | $49,954 |
Occupancy by Householder Income Bracket in Providence
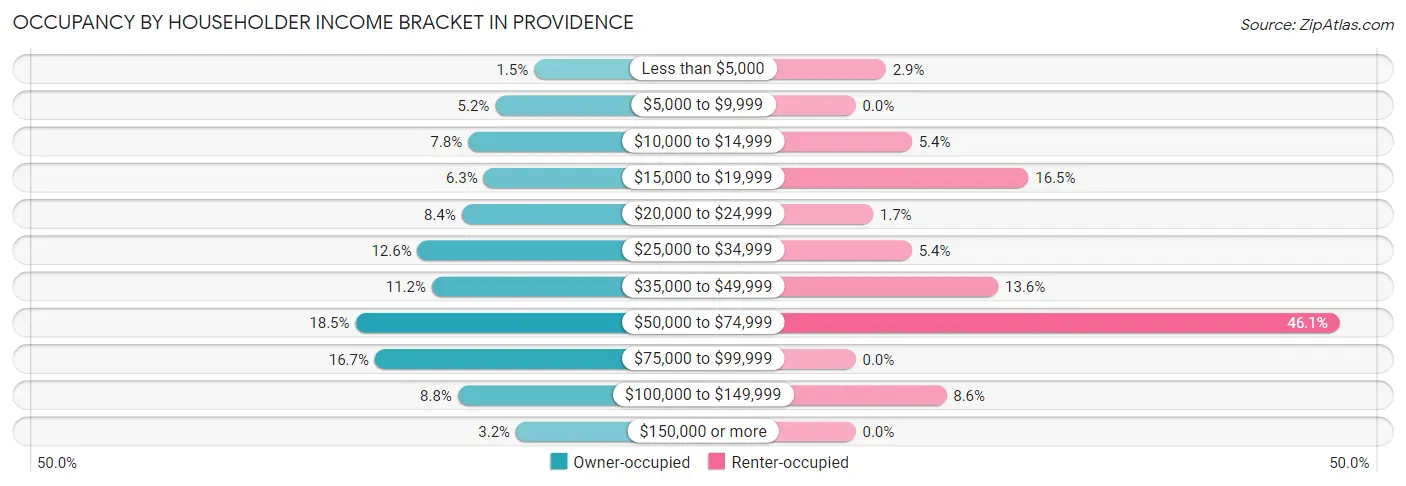
| Income Bracket | Owner-occupied | Renter-occupied |
| Less than $5,000 | 12 (1.5%) | 14 (2.9%) |
| $5,000 to $9,999 | 42 (5.2%) | 0 (0.0%) |
| $10,000 to $14,999 | 63 (7.8%) | 26 (5.3%) |
| $15,000 to $19,999 | 51 (6.3%) | 80 (16.5%) |
| $20,000 to $24,999 | 68 (8.4%) | 8 (1.7%) |
| $25,000 to $34,999 | 102 (12.6%) | 26 (5.3%) |
| $35,000 to $49,999 | 91 (11.2%) | 66 (13.6%) |
| $50,000 to $74,999 | 150 (18.5%) | 224 (46.1%) |
| $75,000 to $99,999 | 135 (16.7%) | 0 (0.0%) |
| $100,000 to $149,999 | 71 (8.7%) | 42 (8.6%) |
| $150,000 or more | 26 (3.2%) | 0 (0.0%) |
| Total | 811 (100.0%) | 486 (100.0%) |
Monthly Housing Cost Tiers in Providence
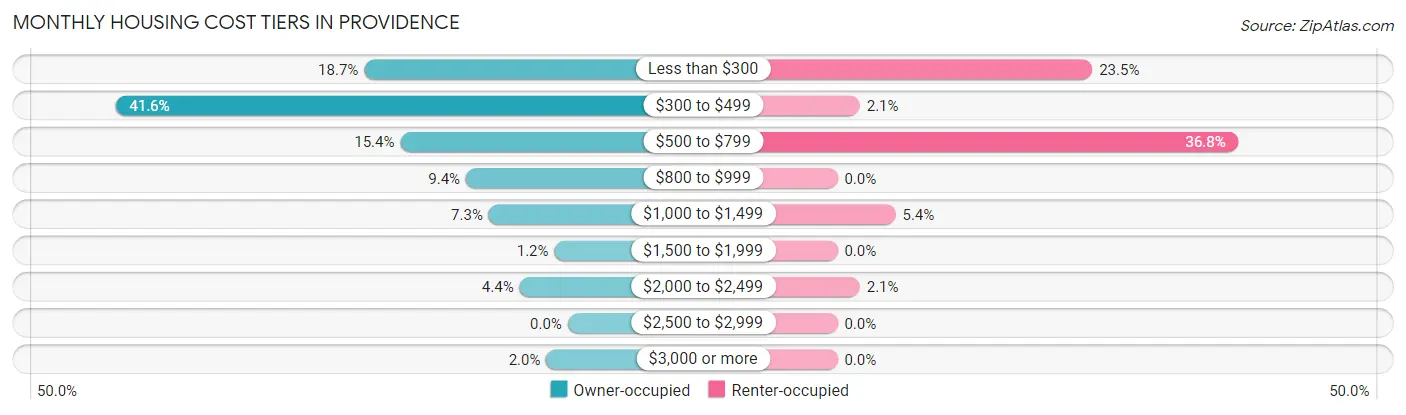
| Monthly Cost | Owner-occupied | Renter-occupied |
| Less than $300 | 152 (18.7%) | 114 (23.5%) |
| $300 to $499 | 337 (41.5%) | 10 (2.1%) |
| $500 to $799 | 125 (15.4%) | 179 (36.8%) |
| $800 to $999 | 76 (9.4%) | 0 (0.0%) |
| $1,000 to $1,499 | 59 (7.3%) | 26 (5.3%) |
| $1,500 to $1,999 | 10 (1.2%) | 0 (0.0%) |
| $2,000 to $2,499 | 36 (4.4%) | 10 (2.1%) |
| $2,500 to $2,999 | 0 (0.0%) | 0 (0.0%) |
| $3,000 or more | 16 (2.0%) | 0 (0.0%) |
| Total | 811 (100.0%) | 486 (100.0%) |
Physical Housing Characteristics in Providence
Housing Structures in Providence
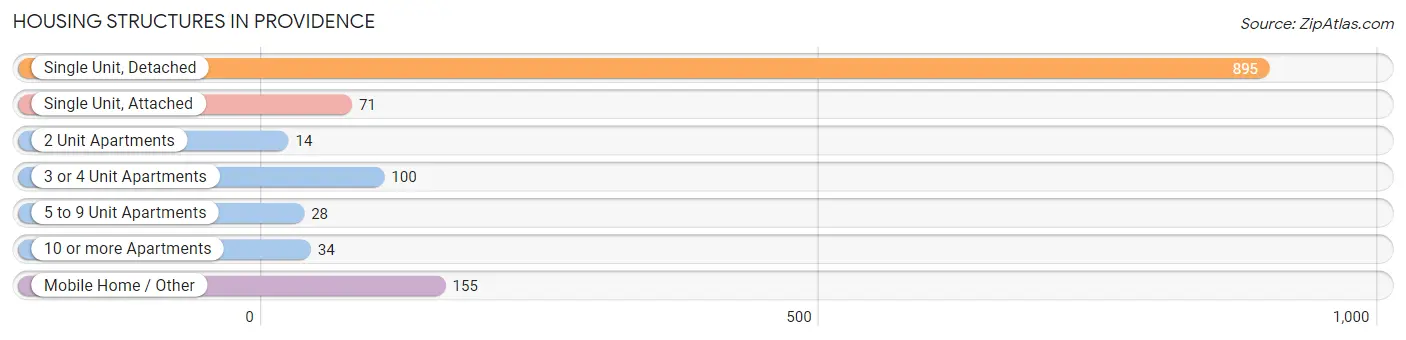
| Structure Type | # Housing Units | % Housing Units |
| Single Unit, Detached | 895 | 69.0% |
| Single Unit, Attached | 71 | 5.5% |
| 2 Unit Apartments | 14 | 1.1% |
| 3 or 4 Unit Apartments | 100 | 7.7% |
| 5 to 9 Unit Apartments | 28 | 2.2% |
| 10 or more Apartments | 34 | 2.6% |
| Mobile Home / Other | 155 | 11.9% |
| Total | 1,297 | 100.0% |
Housing Structures by Occupancy in Providence
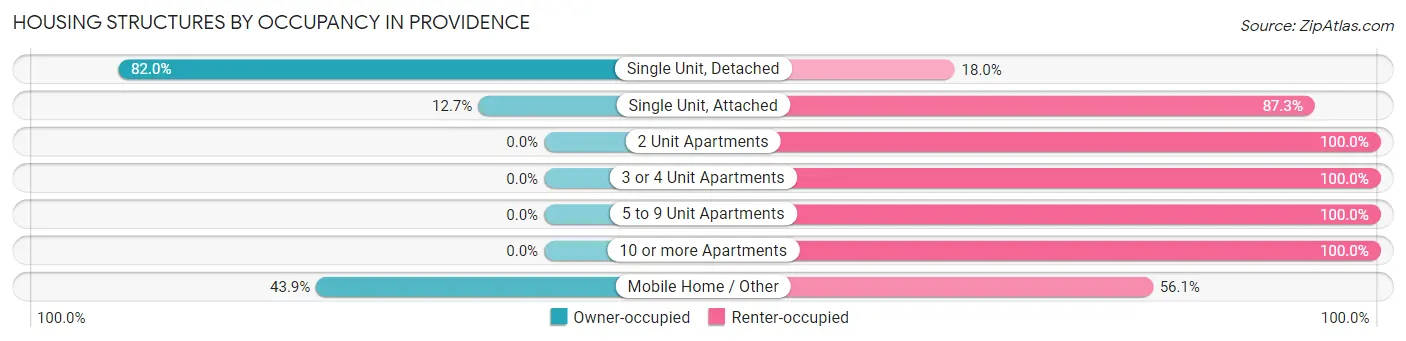
| Structure Type | Owner-occupied | Renter-occupied |
| Single Unit, Detached | 734 (82.0%) | 161 (18.0%) |
| Single Unit, Attached | 9 (12.7%) | 62 (87.3%) |
| 2 Unit Apartments | 0 (0.0%) | 14 (100.0%) |
| 3 or 4 Unit Apartments | 0 (0.0%) | 100 (100.0%) |
| 5 to 9 Unit Apartments | 0 (0.0%) | 28 (100.0%) |
| 10 or more Apartments | 0 (0.0%) | 34 (100.0%) |
| Mobile Home / Other | 68 (43.9%) | 87 (56.1%) |
| Total | 811 (62.5%) | 486 (37.5%) |
Housing Structures by Number of Rooms in Providence
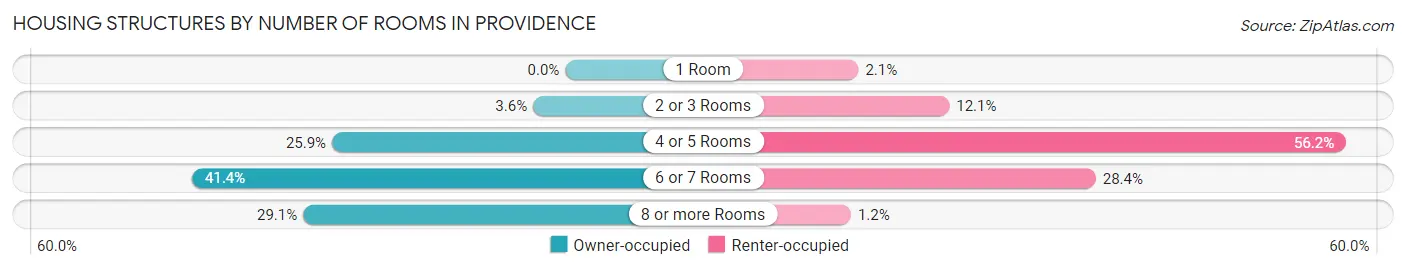
| Number of Rooms | Owner-occupied | Renter-occupied |
| 1 Room | 0 (0.0%) | 10 (2.1%) |
| 2 or 3 Rooms | 29 (3.6%) | 59 (12.1%) |
| 4 or 5 Rooms | 210 (25.9%) | 273 (56.2%) |
| 6 or 7 Rooms | 336 (41.4%) | 138 (28.4%) |
| 8 or more Rooms | 236 (29.1%) | 6 (1.2%) |
| Total | 811 (100.0%) | 486 (100.0%) |
Housing Structure by Heating Type in Providence
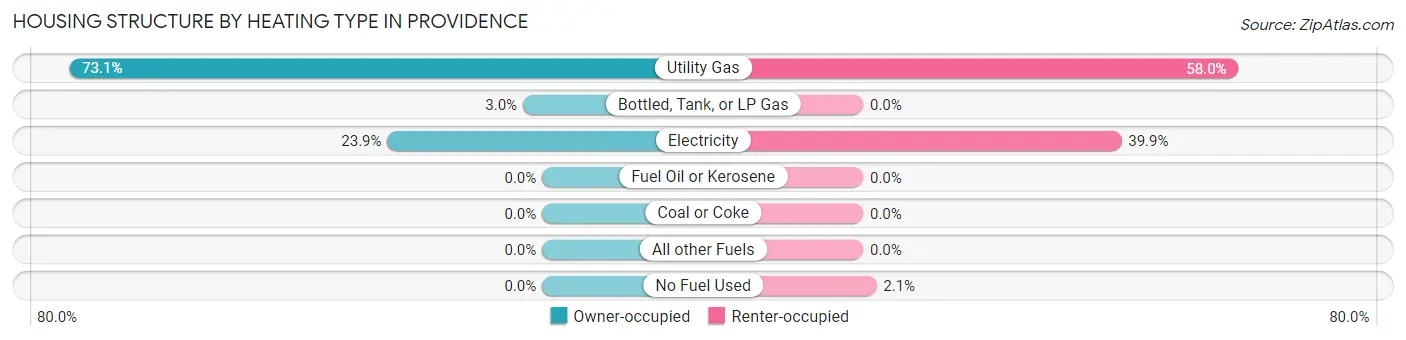
| Heating Type | Owner-occupied | Renter-occupied |
| Utility Gas | 593 (73.1%) | 282 (58.0%) |
| Bottled, Tank, or LP Gas | 24 (3.0%) | 0 (0.0%) |
| Electricity | 194 (23.9%) | 194 (39.9%) |
| Fuel Oil or Kerosene | 0 (0.0%) | 0 (0.0%) |
| Coal or Coke | 0 (0.0%) | 0 (0.0%) |
| All other Fuels | 0 (0.0%) | 0 (0.0%) |
| No Fuel Used | 0 (0.0%) | 10 (2.1%) |
| Total | 811 (100.0%) | 486 (100.0%) |
Household Vehicle Usage in Providence
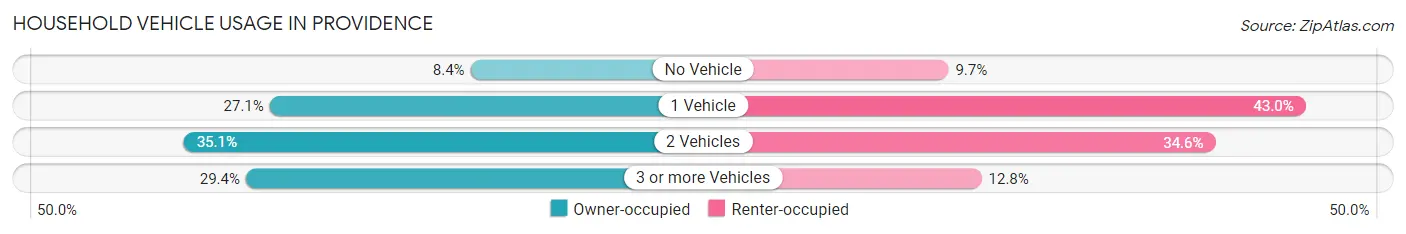
| Vehicles per Household | Owner-occupied | Renter-occupied |
| No Vehicle | 68 (8.4%) | 47 (9.7%) |
| 1 Vehicle | 220 (27.1%) | 209 (43.0%) |
| 2 Vehicles | 285 (35.1%) | 168 (34.6%) |
| 3 or more Vehicles | 238 (29.3%) | 62 (12.8%) |
| Total | 811 (100.0%) | 486 (100.0%) |
Real Estate & Mortgages in Providence
Real Estate and Mortgage Overview in Providence
| Characteristic | Without Mortgage | With Mortgage |
| Housing Units | 585 | 226 |
| Median Property Value | $53,300 | $0 |
| Median Household Income | $33,990 | $26 |
| Monthly Housing Costs | $369 | $16 |
| Real Estate Taxes | $401 | $22 |
Property Value by Mortgage Status in Providence
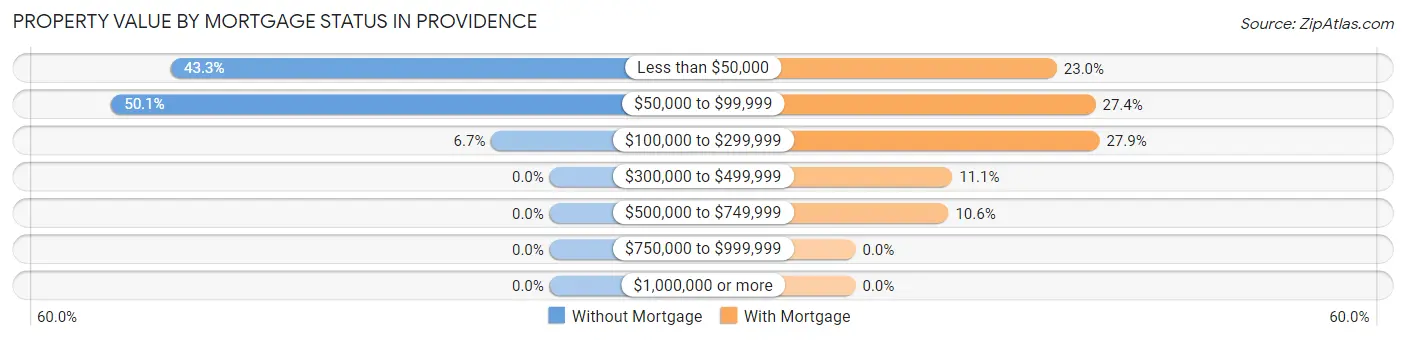
| Property Value | Without Mortgage | With Mortgage |
| Less than $50,000 | 253 (43.2%) | 52 (23.0%) |
| $50,000 to $99,999 | 293 (50.1%) | 62 (27.4%) |
| $100,000 to $299,999 | 39 (6.7%) | 63 (27.9%) |
| $300,000 to $499,999 | 0 (0.0%) | 25 (11.1%) |
| $500,000 to $749,999 | 0 (0.0%) | 24 (10.6%) |
| $750,000 to $999,999 | 0 (0.0%) | 0 (0.0%) |
| $1,000,000 or more | 0 (0.0%) | 0 (0.0%) |
| Total | 585 (100.0%) | 226 (100.0%) |
Household Income by Mortgage Status in Providence
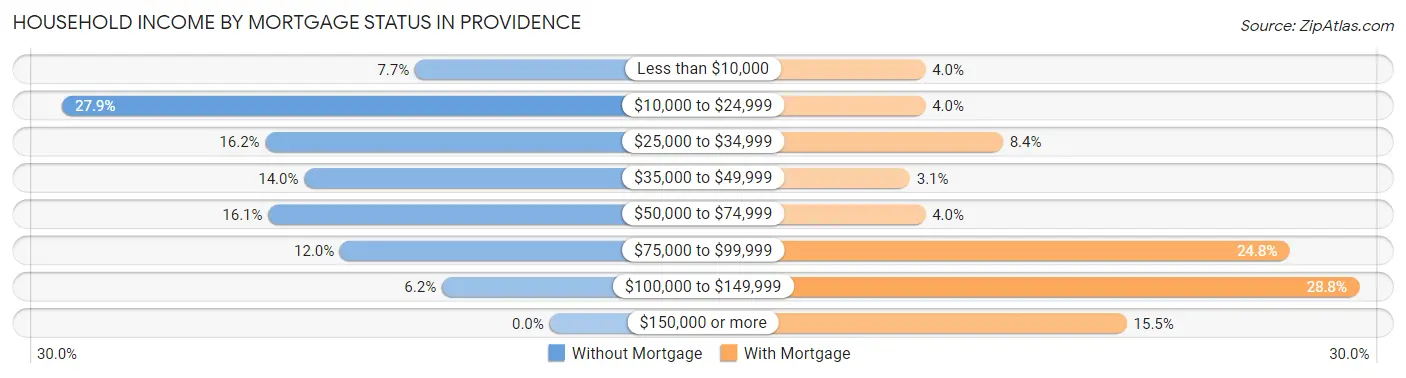
| Household Income | Without Mortgage | With Mortgage |
| Less than $10,000 | 45 (7.7%) | 9 (4.0%) |
| $10,000 to $24,999 | 163 (27.9%) | 9 (4.0%) |
| $25,000 to $34,999 | 95 (16.2%) | 19 (8.4%) |
| $35,000 to $49,999 | 82 (14.0%) | 7 (3.1%) |
| $50,000 to $74,999 | 94 (16.1%) | 9 (4.0%) |
| $75,000 to $99,999 | 70 (12.0%) | 56 (24.8%) |
| $100,000 to $149,999 | 36 (6.1%) | 65 (28.8%) |
| $150,000 or more | 0 (0.0%) | 35 (15.5%) |
| Total | 585 (100.0%) | 226 (100.0%) |
Property Value to Household Income Ratio in Providence
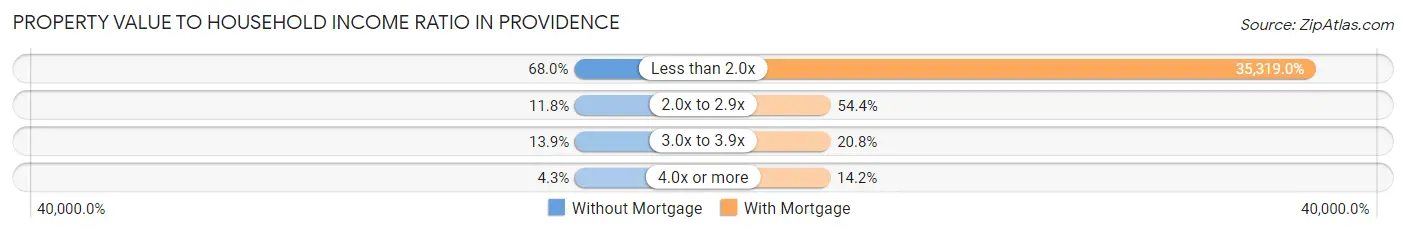
| Value-to-Income Ratio | Without Mortgage | With Mortgage |
| Less than 2.0x | 398 (68.0%) | 79,821 (35,319.0%) |
| 2.0x to 2.9x | 69 (11.8%) | 123 (54.4%) |
| 3.0x to 3.9x | 81 (13.9%) | 47 (20.8%) |
| 4.0x or more | 25 (4.3%) | 32 (14.2%) |
| Total | 585 (100.0%) | 226 (100.0%) |
Real Estate Taxes by Mortgage Status in Providence
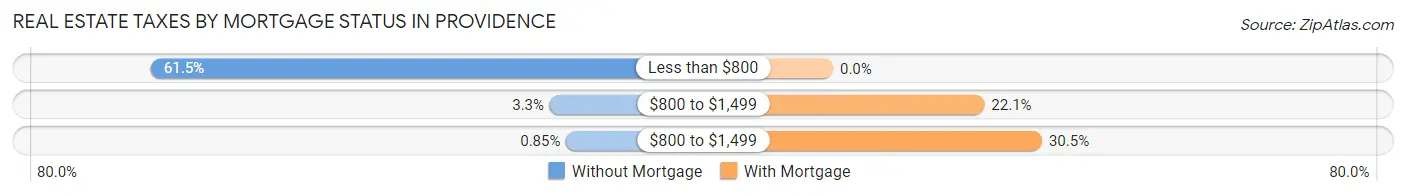
| Property Taxes | Without Mortgage | With Mortgage |
| Less than $800 | 360 (61.5%) | 0 (0.0%) |
| $800 to $1,499 | 19 (3.3%) | 50 (22.1%) |
| $800 to $1,499 | 5 (0.9%) | 69 (30.5%) |
| Total | 585 (100.0%) | 226 (100.0%) |
Health & Disability in Providence
Health Insurance Coverage by Age in Providence
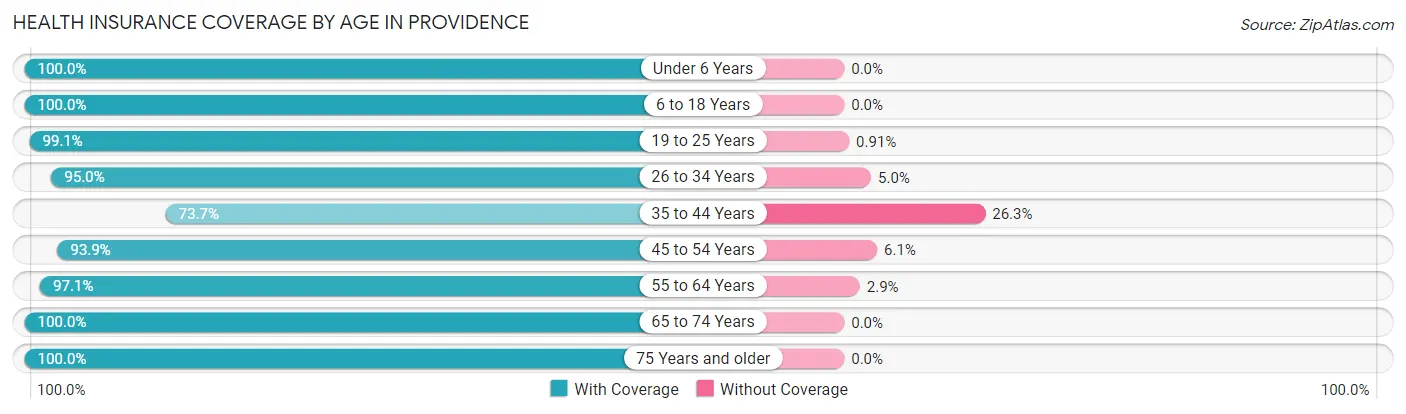
| Age Bracket | With Coverage | Without Coverage |
| Under 6 Years | 114 (100.0%) | 0 (0.0%) |
| 6 to 18 Years | 372 (100.0%) | 0 (0.0%) |
| 19 to 25 Years | 327 (99.1%) | 3 (0.9%) |
| 26 to 34 Years | 114 (95.0%) | 6 (5.0%) |
| 35 to 44 Years | 283 (73.7%) | 101 (26.3%) |
| 45 to 54 Years | 445 (93.9%) | 29 (6.1%) |
| 55 to 64 Years | 535 (97.1%) | 16 (2.9%) |
| 65 to 74 Years | 325 (100.0%) | 0 (0.0%) |
| 75 Years and older | 192 (100.0%) | 0 (0.0%) |
| Total | 2,707 (94.6%) | 155 (5.4%) |
Health Insurance Coverage by Citizenship Status in Providence
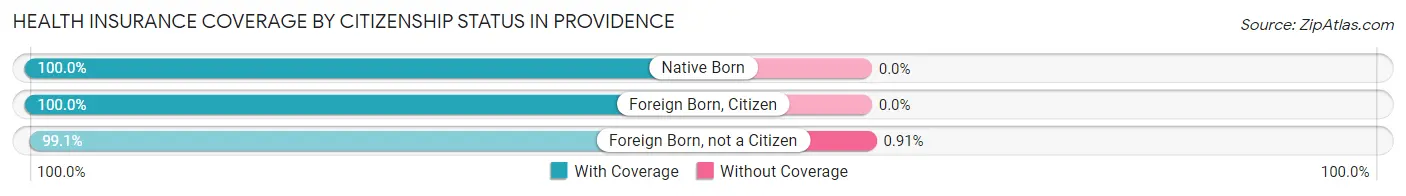
| Citizenship Status | With Coverage | Without Coverage |
| Native Born | 114 (100.0%) | 0 (0.0%) |
| Foreign Born, Citizen | 372 (100.0%) | 0 (0.0%) |
| Foreign Born, not a Citizen | 327 (99.1%) | 3 (0.9%) |
Health Insurance Coverage by Household Income in Providence
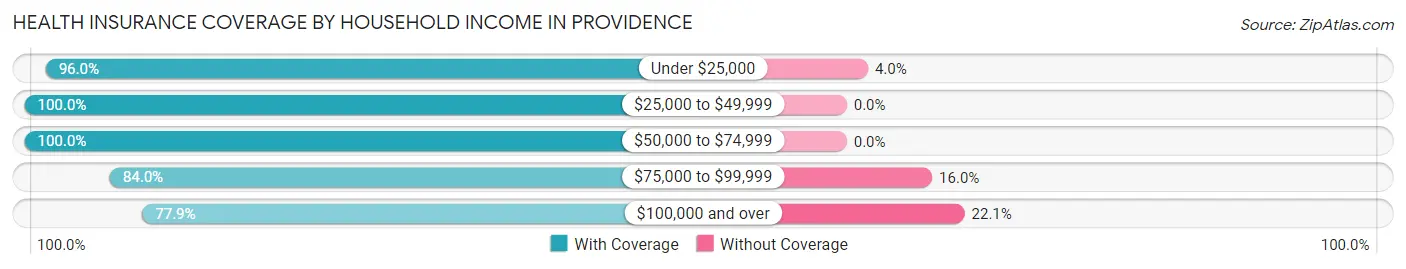
| Household Income | With Coverage | Without Coverage |
| Under $25,000 | 629 (96.0%) | 26 (4.0%) |
| $25,000 to $49,999 | 591 (100.0%) | 0 (0.0%) |
| $50,000 to $74,999 | 941 (100.0%) | 0 (0.0%) |
| $75,000 to $99,999 | 247 (84.0%) | 47 (16.0%) |
| $100,000 and over | 279 (77.9%) | 79 (22.1%) |
Public vs Private Health Insurance Coverage by Age in Providence
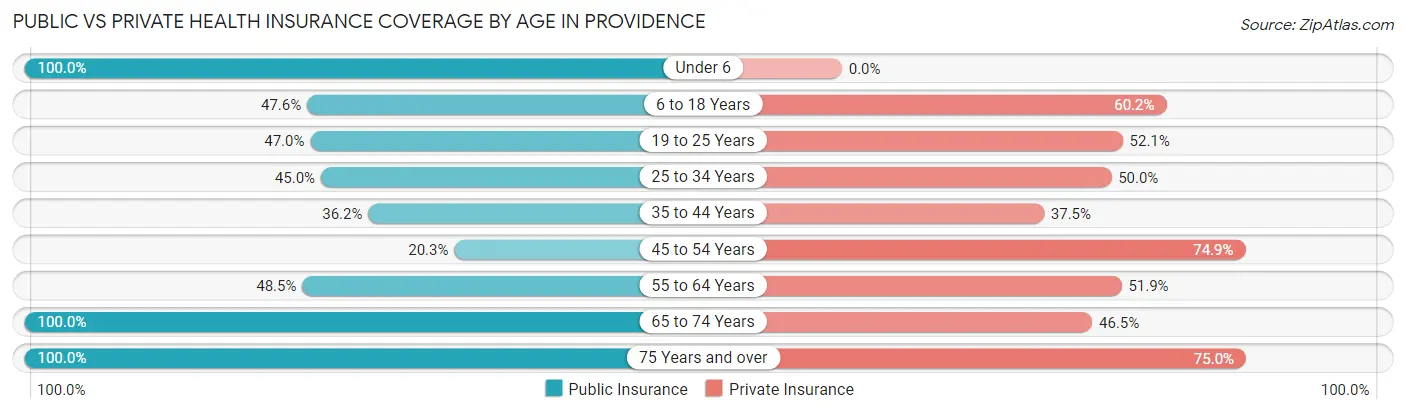
| Age Bracket | Public Insurance | Private Insurance |
| Under 6 | 114 (100.0%) | 0 (0.0%) |
| 6 to 18 Years | 177 (47.6%) | 224 (60.2%) |
| 19 to 25 Years | 155 (47.0%) | 172 (52.1%) |
| 25 to 34 Years | 54 (45.0%) | 60 (50.0%) |
| 35 to 44 Years | 139 (36.2%) | 144 (37.5%) |
| 45 to 54 Years | 96 (20.3%) | 355 (74.9%) |
| 55 to 64 Years | 267 (48.5%) | 286 (51.9%) |
| 65 to 74 Years | 325 (100.0%) | 151 (46.5%) |
| 75 Years and over | 192 (100.0%) | 144 (75.0%) |
| Total | 1,519 (53.1%) | 1,536 (53.7%) |
Disability Status by Sex by Age in Providence
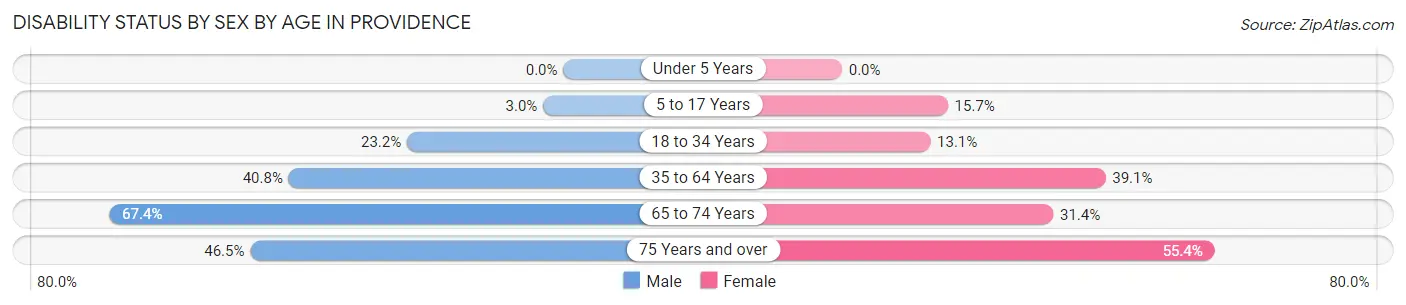
| Age Bracket | Male | Female |
| Under 5 Years | 0 (0.0%) | 0 (0.0%) |
| 5 to 17 Years | 6 (3.0%) | 25 (15.7%) |
| 18 to 34 Years | 65 (23.2%) | 24 (13.1%) |
| 35 to 64 Years | 312 (40.8%) | 252 (39.1%) |
| 65 to 74 Years | 116 (67.4%) | 48 (31.4%) |
| 75 Years and over | 33 (46.5%) | 67 (55.4%) |
Disability Class by Sex by Age in Providence
Disability Class: Hearing Difficulty
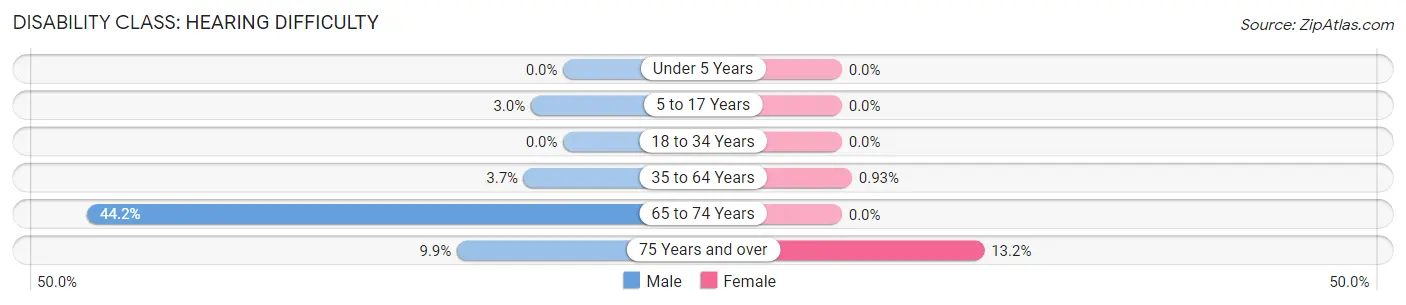
| Age Bracket | Male | Female |
| Under 5 Years | 0 (0.0%) | 0 (0.0%) |
| 5 to 17 Years | 6 (3.0%) | 0 (0.0%) |
| 18 to 34 Years | 0 (0.0%) | 0 (0.0%) |
| 35 to 64 Years | 28 (3.7%) | 6 (0.9%) |
| 65 to 74 Years | 76 (44.2%) | 0 (0.0%) |
| 75 Years and over | 7 (9.9%) | 16 (13.2%) |
Disability Class: Vision Difficulty
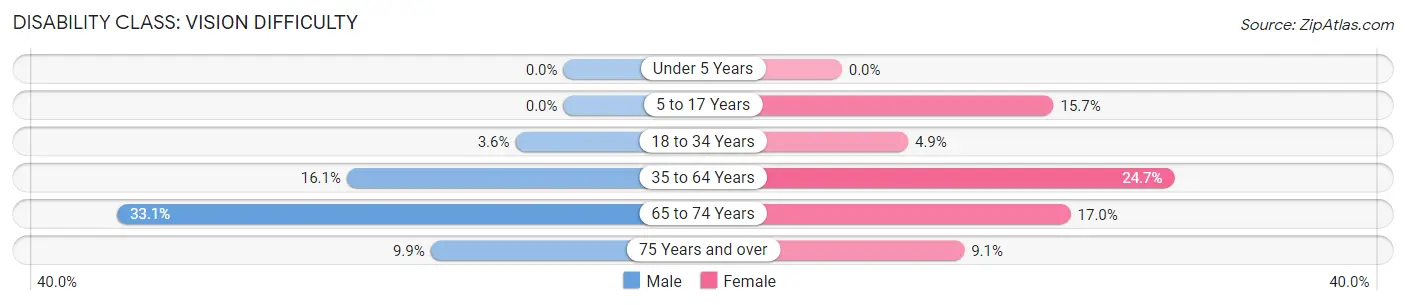
| Age Bracket | Male | Female |
| Under 5 Years | 0 (0.0%) | 0 (0.0%) |
| 5 to 17 Years | 0 (0.0%) | 25 (15.7%) |
| 18 to 34 Years | 10 (3.6%) | 9 (4.9%) |
| 35 to 64 Years | 123 (16.1%) | 159 (24.7%) |
| 65 to 74 Years | 57 (33.1%) | 26 (17.0%) |
| 75 Years and over | 7 (9.9%) | 11 (9.1%) |
Disability Class: Cognitive Difficulty
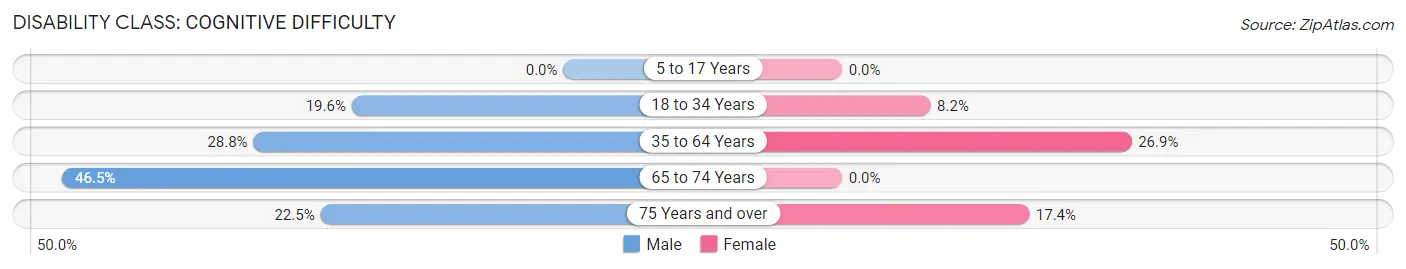
| Age Bracket | Male | Female |
| 5 to 17 Years | 0 (0.0%) | 0 (0.0%) |
| 18 to 34 Years | 55 (19.6%) | 15 (8.2%) |
| 35 to 64 Years | 220 (28.8%) | 173 (26.9%) |
| 65 to 74 Years | 80 (46.5%) | 0 (0.0%) |
| 75 Years and over | 16 (22.5%) | 21 (17.4%) |
Disability Class: Ambulatory Difficulty
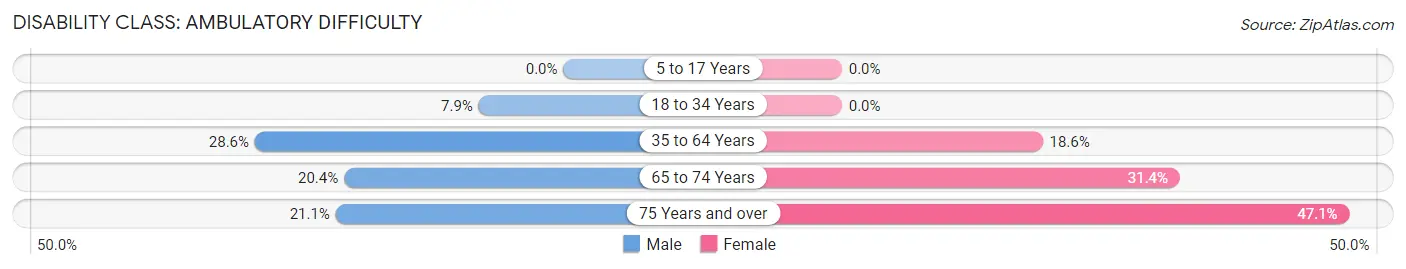
| Age Bracket | Male | Female |
| 5 to 17 Years | 0 (0.0%) | 0 (0.0%) |
| 18 to 34 Years | 22 (7.9%) | 0 (0.0%) |
| 35 to 64 Years | 219 (28.6%) | 120 (18.6%) |
| 65 to 74 Years | 35 (20.3%) | 48 (31.4%) |
| 75 Years and over | 15 (21.1%) | 57 (47.1%) |
Disability Class: Self-Care Difficulty
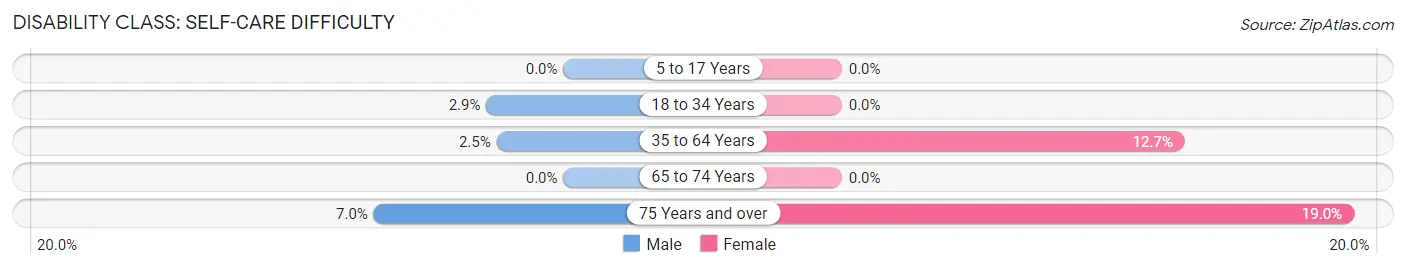
| Age Bracket | Male | Female |
| 5 to 17 Years | 0 (0.0%) | 0 (0.0%) |
| 18 to 34 Years | 8 (2.9%) | 0 (0.0%) |
| 35 to 64 Years | 19 (2.5%) | 82 (12.7%) |
| 65 to 74 Years | 0 (0.0%) | 0 (0.0%) |
| 75 Years and over | 5 (7.0%) | 23 (19.0%) |
Technology Access in Providence
Computing Device Access in Providence
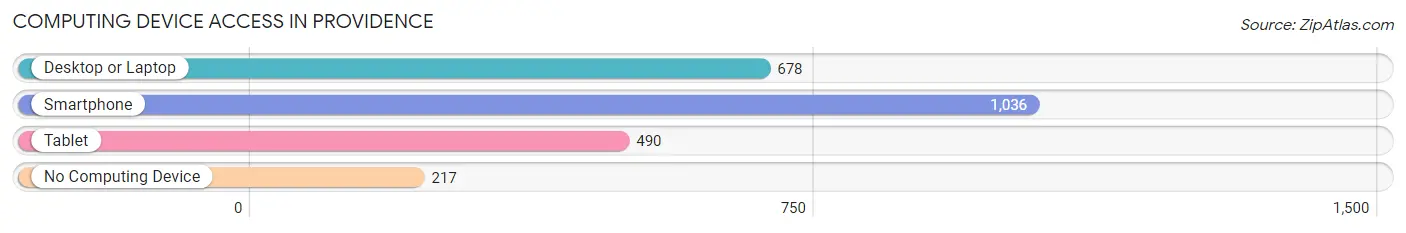
| Device Type | # Households | % Households |
| Desktop or Laptop | 678 | 52.3% |
| Smartphone | 1,036 | 79.9% |
| Tablet | 490 | 37.8% |
| No Computing Device | 217 | 16.7% |
| Total | 1,297 | 100.0% |
Internet Access in Providence
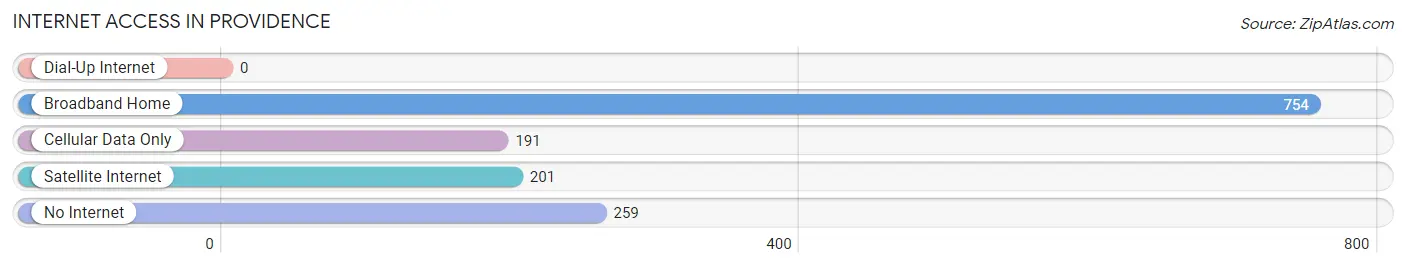
| Internet Type | # Households | % Households |
| Dial-Up Internet | 0 | 0.0% |
| Broadband Home | 754 | 58.1% |
| Cellular Data Only | 191 | 14.7% |
| Satellite Internet | 201 | 15.5% |
| No Internet | 259 | 20.0% |
| Total | 1,297 | 100.0% |
Providence Summary
Providence, Kentucky is a small city located in the western part of the state, in the county of Webster. It is situated on the banks of the Green River, and is part of the Owensboro metropolitan area. The city has a population of approximately 1,500 people, and is known for its rural charm and friendly atmosphere.
History
The area that is now Providence was first settled in the early 1800s by a group of settlers from Virginia. The town was originally known as “Providence Station”, and was a stop on the Louisville and Nashville Railroad. The town was officially incorporated in 1867, and was named after the biblical city of Providence.
In the late 1800s, Providence was a thriving agricultural community, with a variety of crops being grown in the area. The town was also home to several businesses, including a sawmill, a gristmill, and a general store.
In the early 1900s, Providence began to experience a period of growth and development. The town was home to several churches, a bank, a post office, and a variety of other businesses. The town also had a thriving school system, with several elementary and high schools.
Geography
Providence is located in the western part of Kentucky, in the county of Webster. The city is situated on the banks of the Green River, and is part of the Owensboro metropolitan area. The city has a total area of 1.2 square miles, all of which is land.
The climate in Providence is humid subtropical, with hot, humid summers and mild winters. The average annual temperature is around 60 degrees Fahrenheit, and the average annual precipitation is around 45 inches.
Economy
The economy of Providence is largely based on agriculture and tourism. The city is home to several farms, which produce a variety of crops, including corn, soybeans, and wheat. The city is also home to several tourist attractions, including the Green River State Park and the Providence Country Club.
The city is also home to several businesses, including a variety of restaurants, retail stores, and service providers. The city is also home to several manufacturing companies, which produce a variety of products, including furniture, clothing, and automotive parts.
Demographics
As of the 2010 census, the population of Providence was 1,500 people. The racial makeup of the city was 97.3% White, 0.7% African American, 0.3% Native American, 0.3% Asian, and 1.3% from other races. The median household income in the city was $37,500, and the median family income was $45,000.
The city is home to several churches, including the Providence Baptist Church, the Providence United Methodist Church, and the Providence Presbyterian Church. The city is also home to several schools, including the Providence Elementary School, the Providence Middle School, and the Providence High School.
Common Questions
What is Per Capita Income in Providence?
Per Capita income in Providence is $24,983.
What is the Median Family Income in Providence?
Median Family Income in Providence is $55,711.
What is the Median Household income in Providence?
Median Household Income in Providence is $49,954.
What is Income or Wage Gap in Providence?
Income or Wage Gap in Providence is 18.1%.
Women in Providence earn 81.9 cents for every dollar earned by a man.
What is Inequality or Gini Index in Providence?
Inequality or Gini Index in Providence is 0.40.
What is the Total Population of Providence?
Total Population of Providence is 2,883.
What is the Total Male Population of Providence?
Total Male Population of Providence is 1,586.
What is the Total Female Population of Providence?
Total Female Population of Providence is 1,297.
What is the Ratio of Males per 100 Females in Providence?
There are 122.28 Males per 100 Females in Providence.
What is the Ratio of Females per 100 Males in Providence?
There are 81.78 Females per 100 Males in Providence.
What is the Median Population Age in Providence?
Median Population Age in Providence is 46.3 Years.
What is the Average Family Size in Providence
Average Family Size in Providence is 2.5 People.
What is the Average Household Size in Providence
Average Household Size in Providence is 2.2 People.
How Large is the Labor Force in Providence?
There are 1,303 People in the Labor Forcein in Providence.
What is the Percentage of People in the Labor Force in Providence?
52.0% of People are in the Labor Force in Providence.
What is the Unemployment Rate in Providence?
Unemployment Rate in Providence is 8.2%.