Versailles, KY Map & Demographics
Versailles Map
Versailles Overview
$32,984
PER CAPITA INCOME
$80,052
AVG FAMILY INCOME
$55,606
AVG HOUSEHOLD INCOME
22.3%
WAGE / INCOME GAP [ % ]
77.7¢/ $1
WAGE / INCOME GAP [ $ ]
$12,729
FAMILY INCOME DEFICIT
0.43
INEQUALITY / GINI INDEX
10,297
TOTAL POPULATION
5,071
MALE POPULATION
5,226
FEMALE POPULATION
97.03
MALES / 100 FEMALES
103.06
FEMALES / 100 MALES
39.8
MEDIAN AGE
3.0
AVG FAMILY SIZE
2.4
AVG HOUSEHOLD SIZE
5,671
LABOR FORCE [ PEOPLE ]
69.3%
PERCENT IN LABOR FORCE
2.9%
UNEMPLOYMENT RATE
Versailles Zip Codes
Versailles Area Codes
Income in Versailles
Income Overview in Versailles
Per Capita Income in Versailles is $32,984, while median incomes of families and households are $80,052 and $55,606 respectively.
| Characteristic | Number | Measure |
| Per Capita Income | 10,297 | $32,984 |
| Median Family Income | 2,750 | $80,052 |
| Mean Family Income | 2,750 | $94,239 |
| Median Household Income | 4,243 | $55,606 |
| Mean Household Income | 4,243 | $77,720 |
| Income Deficit | 2,750 | $12,729 |
| Wage / Income Gap (%) | 10,297 | 22.26% |
| Wage / Income Gap ($) | 10,297 | 77.74¢ per $1 |
| Gini / Inequality Index | 10,297 | 0.43 |
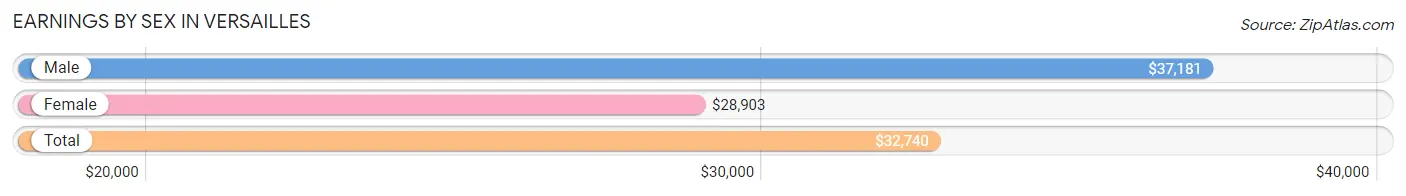
Earnings by Sex in Versailles
Average Earnings in Versailles are $32,740, $37,181 for men and $28,903 for women, a difference of 22.3%.
| Sex | Number | Average Earnings |
| Male | 3,191 (53.9%) | $37,181 |
| Female | 2,725 (46.1%) | $28,903 |
| Total | 5,916 (100.0%) | $32,740 |
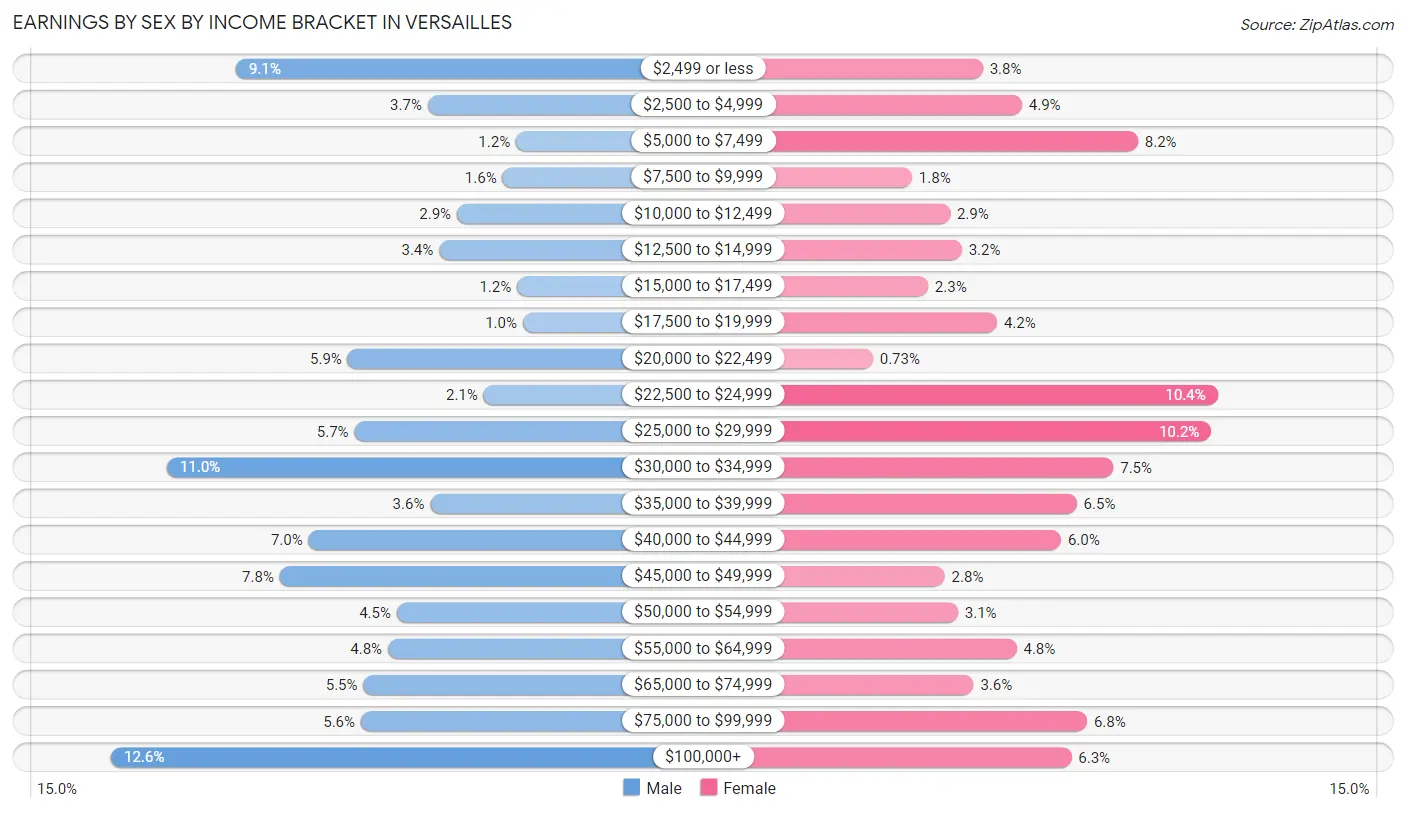
Earnings by Sex by Income Bracket in Versailles
The most common earnings brackets in Versailles are $100,000+ for men (401 | 12.6%) and $22,500 to $24,999 for women (284 | 10.4%).
| Income | Male | Female |
| $2,499 or less | 289 (9.1%) | 104 (3.8%) |
| $2,500 to $4,999 | 117 (3.7%) | 134 (4.9%) |
| $5,000 to $7,499 | 38 (1.2%) | 223 (8.2%) |
| $7,500 to $9,999 | 50 (1.6%) | 50 (1.8%) |
| $10,000 to $12,499 | 91 (2.9%) | 79 (2.9%) |
| $12,500 to $14,999 | 107 (3.4%) | 88 (3.2%) |
| $15,000 to $17,499 | 37 (1.2%) | 62 (2.3%) |
| $17,500 to $19,999 | 32 (1.0%) | 115 (4.2%) |
| $20,000 to $22,499 | 189 (5.9%) | 20 (0.7%) |
| $22,500 to $24,999 | 67 (2.1%) | 284 (10.4%) |
| $25,000 to $29,999 | 183 (5.7%) | 279 (10.2%) |
| $30,000 to $34,999 | 351 (11.0%) | 204 (7.5%) |
| $35,000 to $39,999 | 115 (3.6%) | 176 (6.5%) |
| $40,000 to $44,999 | 224 (7.0%) | 164 (6.0%) |
| $45,000 to $49,999 | 250 (7.8%) | 75 (2.8%) |
| $50,000 to $54,999 | 145 (4.5%) | 85 (3.1%) |
| $55,000 to $64,999 | 153 (4.8%) | 130 (4.8%) |
| $65,000 to $74,999 | 175 (5.5%) | 97 (3.6%) |
| $75,000 to $99,999 | 177 (5.6%) | 184 (6.8%) |
| $100,000+ | 401 (12.6%) | 172 (6.3%) |
| Total | 3,191 (100.0%) | 2,725 (100.0%) |
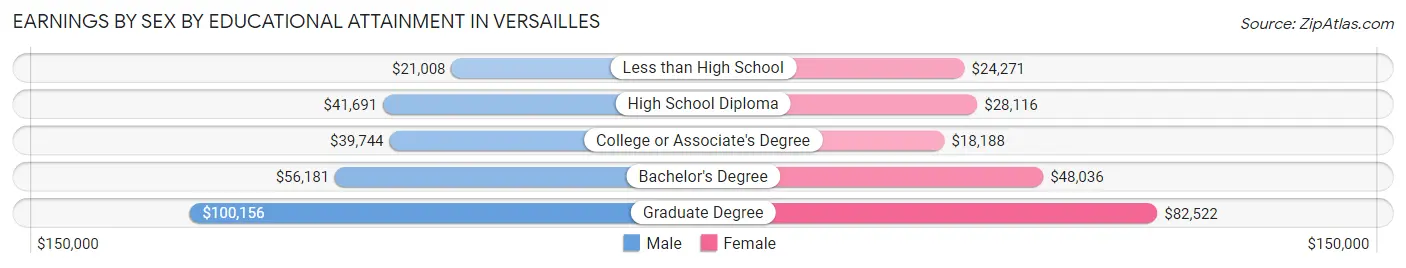
Earnings by Sex by Educational Attainment in Versailles
Average earnings in Versailles are $42,442 for men and $31,452 for women, a difference of 25.9%. Men with an educational attainment of graduate degree enjoy the highest average annual earnings of $100,156, while those with less than high school education earn the least with $21,008. Women with an educational attainment of graduate degree earn the most with the average annual earnings of $82,522, while those with college or associate's degree education have the smallest earnings of $18,188.
| Educational Attainment | Male Income | Female Income |
| Less than High School | $21,008 | $24,271 |
| High School Diploma | $41,691 | $28,116 |
| College or Associate's Degree | $39,744 | $18,188 |
| Bachelor's Degree | $56,181 | $48,036 |
| Graduate Degree | $100,156 | $82,522 |
| Total | $42,442 | $31,452 |
Family Income in Versailles
Family Income Brackets in Versailles
According to the Versailles family income data, there are 597 families falling into the $100,000 to $149,999 income range, which is the most common income bracket and makes up 21.7% of all families. Conversely, the $10,000 to $14,999 income bracket is the least frequent group with only 19 families (0.7%) belonging to this category.
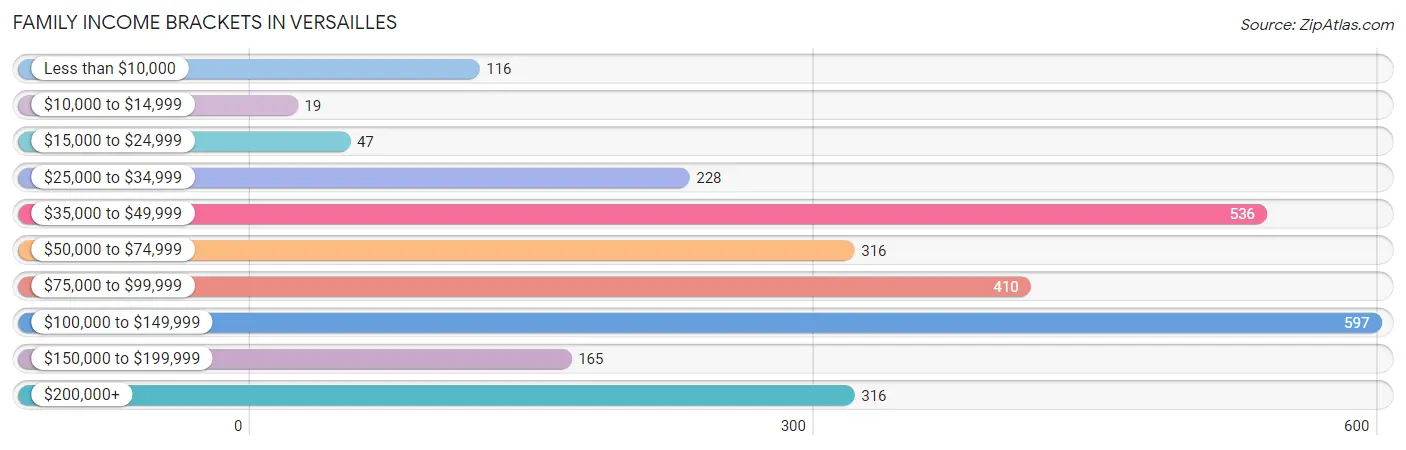
| Income Bracket | # Families | % Families |
| Less than $10,000 | 116 | 4.2% |
| $10,000 to $14,999 | 19 | 0.7% |
| $15,000 to $24,999 | 47 | 1.7% |
| $25,000 to $34,999 | 228 | 8.3% |
| $35,000 to $49,999 | 536 | 19.5% |
| $50,000 to $74,999 | 316 | 11.5% |
| $75,000 to $99,999 | 410 | 14.9% |
| $100,000 to $149,999 | 597 | 21.7% |
| $150,000 to $199,999 | 165 | 6.0% |
| $200,000+ | 316 | 11.5% |
Family Income by Famaliy Size in Versailles
2-person families (1,513 | 55.0%) account for the highest median family income in Versailles with $80,662 per family, while 2-person families (1,513 | 55.0%) have the highest median income of $40,331 per family member.
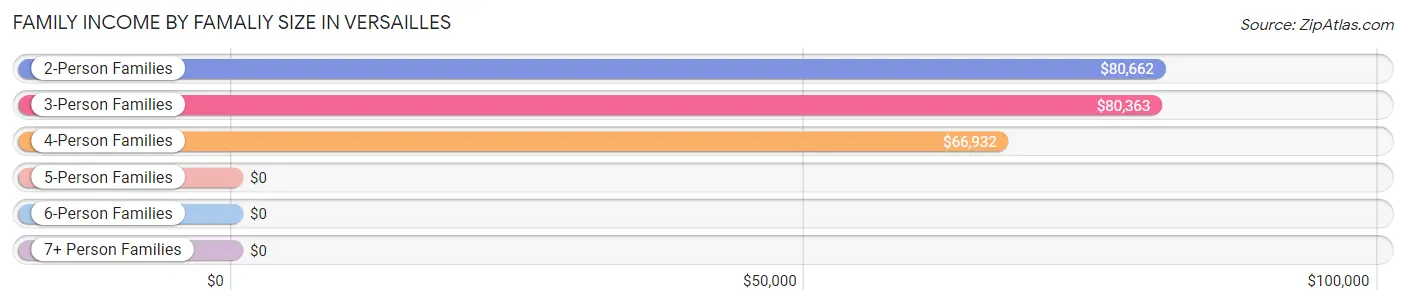
| Income Bracket | # Families | Median Income |
| 2-Person Families | 1,513 (55.0%) | $80,662 |
| 3-Person Families | 599 (21.8%) | $80,363 |
| 4-Person Families | 379 (13.8%) | $66,932 |
| 5-Person Families | 92 (3.4%) | $0 |
| 6-Person Families | 48 (1.8%) | $0 |
| 7+ Person Families | 119 (4.3%) | $0 |
| Total | 2,750 (100.0%) | $80,052 |
Family Income by Number of Earners in Versailles
The median family income in Versailles is $80,052, with families comprising 3+ earners (175) having the highest median family income of $145,050, while families with 1 earner (878) have the lowest median family income of $44,850, accounting for 6.4% and 31.9% of families, respectively.
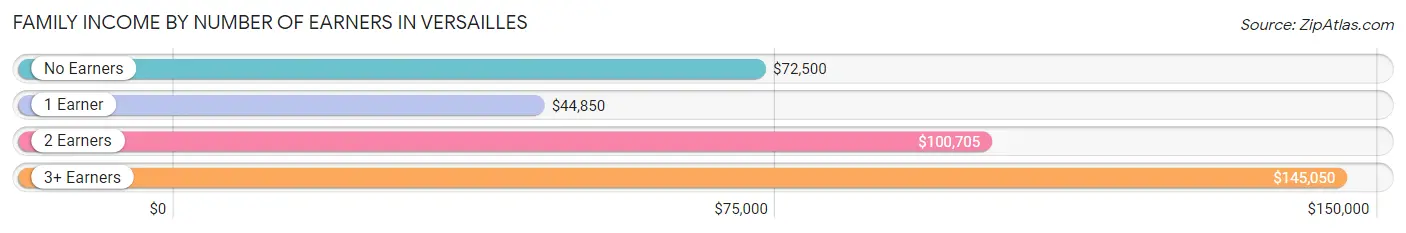
| Number of Earners | # Families | Median Income |
| No Earners | 294 (10.7%) | $72,500 |
| 1 Earner | 878 (31.9%) | $44,850 |
| 2 Earners | 1,403 (51.0%) | $100,705 |
| 3+ Earners | 175 (6.4%) | $145,050 |
| Total | 2,750 (100.0%) | $80,052 |
Household Income in Versailles
Household Income Brackets in Versailles
With 768 households falling in the category, the $35,000 to $49,999 income range is the most frequent in Versailles, accounting for 18.1% of all households. In contrast, only 106 households (2.5%) fall into the $10,000 to $14,999 income bracket, making it the least populous group.
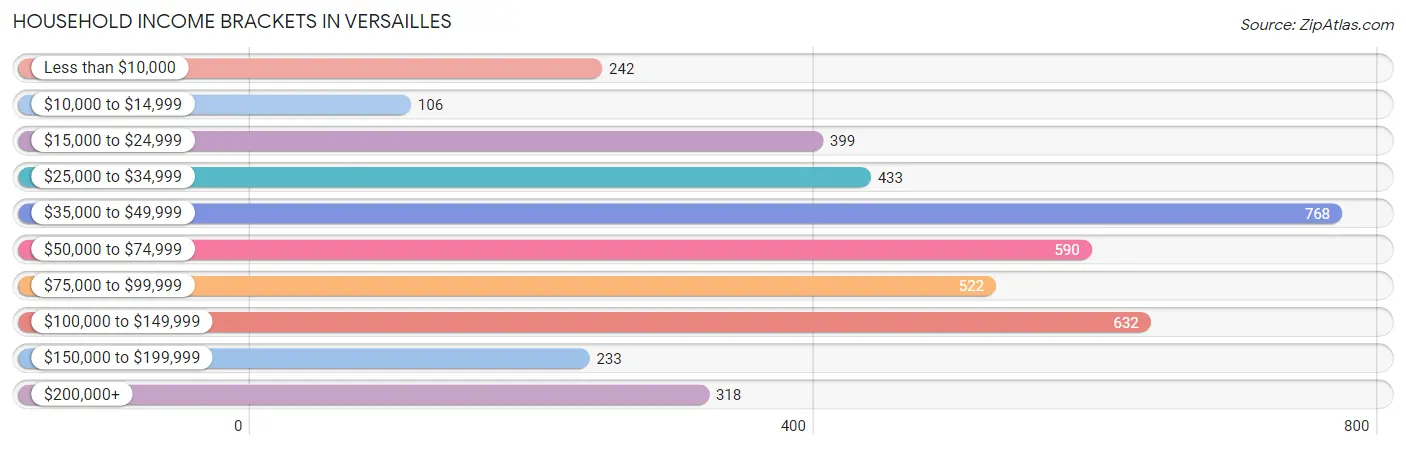
| Income Bracket | # Households | % Households |
| Less than $10,000 | 242 | 5.7% |
| $10,000 to $14,999 | 106 | 2.5% |
| $15,000 to $24,999 | 399 | 9.4% |
| $25,000 to $34,999 | 433 | 10.2% |
| $35,000 to $49,999 | 768 | 18.1% |
| $50,000 to $74,999 | 590 | 13.9% |
| $75,000 to $99,999 | 522 | 12.3% |
| $100,000 to $149,999 | 632 | 14.9% |
| $150,000 to $199,999 | 233 | 5.5% |
| $200,000+ | 318 | 7.5% |
Household Income by Householder Age in Versailles
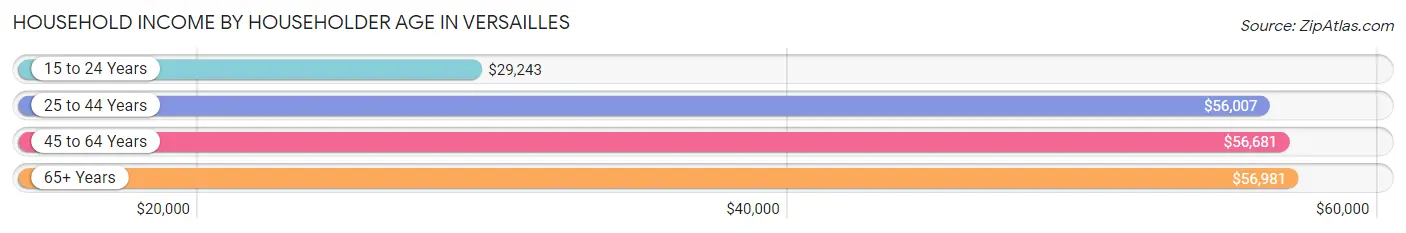
The median household income in Versailles is $55,606, with the highest median household income of $56,981 found in the 65+ years age bracket for the primary householder. A total of 1,167 households (27.5%) fall into this category. Meanwhile, the 15 to 24 years age bracket for the primary householder has the lowest median household income of $29,243, with 246 households (5.8%) in this group.
| Income Bracket | # Households | Median Income |
| 15 to 24 Years | 246 (5.8%) | $29,243 |
| 25 to 44 Years | 1,239 (29.2%) | $56,007 |
| 45 to 64 Years | 1,591 (37.5%) | $56,681 |
| 65+ Years | 1,167 (27.5%) | $56,981 |
| Total | 4,243 (100.0%) | $55,606 |
Poverty in Versailles
Income Below Poverty by Sex and Age in Versailles
With 13.6% poverty level for males and 12.2% for females among the residents of Versailles, 25 to 34 year old males and 16 and 17 year old females are the most vulnerable to poverty, with 238 males (32.7%) and 46 females (39.0%) in their respective age groups living below the poverty level.
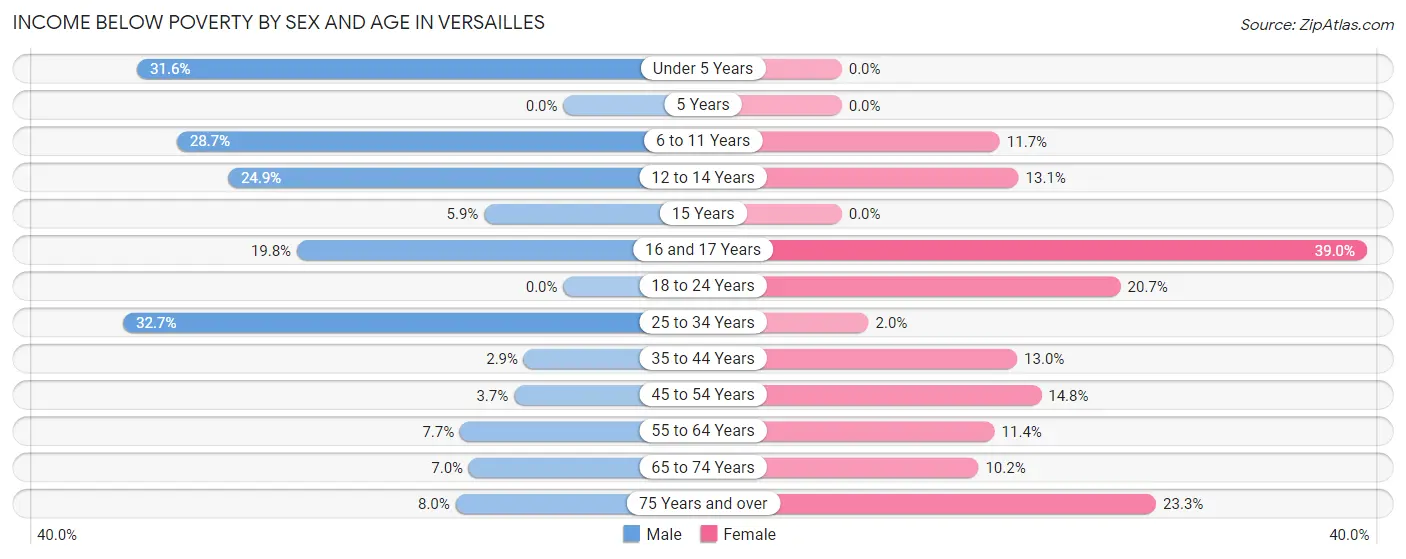
| Age Bracket | Male | Female |
| Under 5 Years | 81 (31.6%) | 0 (0.0%) |
| 5 Years | 0 (0.0%) | 0 (0.0%) |
| 6 to 11 Years | 126 (28.7%) | 33 (11.7%) |
| 12 to 14 Years | 62 (24.9%) | 26 (13.1%) |
| 15 Years | 1 (5.9%) | 0 (0.0%) |
| 16 and 17 Years | 18 (19.8%) | 46 (39.0%) |
| 18 to 24 Years | 0 (0.0%) | 113 (20.7%) |
| 25 to 34 Years | 238 (32.7%) | 9 (2.0%) |
| 35 to 44 Years | 18 (2.9%) | 82 (13.0%) |
| 45 to 54 Years | 20 (3.7%) | 73 (14.8%) |
| 55 to 64 Years | 55 (7.7%) | 96 (11.4%) |
| 65 to 74 Years | 39 (7.0%) | 66 (10.2%) |
| 75 Years and over | 22 (8.0%) | 88 (23.3%) |
| Total | 680 (13.6%) | 632 (12.2%) |
Income Above Poverty by Sex and Age in Versailles
According to the poverty statistics in Versailles, males aged 5 years and females aged under 5 years are the age groups that are most secure financially, with 100.0% of males and 100.0% of females in these age groups living above the poverty line.
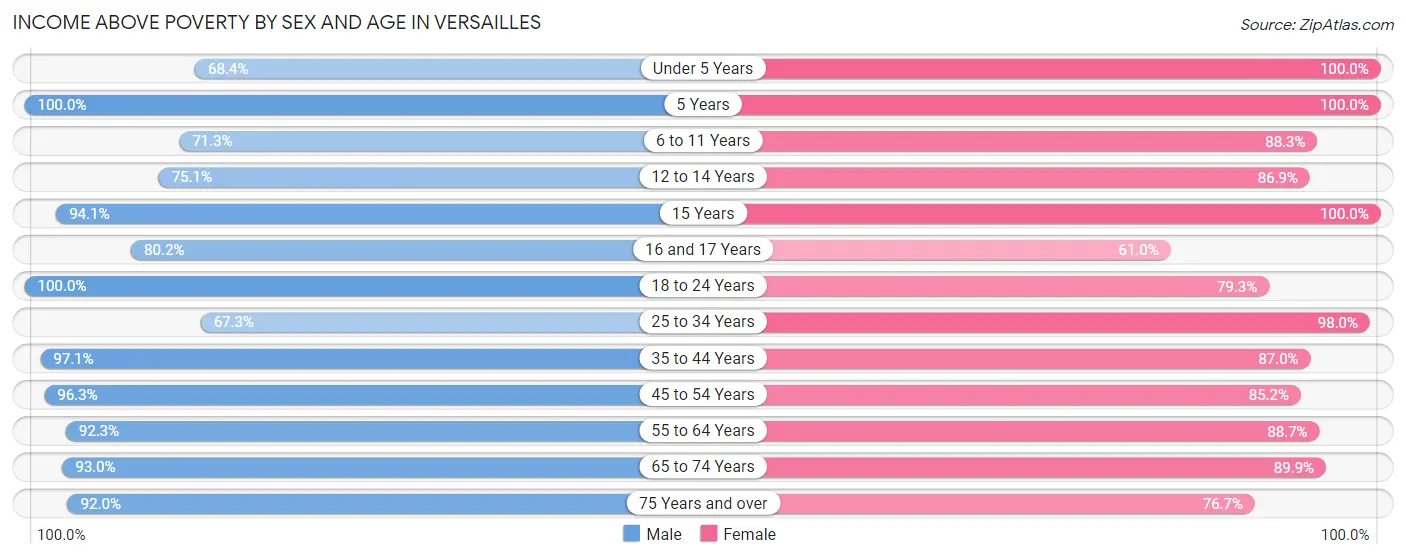
| Age Bracket | Male | Female |
| Under 5 Years | 175 (68.4%) | 444 (100.0%) |
| 5 Years | 48 (100.0%) | 111 (100.0%) |
| 6 to 11 Years | 313 (71.3%) | 248 (88.3%) |
| 12 to 14 Years | 187 (75.1%) | 172 (86.9%) |
| 15 Years | 16 (94.1%) | 43 (100.0%) |
| 16 and 17 Years | 73 (80.2%) | 72 (61.0%) |
| 18 to 24 Years | 453 (100.0%) | 433 (79.3%) |
| 25 to 34 Years | 490 (67.3%) | 443 (98.0%) |
| 35 to 44 Years | 597 (97.1%) | 548 (87.0%) |
| 45 to 54 Years | 526 (96.3%) | 420 (85.2%) |
| 55 to 64 Years | 662 (92.3%) | 750 (88.6%) |
| 65 to 74 Years | 517 (93.0%) | 584 (89.8%) |
| 75 Years and over | 253 (92.0%) | 289 (76.7%) |
| Total | 4,310 (86.4%) | 4,557 (87.8%) |
Income Below Poverty Among Married-Couple Families in Versailles
The poverty statistics for married-couple families in Versailles show that 5.1% or 92 of the total 1,791 families live below the poverty line. Families with 3 or 4 children have the highest poverty rate of 15.0%, comprising of 18 families. On the other hand, families with no children have the lowest poverty rate of 1.8%, which includes 20 families.
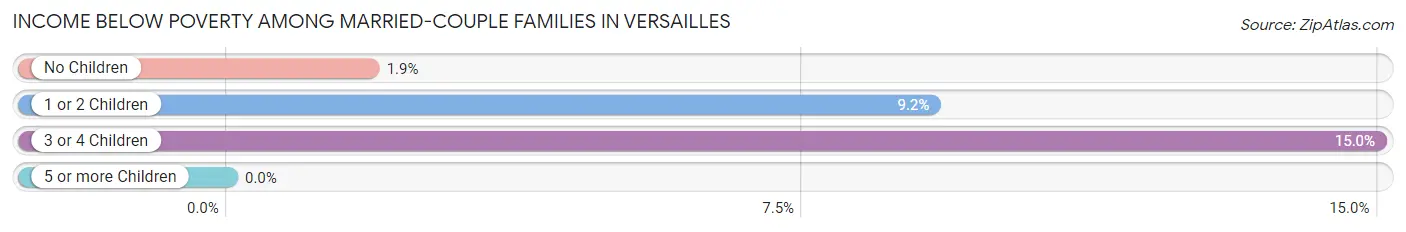
| Children | Above Poverty | Below Poverty |
| No Children | 1,063 (98.2%) | 20 (1.8%) |
| 1 or 2 Children | 534 (90.8%) | 54 (9.2%) |
| 3 or 4 Children | 102 (85.0%) | 18 (15.0%) |
| 5 or more Children | 0 (0.0%) | 0 (0.0%) |
| Total | 1,699 (94.9%) | 92 (5.1%) |
Income Below Poverty Among Single-Parent Households in Versailles
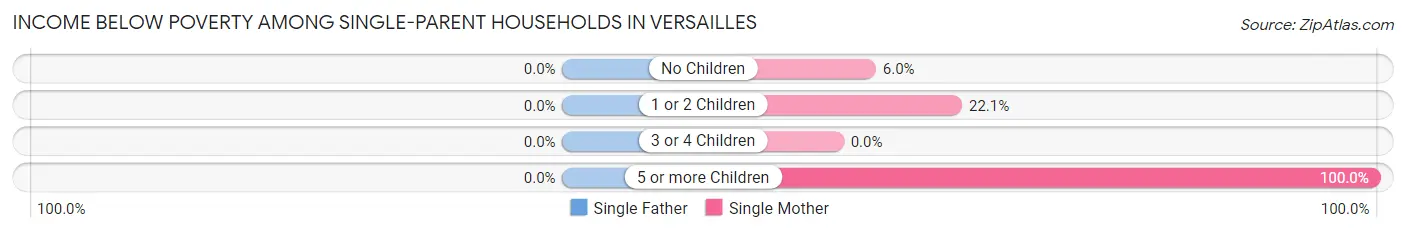
| Children | Single Father | Single Mother |
| No Children | 0 (0.0%) | 13 (6.0%) |
| 1 or 2 Children | 0 (0.0%) | 97 (22.1%) |
| 3 or 4 Children | 0 (0.0%) | 0 (0.0%) |
| 5 or more Children | 0 (0.0%) | 47 (100.0%) |
| Total | 0 (0.0%) | 157 (20.9%) |
Income Below Poverty Among Married-Couple vs Single-Parent Households in Versailles
The poverty data for Versailles shows that 92 of the married-couple family households (5.1%) and 157 of the single-parent households (16.4%) are living below the poverty level. Within the married-couple family households, those with 3 or 4 children have the highest poverty rate, with 18 households (15.0%) falling below the poverty line. Among the single-parent households, those with 5 or more children have the highest poverty rate, with 47 household (100.0%) living below poverty.
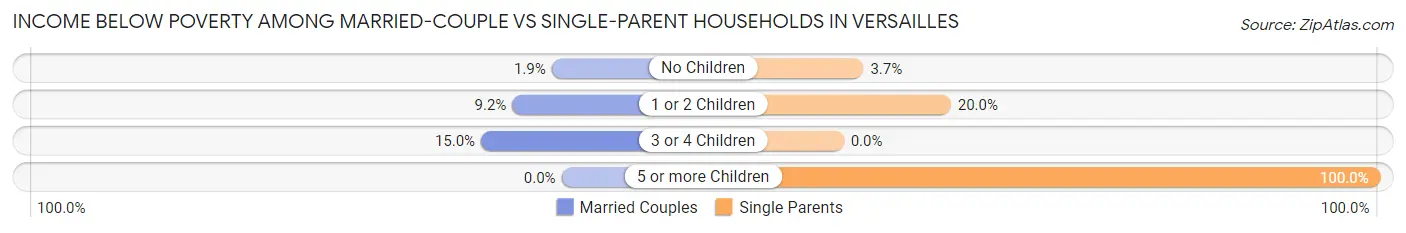
| Children | Married-Couple Families | Single-Parent Households |
| No Children | 20 (1.8%) | 13 (3.7%) |
| 1 or 2 Children | 54 (9.2%) | 97 (20.0%) |
| 3 or 4 Children | 18 (15.0%) | 0 (0.0%) |
| 5 or more Children | 0 (0.0%) | 47 (100.0%) |
| Total | 92 (5.1%) | 157 (16.4%) |
Race in Versailles
The most populous races in Versailles are White / Caucasian (8,494 | 82.5%), Hispanic or Latino (1,378 | 13.4%), and Black / African American (707 | 6.9%).
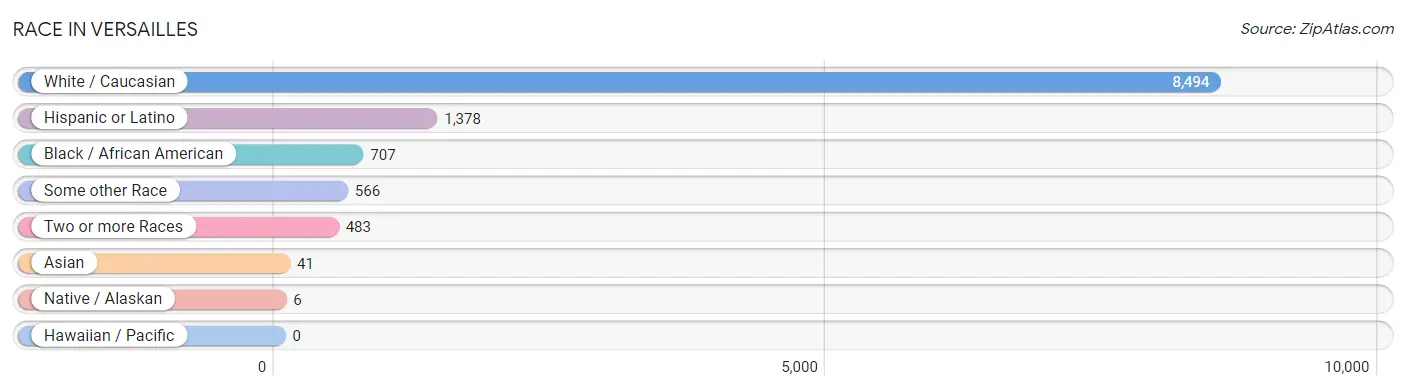
| Race | # Population | % Population |
| Asian | 41 | 0.4% |
| Black / African American | 707 | 6.9% |
| Hawaiian / Pacific | 0 | 0.0% |
| Hispanic or Latino | 1,378 | 13.4% |
| Native / Alaskan | 6 | 0.1% |
| White / Caucasian | 8,494 | 82.5% |
| Two or more Races | 483 | 4.7% |
| Some other Race | 566 | 5.5% |
| Total | 10,297 | 100.0% |
Ancestry in Versailles
The most populous ancestries reported in Versailles are American (1,514 | 14.7%), Mexican (1,301 | 12.6%), English (1,157 | 11.2%), Irish (959 | 9.3%), and German (815 | 7.9%), together accounting for 55.8% of all Versailles residents.
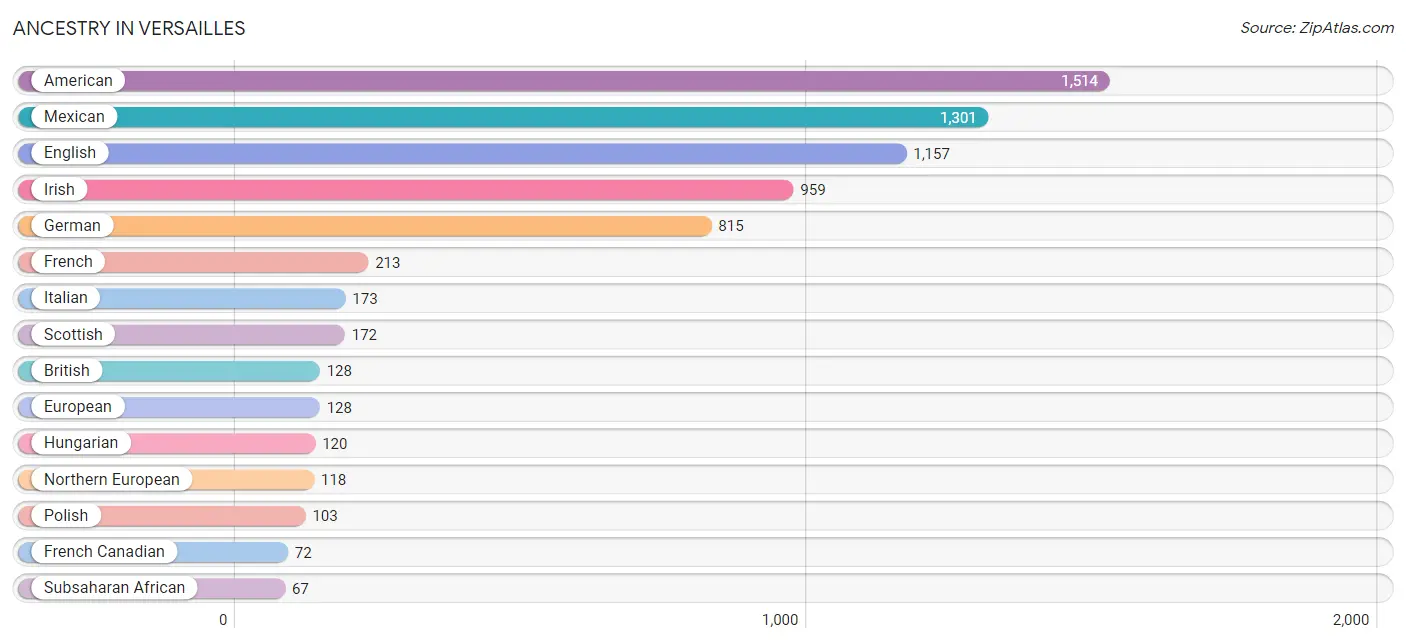
| Ancestry | # Population | % Population |
| African | 39 | 0.4% |
| Alsatian | 14 | 0.1% |
| American | 1,514 | 14.7% |
| Austrian | 19 | 0.2% |
| British | 128 | 1.2% |
| Burmese | 64 | 0.6% |
| Central American | 42 | 0.4% |
| Danish | 8 | 0.1% |
| Dutch | 63 | 0.6% |
| Eastern European | 20 | 0.2% |
| English | 1,157 | 11.2% |
| European | 128 | 1.2% |
| French | 213 | 2.1% |
| French Canadian | 72 | 0.7% |
| German | 815 | 7.9% |
| Greek | 8 | 0.1% |
| Honduran | 29 | 0.3% |
| Hungarian | 120 | 1.2% |
| Indian (Asian) | 6 | 0.1% |
| Irish | 959 | 9.3% |
| Italian | 173 | 1.7% |
| Japanese | 1 | 0.0% |
| Lithuanian | 21 | 0.2% |
| Mexican | 1,301 | 12.6% |
| Nigerian | 28 | 0.3% |
| Northern European | 118 | 1.1% |
| Norwegian | 15 | 0.2% |
| Polish | 103 | 1.0% |
| Puerto Rican | 35 | 0.3% |
| Russian | 9 | 0.1% |
| Salvadoran | 13 | 0.1% |
| Samoan | 29 | 0.3% |
| Scotch-Irish | 63 | 0.6% |
| Scottish | 172 | 1.7% |
| Sioux | 7 | 0.1% |
| Slovak | 13 | 0.1% |
| Slovene | 9 | 0.1% |
| Subsaharan African | 67 | 0.6% |
| Swedish | 50 | 0.5% |
| Welsh | 55 | 0.5% | View All 40 Rows |
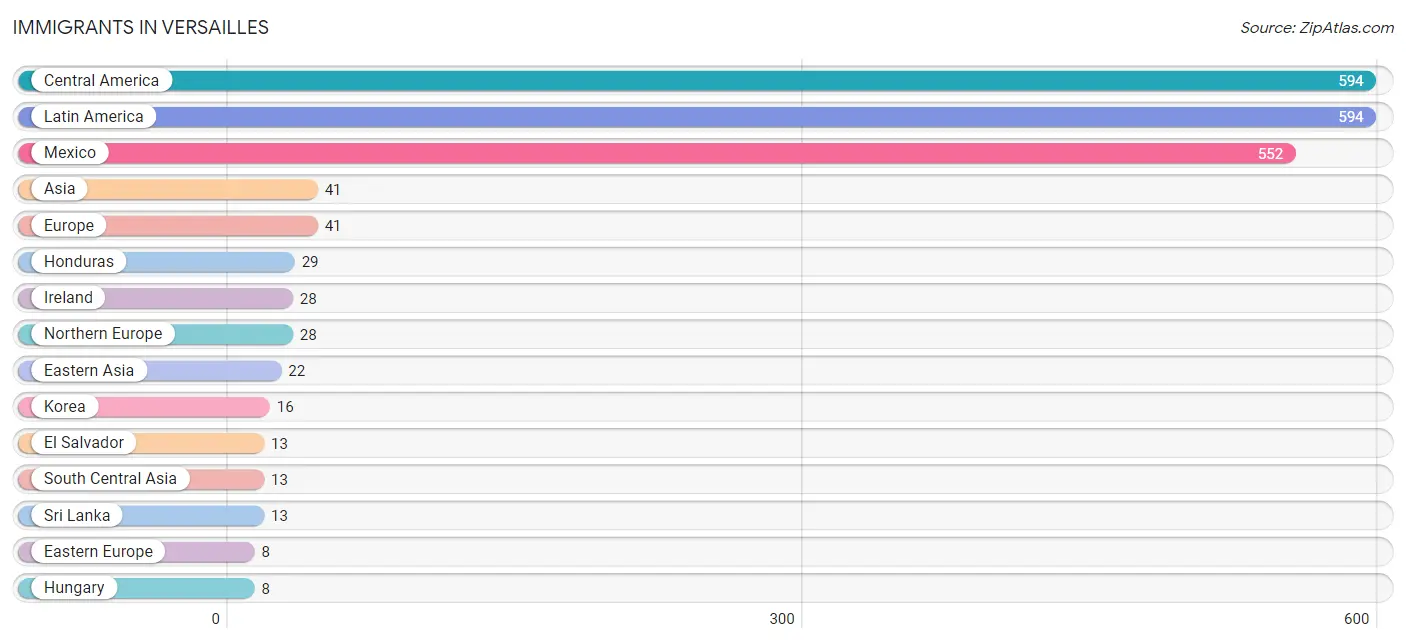
Immigrants in Versailles
The most numerous immigrant groups reported in Versailles came from Central America (594 | 5.8%), Latin America (594 | 5.8%), Mexico (552 | 5.4%), Asia (41 | 0.4%), and Europe (41 | 0.4%), together accounting for 17.7% of all Versailles residents.
| Immigration Origin | # Population | % Population |
| Asia | 41 | 0.4% |
| Cambodia | 1 | 0.0% |
| Canada | 6 | 0.1% |
| Central America | 594 | 5.8% |
| China | 6 | 0.1% |
| Eastern Asia | 22 | 0.2% |
| Eastern Europe | 8 | 0.1% |
| El Salvador | 13 | 0.1% |
| Europe | 41 | 0.4% |
| Germany | 5 | 0.1% |
| Honduras | 29 | 0.3% |
| Hungary | 8 | 0.1% |
| Ireland | 28 | 0.3% |
| Korea | 16 | 0.2% |
| Latin America | 594 | 5.8% |
| Malaysia | 5 | 0.1% |
| Mexico | 552 | 5.4% |
| Northern Europe | 28 | 0.3% |
| South Central Asia | 13 | 0.1% |
| South Eastern Asia | 6 | 0.1% |
| Sri Lanka | 13 | 0.1% |
| Western Europe | 5 | 0.1% | View All 22 Rows |
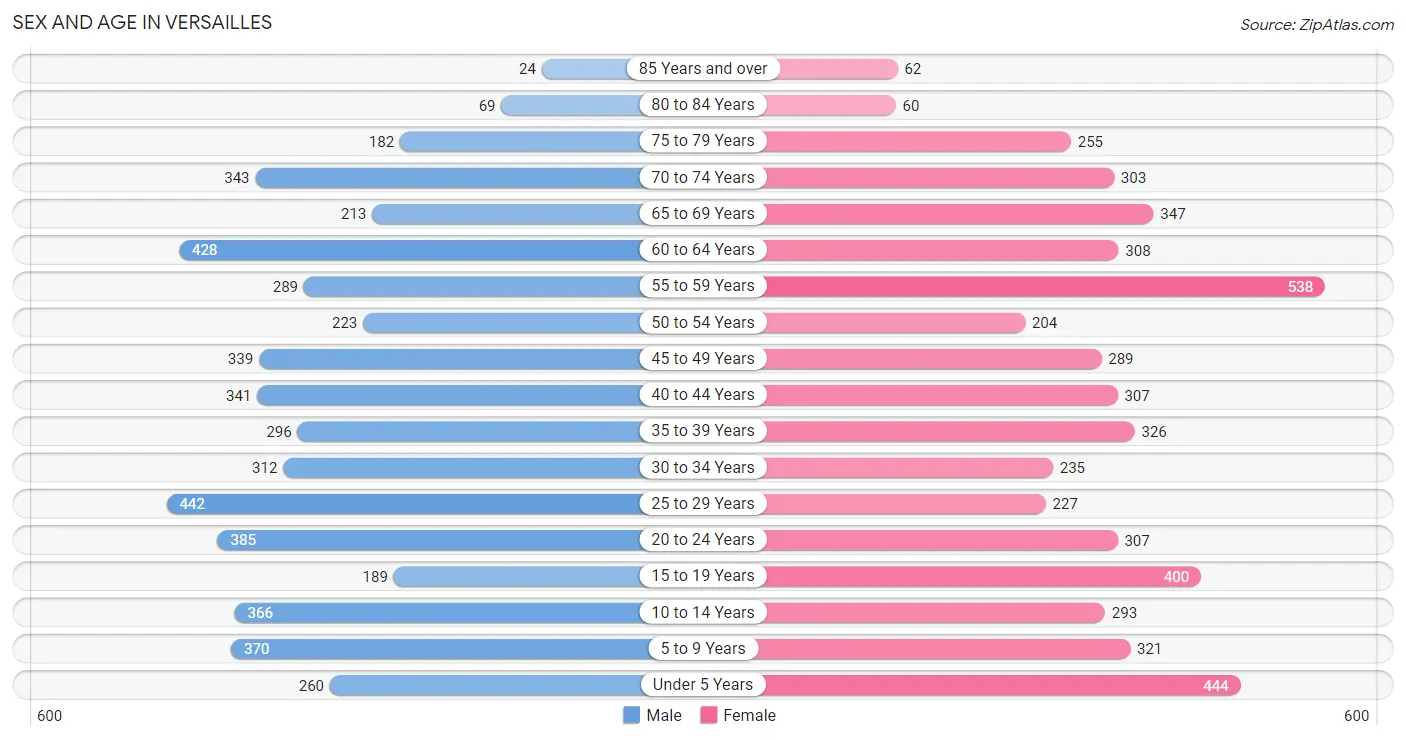
Sex and Age in Versailles
Sex and Age in Versailles
The most populous age groups in Versailles are 25 to 29 Years (442 | 8.7%) for men and 55 to 59 Years (538 | 10.3%) for women.
| Age Bracket | Male | Female |
| Under 5 Years | 260 (5.1%) | 444 (8.5%) |
| 5 to 9 Years | 370 (7.3%) | 321 (6.1%) |
| 10 to 14 Years | 366 (7.2%) | 293 (5.6%) |
| 15 to 19 Years | 189 (3.7%) | 400 (7.6%) |
| 20 to 24 Years | 385 (7.6%) | 307 (5.9%) |
| 25 to 29 Years | 442 (8.7%) | 227 (4.3%) |
| 30 to 34 Years | 312 (6.1%) | 235 (4.5%) |
| 35 to 39 Years | 296 (5.8%) | 326 (6.2%) |
| 40 to 44 Years | 341 (6.7%) | 307 (5.9%) |
| 45 to 49 Years | 339 (6.7%) | 289 (5.5%) |
| 50 to 54 Years | 223 (4.4%) | 204 (3.9%) |
| 55 to 59 Years | 289 (5.7%) | 538 (10.3%) |
| 60 to 64 Years | 428 (8.4%) | 308 (5.9%) |
| 65 to 69 Years | 213 (4.2%) | 347 (6.6%) |
| 70 to 74 Years | 343 (6.8%) | 303 (5.8%) |
| 75 to 79 Years | 182 (3.6%) | 255 (4.9%) |
| 80 to 84 Years | 69 (1.4%) | 60 (1.1%) |
| 85 Years and over | 24 (0.5%) | 62 (1.2%) |
| Total | 5,071 (100.0%) | 5,226 (100.0%) |
Families and Households in Versailles
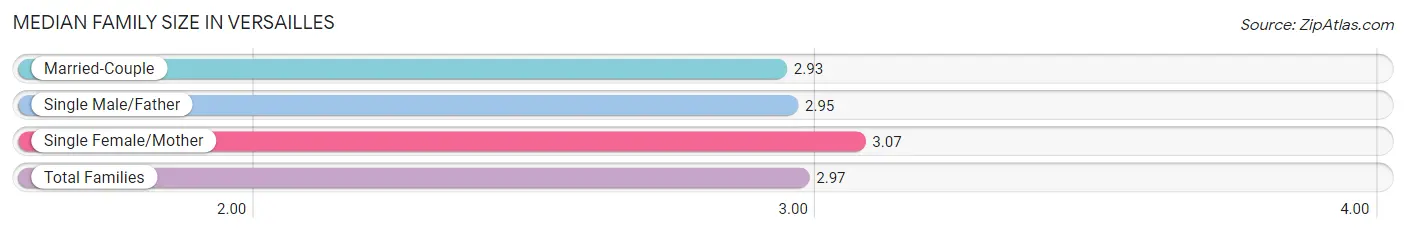
Median Family Size in Versailles
The median family size in Versailles is 2.97 persons per family, with single female/mother families (751 | 27.3%) accounting for the largest median family size of 3.07 persons per family. On the other hand, married-couple families (1,791 | 65.1%) represent the smallest median family size with 2.93 persons per family.
| Family Type | # Families | Family Size |
| Married-Couple | 1,791 (65.1%) | 2.93 |
| Single Male/Father | 208 (7.6%) | 2.95 |
| Single Female/Mother | 751 (27.3%) | 3.07 |
| Total Families | 2,750 (100.0%) | 2.97 |
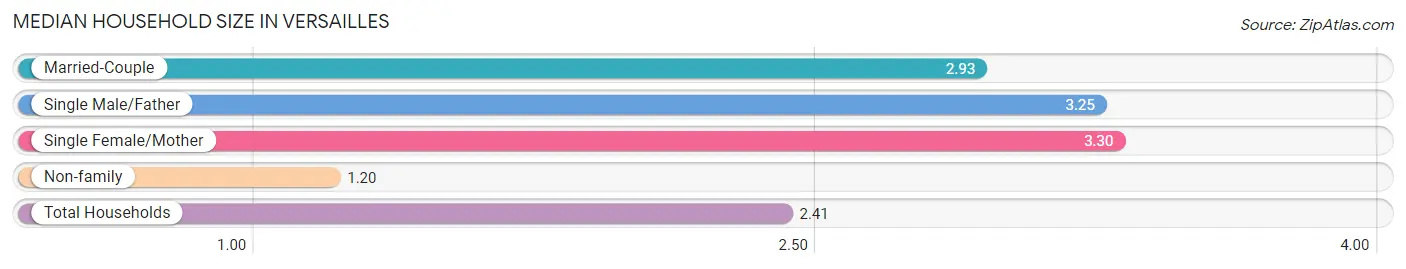
Median Household Size in Versailles
The median household size in Versailles is 2.41 persons per household, with single female/mother households (751 | 17.7%) accounting for the largest median household size of 3.3 persons per household. non-family households (1,493 | 35.2%) represent the smallest median household size with 1.20 persons per household.
| Household Type | # Households | Household Size |
| Married-Couple | 1,791 (42.2%) | 2.93 |
| Single Male/Father | 208 (4.9%) | 3.25 |
| Single Female/Mother | 751 (17.7%) | 3.30 |
| Non-family | 1,493 (35.2%) | 1.20 |
| Total Households | 4,243 (100.0%) | 2.41 |
Household Size by Marriage Status in Versailles
Out of a total of 4,243 households in Versailles, 2,750 (64.8%) are family households, while 1,493 (35.2%) are nonfamily households. The most numerous type of family households are 2-person households, comprising 1,413, and the most common type of nonfamily households are 1-person households, comprising 1,229.
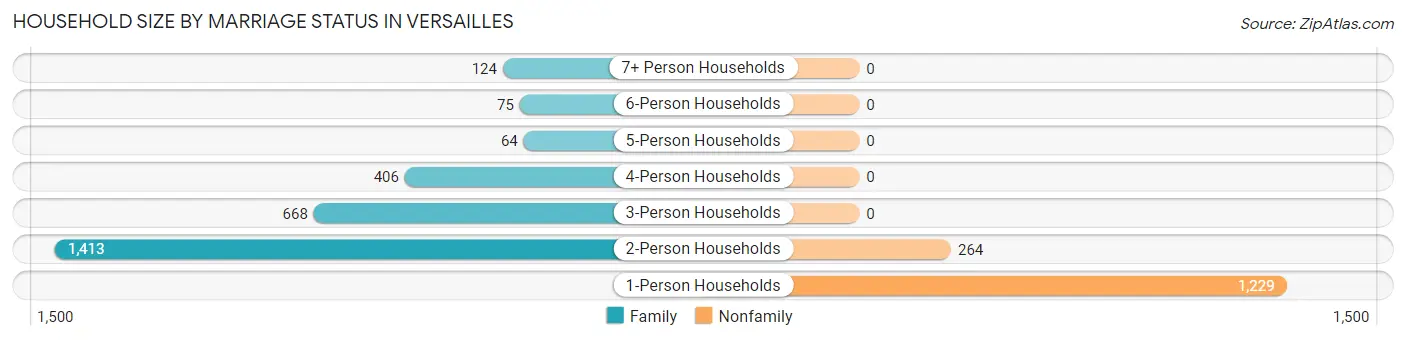
| Household Size | Family Households | Nonfamily Households |
| 1-Person Households | - | 1,229 (29.0%) |
| 2-Person Households | 1,413 (33.3%) | 264 (6.2%) |
| 3-Person Households | 668 (15.7%) | 0 (0.0%) |
| 4-Person Households | 406 (9.6%) | 0 (0.0%) |
| 5-Person Households | 64 (1.5%) | 0 (0.0%) |
| 6-Person Households | 75 (1.8%) | 0 (0.0%) |
| 7+ Person Households | 124 (2.9%) | 0 (0.0%) |
| Total | 2,750 (64.8%) | 1,493 (35.2%) |
Female Fertility in Versailles
Fertility by Age in Versailles
Average fertility rate in Versailles is 48.0 births per 1,000 women. Women in the age bracket of 20 to 34 years have the highest fertility rate with 120.0 births per 1,000 women. Women in the age bracket of 20 to 34 years acount for 89.3% of all women with births.
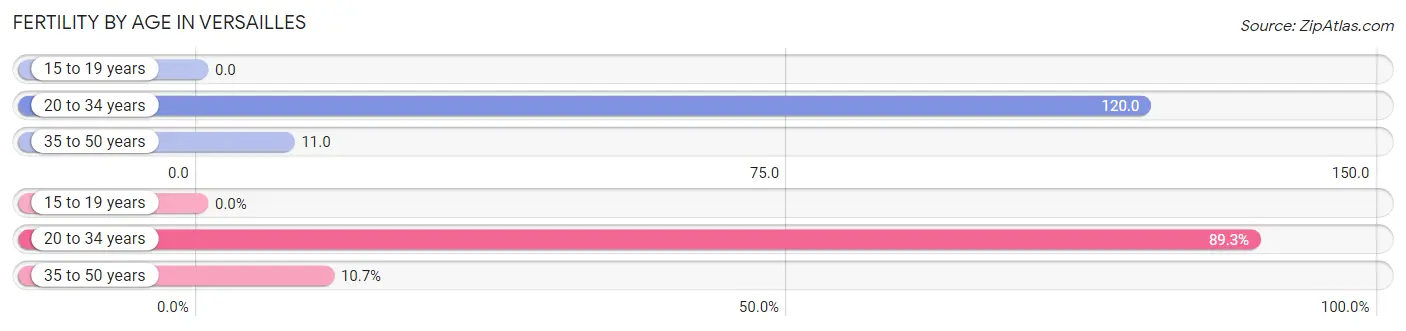
| Age Bracket | Women with Births | Births / 1,000 Women |
| 15 to 19 years | 0 (0.0%) | 0.0 |
| 20 to 34 years | 92 (89.3%) | 120.0 |
| 35 to 50 years | 11 (10.7%) | 11.0 |
| Total | 103 (100.0%) | 48.0 |
Fertility by Age by Marriage Status in Versailles
55.3% of women with births (103) in Versailles are married. The highest percentage of unmarried women with births falls into 20 to 34 years age bracket with 50.0% of them unmarried at the time of birth, while the lowest percentage of unmarried women with births belong to 35 to 50 years age bracket with 0.0% of them unmarried.
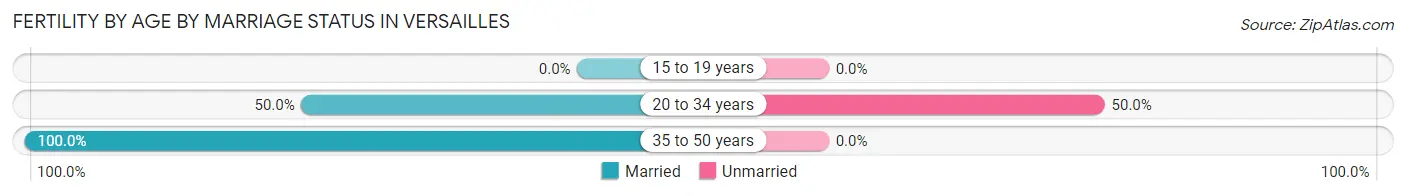
| Age Bracket | Married | Unmarried |
| 15 to 19 years | 0 (0.0%) | 0 (0.0%) |
| 20 to 34 years | 46 (50.0%) | 46 (50.0%) |
| 35 to 50 years | 11 (100.0%) | 0 (0.0%) |
| Total | 57 (55.3%) | 46 (44.7%) |
Fertility by Education in Versailles
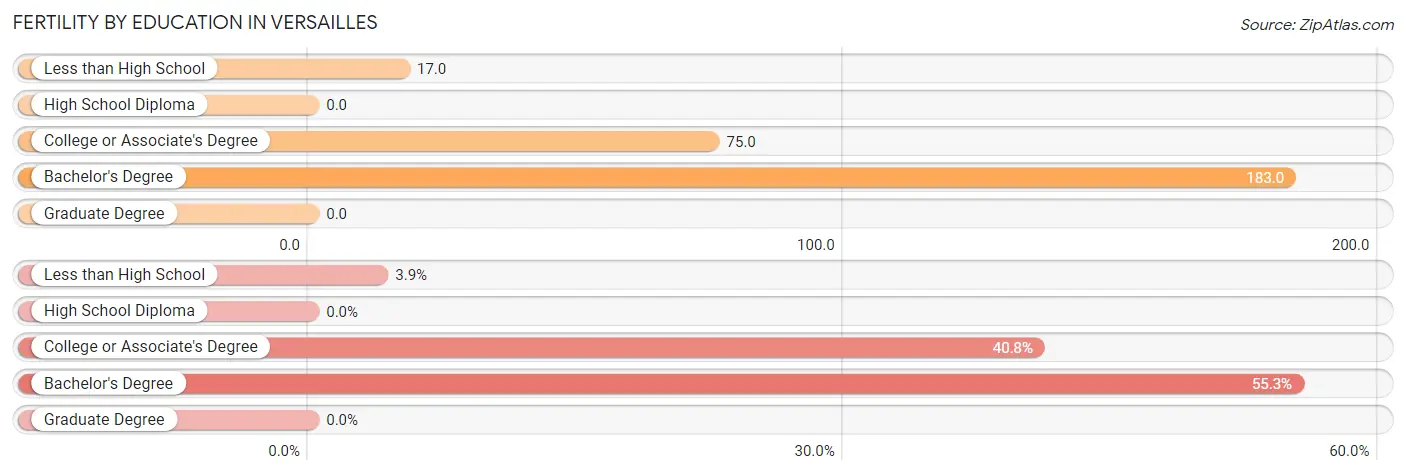
| Educational Attainment | Women with Births | Births / 1,000 Women |
| Less than High School | 4 (3.9%) | 17.0 |
| High School Diploma | 0 (0.0%) | 0.0 |
| College or Associate's Degree | 42 (40.8%) | 75.0 |
| Bachelor's Degree | 57 (55.3%) | 183.0 |
| Graduate Degree | 0 (0.0%) | 0.0 |
| Total | 103 (100.0%) | 48.0 |
Fertility by Education by Marriage Status in Versailles
44.7% of women with births in Versailles are unmarried. Women with the educational attainment of bachelor's degree are most likely to be married with 100.0% of them married at childbirth, while women with the educational attainment of less than high school are least likely to be married with 100.0% of them unmarried at childbirth.
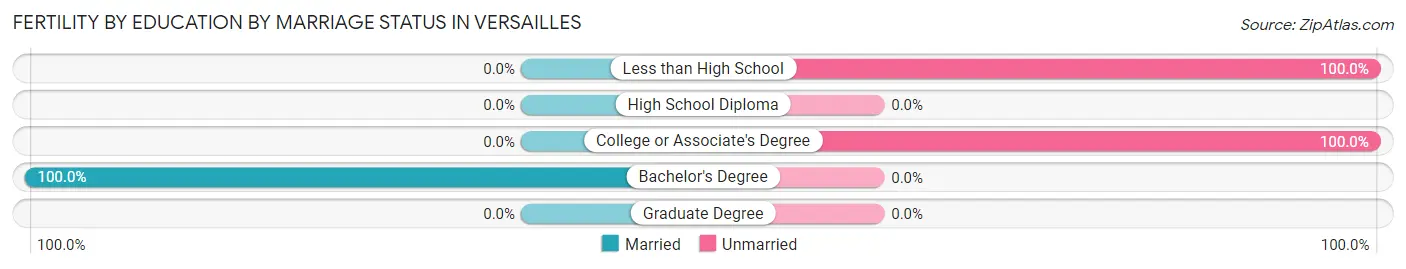
| Educational Attainment | Married | Unmarried |
| Less than High School | 0 (0.0%) | 4 (100.0%) |
| High School Diploma | 0 (0.0%) | 0 (0.0%) |
| College or Associate's Degree | 0 (0.0%) | 42 (100.0%) |
| Bachelor's Degree | 57 (100.0%) | 0 (0.0%) |
| Graduate Degree | 0 (0.0%) | 0 (0.0%) |
| Total | 57 (55.3%) | 46 (44.7%) |
Employment Characteristics in Versailles
Employment by Class of Employer in Versailles
Among the 5,456 employed individuals in Versailles, private company employees (3,605 | 66.1%), local government employees (397 | 7.3%), and self-employed (not incorporated) (396 | 7.3%) make up the most common classes of employment.
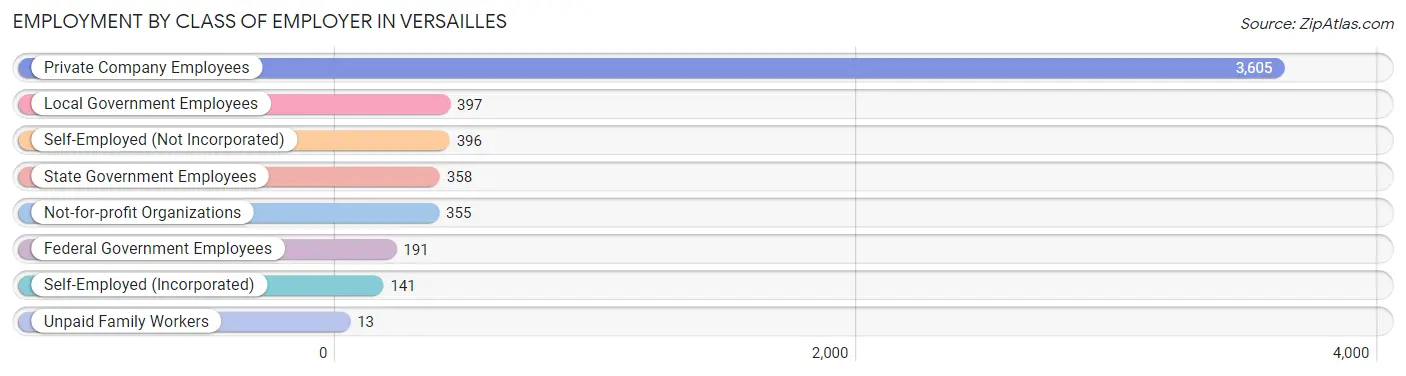
| Employer Class | # Employees | % Employees |
| Private Company Employees | 3,605 | 66.1% |
| Self-Employed (Incorporated) | 141 | 2.6% |
| Self-Employed (Not Incorporated) | 396 | 7.3% |
| Not-for-profit Organizations | 355 | 6.5% |
| Local Government Employees | 397 | 7.3% |
| State Government Employees | 358 | 6.6% |
| Federal Government Employees | 191 | 3.5% |
| Unpaid Family Workers | 13 | 0.2% |
| Total | 5,456 | 100.0% |
Employment Status by Age in Versailles
According to the labor force statistics for Versailles, out of the total population over 16 years of age (8,183), 69.3% or 5,671 individuals are in the labor force, with 2.9% or 164 of them unemployed. The age group with the highest labor force participation rate is 30 to 34 years, with 97.4% or 533 individuals in the labor force. Within the labor force, the 16 to 19 years age range has the highest percentage of unemployed individuals, with 10.7% or 36 of them being unemployed.
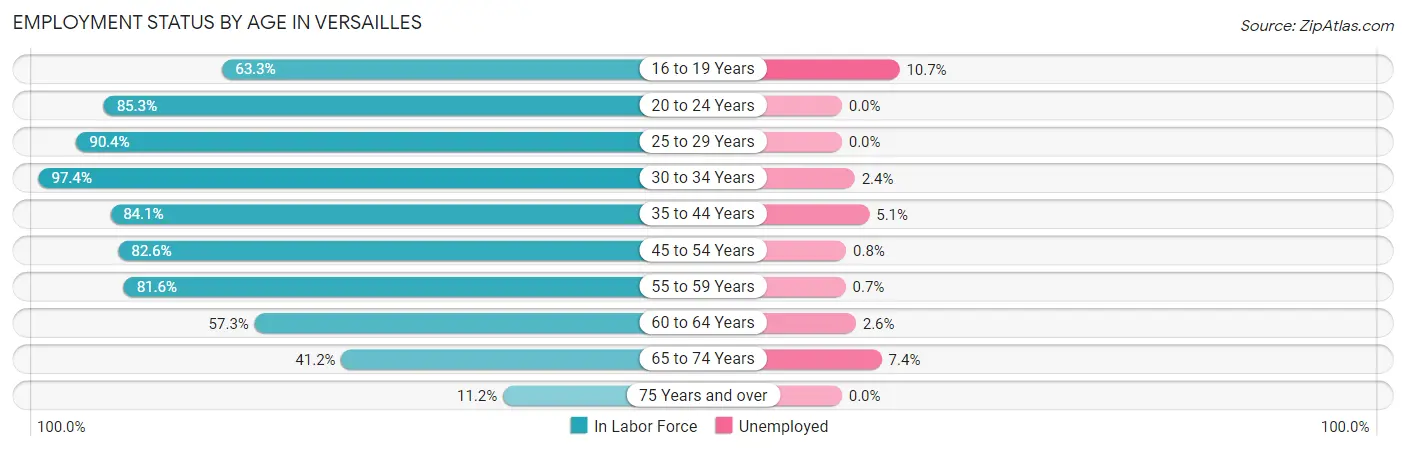
| Age Bracket | In Labor Force | Unemployed |
| 16 to 19 Years | 335 (63.3%) | 36 (10.7%) |
| 20 to 24 Years | 590 (85.3%) | 0 (0.0%) |
| 25 to 29 Years | 605 (90.4%) | 0 (0.0%) |
| 30 to 34 Years | 533 (97.4%) | 13 (2.4%) |
| 35 to 44 Years | 1,068 (84.1%) | 54 (5.1%) |
| 45 to 54 Years | 871 (82.6%) | 7 (0.8%) |
| 55 to 59 Years | 675 (81.6%) | 5 (0.7%) |
| 60 to 64 Years | 422 (57.3%) | 11 (2.6%) |
| 65 to 74 Years | 497 (41.2%) | 37 (7.4%) |
| 75 Years and over | 73 (11.2%) | 0 (0.0%) |
| Total | 5,671 (69.3%) | 164 (2.9%) |
Employment Status by Educational Attainment in Versailles
According to labor force statistics for Versailles, 81.8% of individuals (4,175) out of the total population between 25 and 64 years of age (5,104) are in the labor force, with 2.1% or 88 of them being unemployed. The group with the highest labor force participation rate are those with the educational attainment of bachelor's degree or higher, with 92.2% or 1,553 individuals in the labor force. Within the labor force, individuals with college / associate degree education have the highest percentage of unemployment, with 5.0% or 53 of them being unemployed.
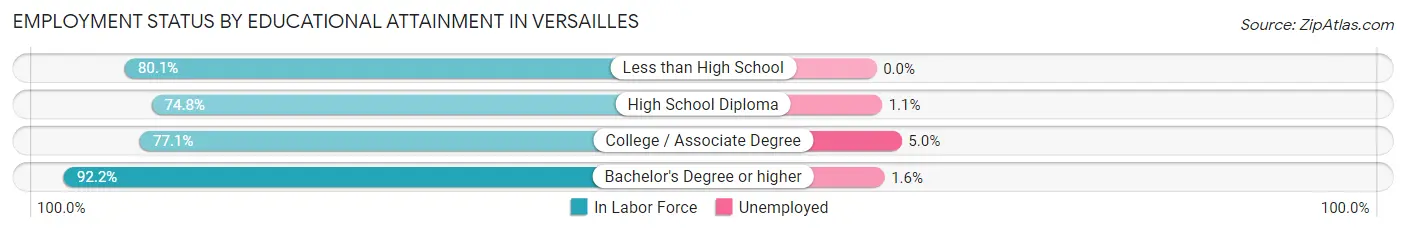
| Educational Attainment | In Labor Force | Unemployed |
| Less than High School | 487 (80.1%) | 0 (0.0%) |
| High School Diploma | 1,070 (74.8%) | 16 (1.1%) |
| College / Associate Degree | 1,066 (77.1%) | 69 (5.0%) |
| Bachelor's Degree or higher | 1,553 (92.2%) | 27 (1.6%) |
| Total | 4,175 (81.8%) | 107 (2.1%) |
Employment Occupations by Sex in Versailles
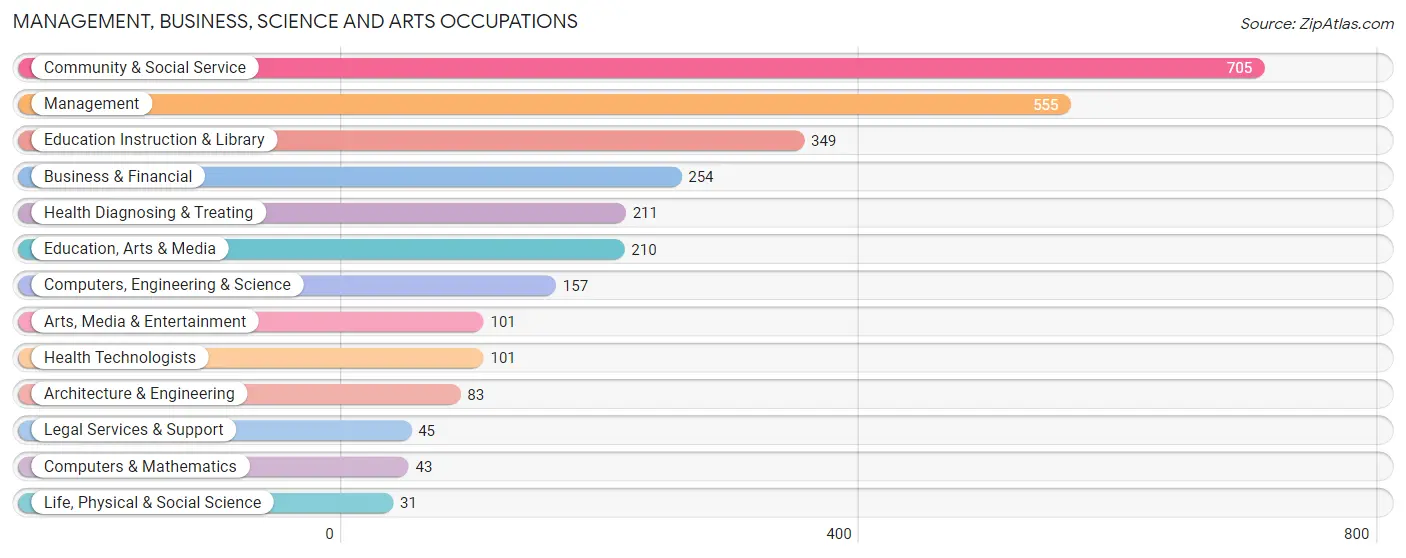
Management, Business, Science and Arts Occupations
The most common Management, Business, Science and Arts occupations in Versailles are Community & Social Service (705 | 13.0%), Management (555 | 10.2%), Education Instruction & Library (349 | 6.4%), Business & Financial (254 | 4.7%), and Health Diagnosing & Treating (211 | 3.9%).
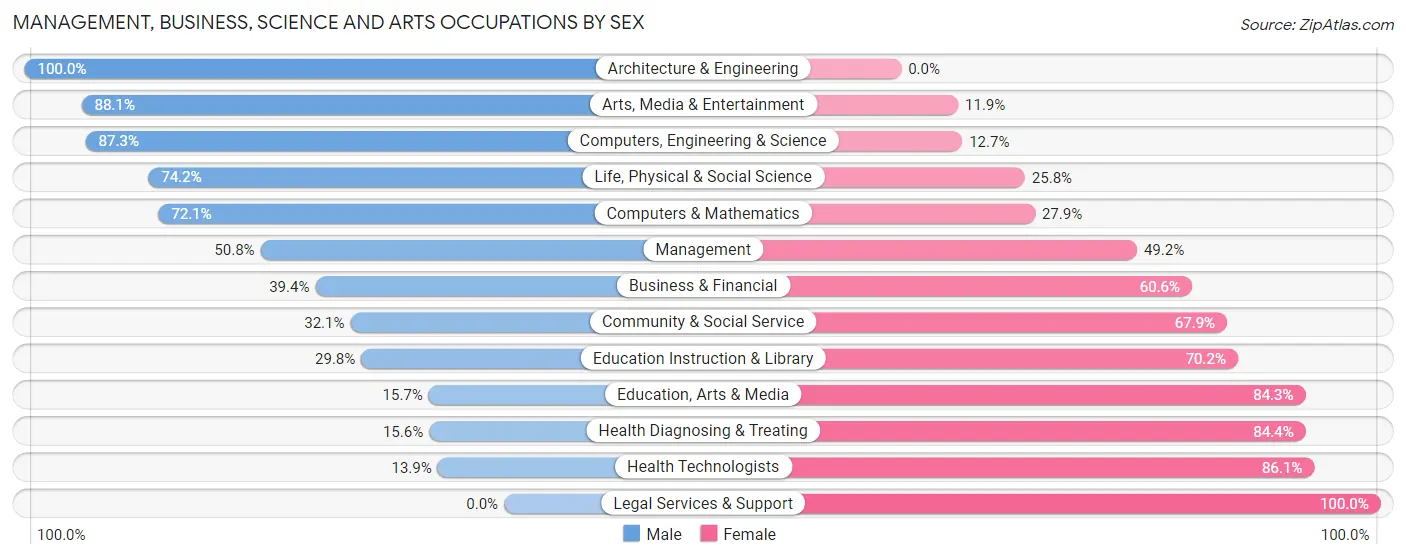
Management, Business, Science and Arts Occupations by Sex
Within the Management, Business, Science and Arts occupations in Versailles, the most male-oriented occupations are Architecture & Engineering (100.0%), Arts, Media & Entertainment (88.1%), and Computers, Engineering & Science (87.3%), while the most female-oriented occupations are Legal Services & Support (100.0%), Health Technologists (86.1%), and Health Diagnosing & Treating (84.4%).
| Occupation | Male | Female |
| Management | 282 (50.8%) | 273 (49.2%) |
| Business & Financial | 100 (39.4%) | 154 (60.6%) |
| Computers, Engineering & Science | 137 (87.3%) | 20 (12.7%) |
| Computers & Mathematics | 31 (72.1%) | 12 (27.9%) |
| Architecture & Engineering | 83 (100.0%) | 0 (0.0%) |
| Life, Physical & Social Science | 23 (74.2%) | 8 (25.8%) |
| Community & Social Service | 226 (32.1%) | 479 (67.9%) |
| Education, Arts & Media | 33 (15.7%) | 177 (84.3%) |
| Legal Services & Support | 0 (0.0%) | 45 (100.0%) |
| Education Instruction & Library | 104 (29.8%) | 245 (70.2%) |
| Arts, Media & Entertainment | 89 (88.1%) | 12 (11.9%) |
| Health Diagnosing & Treating | 33 (15.6%) | 178 (84.4%) |
| Health Technologists | 14 (13.9%) | 87 (86.1%) |
| Total (Category) | 778 (41.3%) | 1,104 (58.7%) |
| Total (Overall) | 2,914 (53.7%) | 2,510 (46.3%) |
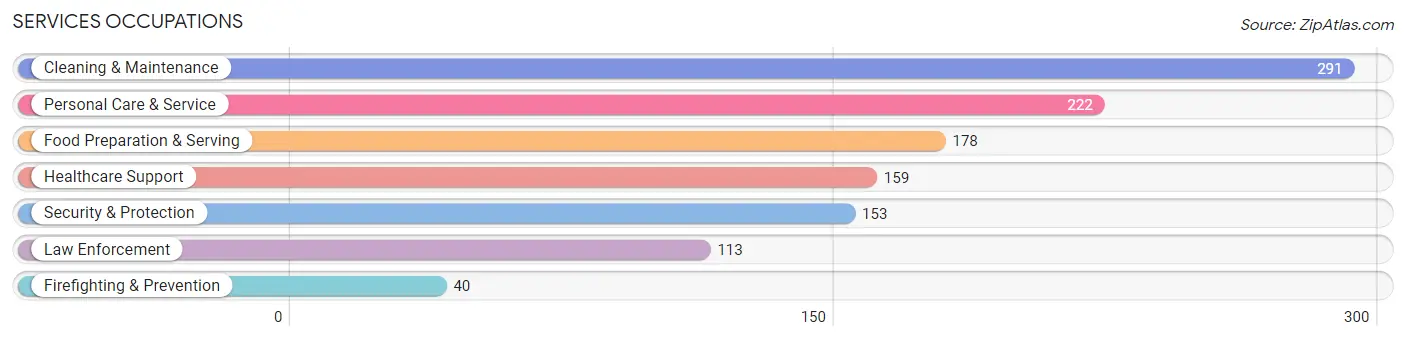
Services Occupations
The most common Services occupations in Versailles are Cleaning & Maintenance (291 | 5.4%), Personal Care & Service (222 | 4.1%), Food Preparation & Serving (178 | 3.3%), Healthcare Support (159 | 2.9%), and Security & Protection (153 | 2.8%).
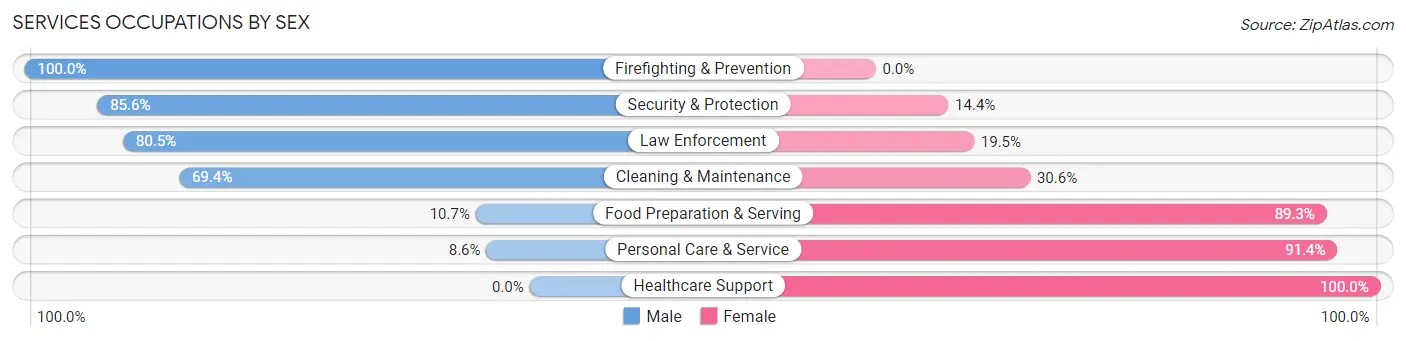
Services Occupations by Sex
Within the Services occupations in Versailles, the most male-oriented occupations are Firefighting & Prevention (100.0%), Security & Protection (85.6%), and Law Enforcement (80.5%), while the most female-oriented occupations are Healthcare Support (100.0%), Personal Care & Service (91.4%), and Food Preparation & Serving (89.3%).
| Occupation | Male | Female |
| Healthcare Support | 0 (0.0%) | 159 (100.0%) |
| Security & Protection | 131 (85.6%) | 22 (14.4%) |
| Firefighting & Prevention | 40 (100.0%) | 0 (0.0%) |
| Law Enforcement | 91 (80.5%) | 22 (19.5%) |
| Food Preparation & Serving | 19 (10.7%) | 159 (89.3%) |
| Cleaning & Maintenance | 202 (69.4%) | 89 (30.6%) |
| Personal Care & Service | 19 (8.6%) | 203 (91.4%) |
| Total (Category) | 371 (37.0%) | 632 (63.0%) |
| Total (Overall) | 2,914 (53.7%) | 2,510 (46.3%) |
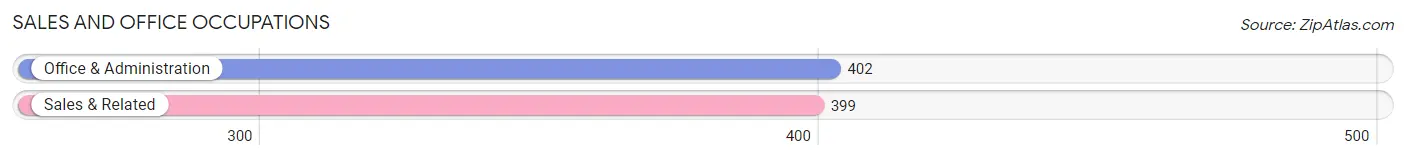
Sales and Office Occupations
The most common Sales and Office occupations in Versailles are Office & Administration (402 | 7.4%), and Sales & Related (399 | 7.4%).
Sales and Office Occupations by Sex
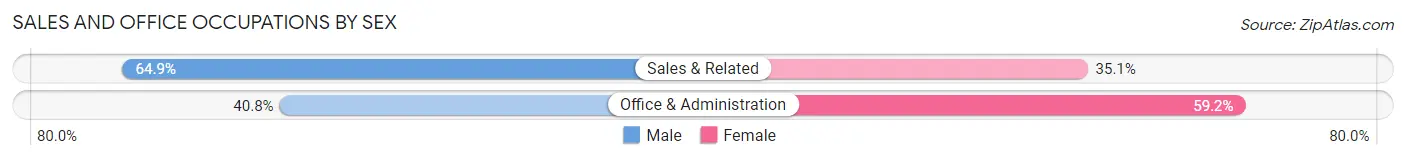
| Occupation | Male | Female |
| Sales & Related | 259 (64.9%) | 140 (35.1%) |
| Office & Administration | 164 (40.8%) | 238 (59.2%) |
| Total (Category) | 423 (52.8%) | 378 (47.2%) |
| Total (Overall) | 2,914 (53.7%) | 2,510 (46.3%) |
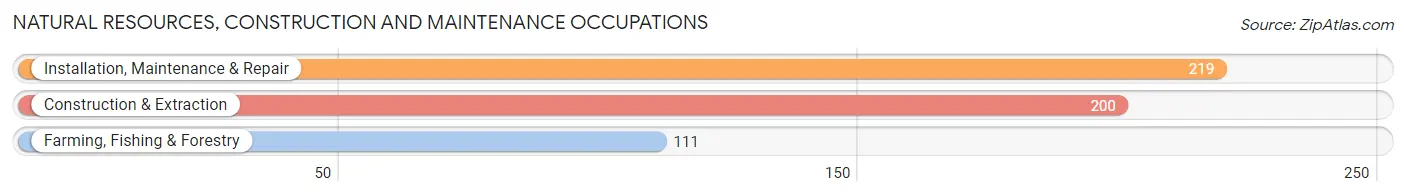
Natural Resources, Construction and Maintenance Occupations
The most common Natural Resources, Construction and Maintenance occupations in Versailles are Installation, Maintenance & Repair (219 | 4.0%), Construction & Extraction (200 | 3.7%), and Farming, Fishing & Forestry (111 | 2.1%).
Natural Resources, Construction and Maintenance Occupations by Sex
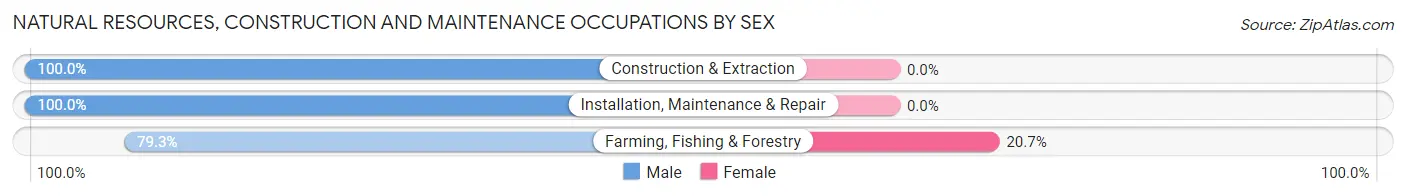
| Occupation | Male | Female |
| Farming, Fishing & Forestry | 88 (79.3%) | 23 (20.7%) |
| Construction & Extraction | 200 (100.0%) | 0 (0.0%) |
| Installation, Maintenance & Repair | 219 (100.0%) | 0 (0.0%) |
| Total (Category) | 507 (95.7%) | 23 (4.3%) |
| Total (Overall) | 2,914 (53.7%) | 2,510 (46.3%) |
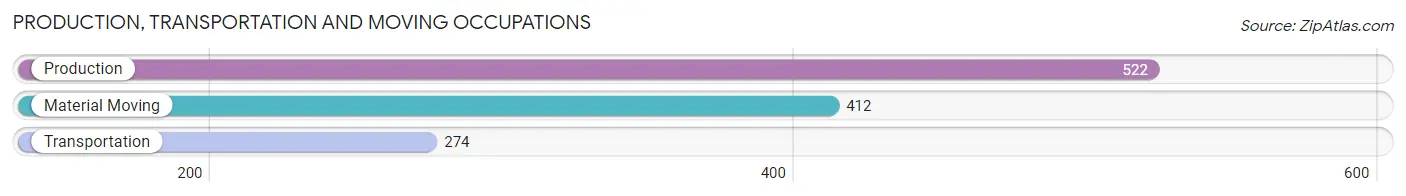
Production, Transportation and Moving Occupations
The most common Production, Transportation and Moving occupations in Versailles are Production (522 | 9.6%), Material Moving (412 | 7.6%), and Transportation (274 | 5.1%).
Production, Transportation and Moving Occupations by Sex
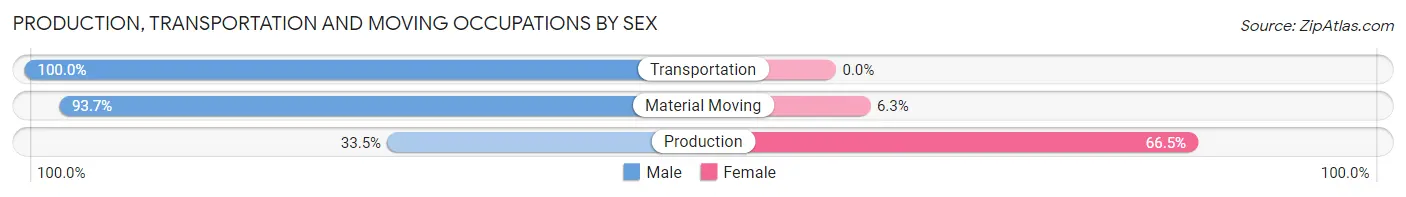
| Occupation | Male | Female |
| Production | 175 (33.5%) | 347 (66.5%) |
| Transportation | 274 (100.0%) | 0 (0.0%) |
| Material Moving | 386 (93.7%) | 26 (6.3%) |
| Total (Category) | 835 (69.1%) | 373 (30.9%) |
| Total (Overall) | 2,914 (53.7%) | 2,510 (46.3%) |
Employment Industries by Sex in Versailles
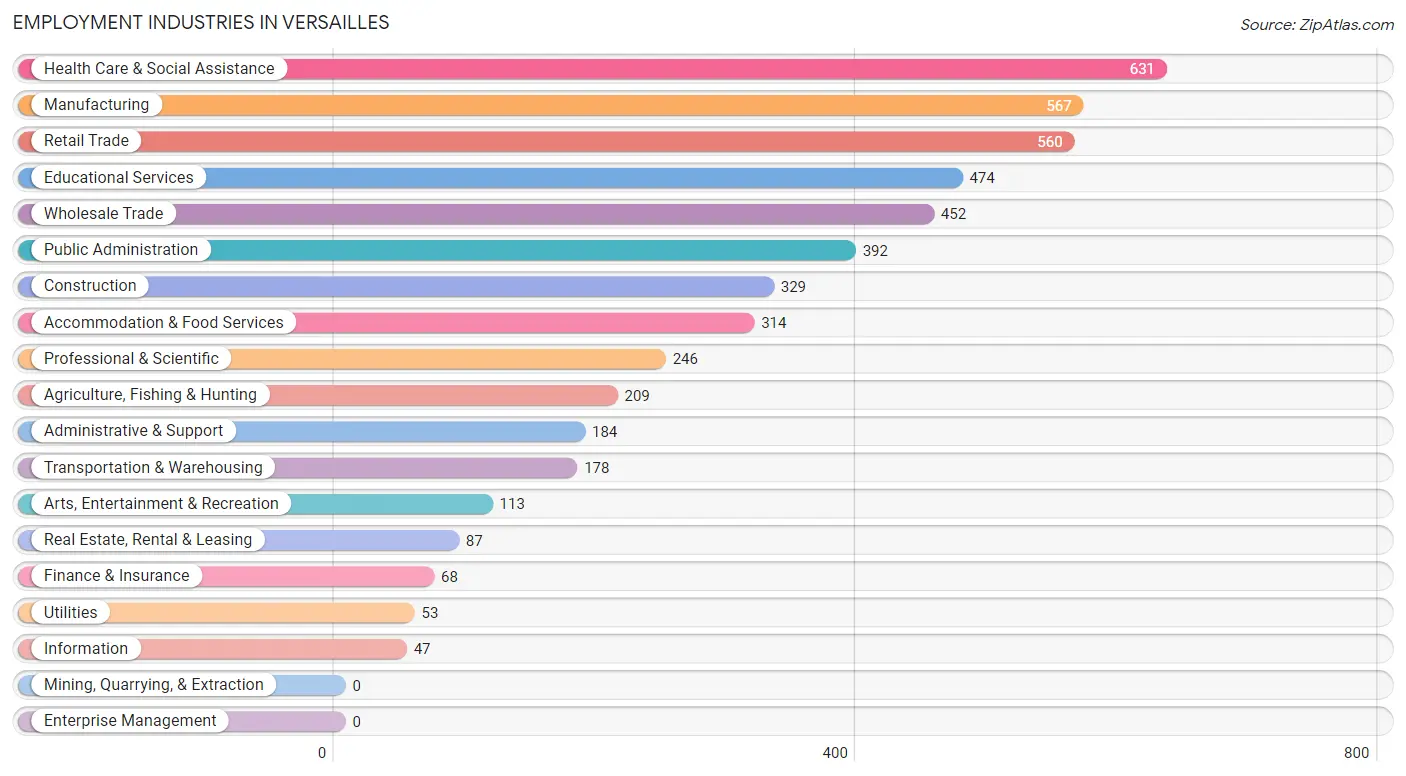
Employment Industries in Versailles
The major employment industries in Versailles include Health Care & Social Assistance (631 | 11.6%), Manufacturing (567 | 10.4%), Retail Trade (560 | 10.3%), Educational Services (474 | 8.7%), and Wholesale Trade (452 | 8.3%).
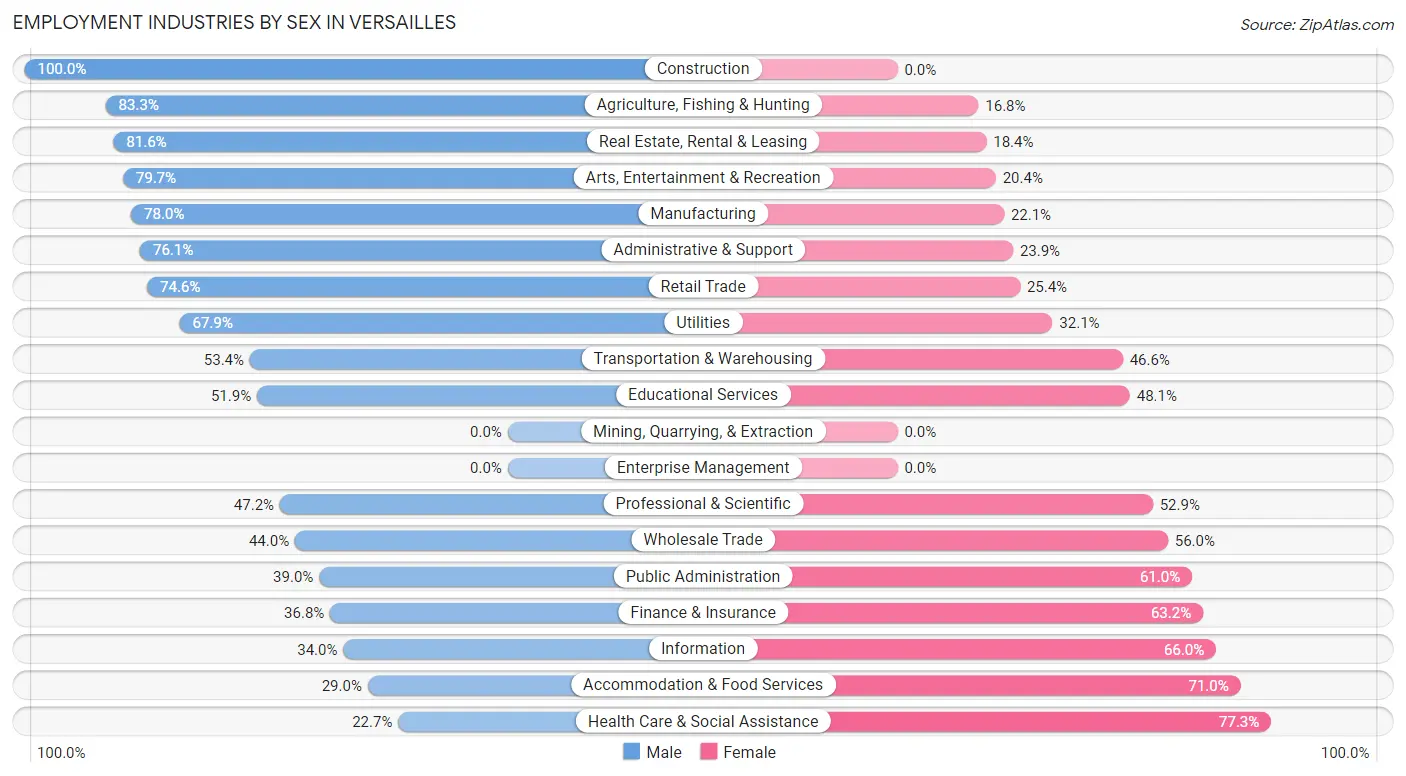
Employment Industries by Sex in Versailles
The Versailles industries that see more men than women are Construction (100.0%), Agriculture, Fishing & Hunting (83.3%), and Real Estate, Rental & Leasing (81.6%), whereas the industries that tend to have a higher number of women are Health Care & Social Assistance (77.3%), Accommodation & Food Services (71.0%), and Information (66.0%).
| Industry | Male | Female |
| Agriculture, Fishing & Hunting | 174 (83.3%) | 35 (16.8%) |
| Mining, Quarrying, & Extraction | 0 (0.0%) | 0 (0.0%) |
| Construction | 329 (100.0%) | 0 (0.0%) |
| Manufacturing | 442 (77.9%) | 125 (22.1%) |
| Wholesale Trade | 199 (44.0%) | 253 (56.0%) |
| Retail Trade | 418 (74.6%) | 142 (25.4%) |
| Transportation & Warehousing | 95 (53.4%) | 83 (46.6%) |
| Utilities | 36 (67.9%) | 17 (32.1%) |
| Information | 16 (34.0%) | 31 (66.0%) |
| Finance & Insurance | 25 (36.8%) | 43 (63.2%) |
| Real Estate, Rental & Leasing | 71 (81.6%) | 16 (18.4%) |
| Professional & Scientific | 116 (47.1%) | 130 (52.8%) |
| Enterprise Management | 0 (0.0%) | 0 (0.0%) |
| Administrative & Support | 140 (76.1%) | 44 (23.9%) |
| Educational Services | 246 (51.9%) | 228 (48.1%) |
| Health Care & Social Assistance | 143 (22.7%) | 488 (77.3%) |
| Arts, Entertainment & Recreation | 90 (79.6%) | 23 (20.3%) |
| Accommodation & Food Services | 91 (29.0%) | 223 (71.0%) |
| Public Administration | 153 (39.0%) | 239 (61.0%) |
| Total | 2,914 (53.7%) | 2,510 (46.3%) |
Education in Versailles
School Enrollment in Versailles
The most common levels of schooling among the 2,090 students in Versailles are middle school (543 | 26.0%), elementary school (473 | 22.6%), and high school (410 | 19.6%).
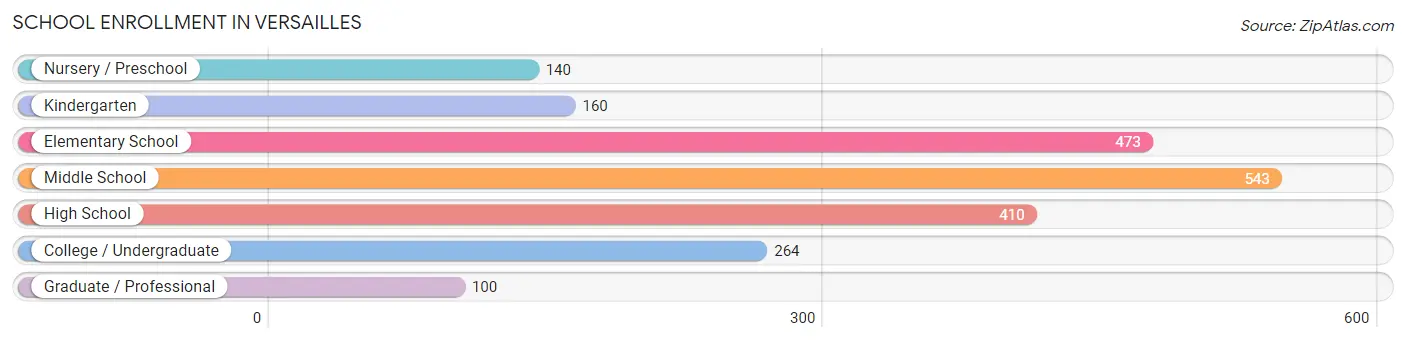
| School Level | # Students | % Students |
| Nursery / Preschool | 140 | 6.7% |
| Kindergarten | 160 | 7.7% |
| Elementary School | 473 | 22.6% |
| Middle School | 543 | 26.0% |
| High School | 410 | 19.6% |
| College / Undergraduate | 264 | 12.6% |
| Graduate / Professional | 100 | 4.8% |
| Total | 2,090 | 100.0% |
School Enrollment by Age by Funding Source in Versailles
Out of a total of 2,090 students who are enrolled in schools in Versailles, 245 (11.7%) attend a private institution, while the remaining 1,845 (88.3%) are enrolled in public schools. The age group of 35 years and over has the highest likelihood of being enrolled in private schools, with 42 (37.8% in the age bracket) enrolled. Conversely, the age group of 18 to 19 year olds has the lowest likelihood of being enrolled in a private school, with 89 (100.0% in the age bracket) attending a public institution.
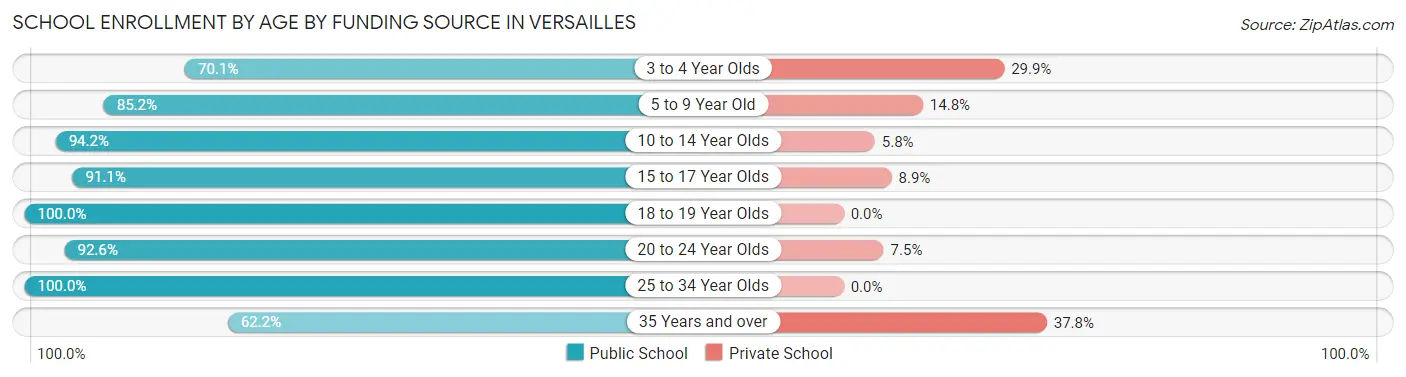
| Age Bracket | Public School | Private School |
| 3 to 4 Year Olds | 68 (70.1%) | 29 (29.9%) |
| 5 to 9 Year Old | 566 (85.2%) | 98 (14.8%) |
| 10 to 14 Year Olds | 568 (94.2%) | 35 (5.8%) |
| 15 to 17 Year Olds | 204 (91.1%) | 20 (8.9%) |
| 18 to 19 Year Olds | 89 (100.0%) | 0 (0.0%) |
| 20 to 24 Year Olds | 261 (92.5%) | 21 (7.4%) |
| 25 to 34 Year Olds | 20 (100.0%) | 0 (0.0%) |
| 35 Years and over | 69 (62.2%) | 42 (37.8%) |
| Total | 1,845 (88.3%) | 245 (11.7%) |
Educational Attainment by Field of Study in Versailles
Business (688 | 27.8%), education (299 | 12.1%), science & technology (288 | 11.6%), arts & humanities (255 | 10.3%), and bio, nature & agricultural (180 | 7.3%) are the most common fields of study among 2,479 individuals in Versailles who have obtained a bachelor's degree or higher.
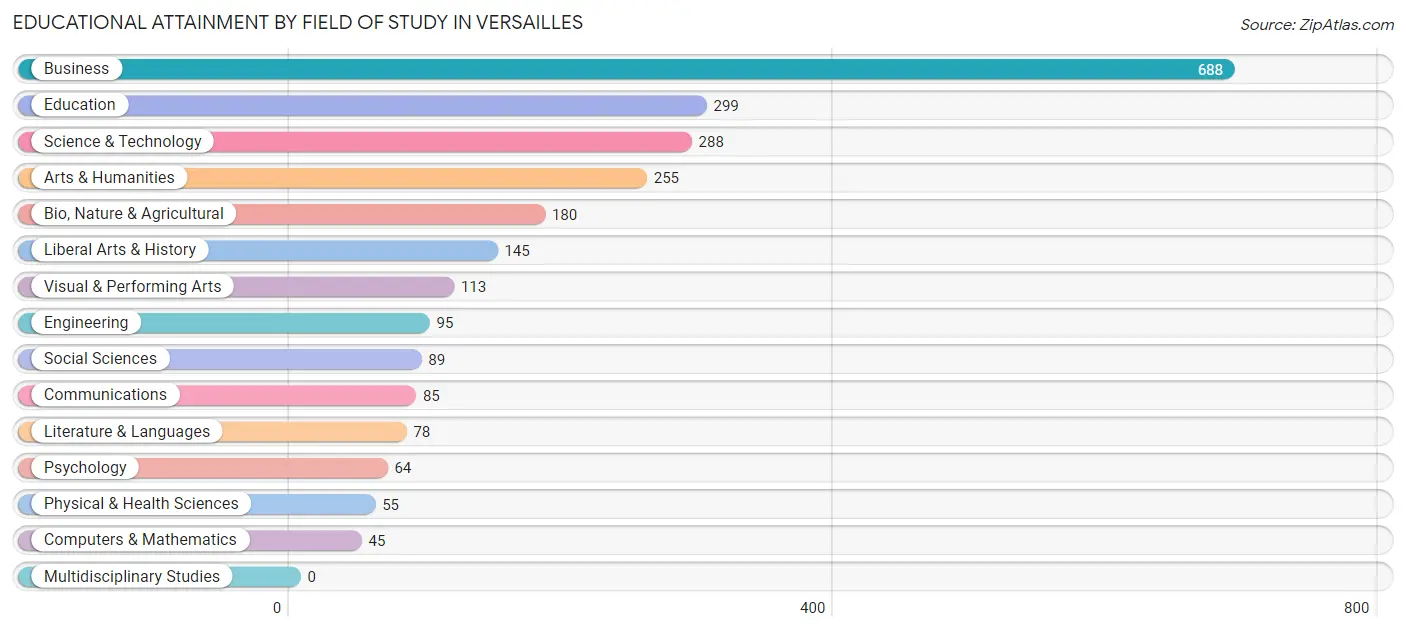
| Field of Study | # Graduates | % Graduates |
| Computers & Mathematics | 45 | 1.8% |
| Bio, Nature & Agricultural | 180 | 7.3% |
| Physical & Health Sciences | 55 | 2.2% |
| Psychology | 64 | 2.6% |
| Social Sciences | 89 | 3.6% |
| Engineering | 95 | 3.8% |
| Multidisciplinary Studies | 0 | 0.0% |
| Science & Technology | 288 | 11.6% |
| Business | 688 | 27.8% |
| Education | 299 | 12.1% |
| Literature & Languages | 78 | 3.2% |
| Liberal Arts & History | 145 | 5.9% |
| Visual & Performing Arts | 113 | 4.6% |
| Communications | 85 | 3.4% |
| Arts & Humanities | 255 | 10.3% |
| Total | 2,479 | 100.0% |
Transportation & Commute in Versailles
Vehicle Availability by Sex in Versailles
The most prevalent vehicle ownership categories in Versailles are males with 2 vehicles (1,470, accounting for 50.8%) and females with 2 vehicles (1,467, making up 57.3%).
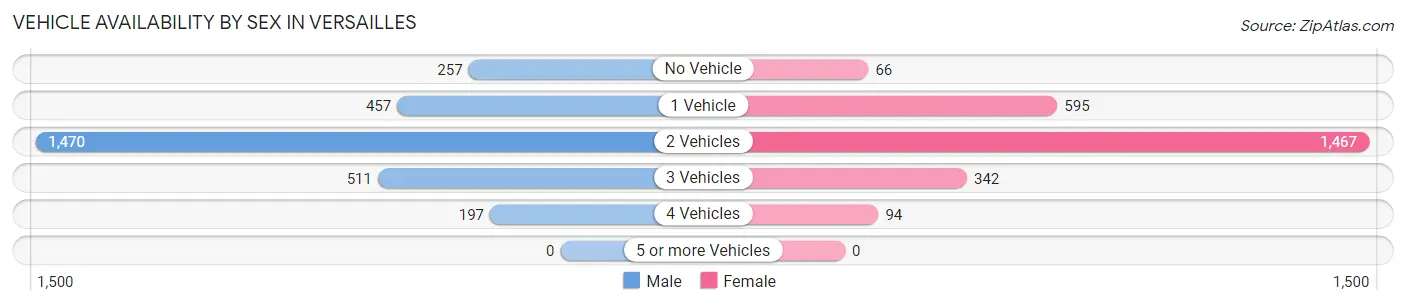
| Vehicles Available | Male | Female |
| No Vehicle | 257 (8.9%) | 66 (2.6%) |
| 1 Vehicle | 457 (15.8%) | 595 (23.2%) |
| 2 Vehicles | 1,470 (50.8%) | 1,467 (57.2%) |
| 3 Vehicles | 511 (17.7%) | 342 (13.3%) |
| 4 Vehicles | 197 (6.8%) | 94 (3.7%) |
| 5 or more Vehicles | 0 (0.0%) | 0 (0.0%) |
| Total | 2,892 (100.0%) | 2,564 (100.0%) |
Commute Time in Versailles
The most frequently occuring commute durations in Versailles are 5 to 9 minutes (948 commuters, 18.9%), 10 to 14 minutes (677 commuters, 13.5%), and 30 to 34 minutes (675 commuters, 13.4%).
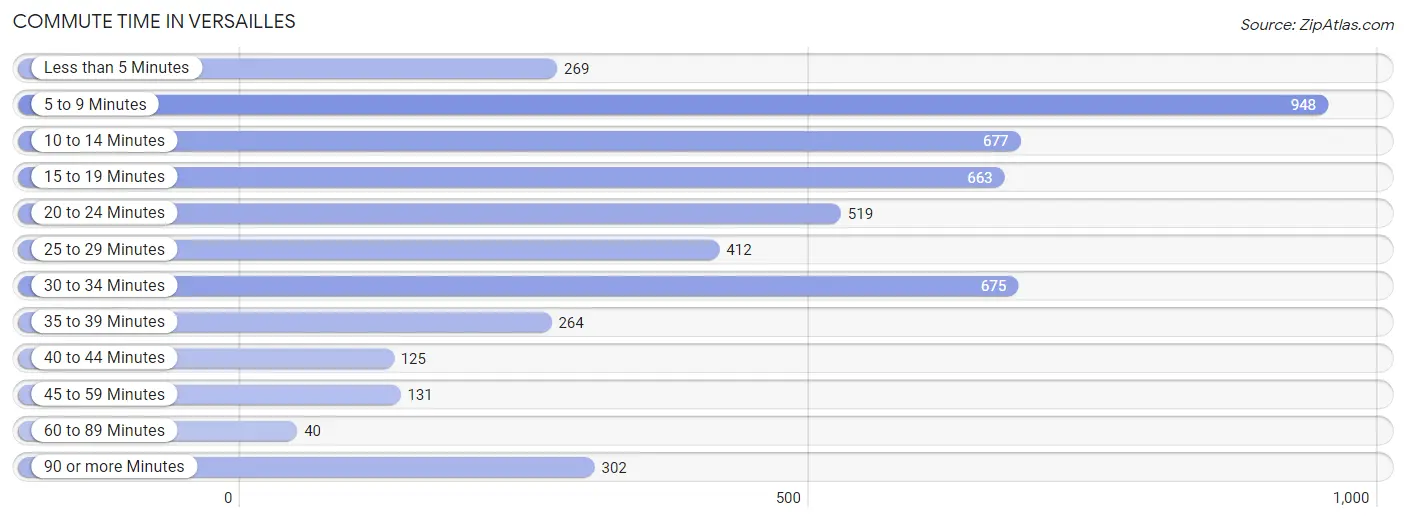
| Commute Time | # Commuters | % Commuters |
| Less than 5 Minutes | 269 | 5.3% |
| 5 to 9 Minutes | 948 | 18.9% |
| 10 to 14 Minutes | 677 | 13.5% |
| 15 to 19 Minutes | 663 | 13.2% |
| 20 to 24 Minutes | 519 | 10.3% |
| 25 to 29 Minutes | 412 | 8.2% |
| 30 to 34 Minutes | 675 | 13.4% |
| 35 to 39 Minutes | 264 | 5.2% |
| 40 to 44 Minutes | 125 | 2.5% |
| 45 to 59 Minutes | 131 | 2.6% |
| 60 to 89 Minutes | 40 | 0.8% |
| 90 or more Minutes | 302 | 6.0% |
Commute Time by Sex in Versailles
The most common commute times in Versailles are 5 to 9 minutes (544 commuters, 19.6%) for males and 5 to 9 minutes (404 commuters, 17.9%) for females.
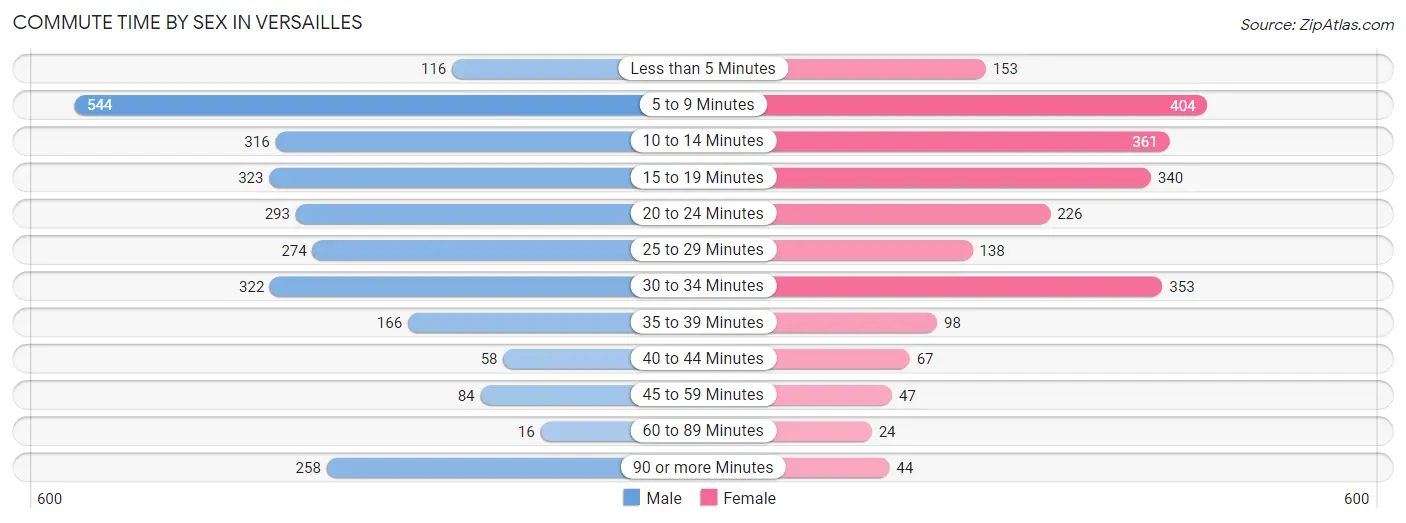
| Commute Time | Male | Female |
| Less than 5 Minutes | 116 (4.2%) | 153 (6.8%) |
| 5 to 9 Minutes | 544 (19.6%) | 404 (17.9%) |
| 10 to 14 Minutes | 316 (11.4%) | 361 (16.0%) |
| 15 to 19 Minutes | 323 (11.7%) | 340 (15.1%) |
| 20 to 24 Minutes | 293 (10.6%) | 226 (10.0%) |
| 25 to 29 Minutes | 274 (9.9%) | 138 (6.1%) |
| 30 to 34 Minutes | 322 (11.6%) | 353 (15.7%) |
| 35 to 39 Minutes | 166 (6.0%) | 98 (4.3%) |
| 40 to 44 Minutes | 58 (2.1%) | 67 (3.0%) |
| 45 to 59 Minutes | 84 (3.0%) | 47 (2.1%) |
| 60 to 89 Minutes | 16 (0.6%) | 24 (1.1%) |
| 90 or more Minutes | 258 (9.3%) | 44 (1.9%) |
Time of Departure to Work by Sex in Versailles
The most frequent times of departure to work in Versailles are 6:30 AM to 6:59 AM (561, 20.3%) for males and 7:00 AM to 7:29 AM (464, 20.6%) for females.
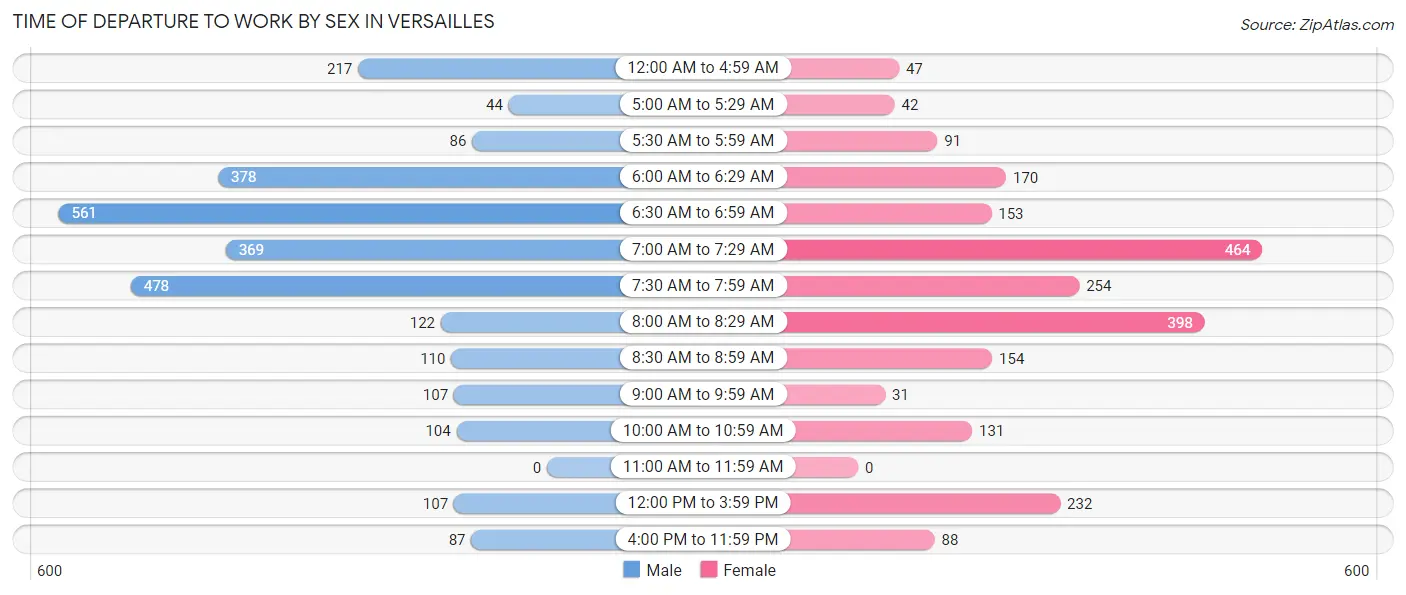
| Time of Departure | Male | Female |
| 12:00 AM to 4:59 AM | 217 (7.8%) | 47 (2.1%) |
| 5:00 AM to 5:29 AM | 44 (1.6%) | 42 (1.9%) |
| 5:30 AM to 5:59 AM | 86 (3.1%) | 91 (4.0%) |
| 6:00 AM to 6:29 AM | 378 (13.7%) | 170 (7.5%) |
| 6:30 AM to 6:59 AM | 561 (20.3%) | 153 (6.8%) |
| 7:00 AM to 7:29 AM | 369 (13.3%) | 464 (20.6%) |
| 7:30 AM to 7:59 AM | 478 (17.3%) | 254 (11.3%) |
| 8:00 AM to 8:29 AM | 122 (4.4%) | 398 (17.6%) |
| 8:30 AM to 8:59 AM | 110 (4.0%) | 154 (6.8%) |
| 9:00 AM to 9:59 AM | 107 (3.9%) | 31 (1.4%) |
| 10:00 AM to 10:59 AM | 104 (3.7%) | 131 (5.8%) |
| 11:00 AM to 11:59 AM | 0 (0.0%) | 0 (0.0%) |
| 12:00 PM to 3:59 PM | 107 (3.9%) | 232 (10.3%) |
| 4:00 PM to 11:59 PM | 87 (3.1%) | 88 (3.9%) |
| Total | 2,770 (100.0%) | 2,255 (100.0%) |
Housing Occupancy in Versailles
Occupancy by Ownership in Versailles
Of the total 4,243 dwellings in Versailles, owner-occupied units account for 2,479 (58.4%), while renter-occupied units make up 1,764 (41.6%).
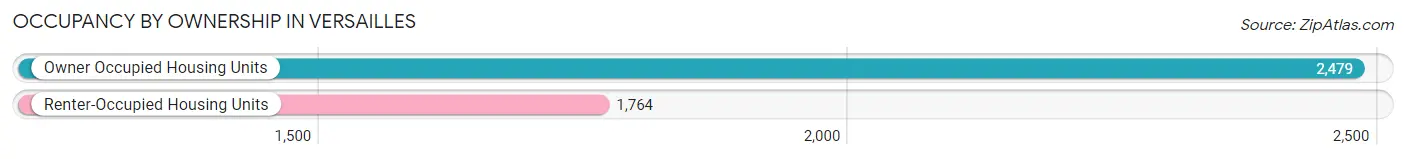
| Occupancy | # Housing Units | % Housing Units |
| Owner Occupied Housing Units | 2,479 | 58.4% |
| Renter-Occupied Housing Units | 1,764 | 41.6% |
| Total Occupied Housing Units | 4,243 | 100.0% |
Occupancy by Household Size in Versailles
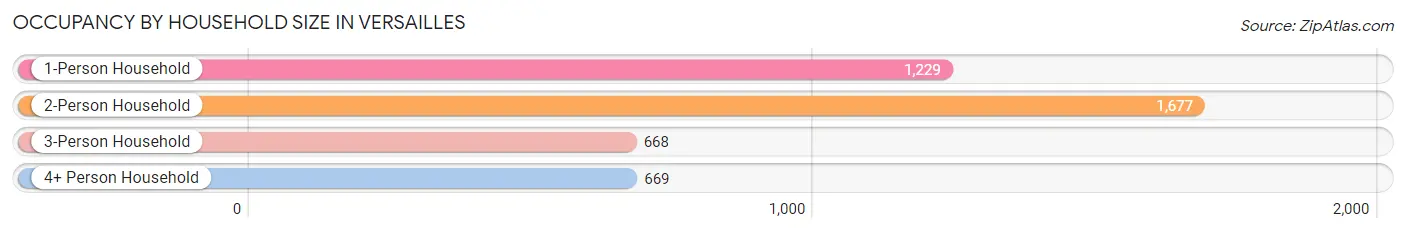
| Household Size | # Housing Units | % Housing Units |
| 1-Person Household | 1,229 | 29.0% |
| 2-Person Household | 1,677 | 39.5% |
| 3-Person Household | 668 | 15.7% |
| 4+ Person Household | 669 | 15.8% |
| Total Housing Units | 4,243 | 100.0% |
Occupancy by Ownership by Household Size in Versailles
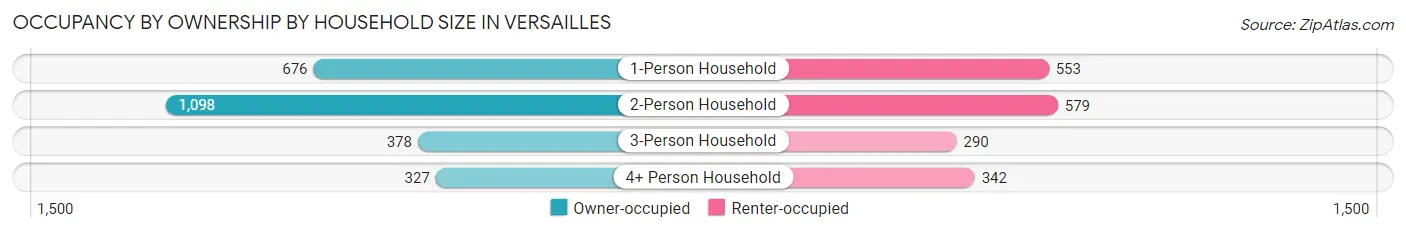
| Household Size | Owner-occupied | Renter-occupied |
| 1-Person Household | 676 (55.0%) | 553 (45.0%) |
| 2-Person Household | 1,098 (65.5%) | 579 (34.5%) |
| 3-Person Household | 378 (56.6%) | 290 (43.4%) |
| 4+ Person Household | 327 (48.9%) | 342 (51.1%) |
| Total Housing Units | 2,479 (58.4%) | 1,764 (41.6%) |
Occupancy by Educational Attainment in Versailles
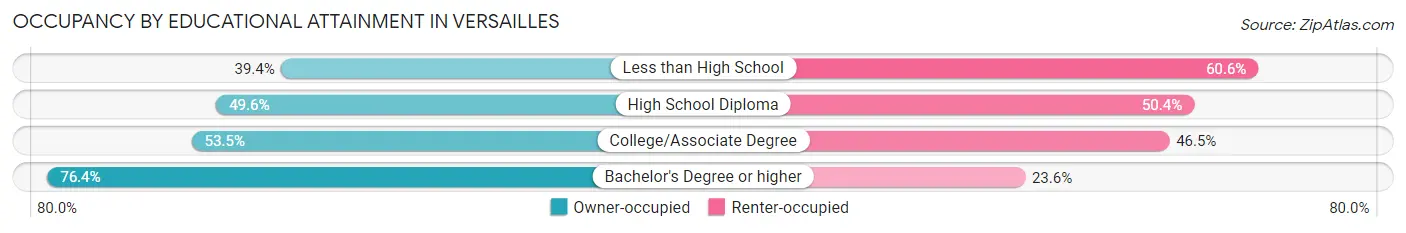
| Household Size | Owner-occupied | Renter-occupied |
| Less than High School | 199 (39.4%) | 306 (60.6%) |
| High School Diploma | 560 (49.6%) | 569 (50.4%) |
| College/Associate Degree | 639 (53.5%) | 555 (46.5%) |
| Bachelor's Degree or higher | 1,081 (76.4%) | 334 (23.6%) |
Occupancy by Age of Householder in Versailles
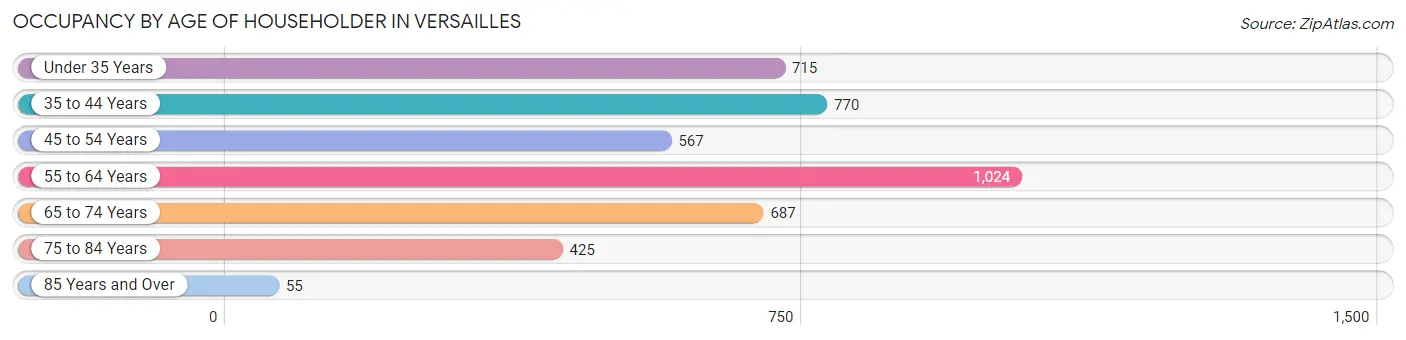
| Age Bracket | # Households | % Households |
| Under 35 Years | 715 | 16.9% |
| 35 to 44 Years | 770 | 18.1% |
| 45 to 54 Years | 567 | 13.4% |
| 55 to 64 Years | 1,024 | 24.1% |
| 65 to 74 Years | 687 | 16.2% |
| 75 to 84 Years | 425 | 10.0% |
| 85 Years and Over | 55 | 1.3% |
| Total | 4,243 | 100.0% |
Housing Finances in Versailles
Median Income by Occupancy in Versailles
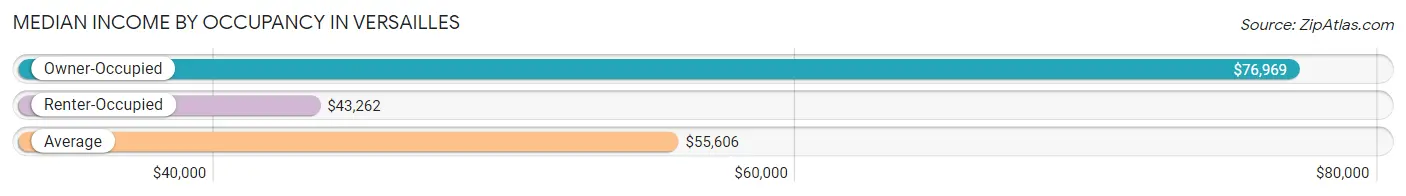
| Occupancy Type | # Households | Median Income |
| Owner-Occupied | 2,479 (58.4%) | $76,969 |
| Renter-Occupied | 1,764 (41.6%) | $43,262 |
| Average | 4,243 (100.0%) | $55,606 |
Occupancy by Householder Income Bracket in Versailles
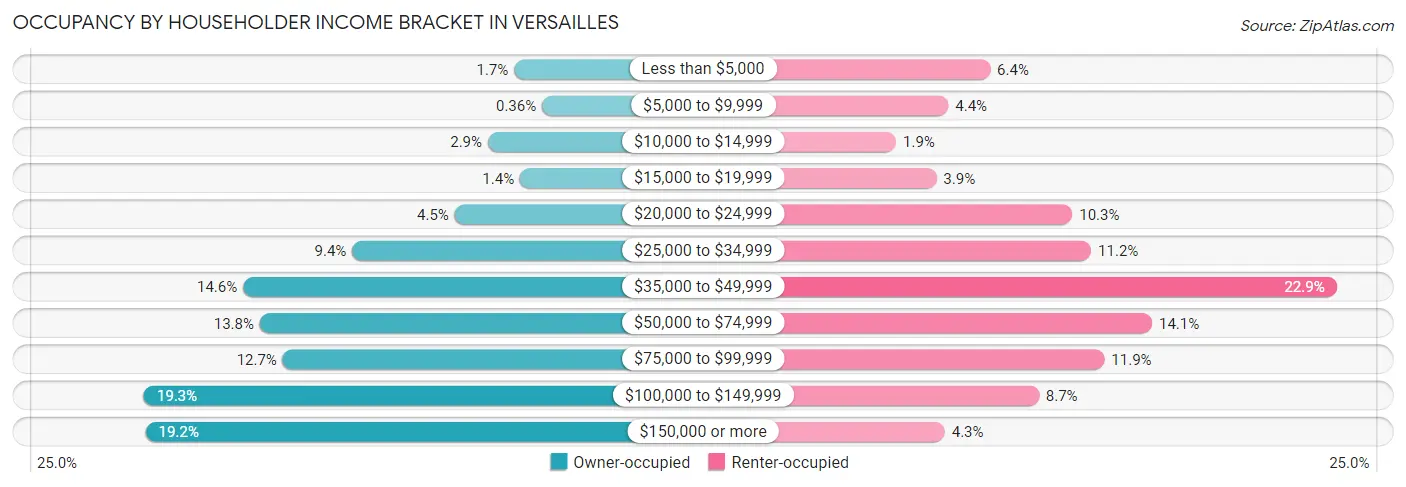
| Income Bracket | Owner-occupied | Renter-occupied |
| Less than $5,000 | 42 (1.7%) | 113 (6.4%) |
| $5,000 to $9,999 | 9 (0.4%) | 78 (4.4%) |
| $10,000 to $14,999 | 73 (2.9%) | 34 (1.9%) |
| $15,000 to $19,999 | 35 (1.4%) | 68 (3.8%) |
| $20,000 to $24,999 | 112 (4.5%) | 182 (10.3%) |
| $25,000 to $34,999 | 233 (9.4%) | 198 (11.2%) |
| $35,000 to $49,999 | 362 (14.6%) | 404 (22.9%) |
| $50,000 to $74,999 | 342 (13.8%) | 249 (14.1%) |
| $75,000 to $99,999 | 315 (12.7%) | 209 (11.8%) |
| $100,000 to $149,999 | 479 (19.3%) | 154 (8.7%) |
| $150,000 or more | 477 (19.2%) | 75 (4.3%) |
| Total | 2,479 (100.0%) | 1,764 (100.0%) |
Monthly Housing Cost Tiers in Versailles
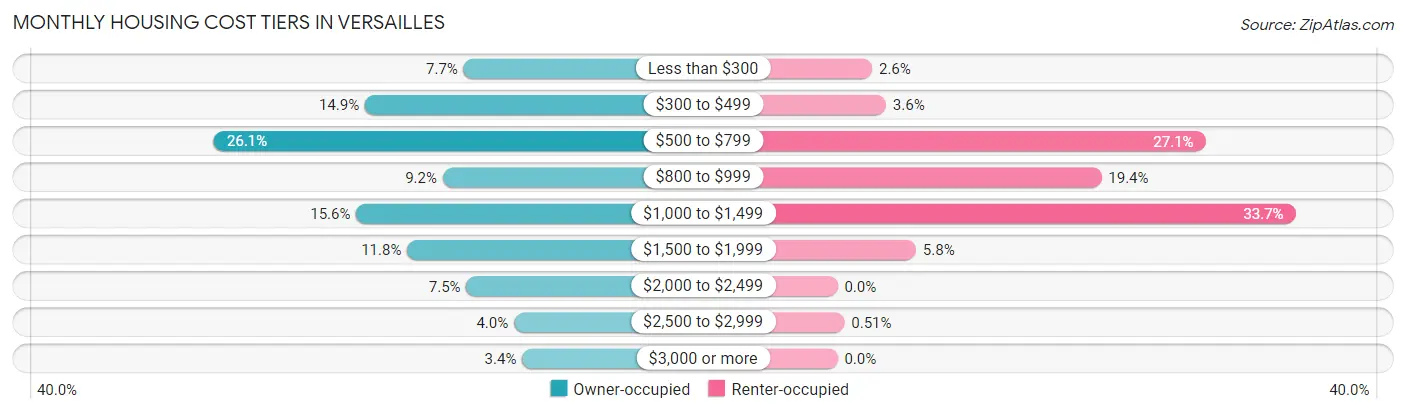
| Monthly Cost | Owner-occupied | Renter-occupied |
| Less than $300 | 190 (7.7%) | 45 (2.5%) |
| $300 to $499 | 370 (14.9%) | 63 (3.6%) |
| $500 to $799 | 646 (26.1%) | 478 (27.1%) |
| $800 to $999 | 228 (9.2%) | 343 (19.4%) |
| $1,000 to $1,499 | 386 (15.6%) | 595 (33.7%) |
| $1,500 to $1,999 | 293 (11.8%) | 102 (5.8%) |
| $2,000 to $2,499 | 185 (7.5%) | 0 (0.0%) |
| $2,500 to $2,999 | 98 (4.0%) | 9 (0.5%) |
| $3,000 or more | 83 (3.4%) | 0 (0.0%) |
| Total | 2,479 (100.0%) | 1,764 (100.0%) |
Physical Housing Characteristics in Versailles
Housing Structures in Versailles
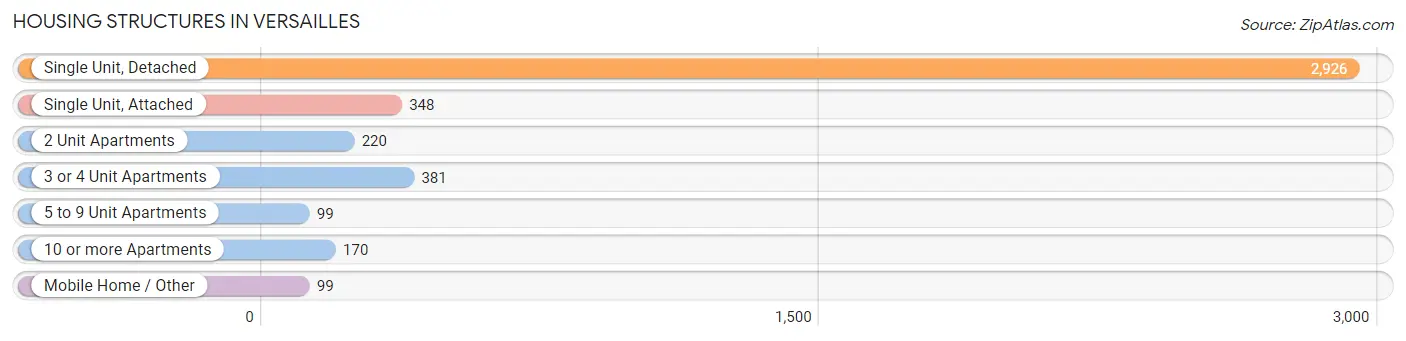
| Structure Type | # Housing Units | % Housing Units |
| Single Unit, Detached | 2,926 | 69.0% |
| Single Unit, Attached | 348 | 8.2% |
| 2 Unit Apartments | 220 | 5.2% |
| 3 or 4 Unit Apartments | 381 | 9.0% |
| 5 to 9 Unit Apartments | 99 | 2.3% |
| 10 or more Apartments | 170 | 4.0% |
| Mobile Home / Other | 99 | 2.3% |
| Total | 4,243 | 100.0% |
Housing Structures by Occupancy in Versailles
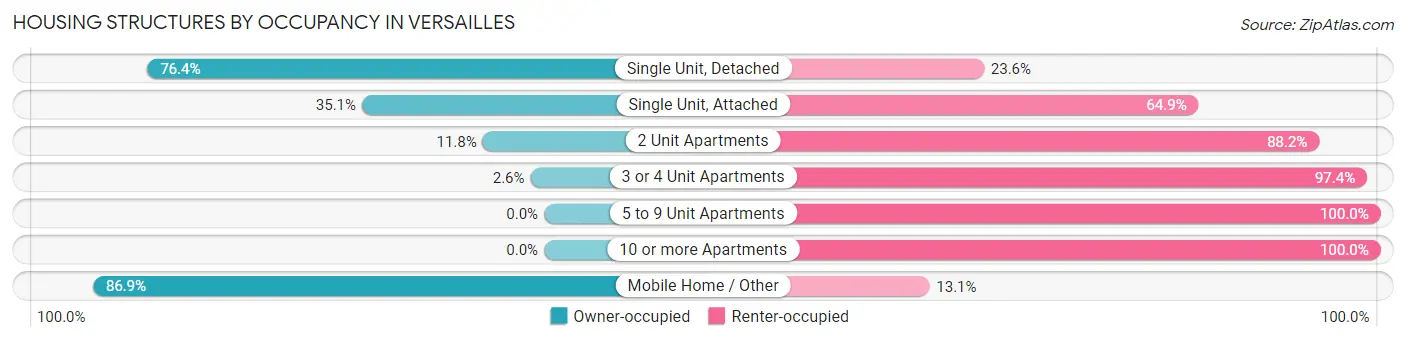
| Structure Type | Owner-occupied | Renter-occupied |
| Single Unit, Detached | 2,235 (76.4%) | 691 (23.6%) |
| Single Unit, Attached | 122 (35.1%) | 226 (64.9%) |
| 2 Unit Apartments | 26 (11.8%) | 194 (88.2%) |
| 3 or 4 Unit Apartments | 10 (2.6%) | 371 (97.4%) |
| 5 to 9 Unit Apartments | 0 (0.0%) | 99 (100.0%) |
| 10 or more Apartments | 0 (0.0%) | 170 (100.0%) |
| Mobile Home / Other | 86 (86.9%) | 13 (13.1%) |
| Total | 2,479 (58.4%) | 1,764 (41.6%) |
Housing Structures by Number of Rooms in Versailles
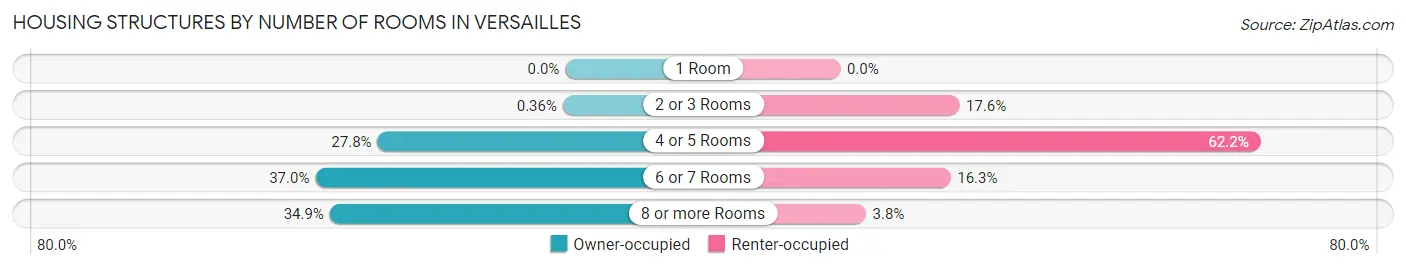
| Number of Rooms | Owner-occupied | Renter-occupied |
| 1 Room | 0 (0.0%) | 0 (0.0%) |
| 2 or 3 Rooms | 9 (0.4%) | 311 (17.6%) |
| 4 or 5 Rooms | 689 (27.8%) | 1,098 (62.2%) |
| 6 or 7 Rooms | 917 (37.0%) | 288 (16.3%) |
| 8 or more Rooms | 864 (34.8%) | 67 (3.8%) |
| Total | 2,479 (100.0%) | 1,764 (100.0%) |
Housing Structure by Heating Type in Versailles
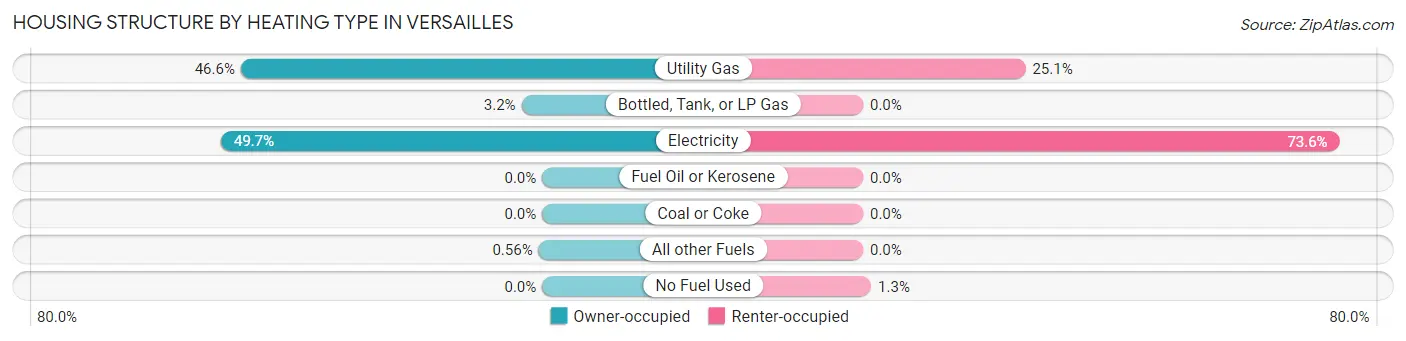
| Heating Type | Owner-occupied | Renter-occupied |
| Utility Gas | 1,155 (46.6%) | 443 (25.1%) |
| Bottled, Tank, or LP Gas | 79 (3.2%) | 0 (0.0%) |
| Electricity | 1,231 (49.7%) | 1,299 (73.6%) |
| Fuel Oil or Kerosene | 0 (0.0%) | 0 (0.0%) |
| Coal or Coke | 0 (0.0%) | 0 (0.0%) |
| All other Fuels | 14 (0.6%) | 0 (0.0%) |
| No Fuel Used | 0 (0.0%) | 22 (1.3%) |
| Total | 2,479 (100.0%) | 1,764 (100.0%) |
Household Vehicle Usage in Versailles
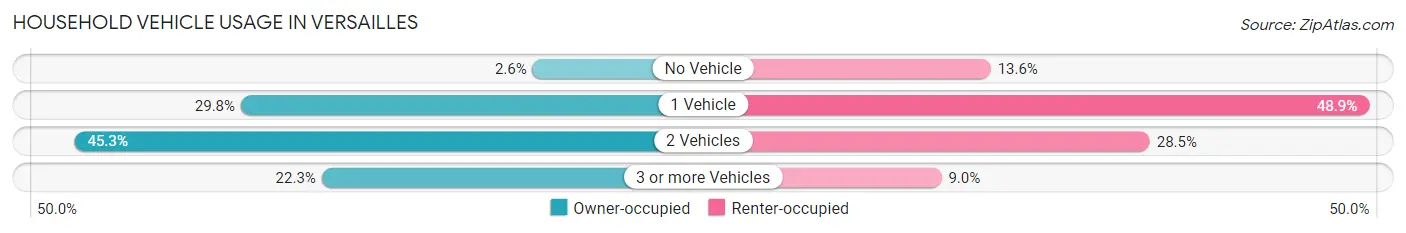
| Vehicles per Household | Owner-occupied | Renter-occupied |
| No Vehicle | 64 (2.6%) | 240 (13.6%) |
| 1 Vehicle | 739 (29.8%) | 863 (48.9%) |
| 2 Vehicles | 1,124 (45.3%) | 502 (28.5%) |
| 3 or more Vehicles | 552 (22.3%) | 159 (9.0%) |
| Total | 2,479 (100.0%) | 1,764 (100.0%) |
Real Estate & Mortgages in Versailles
Real Estate and Mortgage Overview in Versailles
| Characteristic | Without Mortgage | With Mortgage |
| Housing Units | 1,153 | 1,326 |
| Median Property Value | $223,700 | $279,200 |
| Median Household Income | $76,940 | $256 |
| Monthly Housing Costs | $507 | $83 |
| Real Estate Taxes | $1,656 | $21 |
Property Value by Mortgage Status in Versailles
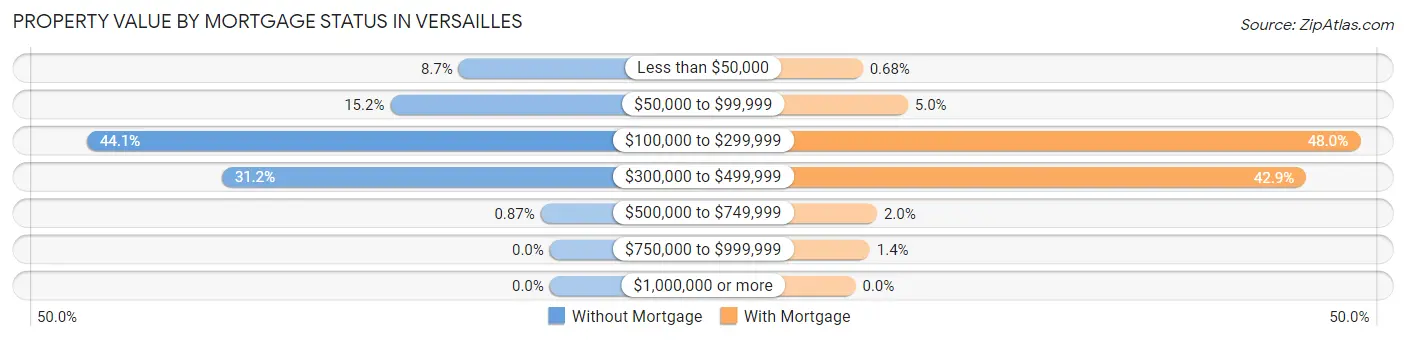
| Property Value | Without Mortgage | With Mortgage |
| Less than $50,000 | 100 (8.7%) | 9 (0.7%) |
| $50,000 to $99,999 | 175 (15.2%) | 66 (5.0%) |
| $100,000 to $299,999 | 508 (44.1%) | 637 (48.0%) |
| $300,000 to $499,999 | 360 (31.2%) | 569 (42.9%) |
| $500,000 to $749,999 | 10 (0.9%) | 27 (2.0%) |
| $750,000 to $999,999 | 0 (0.0%) | 18 (1.4%) |
| $1,000,000 or more | 0 (0.0%) | 0 (0.0%) |
| Total | 1,153 (100.0%) | 1,326 (100.0%) |
Household Income by Mortgage Status in Versailles
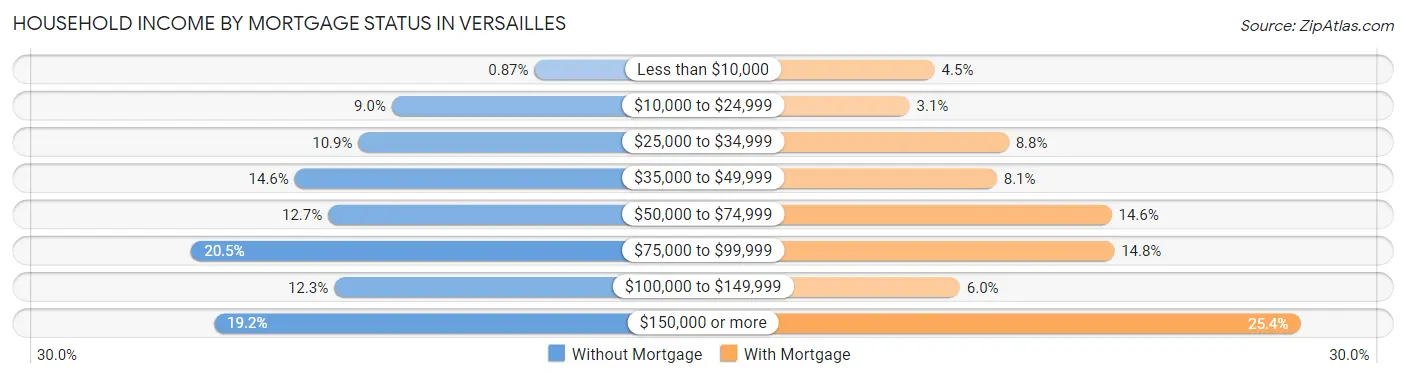
| Household Income | Without Mortgage | With Mortgage |
| Less than $10,000 | 10 (0.9%) | 60 (4.5%) |
| $10,000 to $24,999 | 104 (9.0%) | 41 (3.1%) |
| $25,000 to $34,999 | 126 (10.9%) | 116 (8.7%) |
| $35,000 to $49,999 | 168 (14.6%) | 107 (8.1%) |
| $50,000 to $74,999 | 146 (12.7%) | 194 (14.6%) |
| $75,000 to $99,999 | 236 (20.5%) | 196 (14.8%) |
| $100,000 to $149,999 | 142 (12.3%) | 79 (6.0%) |
| $150,000 or more | 221 (19.2%) | 337 (25.4%) |
| Total | 1,153 (100.0%) | 1,326 (100.0%) |
Property Value to Household Income Ratio in Versailles
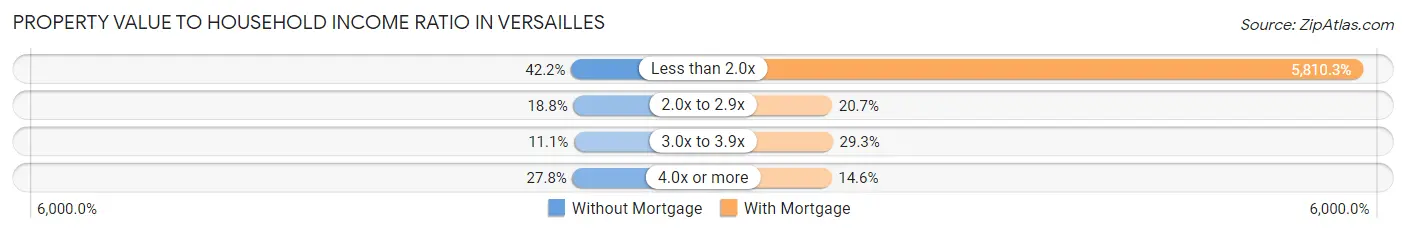
| Value-to-Income Ratio | Without Mortgage | With Mortgage |
| Less than 2.0x | 487 (42.2%) | 77,045 (5,810.3%) |
| 2.0x to 2.9x | 217 (18.8%) | 275 (20.7%) |
| 3.0x to 3.9x | 128 (11.1%) | 388 (29.3%) |
| 4.0x or more | 321 (27.8%) | 194 (14.6%) |
| Total | 1,153 (100.0%) | 1,326 (100.0%) |
Real Estate Taxes by Mortgage Status in Versailles
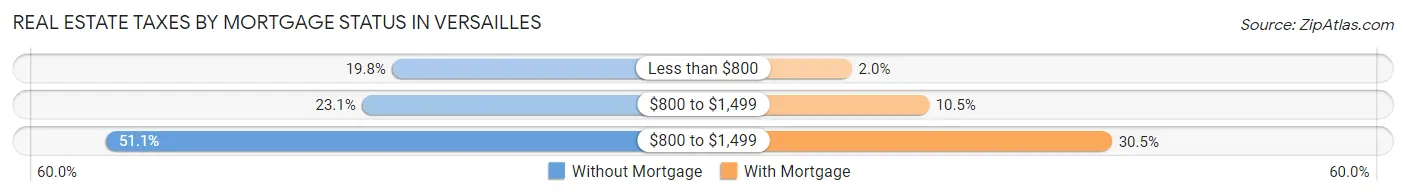
| Property Taxes | Without Mortgage | With Mortgage |
| Less than $800 | 228 (19.8%) | 27 (2.0%) |
| $800 to $1,499 | 266 (23.1%) | 139 (10.5%) |
| $800 to $1,499 | 589 (51.1%) | 405 (30.5%) |
| Total | 1,153 (100.0%) | 1,326 (100.0%) |
Health & Disability in Versailles
Health Insurance Coverage by Age in Versailles
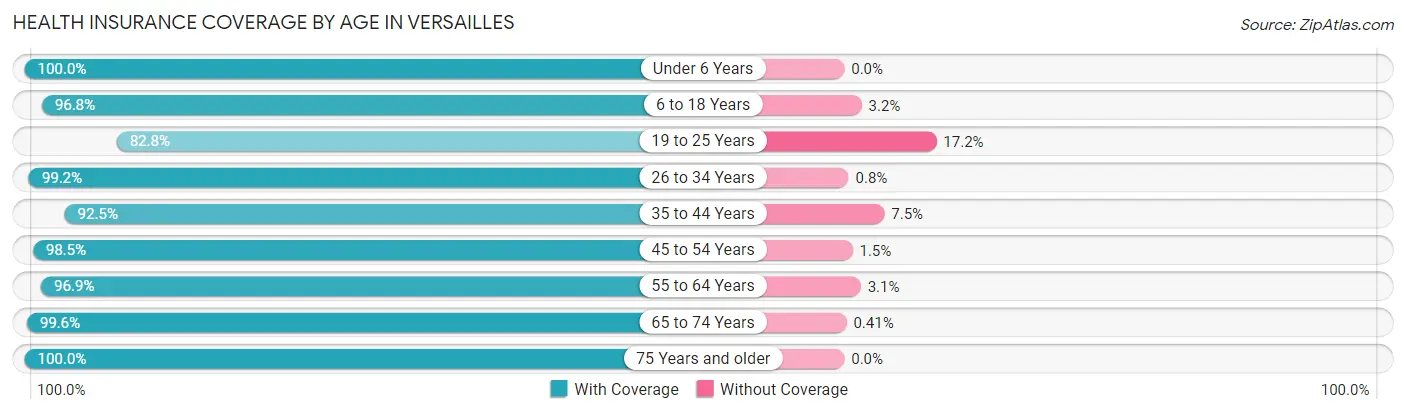
| Age Bracket | With Coverage | Without Coverage |
| Under 6 Years | 863 (100.0%) | 0 (0.0%) |
| 6 to 18 Years | 1,681 (96.8%) | 56 (3.2%) |
| 19 to 25 Years | 622 (82.8%) | 129 (17.2%) |
| 26 to 34 Years | 1,112 (99.2%) | 9 (0.8%) |
| 35 to 44 Years | 1,102 (92.5%) | 89 (7.5%) |
| 45 to 54 Years | 1,023 (98.5%) | 16 (1.5%) |
| 55 to 64 Years | 1,515 (96.9%) | 48 (3.1%) |
| 65 to 74 Years | 1,201 (99.6%) | 5 (0.4%) |
| 75 Years and older | 652 (100.0%) | 0 (0.0%) |
| Total | 9,771 (96.5%) | 352 (3.5%) |
Health Insurance Coverage by Citizenship Status in Versailles
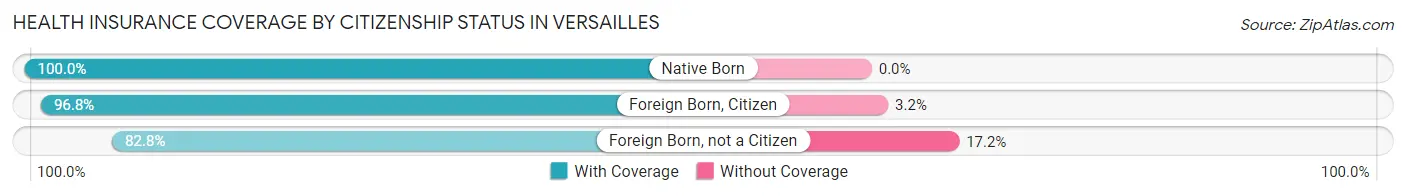
| Citizenship Status | With Coverage | Without Coverage |
| Native Born | 863 (100.0%) | 0 (0.0%) |
| Foreign Born, Citizen | 1,681 (96.8%) | 56 (3.2%) |
| Foreign Born, not a Citizen | 622 (82.8%) | 129 (17.2%) |
Health Insurance Coverage by Household Income in Versailles
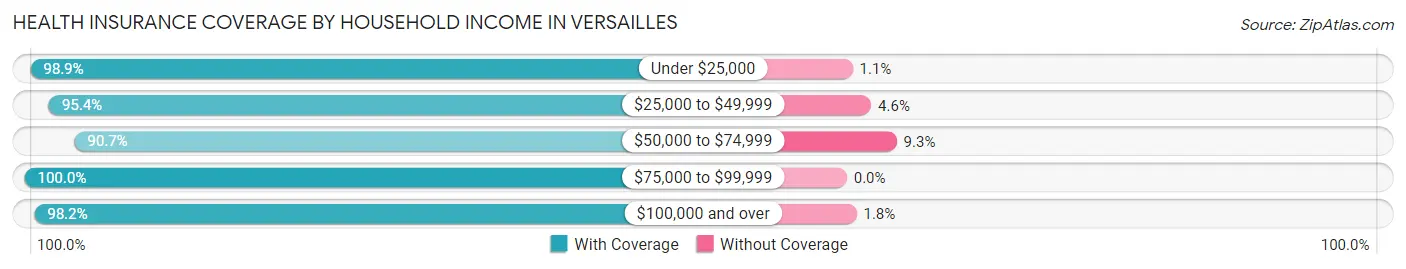
| Household Income | With Coverage | Without Coverage |
| Under $25,000 | 1,179 (98.9%) | 13 (1.1%) |
| $25,000 to $49,999 | 2,660 (95.4%) | 127 (4.6%) |
| $50,000 to $74,999 | 1,446 (90.7%) | 149 (9.3%) |
| $75,000 to $99,999 | 1,081 (100.0%) | 0 (0.0%) |
| $100,000 and over | 3,405 (98.2%) | 63 (1.8%) |
Public vs Private Health Insurance Coverage by Age in Versailles
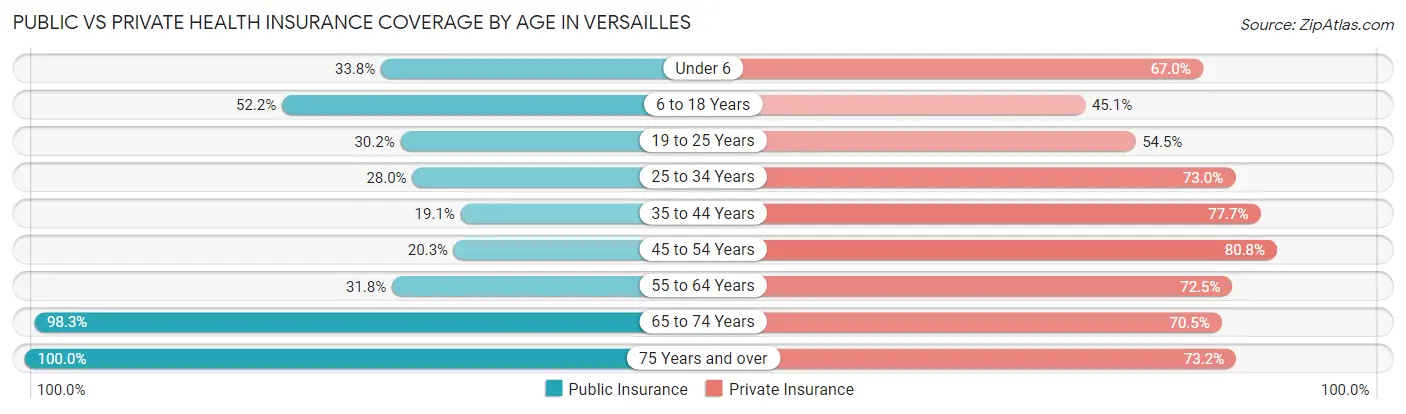
| Age Bracket | Public Insurance | Private Insurance |
| Under 6 | 292 (33.8%) | 578 (67.0%) |
| 6 to 18 Years | 907 (52.2%) | 784 (45.1%) |
| 19 to 25 Years | 227 (30.2%) | 409 (54.5%) |
| 25 to 34 Years | 314 (28.0%) | 818 (73.0%) |
| 35 to 44 Years | 227 (19.1%) | 925 (77.7%) |
| 45 to 54 Years | 211 (20.3%) | 839 (80.7%) |
| 55 to 64 Years | 497 (31.8%) | 1,133 (72.5%) |
| 65 to 74 Years | 1,185 (98.3%) | 850 (70.5%) |
| 75 Years and over | 652 (100.0%) | 477 (73.2%) |
| Total | 4,512 (44.6%) | 6,813 (67.3%) |
Disability Status by Sex by Age in Versailles
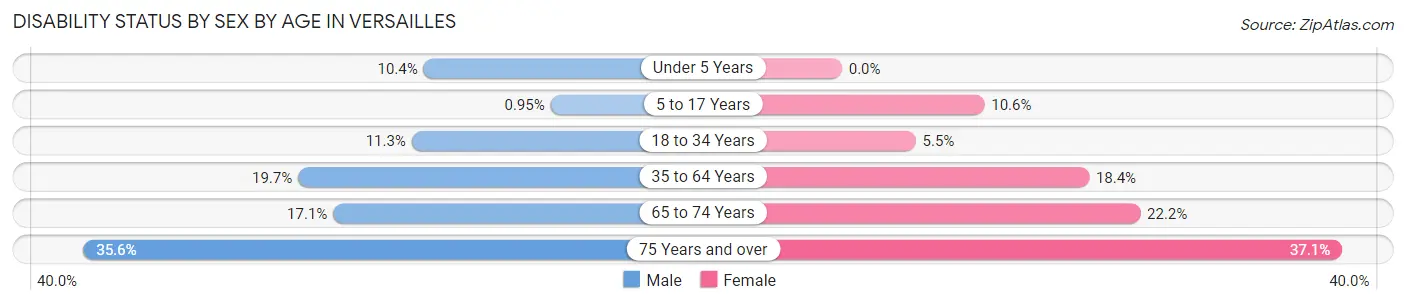
| Age Bracket | Male | Female |
| Under 5 Years | 27 (10.4%) | 0 (0.0%) |
| 5 to 17 Years | 8 (0.9%) | 82 (10.6%) |
| 18 to 34 Years | 133 (11.3%) | 53 (5.5%) |
| 35 to 64 Years | 364 (19.7%) | 357 (18.3%) |
| 65 to 74 Years | 95 (17.1%) | 144 (22.2%) |
| 75 Years and over | 98 (35.6%) | 140 (37.1%) |
Disability Class by Sex by Age in Versailles
Disability Class: Hearing Difficulty
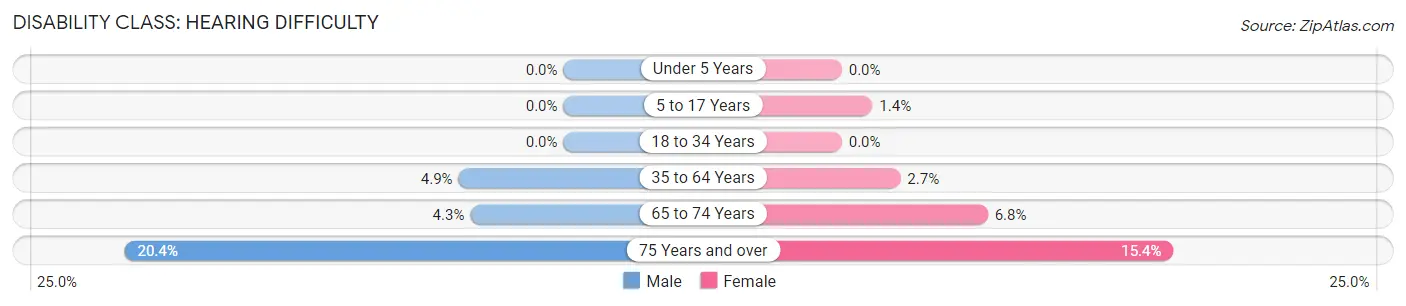
| Age Bracket | Male | Female |
| Under 5 Years | 0 (0.0%) | 0 (0.0%) |
| 5 to 17 Years | 0 (0.0%) | 11 (1.4%) |
| 18 to 34 Years | 0 (0.0%) | 0 (0.0%) |
| 35 to 64 Years | 90 (4.9%) | 53 (2.7%) |
| 65 to 74 Years | 24 (4.3%) | 44 (6.8%) |
| 75 Years and over | 56 (20.4%) | 58 (15.4%) |
Disability Class: Vision Difficulty
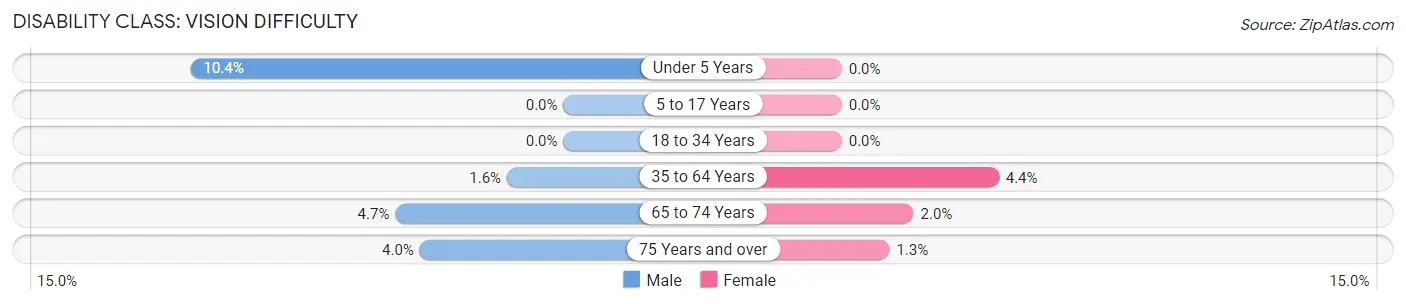
| Age Bracket | Male | Female |
| Under 5 Years | 27 (10.4%) | 0 (0.0%) |
| 5 to 17 Years | 0 (0.0%) | 0 (0.0%) |
| 18 to 34 Years | 0 (0.0%) | 0 (0.0%) |
| 35 to 64 Years | 29 (1.6%) | 85 (4.4%) |
| 65 to 74 Years | 26 (4.7%) | 13 (2.0%) |
| 75 Years and over | 11 (4.0%) | 5 (1.3%) |
Disability Class: Cognitive Difficulty
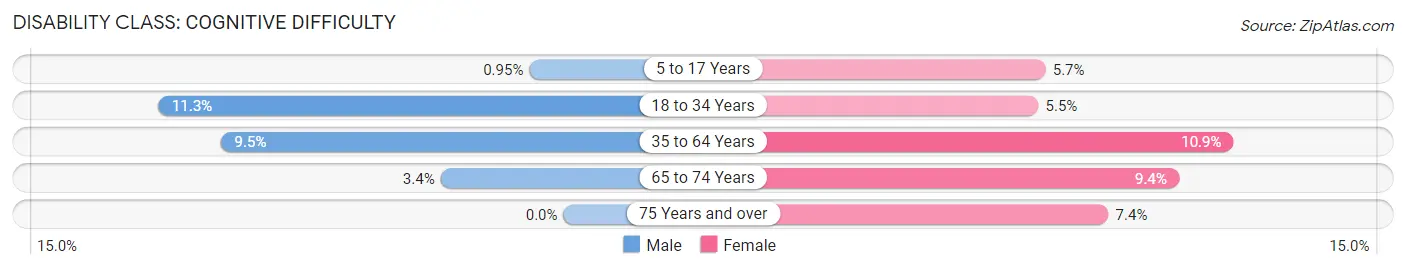
| Age Bracket | Male | Female |
| 5 to 17 Years | 8 (0.9%) | 44 (5.7%) |
| 18 to 34 Years | 133 (11.3%) | 53 (5.5%) |
| 35 to 64 Years | 176 (9.5%) | 212 (10.9%) |
| 65 to 74 Years | 19 (3.4%) | 61 (9.4%) |
| 75 Years and over | 0 (0.0%) | 28 (7.4%) |
Disability Class: Ambulatory Difficulty
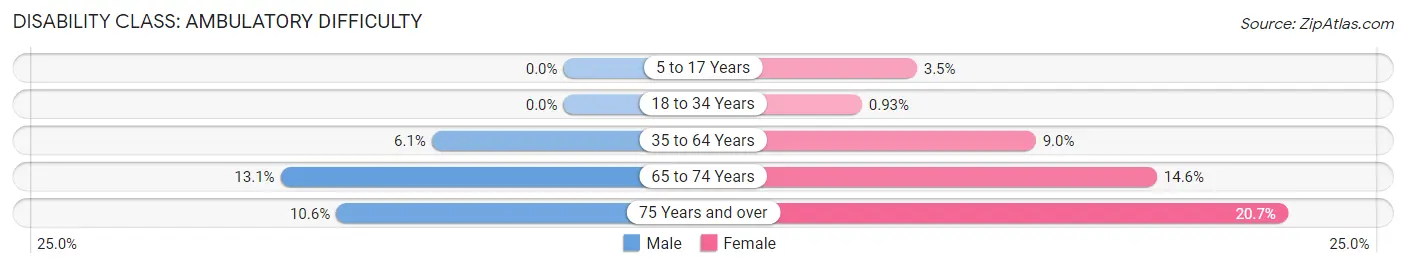
| Age Bracket | Male | Female |
| 5 to 17 Years | 0 (0.0%) | 27 (3.5%) |
| 18 to 34 Years | 0 (0.0%) | 9 (0.9%) |
| 35 to 64 Years | 113 (6.1%) | 175 (9.0%) |
| 65 to 74 Years | 73 (13.1%) | 95 (14.6%) |
| 75 Years and over | 29 (10.5%) | 78 (20.7%) |
Disability Class: Self-Care Difficulty
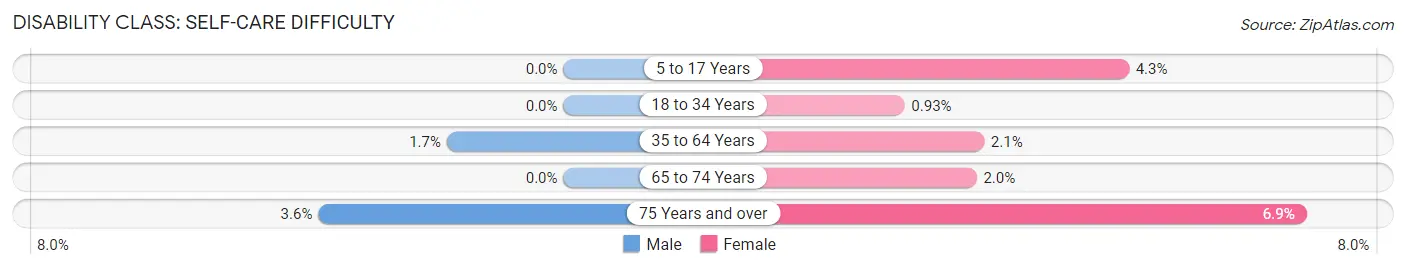
| Age Bracket | Male | Female |
| 5 to 17 Years | 0 (0.0%) | 33 (4.3%) |
| 18 to 34 Years | 0 (0.0%) | 9 (0.9%) |
| 35 to 64 Years | 32 (1.7%) | 41 (2.1%) |
| 65 to 74 Years | 0 (0.0%) | 13 (2.0%) |
| 75 Years and over | 10 (3.6%) | 26 (6.9%) |
Technology Access in Versailles
Computing Device Access in Versailles
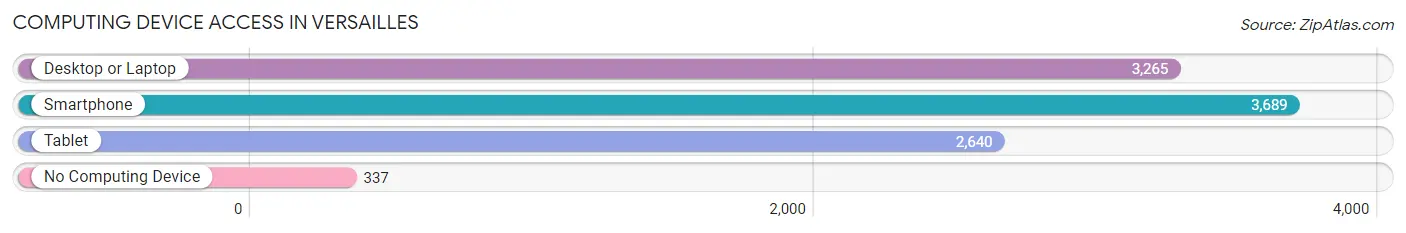
| Device Type | # Households | % Households |
| Desktop or Laptop | 3,265 | 76.9% |
| Smartphone | 3,689 | 86.9% |
| Tablet | 2,640 | 62.2% |
| No Computing Device | 337 | 7.9% |
| Total | 4,243 | 100.0% |
Internet Access in Versailles
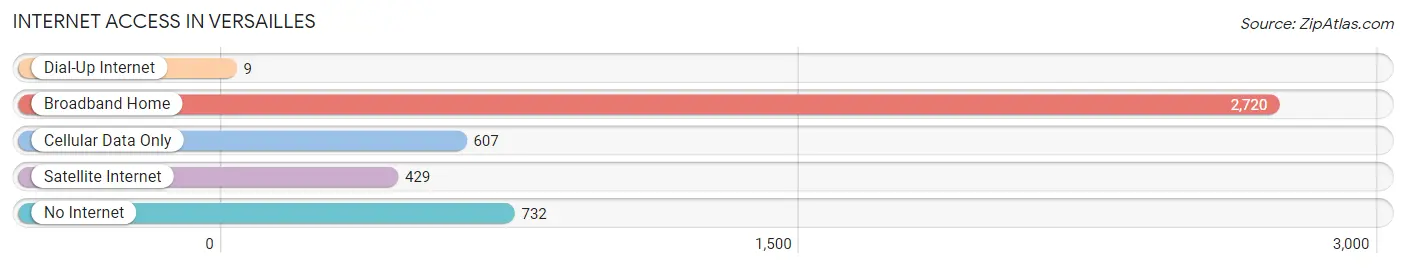
| Internet Type | # Households | % Households |
| Dial-Up Internet | 9 | 0.2% |
| Broadband Home | 2,720 | 64.1% |
| Cellular Data Only | 607 | 14.3% |
| Satellite Internet | 429 | 10.1% |
| No Internet | 732 | 17.2% |
| Total | 4,243 | 100.0% |
Versailles Summary
Versailles is a city located in Woodford County, Kentucky, United States. It is part of the Lexington-Fayette Metropolitan Statistical Area. The population was 8,568 at the 2010 census. It is the county seat of Woodford County.
History
The area that is now Versailles was first settled in 1774 by James McCoun, a veteran of the American Revolutionary War. The settlement was originally known as McCoun's Station, and was located at the intersection of the Louisville and Lexington Turnpike and the Lexington and Big Sandy Turnpike. The settlement was renamed Versailles in 1792, after the French city of the same name.
The city was officially incorporated in 1837. The city was the site of a Civil War battle in 1862, when Confederate forces under General Braxton Bragg attempted to capture the city. The Union forces were able to repel the attack, and the city remained in Union hands for the remainder of the war.
Geography
Versailles is located at 38°2′17″N 84°41′25″W (38.038139, -84.690278). According to the United States Census Bureau, the city has a total area of 5.2 square miles (13.4 km2), all land.
Economy
The economy of Versailles is largely based on agriculture and tourism. The city is home to several wineries, including the Woodford Reserve Distillery, which produces bourbon whiskey. The city is also home to several horse farms, including the world-famous Three Chimneys Farm, which is home to some of the world's most successful racehorses.
Demographics
As of the census of 2000, there were 8,160 people, 3,093 households, and 2,092 families residing in the city. The population density was 1,567.2 people per square mile (605.7/km2). There were 3,310 housing units at an average density of 641.2 per square mile (247.3/km2). The racial makeup of the city was 93.2% White, 4.2% African American, 0.2% Native American, 0.7% Asian, 0.1% Pacific Islander, 0.7% from other races, and 0.9% from two or more races. Hispanic or Latino of any race were 1.7% of the population.
There were 3,093 households, out of which 33.2% had children under the age of 18 living with them, 51.2% were married couples living together, 12.7% had a female householder with no husband present, and 32.2% were non-families. 27.3% of all households were made up of individuals, and 10.2% had someone living alone who was 65 years of age or older. The average household size was 2.48 and the average family size was 3.02.
In the city, the population was spread out, with 25.2% under the age of 18, 8.2% from 18 to 24, 30.2% from 25 to 44, 22.3% from 45 to 64, and 14.1% who were 65 years of age or older. The median age was 36 years. For every 100 females, there were 91.2 males. For every 100 females age 18 and over, there were 87.2 males.
The median income for a household in the city was $41,945, and the median income for a family was $50,945. Males had a median income of $35,945 versus $25,945 for females. The per capita income for the city was $20,945. About 5.2% of families and 7.2% of the population were below the poverty line, including 8.2% of those under age 18 and 8.2% of those age 65 or over.
Common Questions
What is Per Capita Income in Versailles?
Per Capita income in Versailles is $32,984.
What is the Median Family Income in Versailles?
Median Family Income in Versailles is $80,052.
What is the Median Household income in Versailles?
Median Household Income in Versailles is $55,606.
What is Income or Wage Gap in Versailles?
Income or Wage Gap in Versailles is 22.3%.
Women in Versailles earn 77.7 cents for every dollar earned by a man.
What is Family Income Deficit in Versailles?
Family Income Deficit in Versailles is $12,729.
Families that are below poverty line in Versailles earn $12,729 less on average than the poverty threshold level.
What is Inequality or Gini Index in Versailles?
Inequality or Gini Index in Versailles is 0.43.
What is the Total Population of Versailles?
Total Population of Versailles is 10,297.
What is the Total Male Population of Versailles?
Total Male Population of Versailles is 5,071.
What is the Total Female Population of Versailles?
Total Female Population of Versailles is 5,226.
What is the Ratio of Males per 100 Females in Versailles?
There are 97.03 Males per 100 Females in Versailles.
What is the Ratio of Females per 100 Males in Versailles?
There are 103.06 Females per 100 Males in Versailles.
What is the Median Population Age in Versailles?
Median Population Age in Versailles is 39.8 Years.
What is the Average Family Size in Versailles
Average Family Size in Versailles is 3.0 People.
What is the Average Household Size in Versailles
Average Household Size in Versailles is 2.4 People.
How Large is the Labor Force in Versailles?
There are 5,671 People in the Labor Forcein in Versailles.
What is the Percentage of People in the Labor Force in Versailles?
69.3% of People are in the Labor Force in Versailles.
What is the Unemployment Rate in Versailles?
Unemployment Rate in Versailles is 2.9%.