Cave City, KY Map & Demographics
Cave City Map
Cave City Overview
$21,727
PER CAPITA INCOME
$53,150
AVG FAMILY INCOME
$37,431
AVG HOUSEHOLD INCOME
16.0%
WAGE / INCOME GAP [ % ]
84.0¢/ $1
WAGE / INCOME GAP [ $ ]
0.47
INEQUALITY / GINI INDEX
2,707
TOTAL POPULATION
1,347
MALE POPULATION
1,360
FEMALE POPULATION
99.04
MALES / 100 FEMALES
100.97
FEMALES / 100 MALES
40.2
MEDIAN AGE
3.2
AVG FAMILY SIZE
2.3
AVG HOUSEHOLD SIZE
1,211
LABOR FORCE [ PEOPLE ]
54.1%
PERCENT IN LABOR FORCE
9.2%
UNEMPLOYMENT RATE
Cave City Zip Codes
Cave City Area Codes
Income in Cave City
Income Overview in Cave City
Per Capita Income in Cave City is $21,727, while median incomes of families and households are $53,150 and $37,431 respectively.
| Characteristic | Number | Measure |
| Per Capita Income | 2,707 | $21,727 |
| Median Family Income | 599 | $53,150 |
| Mean Family Income | 599 | $67,972 |
| Median Household Income | 1,165 | $37,431 |
| Mean Household Income | 1,165 | $48,384 |
| Income Deficit | 599 | $0 |
| Wage / Income Gap (%) | 2,707 | 15.99% |
| Wage / Income Gap ($) | 2,707 | 84.01¢ per $1 |
| Gini / Inequality Index | 2,707 | 0.47 |
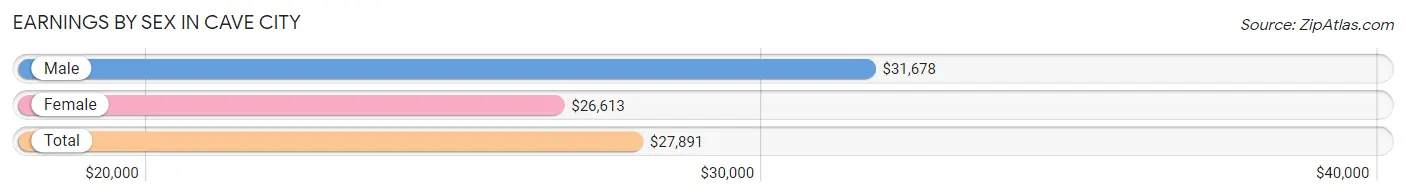
Earnings by Sex in Cave City
Average Earnings in Cave City are $27,891, $31,678 for men and $26,613 for women, a difference of 16.0%.
| Sex | Number | Average Earnings |
| Male | 665 (51.2%) | $31,678 |
| Female | 634 (48.8%) | $26,613 |
| Total | 1,299 (100.0%) | $27,891 |
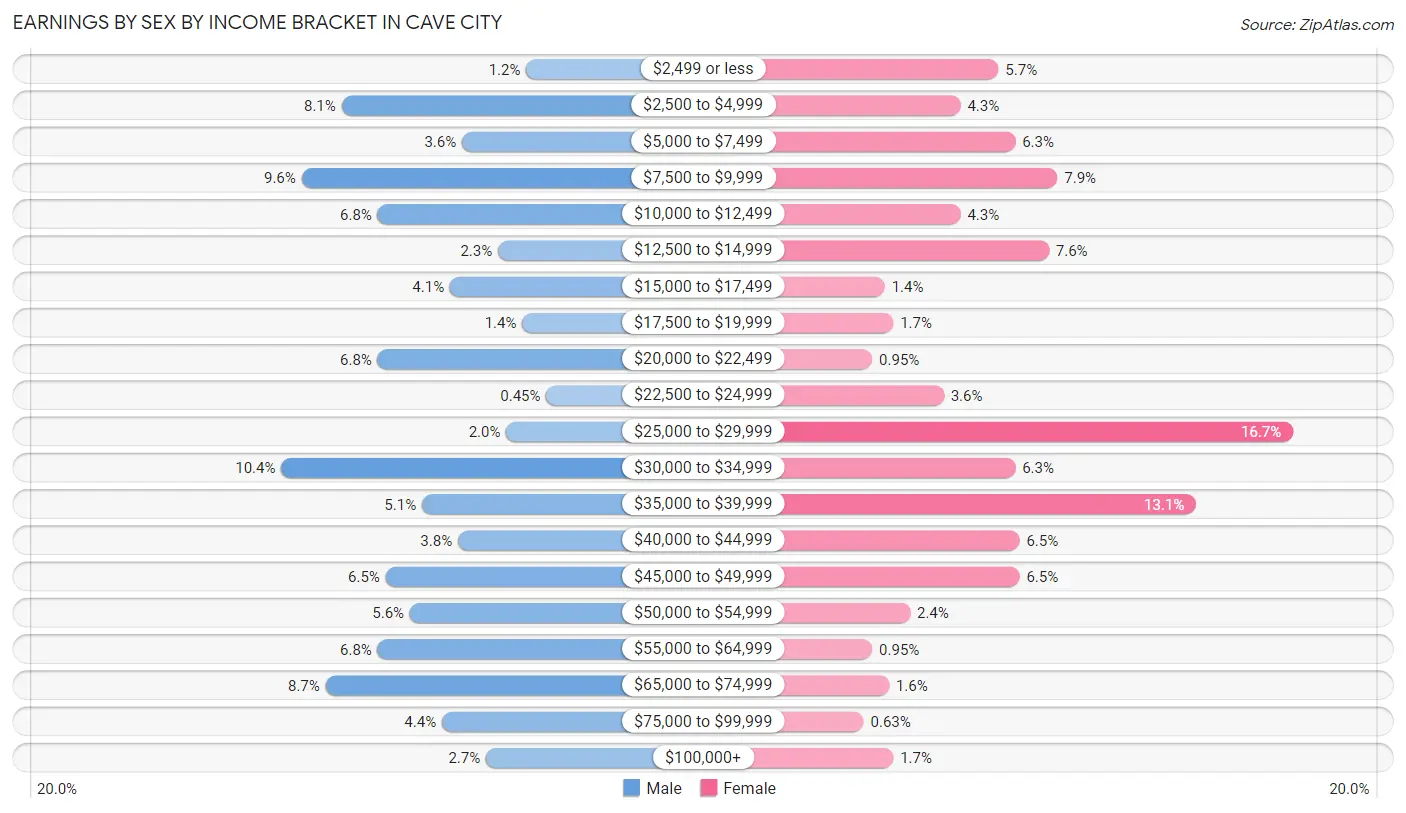
Earnings by Sex by Income Bracket in Cave City
The most common earnings brackets in Cave City are $30,000 to $34,999 for men (69 | 10.4%) and $25,000 to $29,999 for women (106 | 16.7%).
| Income | Male | Female |
| $2,499 or less | 8 (1.2%) | 36 (5.7%) |
| $2,500 to $4,999 | 54 (8.1%) | 27 (4.3%) |
| $5,000 to $7,499 | 24 (3.6%) | 40 (6.3%) |
| $7,500 to $9,999 | 64 (9.6%) | 50 (7.9%) |
| $10,000 to $12,499 | 45 (6.8%) | 27 (4.3%) |
| $12,500 to $14,999 | 15 (2.3%) | 48 (7.6%) |
| $15,000 to $17,499 | 27 (4.1%) | 9 (1.4%) |
| $17,500 to $19,999 | 9 (1.3%) | 11 (1.7%) |
| $20,000 to $22,499 | 45 (6.8%) | 6 (0.9%) |
| $22,500 to $24,999 | 3 (0.4%) | 23 (3.6%) |
| $25,000 to $29,999 | 13 (1.9%) | 106 (16.7%) |
| $30,000 to $34,999 | 69 (10.4%) | 40 (6.3%) |
| $35,000 to $39,999 | 34 (5.1%) | 83 (13.1%) |
| $40,000 to $44,999 | 25 (3.8%) | 41 (6.5%) |
| $45,000 to $49,999 | 43 (6.5%) | 41 (6.5%) |
| $50,000 to $54,999 | 37 (5.6%) | 15 (2.4%) |
| $55,000 to $64,999 | 45 (6.8%) | 6 (0.9%) |
| $65,000 to $74,999 | 58 (8.7%) | 10 (1.6%) |
| $75,000 to $99,999 | 29 (4.4%) | 4 (0.6%) |
| $100,000+ | 18 (2.7%) | 11 (1.7%) |
| Total | 665 (100.0%) | 634 (100.0%) |
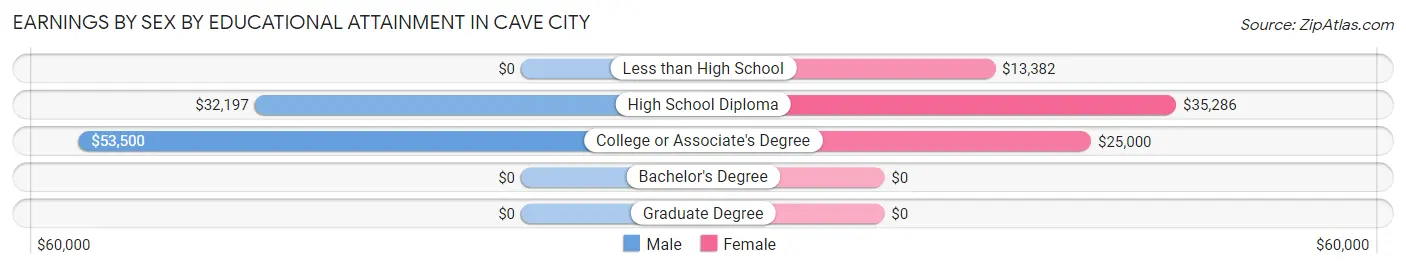
Earnings by Sex by Educational Attainment in Cave City
Average earnings in Cave City are $33,629 for men and $28,419 for women, a difference of 15.5%. Men with an educational attainment of college or associate's degree enjoy the highest average annual earnings of $53,500, while those with high school diploma education earn the least with $32,197. Women with an educational attainment of high school diploma earn the most with the average annual earnings of $35,286, while those with less than high school education have the smallest earnings of $13,382.
| Educational Attainment | Male Income | Female Income |
| Less than High School | - | - |
| High School Diploma | $32,197 | $35,286 |
| College or Associate's Degree | $53,500 | $25,000 |
| Bachelor's Degree | - | - |
| Graduate Degree | - | - |
| Total | $33,629 | $28,419 |
Family Income in Cave City
Family Income Brackets in Cave City
According to the Cave City family income data, there are 111 families falling into the $75,000 to $99,999 income range, which is the most common income bracket and makes up 18.5% of all families. Conversely, the less than $10,000 income bracket is the least frequent group with only 16 families (2.7%) belonging to this category.
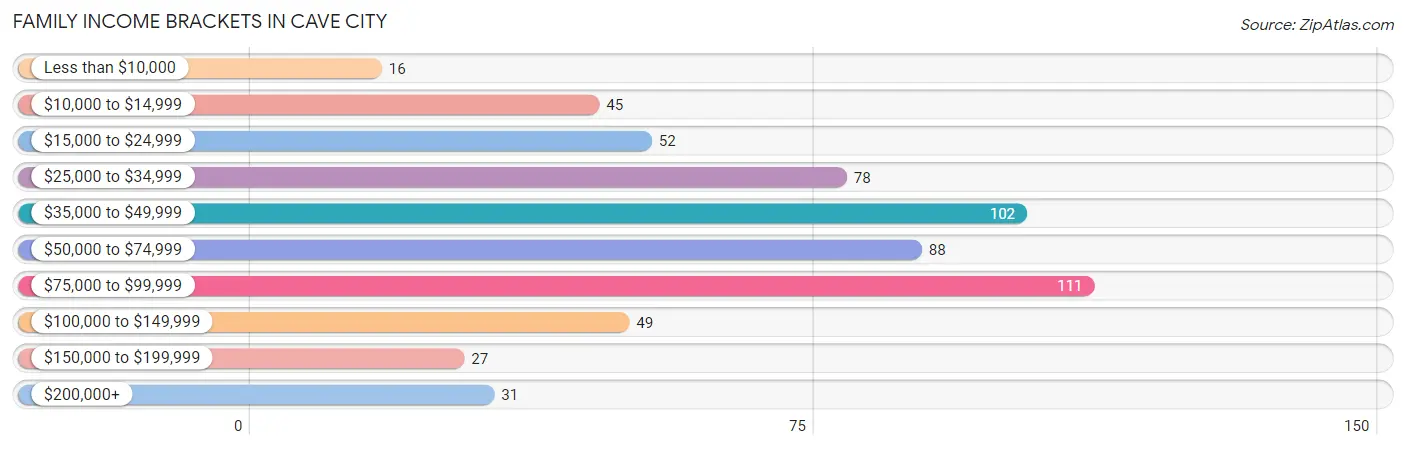
| Income Bracket | # Families | % Families |
| Less than $10,000 | 16 | 2.7% |
| $10,000 to $14,999 | 45 | 7.5% |
| $15,000 to $24,999 | 52 | 8.7% |
| $25,000 to $34,999 | 78 | 13.0% |
| $35,000 to $49,999 | 102 | 17.0% |
| $50,000 to $74,999 | 88 | 14.7% |
| $75,000 to $99,999 | 111 | 18.5% |
| $100,000 to $149,999 | 49 | 8.2% |
| $150,000 to $199,999 | 27 | 4.5% |
| $200,000+ | 31 | 5.2% |
Family Income by Famaliy Size in Cave City
5-person families (61 | 10.2%) account for the highest median family income in Cave City with $76,122 per family, while 2-person families (309 | 51.6%) have the highest median income of $19,399 per family member.
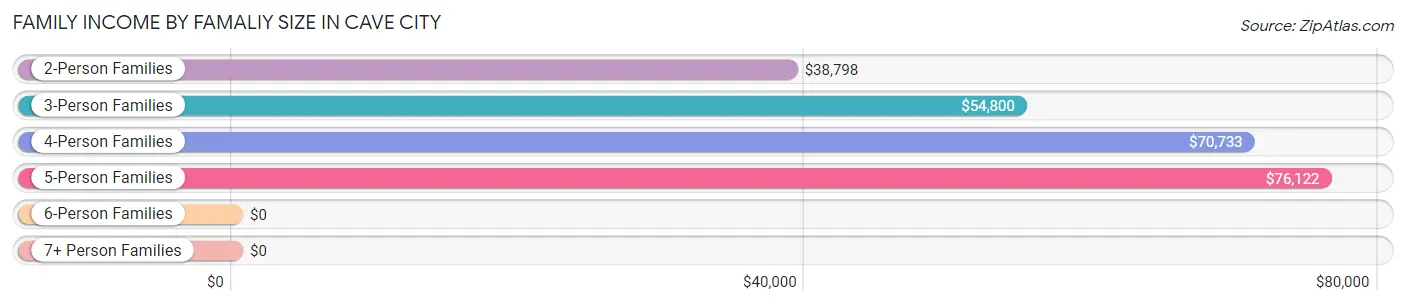
| Income Bracket | # Families | Median Income |
| 2-Person Families | 309 (51.6%) | $38,798 |
| 3-Person Families | 126 (21.0%) | $54,800 |
| 4-Person Families | 87 (14.5%) | $70,733 |
| 5-Person Families | 61 (10.2%) | $76,122 |
| 6-Person Families | 7 (1.2%) | $0 |
| 7+ Person Families | 9 (1.5%) | $0 |
| Total | 599 (100.0%) | $53,150 |
Family Income by Number of Earners in Cave City
The median family income in Cave City is $53,150, with families comprising 2 earners (208) having the highest median family income of $98,462, while families with no earners (122) have the lowest median family income of $31,184, accounting for 34.7% and 20.4% of families, respectively.
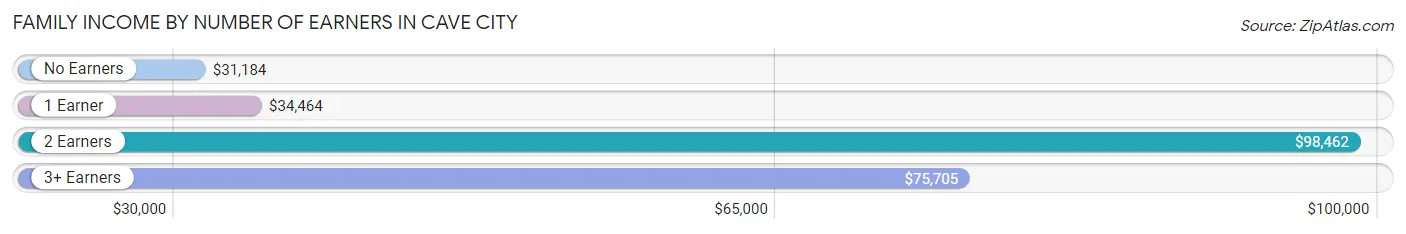
| Number of Earners | # Families | Median Income |
| No Earners | 122 (20.4%) | $31,184 |
| 1 Earner | 213 (35.6%) | $34,464 |
| 2 Earners | 208 (34.7%) | $98,462 |
| 3+ Earners | 56 (9.3%) | $75,705 |
| Total | 599 (100.0%) | $53,150 |
Household Income in Cave City
Household Income Brackets in Cave City
With 209 households falling in the category, the $35,000 to $49,999 income range is the most frequent in Cave City, accounting for 17.9% of all households. In contrast, only 27 households (2.3%) fall into the $150,000 to $199,999 income bracket, making it the least populous group.
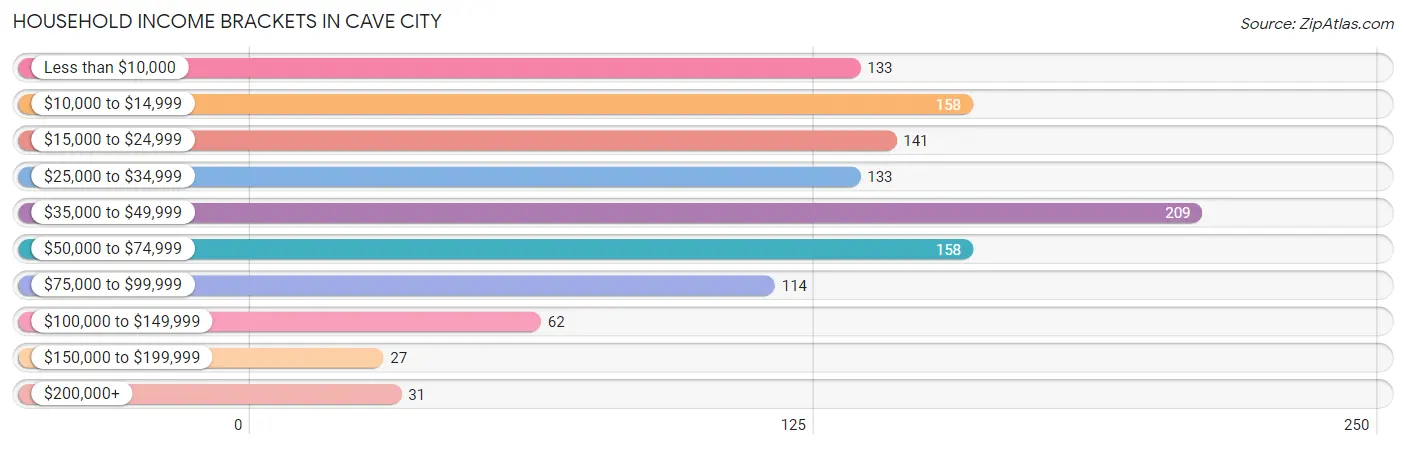
| Income Bracket | # Households | % Households |
| Less than $10,000 | 133 | 11.4% |
| $10,000 to $14,999 | 158 | 13.6% |
| $15,000 to $24,999 | 141 | 12.1% |
| $25,000 to $34,999 | 133 | 11.4% |
| $35,000 to $49,999 | 209 | 17.9% |
| $50,000 to $74,999 | 158 | 13.6% |
| $75,000 to $99,999 | 114 | 9.8% |
| $100,000 to $149,999 | 62 | 5.3% |
| $150,000 to $199,999 | 27 | 2.3% |
| $200,000+ | 31 | 2.7% |
Household Income by Householder Age in Cave City
The median household income in Cave City is $37,431, with the highest median household income of $46,000 found in the 45 to 64 years age bracket for the primary householder. A total of 352 households (30.2%) fall into this category. Meanwhile, the 65+ years age bracket for the primary householder has the lowest median household income of $17,888, with 409 households (35.1%) in this group.
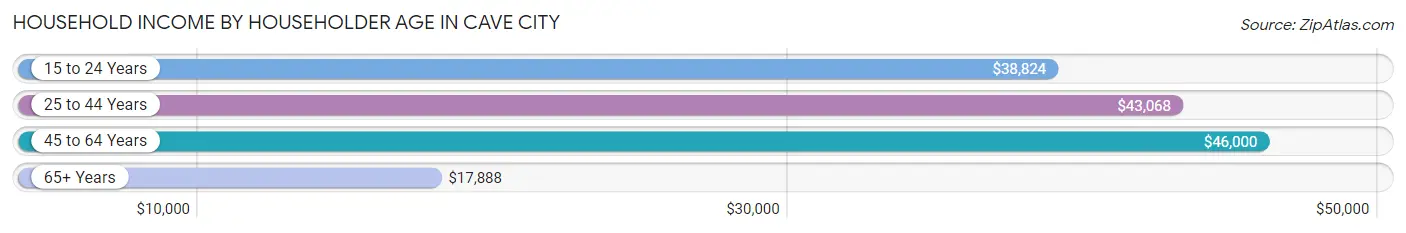
| Income Bracket | # Households | Median Income |
| 15 to 24 Years | 40 (3.4%) | $38,824 |
| 25 to 44 Years | 364 (31.2%) | $43,068 |
| 45 to 64 Years | 352 (30.2%) | $46,000 |
| 65+ Years | 409 (35.1%) | $17,888 |
| Total | 1,165 (100.0%) | $37,431 |
Poverty in Cave City
Income Below Poverty by Sex and Age in Cave City
With 27.5% poverty level for males and 35.7% for females among the residents of Cave City, under 5 year old males and 12 to 14 year old females are the most vulnerable to poverty, with 55 males (72.4%) and 16 females (100.0%) in their respective age groups living below the poverty level.
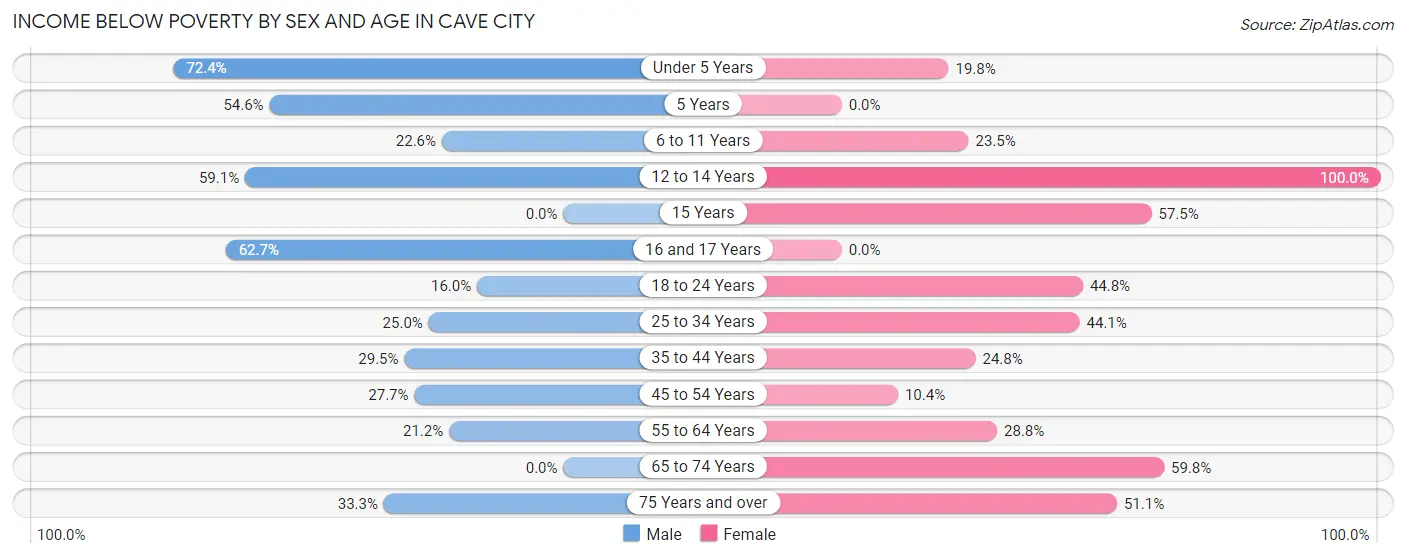
| Age Bracket | Male | Female |
| Under 5 Years | 55 (72.4%) | 21 (19.8%) |
| 5 Years | 6 (54.5%) | 0 (0.0%) |
| 6 to 11 Years | 23 (22.6%) | 8 (23.5%) |
| 12 to 14 Years | 26 (59.1%) | 16 (100.0%) |
| 15 Years | 0 (0.0%) | 23 (57.5%) |
| 16 and 17 Years | 47 (62.7%) | 0 (0.0%) |
| 18 to 24 Years | 33 (16.0%) | 47 (44.8%) |
| 25 to 34 Years | 34 (25.0%) | 98 (44.1%) |
| 35 to 44 Years | 54 (29.5%) | 36 (24.8%) |
| 45 to 54 Years | 52 (27.7%) | 22 (10.4%) |
| 55 to 64 Years | 28 (21.2%) | 47 (28.8%) |
| 65 to 74 Years | 0 (0.0%) | 64 (59.8%) |
| 75 Years and over | 13 (33.3%) | 95 (51.1%) |
| Total | 371 (27.5%) | 477 (35.7%) |
Income Above Poverty by Sex and Age in Cave City
According to the poverty statistics in Cave City, males aged 15 years and females aged 45 to 54 years are the age groups that are most secure financially, with 100.0% of males and 89.6% of females in these age groups living above the poverty line.
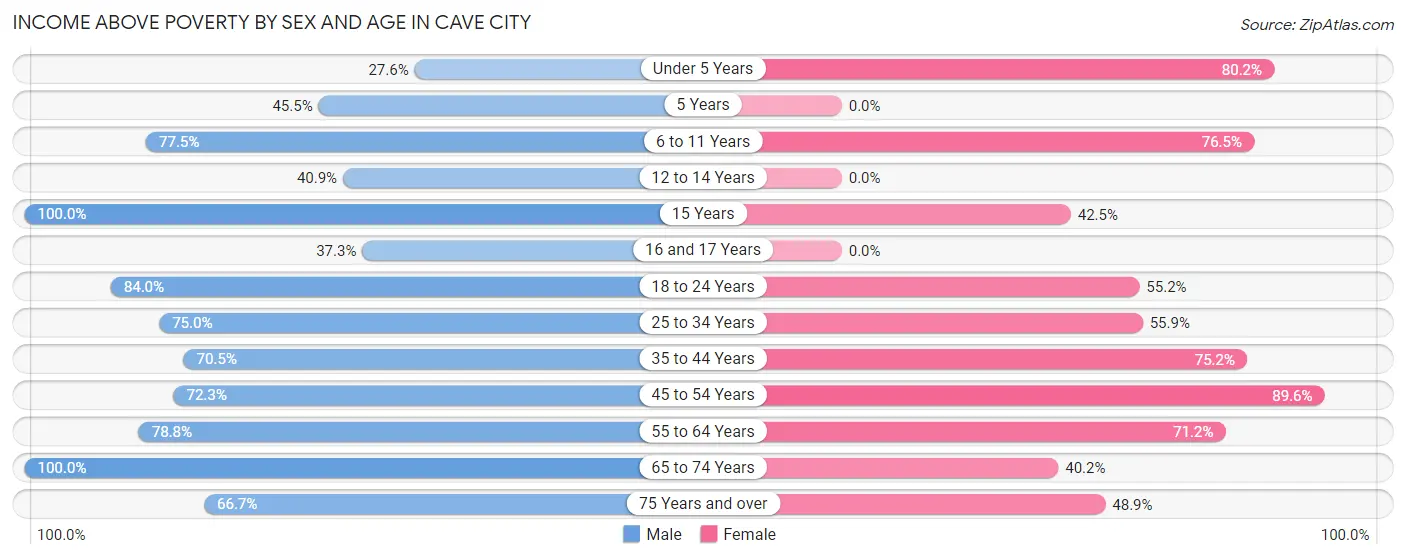
| Age Bracket | Male | Female |
| Under 5 Years | 21 (27.6%) | 85 (80.2%) |
| 5 Years | 5 (45.5%) | 0 (0.0%) |
| 6 to 11 Years | 79 (77.4%) | 26 (76.5%) |
| 12 to 14 Years | 18 (40.9%) | 0 (0.0%) |
| 15 Years | 14 (100.0%) | 17 (42.5%) |
| 16 and 17 Years | 28 (37.3%) | 0 (0.0%) |
| 18 to 24 Years | 173 (84.0%) | 58 (55.2%) |
| 25 to 34 Years | 102 (75.0%) | 124 (55.9%) |
| 35 to 44 Years | 129 (70.5%) | 109 (75.2%) |
| 45 to 54 Years | 136 (72.3%) | 189 (89.6%) |
| 55 to 64 Years | 104 (78.8%) | 116 (71.2%) |
| 65 to 74 Years | 141 (100.0%) | 43 (40.2%) |
| 75 Years and over | 26 (66.7%) | 91 (48.9%) |
| Total | 976 (72.5%) | 858 (64.3%) |
Income Below Poverty Among Married-Couple Families in Cave City
The poverty statistics for married-couple families in Cave City show that 9.6% or 35 of the total 365 families live below the poverty line. Families with 3 or 4 children have the highest poverty rate of 50.0%, comprising of 9 families. On the other hand, families with no children have the lowest poverty rate of 3.3%, which includes 8 families.
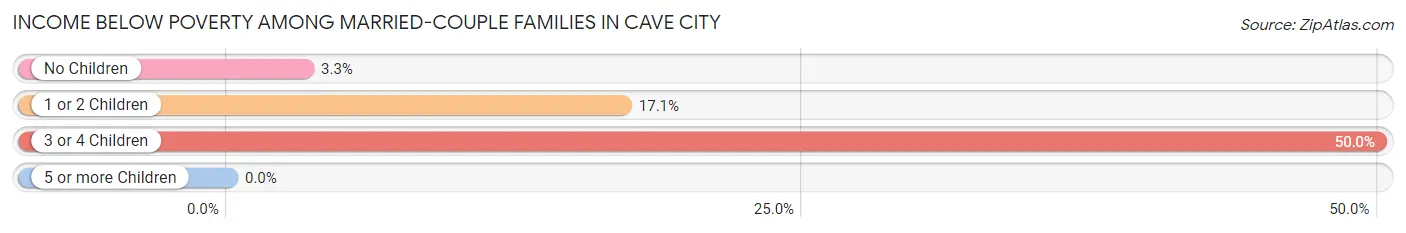
| Children | Above Poverty | Below Poverty |
| No Children | 234 (96.7%) | 8 (3.3%) |
| 1 or 2 Children | 87 (82.9%) | 18 (17.1%) |
| 3 or 4 Children | 9 (50.0%) | 9 (50.0%) |
| 5 or more Children | 0 (0.0%) | 0 (0.0%) |
| Total | 330 (90.4%) | 35 (9.6%) |
Income Below Poverty Among Single-Parent Households in Cave City
According to the poverty data in Cave City, 5.2% or 3 single-father households and 44.9% or 79 single-mother households are living below the poverty line. Among single-father households, those with 1 or 2 children have the highest poverty rate, with 3 households (6.2%) experiencing poverty. Likewise, among single-mother households, those with 3 or 4 children have the highest poverty rate, with 28 households (100.0%) falling below the poverty line.
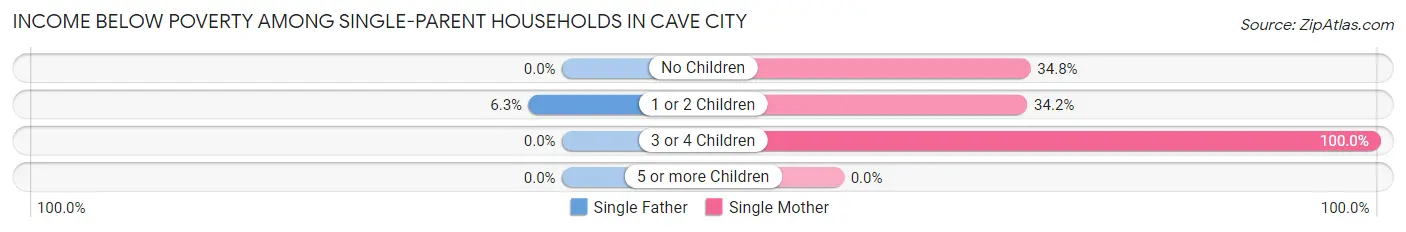
| Children | Single Father | Single Mother |
| No Children | 0 (0.0%) | 24 (34.8%) |
| 1 or 2 Children | 3 (6.2%) | 27 (34.2%) |
| 3 or 4 Children | 0 (0.0%) | 28 (100.0%) |
| 5 or more Children | 0 (0.0%) | 0 (0.0%) |
| Total | 3 (5.2%) | 79 (44.9%) |
Income Below Poverty Among Married-Couple vs Single-Parent Households in Cave City
The poverty data for Cave City shows that 35 of the married-couple family households (9.6%) and 82 of the single-parent households (35.0%) are living below the poverty level. Within the married-couple family households, those with 3 or 4 children have the highest poverty rate, with 9 households (50.0%) falling below the poverty line. Among the single-parent households, those with 3 or 4 children have the highest poverty rate, with 28 household (100.0%) living below poverty.
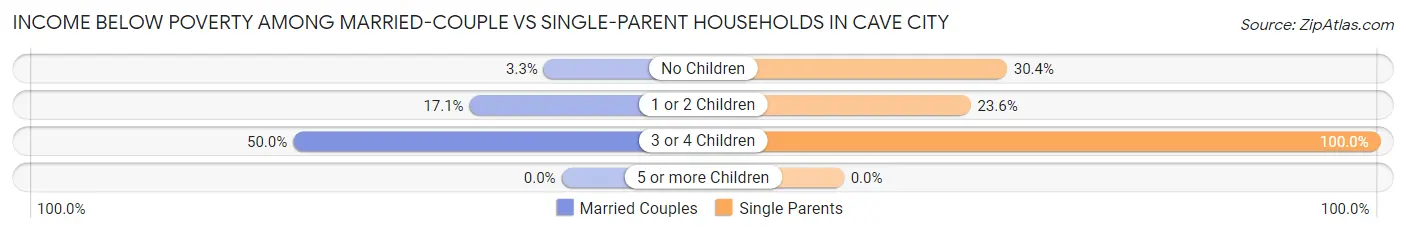
| Children | Married-Couple Families | Single-Parent Households |
| No Children | 8 (3.3%) | 24 (30.4%) |
| 1 or 2 Children | 18 (17.1%) | 30 (23.6%) |
| 3 or 4 Children | 9 (50.0%) | 28 (100.0%) |
| 5 or more Children | 0 (0.0%) | 0 (0.0%) |
| Total | 35 (9.6%) | 82 (35.0%) |
Race in Cave City
The most populous races in Cave City are White / Caucasian (2,354 | 87.0%), Black / African American (146 | 5.4%), and Two or more Races (117 | 4.3%).
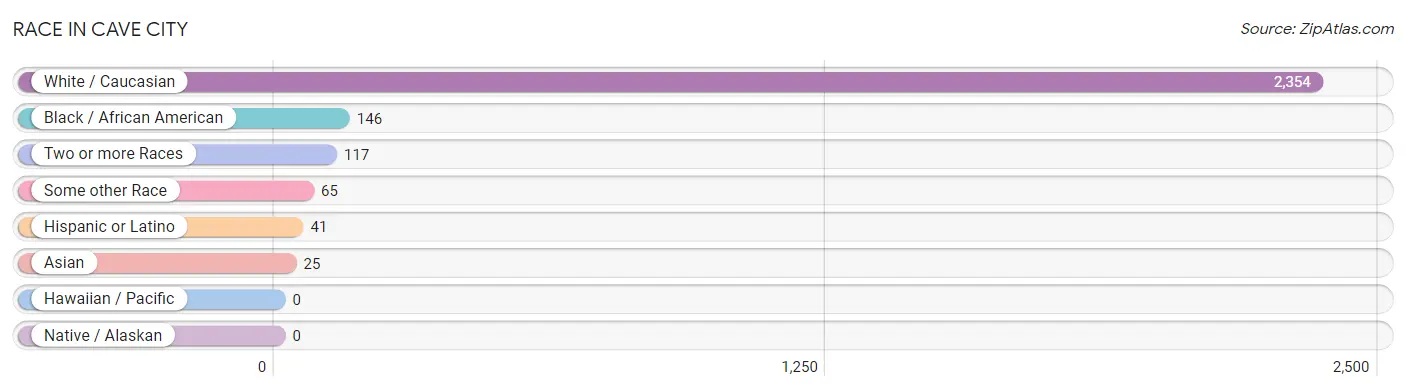
| Race | # Population | % Population |
| Asian | 25 | 0.9% |
| Black / African American | 146 | 5.4% |
| Hawaiian / Pacific | 0 | 0.0% |
| Hispanic or Latino | 41 | 1.5% |
| Native / Alaskan | 0 | 0.0% |
| White / Caucasian | 2,354 | 87.0% |
| Two or more Races | 117 | 4.3% |
| Some other Race | 65 | 2.4% |
| Total | 2,707 | 100.0% |
Ancestry in Cave City
The most populous ancestries reported in Cave City are American (482 | 17.8%), English (352 | 13.0%), Irish (210 | 7.8%), German (100 | 3.7%), and Cherokee (47 | 1.7%), together accounting for 44.0% of all Cave City residents.
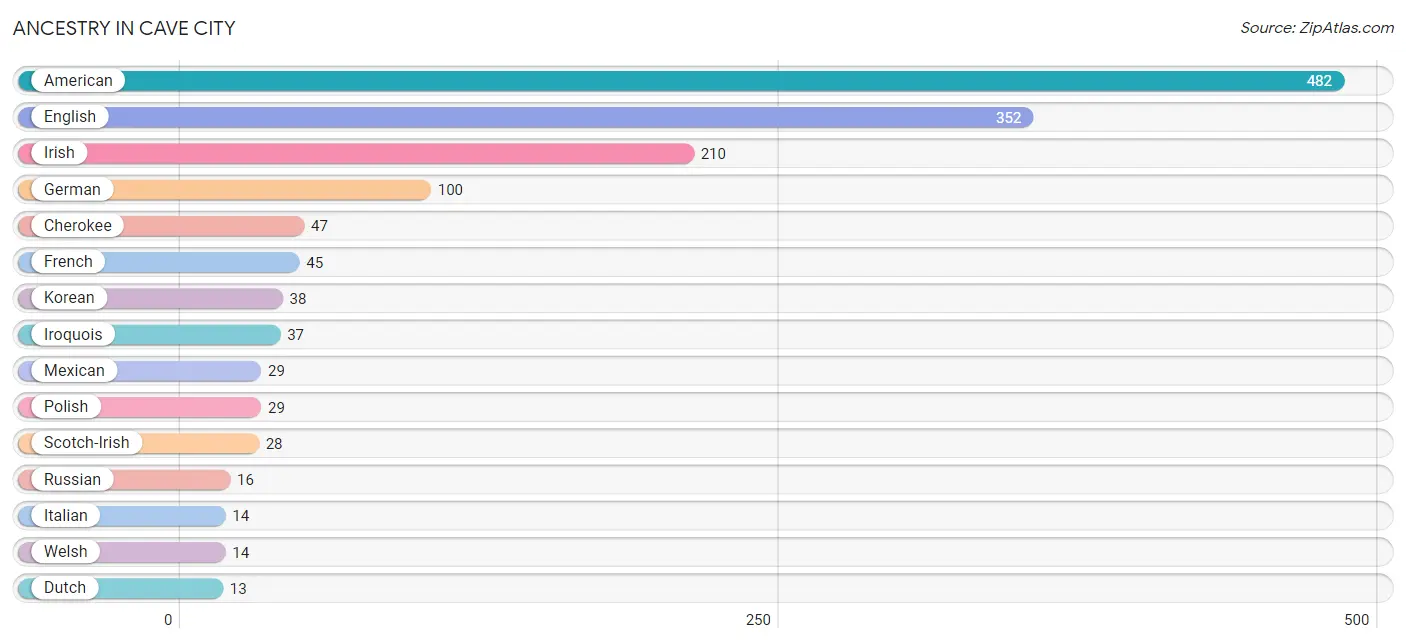
| Ancestry | # Population | % Population |
| American | 482 | 17.8% |
| British | 3 | 0.1% |
| Cherokee | 47 | 1.7% |
| Dutch | 13 | 0.5% |
| English | 352 | 13.0% |
| European | 8 | 0.3% |
| Finnish | 4 | 0.2% |
| French | 45 | 1.7% |
| German | 100 | 3.7% |
| Irish | 210 | 7.8% |
| Iroquois | 37 | 1.4% |
| Italian | 14 | 0.5% |
| Korean | 38 | 1.4% |
| Mexican | 29 | 1.1% |
| Norwegian | 7 | 0.3% |
| Polish | 29 | 1.1% |
| Puerto Rican | 12 | 0.4% |
| Russian | 16 | 0.6% |
| Scotch-Irish | 28 | 1.0% |
| Slovak | 4 | 0.2% |
| Welsh | 14 | 0.5% | View All 21 Rows |
Immigrants in Cave City
The most numerous immigrant groups reported in Cave City came from Asia (50 | 1.8%), Eastern Asia (25 | 0.9%), Japan (25 | 0.9%), Philippines (25 | 0.9%), and South Eastern Asia (25 | 0.9%), together accounting for 5.5% of all Cave City residents.
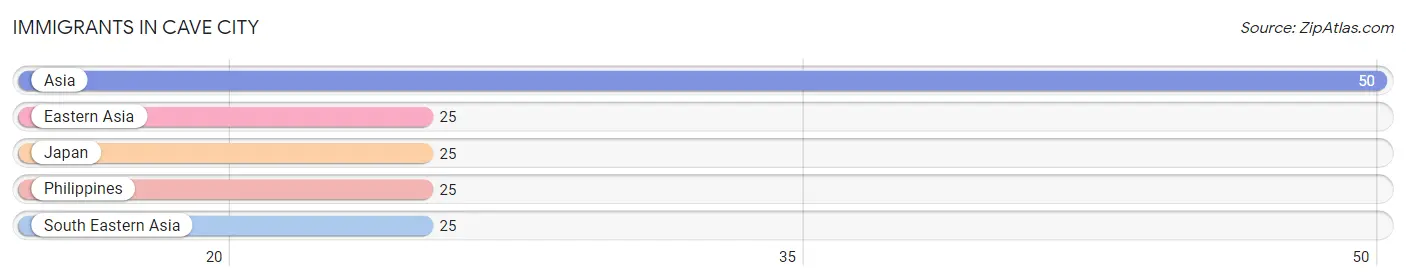
| Immigration Origin | # Population | % Population |
| Asia | 50 | 1.8% |
| Eastern Asia | 25 | 0.9% |
| Japan | 25 | 0.9% |
| Philippines | 25 | 0.9% |
| South Eastern Asia | 25 | 0.9% | View All 5 Rows |
Sex and Age in Cave City
Sex and Age in Cave City
The most populous age groups in Cave City are 20 to 24 Years (156 | 11.6%) for men and 25 to 29 Years (133 | 9.8%) for women.
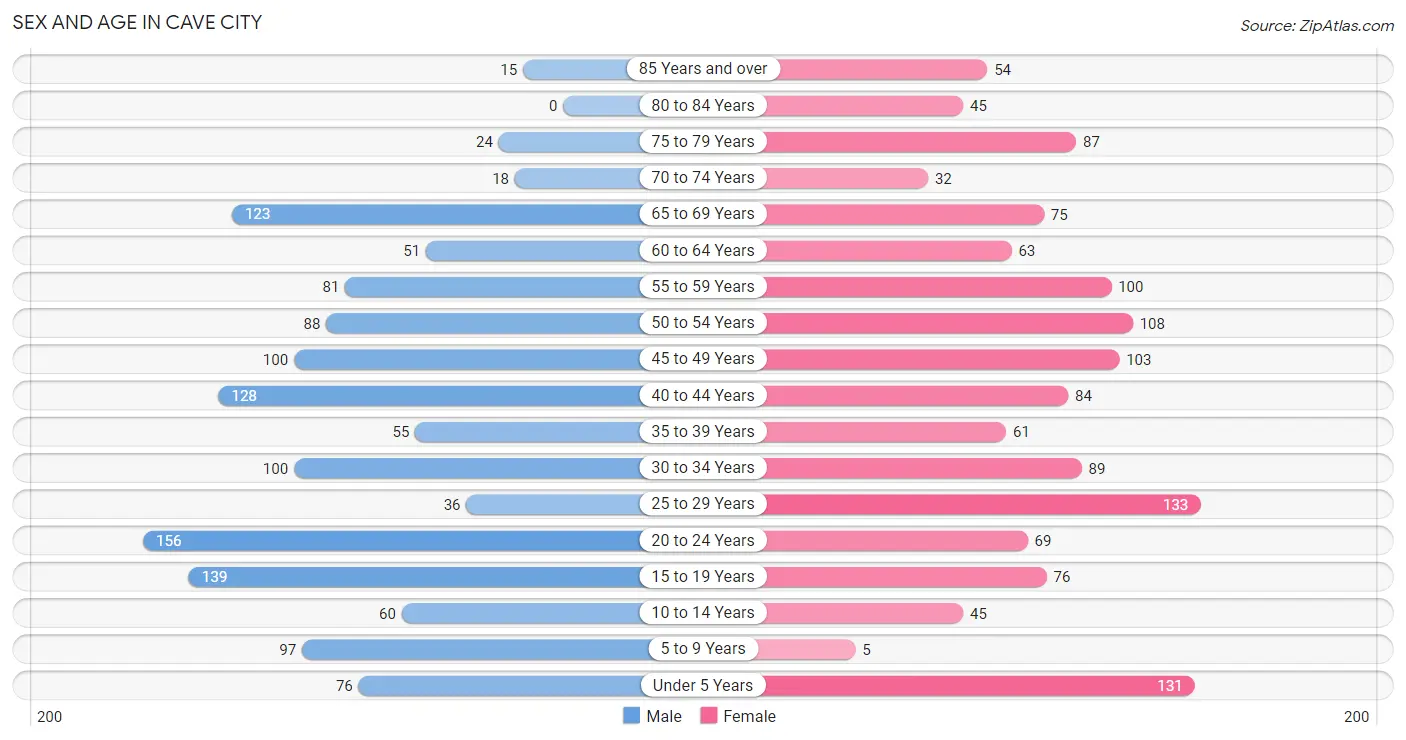
| Age Bracket | Male | Female |
| Under 5 Years | 76 (5.6%) | 131 (9.6%) |
| 5 to 9 Years | 97 (7.2%) | 5 (0.4%) |
| 10 to 14 Years | 60 (4.4%) | 45 (3.3%) |
| 15 to 19 Years | 139 (10.3%) | 76 (5.6%) |
| 20 to 24 Years | 156 (11.6%) | 69 (5.1%) |
| 25 to 29 Years | 36 (2.7%) | 133 (9.8%) |
| 30 to 34 Years | 100 (7.4%) | 89 (6.5%) |
| 35 to 39 Years | 55 (4.1%) | 61 (4.5%) |
| 40 to 44 Years | 128 (9.5%) | 84 (6.2%) |
| 45 to 49 Years | 100 (7.4%) | 103 (7.6%) |
| 50 to 54 Years | 88 (6.5%) | 108 (7.9%) |
| 55 to 59 Years | 81 (6.0%) | 100 (7.3%) |
| 60 to 64 Years | 51 (3.8%) | 63 (4.6%) |
| 65 to 69 Years | 123 (9.1%) | 75 (5.5%) |
| 70 to 74 Years | 18 (1.3%) | 32 (2.4%) |
| 75 to 79 Years | 24 (1.8%) | 87 (6.4%) |
| 80 to 84 Years | 0 (0.0%) | 45 (3.3%) |
| 85 Years and over | 15 (1.1%) | 54 (4.0%) |
| Total | 1,347 (100.0%) | 1,360 (100.0%) |
Families and Households in Cave City
Median Family Size in Cave City
The median family size in Cave City is 3.17 persons per family, with single female/mother families (176 | 29.4%) accounting for the largest median family size of 3.8 persons per family. On the other hand, single male/father families (58 | 9.7%) represent the smallest median family size with 2.21 persons per family.
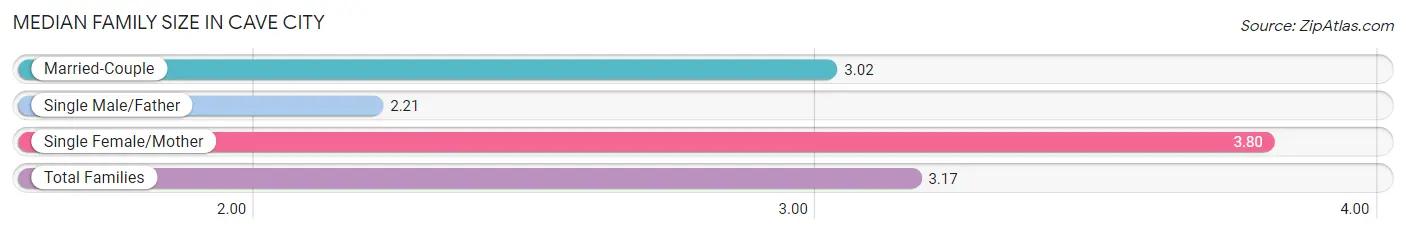
| Family Type | # Families | Family Size |
| Married-Couple | 365 (60.9%) | 3.02 |
| Single Male/Father | 58 (9.7%) | 2.21 |
| Single Female/Mother | 176 (29.4%) | 3.80 |
| Total Families | 599 (100.0%) | 3.17 |
Median Household Size in Cave City
The median household size in Cave City is 2.31 persons per household, with single female/mother households (176 | 15.1%) accounting for the largest median household size of 4.02 persons per household. non-family households (566 | 48.6%) represent the smallest median household size with 1.24 persons per household.
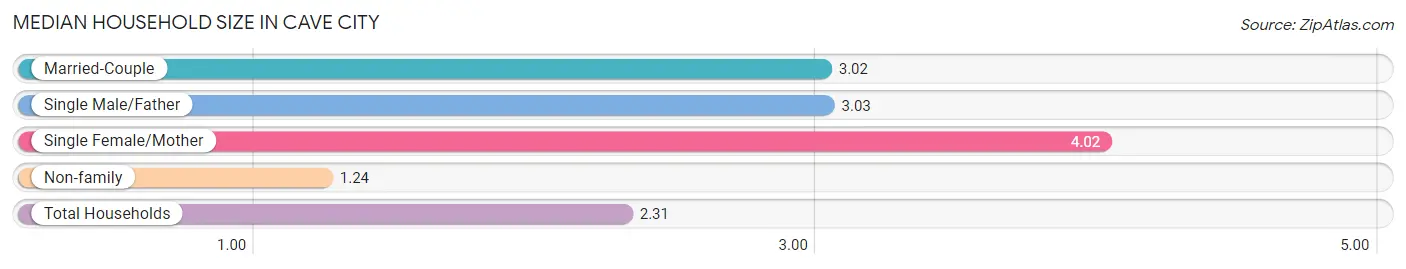
| Household Type | # Households | Household Size |
| Married-Couple | 365 (31.3%) | 3.02 |
| Single Male/Father | 58 (5.0%) | 3.03 |
| Single Female/Mother | 176 (15.1%) | 4.02 |
| Non-family | 566 (48.6%) | 1.24 |
| Total Households | 1,165 (100.0%) | 2.31 |
Household Size by Marriage Status in Cave City
Out of a total of 1,165 households in Cave City, 599 (51.4%) are family households, while 566 (48.6%) are nonfamily households. The most numerous type of family households are 2-person households, comprising 257, and the most common type of nonfamily households are 1-person households, comprising 436.
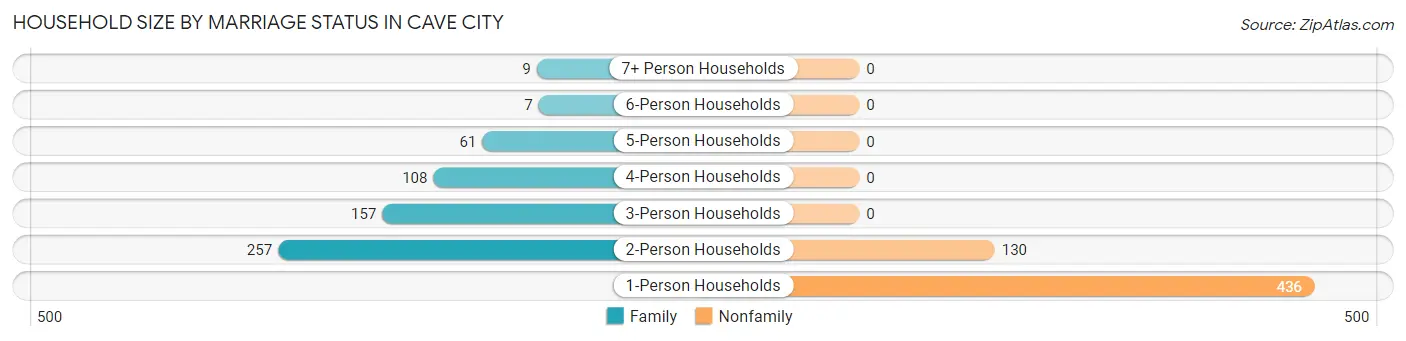
| Household Size | Family Households | Nonfamily Households |
| 1-Person Households | - | 436 (37.4%) |
| 2-Person Households | 257 (22.1%) | 130 (11.2%) |
| 3-Person Households | 157 (13.5%) | 0 (0.0%) |
| 4-Person Households | 108 (9.3%) | 0 (0.0%) |
| 5-Person Households | 61 (5.2%) | 0 (0.0%) |
| 6-Person Households | 7 (0.6%) | 0 (0.0%) |
| 7+ Person Households | 9 (0.8%) | 0 (0.0%) |
| Total | 599 (51.4%) | 566 (48.6%) |
Female Fertility in Cave City
Fertility by Age in Cave City
Average fertility rate in Cave City is 65.0 births per 1,000 women. Women in the age bracket of 20 to 34 years have the highest fertility rate with 117.0 births per 1,000 women. Women in the age bracket of 20 to 34 years acount for 82.9% of all women with births.
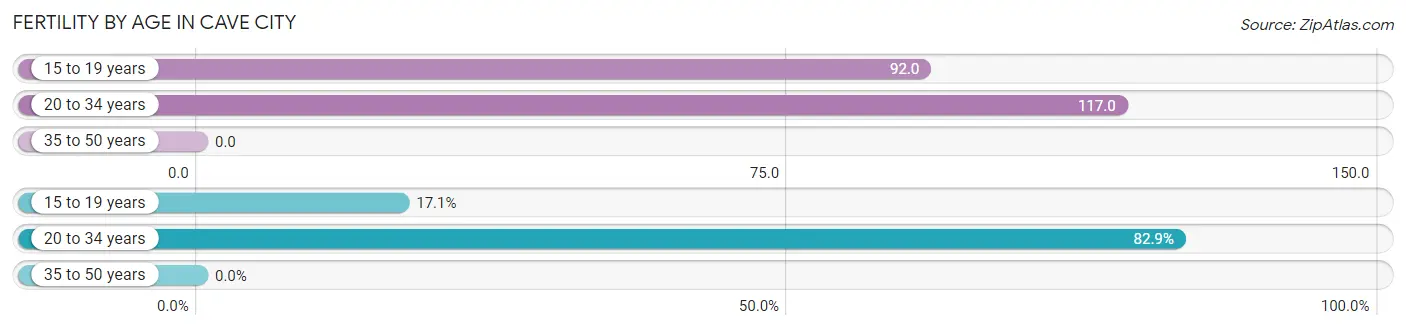
| Age Bracket | Women with Births | Births / 1,000 Women |
| 15 to 19 years | 7 (17.1%) | 92.0 |
| 20 to 34 years | 34 (82.9%) | 117.0 |
| 35 to 50 years | 0 (0.0%) | 0.0 |
| Total | 41 (100.0%) | 65.0 |
Fertility by Age by Marriage Status in Cave City
9.8% of women with births (41) in Cave City are married. The highest percentage of unmarried women with births falls into 15 to 19 years age bracket with 100.0% of them unmarried at the time of birth, while the lowest percentage of unmarried women with births belong to 20 to 34 years age bracket with 88.2% of them unmarried.
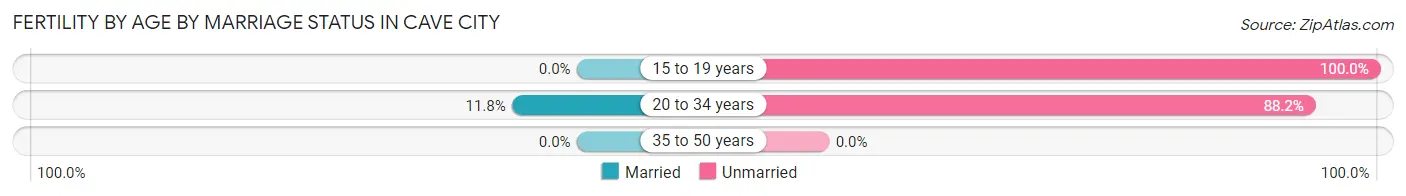
| Age Bracket | Married | Unmarried |
| 15 to 19 years | 0 (0.0%) | 7 (100.0%) |
| 20 to 34 years | 4 (11.8%) | 30 (88.2%) |
| 35 to 50 years | 0 (0.0%) | 0 (0.0%) |
| Total | 4 (9.8%) | 37 (90.2%) |
Fertility by Education in Cave City
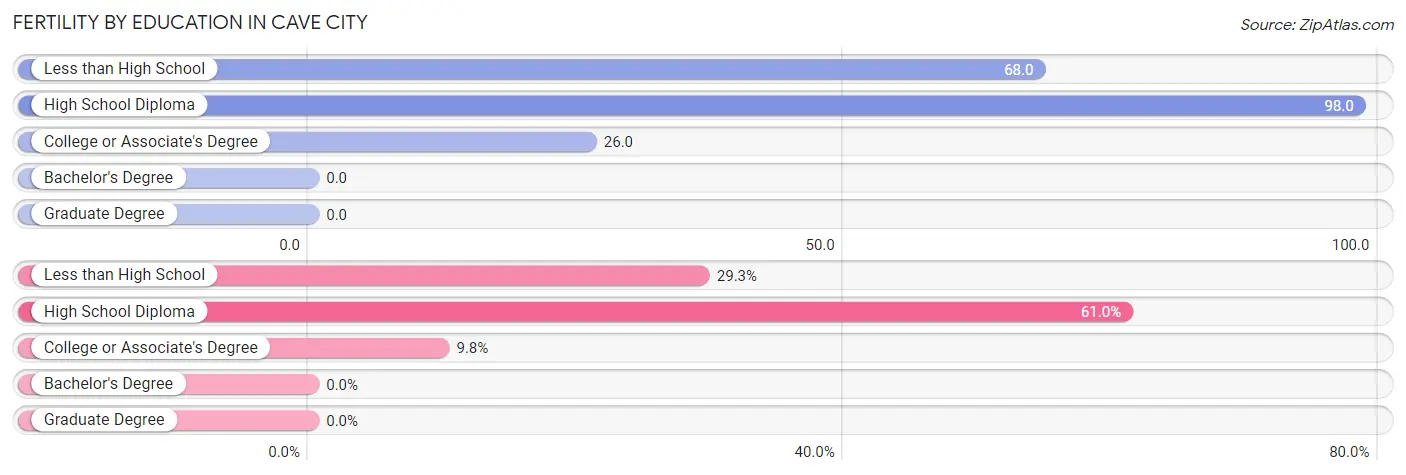
| Educational Attainment | Women with Births | Births / 1,000 Women |
| Less than High School | 12 (29.3%) | 68.0 |
| High School Diploma | 25 (61.0%) | 98.0 |
| College or Associate's Degree | 4 (9.8%) | 26.0 |
| Bachelor's Degree | 0 (0.0%) | 0.0 |
| Graduate Degree | 0 (0.0%) | 0.0 |
| Total | 41 (100.0%) | 65.0 |
Fertility by Education by Marriage Status in Cave City
90.2% of women with births in Cave City are unmarried. Women with the educational attainment of college or associate's degree are most likely to be married with 100.0% of them married at childbirth, while women with the educational attainment of less than high school are least likely to be married with 100.0% of them unmarried at childbirth.
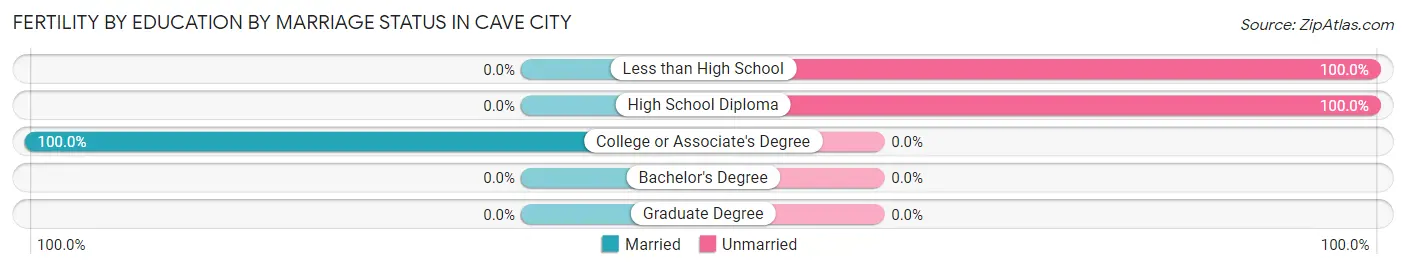
| Educational Attainment | Married | Unmarried |
| Less than High School | 0 (0.0%) | 12 (100.0%) |
| High School Diploma | 0 (0.0%) | 25 (100.0%) |
| College or Associate's Degree | 4 (100.0%) | 0 (0.0%) |
| Bachelor's Degree | 0 (0.0%) | 0 (0.0%) |
| Graduate Degree | 0 (0.0%) | 0 (0.0%) |
| Total | 4 (9.8%) | 37 (90.2%) |
Employment Characteristics in Cave City
Employment by Class of Employer in Cave City
Among the 1,068 employed individuals in Cave City, private company employees (799 | 74.8%), not-for-profit organizations (82 | 7.7%), and self-employed (not incorporated) (79 | 7.4%) make up the most common classes of employment.
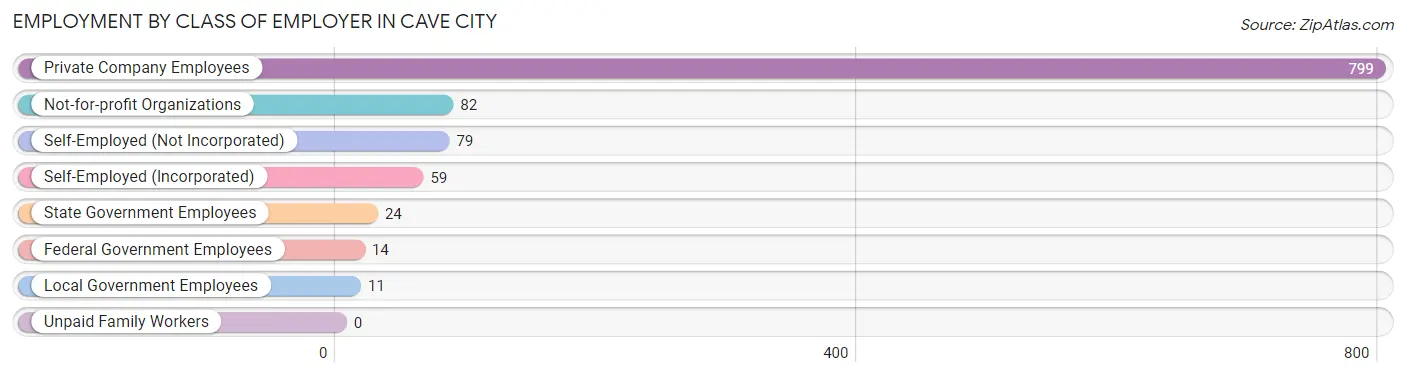
| Employer Class | # Employees | % Employees |
| Private Company Employees | 799 | 74.8% |
| Self-Employed (Incorporated) | 59 | 5.5% |
| Self-Employed (Not Incorporated) | 79 | 7.4% |
| Not-for-profit Organizations | 82 | 7.7% |
| Local Government Employees | 11 | 1.0% |
| State Government Employees | 24 | 2.2% |
| Federal Government Employees | 14 | 1.3% |
| Unpaid Family Workers | 0 | 0.0% |
| Total | 1,068 | 100.0% |
Employment Status by Age in Cave City
According to the labor force statistics for Cave City, out of the total population over 16 years of age (2,239), 54.1% or 1,211 individuals are in the labor force, with 9.2% or 111 of them unemployed. The age group with the highest labor force participation rate is 45 to 54 years, with 76.7% or 306 individuals in the labor force. Within the labor force, the 25 to 29 years age range has the highest percentage of unemployed individuals, with 42.6% or 52 of them being unemployed.
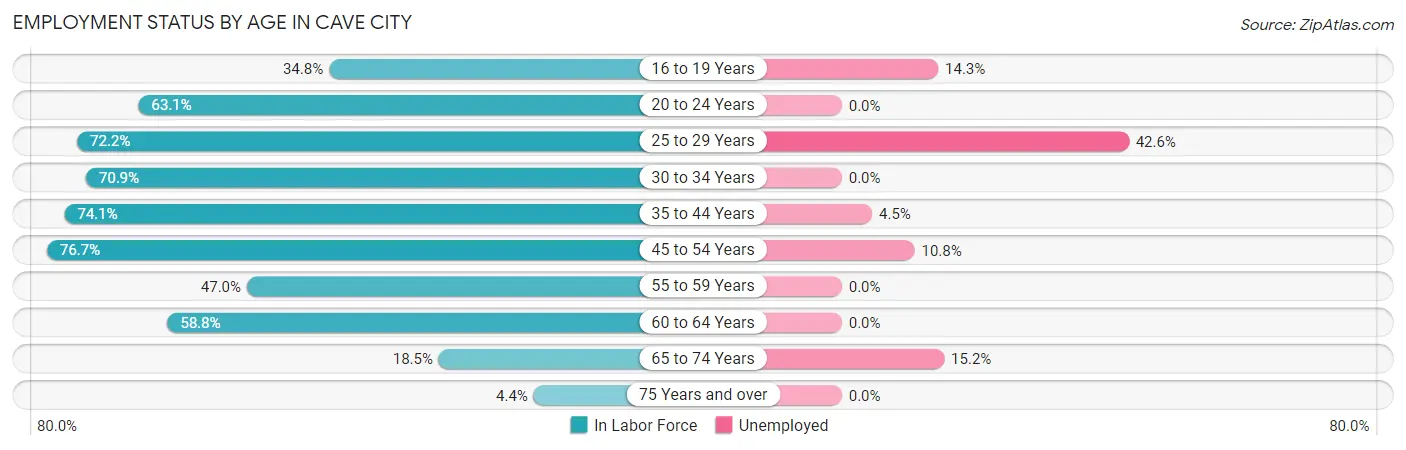
| Age Bracket | In Labor Force | Unemployed |
| 16 to 19 Years | 56 (34.8%) | 8 (14.3%) |
| 20 to 24 Years | 142 (63.1%) | 0 (0.0%) |
| 25 to 29 Years | 122 (72.2%) | 52 (42.6%) |
| 30 to 34 Years | 134 (70.9%) | 0 (0.0%) |
| 35 to 44 Years | 243 (74.1%) | 11 (4.5%) |
| 45 to 54 Years | 306 (76.7%) | 33 (10.8%) |
| 55 to 59 Years | 85 (47.0%) | 0 (0.0%) |
| 60 to 64 Years | 67 (58.8%) | 0 (0.0%) |
| 65 to 74 Years | 46 (18.5%) | 7 (15.2%) |
| 75 Years and over | 10 (4.4%) | 0 (0.0%) |
| Total | 1,211 (54.1%) | 111 (9.2%) |
Employment Status by Educational Attainment in Cave City
According to labor force statistics for Cave City, 69.3% of individuals (956) out of the total population between 25 and 64 years of age (1,380) are in the labor force, with 10.0% or 96 of them being unemployed. The group with the highest labor force participation rate are those with the educational attainment of high school diploma, with 72.8% or 476 individuals in the labor force. Within the labor force, individuals with less than high school education have the highest percentage of unemployment, with 46.9% or 67 of them being unemployed.
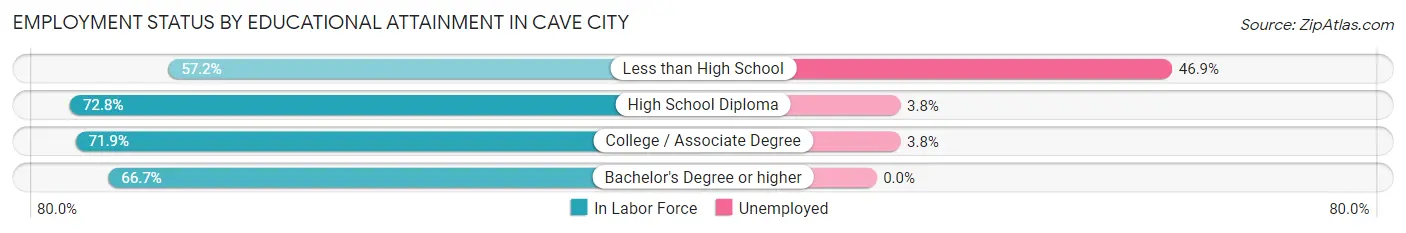
| Educational Attainment | In Labor Force | Unemployed |
| Less than High School | 143 (57.2%) | 117 (46.9%) |
| High School Diploma | 476 (72.8%) | 25 (3.8%) |
| College / Associate Degree | 286 (71.9%) | 15 (3.8%) |
| Bachelor's Degree or higher | 52 (66.7%) | 0 (0.0%) |
| Total | 956 (69.3%) | 138 (10.0%) |
Employment Occupations by Sex in Cave City
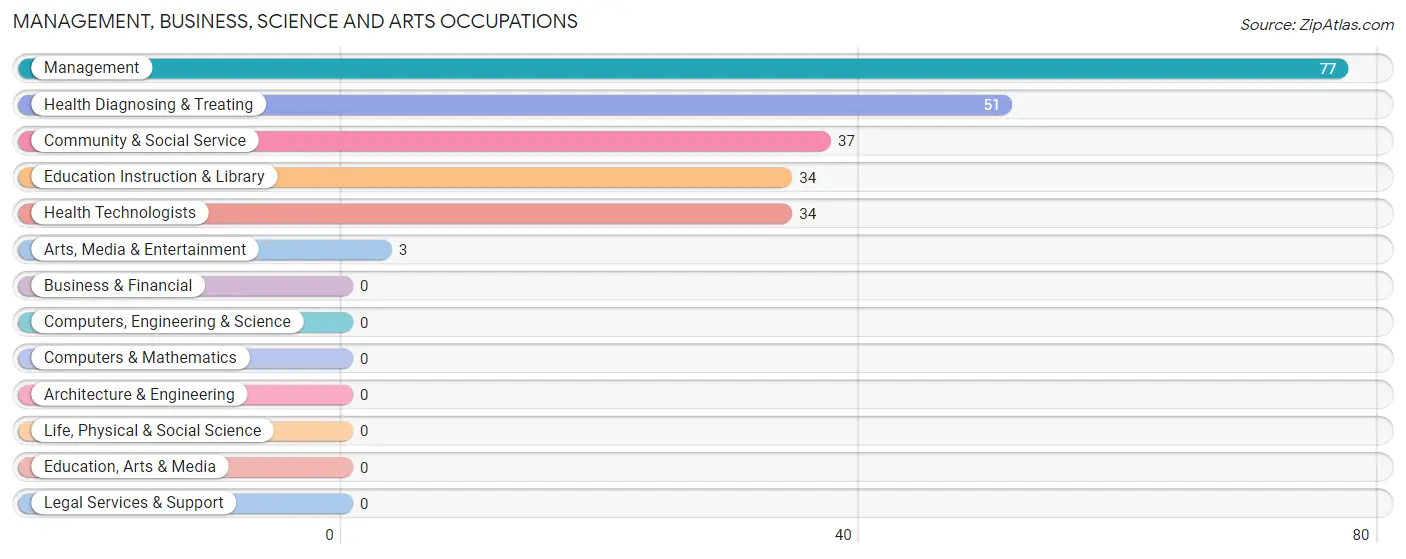
Management, Business, Science and Arts Occupations
The most common Management, Business, Science and Arts occupations in Cave City are Management (77 | 7.0%), Health Diagnosing & Treating (51 | 4.6%), Community & Social Service (37 | 3.4%), Education Instruction & Library (34 | 3.1%), and Health Technologists (34 | 3.1%).
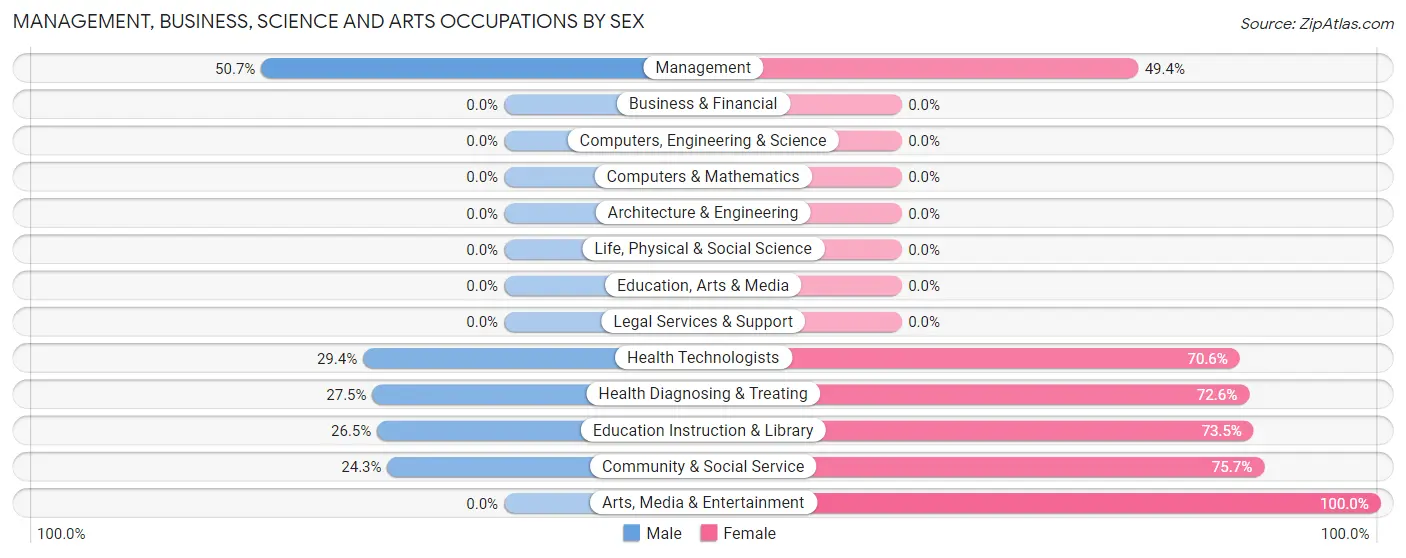
Management, Business, Science and Arts Occupations by Sex
Within the Management, Business, Science and Arts occupations in Cave City, the most male-oriented occupations are Management (50.6%), Health Technologists (29.4%), and Health Diagnosing & Treating (27.5%), while the most female-oriented occupations are Arts, Media & Entertainment (100.0%), Community & Social Service (75.7%), and Education Instruction & Library (73.5%).
| Occupation | Male | Female |
| Management | 39 (50.6%) | 38 (49.3%) |
| Business & Financial | 0 (0.0%) | 0 (0.0%) |
| Computers, Engineering & Science | 0 (0.0%) | 0 (0.0%) |
| Computers & Mathematics | 0 (0.0%) | 0 (0.0%) |
| Architecture & Engineering | 0 (0.0%) | 0 (0.0%) |
| Life, Physical & Social Science | 0 (0.0%) | 0 (0.0%) |
| Community & Social Service | 9 (24.3%) | 28 (75.7%) |
| Education, Arts & Media | 0 (0.0%) | 0 (0.0%) |
| Legal Services & Support | 0 (0.0%) | 0 (0.0%) |
| Education Instruction & Library | 9 (26.5%) | 25 (73.5%) |
| Arts, Media & Entertainment | 0 (0.0%) | 3 (100.0%) |
| Health Diagnosing & Treating | 14 (27.5%) | 37 (72.6%) |
| Health Technologists | 10 (29.4%) | 24 (70.6%) |
| Total (Category) | 62 (37.6%) | 103 (62.4%) |
| Total (Overall) | 548 (49.8%) | 552 (50.2%) |
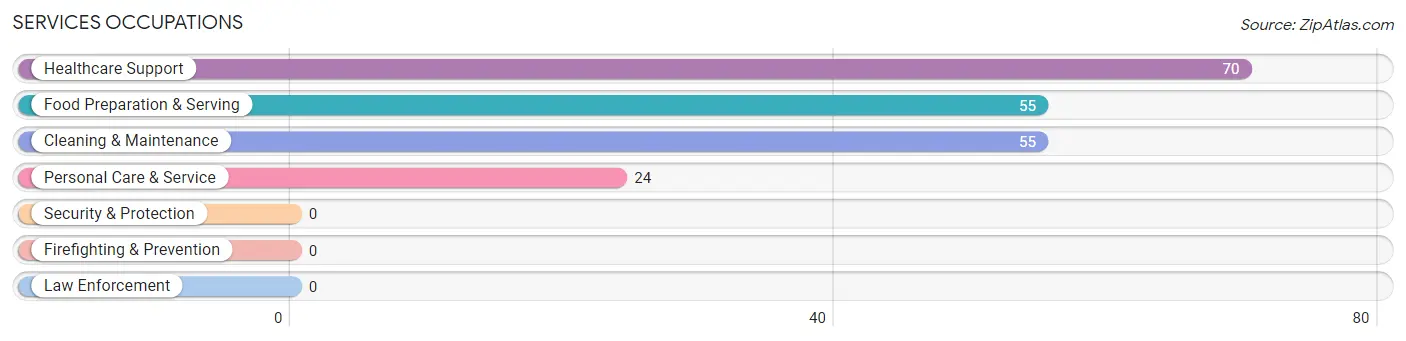
Services Occupations
The most common Services occupations in Cave City are Healthcare Support (70 | 6.4%), Food Preparation & Serving (55 | 5.0%), Cleaning & Maintenance (55 | 5.0%), and Personal Care & Service (24 | 2.2%).
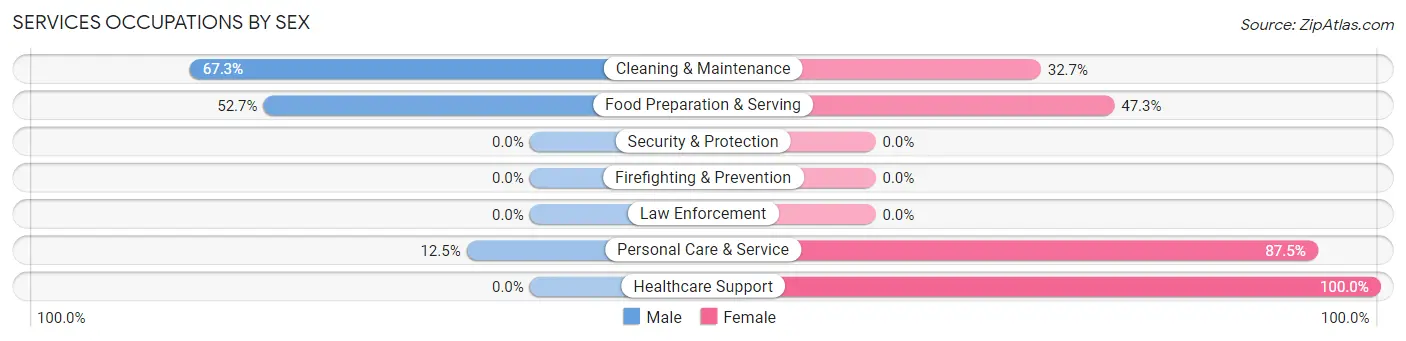
Services Occupations by Sex
Within the Services occupations in Cave City, the most male-oriented occupations are Cleaning & Maintenance (67.3%), Food Preparation & Serving (52.7%), and Personal Care & Service (12.5%), while the most female-oriented occupations are Healthcare Support (100.0%), Personal Care & Service (87.5%), and Food Preparation & Serving (47.3%).
| Occupation | Male | Female |
| Healthcare Support | 0 (0.0%) | 70 (100.0%) |
| Security & Protection | 0 (0.0%) | 0 (0.0%) |
| Firefighting & Prevention | 0 (0.0%) | 0 (0.0%) |
| Law Enforcement | 0 (0.0%) | 0 (0.0%) |
| Food Preparation & Serving | 29 (52.7%) | 26 (47.3%) |
| Cleaning & Maintenance | 37 (67.3%) | 18 (32.7%) |
| Personal Care & Service | 3 (12.5%) | 21 (87.5%) |
| Total (Category) | 69 (33.8%) | 135 (66.2%) |
| Total (Overall) | 548 (49.8%) | 552 (50.2%) |
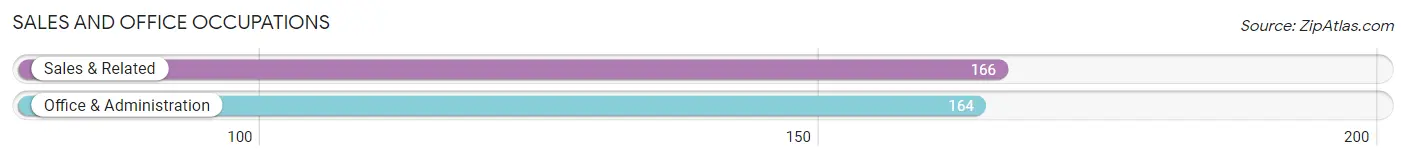
Sales and Office Occupations
The most common Sales and Office occupations in Cave City are Sales & Related (166 | 15.1%), and Office & Administration (164 | 14.9%).
Sales and Office Occupations by Sex
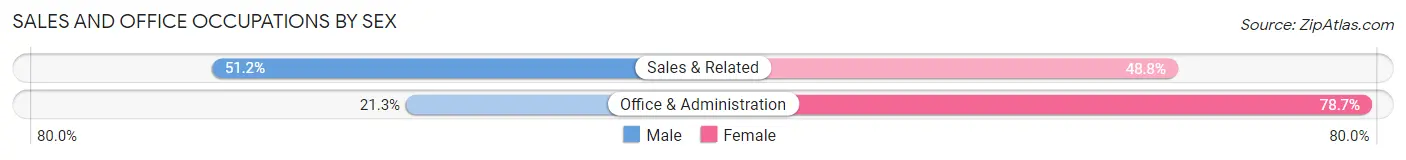
| Occupation | Male | Female |
| Sales & Related | 85 (51.2%) | 81 (48.8%) |
| Office & Administration | 35 (21.3%) | 129 (78.7%) |
| Total (Category) | 120 (36.4%) | 210 (63.6%) |
| Total (Overall) | 548 (49.8%) | 552 (50.2%) |
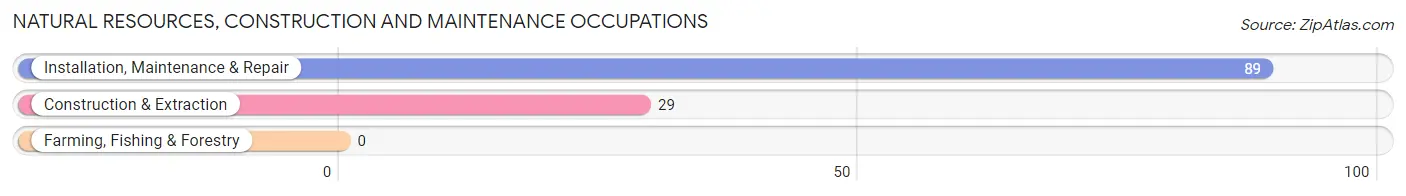
Natural Resources, Construction and Maintenance Occupations
The most common Natural Resources, Construction and Maintenance occupations in Cave City are Installation, Maintenance & Repair (89 | 8.1%), and Construction & Extraction (29 | 2.6%).
Natural Resources, Construction and Maintenance Occupations by Sex
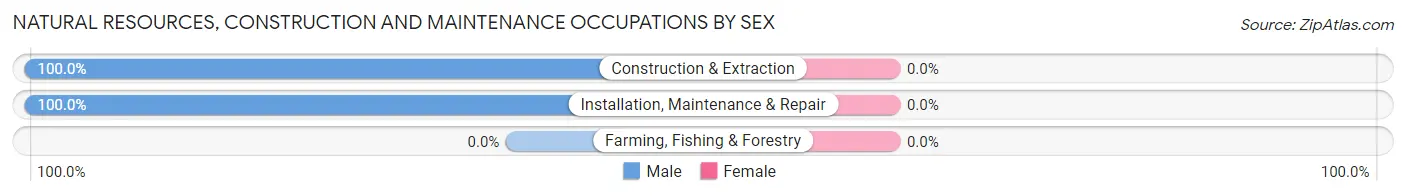
| Occupation | Male | Female |
| Farming, Fishing & Forestry | 0 (0.0%) | 0 (0.0%) |
| Construction & Extraction | 29 (100.0%) | 0 (0.0%) |
| Installation, Maintenance & Repair | 89 (100.0%) | 0 (0.0%) |
| Total (Category) | 118 (100.0%) | 0 (0.0%) |
| Total (Overall) | 548 (49.8%) | 552 (50.2%) |
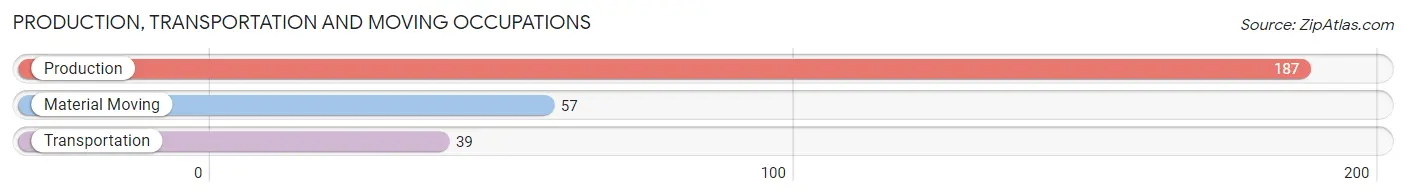
Production, Transportation and Moving Occupations
The most common Production, Transportation and Moving occupations in Cave City are Production (187 | 17.0%), Material Moving (57 | 5.2%), and Transportation (39 | 3.5%).
Production, Transportation and Moving Occupations by Sex
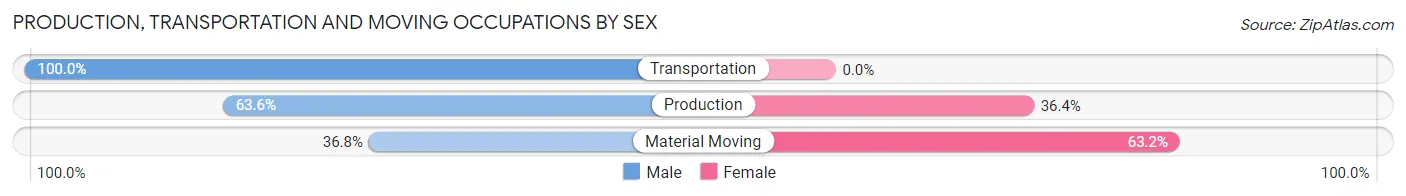
| Occupation | Male | Female |
| Production | 119 (63.6%) | 68 (36.4%) |
| Transportation | 39 (100.0%) | 0 (0.0%) |
| Material Moving | 21 (36.8%) | 36 (63.2%) |
| Total (Category) | 179 (63.2%) | 104 (36.7%) |
| Total (Overall) | 548 (49.8%) | 552 (50.2%) |
Employment Industries by Sex in Cave City
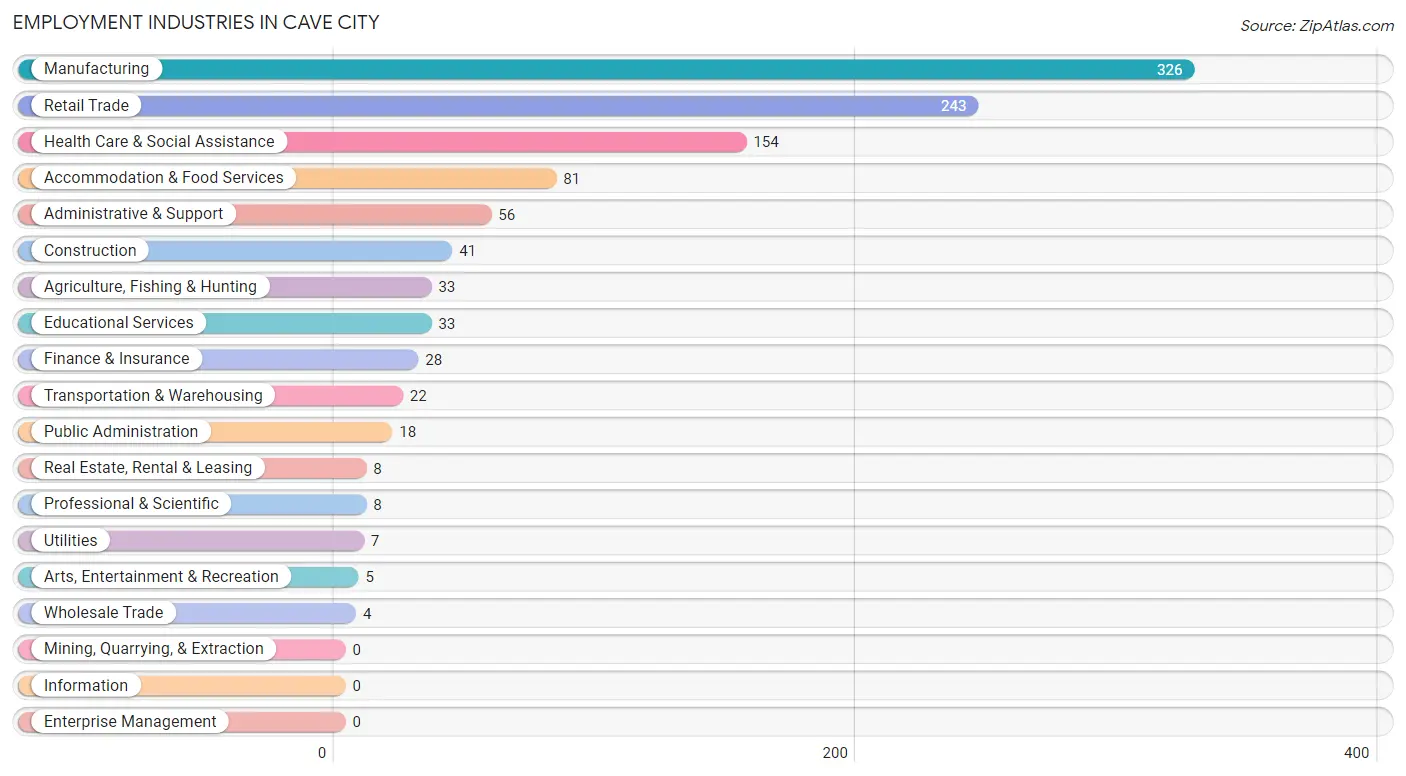
Employment Industries in Cave City
The major employment industries in Cave City include Manufacturing (326 | 29.6%), Retail Trade (243 | 22.1%), Health Care & Social Assistance (154 | 14.0%), Accommodation & Food Services (81 | 7.4%), and Administrative & Support (56 | 5.1%).
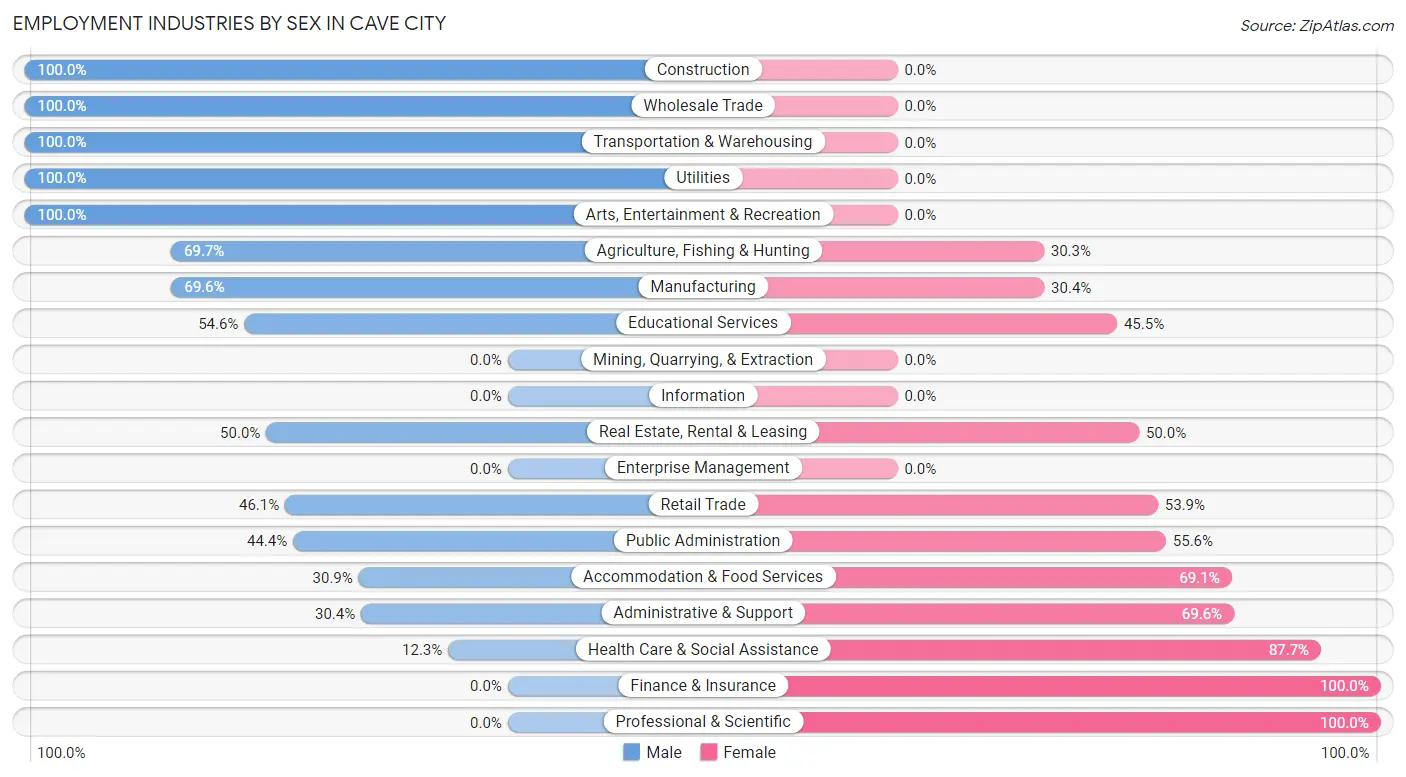
Employment Industries by Sex in Cave City
The Cave City industries that see more men than women are Construction (100.0%), Wholesale Trade (100.0%), and Transportation & Warehousing (100.0%), whereas the industries that tend to have a higher number of women are Finance & Insurance (100.0%), Professional & Scientific (100.0%), and Health Care & Social Assistance (87.7%).
| Industry | Male | Female |
| Agriculture, Fishing & Hunting | 23 (69.7%) | 10 (30.3%) |
| Mining, Quarrying, & Extraction | 0 (0.0%) | 0 (0.0%) |
| Construction | 41 (100.0%) | 0 (0.0%) |
| Manufacturing | 227 (69.6%) | 99 (30.4%) |
| Wholesale Trade | 4 (100.0%) | 0 (0.0%) |
| Retail Trade | 112 (46.1%) | 131 (53.9%) |
| Transportation & Warehousing | 22 (100.0%) | 0 (0.0%) |
| Utilities | 7 (100.0%) | 0 (0.0%) |
| Information | 0 (0.0%) | 0 (0.0%) |
| Finance & Insurance | 0 (0.0%) | 28 (100.0%) |
| Real Estate, Rental & Leasing | 4 (50.0%) | 4 (50.0%) |
| Professional & Scientific | 0 (0.0%) | 8 (100.0%) |
| Enterprise Management | 0 (0.0%) | 0 (0.0%) |
| Administrative & Support | 17 (30.4%) | 39 (69.6%) |
| Educational Services | 18 (54.5%) | 15 (45.5%) |
| Health Care & Social Assistance | 19 (12.3%) | 135 (87.7%) |
| Arts, Entertainment & Recreation | 5 (100.0%) | 0 (0.0%) |
| Accommodation & Food Services | 25 (30.9%) | 56 (69.1%) |
| Public Administration | 8 (44.4%) | 10 (55.6%) |
| Total | 548 (49.8%) | 552 (50.2%) |
Education in Cave City
School Enrollment in Cave City
The most common levels of schooling among the 426 students in Cave City are high school (136 | 31.9%), middle school (95 | 22.3%), and elementary school (79 | 18.5%).
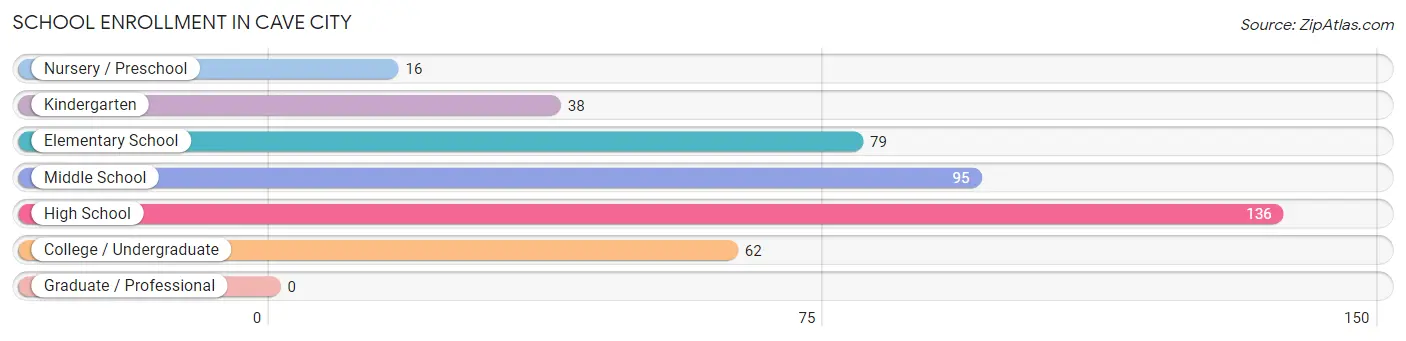
| School Level | # Students | % Students |
| Nursery / Preschool | 16 | 3.8% |
| Kindergarten | 38 | 8.9% |
| Elementary School | 79 | 18.5% |
| Middle School | 95 | 22.3% |
| High School | 136 | 31.9% |
| College / Undergraduate | 62 | 14.5% |
| Graduate / Professional | 0 | 0.0% |
| Total | 426 | 100.0% |
School Enrollment by Age by Funding Source in Cave City
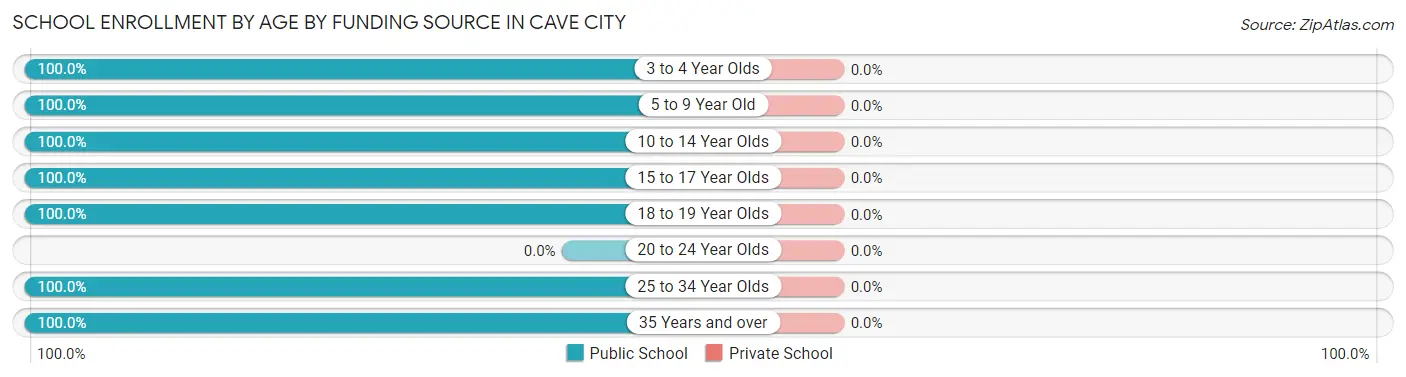
| Age Bracket | Public School | Private School |
| 3 to 4 Year Olds | 16 (100.0%) | 0 (0.0%) |
| 5 to 9 Year Old | 102 (100.0%) | 0 (0.0%) |
| 10 to 14 Year Olds | 105 (100.0%) | 0 (0.0%) |
| 15 to 17 Year Olds | 129 (100.0%) | 0 (0.0%) |
| 18 to 19 Year Olds | 12 (100.0%) | 0 (0.0%) |
| 20 to 24 Year Olds | 0 (0.0%) | 0 (0.0%) |
| 25 to 34 Year Olds | 7 (100.0%) | 0 (0.0%) |
| 35 Years and over | 55 (100.0%) | 0 (0.0%) |
| Total | 426 (100.0%) | 0 (0.0%) |
Educational Attainment by Field of Study in Cave City
Science & technology (29 | 33.7%), social sciences (15 | 17.4%), arts & humanities (13 | 15.1%), physical & health sciences (9 | 10.5%), and business (8 | 9.3%) are the most common fields of study among 86 individuals in Cave City who have obtained a bachelor's degree or higher.
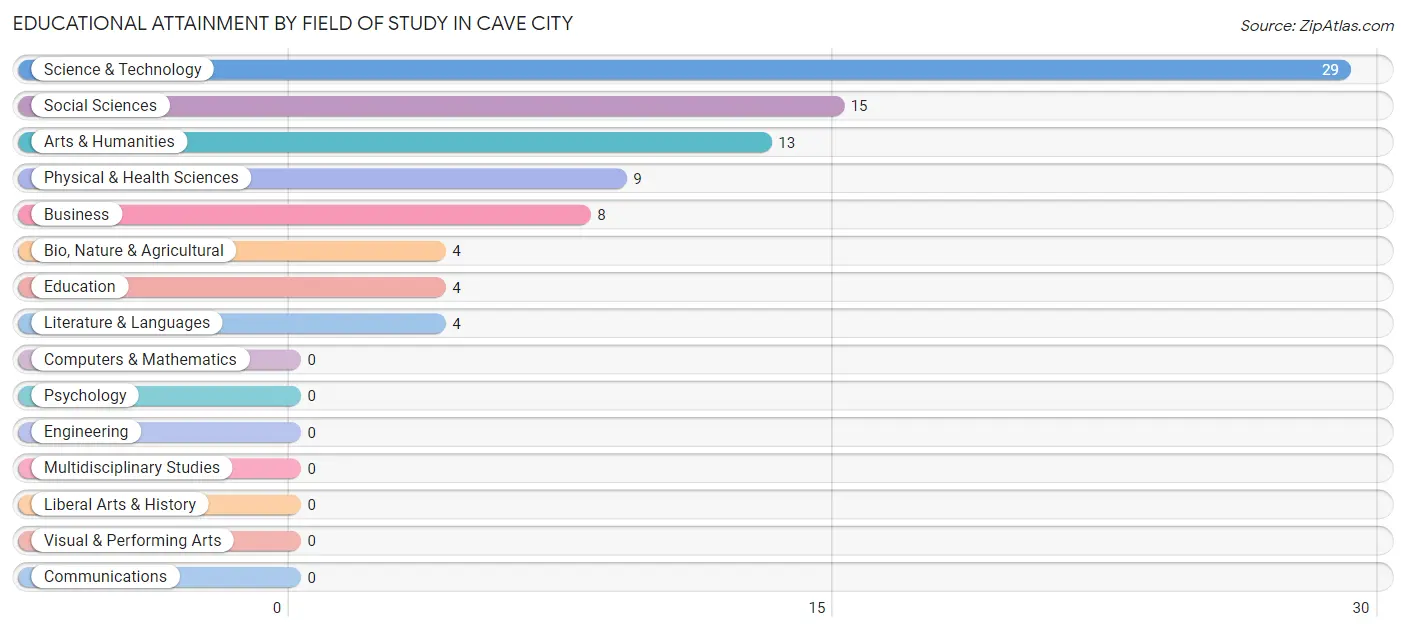
| Field of Study | # Graduates | % Graduates |
| Computers & Mathematics | 0 | 0.0% |
| Bio, Nature & Agricultural | 4 | 4.6% |
| Physical & Health Sciences | 9 | 10.5% |
| Psychology | 0 | 0.0% |
| Social Sciences | 15 | 17.4% |
| Engineering | 0 | 0.0% |
| Multidisciplinary Studies | 0 | 0.0% |
| Science & Technology | 29 | 33.7% |
| Business | 8 | 9.3% |
| Education | 4 | 4.6% |
| Literature & Languages | 4 | 4.6% |
| Liberal Arts & History | 0 | 0.0% |
| Visual & Performing Arts | 0 | 0.0% |
| Communications | 0 | 0.0% |
| Arts & Humanities | 13 | 15.1% |
| Total | 86 | 100.0% |
Transportation & Commute in Cave City
Vehicle Availability by Sex in Cave City
The most prevalent vehicle ownership categories in Cave City are males with 2 vehicles (199, accounting for 36.3%) and females with 2 vehicles (171, making up 38.3%).
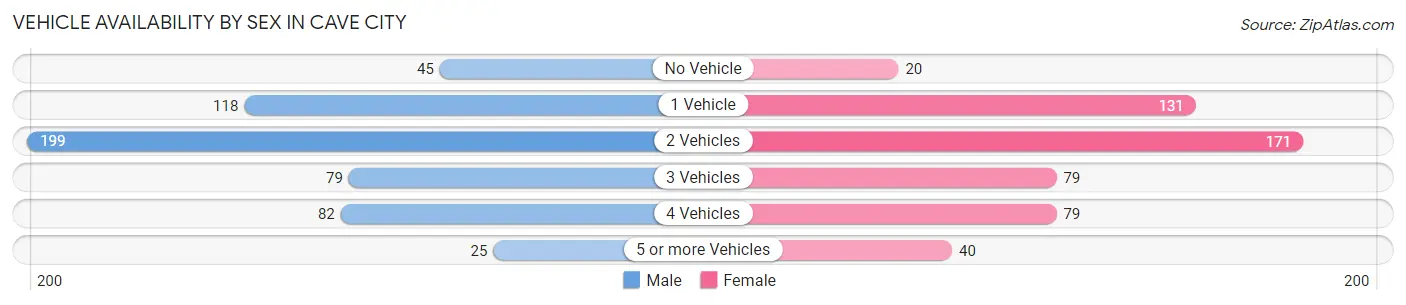
| Vehicles Available | Male | Female |
| No Vehicle | 45 (8.2%) | 20 (3.8%) |
| 1 Vehicle | 118 (21.5%) | 131 (25.2%) |
| 2 Vehicles | 199 (36.3%) | 171 (32.9%) |
| 3 Vehicles | 79 (14.4%) | 79 (15.2%) |
| 4 Vehicles | 82 (15.0%) | 79 (15.2%) |
| 5 or more Vehicles | 25 (4.6%) | 40 (7.7%) |
| Total | 548 (100.0%) | 520 (100.0%) |
Commute Time in Cave City
The most frequently occuring commute durations in Cave City are 5 to 9 minutes (298 commuters, 29.9%), 10 to 14 minutes (165 commuters, 16.5%), and 15 to 19 minutes (113 commuters, 11.3%).
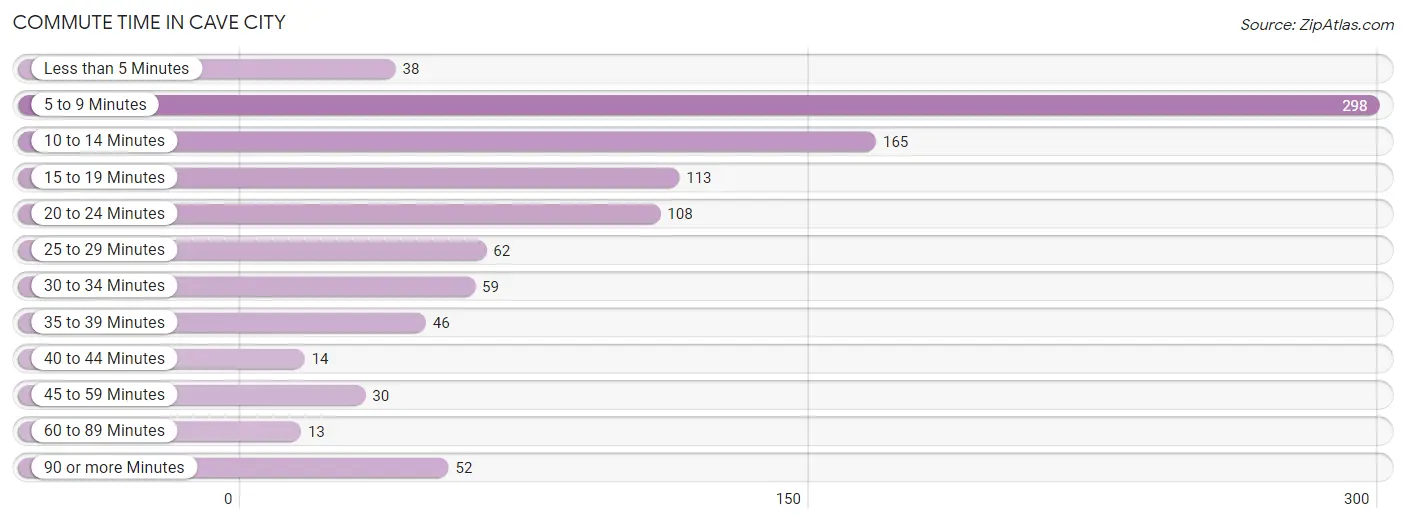
| Commute Time | # Commuters | % Commuters |
| Less than 5 Minutes | 38 | 3.8% |
| 5 to 9 Minutes | 298 | 29.9% |
| 10 to 14 Minutes | 165 | 16.5% |
| 15 to 19 Minutes | 113 | 11.3% |
| 20 to 24 Minutes | 108 | 10.8% |
| 25 to 29 Minutes | 62 | 6.2% |
| 30 to 34 Minutes | 59 | 5.9% |
| 35 to 39 Minutes | 46 | 4.6% |
| 40 to 44 Minutes | 14 | 1.4% |
| 45 to 59 Minutes | 30 | 3.0% |
| 60 to 89 Minutes | 13 | 1.3% |
| 90 or more Minutes | 52 | 5.2% |
Commute Time by Sex in Cave City
The most common commute times in Cave City are 5 to 9 minutes (151 commuters, 29.7%) for males and 5 to 9 minutes (147 commuters, 30.1%) for females.
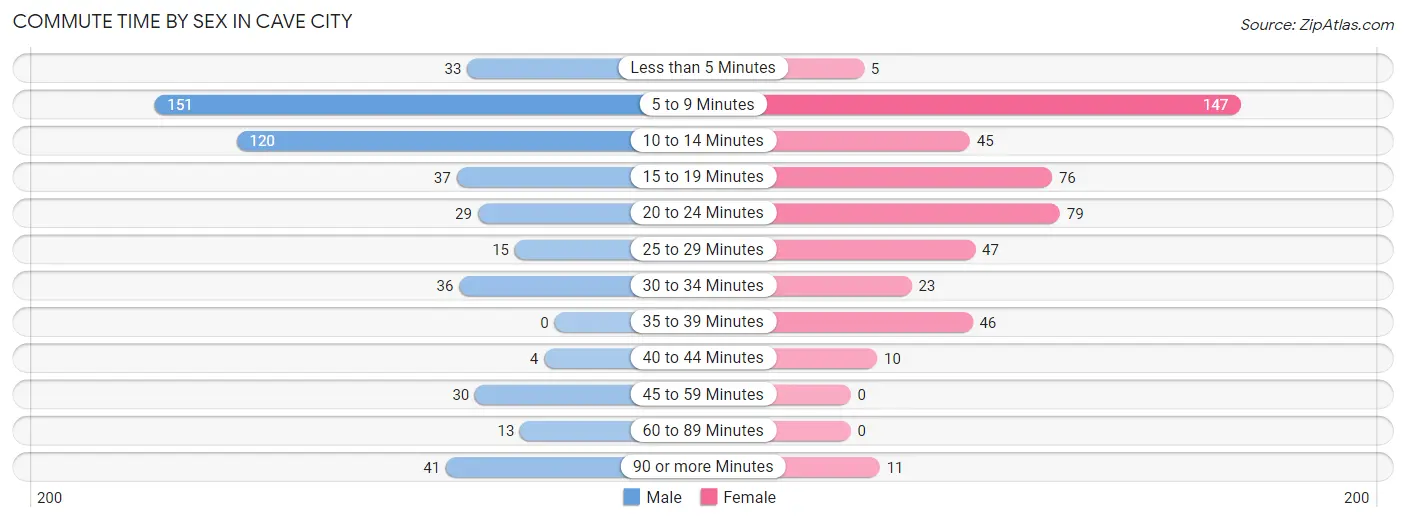
| Commute Time | Male | Female |
| Less than 5 Minutes | 33 (6.5%) | 5 (1.0%) |
| 5 to 9 Minutes | 151 (29.7%) | 147 (30.1%) |
| 10 to 14 Minutes | 120 (23.6%) | 45 (9.2%) |
| 15 to 19 Minutes | 37 (7.3%) | 76 (15.5%) |
| 20 to 24 Minutes | 29 (5.7%) | 79 (16.2%) |
| 25 to 29 Minutes | 15 (2.9%) | 47 (9.6%) |
| 30 to 34 Minutes | 36 (7.1%) | 23 (4.7%) |
| 35 to 39 Minutes | 0 (0.0%) | 46 (9.4%) |
| 40 to 44 Minutes | 4 (0.8%) | 10 (2.0%) |
| 45 to 59 Minutes | 30 (5.9%) | 0 (0.0%) |
| 60 to 89 Minutes | 13 (2.5%) | 0 (0.0%) |
| 90 or more Minutes | 41 (8.1%) | 11 (2.2%) |
Time of Departure to Work by Sex in Cave City
The most frequent times of departure to work in Cave City are 6:30 AM to 6:59 AM (97, 19.1%) for males and 12:00 PM to 3:59 PM (78, 16.0%) for females.
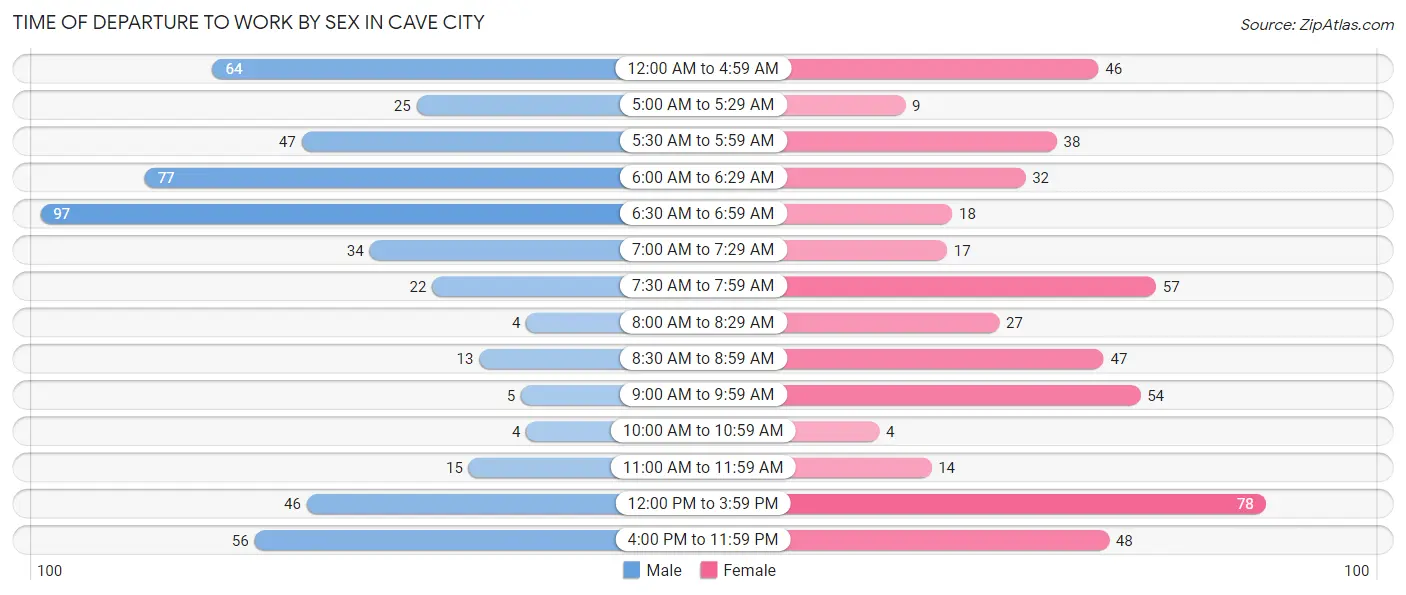
| Time of Departure | Male | Female |
| 12:00 AM to 4:59 AM | 64 (12.6%) | 46 (9.4%) |
| 5:00 AM to 5:29 AM | 25 (4.9%) | 9 (1.8%) |
| 5:30 AM to 5:59 AM | 47 (9.2%) | 38 (7.8%) |
| 6:00 AM to 6:29 AM | 77 (15.1%) | 32 (6.5%) |
| 6:30 AM to 6:59 AM | 97 (19.1%) | 18 (3.7%) |
| 7:00 AM to 7:29 AM | 34 (6.7%) | 17 (3.5%) |
| 7:30 AM to 7:59 AM | 22 (4.3%) | 57 (11.7%) |
| 8:00 AM to 8:29 AM | 4 (0.8%) | 27 (5.5%) |
| 8:30 AM to 8:59 AM | 13 (2.5%) | 47 (9.6%) |
| 9:00 AM to 9:59 AM | 5 (1.0%) | 54 (11.0%) |
| 10:00 AM to 10:59 AM | 4 (0.8%) | 4 (0.8%) |
| 11:00 AM to 11:59 AM | 15 (2.9%) | 14 (2.9%) |
| 12:00 PM to 3:59 PM | 46 (9.0%) | 78 (16.0%) |
| 4:00 PM to 11:59 PM | 56 (11.0%) | 48 (9.8%) |
| Total | 509 (100.0%) | 489 (100.0%) |
Housing Occupancy in Cave City
Occupancy by Ownership in Cave City
Of the total 1,165 dwellings in Cave City, owner-occupied units account for 459 (39.4%), while renter-occupied units make up 706 (60.6%).
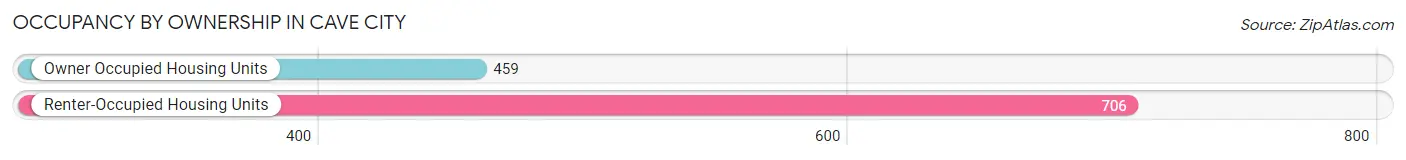
| Occupancy | # Housing Units | % Housing Units |
| Owner Occupied Housing Units | 459 | 39.4% |
| Renter-Occupied Housing Units | 706 | 60.6% |
| Total Occupied Housing Units | 1,165 | 100.0% |
Occupancy by Household Size in Cave City
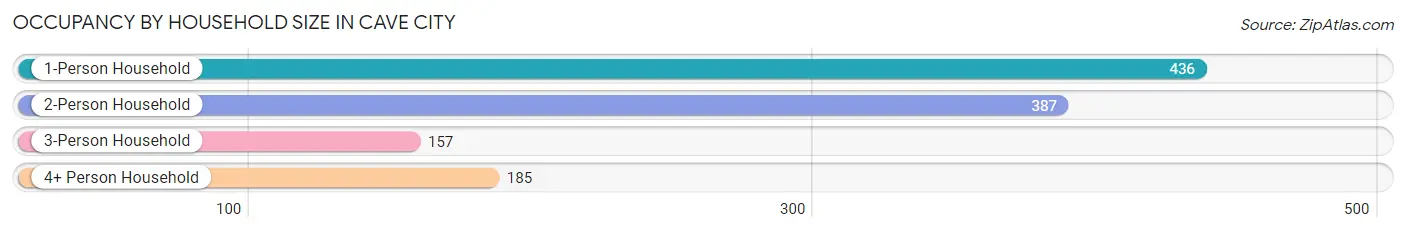
| Household Size | # Housing Units | % Housing Units |
| 1-Person Household | 436 | 37.4% |
| 2-Person Household | 387 | 33.2% |
| 3-Person Household | 157 | 13.5% |
| 4+ Person Household | 185 | 15.9% |
| Total Housing Units | 1,165 | 100.0% |
Occupancy by Ownership by Household Size in Cave City
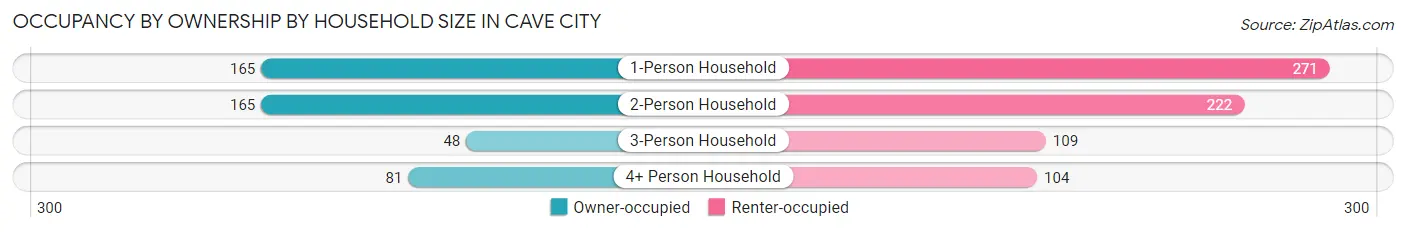
| Household Size | Owner-occupied | Renter-occupied |
| 1-Person Household | 165 (37.8%) | 271 (62.2%) |
| 2-Person Household | 165 (42.6%) | 222 (57.4%) |
| 3-Person Household | 48 (30.6%) | 109 (69.4%) |
| 4+ Person Household | 81 (43.8%) | 104 (56.2%) |
| Total Housing Units | 459 (39.4%) | 706 (60.6%) |
Occupancy by Educational Attainment in Cave City
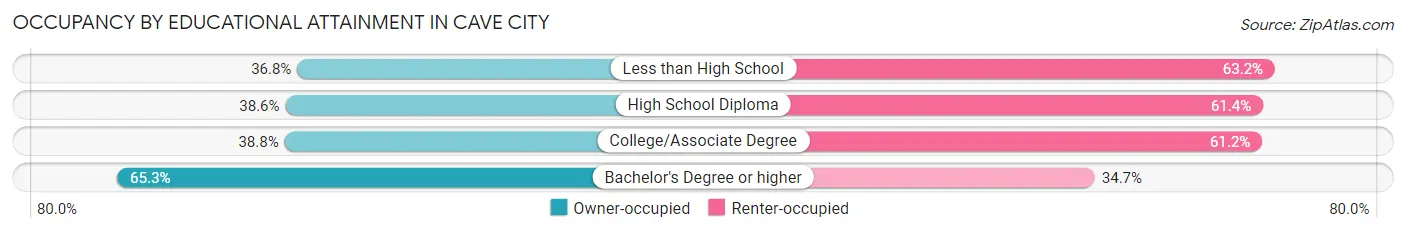
| Household Size | Owner-occupied | Renter-occupied |
| Less than High School | 93 (36.8%) | 160 (63.2%) |
| High School Diploma | 182 (38.6%) | 289 (61.4%) |
| College/Associate Degree | 152 (38.8%) | 240 (61.2%) |
| Bachelor's Degree or higher | 32 (65.3%) | 17 (34.7%) |
Occupancy by Age of Householder in Cave City
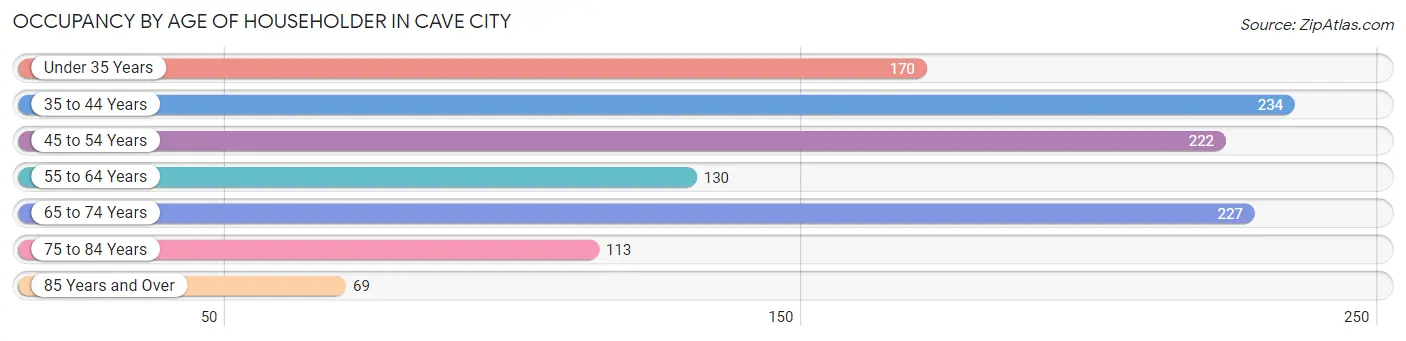
| Age Bracket | # Households | % Households |
| Under 35 Years | 170 | 14.6% |
| 35 to 44 Years | 234 | 20.1% |
| 45 to 54 Years | 222 | 19.1% |
| 55 to 64 Years | 130 | 11.2% |
| 65 to 74 Years | 227 | 19.5% |
| 75 to 84 Years | 113 | 9.7% |
| 85 Years and Over | 69 | 5.9% |
| Total | 1,165 | 100.0% |
Housing Finances in Cave City
Median Income by Occupancy in Cave City
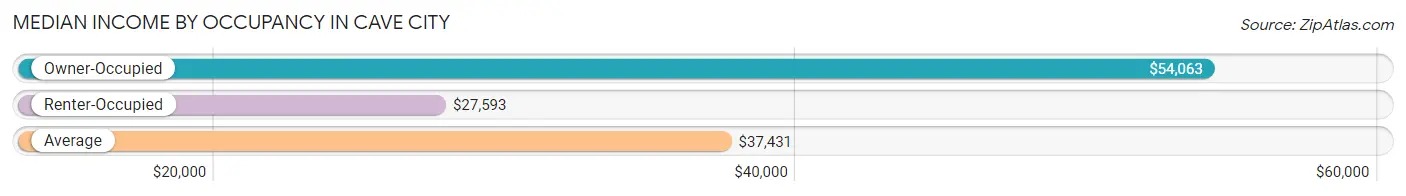
| Occupancy Type | # Households | Median Income |
| Owner-Occupied | 459 (39.4%) | $54,063 |
| Renter-Occupied | 706 (60.6%) | $27,593 |
| Average | 1,165 (100.0%) | $37,431 |
Occupancy by Householder Income Bracket in Cave City
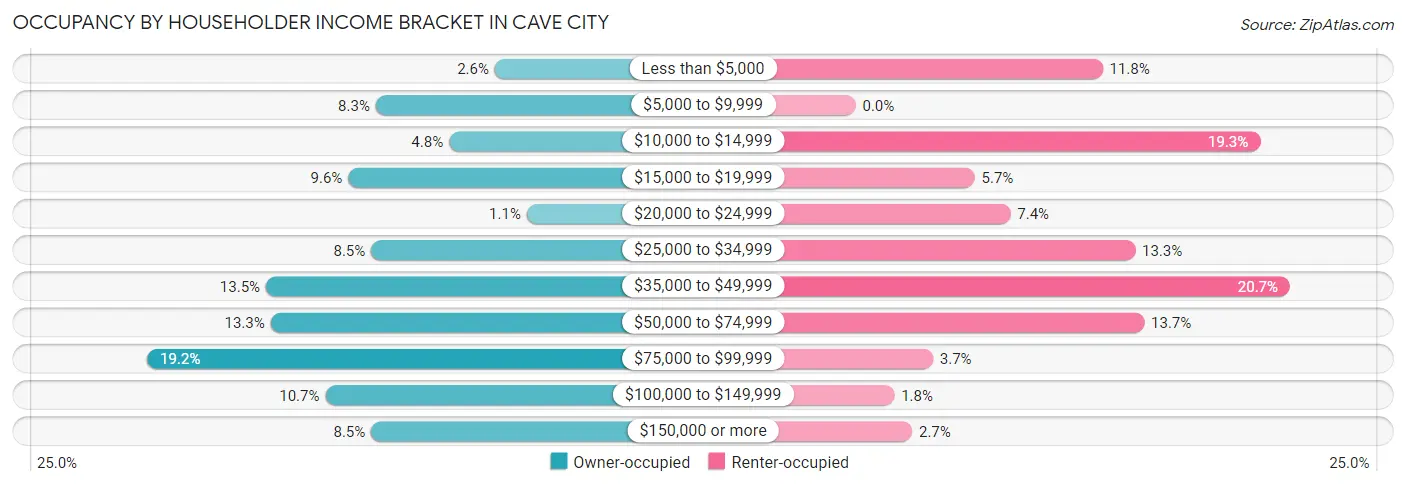
| Income Bracket | Owner-occupied | Renter-occupied |
| Less than $5,000 | 12 (2.6%) | 83 (11.8%) |
| $5,000 to $9,999 | 38 (8.3%) | 0 (0.0%) |
| $10,000 to $14,999 | 22 (4.8%) | 136 (19.3%) |
| $15,000 to $19,999 | 44 (9.6%) | 40 (5.7%) |
| $20,000 to $24,999 | 5 (1.1%) | 52 (7.4%) |
| $25,000 to $34,999 | 39 (8.5%) | 94 (13.3%) |
| $35,000 to $49,999 | 62 (13.5%) | 146 (20.7%) |
| $50,000 to $74,999 | 61 (13.3%) | 97 (13.7%) |
| $75,000 to $99,999 | 88 (19.2%) | 26 (3.7%) |
| $100,000 to $149,999 | 49 (10.7%) | 13 (1.8%) |
| $150,000 or more | 39 (8.5%) | 19 (2.7%) |
| Total | 459 (100.0%) | 706 (100.0%) |
Monthly Housing Cost Tiers in Cave City
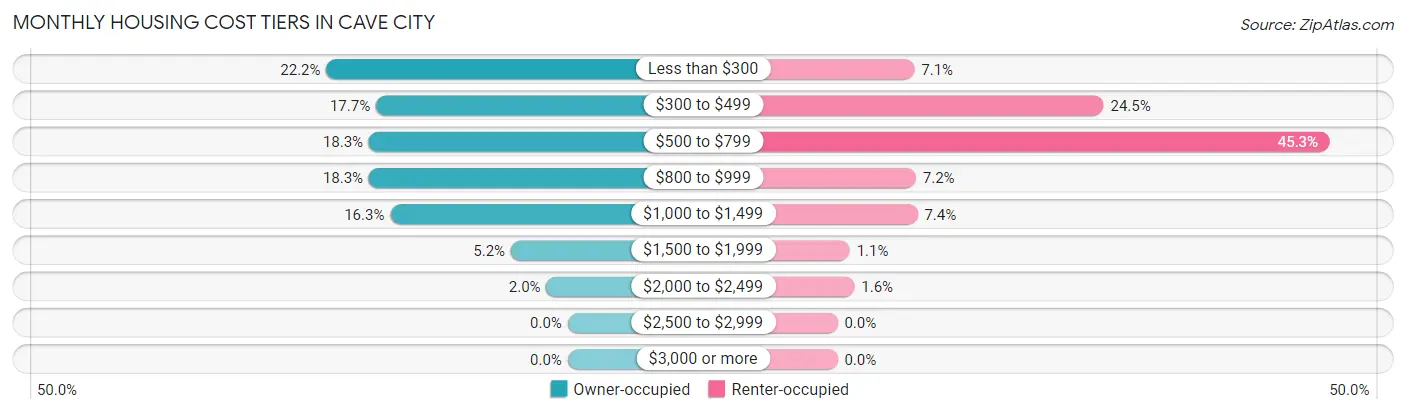
| Monthly Cost | Owner-occupied | Renter-occupied |
| Less than $300 | 102 (22.2%) | 50 (7.1%) |
| $300 to $499 | 81 (17.6%) | 173 (24.5%) |
| $500 to $799 | 84 (18.3%) | 320 (45.3%) |
| $800 to $999 | 84 (18.3%) | 51 (7.2%) |
| $1,000 to $1,499 | 75 (16.3%) | 52 (7.4%) |
| $1,500 to $1,999 | 24 (5.2%) | 8 (1.1%) |
| $2,000 to $2,499 | 9 (2.0%) | 11 (1.6%) |
| $2,500 to $2,999 | 0 (0.0%) | 0 (0.0%) |
| $3,000 or more | 0 (0.0%) | 0 (0.0%) |
| Total | 459 (100.0%) | 706 (100.0%) |
Physical Housing Characteristics in Cave City
Housing Structures in Cave City
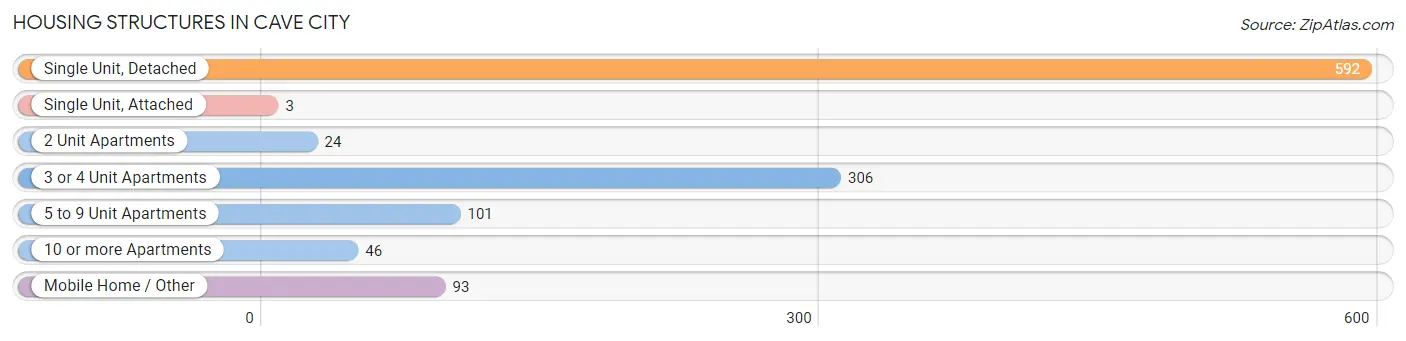
| Structure Type | # Housing Units | % Housing Units |
| Single Unit, Detached | 592 | 50.8% |
| Single Unit, Attached | 3 | 0.3% |
| 2 Unit Apartments | 24 | 2.1% |
| 3 or 4 Unit Apartments | 306 | 26.3% |
| 5 to 9 Unit Apartments | 101 | 8.7% |
| 10 or more Apartments | 46 | 4.0% |
| Mobile Home / Other | 93 | 8.0% |
| Total | 1,165 | 100.0% |
Housing Structures by Occupancy in Cave City
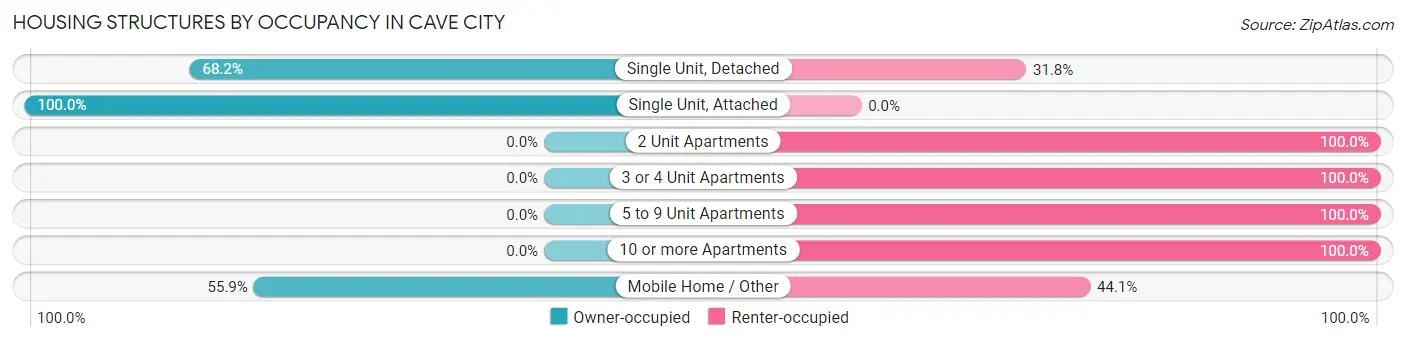
| Structure Type | Owner-occupied | Renter-occupied |
| Single Unit, Detached | 404 (68.2%) | 188 (31.8%) |
| Single Unit, Attached | 3 (100.0%) | 0 (0.0%) |
| 2 Unit Apartments | 0 (0.0%) | 24 (100.0%) |
| 3 or 4 Unit Apartments | 0 (0.0%) | 306 (100.0%) |
| 5 to 9 Unit Apartments | 0 (0.0%) | 101 (100.0%) |
| 10 or more Apartments | 0 (0.0%) | 46 (100.0%) |
| Mobile Home / Other | 52 (55.9%) | 41 (44.1%) |
| Total | 459 (39.4%) | 706 (60.6%) |
Housing Structures by Number of Rooms in Cave City
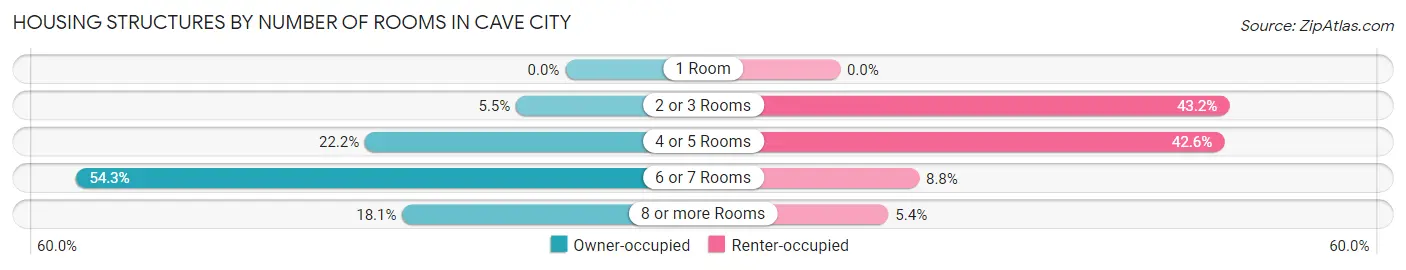
| Number of Rooms | Owner-occupied | Renter-occupied |
| 1 Room | 0 (0.0%) | 0 (0.0%) |
| 2 or 3 Rooms | 25 (5.4%) | 305 (43.2%) |
| 4 or 5 Rooms | 102 (22.2%) | 301 (42.6%) |
| 6 or 7 Rooms | 249 (54.2%) | 62 (8.8%) |
| 8 or more Rooms | 83 (18.1%) | 38 (5.4%) |
| Total | 459 (100.0%) | 706 (100.0%) |
Housing Structure by Heating Type in Cave City
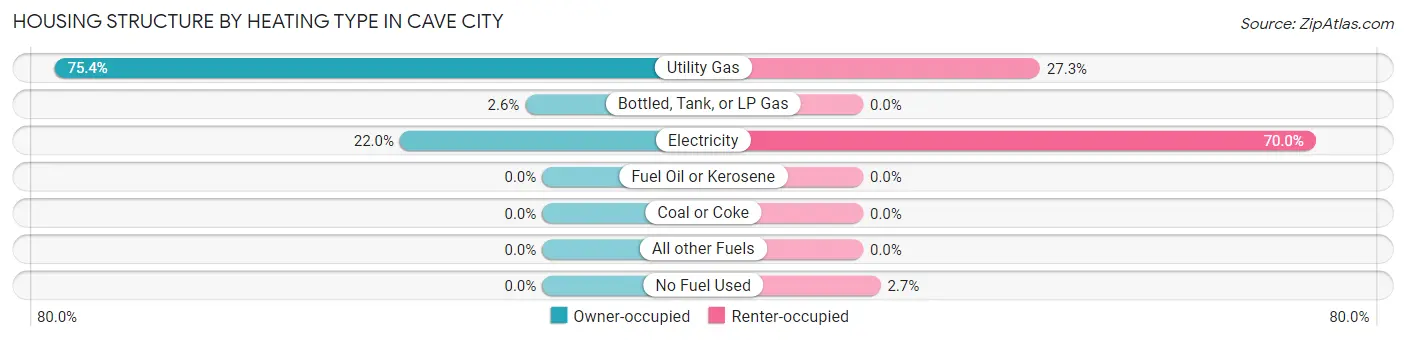
| Heating Type | Owner-occupied | Renter-occupied |
| Utility Gas | 346 (75.4%) | 193 (27.3%) |
| Bottled, Tank, or LP Gas | 12 (2.6%) | 0 (0.0%) |
| Electricity | 101 (22.0%) | 494 (70.0%) |
| Fuel Oil or Kerosene | 0 (0.0%) | 0 (0.0%) |
| Coal or Coke | 0 (0.0%) | 0 (0.0%) |
| All other Fuels | 0 (0.0%) | 0 (0.0%) |
| No Fuel Used | 0 (0.0%) | 19 (2.7%) |
| Total | 459 (100.0%) | 706 (100.0%) |
Household Vehicle Usage in Cave City
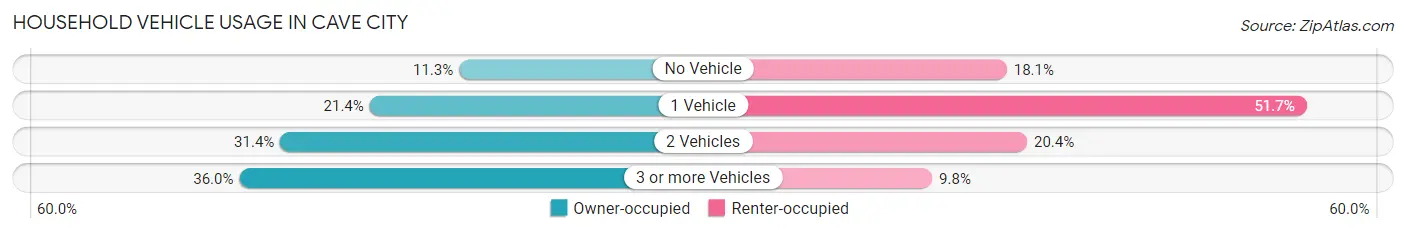
| Vehicles per Household | Owner-occupied | Renter-occupied |
| No Vehicle | 52 (11.3%) | 128 (18.1%) |
| 1 Vehicle | 98 (21.3%) | 365 (51.7%) |
| 2 Vehicles | 144 (31.4%) | 144 (20.4%) |
| 3 or more Vehicles | 165 (35.9%) | 69 (9.8%) |
| Total | 459 (100.0%) | 706 (100.0%) |
Real Estate & Mortgages in Cave City
Real Estate and Mortgage Overview in Cave City
| Characteristic | Without Mortgage | With Mortgage |
| Housing Units | 195 | 264 |
| Median Property Value | $83,500 | $127,400 |
| Median Household Income | - | - |
| Monthly Housing Costs | $295 | $0 |
| Real Estate Taxes | $645 | $9 |
Property Value by Mortgage Status in Cave City
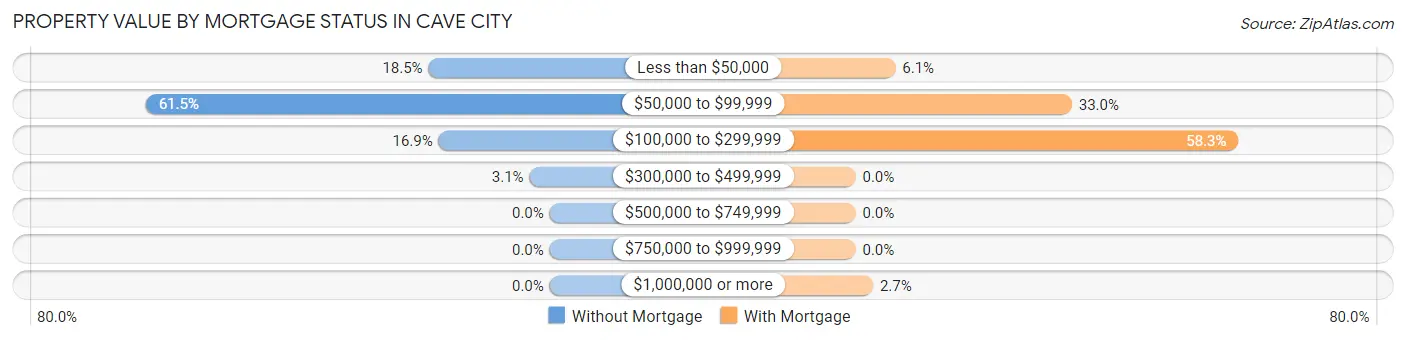
| Property Value | Without Mortgage | With Mortgage |
| Less than $50,000 | 36 (18.5%) | 16 (6.1%) |
| $50,000 to $99,999 | 120 (61.5%) | 87 (33.0%) |
| $100,000 to $299,999 | 33 (16.9%) | 154 (58.3%) |
| $300,000 to $499,999 | 6 (3.1%) | 0 (0.0%) |
| $500,000 to $749,999 | 0 (0.0%) | 0 (0.0%) |
| $750,000 to $999,999 | 0 (0.0%) | 0 (0.0%) |
| $1,000,000 or more | 0 (0.0%) | 7 (2.6%) |
| Total | 195 (100.0%) | 264 (100.0%) |
Household Income by Mortgage Status in Cave City
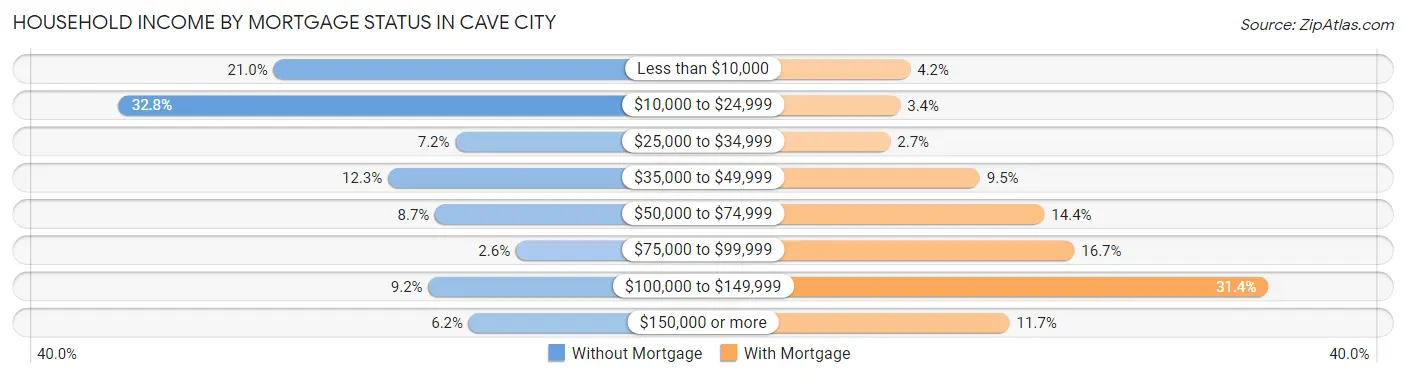
| Household Income | Without Mortgage | With Mortgage |
| Less than $10,000 | 41 (21.0%) | 11 (4.2%) |
| $10,000 to $24,999 | 64 (32.8%) | 9 (3.4%) |
| $25,000 to $34,999 | 14 (7.2%) | 7 (2.6%) |
| $35,000 to $49,999 | 24 (12.3%) | 25 (9.5%) |
| $50,000 to $74,999 | 17 (8.7%) | 38 (14.4%) |
| $75,000 to $99,999 | 5 (2.6%) | 44 (16.7%) |
| $100,000 to $149,999 | 18 (9.2%) | 83 (31.4%) |
| $150,000 or more | 12 (6.1%) | 31 (11.7%) |
| Total | 195 (100.0%) | 264 (100.0%) |
Property Value to Household Income Ratio in Cave City
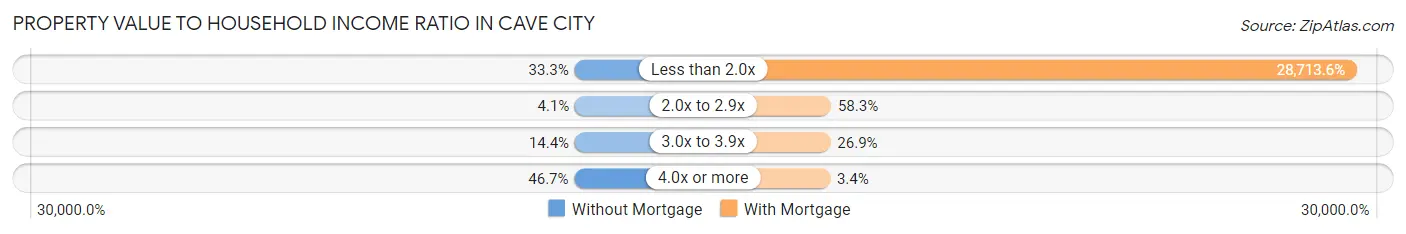
| Value-to-Income Ratio | Without Mortgage | With Mortgage |
| Less than 2.0x | 65 (33.3%) | 75,804 (28,713.6%) |
| 2.0x to 2.9x | 8 (4.1%) | 154 (58.3%) |
| 3.0x to 3.9x | 28 (14.4%) | 71 (26.9%) |
| 4.0x or more | 91 (46.7%) | 9 (3.4%) |
| Total | 195 (100.0%) | 264 (100.0%) |
Real Estate Taxes by Mortgage Status in Cave City
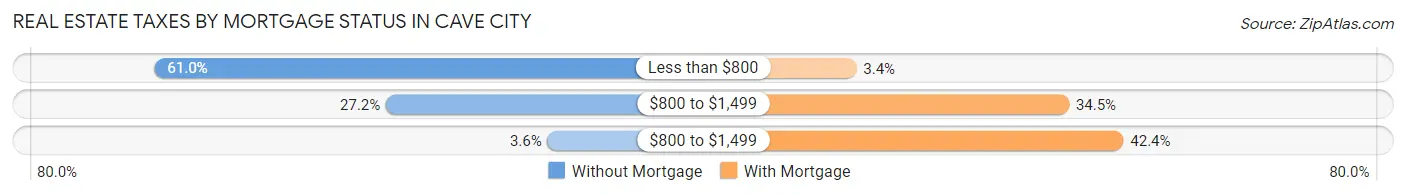
| Property Taxes | Without Mortgage | With Mortgage |
| Less than $800 | 119 (61.0%) | 9 (3.4%) |
| $800 to $1,499 | 53 (27.2%) | 91 (34.5%) |
| $800 to $1,499 | 7 (3.6%) | 112 (42.4%) |
| Total | 195 (100.0%) | 264 (100.0%) |
Health & Disability in Cave City
Health Insurance Coverage by Age in Cave City
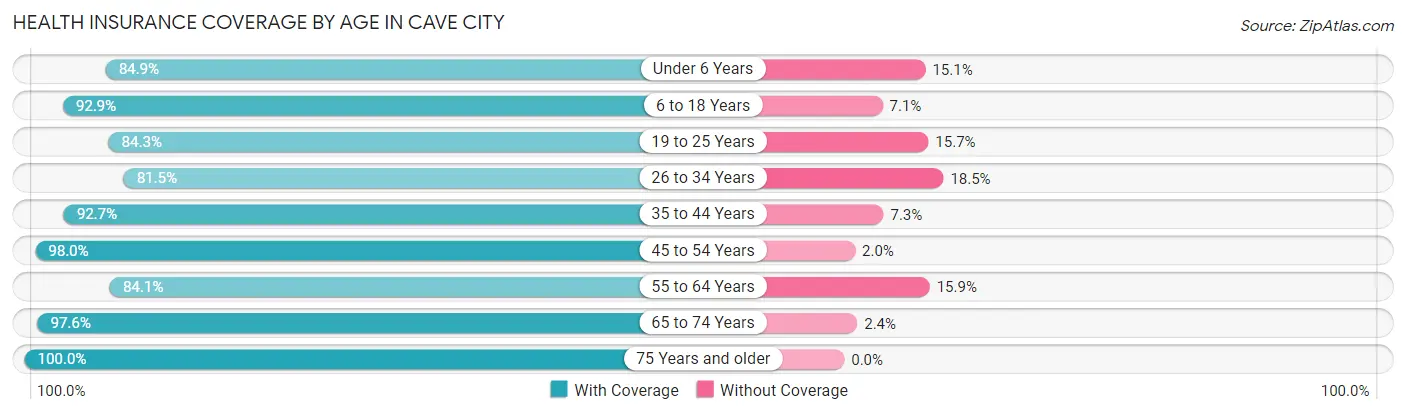
| Age Bracket | With Coverage | Without Coverage |
| Under 6 Years | 185 (84.9%) | 33 (15.1%) |
| 6 to 18 Years | 338 (92.9%) | 26 (7.1%) |
| 19 to 25 Years | 285 (84.3%) | 53 (15.7%) |
| 26 to 34 Years | 238 (81.5%) | 54 (18.5%) |
| 35 to 44 Years | 304 (92.7%) | 24 (7.3%) |
| 45 to 54 Years | 391 (98.0%) | 8 (2.0%) |
| 55 to 64 Years | 248 (84.1%) | 47 (15.9%) |
| 65 to 74 Years | 242 (97.6%) | 6 (2.4%) |
| 75 Years and older | 225 (100.0%) | 0 (0.0%) |
| Total | 2,456 (90.7%) | 251 (9.3%) |
Health Insurance Coverage by Citizenship Status in Cave City
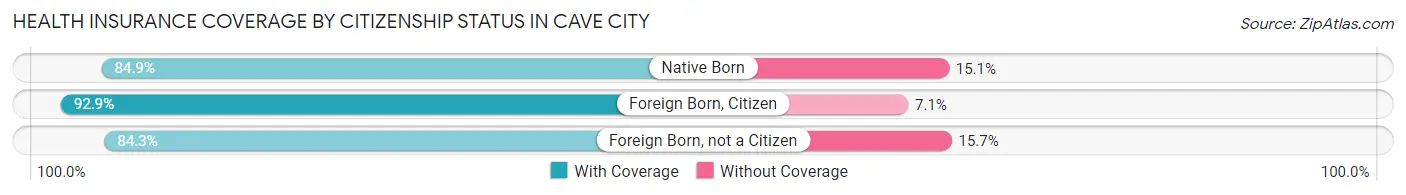
| Citizenship Status | With Coverage | Without Coverage |
| Native Born | 185 (84.9%) | 33 (15.1%) |
| Foreign Born, Citizen | 338 (92.9%) | 26 (7.1%) |
| Foreign Born, not a Citizen | 285 (84.3%) | 53 (15.7%) |
Health Insurance Coverage by Household Income in Cave City
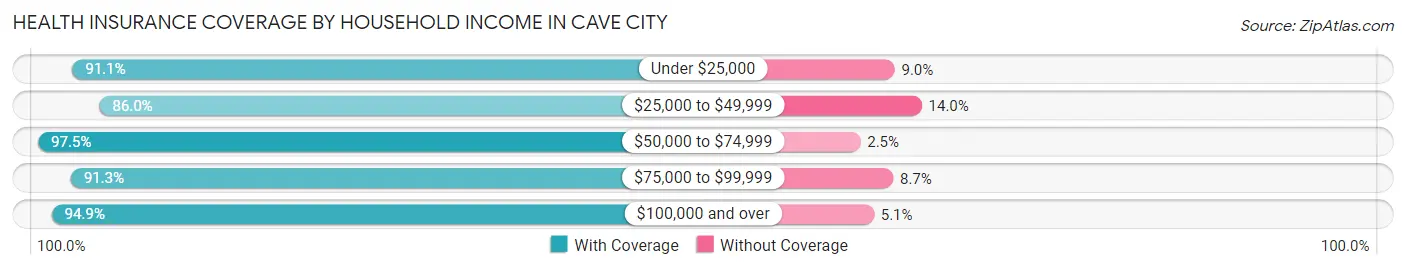
| Household Income | With Coverage | Without Coverage |
| Under $25,000 | 682 (91.0%) | 67 (8.9%) |
| $25,000 to $49,999 | 644 (86.0%) | 105 (14.0%) |
| $50,000 to $74,999 | 423 (97.5%) | 11 (2.5%) |
| $75,000 to $99,999 | 369 (91.3%) | 35 (8.7%) |
| $100,000 and over | 338 (94.9%) | 18 (5.1%) |
Public vs Private Health Insurance Coverage by Age in Cave City
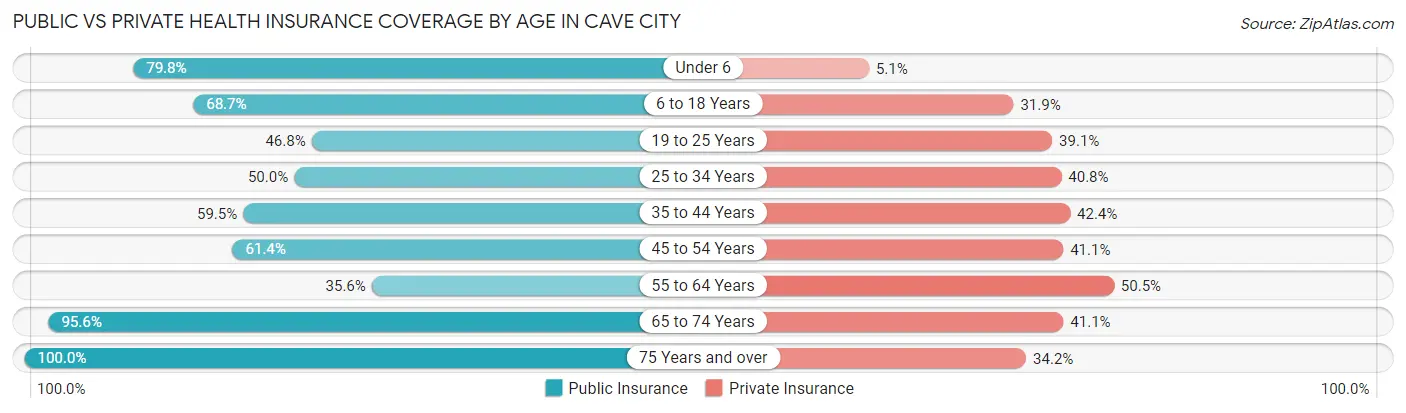
| Age Bracket | Public Insurance | Private Insurance |
| Under 6 | 174 (79.8%) | 11 (5.1%) |
| 6 to 18 Years | 250 (68.7%) | 116 (31.9%) |
| 19 to 25 Years | 158 (46.8%) | 132 (39.1%) |
| 25 to 34 Years | 146 (50.0%) | 119 (40.7%) |
| 35 to 44 Years | 195 (59.5%) | 139 (42.4%) |
| 45 to 54 Years | 245 (61.4%) | 164 (41.1%) |
| 55 to 64 Years | 105 (35.6%) | 149 (50.5%) |
| 65 to 74 Years | 237 (95.6%) | 102 (41.1%) |
| 75 Years and over | 225 (100.0%) | 77 (34.2%) |
| Total | 1,735 (64.1%) | 1,009 (37.3%) |
Disability Status by Sex by Age in Cave City
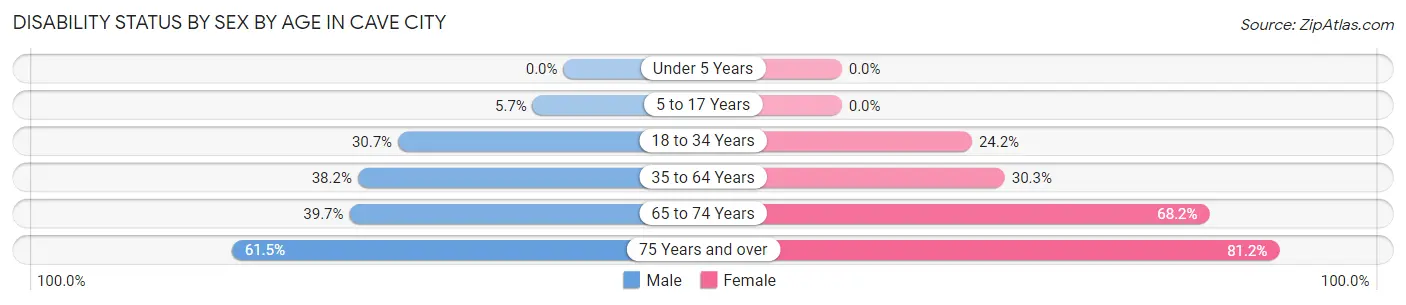
| Age Bracket | Male | Female |
| Under 5 Years | 0 (0.0%) | 0 (0.0%) |
| 5 to 17 Years | 14 (5.7%) | 0 (0.0%) |
| 18 to 34 Years | 105 (30.7%) | 79 (24.2%) |
| 35 to 64 Years | 192 (38.2%) | 157 (30.2%) |
| 65 to 74 Years | 56 (39.7%) | 73 (68.2%) |
| 75 Years and over | 24 (61.5%) | 151 (81.2%) |
Disability Class by Sex by Age in Cave City
Disability Class: Hearing Difficulty
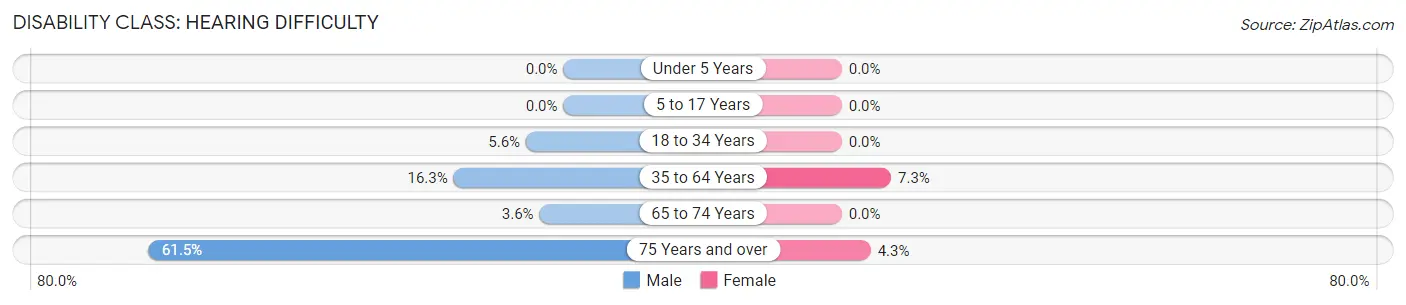
| Age Bracket | Male | Female |
| Under 5 Years | 0 (0.0%) | 0 (0.0%) |
| 5 to 17 Years | 0 (0.0%) | 0 (0.0%) |
| 18 to 34 Years | 19 (5.6%) | 0 (0.0%) |
| 35 to 64 Years | 82 (16.3%) | 38 (7.3%) |
| 65 to 74 Years | 5 (3.5%) | 0 (0.0%) |
| 75 Years and over | 24 (61.5%) | 8 (4.3%) |
Disability Class: Vision Difficulty
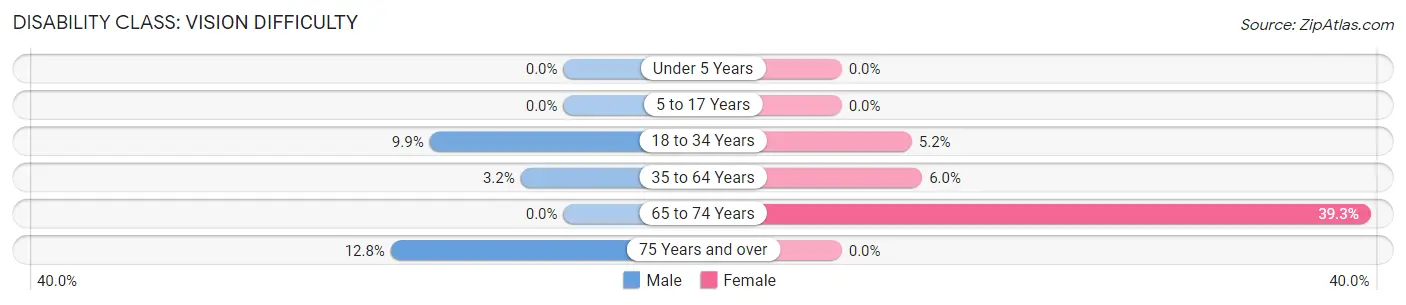
| Age Bracket | Male | Female |
| Under 5 Years | 0 (0.0%) | 0 (0.0%) |
| 5 to 17 Years | 0 (0.0%) | 0 (0.0%) |
| 18 to 34 Years | 34 (9.9%) | 17 (5.2%) |
| 35 to 64 Years | 16 (3.2%) | 31 (6.0%) |
| 65 to 74 Years | 0 (0.0%) | 42 (39.3%) |
| 75 Years and over | 5 (12.8%) | 0 (0.0%) |
Disability Class: Cognitive Difficulty
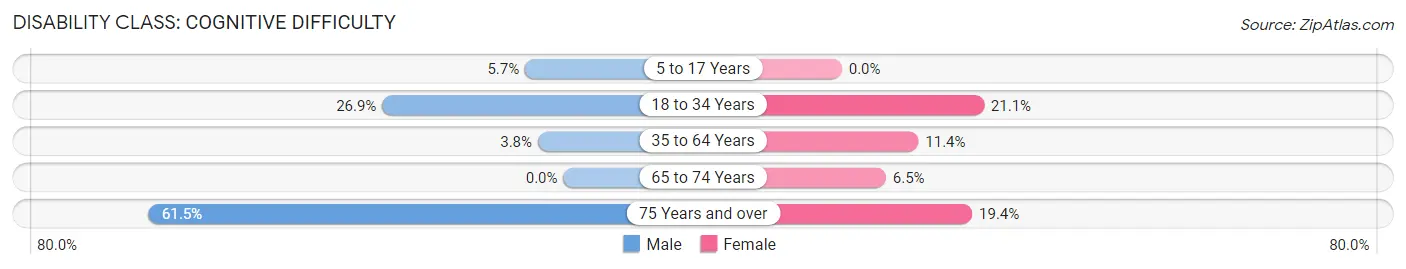
| Age Bracket | Male | Female |
| 5 to 17 Years | 14 (5.7%) | 0 (0.0%) |
| 18 to 34 Years | 92 (26.9%) | 69 (21.1%) |
| 35 to 64 Years | 19 (3.8%) | 59 (11.4%) |
| 65 to 74 Years | 0 (0.0%) | 7 (6.5%) |
| 75 Years and over | 24 (61.5%) | 36 (19.4%) |
Disability Class: Ambulatory Difficulty
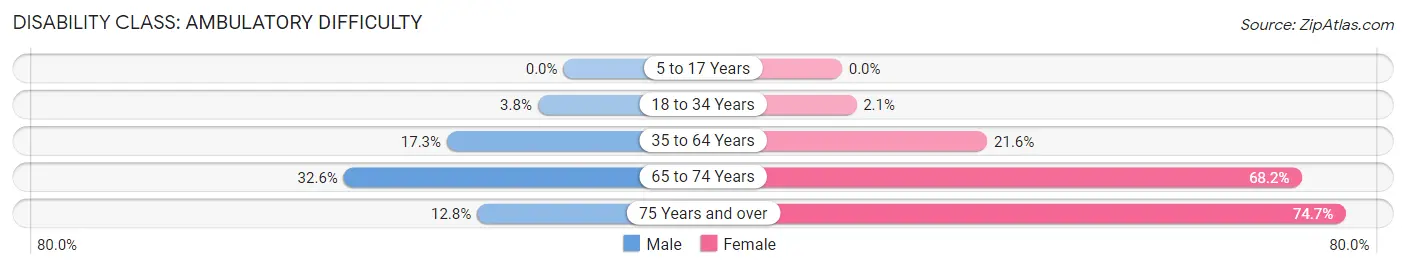
| Age Bracket | Male | Female |
| 5 to 17 Years | 0 (0.0%) | 0 (0.0%) |
| 18 to 34 Years | 13 (3.8%) | 7 (2.1%) |
| 35 to 64 Years | 87 (17.3%) | 112 (21.6%) |
| 65 to 74 Years | 46 (32.6%) | 73 (68.2%) |
| 75 Years and over | 5 (12.8%) | 139 (74.7%) |
Disability Class: Self-Care Difficulty
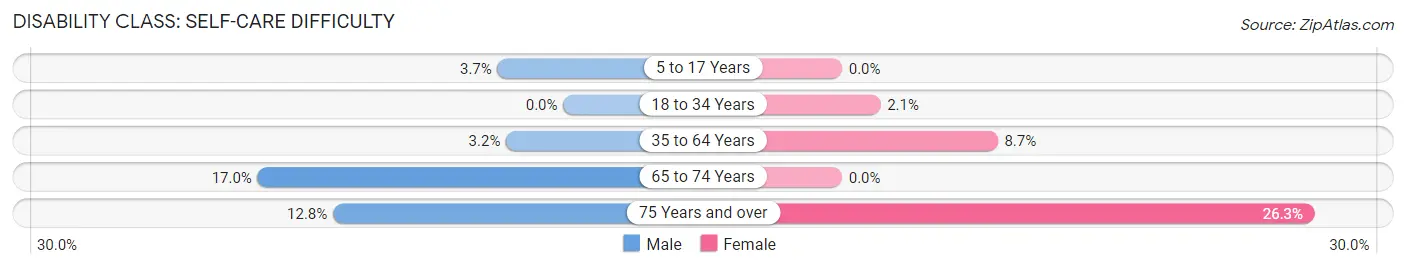
| Age Bracket | Male | Female |
| 5 to 17 Years | 9 (3.7%) | 0 (0.0%) |
| 18 to 34 Years | 0 (0.0%) | 7 (2.1%) |
| 35 to 64 Years | 16 (3.2%) | 45 (8.7%) |
| 65 to 74 Years | 24 (17.0%) | 0 (0.0%) |
| 75 Years and over | 5 (12.8%) | 49 (26.3%) |
Technology Access in Cave City
Computing Device Access in Cave City
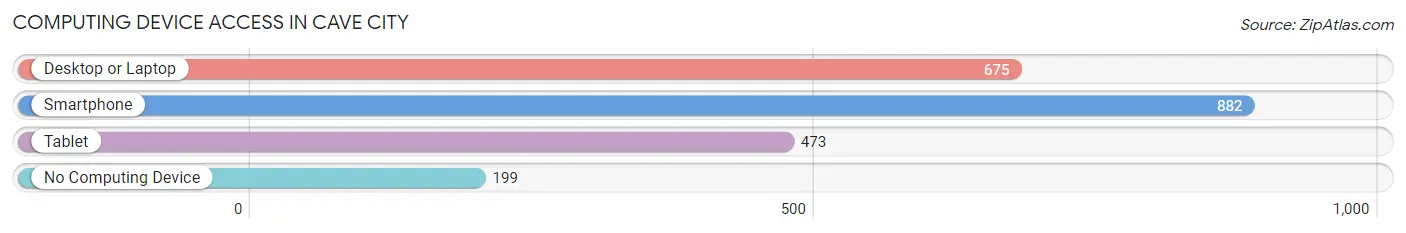
| Device Type | # Households | % Households |
| Desktop or Laptop | 675 | 57.9% |
| Smartphone | 882 | 75.7% |
| Tablet | 473 | 40.6% |
| No Computing Device | 199 | 17.1% |
| Total | 1,165 | 100.0% |
Internet Access in Cave City
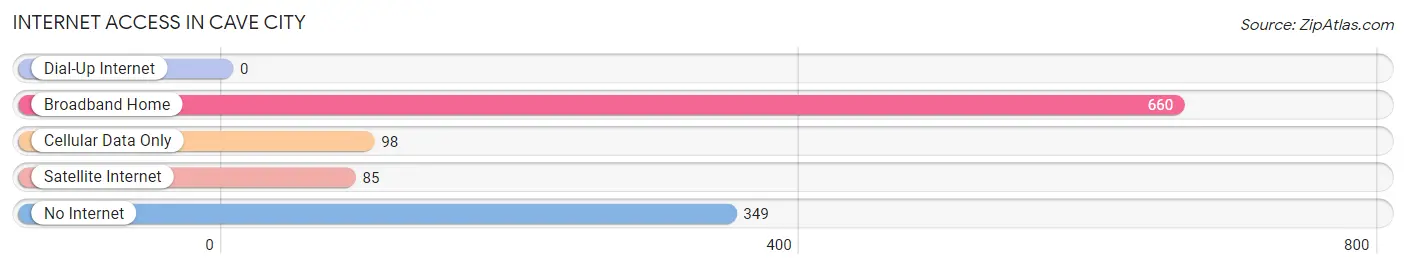
| Internet Type | # Households | % Households |
| Dial-Up Internet | 0 | 0.0% |
| Broadband Home | 660 | 56.7% |
| Cellular Data Only | 98 | 8.4% |
| Satellite Internet | 85 | 7.3% |
| No Internet | 349 | 30.0% |
| Total | 1,165 | 100.0% |
Cave City Summary
Cave City is a small city located in Barren County, Kentucky, United States. It is situated in the south-central part of the state, about 25 miles south of Bowling Green and about 90 miles north of Nashville, Tennessee. The city is known for its proximity to Mammoth Cave National Park, the longest known cave system in the world. As of the 2010 census, the population of Cave City was 2,240.
History
The area that is now Cave City was first settled in the early 1800s by a group of settlers from Virginia. The town was originally known as “Cave Spring” and was named for the numerous springs in the area. In 1839, the town was officially incorporated as Cave City.
The town was a popular stop for travelers on the Louisville and Nashville Railroad, which ran through the area in the late 1800s. The railroad brought many new visitors to the area, and the town soon became a popular tourist destination.
In 1941, Mammoth Cave National Park was established, and the town of Cave City was chosen as the park’s headquarters. The park brought a new wave of visitors to the area, and the town’s population began to grow.
Geography
Cave City is located in south-central Kentucky, about 25 miles south of Bowling Green and about 90 miles north of Nashville, Tennessee. The city is situated in the Barren River Valley, and is surrounded by rolling hills and farmland. The city is located at the intersection of Interstate 65 and U.S. Route 31W.
The climate in Cave City is humid subtropical, with hot, humid summers and mild winters. The average annual temperature is around 61°F, and the average annual precipitation is around 45 inches.
Economy
The economy of Cave City is largely based on tourism. The city is home to Mammoth Cave National Park, the longest known cave system in the world, and is a popular destination for visitors from all over the world. The park brings in millions of visitors each year, and provides jobs for many of the city’s residents.
In addition to tourism, Cave City is also home to several manufacturing companies, including a furniture factory and a plastics factory. The city is also home to several retail stores, restaurants, and other businesses.
Demographics
As of the 2010 census, the population of Cave City was 2,240. The racial makeup of the city was 95.3% White, 1.2% African American, 0.3% Native American, 0.7% Asian, 0.1% Pacific Islander, 0.9% from other races, and 1.5% from two or more races. Hispanic or Latino of any race were 2.2% of the population.
The median household income in Cave City was $31,250, and the median family income was $37,500. The per capita income for the city was $17,845. About 17.2% of the population was below the poverty line.
Common Questions
What is Per Capita Income in Cave City?
Per Capita income in Cave City is $21,727.
What is the Median Family Income in Cave City?
Median Family Income in Cave City is $53,150.
What is the Median Household income in Cave City?
Median Household Income in Cave City is $37,431.
What is Income or Wage Gap in Cave City?
Income or Wage Gap in Cave City is 16.0%.
Women in Cave City earn 84.0 cents for every dollar earned by a man.
What is Inequality or Gini Index in Cave City?
Inequality or Gini Index in Cave City is 0.47.
What is the Total Population of Cave City?
Total Population of Cave City is 2,707.
What is the Total Male Population of Cave City?
Total Male Population of Cave City is 1,347.
What is the Total Female Population of Cave City?
Total Female Population of Cave City is 1,360.
What is the Ratio of Males per 100 Females in Cave City?
There are 99.04 Males per 100 Females in Cave City.
What is the Ratio of Females per 100 Males in Cave City?
There are 100.97 Females per 100 Males in Cave City.
What is the Median Population Age in Cave City?
Median Population Age in Cave City is 40.2 Years.
What is the Average Family Size in Cave City
Average Family Size in Cave City is 3.2 People.
What is the Average Household Size in Cave City
Average Household Size in Cave City is 2.3 People.
How Large is the Labor Force in Cave City?
There are 1,211 People in the Labor Forcein in Cave City.
What is the Percentage of People in the Labor Force in Cave City?
54.1% of People are in the Labor Force in Cave City.
What is the Unemployment Rate in Cave City?
Unemployment Rate in Cave City is 9.2%.