Henderson, KY Map & Demographics
Henderson Map
Henderson Overview
$28,845
PER CAPITA INCOME
$68,425
AVG FAMILY INCOME
$46,276
AVG HOUSEHOLD INCOME
30.5%
WAGE / INCOME GAP [ % ]
69.5¢/ $1
WAGE / INCOME GAP [ $ ]
$10,506
FAMILY INCOME DEFICIT
0.46
INEQUALITY / GINI INDEX
28,166
TOTAL POPULATION
13,303
MALE POPULATION
14,863
FEMALE POPULATION
89.50
MALES / 100 FEMALES
111.73
FEMALES / 100 MALES
40.1
MEDIAN AGE
2.9
AVG FAMILY SIZE
2.2
AVG HOUSEHOLD SIZE
12,724
LABOR FORCE [ PEOPLE ]
55.8%
PERCENT IN LABOR FORCE
3.3%
UNEMPLOYMENT RATE
Henderson Zip Codes
Henderson Area Codes
Income in Henderson
Income Overview in Henderson
Per Capita Income in Henderson is $28,845, while median incomes of families and households are $68,425 and $46,276 respectively.
| Characteristic | Number | Measure |
| Per Capita Income | 28,166 | $28,845 |
| Median Family Income | 7,148 | $68,425 |
| Mean Family Income | 7,148 | $79,760 |
| Median Household Income | 12,133 | $46,276 |
| Mean Household Income | 12,133 | $63,221 |
| Income Deficit | 7,148 | $10,506 |
| Wage / Income Gap (%) | 28,166 | 30.52% |
| Wage / Income Gap ($) | 28,166 | 69.48¢ per $1 |
| Gini / Inequality Index | 28,166 | 0.46 |
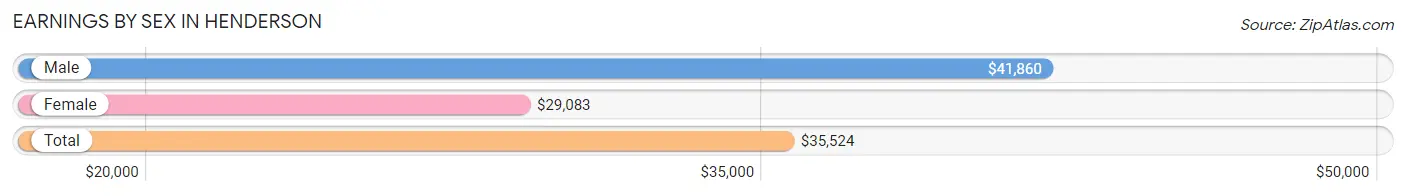
Earnings by Sex in Henderson
Average Earnings in Henderson are $35,524, $41,860 for men and $29,083 for women, a difference of 30.5%.
| Sex | Number | Average Earnings |
| Male | 7,019 (52.1%) | $41,860 |
| Female | 6,459 (47.9%) | $29,083 |
| Total | 13,478 (100.0%) | $35,524 |
Earnings by Sex by Income Bracket in Henderson
The most common earnings brackets in Henderson are $75,000 to $99,999 for men (855 | 12.2%) and $2,499 or less for women (547 | 8.5%).
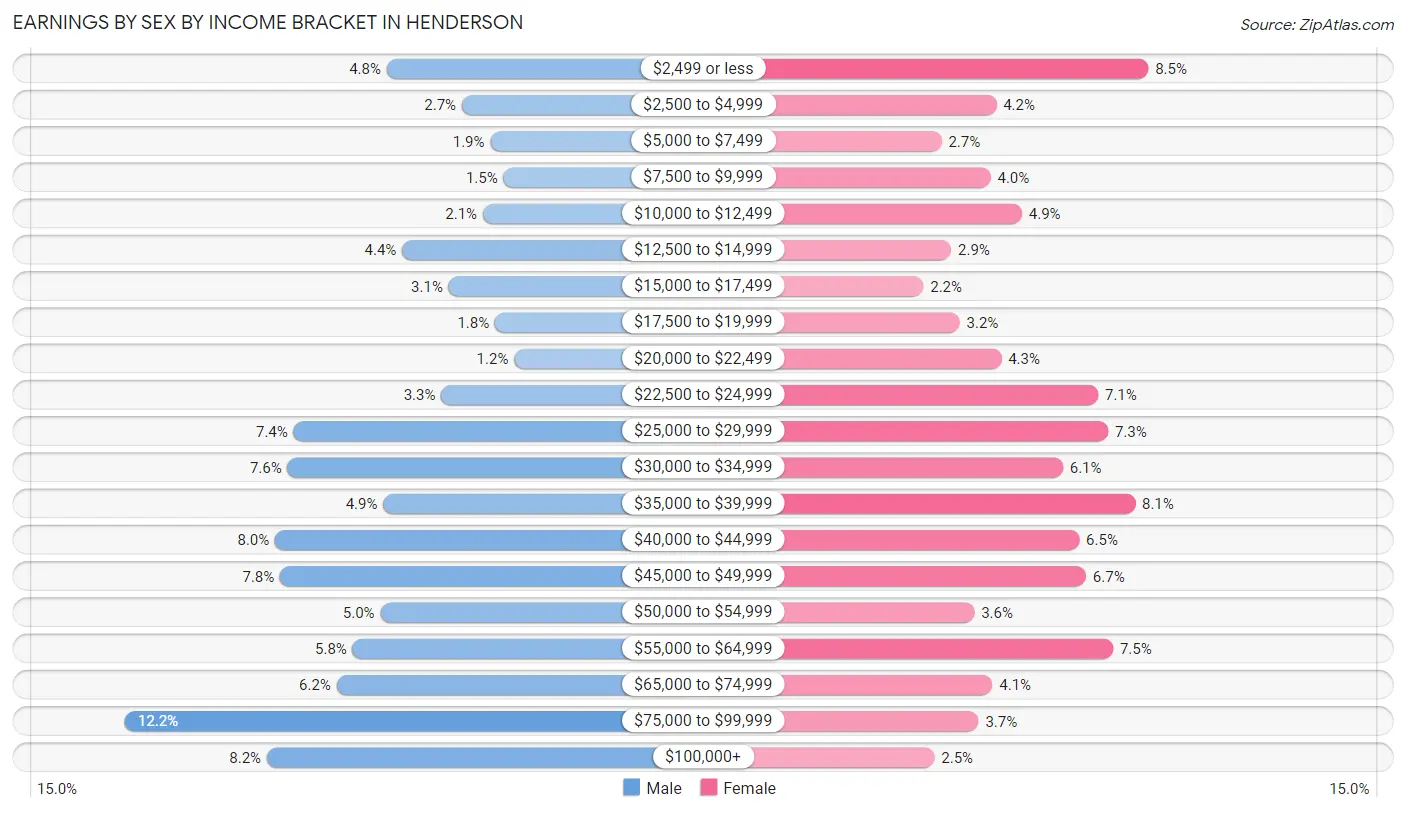
| Income | Male | Female |
| $2,499 or less | 338 (4.8%) | 547 (8.5%) |
| $2,500 to $4,999 | 190 (2.7%) | 271 (4.2%) |
| $5,000 to $7,499 | 134 (1.9%) | 172 (2.7%) |
| $7,500 to $9,999 | 108 (1.5%) | 261 (4.0%) |
| $10,000 to $12,499 | 149 (2.1%) | 318 (4.9%) |
| $12,500 to $14,999 | 308 (4.4%) | 189 (2.9%) |
| $15,000 to $17,499 | 216 (3.1%) | 139 (2.1%) |
| $17,500 to $19,999 | 125 (1.8%) | 205 (3.2%) |
| $20,000 to $22,499 | 87 (1.2%) | 280 (4.3%) |
| $22,500 to $24,999 | 231 (3.3%) | 456 (7.1%) |
| $25,000 to $29,999 | 522 (7.4%) | 474 (7.3%) |
| $30,000 to $34,999 | 534 (7.6%) | 392 (6.1%) |
| $35,000 to $39,999 | 345 (4.9%) | 523 (8.1%) |
| $40,000 to $44,999 | 559 (8.0%) | 422 (6.5%) |
| $45,000 to $49,999 | 549 (7.8%) | 434 (6.7%) |
| $50,000 to $54,999 | 351 (5.0%) | 231 (3.6%) |
| $55,000 to $64,999 | 406 (5.8%) | 483 (7.5%) |
| $65,000 to $74,999 | 437 (6.2%) | 264 (4.1%) |
| $75,000 to $99,999 | 855 (12.2%) | 239 (3.7%) |
| $100,000+ | 575 (8.2%) | 159 (2.5%) |
| Total | 7,019 (100.0%) | 6,459 (100.0%) |
Earnings by Sex by Educational Attainment in Henderson
Average earnings in Henderson are $45,414 for men and $33,125 for women, a difference of 27.1%. Men with an educational attainment of graduate degree enjoy the highest average annual earnings of $80,431, while those with less than high school education earn the least with $28,125. Women with an educational attainment of graduate degree earn the most with the average annual earnings of $47,328, while those with high school diploma education have the smallest earnings of $24,692.
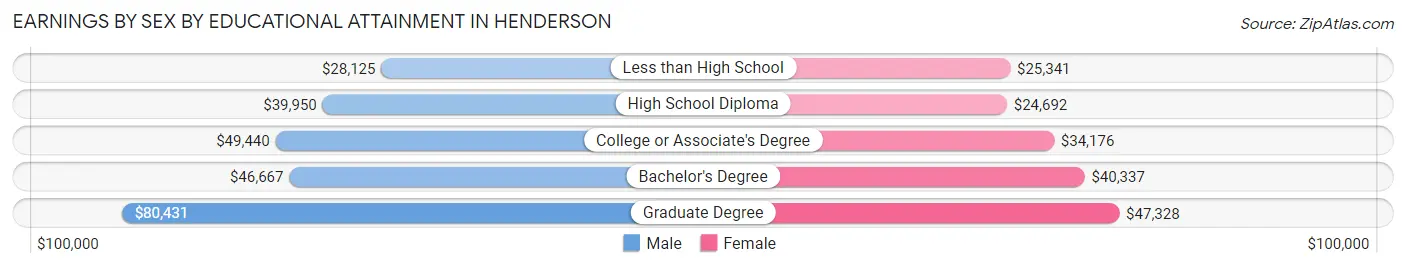
| Educational Attainment | Male Income | Female Income |
| Less than High School | $28,125 | $25,341 |
| High School Diploma | $39,950 | $24,692 |
| College or Associate's Degree | $49,440 | $34,176 |
| Bachelor's Degree | $46,667 | $40,337 |
| Graduate Degree | $80,431 | $47,328 |
| Total | $45,414 | $33,125 |
Family Income in Henderson
Family Income Brackets in Henderson
According to the Henderson family income data, there are 1,387 families falling into the $100,000 to $149,999 income range, which is the most common income bracket and makes up 19.4% of all families. Conversely, the $200,000+ income bracket is the least frequent group with only 264 families (3.7%) belonging to this category.
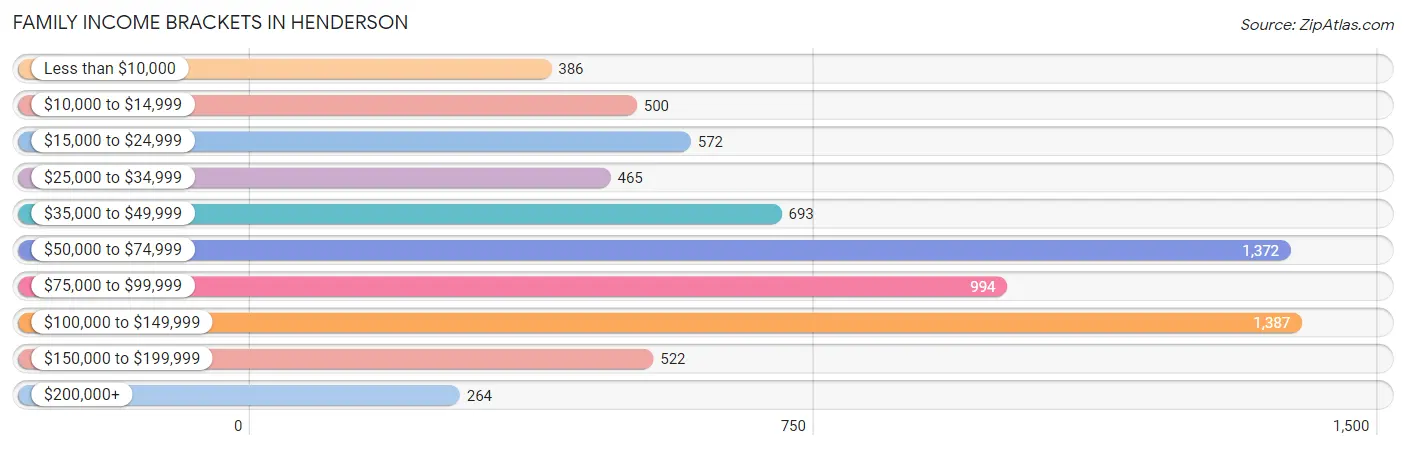
| Income Bracket | # Families | % Families |
| Less than $10,000 | 386 | 5.4% |
| $10,000 to $14,999 | 500 | 7.0% |
| $15,000 to $24,999 | 572 | 8.0% |
| $25,000 to $34,999 | 465 | 6.5% |
| $35,000 to $49,999 | 693 | 9.7% |
| $50,000 to $74,999 | 1,372 | 19.2% |
| $75,000 to $99,999 | 994 | 13.9% |
| $100,000 to $149,999 | 1,387 | 19.4% |
| $150,000 to $199,999 | 522 | 7.3% |
| $200,000+ | 264 | 3.7% |
Family Income by Famaliy Size in Henderson
6-person families (100 | 1.4%) account for the highest median family income in Henderson with $118,750 per family, while 2-person families (3,676 | 51.4%) have the highest median income of $33,222 per family member.
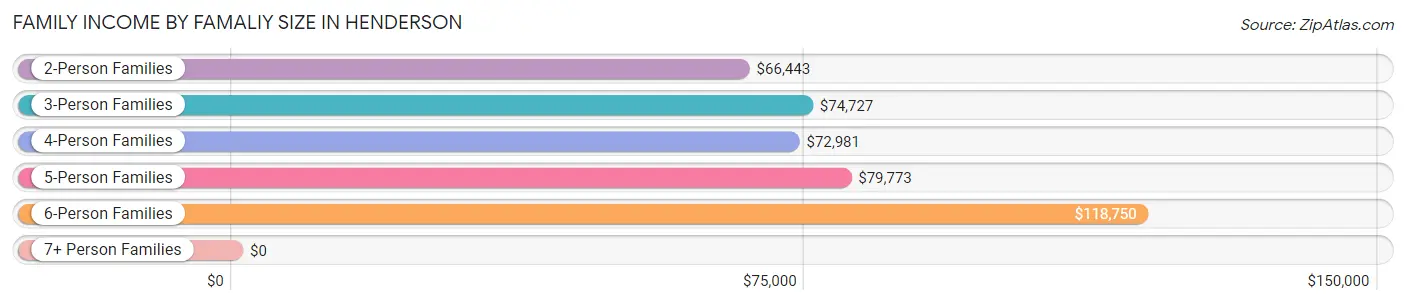
| Income Bracket | # Families | Median Income |
| 2-Person Families | 3,676 (51.4%) | $66,443 |
| 3-Person Families | 1,647 (23.0%) | $74,727 |
| 4-Person Families | 1,265 (17.7%) | $72,981 |
| 5-Person Families | 412 (5.8%) | $79,773 |
| 6-Person Families | 100 (1.4%) | $118,750 |
| 7+ Person Families | 48 (0.7%) | $0 |
| Total | 7,148 (100.0%) | $68,425 |
Family Income by Number of Earners in Henderson
The median family income in Henderson is $68,425, with families comprising 3+ earners (381) having the highest median family income of $121,083, while families with no earners (1,311) have the lowest median family income of $29,103, accounting for 5.3% and 18.3% of families, respectively.
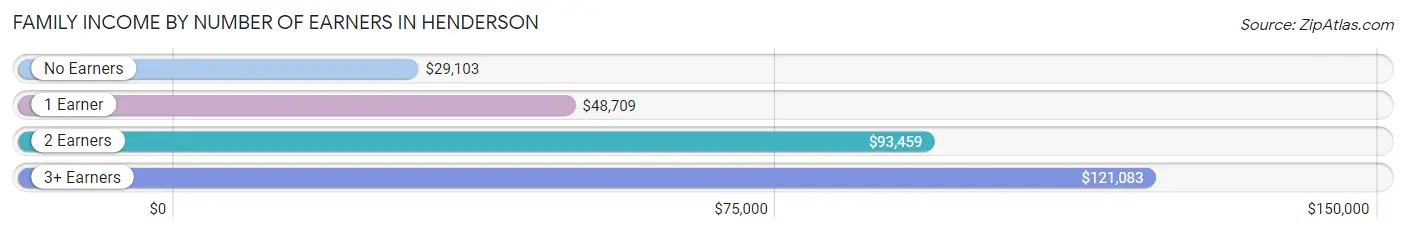
| Number of Earners | # Families | Median Income |
| No Earners | 1,311 (18.3%) | $29,103 |
| 1 Earner | 2,500 (35.0%) | $48,709 |
| 2 Earners | 2,956 (41.3%) | $93,459 |
| 3+ Earners | 381 (5.3%) | $121,083 |
| Total | 7,148 (100.0%) | $68,425 |
Household Income in Henderson
Household Income Brackets in Henderson
With 1,905 households falling in the category, the $50,000 to $74,999 income range is the most frequent in Henderson, accounting for 15.7% of all households. In contrast, only 303 households (2.5%) fall into the $200,000+ income bracket, making it the least populous group.
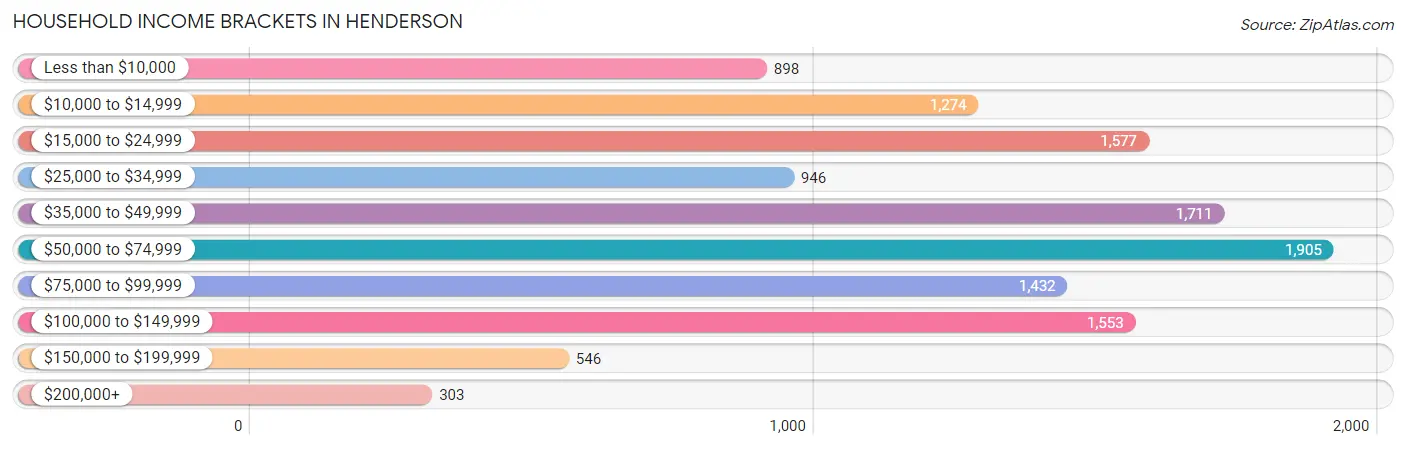
| Income Bracket | # Households | % Households |
| Less than $10,000 | 898 | 7.4% |
| $10,000 to $14,999 | 1,274 | 10.5% |
| $15,000 to $24,999 | 1,577 | 13.0% |
| $25,000 to $34,999 | 946 | 7.8% |
| $35,000 to $49,999 | 1,711 | 14.1% |
| $50,000 to $74,999 | 1,905 | 15.7% |
| $75,000 to $99,999 | 1,432 | 11.8% |
| $100,000 to $149,999 | 1,553 | 12.8% |
| $150,000 to $199,999 | 546 | 4.5% |
| $200,000+ | 303 | 2.5% |
Household Income by Householder Age in Henderson
The median household income in Henderson is $46,276, with the highest median household income of $58,462 found in the 45 to 64 years age bracket for the primary householder. A total of 4,506 households (37.1%) fall into this category. Meanwhile, the 15 to 24 years age bracket for the primary householder has the lowest median household income of $22,722, with 787 households (6.5%) in this group.
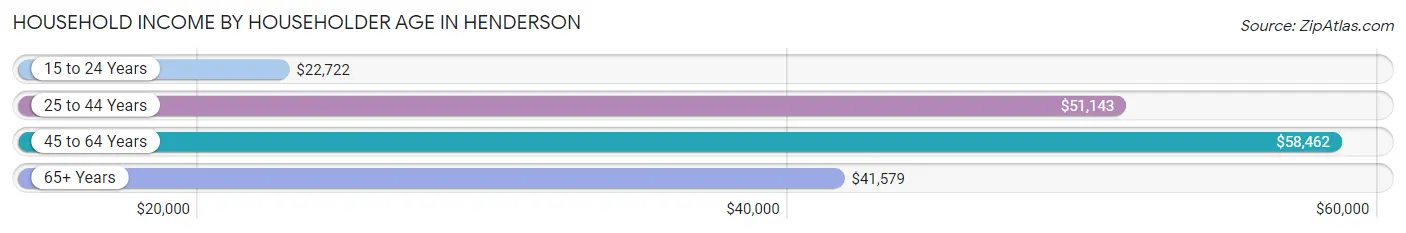
| Income Bracket | # Households | Median Income |
| 15 to 24 Years | 787 (6.5%) | $22,722 |
| 25 to 44 Years | 3,412 (28.1%) | $51,143 |
| 45 to 64 Years | 4,506 (37.1%) | $58,462 |
| 65+ Years | 3,428 (28.2%) | $41,579 |
| Total | 12,133 (100.0%) | $46,276 |
Poverty in Henderson
Income Below Poverty by Sex and Age in Henderson
With 17.4% poverty level for males and 23.7% for females among the residents of Henderson, 16 and 17 year old males and 5 year old females are the most vulnerable to poverty, with 204 males (38.1%) and 122 females (64.9%) in their respective age groups living below the poverty level.
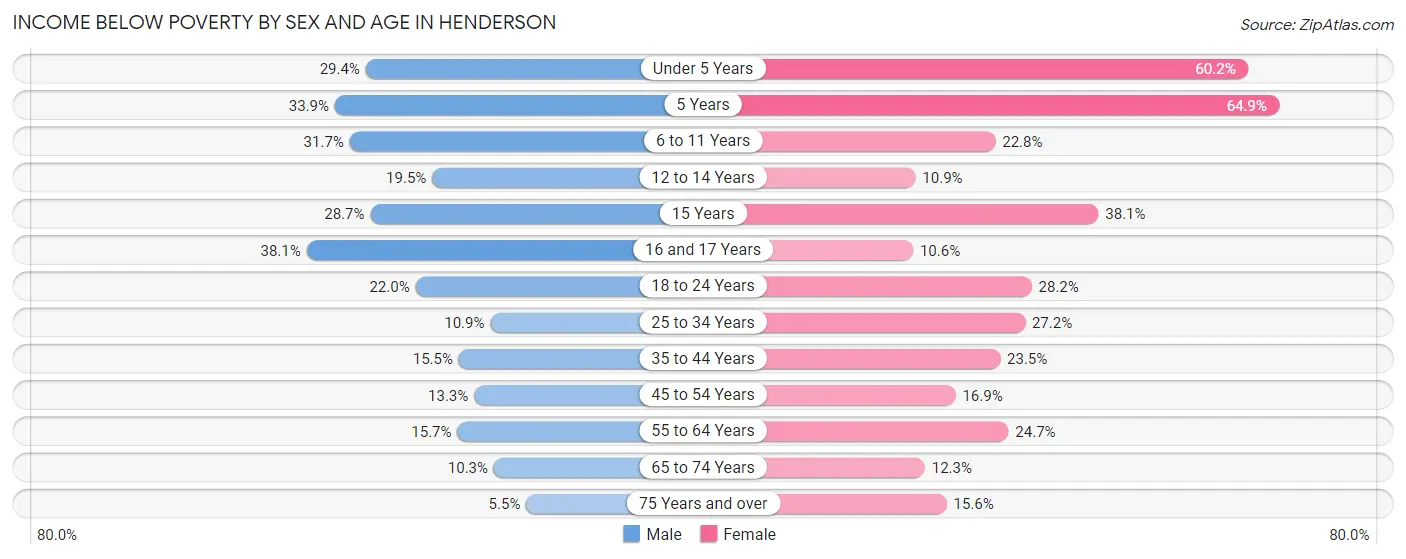
| Age Bracket | Male | Female |
| Under 5 Years | 204 (29.3%) | 553 (60.2%) |
| 5 Years | 37 (33.9%) | 122 (64.9%) |
| 6 to 11 Years | 271 (31.7%) | 219 (22.8%) |
| 12 to 14 Years | 120 (19.5%) | 68 (10.9%) |
| 15 Years | 41 (28.7%) | 56 (38.1%) |
| 16 and 17 Years | 204 (38.1%) | 39 (10.6%) |
| 18 to 24 Years | 265 (22.0%) | 254 (28.2%) |
| 25 to 34 Years | 193 (10.8%) | 522 (27.2%) |
| 35 to 44 Years | 224 (15.5%) | 410 (23.5%) |
| 45 to 54 Years | 210 (13.3%) | 304 (16.9%) |
| 55 to 64 Years | 284 (15.7%) | 472 (24.7%) |
| 65 to 74 Years | 119 (10.3%) | 210 (12.3%) |
| 75 Years and over | 44 (5.5%) | 190 (15.5%) |
| Total | 2,216 (17.4%) | 3,419 (23.7%) |
Income Above Poverty by Sex and Age in Henderson
According to the poverty statistics in Henderson, males aged 75 years and over and females aged 16 and 17 years are the age groups that are most secure financially, with 94.5% of males and 89.4% of females in these age groups living above the poverty line.
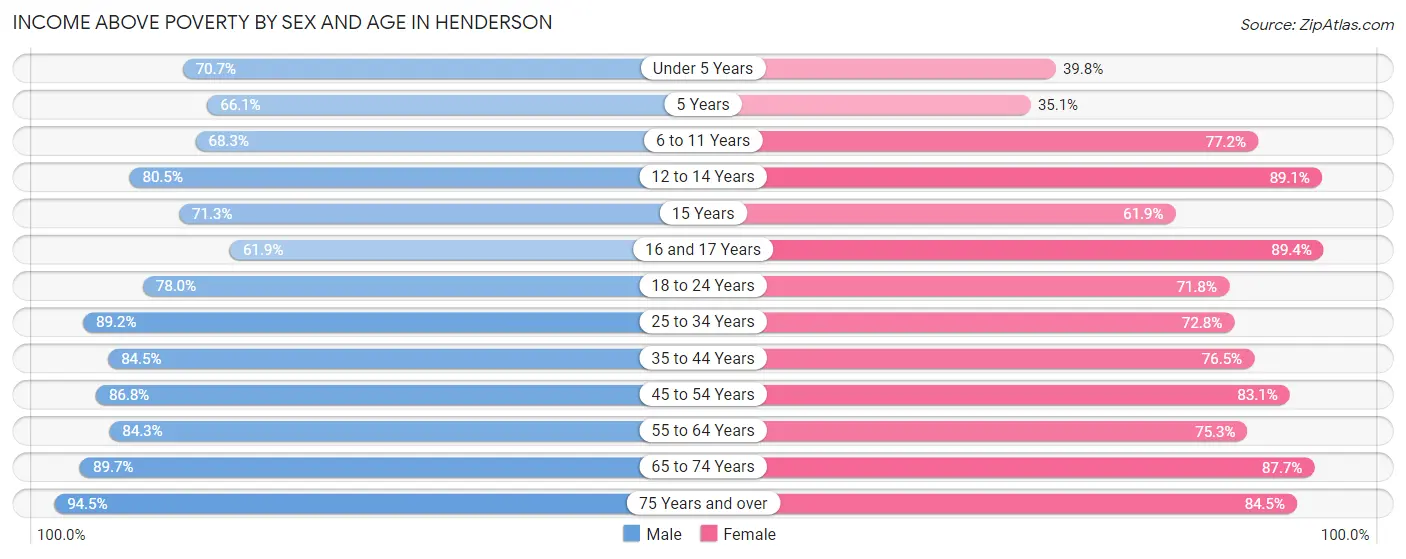
| Age Bracket | Male | Female |
| Under 5 Years | 491 (70.7%) | 365 (39.8%) |
| 5 Years | 72 (66.1%) | 66 (35.1%) |
| 6 to 11 Years | 583 (68.3%) | 742 (77.2%) |
| 12 to 14 Years | 496 (80.5%) | 554 (89.1%) |
| 15 Years | 102 (71.3%) | 91 (61.9%) |
| 16 and 17 Years | 331 (61.9%) | 330 (89.4%) |
| 18 to 24 Years | 942 (78.0%) | 647 (71.8%) |
| 25 to 34 Years | 1,586 (89.1%) | 1,397 (72.8%) |
| 35 to 44 Years | 1,219 (84.5%) | 1,334 (76.5%) |
| 45 to 54 Years | 1,375 (86.8%) | 1,497 (83.1%) |
| 55 to 64 Years | 1,520 (84.3%) | 1,436 (75.3%) |
| 65 to 74 Years | 1,034 (89.7%) | 1,493 (87.7%) |
| 75 Years and over | 754 (94.5%) | 1,032 (84.5%) |
| Total | 10,505 (82.6%) | 10,984 (76.3%) |
Income Below Poverty Among Married-Couple Families in Henderson
The poverty statistics for married-couple families in Henderson show that 11.3% or 577 of the total 5,119 families live below the poverty line. Families with 3 or 4 children have the highest poverty rate of 19.7%, comprising of 74 families. On the other hand, families with 5 or more children have the lowest poverty rate of 0.0%, which includes 0 families.
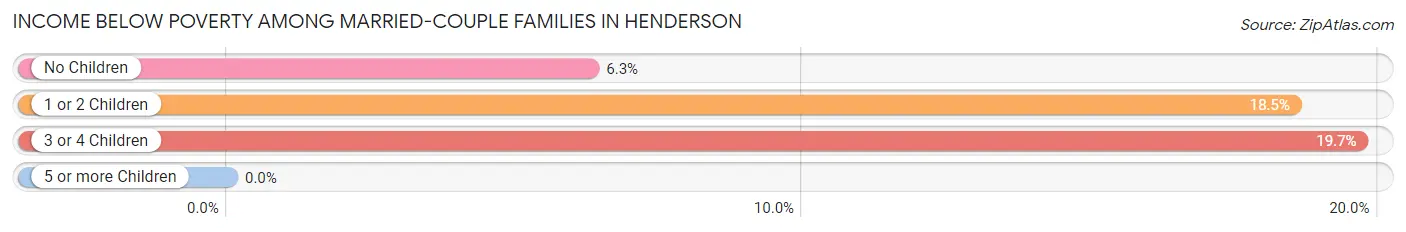
| Children | Above Poverty | Below Poverty |
| No Children | 2,861 (93.7%) | 192 (6.3%) |
| 1 or 2 Children | 1,368 (81.5%) | 311 (18.5%) |
| 3 or 4 Children | 302 (80.3%) | 74 (19.7%) |
| 5 or more Children | 11 (100.0%) | 0 (0.0%) |
| Total | 4,542 (88.7%) | 577 (11.3%) |
Income Below Poverty Among Single-Parent Households in Henderson
According to the poverty data in Henderson, 24.8% or 131 single-father households and 41.9% or 629 single-mother households are living below the poverty line. Among single-father households, those with no children have the highest poverty rate, with 55 households (26.2%) experiencing poverty. Likewise, among single-mother households, those with 5 or more children have the highest poverty rate, with 30 households (100.0%) falling below the poverty line.
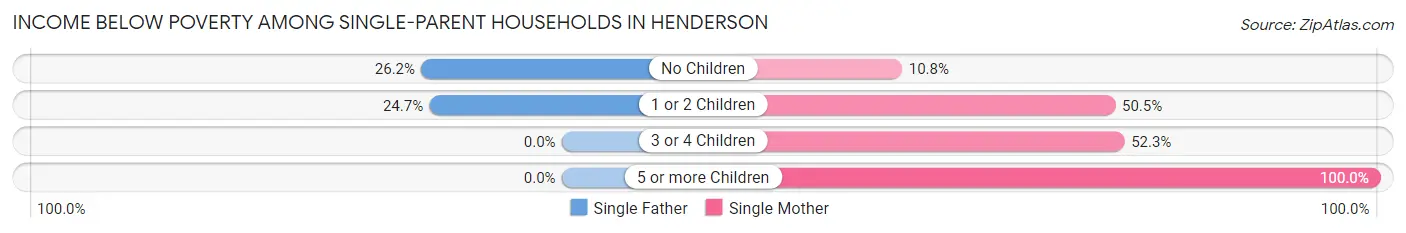
| Children | Single Father | Single Mother |
| No Children | 55 (26.2%) | 41 (10.8%) |
| 1 or 2 Children | 76 (24.7%) | 372 (50.5%) |
| 3 or 4 Children | 0 (0.0%) | 186 (52.2%) |
| 5 or more Children | 0 (0.0%) | 30 (100.0%) |
| Total | 131 (24.8%) | 629 (41.9%) |
Income Below Poverty Among Married-Couple vs Single-Parent Households in Henderson
The poverty data for Henderson shows that 577 of the married-couple family households (11.3%) and 760 of the single-parent households (37.5%) are living below the poverty level. Within the married-couple family households, those with 3 or 4 children have the highest poverty rate, with 74 households (19.7%) falling below the poverty line. Among the single-parent households, those with 5 or more children have the highest poverty rate, with 30 household (100.0%) living below poverty.
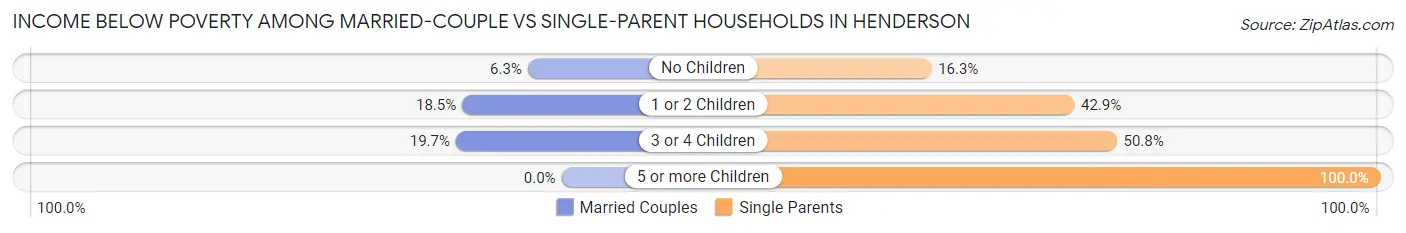
| Children | Married-Couple Families | Single-Parent Households |
| No Children | 192 (6.3%) | 96 (16.3%) |
| 1 or 2 Children | 311 (18.5%) | 448 (42.9%) |
| 3 or 4 Children | 74 (19.7%) | 186 (50.8%) |
| 5 or more Children | 0 (0.0%) | 30 (100.0%) |
| Total | 577 (11.3%) | 760 (37.5%) |
Race in Henderson
The most populous races in Henderson are White / Caucasian (23,063 | 81.9%), Black / African American (3,060 | 10.9%), and Two or more Races (1,289 | 4.6%).
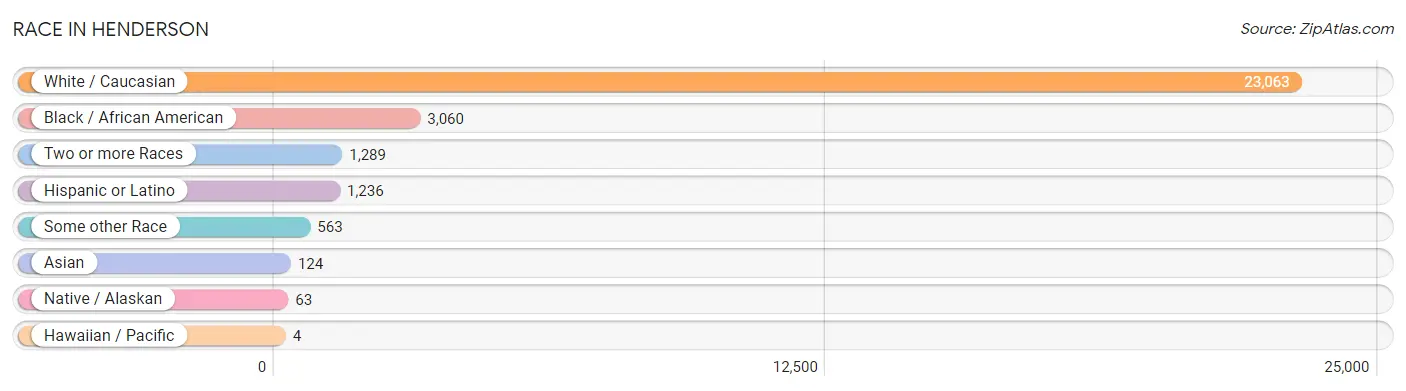
| Race | # Population | % Population |
| Asian | 124 | 0.4% |
| Black / African American | 3,060 | 10.9% |
| Hawaiian / Pacific | 4 | 0.0% |
| Hispanic or Latino | 1,236 | 4.4% |
| Native / Alaskan | 63 | 0.2% |
| White / Caucasian | 23,063 | 81.9% |
| Two or more Races | 1,289 | 4.6% |
| Some other Race | 563 | 2.0% |
| Total | 28,166 | 100.0% |
Ancestry in Henderson
The most populous ancestries reported in Henderson are American (3,523 | 12.5%), German (3,081 | 10.9%), Irish (2,985 | 10.6%), English (2,446 | 8.7%), and Mexican (891 | 3.2%), together accounting for 45.9% of all Henderson residents.
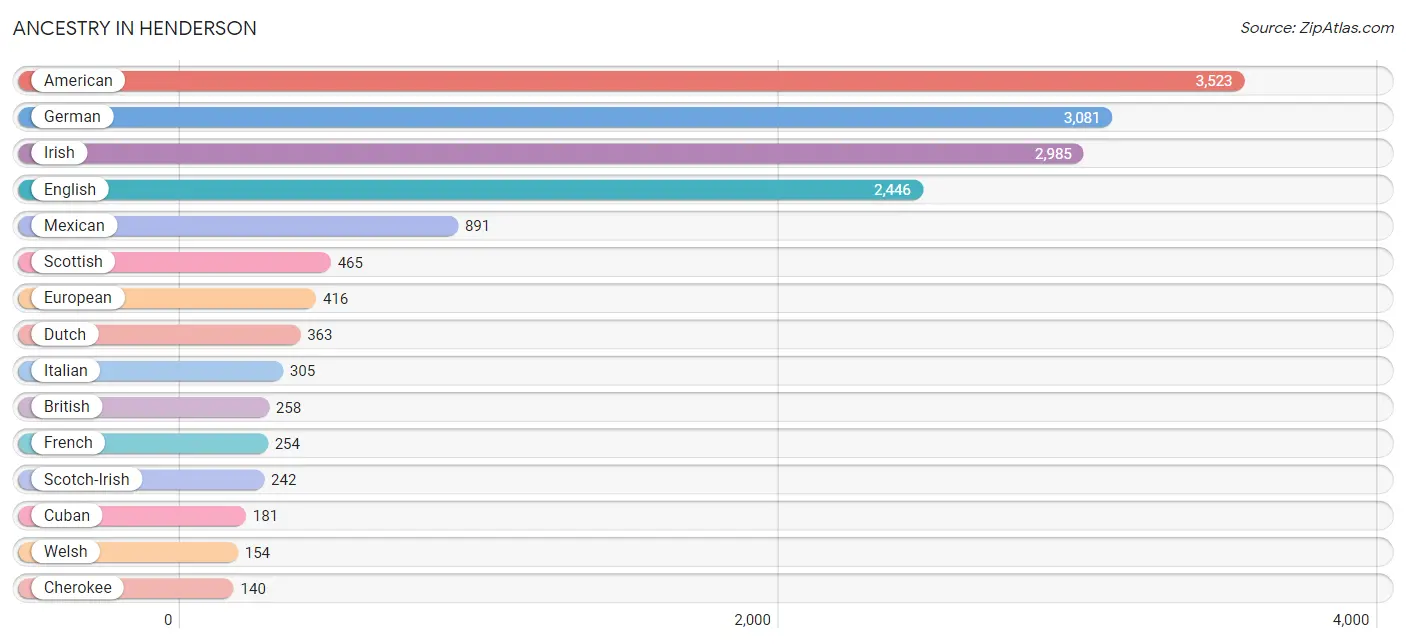
| Ancestry | # Population | % Population |
| African | 48 | 0.2% |
| American | 3,523 | 12.5% |
| Arab | 72 | 0.3% |
| Argentinean | 41 | 0.2% |
| Austrian | 15 | 0.1% |
| Bhutanese | 129 | 0.5% |
| British | 258 | 0.9% |
| Burmese | 52 | 0.2% |
| Cambodian | 8 | 0.0% |
| Central American | 63 | 0.2% |
| Central American Indian | 4 | 0.0% |
| Cherokee | 140 | 0.5% |
| Chippewa | 29 | 0.1% |
| Cuban | 181 | 0.6% |
| Czechoslovakian | 3 | 0.0% |
| Danish | 67 | 0.2% |
| Dutch | 363 | 1.3% |
| Ecuadorian | 18 | 0.1% |
| Egyptian | 22 | 0.1% |
| English | 2,446 | 8.7% |
| European | 416 | 1.5% |
| French | 254 | 0.9% |
| French Canadian | 24 | 0.1% |
| German | 3,081 | 10.9% |
| Greek | 22 | 0.1% |
| Guamanian / Chamorro | 4 | 0.0% |
| Honduran | 63 | 0.2% |
| Indian (Asian) | 102 | 0.4% |
| Irish | 2,985 | 10.6% |
| Italian | 305 | 1.1% |
| Jamaican | 43 | 0.2% |
| Laotian | 9 | 0.0% |
| Lebanese | 43 | 0.2% |
| Lithuanian | 15 | 0.1% |
| Malaysian | 56 | 0.2% |
| Mexican | 891 | 3.2% |
| Northern European | 30 | 0.1% |
| Norwegian | 29 | 0.1% |
| Pennsylvania German | 9 | 0.0% |
| Polish | 127 | 0.4% |
| Portuguese | 31 | 0.1% |
| Puerto Rican | 42 | 0.2% |
| Russian | 73 | 0.3% |
| Scandinavian | 49 | 0.2% |
| Scotch-Irish | 242 | 0.9% |
| Scottish | 465 | 1.7% |
| South American | 59 | 0.2% |
| Subsaharan African | 48 | 0.2% |
| Swedish | 15 | 0.1% |
| Swiss | 13 | 0.1% |
| Syrian | 7 | 0.0% |
| Ukrainian | 12 | 0.0% |
| Welsh | 154 | 0.5% |
| West Indian | 8 | 0.0% | View All 54 Rows |
Immigrants in Henderson
The most numerous immigrant groups reported in Henderson came from Latin America (282 | 1.0%), Central America (184 | 0.6%), Mexico (159 | 0.6%), Asia (157 | 0.6%), and China (75 | 0.3%), together accounting for 3.0% of all Henderson residents.
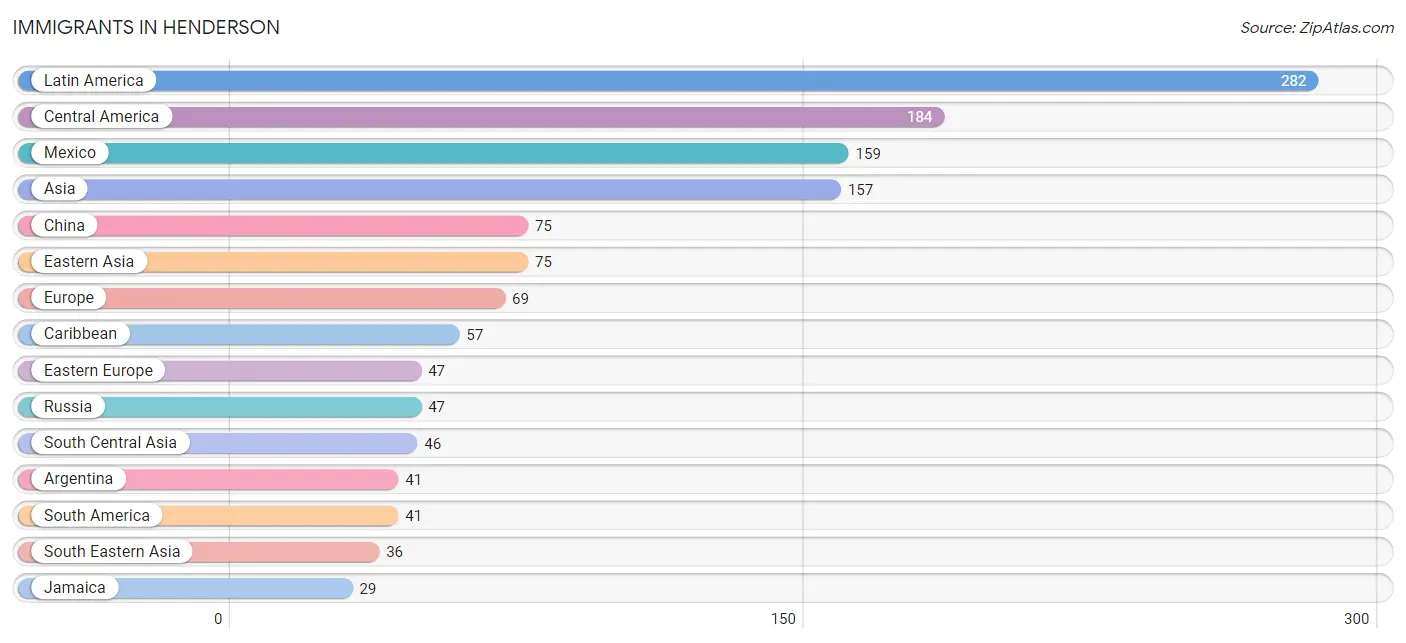
| Immigration Origin | # Population | % Population |
| Africa | 22 | 0.1% |
| Argentina | 41 | 0.2% |
| Asia | 157 | 0.6% |
| Canada | 12 | 0.0% |
| Caribbean | 57 | 0.2% |
| Central America | 184 | 0.6% |
| China | 75 | 0.3% |
| Cuba | 28 | 0.1% |
| Eastern Asia | 75 | 0.3% |
| Eastern Europe | 47 | 0.2% |
| Egypt | 22 | 0.1% |
| Europe | 69 | 0.2% |
| Germany | 10 | 0.0% |
| Honduras | 25 | 0.1% |
| India | 27 | 0.1% |
| Jamaica | 29 | 0.1% |
| Latin America | 282 | 1.0% |
| Mexico | 159 | 0.6% |
| Netherlands | 12 | 0.0% |
| Northern Africa | 22 | 0.1% |
| Philippines | 14 | 0.1% |
| Russia | 47 | 0.2% |
| South America | 41 | 0.2% |
| South Central Asia | 46 | 0.2% |
| South Eastern Asia | 36 | 0.1% |
| Vietnam | 22 | 0.1% |
| Western Europe | 22 | 0.1% | View All 27 Rows |
Sex and Age in Henderson
Sex and Age in Henderson
The most populous age groups in Henderson are 25 to 29 Years (1,161 | 8.7%) for men and 55 to 59 Years (1,205 | 8.1%) for women.
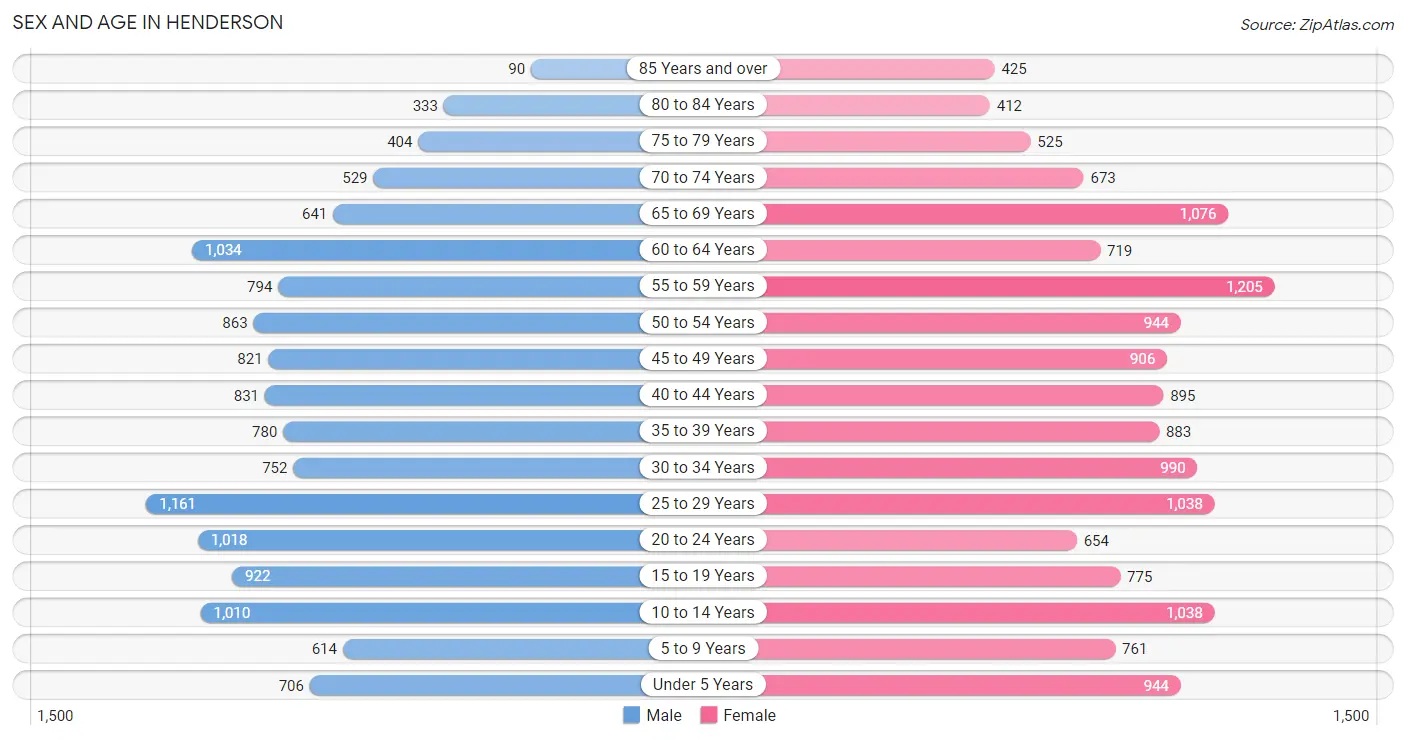
| Age Bracket | Male | Female |
| Under 5 Years | 706 (5.3%) | 944 (6.4%) |
| 5 to 9 Years | 614 (4.6%) | 761 (5.1%) |
| 10 to 14 Years | 1,010 (7.6%) | 1,038 (7.0%) |
| 15 to 19 Years | 922 (6.9%) | 775 (5.2%) |
| 20 to 24 Years | 1,018 (7.6%) | 654 (4.4%) |
| 25 to 29 Years | 1,161 (8.7%) | 1,038 (7.0%) |
| 30 to 34 Years | 752 (5.7%) | 990 (6.7%) |
| 35 to 39 Years | 780 (5.9%) | 883 (5.9%) |
| 40 to 44 Years | 831 (6.2%) | 895 (6.0%) |
| 45 to 49 Years | 821 (6.2%) | 906 (6.1%) |
| 50 to 54 Years | 863 (6.5%) | 944 (6.4%) |
| 55 to 59 Years | 794 (6.0%) | 1,205 (8.1%) |
| 60 to 64 Years | 1,034 (7.8%) | 719 (4.8%) |
| 65 to 69 Years | 641 (4.8%) | 1,076 (7.2%) |
| 70 to 74 Years | 529 (4.0%) | 673 (4.5%) |
| 75 to 79 Years | 404 (3.0%) | 525 (3.5%) |
| 80 to 84 Years | 333 (2.5%) | 412 (2.8%) |
| 85 Years and over | 90 (0.7%) | 425 (2.9%) |
| Total | 13,303 (100.0%) | 14,863 (100.0%) |
Families and Households in Henderson
Median Family Size in Henderson
The median family size in Henderson is 2.92 persons per family, with single female/mother families (1,501 | 21.0%) accounting for the largest median family size of 3.22 persons per family. On the other hand, single male/father families (528 | 7.4%) represent the smallest median family size with 2.61 persons per family.
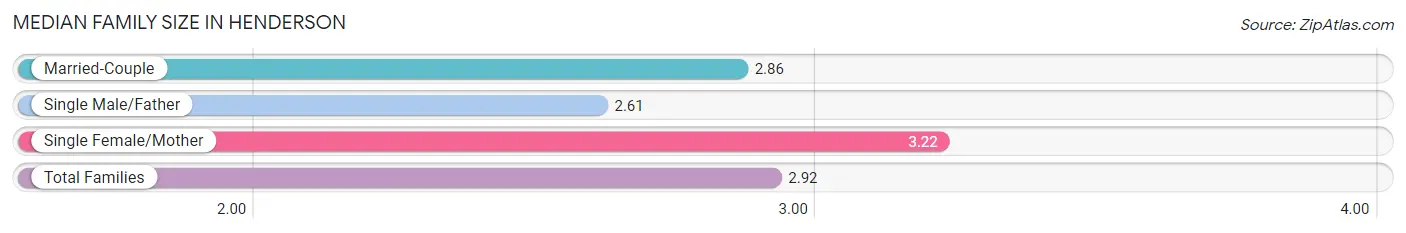
| Family Type | # Families | Family Size |
| Married-Couple | 5,119 (71.6%) | 2.86 |
| Single Male/Father | 528 (7.4%) | 2.61 |
| Single Female/Mother | 1,501 (21.0%) | 3.22 |
| Total Families | 7,148 (100.0%) | 2.92 |
Median Household Size in Henderson
The median household size in Henderson is 2.22 persons per household, with single female/mother households (1,501 | 12.4%) accounting for the largest median household size of 3.37 persons per household. non-family households (4,985 | 41.1%) represent the smallest median household size with 1.14 persons per household.
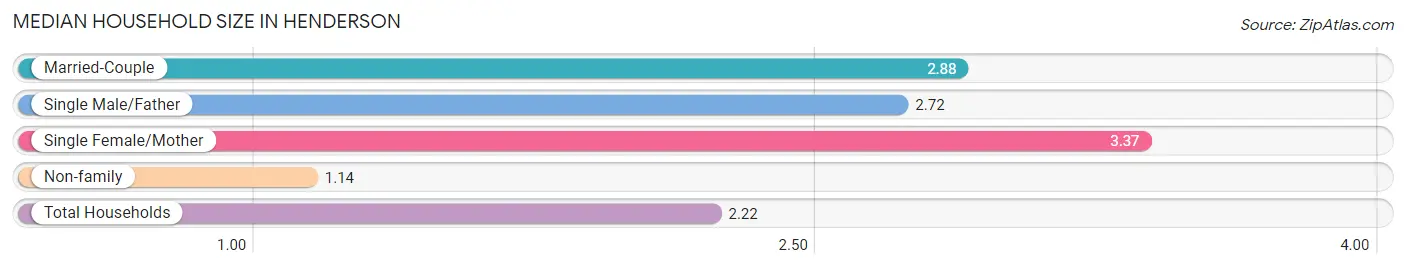
| Household Type | # Households | Household Size |
| Married-Couple | 5,119 (42.2%) | 2.88 |
| Single Male/Father | 528 (4.3%) | 2.72 |
| Single Female/Mother | 1,501 (12.4%) | 3.37 |
| Non-family | 4,985 (41.1%) | 1.14 |
| Total Households | 12,133 (100.0%) | 2.22 |
Household Size by Marriage Status in Henderson
Out of a total of 12,133 households in Henderson, 7,148 (58.9%) are family households, while 4,985 (41.1%) are nonfamily households. The most numerous type of family households are 2-person households, comprising 3,542, and the most common type of nonfamily households are 1-person households, comprising 4,483.
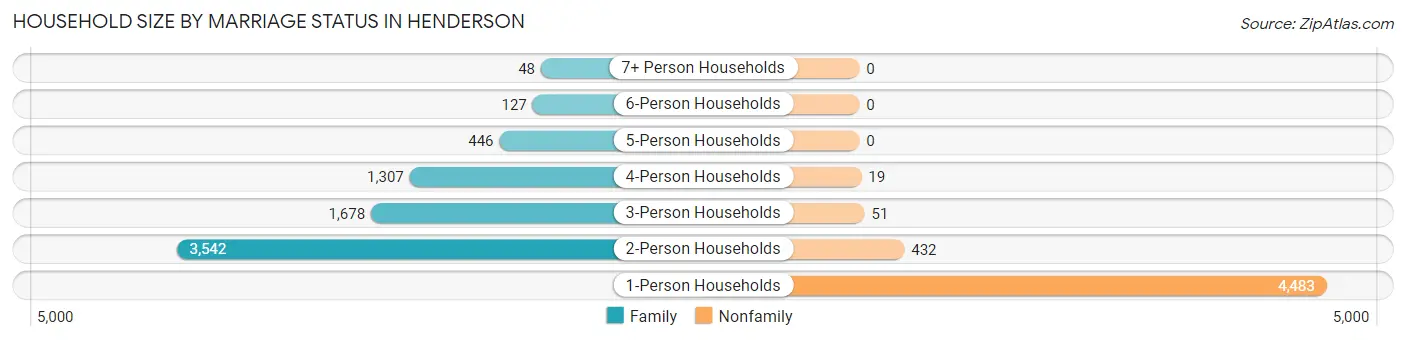
| Household Size | Family Households | Nonfamily Households |
| 1-Person Households | - | 4,483 (36.9%) |
| 2-Person Households | 3,542 (29.2%) | 432 (3.6%) |
| 3-Person Households | 1,678 (13.8%) | 51 (0.4%) |
| 4-Person Households | 1,307 (10.8%) | 19 (0.2%) |
| 5-Person Households | 446 (3.7%) | 0 (0.0%) |
| 6-Person Households | 127 (1.1%) | 0 (0.0%) |
| 7+ Person Households | 48 (0.4%) | 0 (0.0%) |
| Total | 7,148 (58.9%) | 4,985 (41.1%) |
Female Fertility in Henderson
Fertility by Age in Henderson
Average fertility rate in Henderson is 45.0 births per 1,000 women. Women in the age bracket of 20 to 34 years have the highest fertility rate with 76.0 births per 1,000 women. Women in the age bracket of 20 to 34 years acount for 72.1% of all women with births.
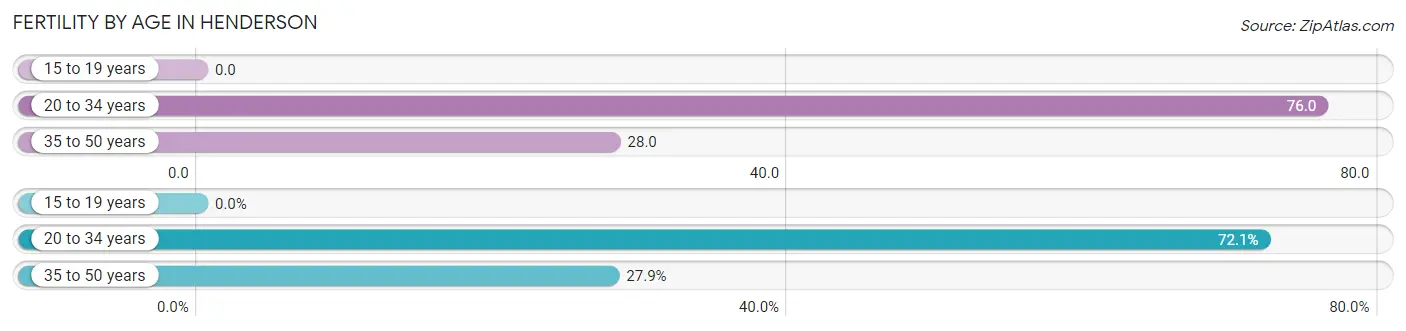
| Age Bracket | Women with Births | Births / 1,000 Women |
| 15 to 19 years | 0 (0.0%) | 0.0 |
| 20 to 34 years | 204 (72.1%) | 76.0 |
| 35 to 50 years | 79 (27.9%) | 28.0 |
| Total | 283 (100.0%) | 45.0 |
Fertility by Age by Marriage Status in Henderson
59.7% of women with births (283) in Henderson are married. The highest percentage of unmarried women with births falls into 35 to 50 years age bracket with 70.9% of them unmarried at the time of birth, while the lowest percentage of unmarried women with births belong to 20 to 34 years age bracket with 28.4% of them unmarried.
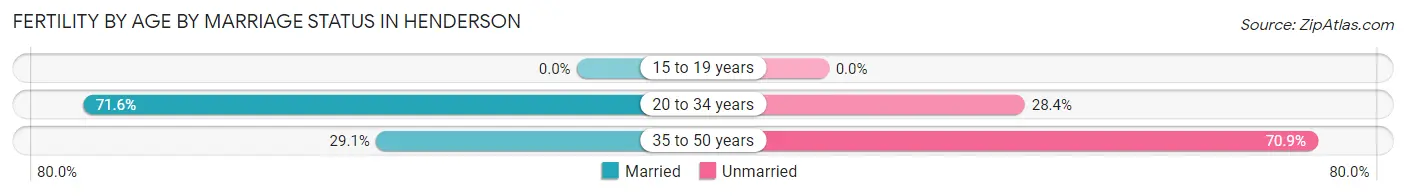
| Age Bracket | Married | Unmarried |
| 15 to 19 years | 0 (0.0%) | 0 (0.0%) |
| 20 to 34 years | 146 (71.6%) | 58 (28.4%) |
| 35 to 50 years | 23 (29.1%) | 56 (70.9%) |
| Total | 169 (59.7%) | 114 (40.3%) |
Fertility by Education in Henderson
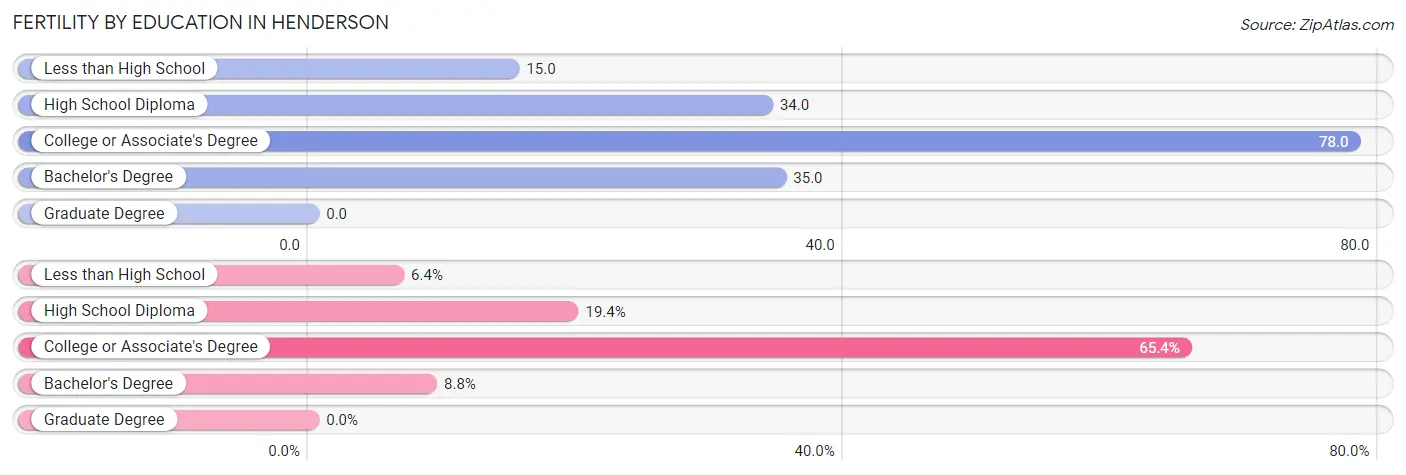
| Educational Attainment | Women with Births | Births / 1,000 Women |
| Less than High School | 18 (6.4%) | 15.0 |
| High School Diploma | 55 (19.4%) | 34.0 |
| College or Associate's Degree | 185 (65.4%) | 78.0 |
| Bachelor's Degree | 25 (8.8%) | 35.0 |
| Graduate Degree | 0 (0.0%) | 0.0 |
| Total | 283 (100.0%) | 45.0 |
Fertility by Education by Marriage Status in Henderson
40.3% of women with births in Henderson are unmarried. Women with the educational attainment of college or associate's degree are most likely to be married with 76.2% of them married at childbirth, while women with the educational attainment of less than high school are least likely to be married with 100.0% of them unmarried at childbirth.
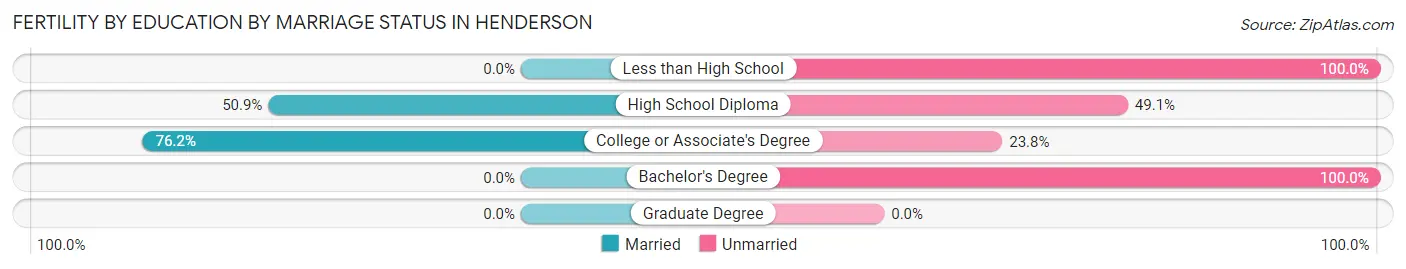
| Educational Attainment | Married | Unmarried |
| Less than High School | 0 (0.0%) | 18 (100.0%) |
| High School Diploma | 28 (50.9%) | 27 (49.1%) |
| College or Associate's Degree | 141 (76.2%) | 44 (23.8%) |
| Bachelor's Degree | 0 (0.0%) | 25 (100.0%) |
| Graduate Degree | 0 (0.0%) | 0 (0.0%) |
| Total | 169 (59.7%) | 114 (40.3%) |
Employment Characteristics in Henderson
Employment by Class of Employer in Henderson
Among the 12,116 employed individuals in Henderson, private company employees (8,703 | 71.8%), local government employees (1,094 | 9.0%), and not-for-profit organizations (871 | 7.2%) make up the most common classes of employment.
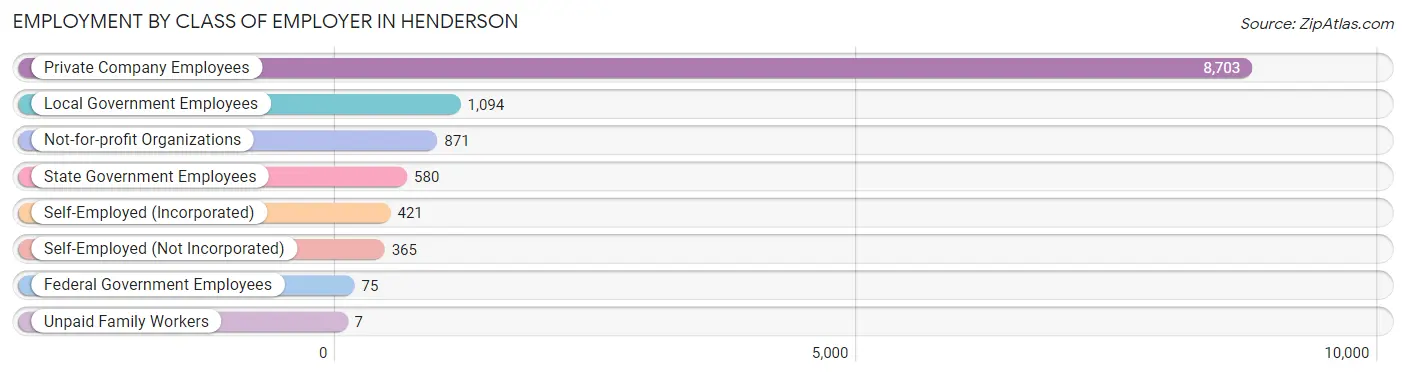
| Employer Class | # Employees | % Employees |
| Private Company Employees | 8,703 | 71.8% |
| Self-Employed (Incorporated) | 421 | 3.5% |
| Self-Employed (Not Incorporated) | 365 | 3.0% |
| Not-for-profit Organizations | 871 | 7.2% |
| Local Government Employees | 1,094 | 9.0% |
| State Government Employees | 580 | 4.8% |
| Federal Government Employees | 75 | 0.6% |
| Unpaid Family Workers | 7 | 0.1% |
| Total | 12,116 | 100.0% |
Employment Status by Age in Henderson
According to the labor force statistics for Henderson, out of the total population over 16 years of age (22,803), 55.8% or 12,724 individuals are in the labor force, with 3.3% or 420 of them unemployed. The age group with the highest labor force participation rate is 20 to 24 years, with 77.5% or 1,296 individuals in the labor force. Within the labor force, the 16 to 19 years age range has the highest percentage of unemployed individuals, with 11.0% or 60 of them being unemployed.
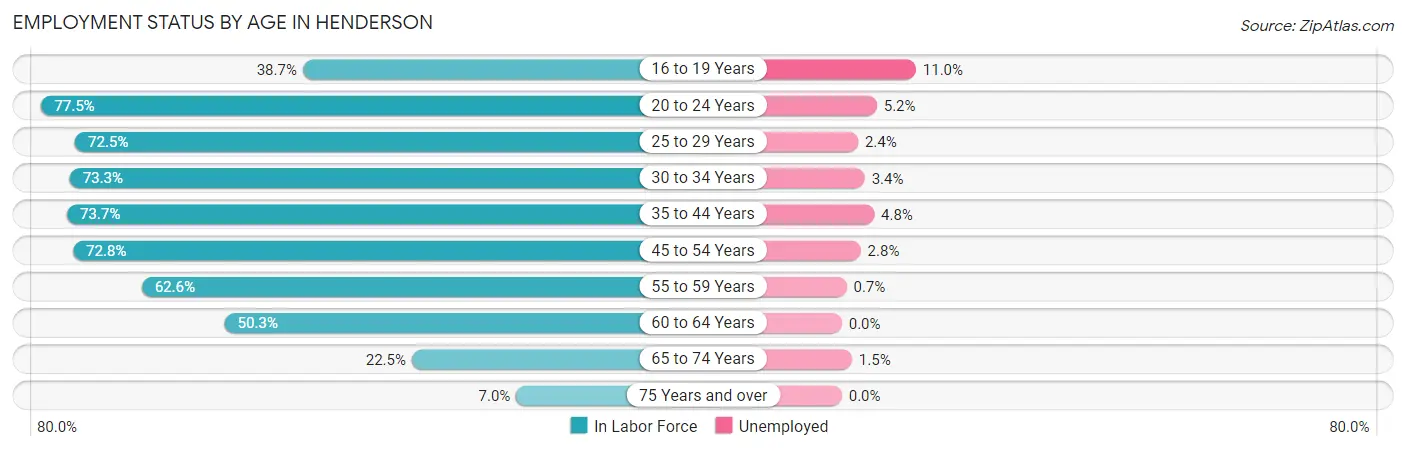
| Age Bracket | In Labor Force | Unemployed |
| 16 to 19 Years | 545 (38.7%) | 60 (11.0%) |
| 20 to 24 Years | 1,296 (77.5%) | 67 (5.2%) |
| 25 to 29 Years | 1,594 (72.5%) | 38 (2.4%) |
| 30 to 34 Years | 1,277 (73.3%) | 43 (3.4%) |
| 35 to 44 Years | 2,498 (73.7%) | 120 (4.8%) |
| 45 to 54 Years | 2,573 (72.8%) | 72 (2.8%) |
| 55 to 59 Years | 1,251 (62.6%) | 9 (0.7%) |
| 60 to 64 Years | 882 (50.3%) | 0 (0.0%) |
| 65 to 74 Years | 657 (22.5%) | 10 (1.5%) |
| 75 Years and over | 153 (7.0%) | 0 (0.0%) |
| Total | 12,724 (55.8%) | 420 (3.3%) |
Employment Status by Educational Attainment in Henderson
According to labor force statistics for Henderson, 68.9% of individuals (10,070) out of the total population between 25 and 64 years of age (14,616) are in the labor force, with 2.8% or 282 of them being unemployed. The group with the highest labor force participation rate are those with the educational attainment of bachelor's degree or higher, with 92.2% or 2,443 individuals in the labor force. Within the labor force, individuals with less than high school education have the highest percentage of unemployment, with 5.2% or 32 of them being unemployed.
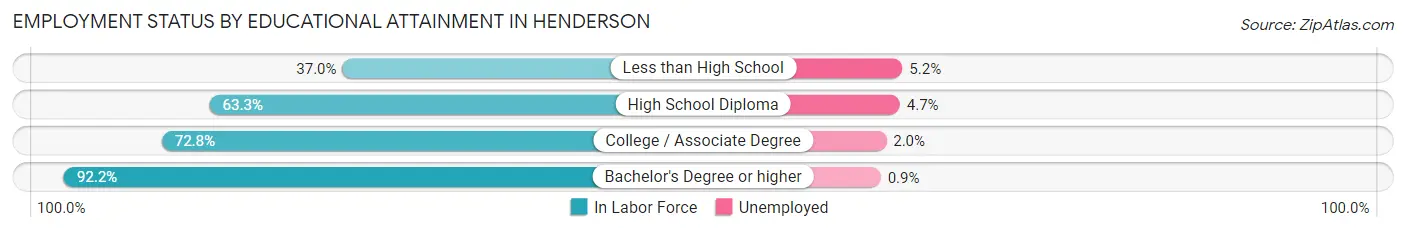
| Educational Attainment | In Labor Force | Unemployed |
| Less than High School | 615 (37.0%) | 86 (5.2%) |
| High School Diploma | 3,250 (63.3%) | 241 (4.7%) |
| College / Associate Degree | 3,763 (72.8%) | 103 (2.0%) |
| Bachelor's Degree or higher | 2,443 (92.2%) | 24 (0.9%) |
| Total | 10,070 (68.9%) | 409 (2.8%) |
Employment Occupations by Sex in Henderson
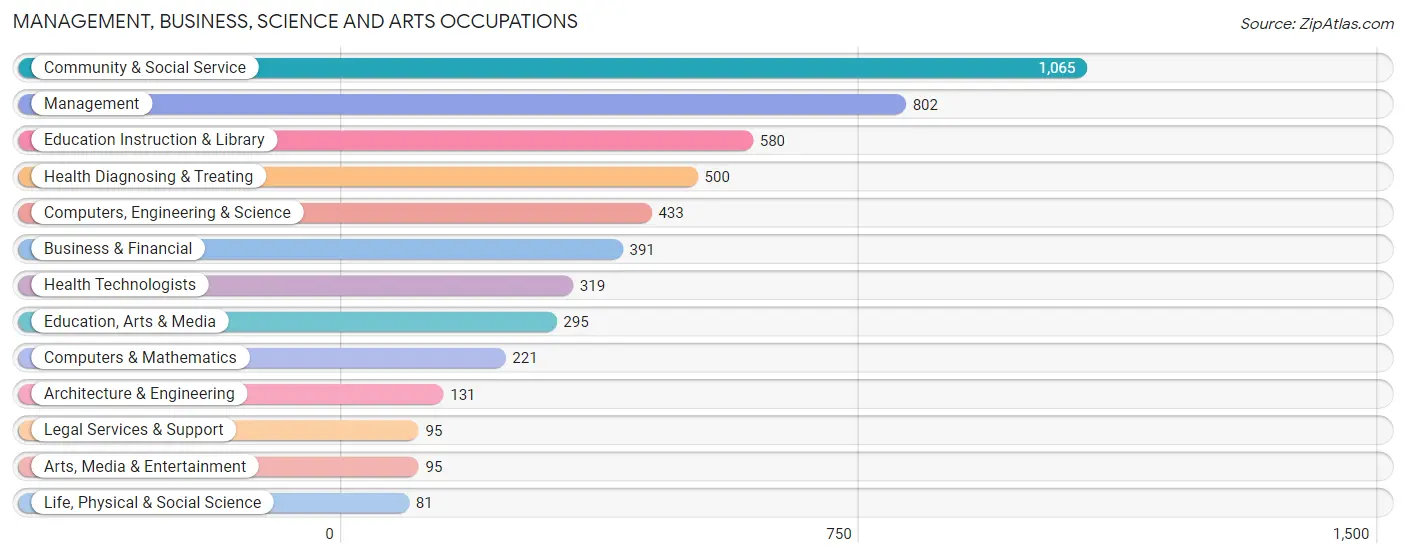
Management, Business, Science and Arts Occupations
The most common Management, Business, Science and Arts occupations in Henderson are Community & Social Service (1,065 | 8.7%), Management (802 | 6.5%), Education Instruction & Library (580 | 4.7%), Health Diagnosing & Treating (500 | 4.1%), and Computers, Engineering & Science (433 | 3.5%).
Management, Business, Science and Arts Occupations by Sex
Within the Management, Business, Science and Arts occupations in Henderson, the most male-oriented occupations are Computers & Mathematics (77.4%), Arts, Media & Entertainment (71.6%), and Computers, Engineering & Science (64.7%), while the most female-oriented occupations are Health Technologists (98.1%), Health Diagnosing & Treating (90.2%), and Business & Financial (80.8%).
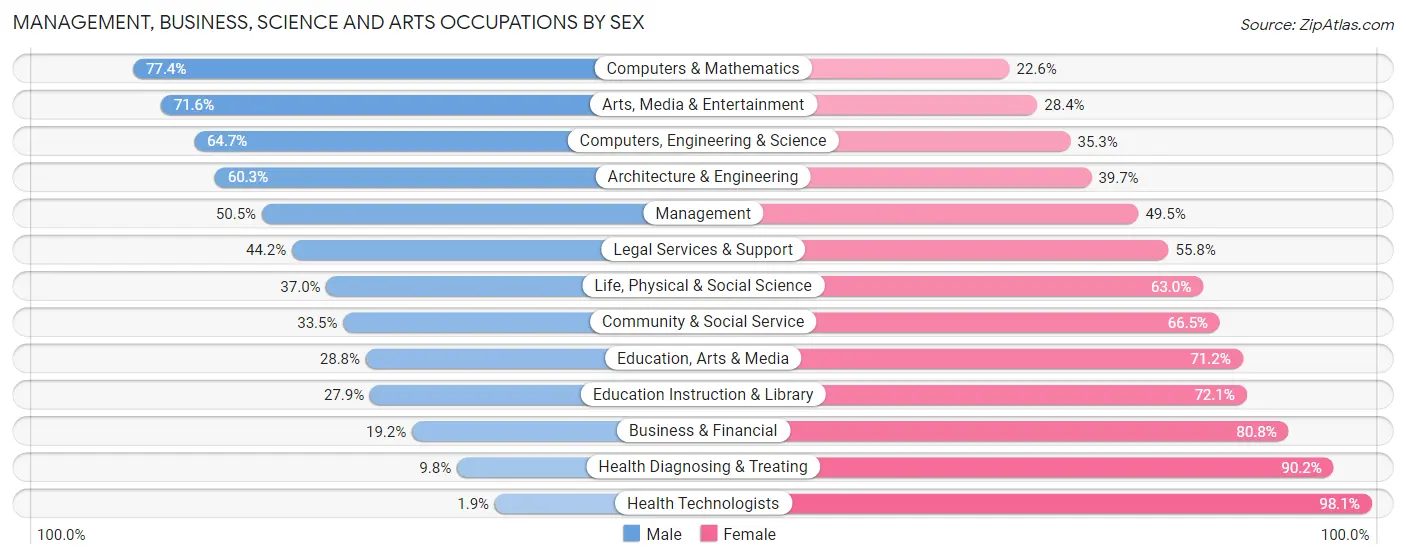
| Occupation | Male | Female |
| Management | 405 (50.5%) | 397 (49.5%) |
| Business & Financial | 75 (19.2%) | 316 (80.8%) |
| Computers, Engineering & Science | 280 (64.7%) | 153 (35.3%) |
| Computers & Mathematics | 171 (77.4%) | 50 (22.6%) |
| Architecture & Engineering | 79 (60.3%) | 52 (39.7%) |
| Life, Physical & Social Science | 30 (37.0%) | 51 (63.0%) |
| Community & Social Service | 357 (33.5%) | 708 (66.5%) |
| Education, Arts & Media | 85 (28.8%) | 210 (71.2%) |
| Legal Services & Support | 42 (44.2%) | 53 (55.8%) |
| Education Instruction & Library | 162 (27.9%) | 418 (72.1%) |
| Arts, Media & Entertainment | 68 (71.6%) | 27 (28.4%) |
| Health Diagnosing & Treating | 49 (9.8%) | 451 (90.2%) |
| Health Technologists | 6 (1.9%) | 313 (98.1%) |
| Total (Category) | 1,166 (36.5%) | 2,025 (63.5%) |
| Total (Overall) | 6,512 (53.0%) | 5,771 (47.0%) |
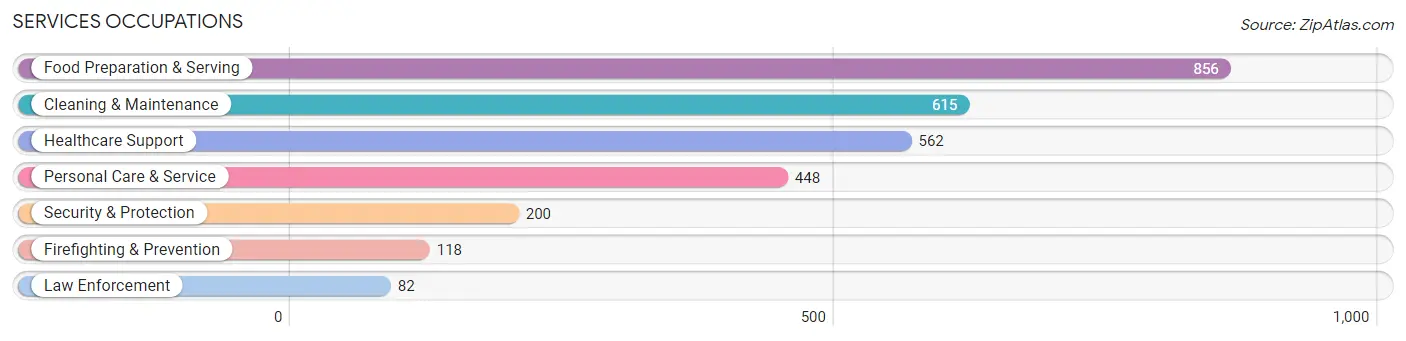
Services Occupations
The most common Services occupations in Henderson are Food Preparation & Serving (856 | 7.0%), Cleaning & Maintenance (615 | 5.0%), Healthcare Support (562 | 4.6%), Personal Care & Service (448 | 3.6%), and Security & Protection (200 | 1.6%).
Services Occupations by Sex
Within the Services occupations in Henderson, the most male-oriented occupations are Firefighting & Prevention (78.0%), Cleaning & Maintenance (77.6%), and Security & Protection (73.5%), while the most female-oriented occupations are Healthcare Support (96.3%), Food Preparation & Serving (75.9%), and Personal Care & Service (59.6%).
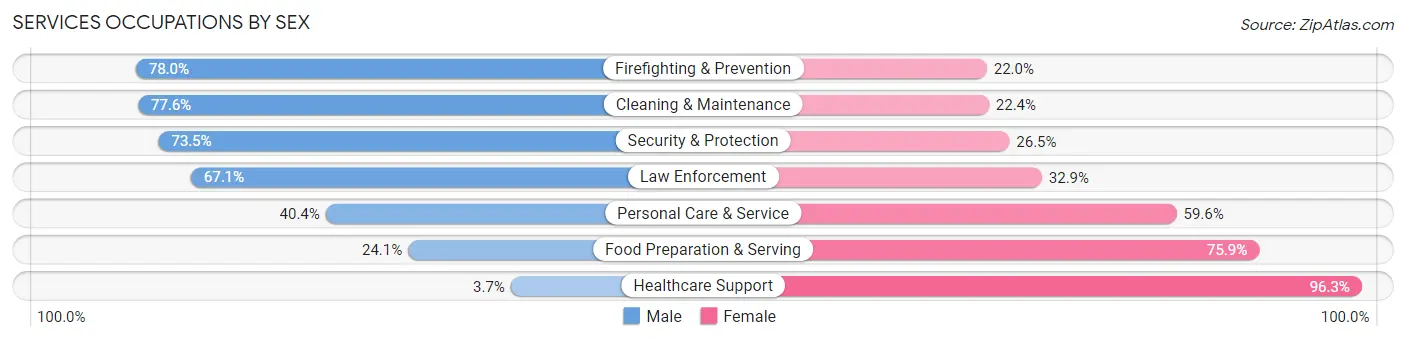
| Occupation | Male | Female |
| Healthcare Support | 21 (3.7%) | 541 (96.3%) |
| Security & Protection | 147 (73.5%) | 53 (26.5%) |
| Firefighting & Prevention | 92 (78.0%) | 26 (22.0%) |
| Law Enforcement | 55 (67.1%) | 27 (32.9%) |
| Food Preparation & Serving | 206 (24.1%) | 650 (75.9%) |
| Cleaning & Maintenance | 477 (77.6%) | 138 (22.4%) |
| Personal Care & Service | 181 (40.4%) | 267 (59.6%) |
| Total (Category) | 1,032 (38.5%) | 1,649 (61.5%) |
| Total (Overall) | 6,512 (53.0%) | 5,771 (47.0%) |
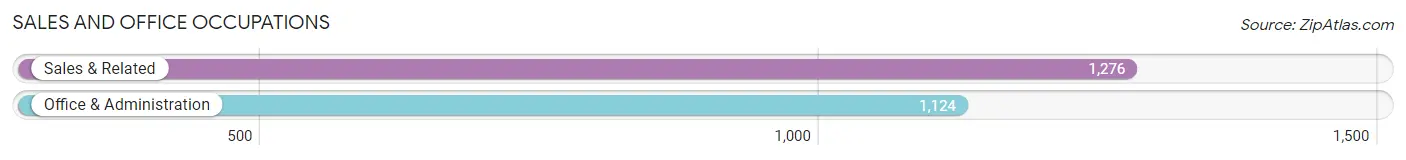
Sales and Office Occupations
The most common Sales and Office occupations in Henderson are Sales & Related (1,276 | 10.4%), and Office & Administration (1,124 | 9.1%).
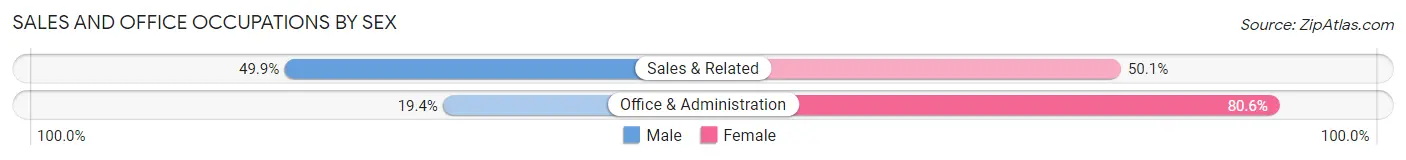
Sales and Office Occupations by Sex
| Occupation | Male | Female |
| Sales & Related | 637 (49.9%) | 639 (50.1%) |
| Office & Administration | 218 (19.4%) | 906 (80.6%) |
| Total (Category) | 855 (35.6%) | 1,545 (64.4%) |
| Total (Overall) | 6,512 (53.0%) | 5,771 (47.0%) |
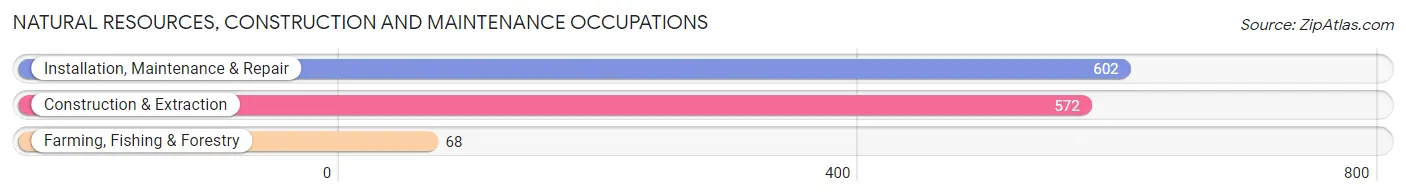
Natural Resources, Construction and Maintenance Occupations
The most common Natural Resources, Construction and Maintenance occupations in Henderson are Installation, Maintenance & Repair (602 | 4.9%), Construction & Extraction (572 | 4.7%), and Farming, Fishing & Forestry (68 | 0.5%).
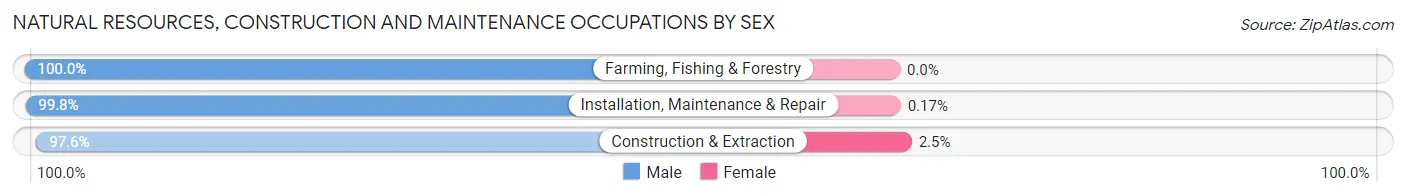
Natural Resources, Construction and Maintenance Occupations by Sex
| Occupation | Male | Female |
| Farming, Fishing & Forestry | 68 (100.0%) | 0 (0.0%) |
| Construction & Extraction | 558 (97.6%) | 14 (2.5%) |
| Installation, Maintenance & Repair | 601 (99.8%) | 1 (0.2%) |
| Total (Category) | 1,227 (98.8%) | 15 (1.2%) |
| Total (Overall) | 6,512 (53.0%) | 5,771 (47.0%) |
Production, Transportation and Moving Occupations
The most common Production, Transportation and Moving occupations in Henderson are Production (1,588 | 12.9%), Material Moving (634 | 5.2%), and Transportation (547 | 4.4%).
Production, Transportation and Moving Occupations by Sex
| Occupation | Male | Female |
| Production | 1,268 (79.8%) | 320 (20.2%) |
| Transportation | 456 (83.4%) | 91 (16.6%) |
| Material Moving | 508 (80.1%) | 126 (19.9%) |
| Total (Category) | 2,232 (80.6%) | 537 (19.4%) |
| Total (Overall) | 6,512 (53.0%) | 5,771 (47.0%) |
Employment Industries by Sex in Henderson
Employment Industries in Henderson
The major employment industries in Henderson include Manufacturing (2,367 | 19.3%), Health Care & Social Assistance (1,712 | 13.9%), Retail Trade (1,344 | 10.9%), Accommodation & Food Services (1,059 | 8.6%), and Educational Services (972 | 7.9%).
Employment Industries by Sex in Henderson
The Henderson industries that see more men than women are Agriculture, Fishing & Hunting (100.0%), Mining, Quarrying, & Extraction (100.0%), and Enterprise Management (100.0%), whereas the industries that tend to have a higher number of women are Health Care & Social Assistance (83.9%), Finance & Insurance (75.2%), and Arts, Entertainment & Recreation (75.2%).
| Industry | Male | Female |
| Agriculture, Fishing & Hunting | 55 (100.0%) | 0 (0.0%) |
| Mining, Quarrying, & Extraction | 89 (100.0%) | 0 (0.0%) |
| Construction | 695 (93.9%) | 45 (6.1%) |
| Manufacturing | 1,873 (79.1%) | 494 (20.9%) |
| Wholesale Trade | 132 (90.4%) | 14 (9.6%) |
| Retail Trade | 552 (41.1%) | 792 (58.9%) |
| Transportation & Warehousing | 463 (80.5%) | 112 (19.5%) |
| Utilities | 289 (84.3%) | 54 (15.7%) |
| Information | 68 (55.3%) | 55 (44.7%) |
| Finance & Insurance | 115 (24.8%) | 349 (75.2%) |
| Real Estate, Rental & Leasing | 97 (51.3%) | 92 (48.7%) |
| Professional & Scientific | 119 (42.3%) | 162 (57.7%) |
| Enterprise Management | 18 (100.0%) | 0 (0.0%) |
| Administrative & Support | 406 (79.0%) | 108 (21.0%) |
| Educational Services | 300 (30.9%) | 672 (69.1%) |
| Health Care & Social Assistance | 275 (16.1%) | 1,437 (83.9%) |
| Arts, Entertainment & Recreation | 56 (24.8%) | 170 (75.2%) |
| Accommodation & Food Services | 387 (36.5%) | 672 (63.5%) |
| Public Administration | 187 (35.1%) | 345 (64.8%) |
| Total | 6,512 (53.0%) | 5,771 (47.0%) |
Education in Henderson
School Enrollment in Henderson
The most common levels of schooling among the 5,771 students in Henderson are middle school (1,736 | 30.1%), high school (1,463 | 25.4%), and elementary school (1,089 | 18.9%).
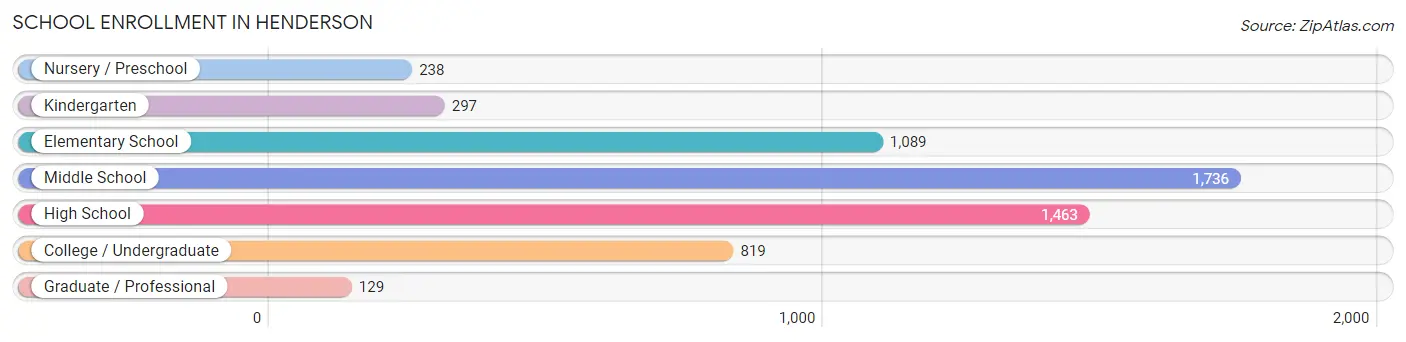
| School Level | # Students | % Students |
| Nursery / Preschool | 238 | 4.1% |
| Kindergarten | 297 | 5.1% |
| Elementary School | 1,089 | 18.9% |
| Middle School | 1,736 | 30.1% |
| High School | 1,463 | 25.4% |
| College / Undergraduate | 819 | 14.2% |
| Graduate / Professional | 129 | 2.2% |
| Total | 5,771 | 100.0% |
School Enrollment by Age by Funding Source in Henderson
Out of a total of 5,771 students who are enrolled in schools in Henderson, 693 (12.0%) attend a private institution, while the remaining 5,078 (88.0%) are enrolled in public schools. The age group of 35 years and over has the highest likelihood of being enrolled in private schools, with 43 (18.9% in the age bracket) enrolled. Conversely, the age group of 18 to 19 year olds has the lowest likelihood of being enrolled in a private school, with 361 (100.0% in the age bracket) attending a public institution.
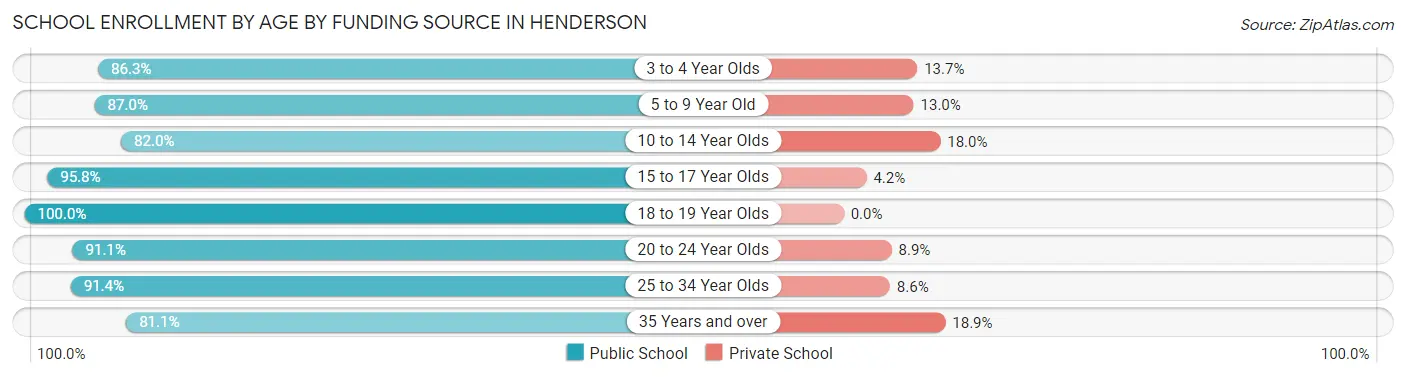
| Age Bracket | Public School | Private School |
| 3 to 4 Year Olds | 126 (86.3%) | 20 (13.7%) |
| 5 to 9 Year Old | 1,088 (87.0%) | 163 (13.0%) |
| 10 to 14 Year Olds | 1,641 (82.0%) | 360 (18.0%) |
| 15 to 17 Year Olds | 1,108 (95.8%) | 49 (4.2%) |
| 18 to 19 Year Olds | 361 (100.0%) | 0 (0.0%) |
| 20 to 24 Year Olds | 265 (91.1%) | 26 (8.9%) |
| 25 to 34 Year Olds | 308 (91.4%) | 29 (8.6%) |
| 35 Years and over | 184 (81.1%) | 43 (18.9%) |
| Total | 5,078 (88.0%) | 693 (12.0%) |
Educational Attainment by Field of Study in Henderson
Business (933 | 23.3%), education (629 | 15.7%), science & technology (448 | 11.2%), arts & humanities (304 | 7.6%), and bio, nature & agricultural (262 | 6.5%) are the most common fields of study among 4,006 individuals in Henderson who have obtained a bachelor's degree or higher.
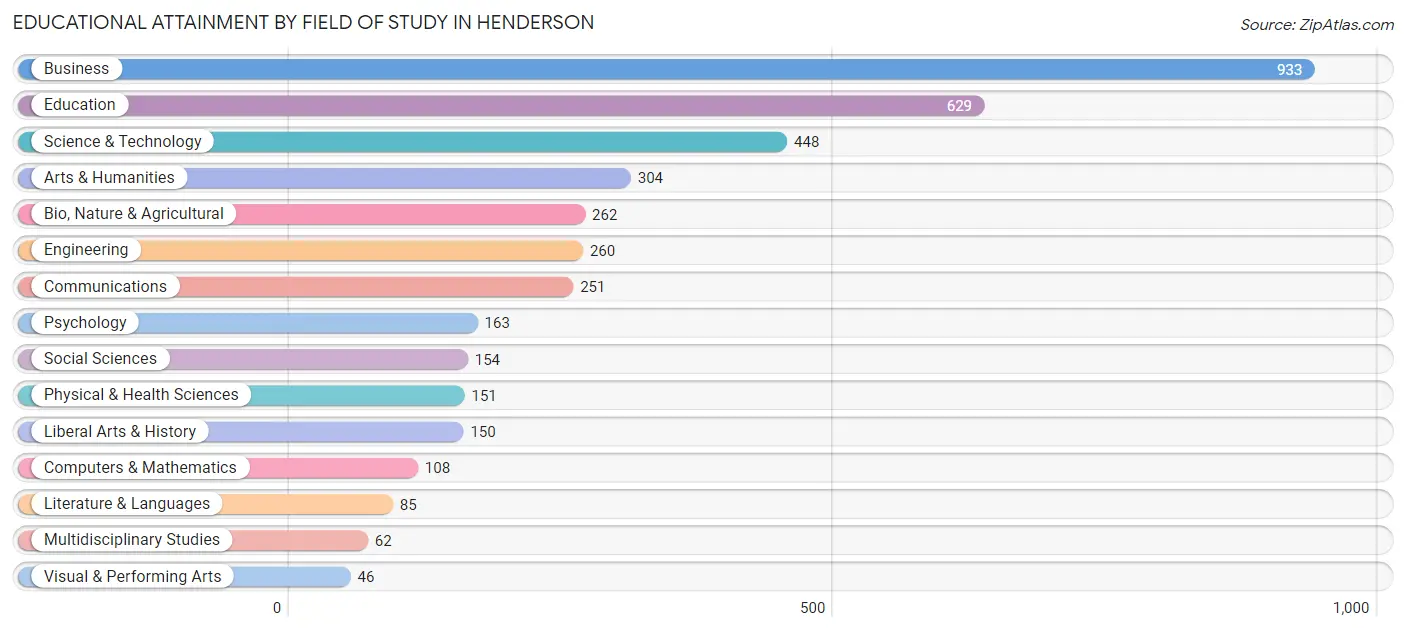
| Field of Study | # Graduates | % Graduates |
| Computers & Mathematics | 108 | 2.7% |
| Bio, Nature & Agricultural | 262 | 6.5% |
| Physical & Health Sciences | 151 | 3.8% |
| Psychology | 163 | 4.1% |
| Social Sciences | 154 | 3.8% |
| Engineering | 260 | 6.5% |
| Multidisciplinary Studies | 62 | 1.5% |
| Science & Technology | 448 | 11.2% |
| Business | 933 | 23.3% |
| Education | 629 | 15.7% |
| Literature & Languages | 85 | 2.1% |
| Liberal Arts & History | 150 | 3.7% |
| Visual & Performing Arts | 46 | 1.1% |
| Communications | 251 | 6.3% |
| Arts & Humanities | 304 | 7.6% |
| Total | 4,006 | 100.0% |
Transportation & Commute in Henderson
Vehicle Availability by Sex in Henderson
The most prevalent vehicle ownership categories in Henderson are males with 2 vehicles (2,744, accounting for 42.8%) and females with 2 vehicles (2,260, making up 48.1%).
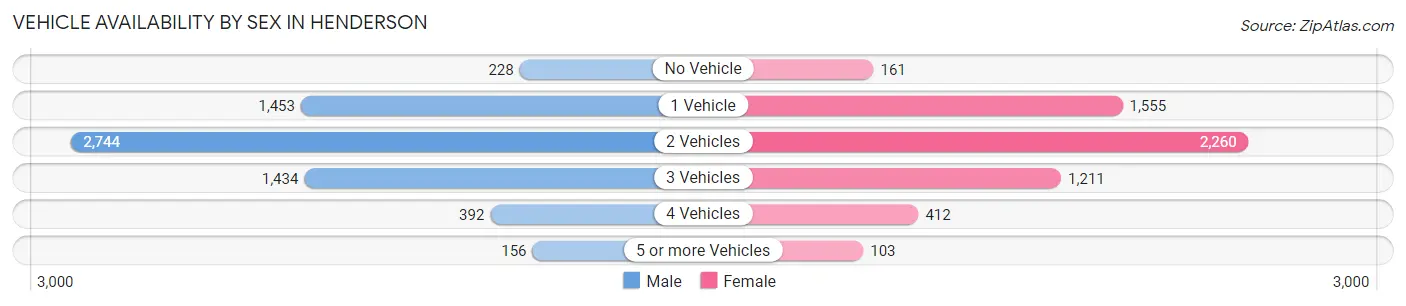
| Vehicles Available | Male | Female |
| No Vehicle | 228 (3.6%) | 161 (2.8%) |
| 1 Vehicle | 1,453 (22.7%) | 1,555 (27.3%) |
| 2 Vehicles | 2,744 (42.8%) | 2,260 (39.6%) |
| 3 Vehicles | 1,434 (22.4%) | 1,211 (21.2%) |
| 4 Vehicles | 392 (6.1%) | 412 (7.2%) |
| 5 or more Vehicles | 156 (2.4%) | 103 (1.8%) |
| Total | 6,407 (100.0%) | 5,702 (100.0%) |
Commute Time in Henderson
The most frequently occuring commute durations in Henderson are 10 to 14 minutes (2,337 commuters, 20.2%), 5 to 9 minutes (2,195 commuters, 19.0%), and 20 to 24 minutes (1,836 commuters, 15.9%).
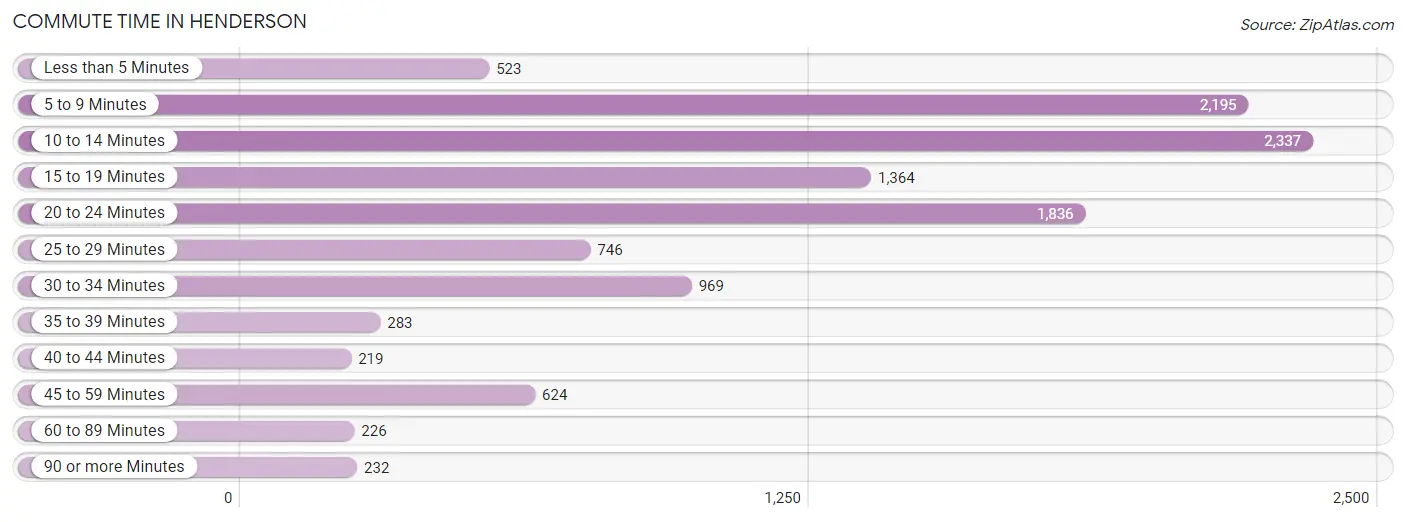
| Commute Time | # Commuters | % Commuters |
| Less than 5 Minutes | 523 | 4.5% |
| 5 to 9 Minutes | 2,195 | 19.0% |
| 10 to 14 Minutes | 2,337 | 20.2% |
| 15 to 19 Minutes | 1,364 | 11.8% |
| 20 to 24 Minutes | 1,836 | 15.9% |
| 25 to 29 Minutes | 746 | 6.5% |
| 30 to 34 Minutes | 969 | 8.4% |
| 35 to 39 Minutes | 283 | 2.5% |
| 40 to 44 Minutes | 219 | 1.9% |
| 45 to 59 Minutes | 624 | 5.4% |
| 60 to 89 Minutes | 226 | 2.0% |
| 90 or more Minutes | 232 | 2.0% |
Commute Time by Sex in Henderson
The most common commute times in Henderson are 10 to 14 minutes (1,127 commuters, 18.3%) for males and 10 to 14 minutes (1,210 commuters, 22.4%) for females.
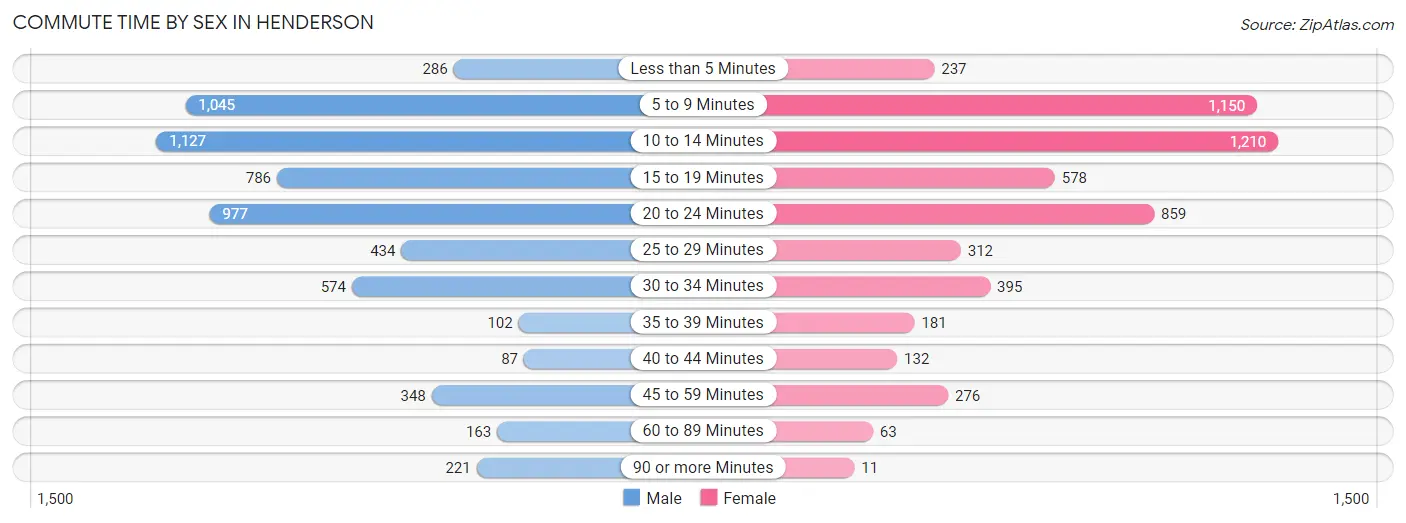
| Commute Time | Male | Female |
| Less than 5 Minutes | 286 (4.6%) | 237 (4.4%) |
| 5 to 9 Minutes | 1,045 (17.0%) | 1,150 (21.3%) |
| 10 to 14 Minutes | 1,127 (18.3%) | 1,210 (22.4%) |
| 15 to 19 Minutes | 786 (12.8%) | 578 (10.7%) |
| 20 to 24 Minutes | 977 (15.9%) | 859 (15.9%) |
| 25 to 29 Minutes | 434 (7.1%) | 312 (5.8%) |
| 30 to 34 Minutes | 574 (9.3%) | 395 (7.3%) |
| 35 to 39 Minutes | 102 (1.7%) | 181 (3.4%) |
| 40 to 44 Minutes | 87 (1.4%) | 132 (2.4%) |
| 45 to 59 Minutes | 348 (5.7%) | 276 (5.1%) |
| 60 to 89 Minutes | 163 (2.6%) | 63 (1.2%) |
| 90 or more Minutes | 221 (3.6%) | 11 (0.2%) |
Time of Departure to Work by Sex in Henderson
The most frequent times of departure to work in Henderson are 4:00 PM to 11:59 PM (969, 15.8%) for males and 7:00 AM to 7:29 AM (1,018, 18.8%) for females.
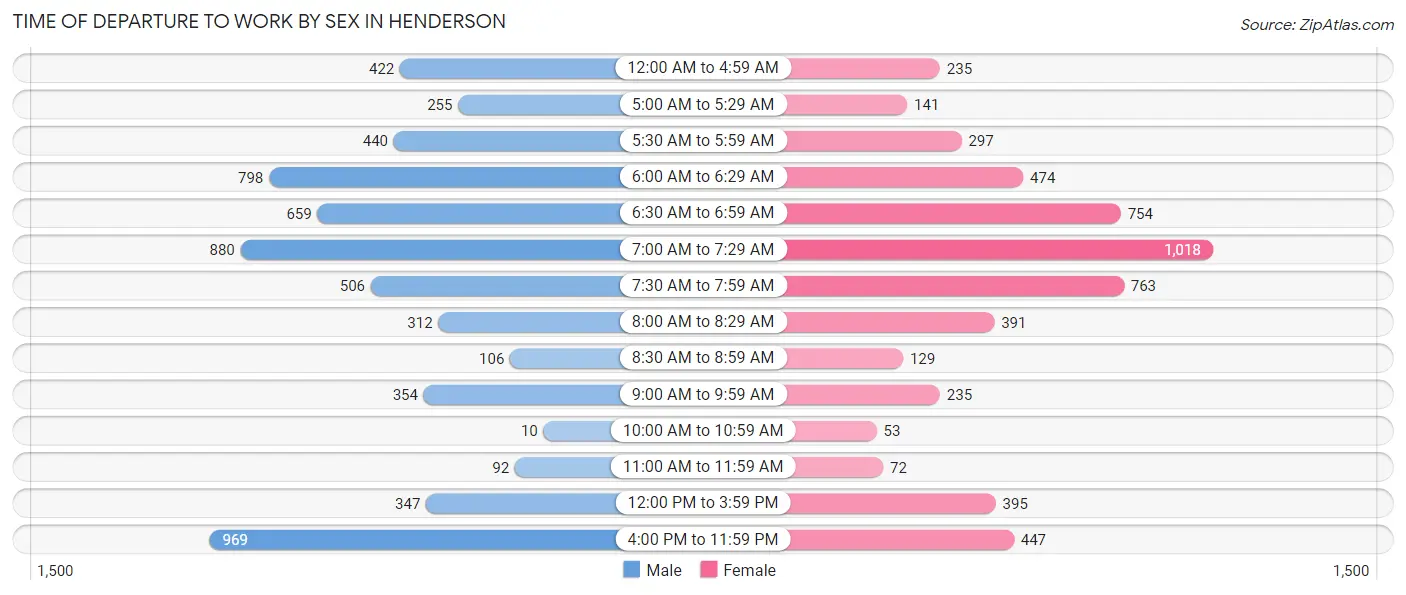
| Time of Departure | Male | Female |
| 12:00 AM to 4:59 AM | 422 (6.9%) | 235 (4.3%) |
| 5:00 AM to 5:29 AM | 255 (4.2%) | 141 (2.6%) |
| 5:30 AM to 5:59 AM | 440 (7.1%) | 297 (5.5%) |
| 6:00 AM to 6:29 AM | 798 (13.0%) | 474 (8.8%) |
| 6:30 AM to 6:59 AM | 659 (10.7%) | 754 (14.0%) |
| 7:00 AM to 7:29 AM | 880 (14.3%) | 1,018 (18.8%) |
| 7:30 AM to 7:59 AM | 506 (8.2%) | 763 (14.1%) |
| 8:00 AM to 8:29 AM | 312 (5.1%) | 391 (7.2%) |
| 8:30 AM to 8:59 AM | 106 (1.7%) | 129 (2.4%) |
| 9:00 AM to 9:59 AM | 354 (5.8%) | 235 (4.3%) |
| 10:00 AM to 10:59 AM | 10 (0.2%) | 53 (1.0%) |
| 11:00 AM to 11:59 AM | 92 (1.5%) | 72 (1.3%) |
| 12:00 PM to 3:59 PM | 347 (5.6%) | 395 (7.3%) |
| 4:00 PM to 11:59 PM | 969 (15.8%) | 447 (8.3%) |
| Total | 6,150 (100.0%) | 5,404 (100.0%) |
Housing Occupancy in Henderson
Occupancy by Ownership in Henderson
Of the total 12,133 dwellings in Henderson, owner-occupied units account for 6,476 (53.4%), while renter-occupied units make up 5,657 (46.6%).
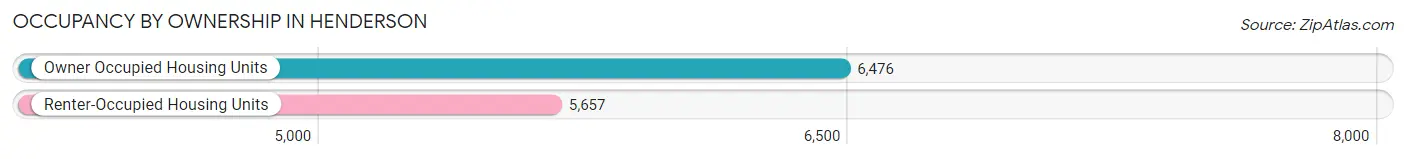
| Occupancy | # Housing Units | % Housing Units |
| Owner Occupied Housing Units | 6,476 | 53.4% |
| Renter-Occupied Housing Units | 5,657 | 46.6% |
| Total Occupied Housing Units | 12,133 | 100.0% |
Occupancy by Household Size in Henderson
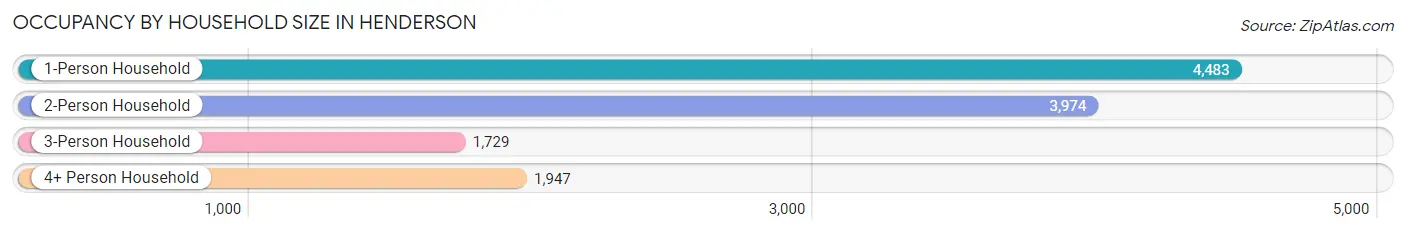
| Household Size | # Housing Units | % Housing Units |
| 1-Person Household | 4,483 | 36.9% |
| 2-Person Household | 3,974 | 32.8% |
| 3-Person Household | 1,729 | 14.2% |
| 4+ Person Household | 1,947 | 16.1% |
| Total Housing Units | 12,133 | 100.0% |
Occupancy by Ownership by Household Size in Henderson
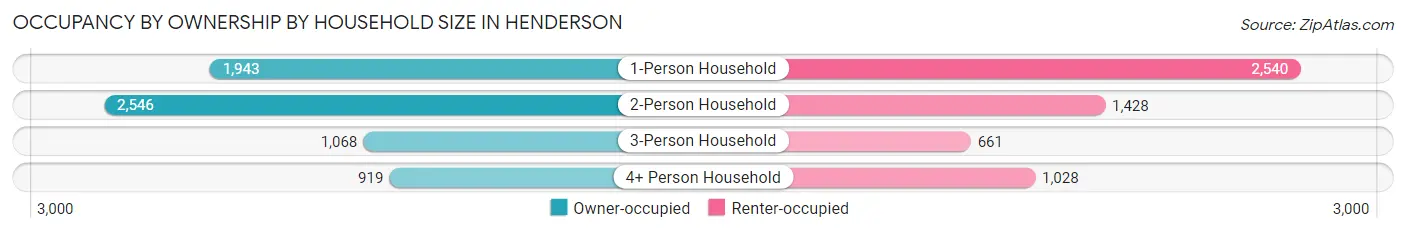
| Household Size | Owner-occupied | Renter-occupied |
| 1-Person Household | 1,943 (43.3%) | 2,540 (56.7%) |
| 2-Person Household | 2,546 (64.1%) | 1,428 (35.9%) |
| 3-Person Household | 1,068 (61.8%) | 661 (38.2%) |
| 4+ Person Household | 919 (47.2%) | 1,028 (52.8%) |
| Total Housing Units | 6,476 (53.4%) | 5,657 (46.6%) |
Occupancy by Educational Attainment in Henderson
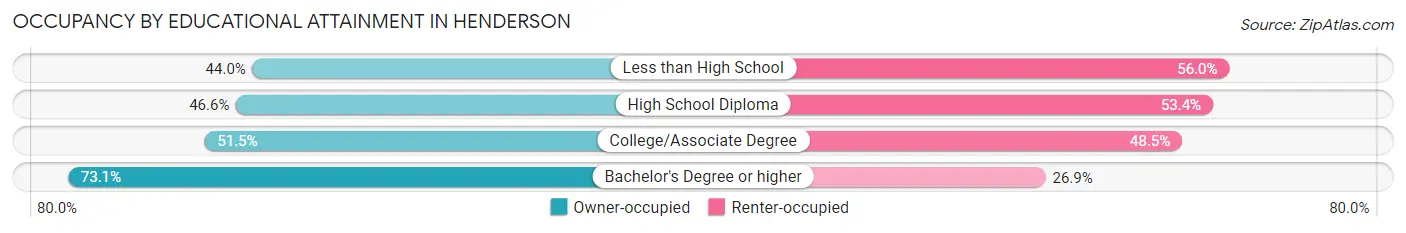
| Household Size | Owner-occupied | Renter-occupied |
| Less than High School | 593 (44.0%) | 755 (56.0%) |
| High School Diploma | 1,976 (46.6%) | 2,265 (53.4%) |
| College/Associate Degree | 2,089 (51.5%) | 1,969 (48.5%) |
| Bachelor's Degree or higher | 1,818 (73.1%) | 668 (26.9%) |
Occupancy by Age of Householder in Henderson
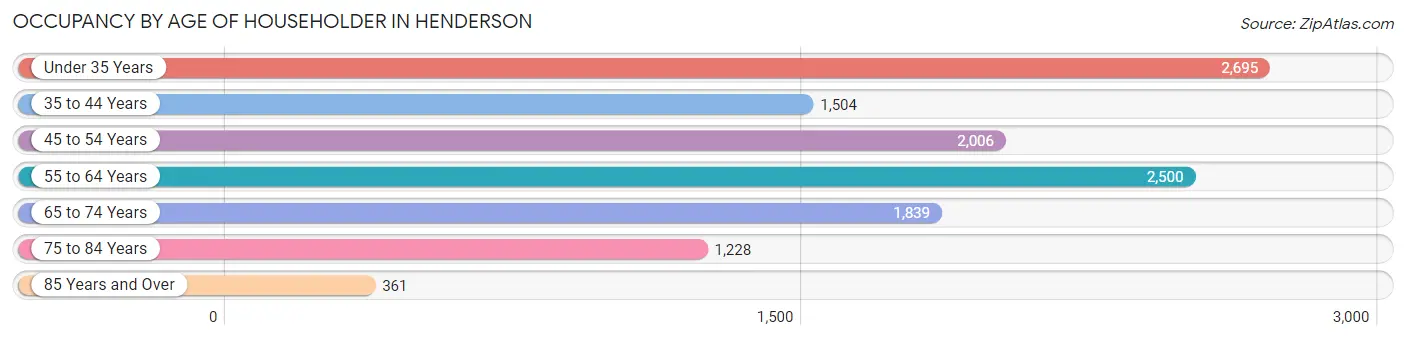
| Age Bracket | # Households | % Households |
| Under 35 Years | 2,695 | 22.2% |
| 35 to 44 Years | 1,504 | 12.4% |
| 45 to 54 Years | 2,006 | 16.5% |
| 55 to 64 Years | 2,500 | 20.6% |
| 65 to 74 Years | 1,839 | 15.2% |
| 75 to 84 Years | 1,228 | 10.1% |
| 85 Years and Over | 361 | 3.0% |
| Total | 12,133 | 100.0% |
Housing Finances in Henderson
Median Income by Occupancy in Henderson
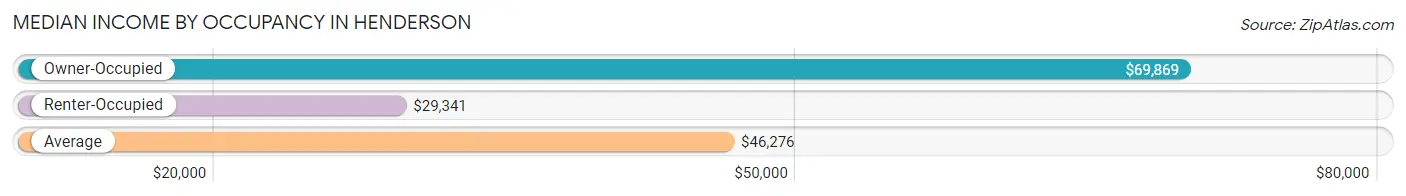
| Occupancy Type | # Households | Median Income |
| Owner-Occupied | 6,476 (53.4%) | $69,869 |
| Renter-Occupied | 5,657 (46.6%) | $29,341 |
| Average | 12,133 (100.0%) | $46,276 |
Occupancy by Householder Income Bracket in Henderson
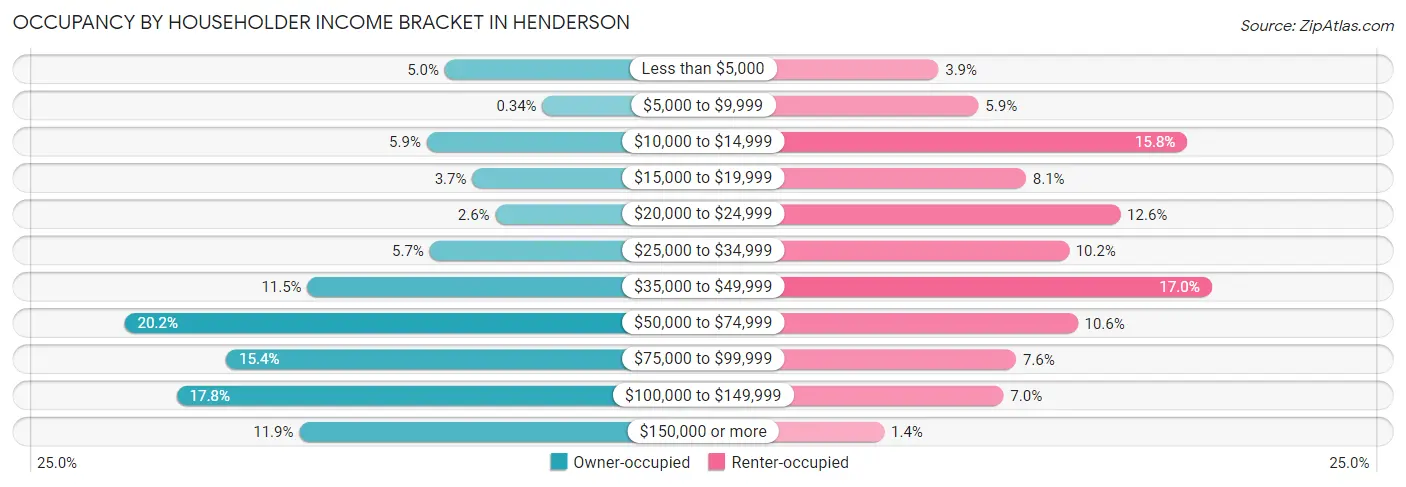
| Income Bracket | Owner-occupied | Renter-occupied |
| Less than $5,000 | 323 (5.0%) | 223 (3.9%) |
| $5,000 to $9,999 | 22 (0.3%) | 331 (5.9%) |
| $10,000 to $14,999 | 379 (5.9%) | 893 (15.8%) |
| $15,000 to $19,999 | 238 (3.7%) | 459 (8.1%) |
| $20,000 to $24,999 | 167 (2.6%) | 713 (12.6%) |
| $25,000 to $34,999 | 370 (5.7%) | 574 (10.2%) |
| $35,000 to $49,999 | 747 (11.5%) | 959 (17.0%) |
| $50,000 to $74,999 | 1,311 (20.2%) | 598 (10.6%) |
| $75,000 to $99,999 | 997 (15.4%) | 432 (7.6%) |
| $100,000 to $149,999 | 1,150 (17.8%) | 398 (7.0%) |
| $150,000 or more | 772 (11.9%) | 77 (1.4%) |
| Total | 6,476 (100.0%) | 5,657 (100.0%) |
Monthly Housing Cost Tiers in Henderson
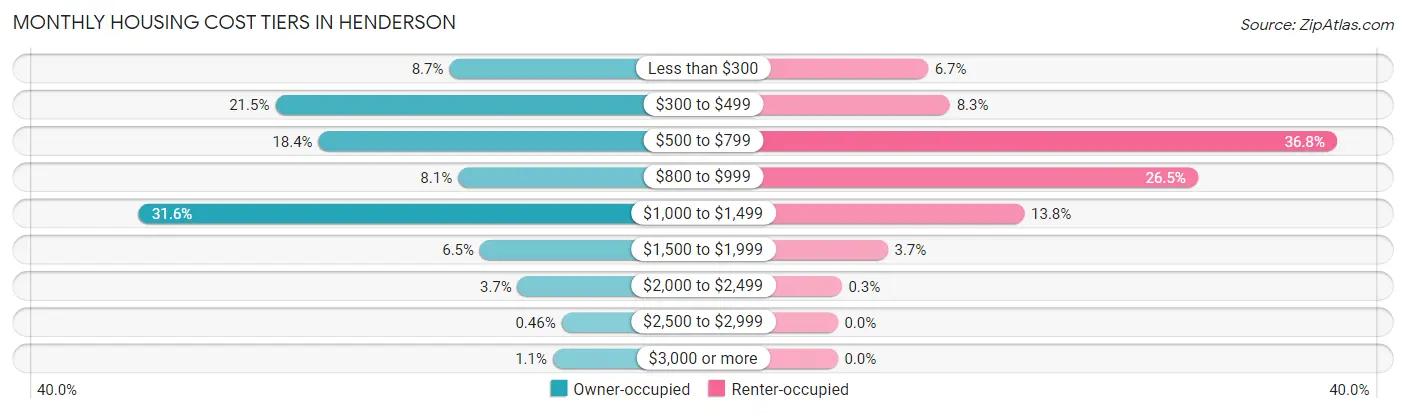
| Monthly Cost | Owner-occupied | Renter-occupied |
| Less than $300 | 565 (8.7%) | 376 (6.7%) |
| $300 to $499 | 1,395 (21.5%) | 468 (8.3%) |
| $500 to $799 | 1,189 (18.4%) | 2,080 (36.8%) |
| $800 to $999 | 523 (8.1%) | 1,501 (26.5%) |
| $1,000 to $1,499 | 2,045 (31.6%) | 778 (13.8%) |
| $1,500 to $1,999 | 419 (6.5%) | 209 (3.7%) |
| $2,000 to $2,499 | 239 (3.7%) | 17 (0.3%) |
| $2,500 to $2,999 | 30 (0.5%) | 0 (0.0%) |
| $3,000 or more | 71 (1.1%) | 0 (0.0%) |
| Total | 6,476 (100.0%) | 5,657 (100.0%) |
Physical Housing Characteristics in Henderson
Housing Structures in Henderson
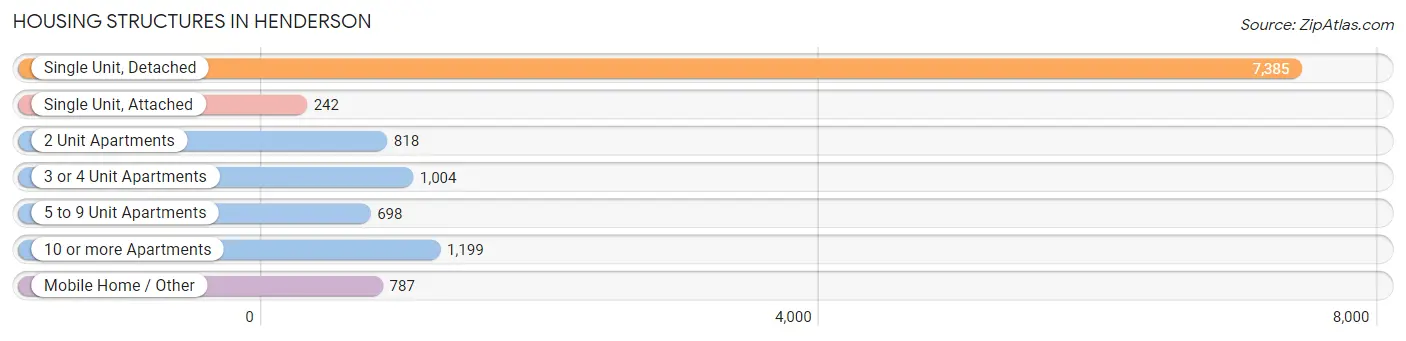
| Structure Type | # Housing Units | % Housing Units |
| Single Unit, Detached | 7,385 | 60.9% |
| Single Unit, Attached | 242 | 2.0% |
| 2 Unit Apartments | 818 | 6.7% |
| 3 or 4 Unit Apartments | 1,004 | 8.3% |
| 5 to 9 Unit Apartments | 698 | 5.8% |
| 10 or more Apartments | 1,199 | 9.9% |
| Mobile Home / Other | 787 | 6.5% |
| Total | 12,133 | 100.0% |
Housing Structures by Occupancy in Henderson
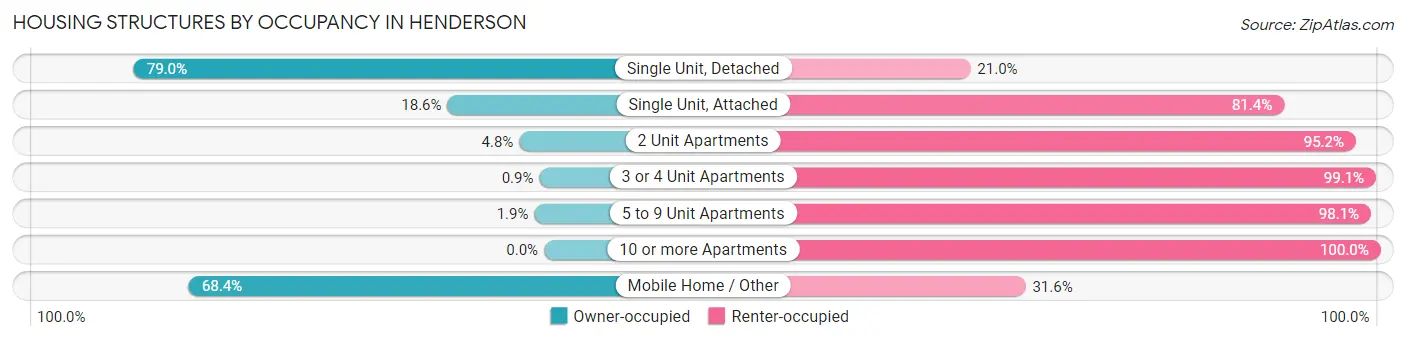
| Structure Type | Owner-occupied | Renter-occupied |
| Single Unit, Detached | 5,832 (79.0%) | 1,553 (21.0%) |
| Single Unit, Attached | 45 (18.6%) | 197 (81.4%) |
| 2 Unit Apartments | 39 (4.8%) | 779 (95.2%) |
| 3 or 4 Unit Apartments | 9 (0.9%) | 995 (99.1%) |
| 5 to 9 Unit Apartments | 13 (1.9%) | 685 (98.1%) |
| 10 or more Apartments | 0 (0.0%) | 1,199 (100.0%) |
| Mobile Home / Other | 538 (68.4%) | 249 (31.6%) |
| Total | 6,476 (53.4%) | 5,657 (46.6%) |
Housing Structures by Number of Rooms in Henderson
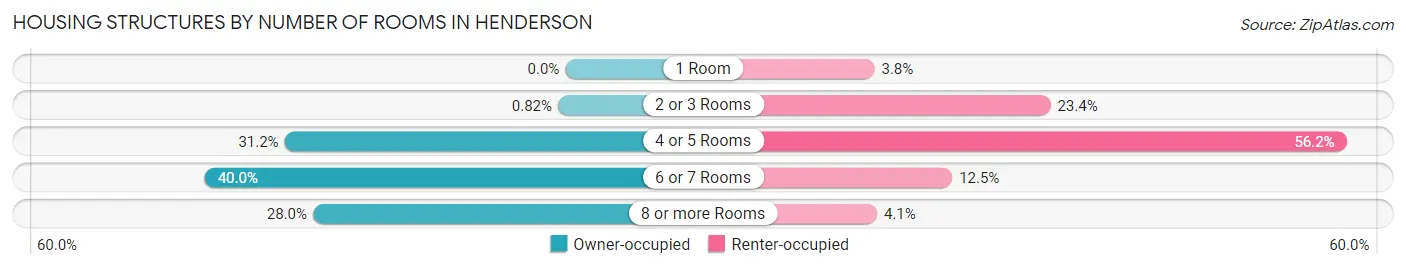
| Number of Rooms | Owner-occupied | Renter-occupied |
| 1 Room | 0 (0.0%) | 217 (3.8%) |
| 2 or 3 Rooms | 53 (0.8%) | 1,322 (23.4%) |
| 4 or 5 Rooms | 2,018 (31.2%) | 3,180 (56.2%) |
| 6 or 7 Rooms | 2,591 (40.0%) | 705 (12.5%) |
| 8 or more Rooms | 1,814 (28.0%) | 233 (4.1%) |
| Total | 6,476 (100.0%) | 5,657 (100.0%) |
Housing Structure by Heating Type in Henderson
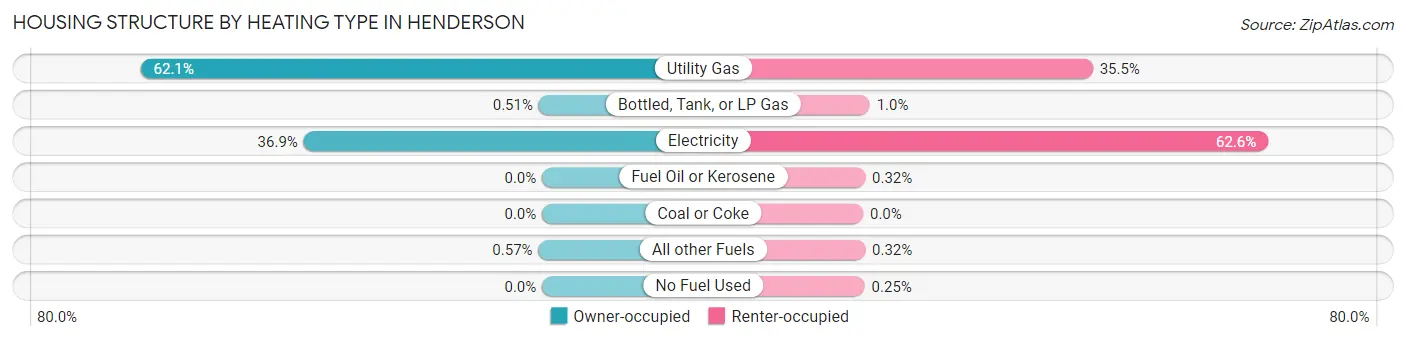
| Heating Type | Owner-occupied | Renter-occupied |
| Utility Gas | 4,019 (62.1%) | 2,008 (35.5%) |
| Bottled, Tank, or LP Gas | 33 (0.5%) | 58 (1.0%) |
| Electricity | 2,387 (36.9%) | 3,541 (62.6%) |
| Fuel Oil or Kerosene | 0 (0.0%) | 18 (0.3%) |
| Coal or Coke | 0 (0.0%) | 0 (0.0%) |
| All other Fuels | 37 (0.6%) | 18 (0.3%) |
| No Fuel Used | 0 (0.0%) | 14 (0.3%) |
| Total | 6,476 (100.0%) | 5,657 (100.0%) |
Household Vehicle Usage in Henderson
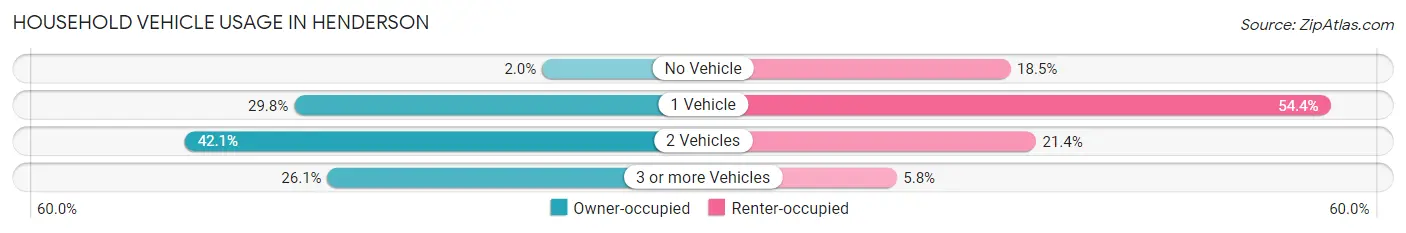
| Vehicles per Household | Owner-occupied | Renter-occupied |
| No Vehicle | 132 (2.0%) | 1,047 (18.5%) |
| 1 Vehicle | 1,931 (29.8%) | 3,076 (54.4%) |
| 2 Vehicles | 2,724 (42.1%) | 1,208 (21.3%) |
| 3 or more Vehicles | 1,689 (26.1%) | 326 (5.8%) |
| Total | 6,476 (100.0%) | 5,657 (100.0%) |
Real Estate & Mortgages in Henderson
Real Estate and Mortgage Overview in Henderson
| Characteristic | Without Mortgage | With Mortgage |
| Housing Units | 2,885 | 3,591 |
| Median Property Value | $122,600 | $153,300 |
| Median Household Income | $56,866 | $544 |
| Monthly Housing Costs | $430 | $71 |
| Real Estate Taxes | $1,232 | $148 |
Property Value by Mortgage Status in Henderson
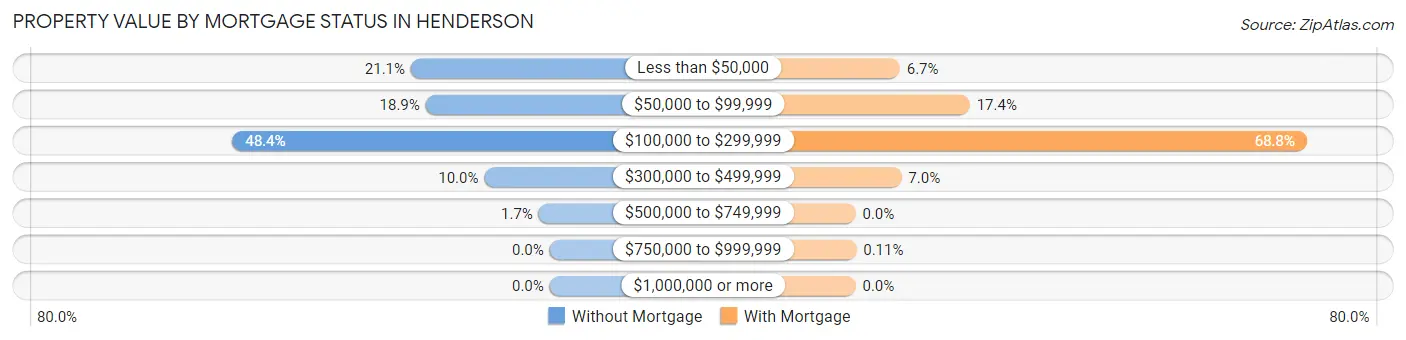
| Property Value | Without Mortgage | With Mortgage |
| Less than $50,000 | 610 (21.1%) | 242 (6.7%) |
| $50,000 to $99,999 | 545 (18.9%) | 625 (17.4%) |
| $100,000 to $299,999 | 1,395 (48.3%) | 2,469 (68.8%) |
| $300,000 to $499,999 | 287 (10.0%) | 251 (7.0%) |
| $500,000 to $749,999 | 48 (1.7%) | 0 (0.0%) |
| $750,000 to $999,999 | 0 (0.0%) | 4 (0.1%) |
| $1,000,000 or more | 0 (0.0%) | 0 (0.0%) |
| Total | 2,885 (100.0%) | 3,591 (100.0%) |
Household Income by Mortgage Status in Henderson
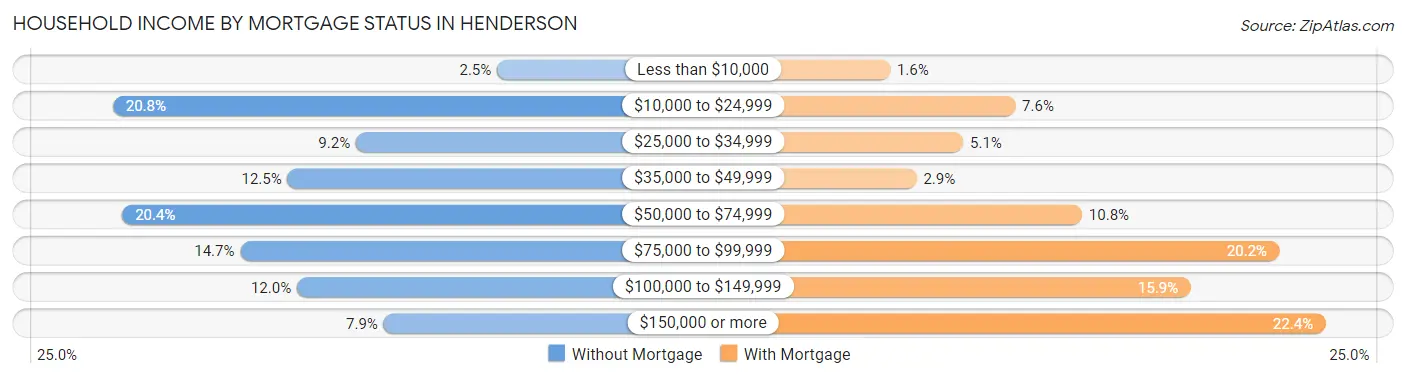
| Household Income | Without Mortgage | With Mortgage |
| Less than $10,000 | 72 (2.5%) | 59 (1.6%) |
| $10,000 to $24,999 | 600 (20.8%) | 273 (7.6%) |
| $25,000 to $34,999 | 266 (9.2%) | 184 (5.1%) |
| $35,000 to $49,999 | 360 (12.5%) | 104 (2.9%) |
| $50,000 to $74,999 | 587 (20.3%) | 387 (10.8%) |
| $75,000 to $99,999 | 425 (14.7%) | 724 (20.2%) |
| $100,000 to $149,999 | 347 (12.0%) | 572 (15.9%) |
| $150,000 or more | 228 (7.9%) | 803 (22.4%) |
| Total | 2,885 (100.0%) | 3,591 (100.0%) |
Property Value to Household Income Ratio in Henderson
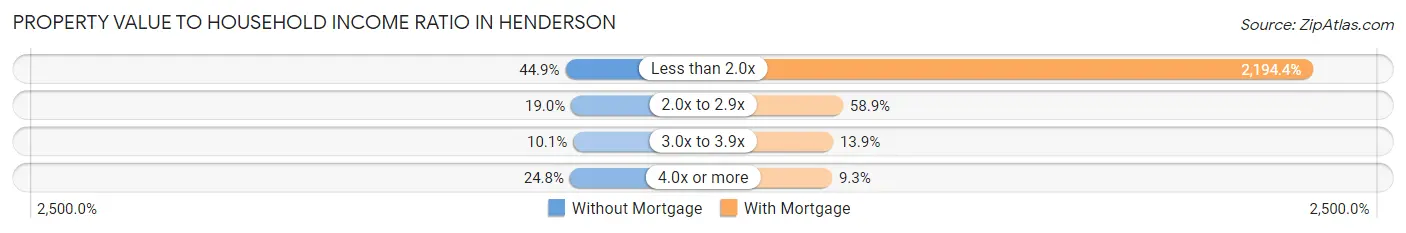
| Value-to-Income Ratio | Without Mortgage | With Mortgage |
| Less than 2.0x | 1,295 (44.9%) | 78,800 (2,194.4%) |
| 2.0x to 2.9x | 548 (19.0%) | 2,116 (58.9%) |
| 3.0x to 3.9x | 291 (10.1%) | 499 (13.9%) |
| 4.0x or more | 716 (24.8%) | 335 (9.3%) |
| Total | 2,885 (100.0%) | 3,591 (100.0%) |
Real Estate Taxes by Mortgage Status in Henderson
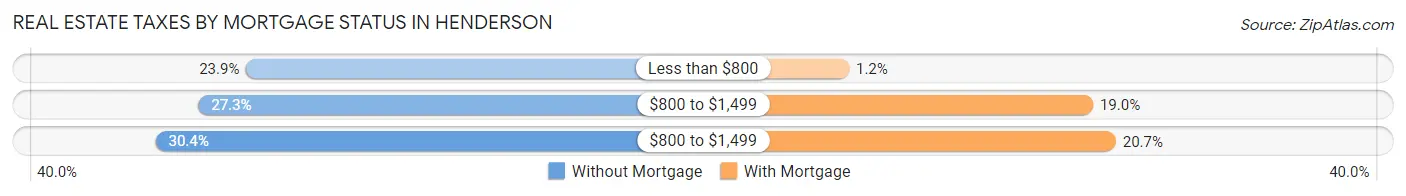
| Property Taxes | Without Mortgage | With Mortgage |
| Less than $800 | 689 (23.9%) | 42 (1.2%) |
| $800 to $1,499 | 788 (27.3%) | 682 (19.0%) |
| $800 to $1,499 | 878 (30.4%) | 742 (20.7%) |
| Total | 2,885 (100.0%) | 3,591 (100.0%) |
Health & Disability in Henderson
Health Insurance Coverage by Age in Henderson
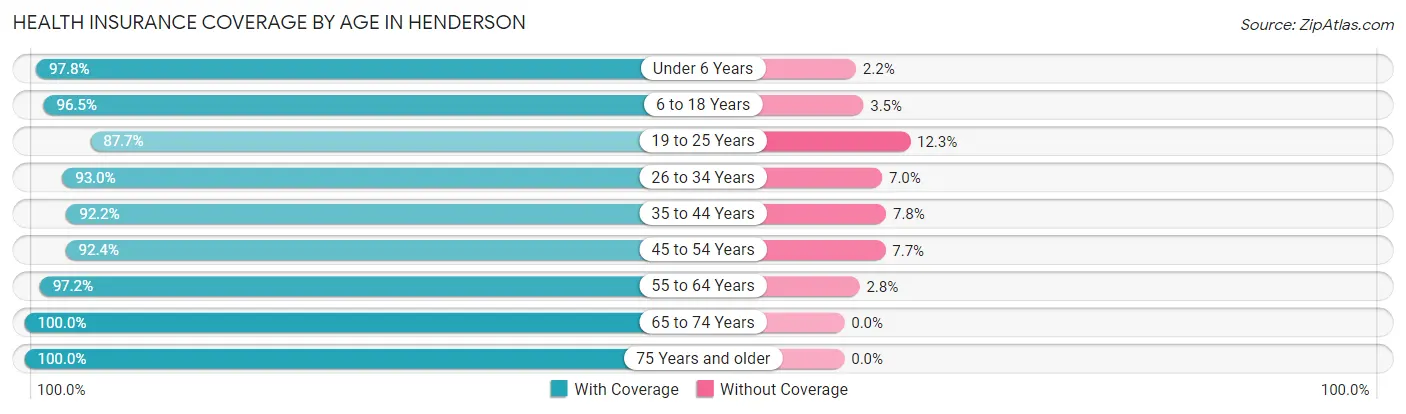
| Age Bracket | With Coverage | Without Coverage |
| Under 6 Years | 1,905 (97.8%) | 42 (2.2%) |
| 6 to 18 Years | 4,420 (96.5%) | 162 (3.5%) |
| 19 to 25 Years | 1,818 (87.7%) | 254 (12.3%) |
| 26 to 34 Years | 3,210 (93.0%) | 243 (7.0%) |
| 35 to 44 Years | 2,939 (92.2%) | 248 (7.8%) |
| 45 to 54 Years | 3,127 (92.3%) | 259 (7.6%) |
| 55 to 64 Years | 3,607 (97.2%) | 105 (2.8%) |
| 65 to 74 Years | 2,856 (100.0%) | 0 (0.0%) |
| 75 Years and older | 2,020 (100.0%) | 0 (0.0%) |
| Total | 25,902 (95.2%) | 1,313 (4.8%) |
Health Insurance Coverage by Citizenship Status in Henderson
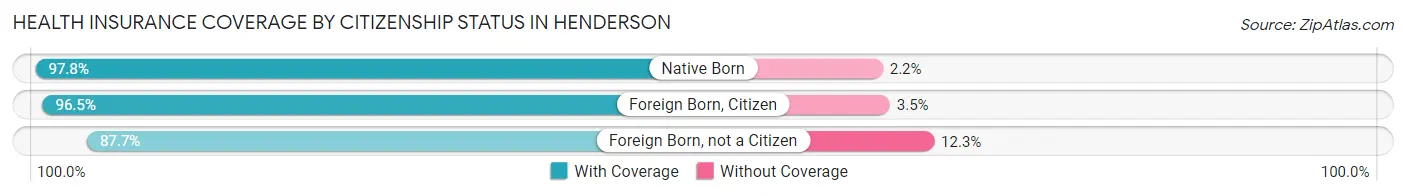
| Citizenship Status | With Coverage | Without Coverage |
| Native Born | 1,905 (97.8%) | 42 (2.2%) |
| Foreign Born, Citizen | 4,420 (96.5%) | 162 (3.5%) |
| Foreign Born, not a Citizen | 1,818 (87.7%) | 254 (12.3%) |
Health Insurance Coverage by Household Income in Henderson
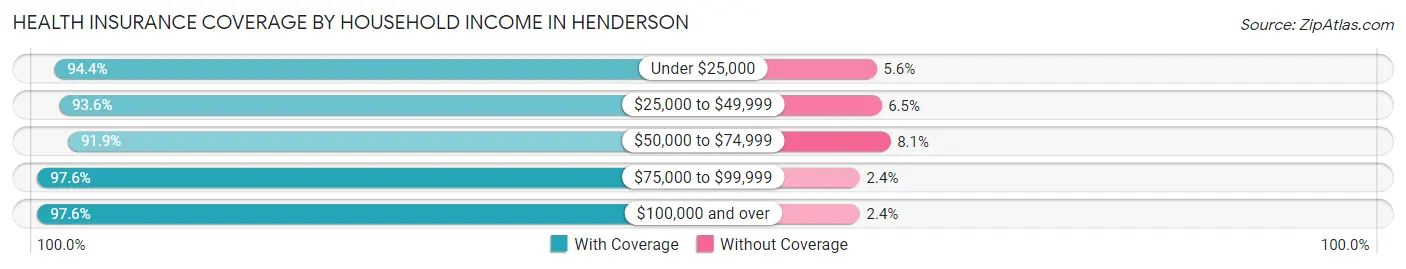
| Household Income | With Coverage | Without Coverage |
| Under $25,000 | 5,633 (94.4%) | 332 (5.6%) |
| $25,000 to $49,999 | 4,771 (93.5%) | 329 (6.5%) |
| $50,000 to $74,999 | 4,229 (91.9%) | 374 (8.1%) |
| $75,000 to $99,999 | 3,690 (97.6%) | 91 (2.4%) |
| $100,000 and over | 7,307 (97.6%) | 180 (2.4%) |
Public vs Private Health Insurance Coverage by Age in Henderson
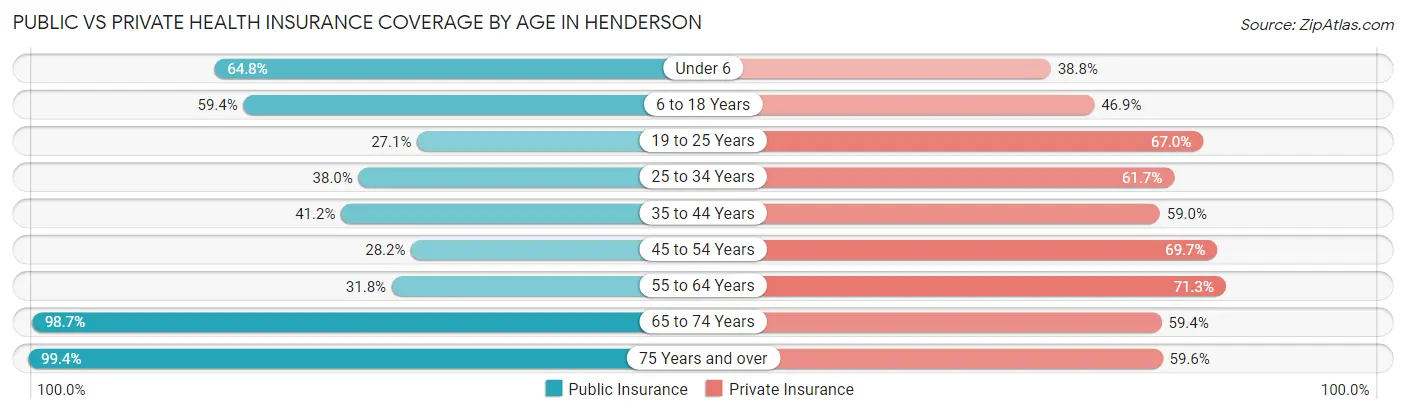
| Age Bracket | Public Insurance | Private Insurance |
| Under 6 | 1,261 (64.8%) | 755 (38.8%) |
| 6 to 18 Years | 2,720 (59.4%) | 2,147 (46.9%) |
| 19 to 25 Years | 562 (27.1%) | 1,389 (67.0%) |
| 25 to 34 Years | 1,312 (38.0%) | 2,129 (61.7%) |
| 35 to 44 Years | 1,314 (41.2%) | 1,881 (59.0%) |
| 45 to 54 Years | 956 (28.2%) | 2,360 (69.7%) |
| 55 to 64 Years | 1,181 (31.8%) | 2,645 (71.3%) |
| 65 to 74 Years | 2,818 (98.7%) | 1,695 (59.4%) |
| 75 Years and over | 2,007 (99.4%) | 1,203 (59.6%) |
| Total | 14,131 (51.9%) | 16,204 (59.5%) |
Disability Status by Sex by Age in Henderson
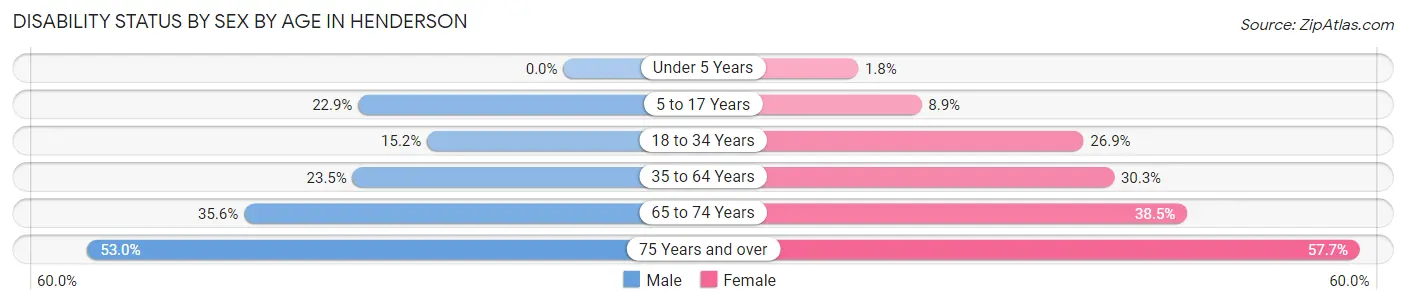
| Age Bracket | Male | Female |
| Under 5 Years | 0 (0.0%) | 17 (1.8%) |
| 5 to 17 Years | 526 (22.9%) | 205 (8.9%) |
| 18 to 34 Years | 450 (15.2%) | 759 (26.9%) |
| 35 to 64 Years | 1,134 (23.5%) | 1,653 (30.3%) |
| 65 to 74 Years | 410 (35.6%) | 655 (38.5%) |
| 75 Years and over | 423 (53.0%) | 705 (57.7%) |
Disability Class by Sex by Age in Henderson
Disability Class: Hearing Difficulty
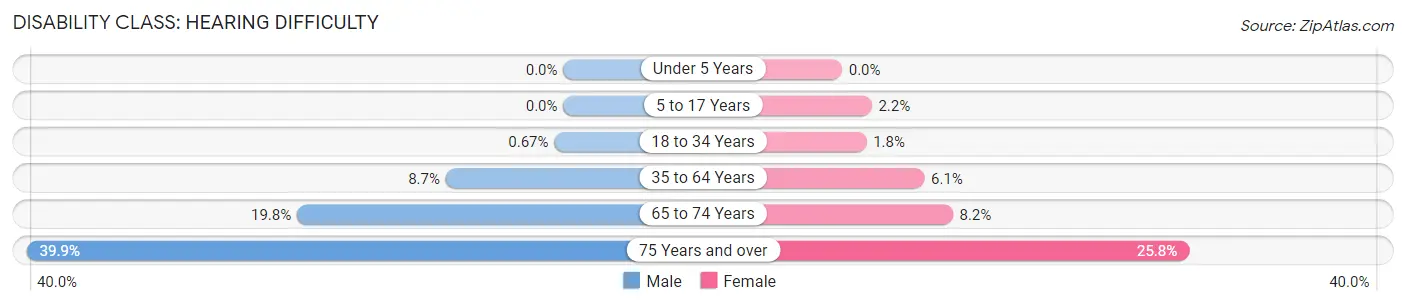
| Age Bracket | Male | Female |
| Under 5 Years | 0 (0.0%) | 0 (0.0%) |
| 5 to 17 Years | 0 (0.0%) | 51 (2.2%) |
| 18 to 34 Years | 20 (0.7%) | 51 (1.8%) |
| 35 to 64 Years | 422 (8.7%) | 333 (6.1%) |
| 65 to 74 Years | 228 (19.8%) | 140 (8.2%) |
| 75 Years and over | 318 (39.9%) | 315 (25.8%) |
Disability Class: Vision Difficulty
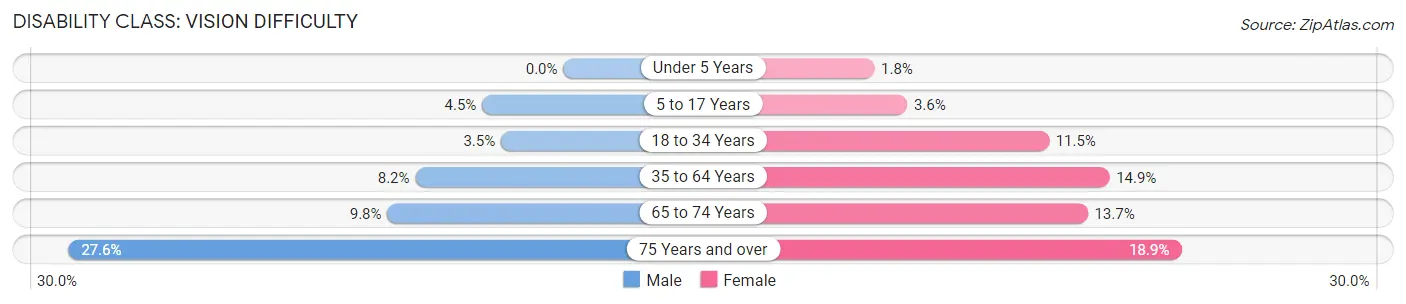
| Age Bracket | Male | Female |
| Under 5 Years | 0 (0.0%) | 17 (1.8%) |
| 5 to 17 Years | 104 (4.5%) | 84 (3.6%) |
| 18 to 34 Years | 103 (3.5%) | 325 (11.5%) |
| 35 to 64 Years | 398 (8.2%) | 812 (14.9%) |
| 65 to 74 Years | 113 (9.8%) | 233 (13.7%) |
| 75 Years and over | 220 (27.6%) | 231 (18.9%) |
Disability Class: Cognitive Difficulty
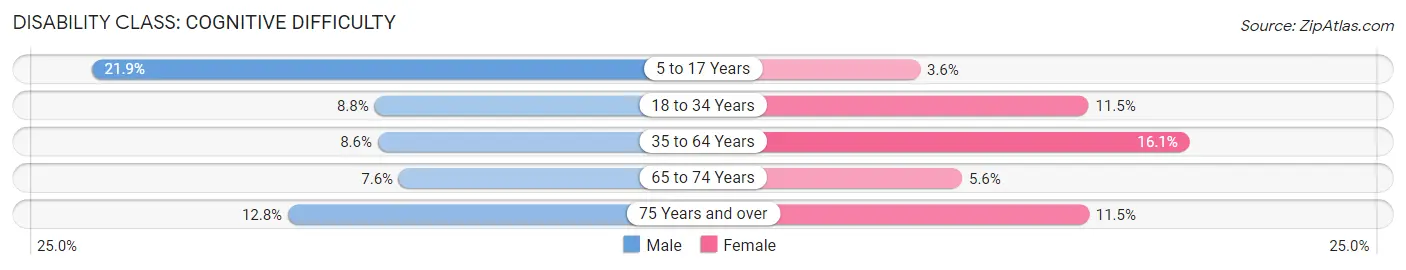
| Age Bracket | Male | Female |
| 5 to 17 Years | 504 (21.9%) | 84 (3.6%) |
| 18 to 34 Years | 260 (8.8%) | 323 (11.5%) |
| 35 to 64 Years | 416 (8.6%) | 880 (16.1%) |
| 65 to 74 Years | 88 (7.6%) | 95 (5.6%) |
| 75 Years and over | 102 (12.8%) | 140 (11.5%) |
Disability Class: Ambulatory Difficulty
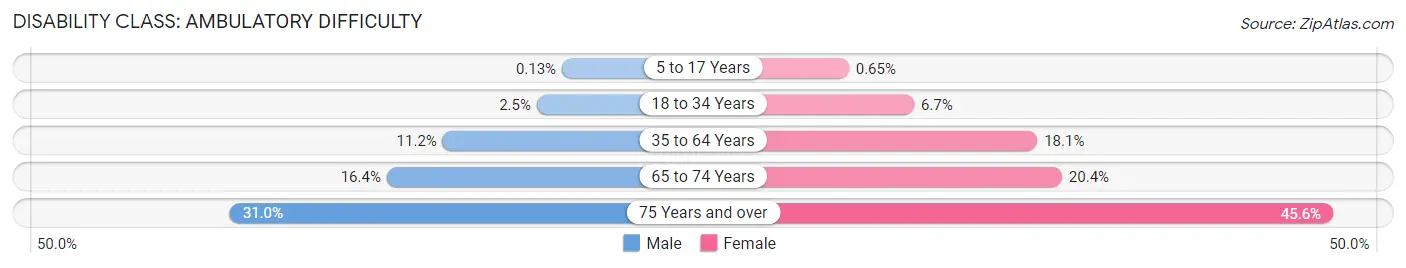
| Age Bracket | Male | Female |
| 5 to 17 Years | 3 (0.1%) | 15 (0.6%) |
| 18 to 34 Years | 73 (2.5%) | 189 (6.7%) |
| 35 to 64 Years | 541 (11.2%) | 989 (18.1%) |
| 65 to 74 Years | 189 (16.4%) | 348 (20.4%) |
| 75 Years and over | 247 (30.9%) | 557 (45.6%) |
Disability Class: Self-Care Difficulty
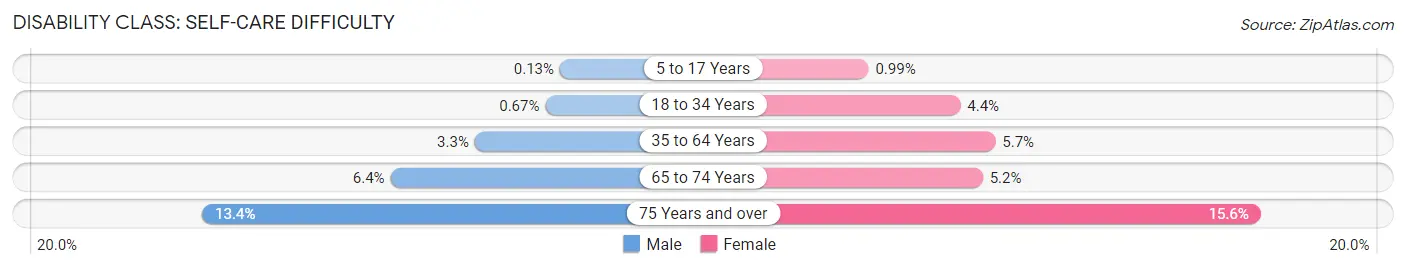
| Age Bracket | Male | Female |
| 5 to 17 Years | 3 (0.1%) | 23 (1.0%) |
| 18 to 34 Years | 20 (0.7%) | 124 (4.4%) |
| 35 to 64 Years | 159 (3.3%) | 311 (5.7%) |
| 65 to 74 Years | 74 (6.4%) | 89 (5.2%) |
| 75 Years and over | 107 (13.4%) | 190 (15.5%) |
Technology Access in Henderson
Computing Device Access in Henderson
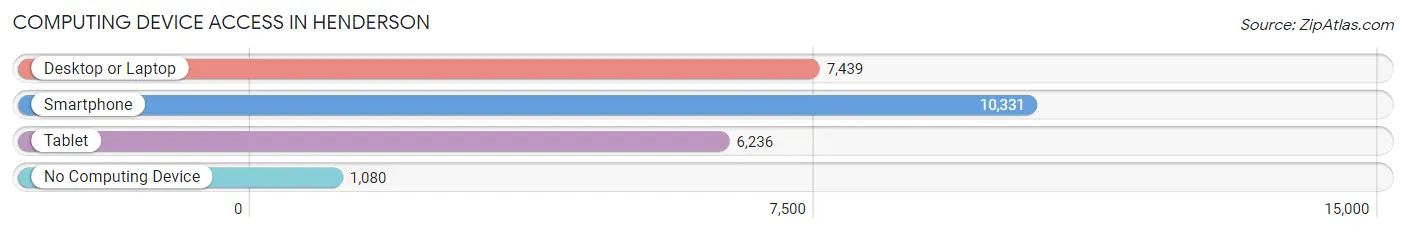
| Device Type | # Households | % Households |
| Desktop or Laptop | 7,439 | 61.3% |
| Smartphone | 10,331 | 85.2% |
| Tablet | 6,236 | 51.4% |
| No Computing Device | 1,080 | 8.9% |
| Total | 12,133 | 100.0% |
Internet Access in Henderson
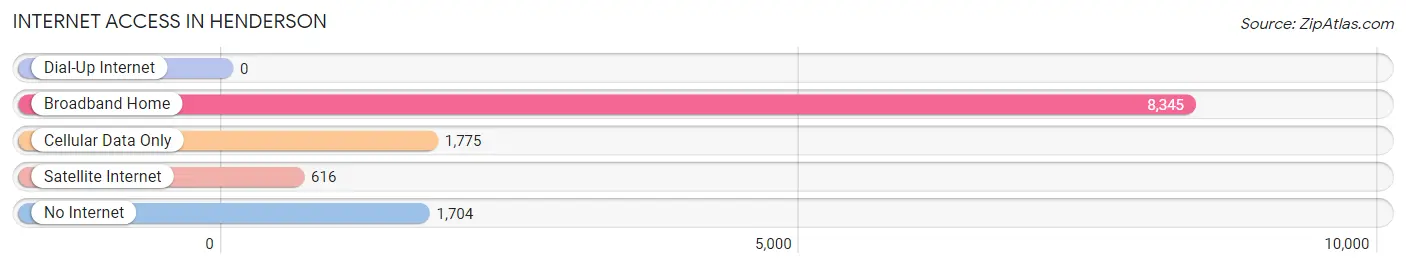
| Internet Type | # Households | % Households |
| Dial-Up Internet | 0 | 0.0% |
| Broadband Home | 8,345 | 68.8% |
| Cellular Data Only | 1,775 | 14.6% |
| Satellite Internet | 616 | 5.1% |
| No Internet | 1,704 | 14.0% |
| Total | 12,133 | 100.0% |
Henderson Summary
Henderson, Kentucky is a city located in the western part of the state, along the Ohio River. It is the county seat of Henderson County and is the 11th largest city in the state. The city has a population of 28,757 as of the 2010 census.
Henderson was founded in 1797 by Colonel Richard Henderson, a Revolutionary War veteran and land speculator. He purchased the land from the Cherokee Indians and named the city after himself. The city was incorporated in 1810 and has since grown to become a major industrial center in the region.
Geography
Henderson is located in the western part of Kentucky, along the Ohio River. It is situated in the Pennyrile region of the state, which is known for its rolling hills and lush forests. The city is located about 40 miles from Evansville, Indiana and about 100 miles from Louisville, Kentucky.
The city has a total area of 16.2 square miles, of which 15.9 square miles is land and 0.3 square miles is water. The city is located at an elevation of 441 feet above sea level.
Economy
Henderson is a major industrial center in the region. The city is home to several large manufacturing companies, including Alcoa, American Greetings, and Whirlpool. The city also has a thriving agricultural sector, with corn, soybeans, and tobacco being the main crops.
The city is also home to several large employers, including the Henderson County Public Schools, the Henderson County Health Department, and the Henderson County Sheriff's Office.
Demographics
As of the 2010 census, Henderson had a population of 28,757. The racial makeup of the city was 79.2% White, 17.3% African American, 0.3% Native American, 0.7% Asian, 0.1% Pacific Islander, 1.2% from other races, and 1.4% from two or more races. Hispanic or Latino of any race were 2.7% of the population.
The median income for a household in the city was $35,945, and the median income for a family was $45,945. The per capita income for the city was $20,845. About 15.2% of families and 18.3% of the population were below the poverty line, including 25.2% of those under age 18 and 11.2% of those age 65 or over.
Conclusion
Henderson, Kentucky is a city located in the western part of the state, along the Ohio River. It is the county seat of Henderson County and is the 11th largest city in the state. The city has a population of 28,757 as of the 2010 census. Henderson is a major industrial center in the region, with several large manufacturing companies and a thriving agricultural sector. The city also has a median household income of $35,945 and a per capita income of $20,845.
Common Questions
What is Per Capita Income in Henderson?
Per Capita income in Henderson is $28,845.
What is the Median Family Income in Henderson?
Median Family Income in Henderson is $68,425.
What is the Median Household income in Henderson?
Median Household Income in Henderson is $46,276.
What is Income or Wage Gap in Henderson?
Income or Wage Gap in Henderson is 30.5%.
Women in Henderson earn 69.5 cents for every dollar earned by a man.
What is Family Income Deficit in Henderson?
Family Income Deficit in Henderson is $10,506.
Families that are below poverty line in Henderson earn $10,506 less on average than the poverty threshold level.
What is Inequality or Gini Index in Henderson?
Inequality or Gini Index in Henderson is 0.46.
What is the Total Population of Henderson?
Total Population of Henderson is 28,166.
What is the Total Male Population of Henderson?
Total Male Population of Henderson is 13,303.
What is the Total Female Population of Henderson?
Total Female Population of Henderson is 14,863.
What is the Ratio of Males per 100 Females in Henderson?
There are 89.50 Males per 100 Females in Henderson.
What is the Ratio of Females per 100 Males in Henderson?
There are 111.73 Females per 100 Males in Henderson.
What is the Median Population Age in Henderson?
Median Population Age in Henderson is 40.1 Years.
What is the Average Family Size in Henderson
Average Family Size in Henderson is 2.9 People.
What is the Average Household Size in Henderson
Average Household Size in Henderson is 2.2 People.
How Large is the Labor Force in Henderson?
There are 12,724 People in the Labor Forcein in Henderson.
What is the Percentage of People in the Labor Force in Henderson?
55.8% of People are in the Labor Force in Henderson.
What is the Unemployment Rate in Henderson?
Unemployment Rate in Henderson is 3.3%.