Area Code 312 Map & Demographics
Area Code 312 Map
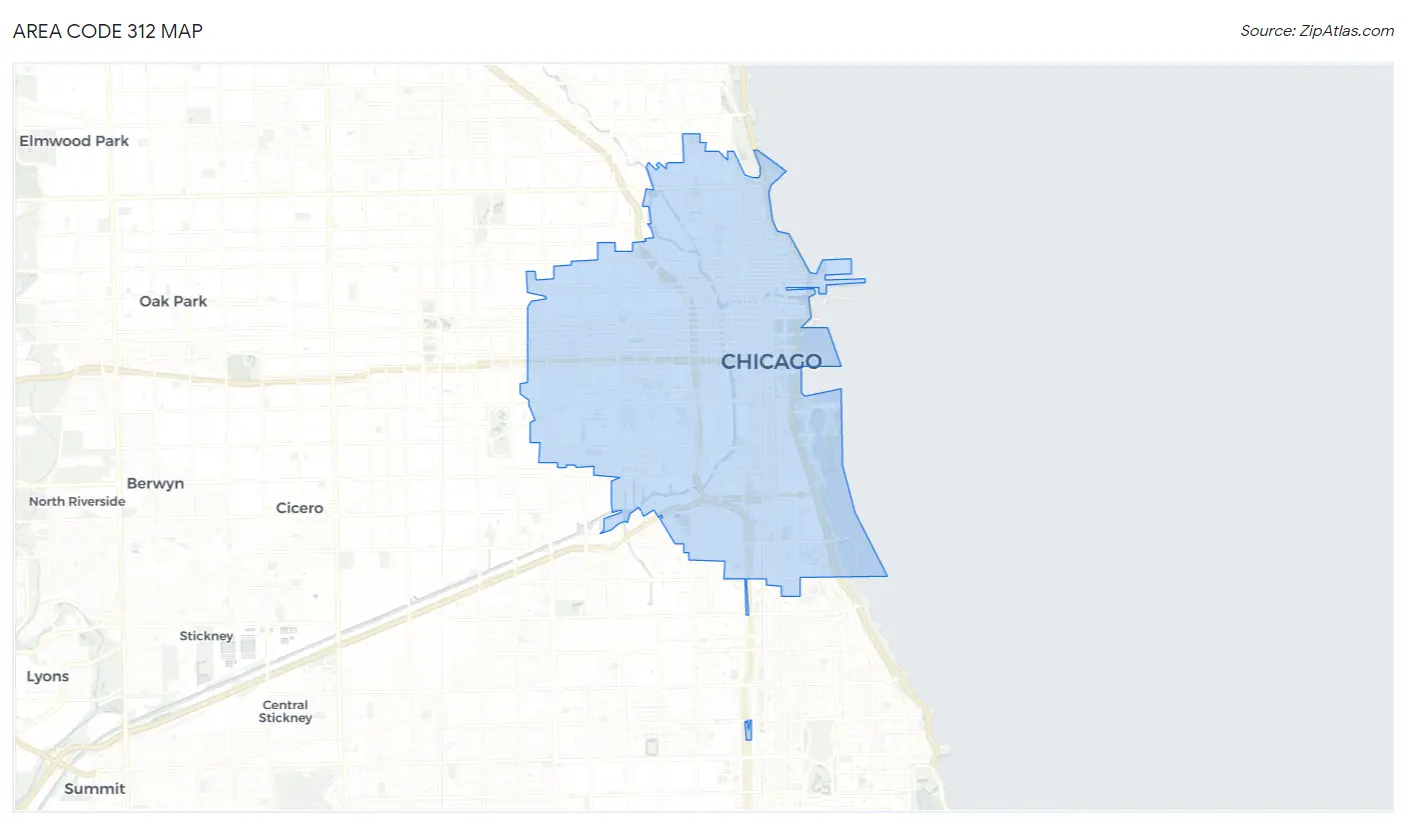
Area Code 312 Overview
$65,563
PER CAPITA INCOME
$138,490
AVG FAMILY INCOME
$97,843
AVG HOUSEHOLD INCOME
26.3%
WAGE / INCOME GAP [ % ]
73.7¢/ $1
WAGE / INCOME GAP [ $ ]
$11,652
FAMILY INCOME DEFICIT
20.59
INEQUALITY / GINI INDEX
1,610,981
TOTAL POPULATION
785,072
MALE POPULATION
825,909
FEMALE POPULATION
95.06
MALES / 100 FEMALES
105.20
FEMALES / 100 MALES
37.1
MEDIAN AGE
3.0
AVG FAMILY SIZE
2.3
AVG HOUSEHOLD SIZE
914,572
LABOR FORCE [ PEOPLE ]
68.9%
PERCENT IN LABOR FORCE
6.9%
UNEMPLOYMENT RATE
Income in Area Code 312
Income Overview in Area Code 312
Per Capita Income in Area Code 312 is $65,563, while median incomes of families and households are $138,490 and $97,843 respectively.
| Characteristic | Number | Measure |
| Per Capita Income | 1,610,981 | $65,563 |
| Median Family Income | 349,018 | $138,490 |
| Mean Family Income | 349,018 | $7,982,286 |
| Median Household Income | 677,609 | $97,843 |
| Mean Household Income | 677,609 | $5,918,742 |
| Income Deficit | 349,018 | $11,652 |
| Wage / Income Gap (%) | 1,610,981 | 26.26% |
| Wage / Income Gap ($) | 1,610,981 | 73.74¢ per $1 |
| Gini / Inequality Index | 1,610,981 | 20.59 |
Earnings by Sex in Area Code 312
Average Earnings in Area Code 312 are $61,042, $72,145 for men and $51,637 for women, a difference of 28.4%.
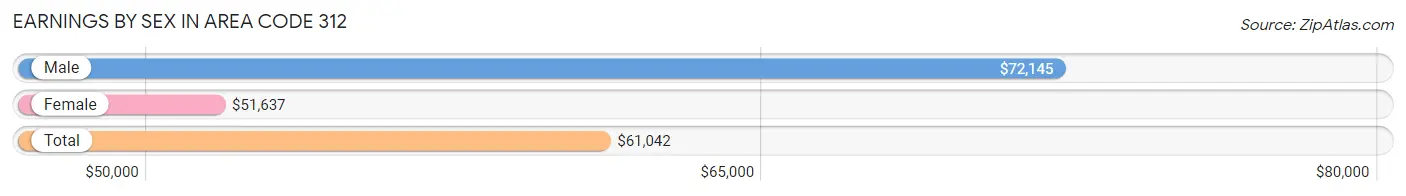
| Sex | Number | Average Earnings |
| Male | 472,452 (52.0%) | $72,145 |
| Female | 436,336 (48.0%) | $51,637 |
| Total | 908,788 (100.0%) | $61,042 |
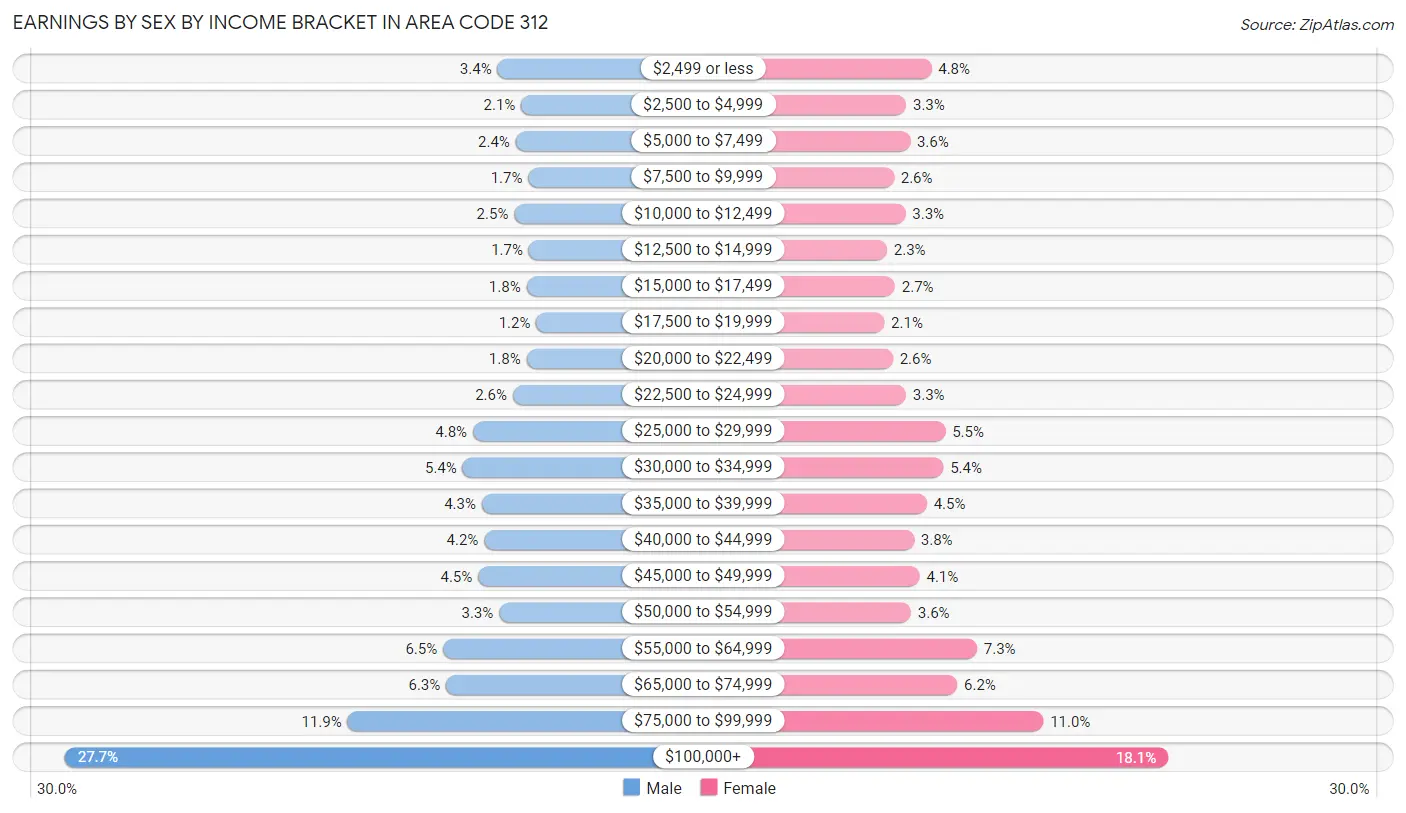
Earnings by Sex by Income Bracket in Area Code 312
The most common earnings brackets in Area Code 312 are $100,000+ for men (131,040 | 27.7%) and $100,000+ for women (78,745 | 18.0%).
| Income | Male | Female |
| $2,499 or less | 16,172 (3.4%) | 20,711 (4.8%) |
| $2,500 to $4,999 | 9,867 (2.1%) | 14,519 (3.3%) |
| $5,000 to $7,499 | 11,328 (2.4%) | 15,478 (3.5%) |
| $7,500 to $9,999 | 7,970 (1.7%) | 11,530 (2.6%) |
| $10,000 to $12,499 | 11,733 (2.5%) | 14,341 (3.3%) |
| $12,500 to $14,999 | 7,851 (1.7%) | 9,811 (2.2%) |
| $15,000 to $17,499 | 8,452 (1.8%) | 11,796 (2.7%) |
| $17,500 to $19,999 | 5,845 (1.2%) | 9,161 (2.1%) |
| $20,000 to $22,499 | 8,452 (1.8%) | 11,250 (2.6%) |
| $22,500 to $24,999 | 12,108 (2.6%) | 14,481 (3.3%) |
| $25,000 to $29,999 | 22,680 (4.8%) | 24,130 (5.5%) |
| $30,000 to $34,999 | 25,433 (5.4%) | 23,658 (5.4%) |
| $35,000 to $39,999 | 20,300 (4.3%) | 19,604 (4.5%) |
| $40,000 to $44,999 | 19,716 (4.2%) | 16,458 (3.8%) |
| $45,000 to $49,999 | 21,285 (4.5%) | 17,831 (4.1%) |
| $50,000 to $54,999 | 15,753 (3.3%) | 15,704 (3.6%) |
| $55,000 to $64,999 | 30,629 (6.5%) | 31,894 (7.3%) |
| $65,000 to $74,999 | 29,834 (6.3%) | 27,056 (6.2%) |
| $75,000 to $99,999 | 56,004 (11.8%) | 48,178 (11.0%) |
| $100,000+ | 131,040 (27.7%) | 78,745 (18.0%) |
| Total | 472,452 (100.0%) | 436,336 (100.0%) |
Earnings by Sex by Educational Attainment in Area Code 312
Average earnings in Area Code 312 are $3,376,252 for men and $2,434,679 for women, a difference of 27.9%. Men with an educational attainment of graduate degree enjoy the highest average annual earnings of $4,632,621, while those with less than high school education earn the least with $997,529. Women with an educational attainment of graduate degree earn the most with the average annual earnings of $3,632,807, while those with less than high school education have the smallest earnings of $631,095.
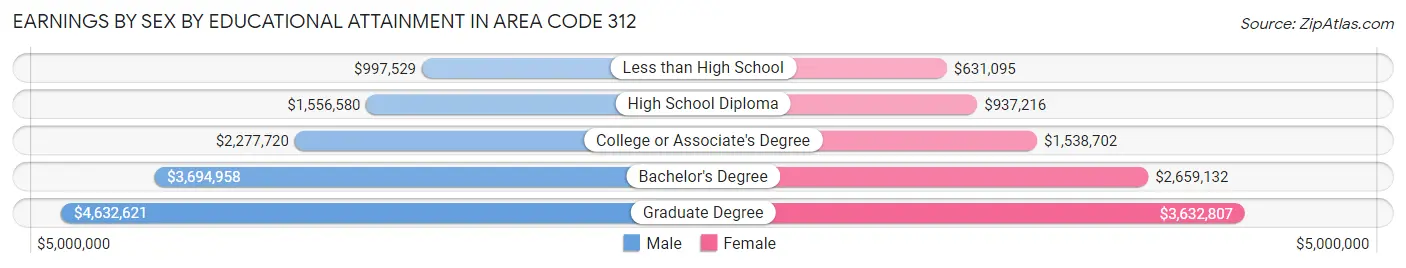
| Educational Attainment | Male Income | Female Income |
| Less than High School | $997,529 | $631,095 |
| High School Diploma | $1,556,580 | $937,216 |
| College or Associate's Degree | $2,277,720 | $1,538,702 |
| Bachelor's Degree | $3,694,958 | $2,659,132 |
| Graduate Degree | $4,632,621 | $3,632,807 |
| Total | $3,376,252 | $2,434,679 |
Family Income in Area Code 312
Family Income Brackets in Area Code 312
According to the Area Code 312 family income data, there are 4,528,509 families falling into the $200,000+ income range, which is the most common income bracket and makes up 1,297.5% of all families. Conversely, the $10,000 to $14,999 income bracket is the least frequent group with only 256,528 families (73.5%) belonging to this category.
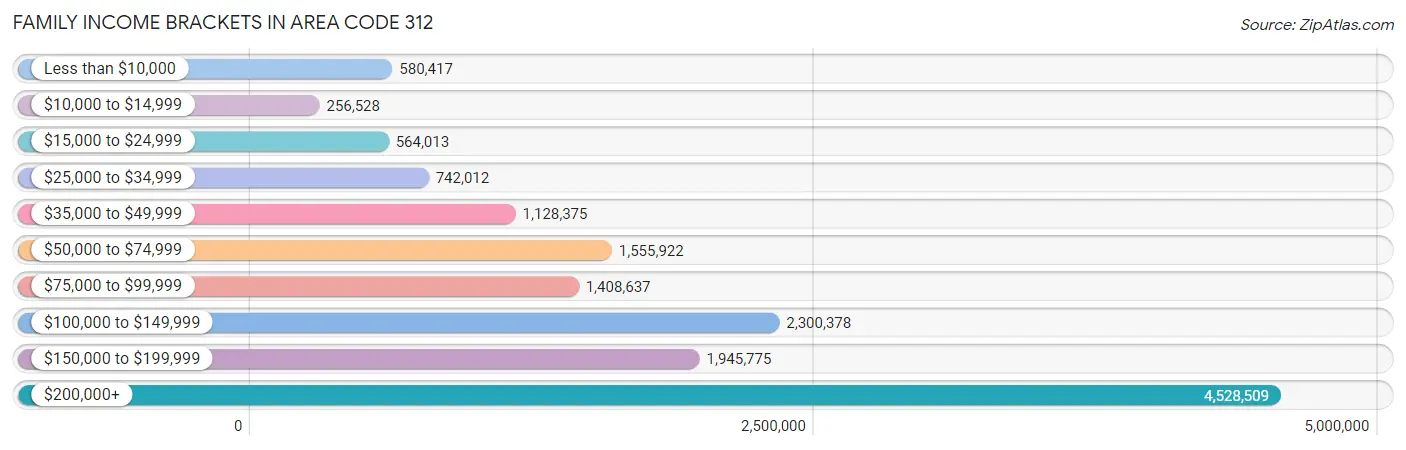
| Income Bracket | # Families | % Families |
| Less than $10,000 | 580,417 | 166.3% |
| $10,000 to $14,999 | 256,528 | 73.5% |
| $15,000 to $24,999 | 564,013 | 161.6% |
| $25,000 to $34,999 | 742,012 | 212.6% |
| $35,000 to $49,999 | 1,128,375 | 323.3% |
| $50,000 to $74,999 | 1,555,922 | 445.8% |
| $75,000 to $99,999 | 1,408,637 | 403.6% |
| $100,000 to $149,999 | 2,300,378 | 659.1% |
| $150,000 to $199,999 | 1,945,775 | 557.5% |
| $200,000+ | 4,528,509 | 1,297.5% |
Family Income by Famaliy Size in Area Code 312
4-person families (65,782 | 18.9%) account for the highest median family income in Area Code 312 with $153,645 per family, while 2-person families (154,406 | 44.2%) have the highest median income of $60,473 per family member.
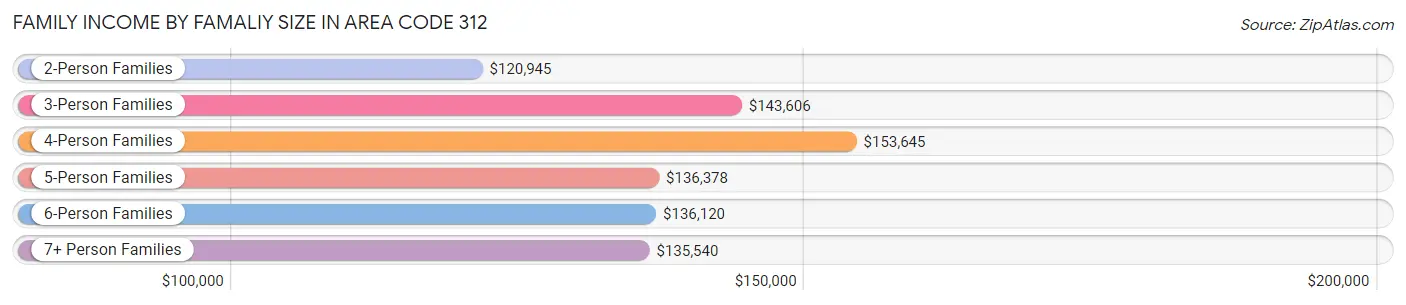
| Income Bracket | # Families | Median Income |
| 2-Person Families | 154,406 (44.2%) | $120,945 |
| 3-Person Families | 80,901 (23.2%) | $143,606 |
| 4-Person Families | 65,782 (18.9%) | $153,645 |
| 5-Person Families | 29,853 (8.6%) | $136,378 |
| 6-Person Families | 11,030 (3.2%) | $136,120 |
| 7+ Person Families | 7,046 (2.0%) | $135,540 |
| Total | 349,018 (100.0%) | $138,490 |
Family Income by Number of Earners in Area Code 312
The median family income in Area Code 312 is $138,490, with families comprising 3+ earners (41,411) having the highest median family income of $165,708, while families with no earners (42,438) have the lowest median family income of $60,956, accounting for 11.9% and 12.2% of families, respectively.
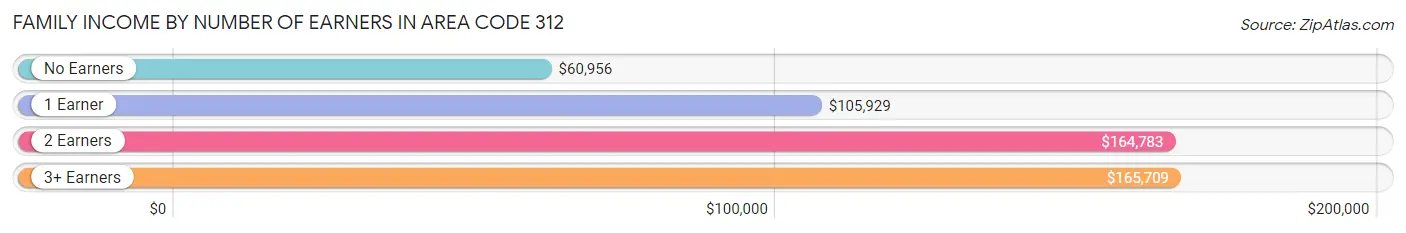
| Number of Earners | # Families | Median Income |
| No Earners | 42,438 (12.2%) | $60,956 |
| 1 Earner | 114,395 (32.8%) | $105,929 |
| 2 Earners | 150,774 (43.2%) | $164,783 |
| 3+ Earners | 41,411 (11.9%) | $165,708 |
| Total | 349,018 (100.0%) | $138,490 |
Household Income in Area Code 312
Household Income Brackets in Area Code 312
With 5,702,757 households falling in the category, the $200,000+ income range is the most frequent in Area Code 312, accounting for 841.6% of all households. In contrast, only 1,097,049 households (161.9%) fall into the $10,000 to $14,999 income bracket, making it the least populous group.
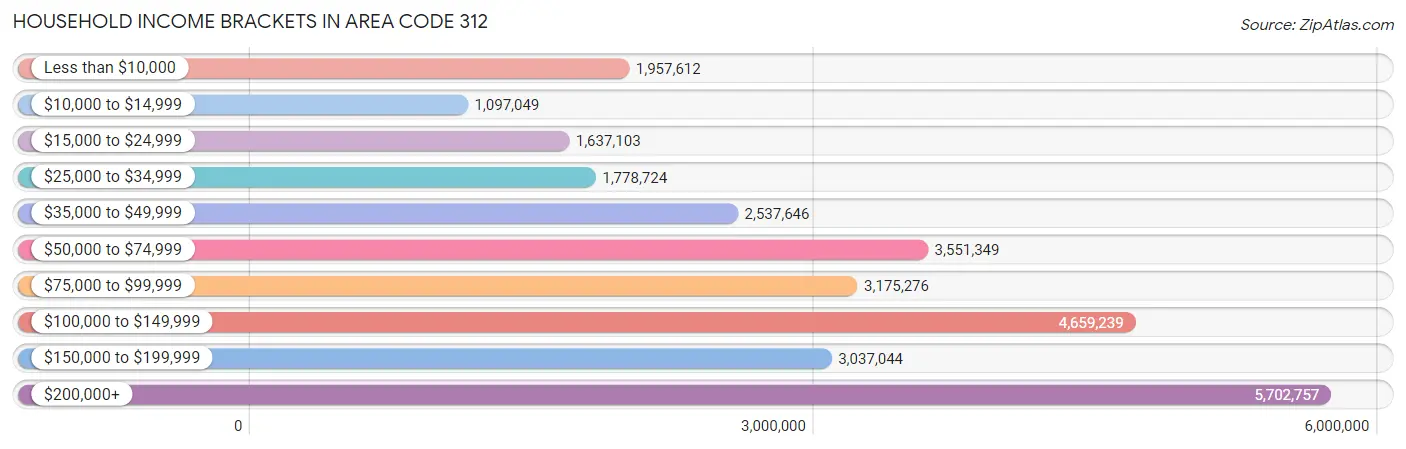
| Income Bracket | # Households | % Households |
| Less than $10,000 | 1,957,612 | 288.9% |
| $10,000 to $14,999 | 1,097,049 | 161.9% |
| $15,000 to $24,999 | 1,637,103 | 241.6% |
| $25,000 to $34,999 | 1,778,724 | 262.5% |
| $35,000 to $49,999 | 2,537,646 | 374.5% |
| $50,000 to $74,999 | 3,551,349 | 524.1% |
| $75,000 to $99,999 | 3,175,276 | 468.6% |
| $100,000 to $149,999 | 4,659,239 | 687.6% |
| $150,000 to $199,999 | 3,037,044 | 448.2% |
| $200,000+ | 5,702,757 | 841.6% |
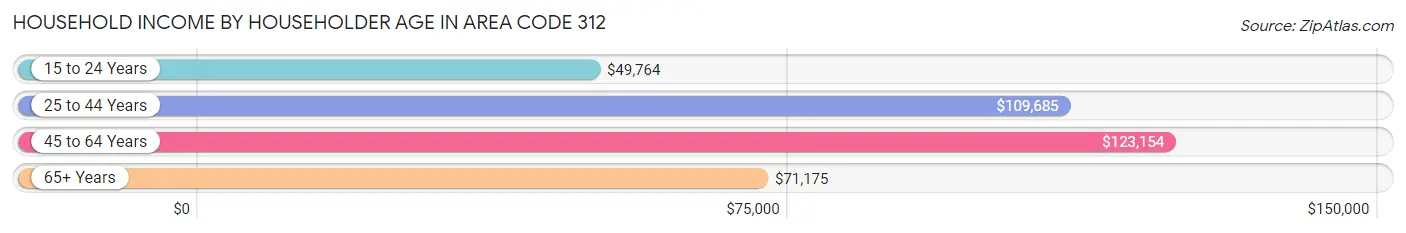
Household Income by Householder Age in Area Code 312
The median household income in Area Code 312 is $97,843, with the highest median household income of $123,154 found in the 45 to 64 years age bracket for the primary householder. A total of 215,624 households (31.8%) fall into this category. Meanwhile, the 15 to 24 years age bracket for the primary householder has the lowest median household income of $49,764, with 33,238 households (4.9%) in this group.
| Income Bracket | # Households | Median Income |
| 15 to 24 Years | 33,238 (4.9%) | $49,764 |
| 25 to 44 Years | 282,792 (41.7%) | $109,685 |
| 45 to 64 Years | 215,624 (31.8%) | $123,154 |
| 65+ Years | 145,955 (21.5%) | $71,175 |
| Total | 677,609 (100.0%) | $97,843 |
Poverty in Area Code 312
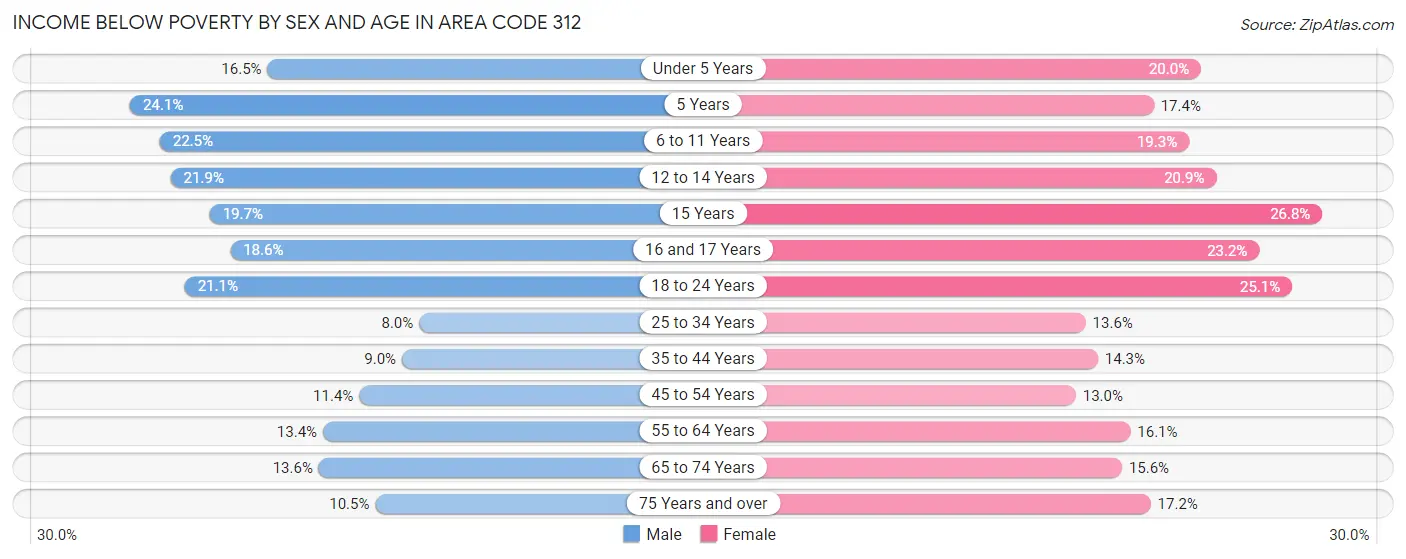
Income Below Poverty by Sex and Age in Area Code 312
With 13.5% poverty level for males and 16.8% for females among the residents of Area Code 312, 5 year old males and 15 year old females are the most vulnerable to poverty, with 2,027 males (24.1%) and 2,352 females (26.8%) in their respective age groups living below the poverty level.
| Age Bracket | Male | Female |
| Under 5 Years | 6,999 (16.5%) | 8,749 (20.0%) |
| 5 Years | 2,027 (24.1%) | 1,396 (17.4%) |
| 6 to 11 Years | 12,070 (22.5%) | 9,746 (19.3%) |
| 12 to 14 Years | 6,279 (21.9%) | 5,468 (20.8%) |
| 15 Years | 1,769 (19.7%) | 2,352 (26.8%) |
| 16 and 17 Years | 3,456 (18.5%) | 4,210 (23.2%) |
| 18 to 24 Years | 15,284 (21.1%) | 19,957 (25.1%) |
| 25 to 34 Years | 12,447 (8.0%) | 21,547 (13.6%) |
| 35 to 44 Years | 9,951 (9.0%) | 15,796 (14.3%) |
| 45 to 54 Years | 10,775 (11.4%) | 12,434 (13.0%) |
| 55 to 64 Years | 11,367 (13.4%) | 14,761 (16.1%) |
| 65 to 74 Years | 7,798 (13.6%) | 10,498 (15.6%) |
| 75 Years and over | 3,706 (10.5%) | 9,162 (17.2%) |
| Total | 103,928 (13.5%) | 136,076 (16.8%) |
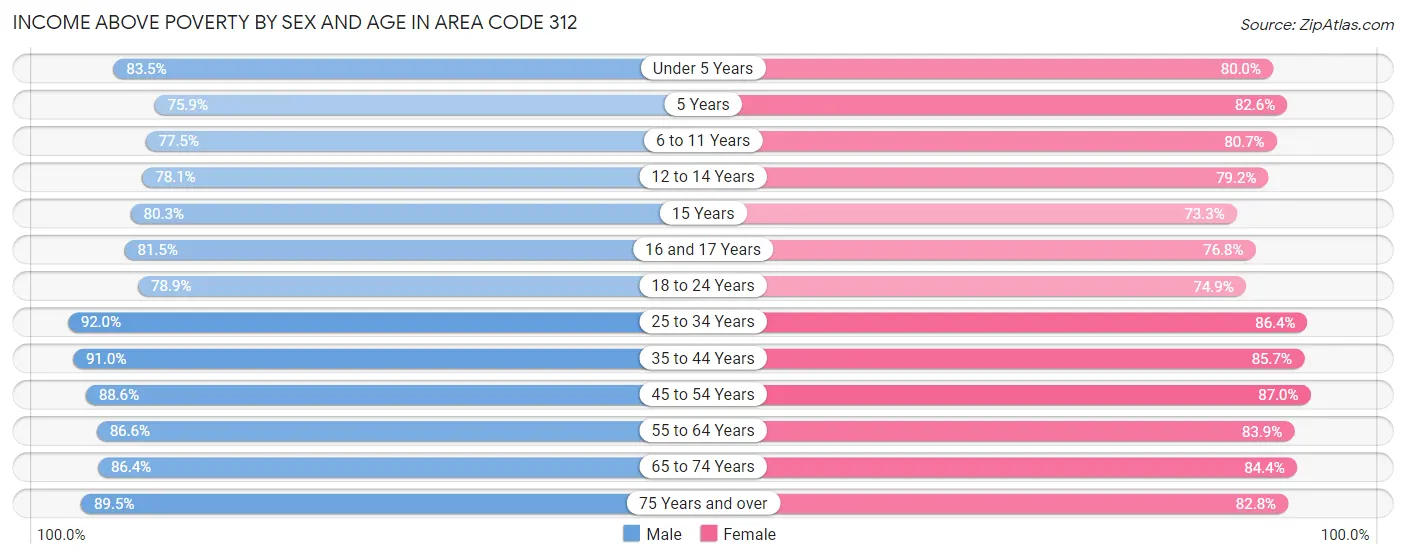
Income Above Poverty by Sex and Age in Area Code 312
According to the poverty statistics in Area Code 312, males aged 25 to 34 years and females aged 45 to 54 years are the age groups that are most secure financially, with 92.0% of males and 87.0% of females in these age groups living above the poverty line.
| Age Bracket | Male | Female |
| Under 5 Years | 35,466 (83.5%) | 34,990 (80.0%) |
| 5 Years | 6,375 (75.9%) | 6,639 (82.6%) |
| 6 to 11 Years | 41,650 (77.5%) | 40,668 (80.7%) |
| 12 to 14 Years | 22,427 (78.1%) | 20,763 (79.1%) |
| 15 Years | 7,215 (80.3%) | 6,439 (73.3%) |
| 16 and 17 Years | 15,178 (81.5%) | 13,903 (76.8%) |
| 18 to 24 Years | 57,214 (78.9%) | 59,640 (74.9%) |
| 25 to 34 Years | 142,529 (92.0%) | 137,063 (86.4%) |
| 35 to 44 Years | 100,797 (91.0%) | 94,964 (85.7%) |
| 45 to 54 Years | 84,020 (88.6%) | 82,959 (87.0%) |
| 55 to 64 Years | 73,544 (86.6%) | 77,105 (83.9%) |
| 65 to 74 Years | 49,467 (86.4%) | 56,780 (84.4%) |
| 75 Years and over | 31,697 (89.5%) | 44,116 (82.8%) |
| Total | 667,579 (86.5%) | 676,029 (83.2%) |
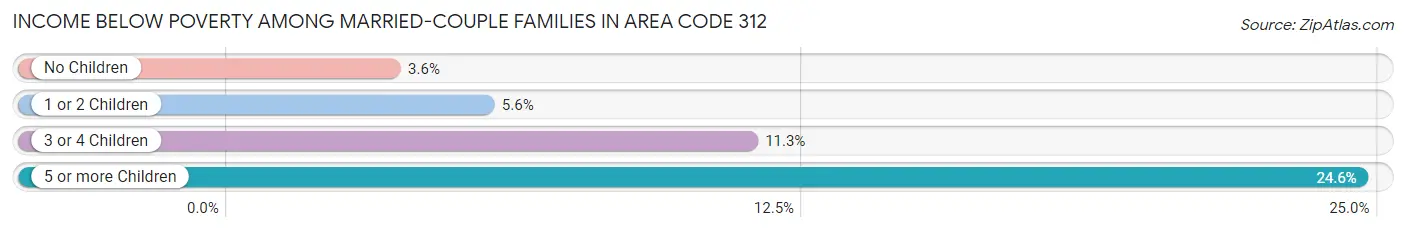
Income Below Poverty Among Married-Couple Families in Area Code 312
The poverty statistics for married-couple families in Area Code 312 show that 4.9% or 11,662 of the total 238,024 families live below the poverty line. Families with 5 or more children have the highest poverty rate of 24.6%, comprising of 259 families. On the other hand, families with no children have the lowest poverty rate of 3.5%, which includes 4,780 families.
| Children | Above Poverty | Below Poverty |
| No Children | 129,725 (96.5%) | 4,780 (3.5%) |
| 1 or 2 Children | 82,021 (94.4%) | 4,859 (5.6%) |
| 3 or 4 Children | 13,822 (88.7%) | 1,764 (11.3%) |
| 5 or more Children | 794 (75.4%) | 259 (24.6%) |
| Total | 226,362 (95.1%) | 11,662 (4.9%) |
Income Below Poverty Among Single-Parent Households in Area Code 312
According to the poverty data in Area Code 312, 13.3% or 3,864 single-father households and 28.6% or 23,414 single-mother households are living below the poverty line. Among single-father households, those with 5 or more children have the highest poverty rate, with 92 households (79.3%) experiencing poverty. Likewise, among single-mother households, those with 5 or more children have the highest poverty rate, with 712 households (70.2%) falling below the poverty line.
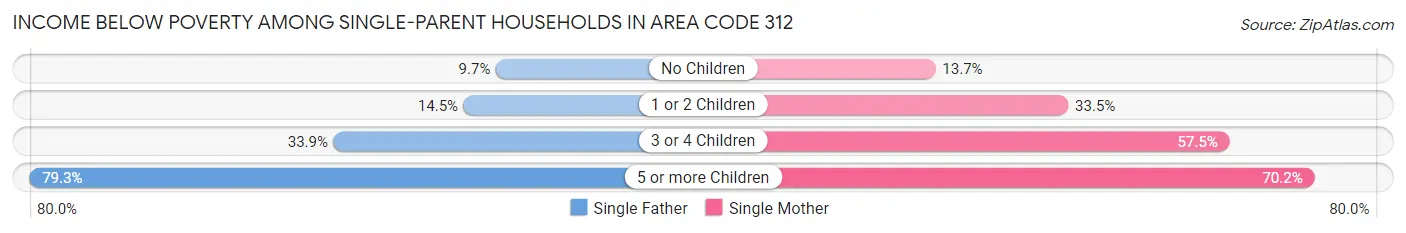
| Children | Single Father | Single Mother |
| No Children | 1,654 (9.7%) | 4,281 (13.7%) |
| 1 or 2 Children | 1,475 (14.5%) | 13,971 (33.5%) |
| 3 or 4 Children | 643 (33.9%) | 4,450 (57.5%) |
| 5 or more Children | 92 (79.3%) | 712 (70.2%) |
| Total | 3,864 (13.3%) | 23,414 (28.6%) |
Income Below Poverty Among Married-Couple vs Single-Parent Households in Area Code 312
The poverty data for Area Code 312 shows that 11,662 of the married-couple family households (4.9%) and 27,278 of the single-parent households (24.6%) are living below the poverty level. Within the married-couple family households, those with 5 or more children have the highest poverty rate, with 259 households (24.6%) falling below the poverty line. Among the single-parent households, those with 5 or more children have the highest poverty rate, with 804 household (71.1%) living below poverty.
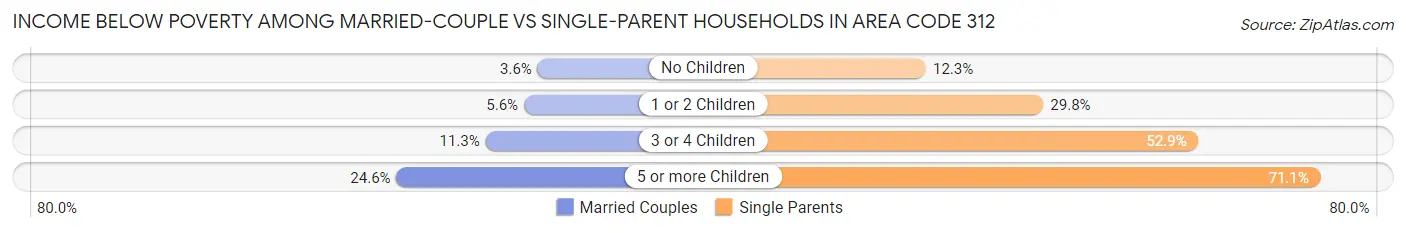
| Children | Married-Couple Families | Single-Parent Households |
| No Children | 4,780 (3.5%) | 5,935 (12.3%) |
| 1 or 2 Children | 4,859 (5.6%) | 15,446 (29.8%) |
| 3 or 4 Children | 1,764 (11.3%) | 5,093 (52.9%) |
| 5 or more Children | 259 (24.6%) | 804 (71.1%) |
| Total | 11,662 (4.9%) | 27,278 (24.6%) |
Race in Area Code 312
The most populous races in Area Code 312 are White / Caucasian (761,090 | 47.2%), Hispanic or Latino (490,480 | 30.4%), and Black / African American (348,014 | 21.6%).
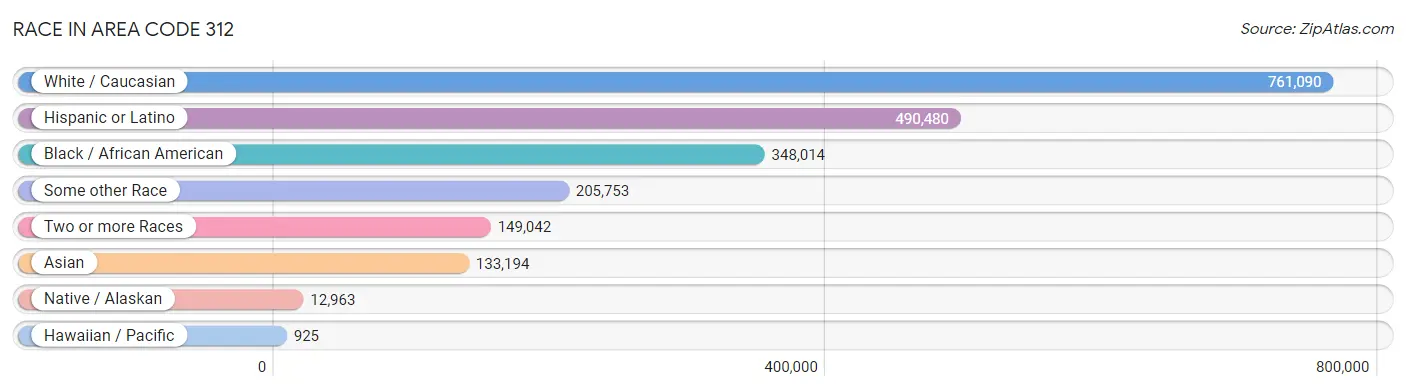
| Race | # Population | % Population |
| Asian | 133,194 | 8.3% |
| Black / African American | 348,014 | 21.6% |
| Hawaiian / Pacific | 925 | 0.1% |
| Hispanic or Latino | 490,480 | 30.4% |
| Native / Alaskan | 12,963 | 0.8% |
| White / Caucasian | 761,090 | 47.2% |
| Two or more Races | 149,042 | 9.2% |
| Some other Race | 205,753 | 12.8% |
| Total | 1,610,981 | 100.0% |
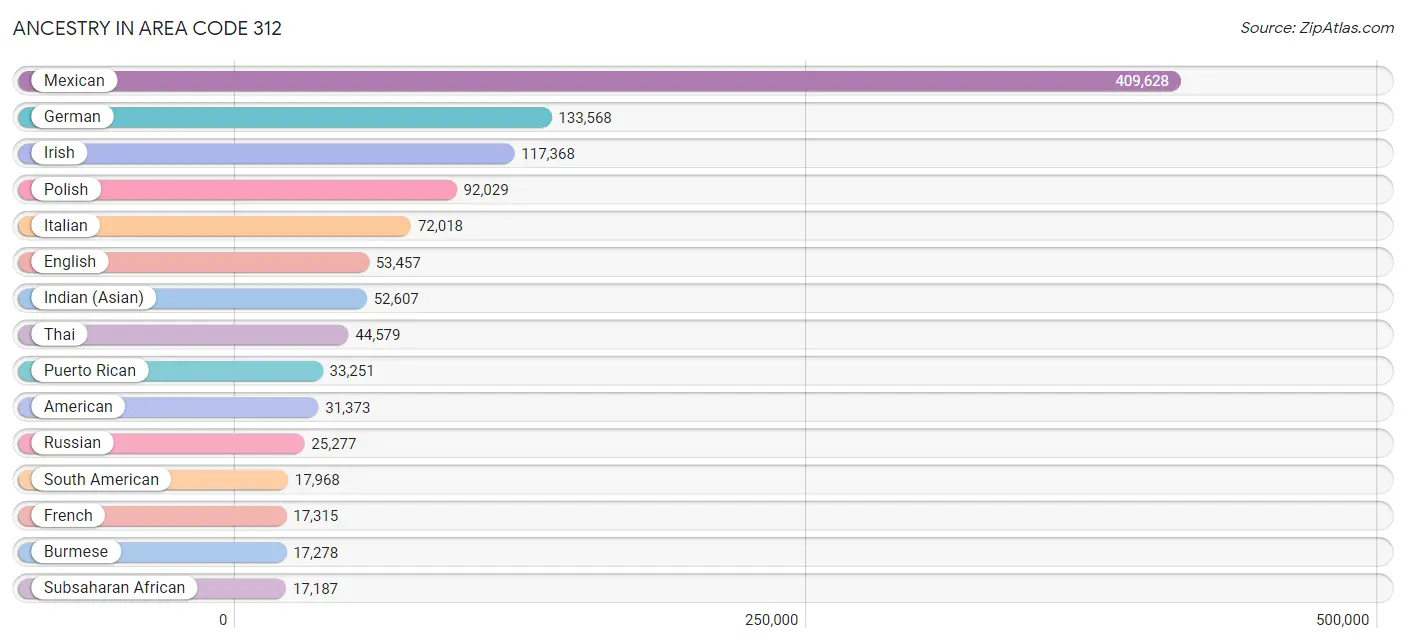
Ancestry in Area Code 312
The most populous ancestries reported in Area Code 312 are Mexican (409,628 | 25.4%), German (133,568 | 8.3%), Irish (117,368 | 7.3%), Polish (92,029 | 5.7%), and Italian (72,018 | 4.5%), together accounting for 51.2% of all Area Code 312 residents.
| Ancestry | # Population | % Population |
| Afghan | 160 | 0.0% |
| African | 8,055 | 0.5% |
| Alaska Native | 44 | 0.0% |
| Albanian | 694 | 0.0% |
| Alsatian | 34 | 0.0% |
| American | 31,373 | 1.9% |
| Apache | 131 | 0.0% |
| Arab | 10,542 | 0.6% |
| Argentinean | 1,571 | 0.1% |
| Armenian | 1,928 | 0.1% |
| Assyrian / Chaldean / Syriac | 1,139 | 0.1% |
| Australian | 989 | 0.1% |
| Austrian | 4,921 | 0.3% |
| Bahamian | 72 | 0.0% |
| Bangladeshi | 231 | 0.0% |
| Barbadian | 277 | 0.0% |
| Basque | 118 | 0.0% |
| Belgian | 2,093 | 0.1% |
| Belizean | 550 | 0.0% |
| Bhutanese | 6,473 | 0.4% |
| Blackfeet | 418 | 0.0% |
| Bolivian | 382 | 0.0% |
| Brazilian | 1,934 | 0.1% |
| British | 5,728 | 0.4% |
| British West Indian | 108 | 0.0% |
| Bulgarian | 2,852 | 0.2% |
| Burmese | 17,278 | 1.1% |
| Cajun | 76 | 0.0% |
| Cambodian | 871 | 0.1% |
| Canadian | 1,795 | 0.1% |
| Cape Verdean | 72 | 0.0% |
| Carpatho Rusyn | 12 | 0.0% |
| Celtic | 86 | 0.0% |
| Central American | 12,942 | 0.8% |
| Central American Indian | 2,389 | 0.2% |
| Cherokee | 2,559 | 0.2% |
| Chickasaw | 41 | 0.0% |
| Chilean | 716 | 0.0% |
| Chinese | 8 | 0.0% |
| Chippewa | 315 | 0.0% |
| Choctaw | 414 | 0.0% |
| Colombian | 4,095 | 0.3% |
| Comanche | 101 | 0.0% |
| Costa Rican | 300 | 0.0% |
| Cree | 121 | 0.0% |
| Creek | 79 | 0.0% |
| Croatian | 4,539 | 0.3% |
| Crow | 8 | 0.0% |
| Cuban | 5,383 | 0.3% |
| Cypriot | 76 | 0.0% |
| Czech | 9,978 | 0.6% |
| Czechoslovakian | 1,125 | 0.1% |
| Danish | 3,101 | 0.2% |
| Delaware | 43 | 0.0% |
| Dominican | 1,618 | 0.1% |
| Dutch | 8,647 | 0.5% |
| Eastern European | 10,076 | 0.6% |
| Ecuadorian | 6,308 | 0.4% |
| Egyptian | 1,312 | 0.1% |
| English | 53,457 | 3.3% |
| Estonian | 199 | 0.0% |
| Ethiopian | 627 | 0.0% |
| European | 17,118 | 1.1% |
| Filipino | 1,824 | 0.1% |
| Finnish | 1,532 | 0.1% |
| French | 17,315 | 1.1% |
| French American Indian | 45 | 0.0% |
| French Canadian | 2,637 | 0.2% |
| German | 133,568 | 8.3% |
| German Russian | 25 | 0.0% |
| Ghanaian | 1,018 | 0.1% |
| Greek | 11,244 | 0.7% |
| Guamanian / Chamorro | 179 | 0.0% |
| Guatemalan | 6,550 | 0.4% |
| Guyanese | 561 | 0.0% |
| Haitian | 1,711 | 0.1% |
| Honduran | 2,063 | 0.1% |
| Hopi | 31 | 0.0% |
| Hungarian | 4,896 | 0.3% |
| Icelander | 80 | 0.0% |
| Indian (Asian) | 52,607 | 3.3% |
| Indonesian | 211 | 0.0% |
| Inupiat | 148 | 0.0% |
| Iranian | 2,461 | 0.2% |
| Iraqi | 962 | 0.1% |
| Irish | 117,368 | 7.3% |
| Iroquois | 173 | 0.0% |
| Israeli | 860 | 0.1% |
| Italian | 72,018 | 4.5% |
| Jamaican | 2,233 | 0.1% |
| Japanese | 496 | 0.0% |
| Jordanian | 1,058 | 0.1% |
| Kenyan | 381 | 0.0% |
| Korean | 15,028 | 0.9% |
| Laotian | 464 | 0.0% |
| Latvian | 861 | 0.1% |
| Lebanese | 2,552 | 0.2% |
| Liberian | 245 | 0.0% |
| Lithuanian | 7,942 | 0.5% |
| Lumbee | 35 | 0.0% |
| Luxembourger | 456 | 0.0% |
| Macedonian | 938 | 0.1% |
| Malaysian | 245 | 0.0% |
| Maltese | 47 | 0.0% |
| Menominee | 43 | 0.0% |
| Mexican | 409,628 | 25.4% |
| Mexican American Indian | 8,697 | 0.5% |
| Mongolian | 189 | 0.0% |
| Moroccan | 638 | 0.0% |
| Native Hawaiian | 882 | 0.1% |
| Navajo | 381 | 0.0% |
| New Zealander | 58 | 0.0% |
| Nicaraguan | 610 | 0.0% |
| Nigerian | 5,040 | 0.3% |
| Northern European | 1,199 | 0.1% |
| Norwegian | 10,782 | 0.7% |
| Okinawan | 95 | 0.0% |
| Osage | 11 | 0.0% |
| Ottawa | 19 | 0.0% |
| Paiute | 4 | 0.0% |
| Pakistani | 2,078 | 0.1% |
| Palestinian | 1,258 | 0.1% |
| Panamanian | 424 | 0.0% |
| Paraguayan | 77 | 0.0% |
| Pennsylvania German | 14 | 0.0% |
| Peruvian | 2,298 | 0.1% |
| Pima | 27 | 0.0% |
| Polish | 92,029 | 5.7% |
| Portuguese | 1,766 | 0.1% |
| Potawatomi | 119 | 0.0% |
| Pueblo | 3 | 0.0% |
| Puerto Rican | 33,251 | 2.1% |
| Romanian | 4,705 | 0.3% |
| Russian | 25,277 | 1.6% |
| Salvadoran | 2,938 | 0.2% |
| Samoan | 70 | 0.0% |
| Scandinavian | 2,392 | 0.2% |
| Scotch-Irish | 4,076 | 0.3% |
| Scottish | 11,376 | 0.7% |
| Seminole | 50 | 0.0% |
| Senegalese | 115 | 0.0% |
| Serbian | 3,348 | 0.2% |
| Sioux | 213 | 0.0% |
| Slavic | 315 | 0.0% |
| Slovak | 2,645 | 0.2% |
| Slovene | 946 | 0.1% |
| South African | 284 | 0.0% |
| South American | 17,968 | 1.1% |
| South American Indian | 457 | 0.0% |
| Soviet Union | 65 | 0.0% |
| Spaniard | 2,891 | 0.2% |
| Spanish | 2,176 | 0.1% |
| Spanish American | 58 | 0.0% |
| Sri Lankan | 2,694 | 0.2% |
| Subsaharan African | 17,187 | 1.1% |
| Sudanese | 161 | 0.0% |
| Swedish | 14,801 | 0.9% |
| Swiss | 2,872 | 0.2% |
| Syrian | 591 | 0.0% |
| Taiwanese | 42 | 0.0% |
| Thai | 44,579 | 2.8% |
| Tlingit-Haida | 22 | 0.0% |
| Tongan | 76 | 0.0% |
| Trinidadian and Tobagonian | 298 | 0.0% |
| Turkish | 1,775 | 0.1% |
| U.S. Virgin Islander | 69 | 0.0% |
| Ugandan | 140 | 0.0% |
| Ukrainian | 11,022 | 0.7% |
| Uruguayan | 195 | 0.0% |
| Venezuelan | 2,220 | 0.1% |
| Vietnamese | 452 | 0.0% |
| Welsh | 3,584 | 0.2% |
| West Indian | 709 | 0.0% |
| Yaqui | 128 | 0.0% |
| Yugoslavian | 981 | 0.1% |
| Yuman | 6 | 0.0% | View All 176 Rows |
Immigrants in Area Code 312
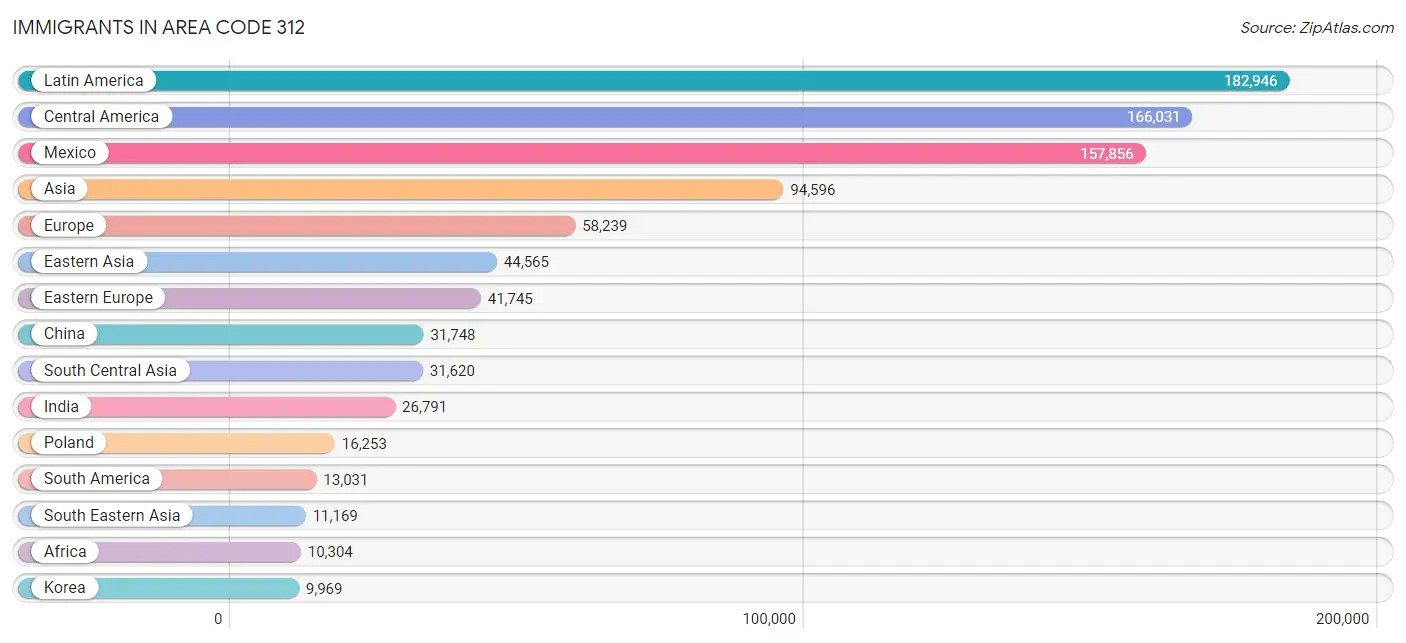
The most numerous immigrant groups reported in Area Code 312 came from Latin America (182,946 | 11.4%), Central America (166,031 | 10.3%), Mexico (157,856 | 9.8%), Asia (94,596 | 5.9%), and Europe (58,239 | 3.6%), together accounting for 41.0% of all Area Code 312 residents.
| Immigration Origin | # Population | % Population |
| Afghanistan | 14 | 0.0% |
| Africa | 10,304 | 0.6% |
| Albania | 296 | 0.0% |
| Argentina | 885 | 0.1% |
| Armenia | 325 | 0.0% |
| Asia | 94,596 | 5.9% |
| Australia | 844 | 0.1% |
| Austria | 433 | 0.0% |
| Bahamas | 27 | 0.0% |
| Bangladesh | 189 | 0.0% |
| Barbados | 29 | 0.0% |
| Belarus | 2,171 | 0.1% |
| Belgium | 150 | 0.0% |
| Belize | 423 | 0.0% |
| Bolivia | 273 | 0.0% |
| Bosnia and Herzegovina | 605 | 0.0% |
| Brazil | 2,628 | 0.2% |
| Bulgaria | 1,856 | 0.1% |
| Cambodia | 154 | 0.0% |
| Cameroon | 145 | 0.0% |
| Canada | 4,551 | 0.3% |
| Caribbean | 3,884 | 0.2% |
| Central America | 166,031 | 10.3% |
| Chile | 494 | 0.0% |
| China | 31,748 | 2.0% |
| Colombia | 1,887 | 0.1% |
| Congo | 150 | 0.0% |
| Costa Rica | 215 | 0.0% |
| Croatia | 465 | 0.0% |
| Cuba | 1,213 | 0.1% |
| Czechoslovakia | 624 | 0.0% |
| Denmark | 164 | 0.0% |
| Dominica | 18 | 0.0% |
| Dominican Republic | 720 | 0.0% |
| Eastern Africa | 1,514 | 0.1% |
| Eastern Asia | 44,565 | 2.8% |
| Eastern Europe | 41,745 | 2.6% |
| Ecuador | 3,202 | 0.2% |
| Egypt | 961 | 0.1% |
| El Salvador | 1,927 | 0.1% |
| England | 1,209 | 0.1% |
| Eritrea | 138 | 0.0% |
| Ethiopia | 266 | 0.0% |
| Europe | 58,239 | 3.6% |
| Fiji | 52 | 0.0% |
| France | 2,027 | 0.1% |
| Germany | 2,825 | 0.2% |
| Ghana | 1,279 | 0.1% |
| Greece | 1,394 | 0.1% |
| Guatemala | 3,291 | 0.2% |
| Guyana | 320 | 0.0% |
| Haiti | 469 | 0.0% |
| Honduras | 1,624 | 0.1% |
| Hong Kong | 1,954 | 0.1% |
| Hungary | 247 | 0.0% |
| India | 26,791 | 1.7% |
| Indonesia | 347 | 0.0% |
| Iran | 1,419 | 0.1% |
| Iraq | 991 | 0.1% |
| Ireland | 989 | 0.1% |
| Israel | 1,110 | 0.1% |
| Italy | 2,414 | 0.2% |
| Jamaica | 1,199 | 0.1% |
| Japan | 2,038 | 0.1% |
| Jordan | 779 | 0.1% |
| Kazakhstan | 208 | 0.0% |
| Kenya | 391 | 0.0% |
| Korea | 9,969 | 0.6% |
| Kuwait | 94 | 0.0% |
| Laos | 89 | 0.0% |
| Latin America | 182,946 | 11.4% |
| Latvia | 221 | 0.0% |
| Lebanon | 491 | 0.0% |
| Liberia | 149 | 0.0% |
| Lithuania | 878 | 0.1% |
| Malaysia | 598 | 0.0% |
| Mexico | 157,856 | 9.8% |
| Middle Africa | 559 | 0.0% |
| Moldova | 688 | 0.0% |
| Morocco | 560 | 0.0% |
| Nepal | 364 | 0.0% |
| Netherlands | 248 | 0.0% |
| Nicaragua | 455 | 0.0% |
| Nigeria | 2,950 | 0.2% |
| North Macedonia | 716 | 0.0% |
| Northern Africa | 1,993 | 0.1% |
| Northern Europe | 5,486 | 0.3% |
| Norway | 116 | 0.0% |
| Oceania | 973 | 0.1% |
| Pakistan | 1,953 | 0.1% |
| Panama | 188 | 0.0% |
| Peru | 1,485 | 0.1% |
| Philippines | 6,758 | 0.4% |
| Poland | 16,253 | 1.0% |
| Portugal | 202 | 0.0% |
| Romania | 1,724 | 0.1% |
| Russia | 4,003 | 0.3% |
| Saudi Arabia | 670 | 0.0% |
| Scotland | 186 | 0.0% |
| Senegal | 109 | 0.0% |
| Serbia | 1,100 | 0.1% |
| Sierra Leone | 39 | 0.0% |
| Singapore | 326 | 0.0% |
| South Africa | 748 | 0.1% |
| South America | 13,031 | 0.8% |
| South Central Asia | 31,620 | 2.0% |
| South Eastern Asia | 11,169 | 0.7% |
| Southern Europe | 4,741 | 0.3% |
| Spain | 731 | 0.1% |
| Sri Lanka | 125 | 0.0% |
| Sweden | 143 | 0.0% |
| Switzerland | 204 | 0.0% |
| Syria | 556 | 0.0% |
| Taiwan | 1,847 | 0.1% |
| Thailand | 945 | 0.1% |
| Trinidad and Tobago | 193 | 0.0% |
| Turkey | 1,371 | 0.1% |
| Uganda | 144 | 0.0% |
| Ukraine | 8,161 | 0.5% |
| Uruguay | 28 | 0.0% |
| Uzbekistan | 372 | 0.0% |
| Venezuela | 1,757 | 0.1% |
| Vietnam | 1,712 | 0.1% |
| Western Africa | 5,278 | 0.3% |
| Western Asia | 6,857 | 0.4% |
| Western Europe | 5,887 | 0.4% |
| Yemen | 17 | 0.0% |
| Zaire | 186 | 0.0% |
| Zimbabwe | 43 | 0.0% | View All 129 Rows |
Sex and Age in Area Code 312
Sex and Age in Area Code 312
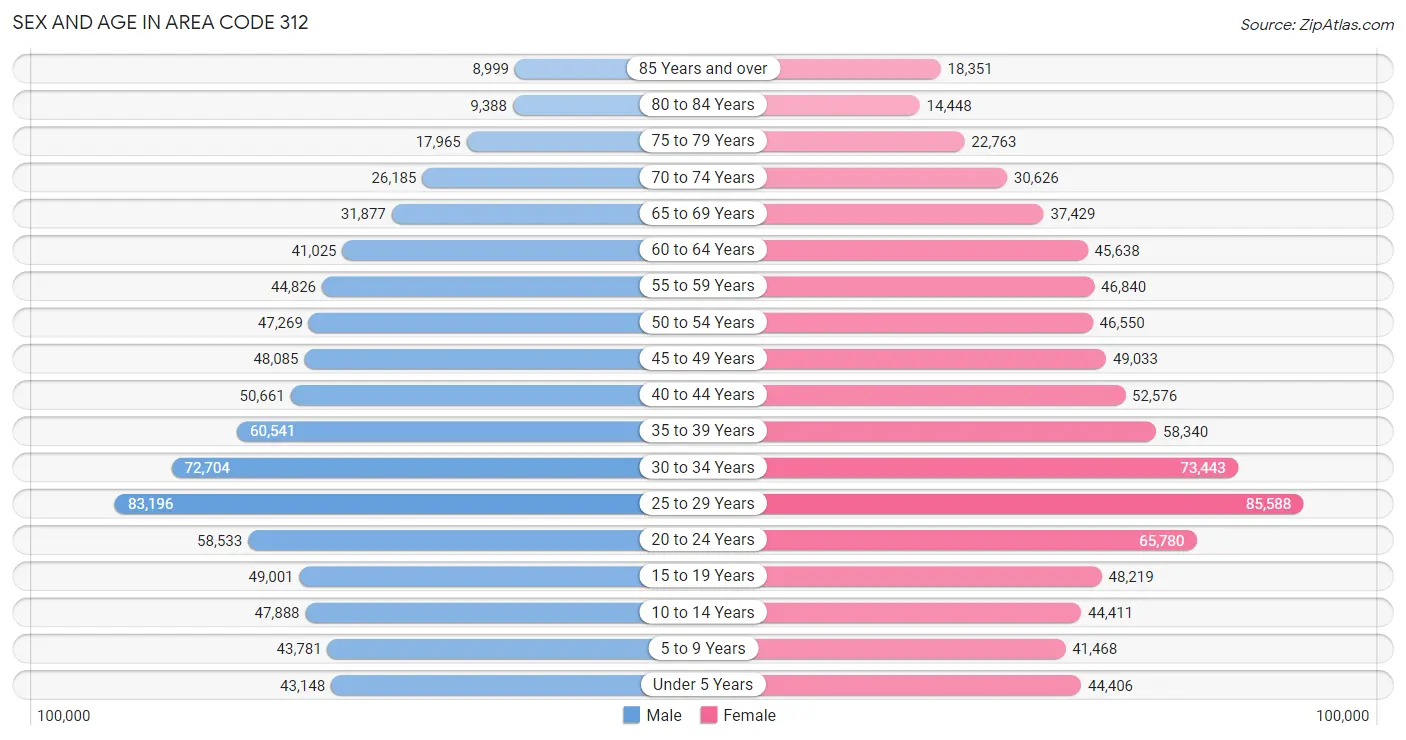
The most populous age groups in Area Code 312 are 25 to 29 Years (83,196 | 10.6%) for men and 25 to 29 Years (85,588 | 10.4%) for women.
| Age Bracket | Male | Female |
| Under 5 Years | 43,148 (5.5%) | 44,406 (5.4%) |
| 5 to 9 Years | 43,781 (5.6%) | 41,468 (5.0%) |
| 10 to 14 Years | 47,888 (6.1%) | 44,411 (5.4%) |
| 15 to 19 Years | 49,001 (6.2%) | 48,219 (5.8%) |
| 20 to 24 Years | 58,533 (7.5%) | 65,780 (8.0%) |
| 25 to 29 Years | 83,196 (10.6%) | 85,588 (10.4%) |
| 30 to 34 Years | 72,704 (9.3%) | 73,443 (8.9%) |
| 35 to 39 Years | 60,541 (7.7%) | 58,340 (7.1%) |
| 40 to 44 Years | 50,661 (6.5%) | 52,576 (6.4%) |
| 45 to 49 Years | 48,085 (6.1%) | 49,033 (5.9%) |
| 50 to 54 Years | 47,269 (6.0%) | 46,550 (5.6%) |
| 55 to 59 Years | 44,826 (5.7%) | 46,840 (5.7%) |
| 60 to 64 Years | 41,025 (5.2%) | 45,638 (5.5%) |
| 65 to 69 Years | 31,877 (4.1%) | 37,429 (4.5%) |
| 70 to 74 Years | 26,185 (3.3%) | 30,626 (3.7%) |
| 75 to 79 Years | 17,965 (2.3%) | 22,763 (2.8%) |
| 80 to 84 Years | 9,388 (1.2%) | 14,448 (1.8%) |
| 85 Years and over | 8,999 (1.1%) | 18,351 (2.2%) |
| Total | 785,072 (100.0%) | 825,909 (100.0%) |
Families and Households in Area Code 312
Median Family Size in Area Code 312
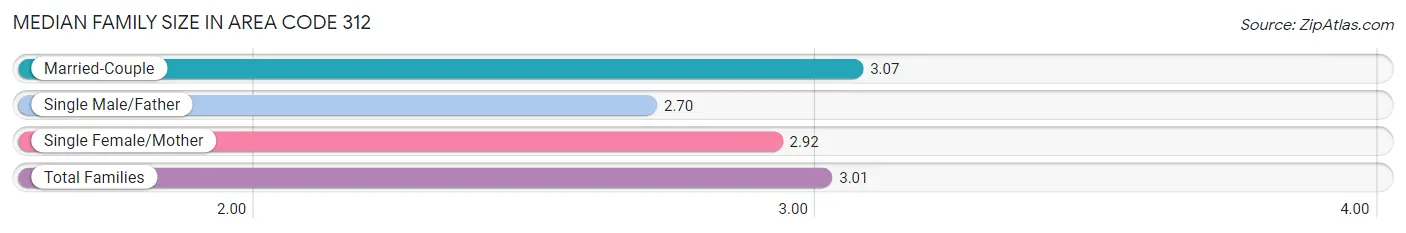
The median family size in Area Code 312 is 3.01 persons per family, with married-couple families (238,024 | 68.2%) accounting for the largest median family size of 3.06604 persons per family. On the other hand, single male/father families (29,162 | 8.4%) represent the smallest median family size with 2.70 persons per family.
| Family Type | # Families | Family Size |
| Married-Couple | 238,024 (68.2%) | 3.07 |
| Single Male/Father | 29,162 (8.4%) | 2.70 |
| Single Female/Mother | 81,832 (23.4%) | 2.92 |
| Total Families | 349,018 (100.0%) | 3.01 |
Median Household Size in Area Code 312
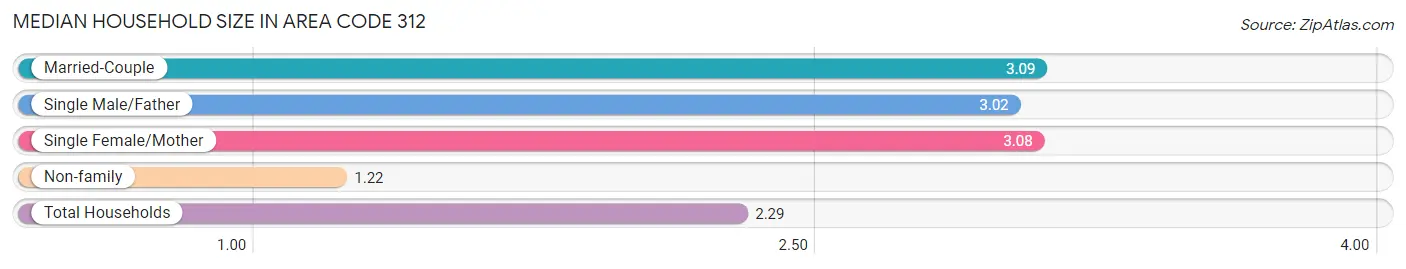
The median household size in Area Code 312 is 2.29 persons per household, with married-couple households (238,024 | 35.1%) accounting for the largest median household size of 3.09093 persons per household. non-family households (328,591 | 48.5%) represent the smallest median household size with 1.22 persons per household.
| Household Type | # Households | Household Size |
| Married-Couple | 238,024 (35.1%) | 3.09 |
| Single Male/Father | 29,162 (4.3%) | 3.02 |
| Single Female/Mother | 81,832 (12.1%) | 3.08 |
| Non-family | 328,591 (48.5%) | 1.22 |
| Total Households | 677,609 (100.0%) | 2.29 |
Household Size by Marriage Status in Area Code 312
Out of a total of 677,609 households in Area Code 312, 349,018 (51.5%) are family households, while 328,591 (48.5%) are nonfamily households. The most numerous type of family households are 2-person households, comprising 145,910, and the most common type of nonfamily households are 1-person households, comprising 262,080.
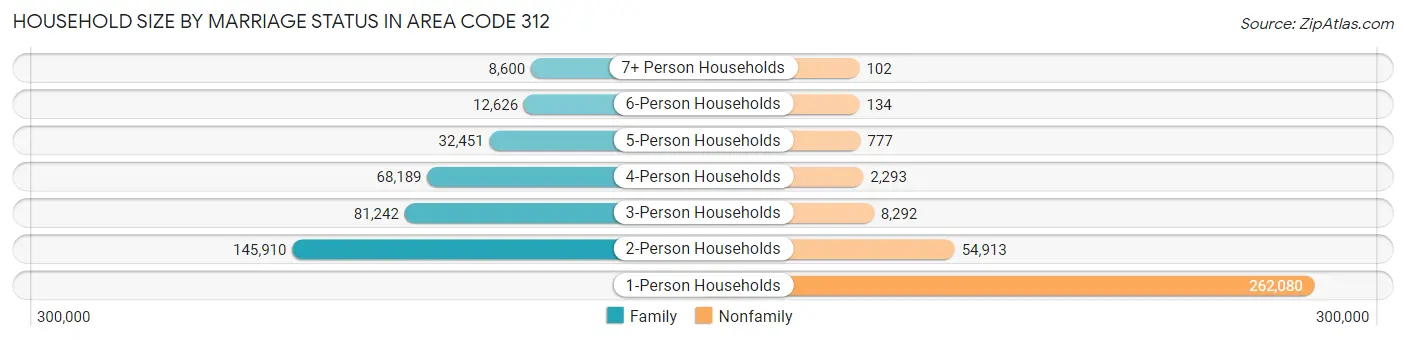
| Household Size | Family Households | Nonfamily Households |
| 1-Person Households | - | 262,080 (38.7%) |
| 2-Person Households | 145,910 (21.5%) | 54,913 (8.1%) |
| 3-Person Households | 81,242 (12.0%) | 8,292 (1.2%) |
| 4-Person Households | 68,189 (10.1%) | 2,293 (0.3%) |
| 5-Person Households | 32,451 (4.8%) | 777 (0.1%) |
| 6-Person Households | 12,626 (1.9%) | 134 (0.0%) |
| 7+ Person Households | 8,600 (1.3%) | 102 (0.0%) |
| Total | 349,018 (51.5%) | 328,591 (48.5%) |
Female Fertility in Area Code 312
Fertility by Age in Area Code 312
Average fertility rate in Area Code 312 is 41.2 births per 1,000 women. Women in the age bracket of 20 to 34 years have the highest fertility rate with 57.9 births per 1,000 women. Women in the age bracket of 20 to 34 years acount for 61.5% of all women with births.
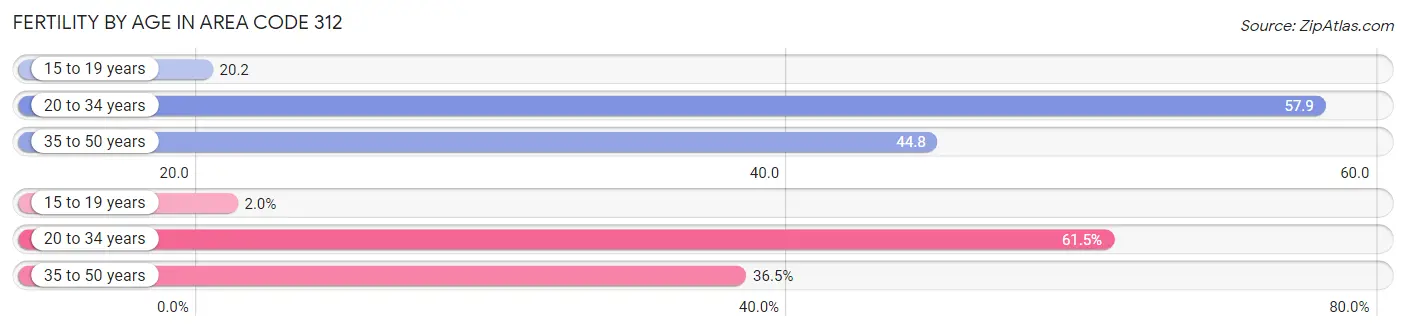
| Age Bracket | Women with Births | Births / 1,000 Women |
| 15 to 19 years | 369 (2.0%) | 20.2 |
| 20 to 34 years | 11,338 (61.5%) | 57.9 |
| 35 to 50 years | 6,735 (36.5%) | 44.8 |
| Total | 18,442 (100.0%) | 41.2 |
Fertility by Age by Marriage Status in Area Code 312
68.1% of women with births (18,442) in Area Code 312 are married. The highest percentage of unmarried women with births falls into 15 to 19 years age bracket with 100.0% of them unmarried at the time of birth, while the lowest percentage of unmarried women with births belong to 35 to 50 years age bracket with 29.3% of them unmarried.
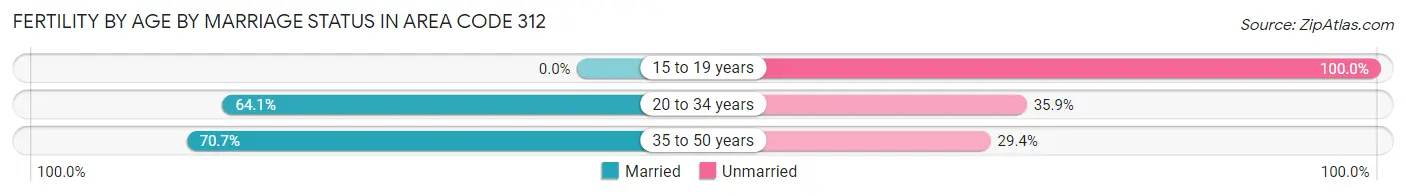
| Age Bracket | Married | Unmarried |
| 15 to 19 years | 0 (0.0%) | 369 (100.0%) |
| 20 to 34 years | 7,270 (64.1%) | 4,068 (35.9%) |
| 35 to 50 years | 4,758 (70.7%) | 1,977 (29.3%) |
| Total | 12,552 (68.1%) | 5,890 (31.9%) |
Fertility by Education in Area Code 312
Average fertility rate in Area Code 312 is 41.2 births per 1,000 women. Women with the education attainment of graduate degree have the highest fertility rate of 57.9 births per 1,000 women, while women with the education attainment of less than high school have the lowest fertility at 38.9 births per 1,000 women. Women with the education attainment of graduate degree represent 25.4% of all women with births.
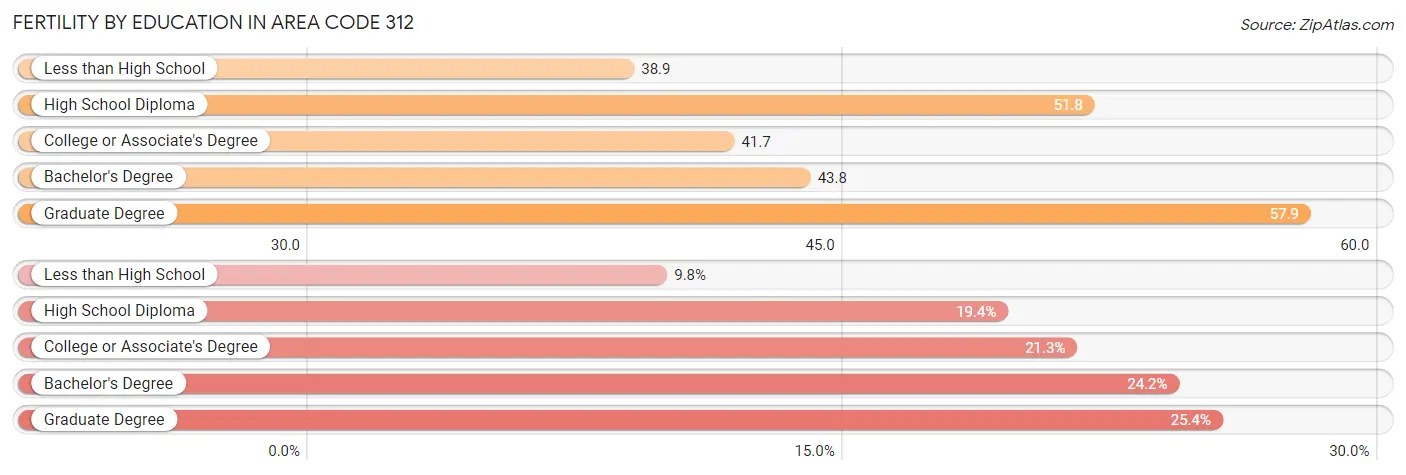
| Educational Attainment | Women with Births | Births / 1,000 Women |
| Less than High School | 1,803 (9.8%) | 38.9 |
| High School Diploma | 3,571 (19.4%) | 51.8 |
| College or Associate's Degree | 3,928 (21.3%) | 41.7 |
| Bachelor's Degree | 4,457 (24.2%) | 43.8 |
| Graduate Degree | 4,683 (25.4%) | 57.9 |
| Total | 18,442 (100.0%) | 41.2 |
Fertility by Education by Marriage Status in Area Code 312
31.9% of women with births in Area Code 312 are unmarried. Women with the educational attainment of graduate degree are most likely to be married with 72.4% of them married at childbirth, while women with the educational attainment of less than high school are least likely to be married with 71.1% of them unmarried at childbirth.
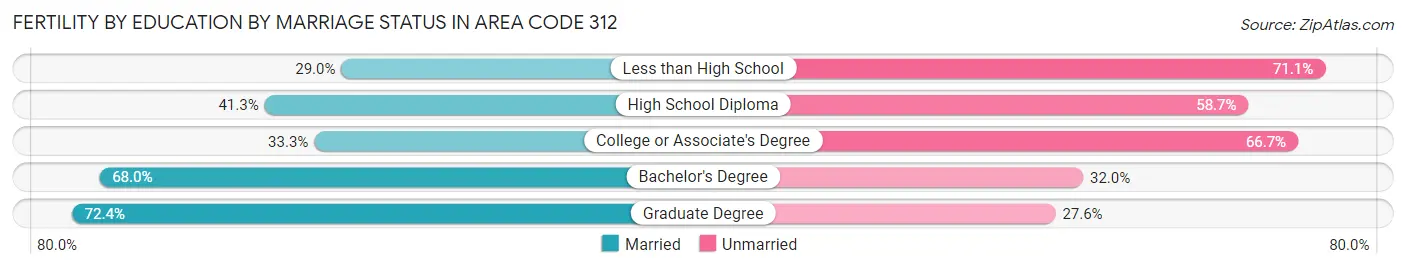
| Educational Attainment | Married | Unmarried |
| Less than High School | 522 (28.9%) | 1,281 (71.1%) |
| High School Diploma | 1,476 (41.3%) | 2,095 (58.7%) |
| College or Associate's Degree | 1,309 (33.3%) | 2,619 (66.7%) |
| Bachelor's Degree | 3,029 (68.0%) | 1,428 (32.0%) |
| Graduate Degree | 3,391 (72.4%) | 1,292 (27.6%) |
| Total | 12,552 (68.1%) | 5,890 (31.9%) |
Employment Characteristics in Area Code 312
Employment by Class of Employer in Area Code 312
Among the 815,329 employed individuals in Area Code 312, private company employees (569,209 | 69.8%), not-for-profit organizations (87,887 | 10.8%), and local government employees (52,330 | 6.4%) make up the most common classes of employment.
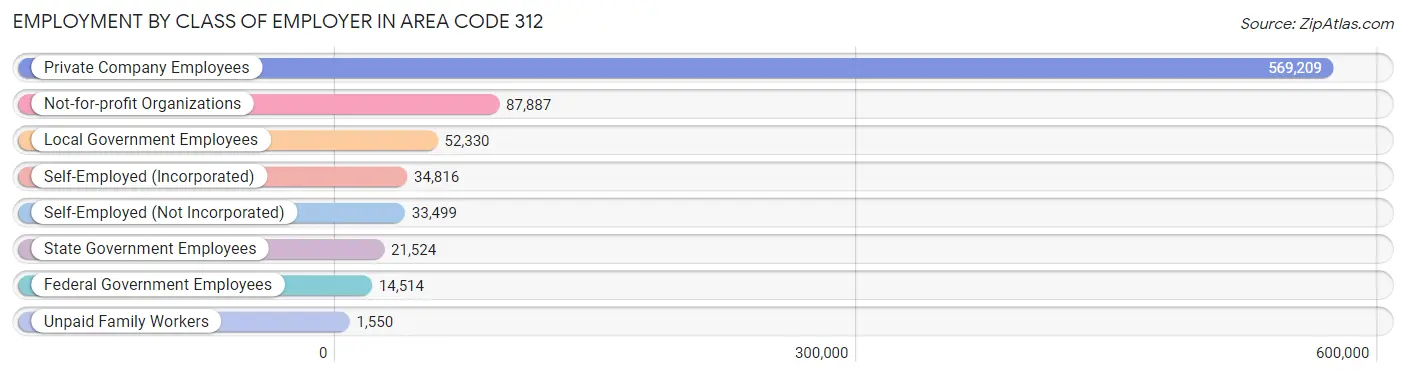
| Employer Class | # Employees | % Employees |
| Private Company Employees | 569,209 | 69.8% |
| Self-Employed (Incorporated) | 34,816 | 4.3% |
| Self-Employed (Not Incorporated) | 33,499 | 4.1% |
| Not-for-profit Organizations | 87,887 | 10.8% |
| Local Government Employees | 52,330 | 6.4% |
| State Government Employees | 21,524 | 2.6% |
| Federal Government Employees | 14,514 | 1.8% |
| Unpaid Family Workers | 1,550 | 0.2% |
| Total | 815,329 | 100.0% |
Employment Status by Age in Area Code 312
According to the labor force statistics for Area Code 312, out of the total population over 16 years of age (1,328,063), 68.9% or 914,637 individuals are in the labor force, with 6.9% or 62,653 of them unemployed. The age group with the highest labor force participation rate is 35 to 44 years, with 87.0% or 193,287 individuals in the labor force. Within the labor force, the 16 to 19 years age range has the highest percentage of unemployed individuals, with 1,126.8% or 285,959 of them being unemployed.
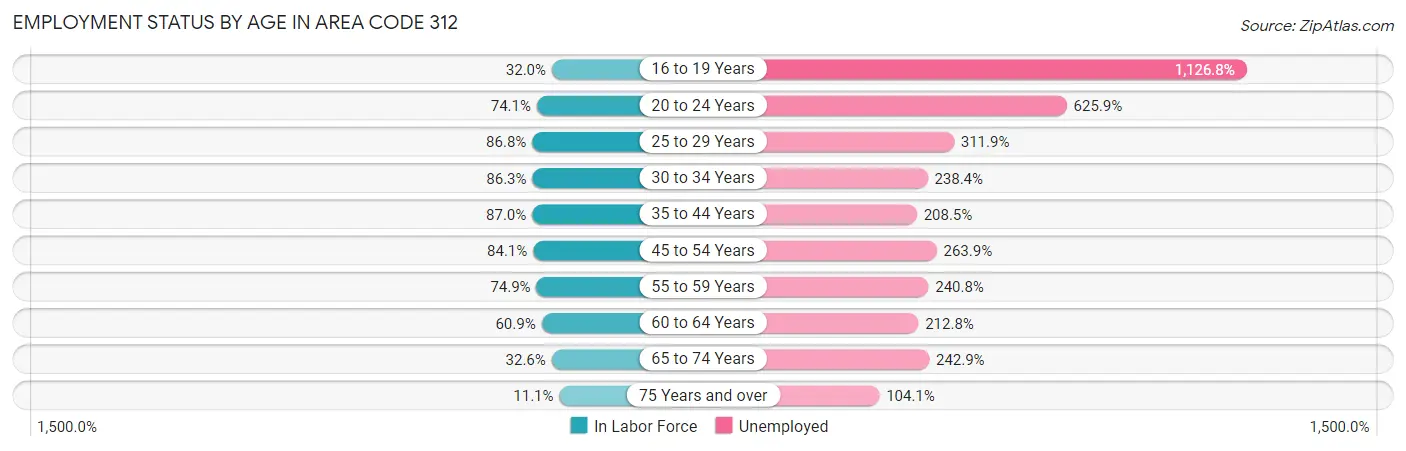
| Age Bracket | In Labor Force | Unemployed |
| 16 to 19 Years | 25,381 (32.0%) | 285,959 (1,126.8%) |
| 20 to 24 Years | 92,049 (74.1%) | 576,166 (625.9%) |
| 25 to 29 Years | 146,497 (86.8%) | 456,949 (311.9%) |
| 30 to 34 Years | 126,132 (86.3%) | 300,682 (238.4%) |
| 35 to 44 Years | 193,294 (87.0%) | 403,003 (208.5%) |
| 45 to 54 Years | 160,636 (84.1%) | 423,916 (263.9%) |
| 55 to 59 Years | 68,683 (74.9%) | 165,393 (240.8%) |
| 60 to 64 Years | 52,804 (60.9%) | 112,367 (212.8%) |
| 65 to 74 Years | 41,170 (32.6%) | 99,990 (242.9%) |
| 75 Years and over | 10,182 (11.1%) | 10,602 (104.1%) |
| Total | 914,572 (68.9%) | 62,663 (6.9%) |
Employment Status by Educational Attainment in Area Code 312
According to labor force statistics for Area Code 312, 82.1% of individuals (743,994) out of the total population between 25 and 64 years of age (906,315) are in the labor force, with 239.0% or 1,778,146 of them being unemployed. The group with the highest labor force participation rate are those with the educational attainment of bachelor's degree or higher, with 88.4% or 405,926 individuals in the labor force. Within the labor force, individuals with less than high school education have the highest percentage of unemployment, with 518.0% or 295,063 of them being unemployed.
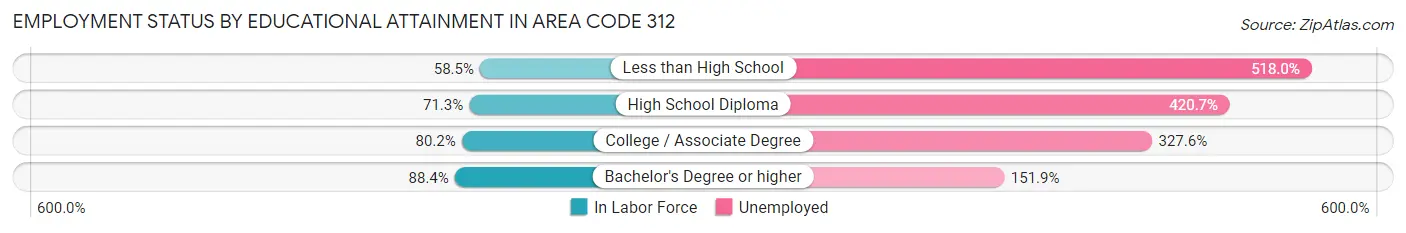
| Educational Attainment | In Labor Force | Unemployed |
| Less than High School | 56,965 (58.5%) | 504,382 (518.0%) |
| High School Diploma | 121,451 (71.3%) | 716,612 (420.7%) |
| College / Associate Degree | 143,993 (80.2%) | 588,268 (327.6%) |
| Bachelor's Degree or higher | 405,927 (88.4%) | 697,277 (151.9%) |
| Total | 743,958 (82.1%) | 2,166,093 (239.0%) |
Employment Occupations by Sex in Area Code 312
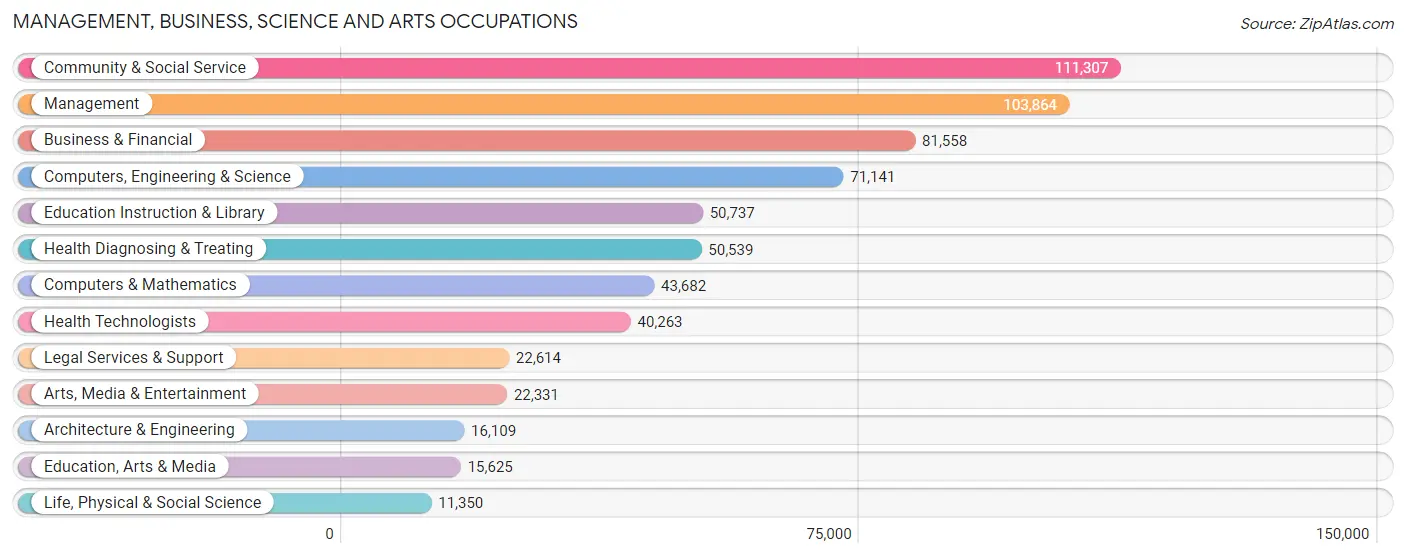
Management, Business, Science and Arts Occupations
The most common Management, Business, Science and Arts occupations in Area Code 312 are Community & Social Service (111,307 | 13.4%), Management (103,864 | 12.5%), Business & Financial (81,558 | 9.8%), Computers, Engineering & Science (71,141 | 8.6%), and Education Instruction & Library (50,737 | 6.1%).
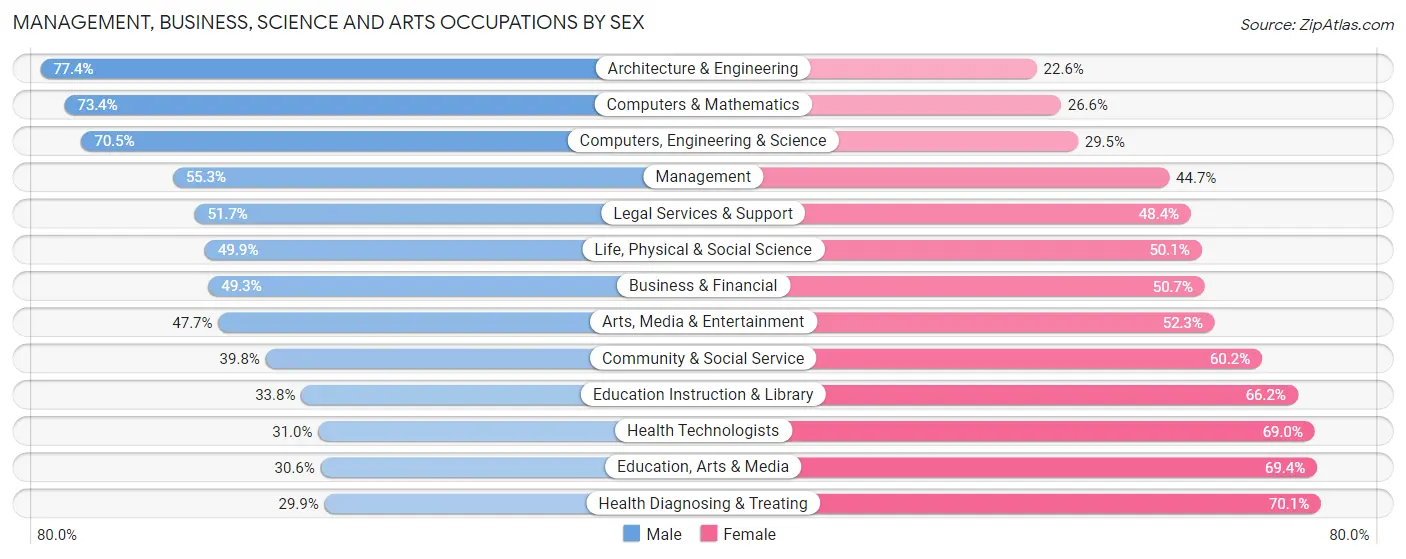
Management, Business, Science and Arts Occupations by Sex
Within the Management, Business, Science and Arts occupations in Area Code 312, the most male-oriented occupations are Architecture & Engineering (77.4%), Computers & Mathematics (73.4%), and Computers, Engineering & Science (70.5%), while the most female-oriented occupations are Health Diagnosing & Treating (70.1%), Education, Arts & Media (69.4%), and Health Technologists (69.0%).
| Occupation | Male | Female |
| Management | 57,415 (55.3%) | 46,449 (44.7%) |
| Business & Financial | 40,232 (49.3%) | 41,326 (50.7%) |
| Computers, Engineering & Science | 50,175 (70.5%) | 20,966 (29.5%) |
| Computers & Mathematics | 32,046 (73.4%) | 11,636 (26.6%) |
| Architecture & Engineering | 12,466 (77.4%) | 3,643 (22.6%) |
| Life, Physical & Social Science | 5,663 (49.9%) | 5,687 (50.1%) |
| Community & Social Service | 44,268 (39.8%) | 67,039 (60.2%) |
| Education, Arts & Media | 4,782 (30.6%) | 10,843 (69.4%) |
| Legal Services & Support | 11,680 (51.6%) | 10,934 (48.3%) |
| Education Instruction & Library | 17,163 (33.8%) | 33,574 (66.2%) |
| Arts, Media & Entertainment | 10,643 (47.7%) | 11,688 (52.3%) |
| Health Diagnosing & Treating | 15,129 (29.9%) | 35,410 (70.1%) |
| Health Technologists | 12,476 (31.0%) | 27,787 (69.0%) |
| Total (Category) | 207,219 (49.5%) | 211,190 (50.5%) |
| Total (Overall) | 434,378 (52.3%) | 396,500 (47.7%) |
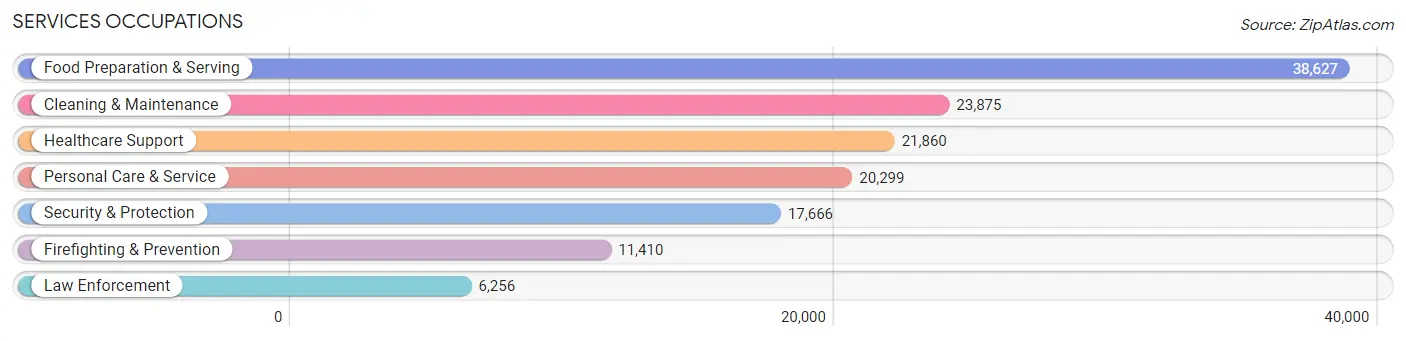
Services Occupations
The most common Services occupations in Area Code 312 are Food Preparation & Serving (38,627 | 4.6%), Cleaning & Maintenance (23,875 | 2.9%), Healthcare Support (21,860 | 2.6%), Personal Care & Service (20,299 | 2.4%), and Security & Protection (17,666 | 2.1%).
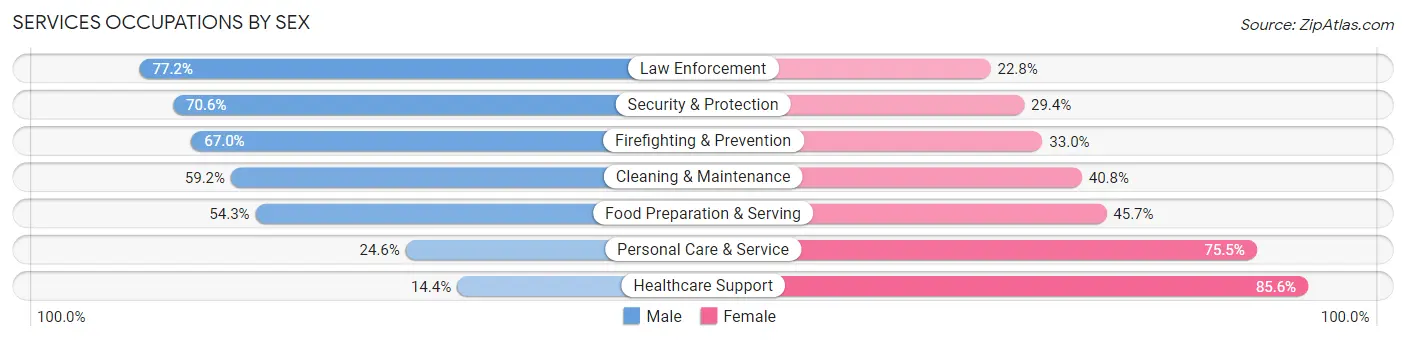
Services Occupations by Sex
Within the Services occupations in Area Code 312, the most male-oriented occupations are Law Enforcement (77.2%), Security & Protection (70.6%), and Firefighting & Prevention (67.0%), while the most female-oriented occupations are Healthcare Support (85.6%), Personal Care & Service (75.4%), and Food Preparation & Serving (45.7%).
| Occupation | Male | Female |
| Healthcare Support | 3,143 (14.4%) | 18,717 (85.6%) |
| Security & Protection | 12,471 (70.6%) | 5,195 (29.4%) |
| Firefighting & Prevention | 7,640 (67.0%) | 3,770 (33.0%) |
| Law Enforcement | 4,831 (77.2%) | 1,425 (22.8%) |
| Food Preparation & Serving | 20,976 (54.3%) | 17,651 (45.7%) |
| Cleaning & Maintenance | 14,124 (59.2%) | 9,751 (40.8%) |
| Personal Care & Service | 4,984 (24.5%) | 15,315 (75.4%) |
| Total (Category) | 55,698 (45.5%) | 66,629 (54.5%) |
| Total (Overall) | 434,378 (52.3%) | 396,500 (47.7%) |
Sales and Office Occupations
The most common Sales and Office occupations in Area Code 312 are Sales & Related (80,531 | 9.7%), and Office & Administration (76,943 | 9.3%).
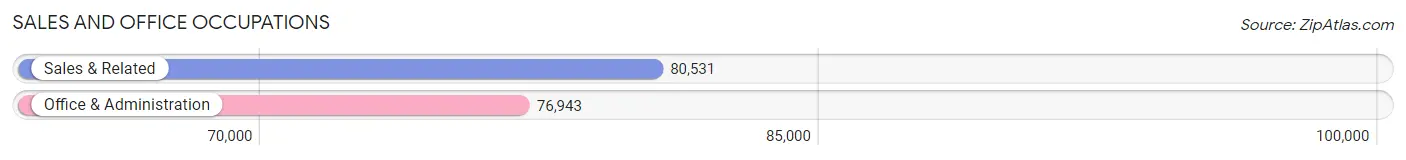
Sales and Office Occupations by Sex
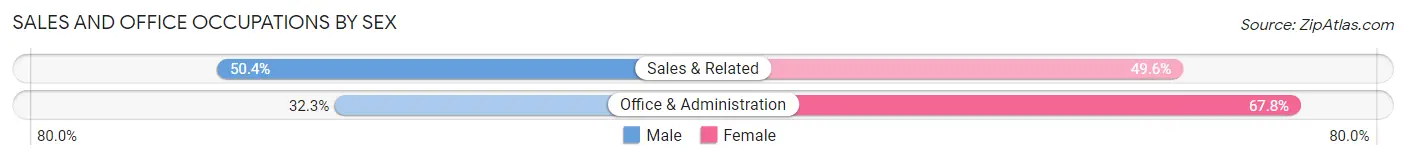
| Occupation | Male | Female |
| Sales & Related | 40,586 (50.4%) | 39,945 (49.6%) |
| Office & Administration | 24,814 (32.3%) | 52,129 (67.7%) |
| Total (Category) | 65,400 (41.5%) | 92,074 (58.5%) |
| Total (Overall) | 434,378 (52.3%) | 396,500 (47.7%) |
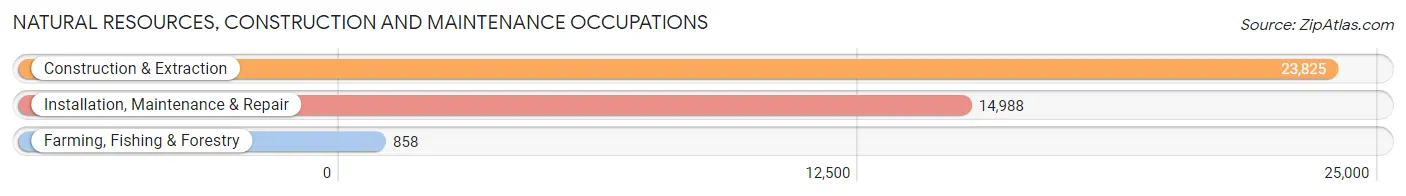
Natural Resources, Construction and Maintenance Occupations
The most common Natural Resources, Construction and Maintenance occupations in Area Code 312 are Construction & Extraction (23,825 | 2.9%), Installation, Maintenance & Repair (14,988 | 1.8%), and Farming, Fishing & Forestry (858 | 0.1%).
Natural Resources, Construction and Maintenance Occupations by Sex
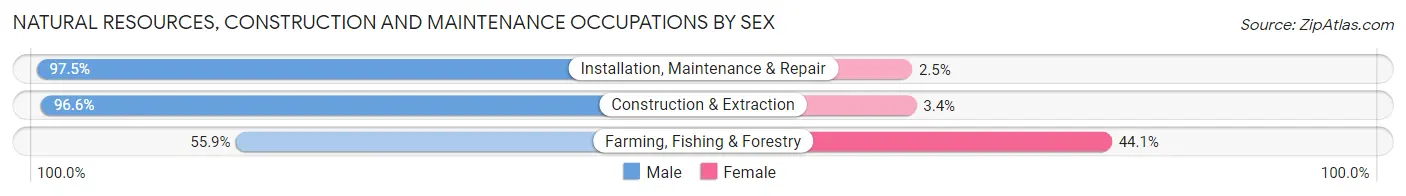
| Occupation | Male | Female |
| Farming, Fishing & Forestry | 480 (55.9%) | 378 (44.1%) |
| Construction & Extraction | 23,010 (96.6%) | 815 (3.4%) |
| Installation, Maintenance & Repair | 14,614 (97.5%) | 374 (2.5%) |
| Total (Category) | 38,104 (96.1%) | 1,567 (4.0%) |
| Total (Overall) | 434,378 (52.3%) | 396,500 (47.7%) |
Production, Transportation and Moving Occupations
The most common Production, Transportation and Moving occupations in Area Code 312 are Production (36,234 | 4.4%), Transportation (29,430 | 3.5%), and Material Moving (27,333 | 3.3%).
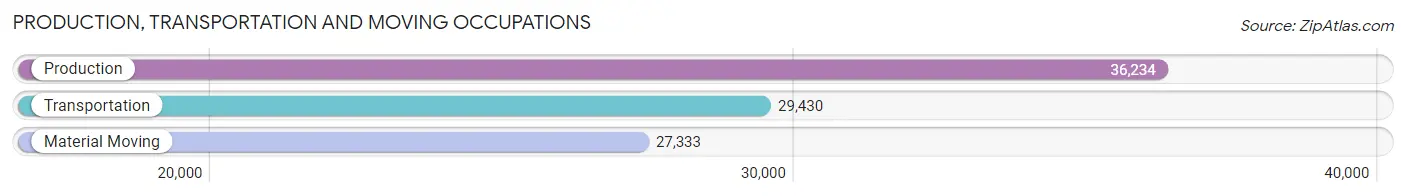
Production, Transportation and Moving Occupations by Sex
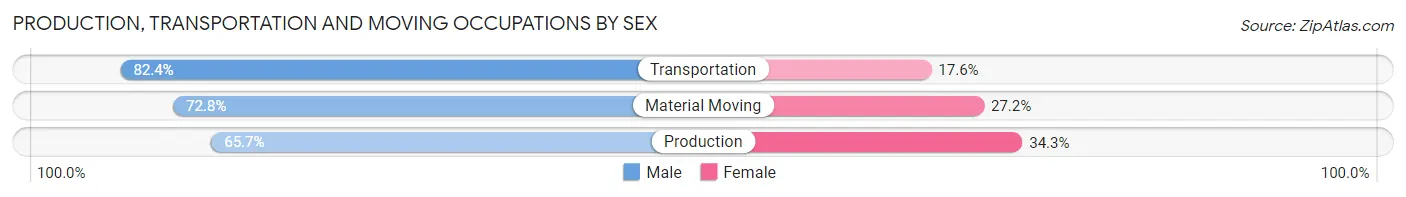
| Occupation | Male | Female |
| Production | 23,816 (65.7%) | 12,418 (34.3%) |
| Transportation | 24,253 (82.4%) | 5,177 (17.6%) |
| Material Moving | 19,888 (72.8%) | 7,445 (27.2%) |
| Total (Category) | 67,957 (73.1%) | 25,040 (26.9%) |
| Total (Overall) | 434,378 (52.3%) | 396,500 (47.7%) |
Employment Industries by Sex in Area Code 312
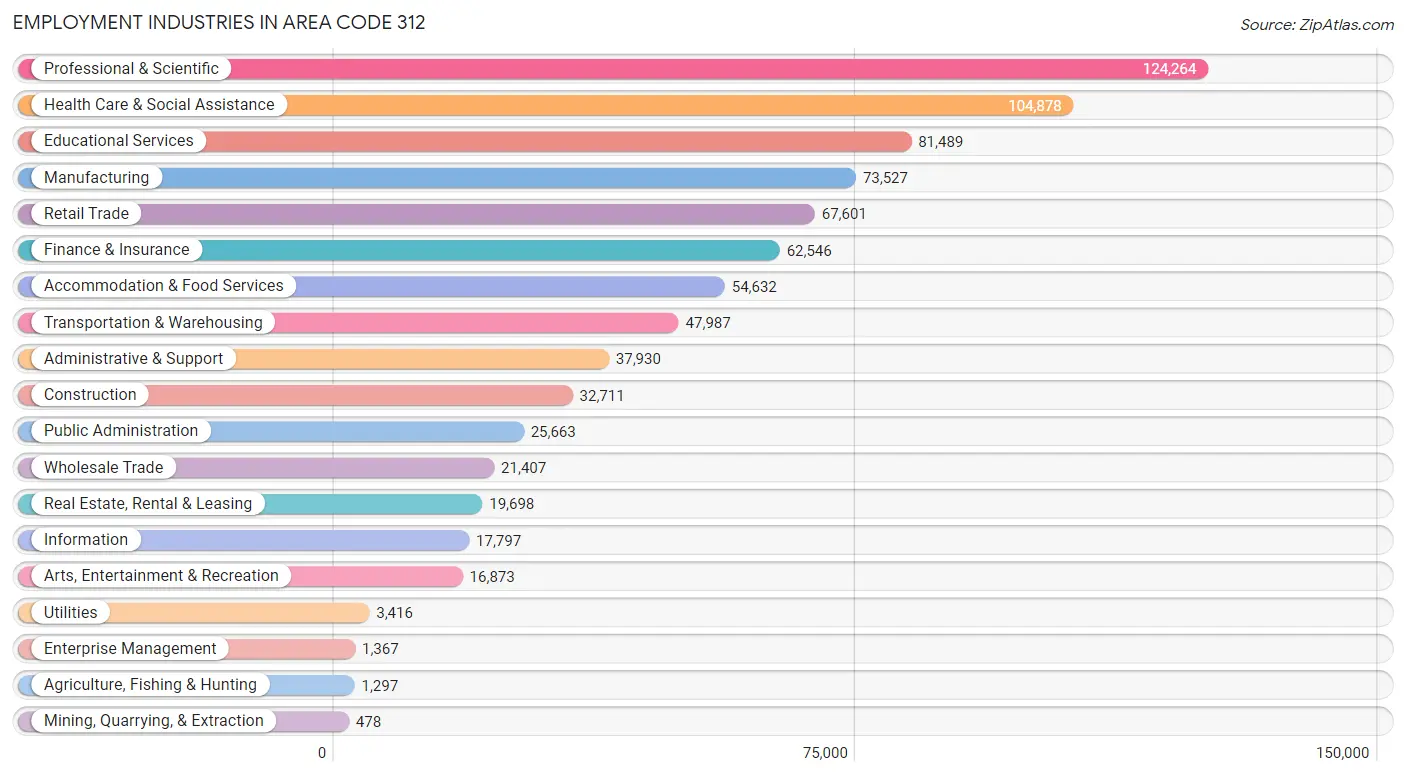
Employment Industries in Area Code 312
The major employment industries in Area Code 312 include Professional & Scientific (124,264 | 15.0%), Health Care & Social Assistance (104,878 | 12.6%), Educational Services (81,489 | 9.8%), Manufacturing (73,527 | 8.8%), and Retail Trade (67,601 | 8.1%).
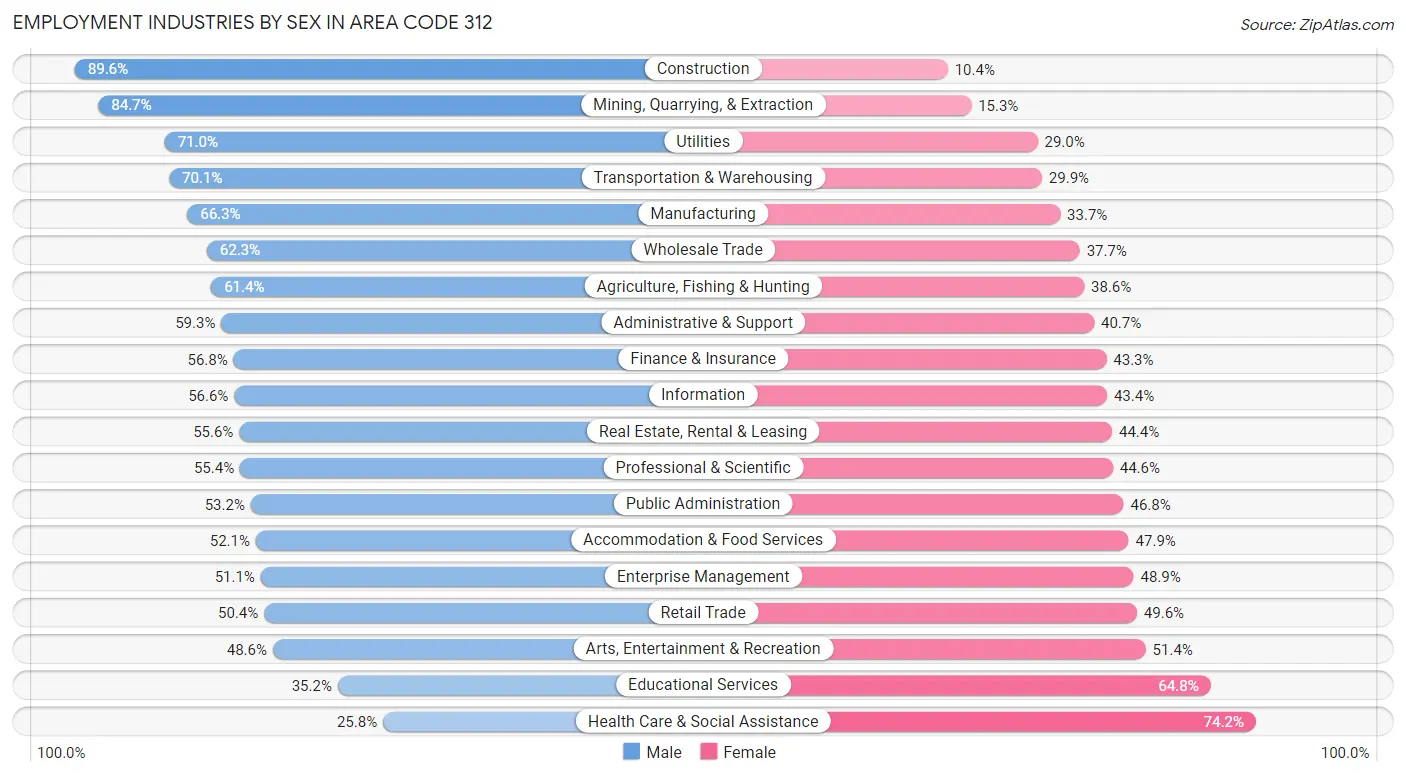
Employment Industries by Sex in Area Code 312
The Area Code 312 industries that see more men than women are Construction (89.6%), Mining, Quarrying, & Extraction (84.7%), and Utilities (71.0%), whereas the industries that tend to have a higher number of women are Health Care & Social Assistance (74.2%), Educational Services (64.8%), and Arts, Entertainment & Recreation (51.4%).
| Industry | Male | Female |
| Agriculture, Fishing & Hunting | 796 (61.4%) | 501 (38.6%) |
| Mining, Quarrying, & Extraction | 405 (84.7%) | 73 (15.3%) |
| Construction | 29,307 (89.6%) | 3,404 (10.4%) |
| Manufacturing | 48,766 (66.3%) | 24,761 (33.7%) |
| Wholesale Trade | 13,331 (62.3%) | 8,076 (37.7%) |
| Retail Trade | 34,094 (50.4%) | 33,507 (49.6%) |
| Transportation & Warehousing | 33,632 (70.1%) | 14,355 (29.9%) |
| Utilities | 2,425 (71.0%) | 991 (29.0%) |
| Information | 10,077 (56.6%) | 7,720 (43.4%) |
| Finance & Insurance | 35,495 (56.8%) | 27,051 (43.2%) |
| Real Estate, Rental & Leasing | 10,948 (55.6%) | 8,750 (44.4%) |
| Professional & Scientific | 68,866 (55.4%) | 55,398 (44.6%) |
| Enterprise Management | 699 (51.1%) | 668 (48.9%) |
| Administrative & Support | 22,494 (59.3%) | 15,436 (40.7%) |
| Educational Services | 28,676 (35.2%) | 52,813 (64.8%) |
| Health Care & Social Assistance | 27,082 (25.8%) | 77,796 (74.2%) |
| Arts, Entertainment & Recreation | 8,203 (48.6%) | 8,670 (51.4%) |
| Accommodation & Food Services | 28,487 (52.1%) | 26,145 (47.9%) |
| Public Administration | 13,650 (53.2%) | 12,013 (46.8%) |
| Total | 434,378 (52.3%) | 396,500 (47.7%) |
Education in Area Code 312
School Enrollment in Area Code 312
The most common levels of schooling among the 386,530 students in Area Code 312 are college / undergraduate (84,598 | 21.9%), high school (75,445 | 19.5%), and middle school (71,739 | 18.6%).
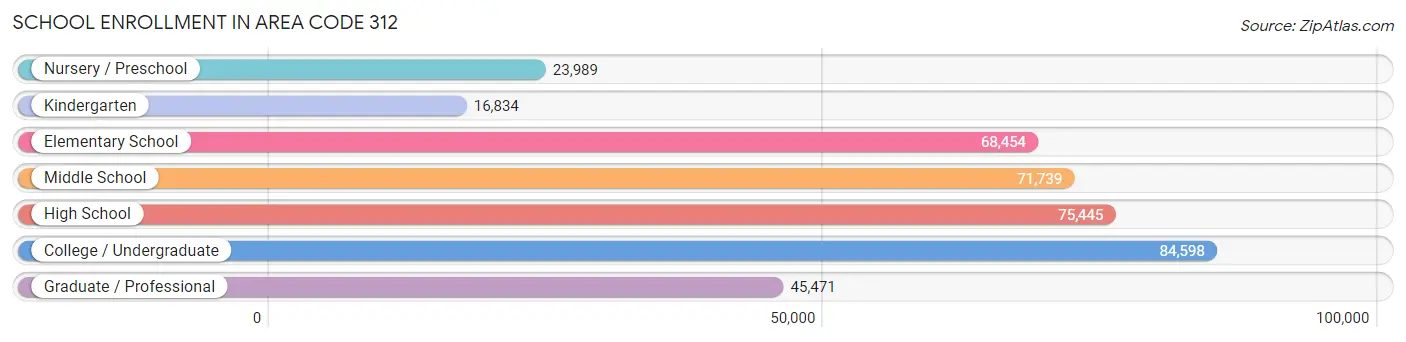
| School Level | # Students | % Students |
| Nursery / Preschool | 23,989 | 6.2% |
| Kindergarten | 16,834 | 4.4% |
| Elementary School | 68,454 | 17.7% |
| Middle School | 71,739 | 18.6% |
| High School | 75,445 | 19.5% |
| College / Undergraduate | 84,598 | 21.9% |
| Graduate / Professional | 45,471 | 11.8% |
| Total | 386,530 | 100.0% |
School Enrollment by Age by Funding Source in Area Code 312
Out of a total of 386,530 students who are enrolled in schools in Area Code 312, 110,703 (28.6%) attend a private institution, while the remaining 275,827 (71.4%) are enrolled in public schools. The age group of 25 to 34 year olds has the highest likelihood of being enrolled in private schools, with 21,346 (57.0% in the age bracket) enrolled. Conversely, the age group of 15 to 17 year olds has the lowest likelihood of being enrolled in a private school, with 45,952 (86.6% in the age bracket) attending a public institution.
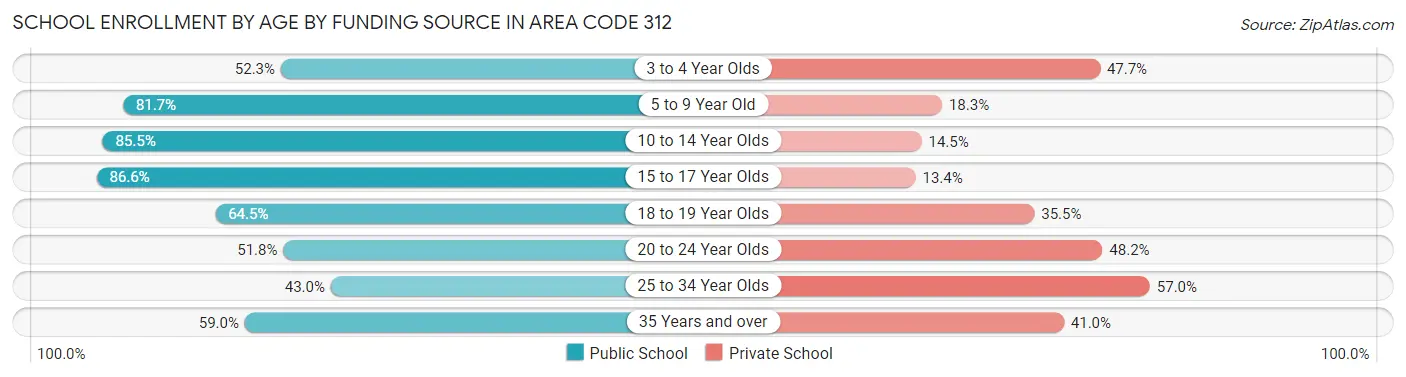
| Age Bracket | Public School | Private School |
| 3 to 4 Year Olds | 10,152 (52.3%) | 9,269 (47.7%) |
| 5 to 9 Year Old | 65,905 (81.7%) | 14,774 (18.3%) |
| 10 to 14 Year Olds | 77,464 (85.5%) | 13,152 (14.5%) |
| 15 to 17 Year Olds | 45,952 (86.6%) | 7,105 (13.4%) |
| 18 to 19 Year Olds | 21,570 (64.5%) | 11,879 (35.5%) |
| 20 to 24 Year Olds | 26,721 (51.8%) | 24,851 (48.2%) |
| 25 to 34 Year Olds | 16,083 (43.0%) | 21,346 (57.0%) |
| 35 Years and over | 11,979 (59.0%) | 8,328 (41.0%) |
| Total | 275,827 (71.4%) | 110,703 (28.6%) |
Educational Attainment by Field of Study in Area Code 312
Business (122,293 | 20.9%), social sciences (63,791 | 10.9%), engineering (43,633 | 7.5%), science & technology (43,319 | 7.4%), and education (37,910 | 6.5%) are the most common fields of study among 584,778 individuals in Area Code 312 who have obtained a bachelor's degree or higher.
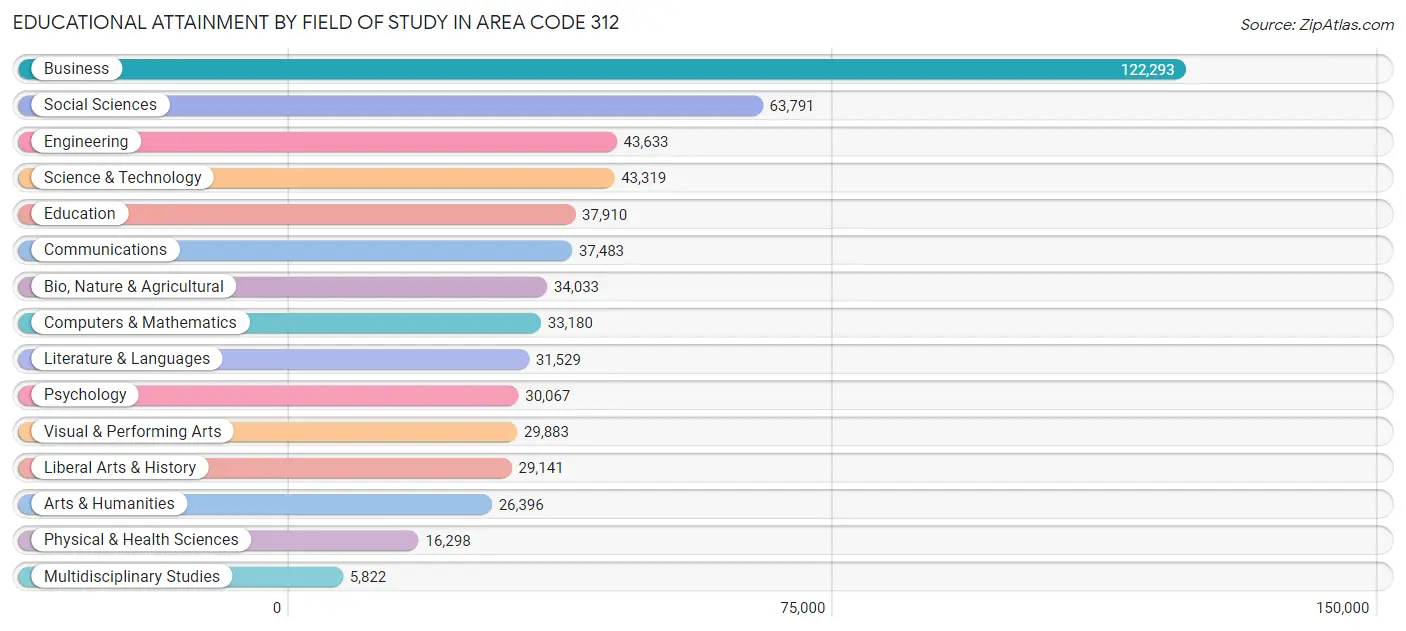
| Field of Study | # Graduates | % Graduates |
| Computers & Mathematics | 33,180 | 5.7% |
| Bio, Nature & Agricultural | 34,033 | 5.8% |
| Physical & Health Sciences | 16,298 | 2.8% |
| Psychology | 30,067 | 5.1% |
| Social Sciences | 63,791 | 10.9% |
| Engineering | 43,633 | 7.5% |
| Multidisciplinary Studies | 5,822 | 1.0% |
| Science & Technology | 43,319 | 7.4% |
| Business | 122,293 | 20.9% |
| Education | 37,910 | 6.5% |
| Literature & Languages | 31,529 | 5.4% |
| Liberal Arts & History | 29,141 | 5.0% |
| Visual & Performing Arts | 29,883 | 5.1% |
| Communications | 37,483 | 6.4% |
| Arts & Humanities | 26,396 | 4.5% |
| Total | 584,778 | 100.0% |
Transportation & Commute in Area Code 312
Vehicle Availability by Sex in Area Code 312
The most prevalent vehicle ownership categories in Area Code 312 are males with 1 vehicle (149,475, accounting for 35.1%) and females with 1 vehicle (148,049, making up 38.9%).
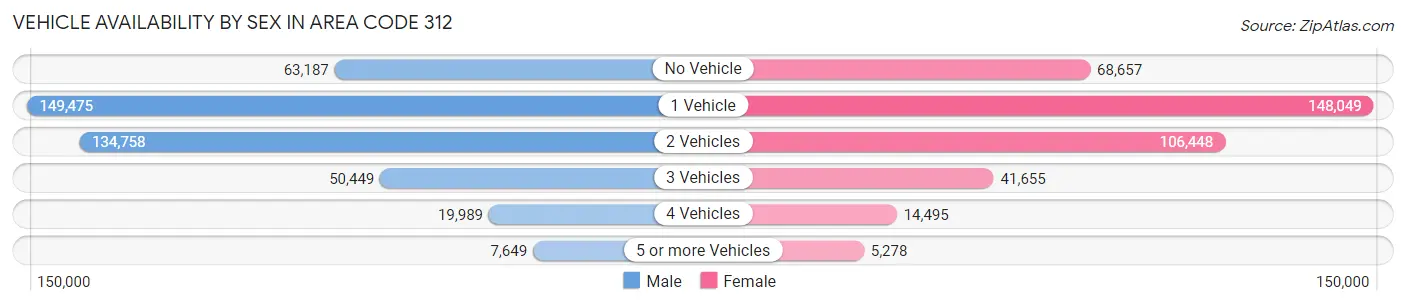
| Vehicles Available | Male | Female |
| No Vehicle | 63,187 (14.8%) | 68,657 (17.8%) |
| 1 Vehicle | 149,475 (35.1%) | 148,049 (38.5%) |
| 2 Vehicles | 134,758 (31.7%) | 106,448 (27.7%) |
| 3 Vehicles | 50,449 (11.9%) | 41,655 (10.8%) |
| 4 Vehicles | 19,989 (4.7%) | 14,495 (3.8%) |
| 5 or more Vehicles | 7,649 (1.8%) | 5,278 (1.4%) |
| Total | 425,507 (100.0%) | 384,582 (100.0%) |
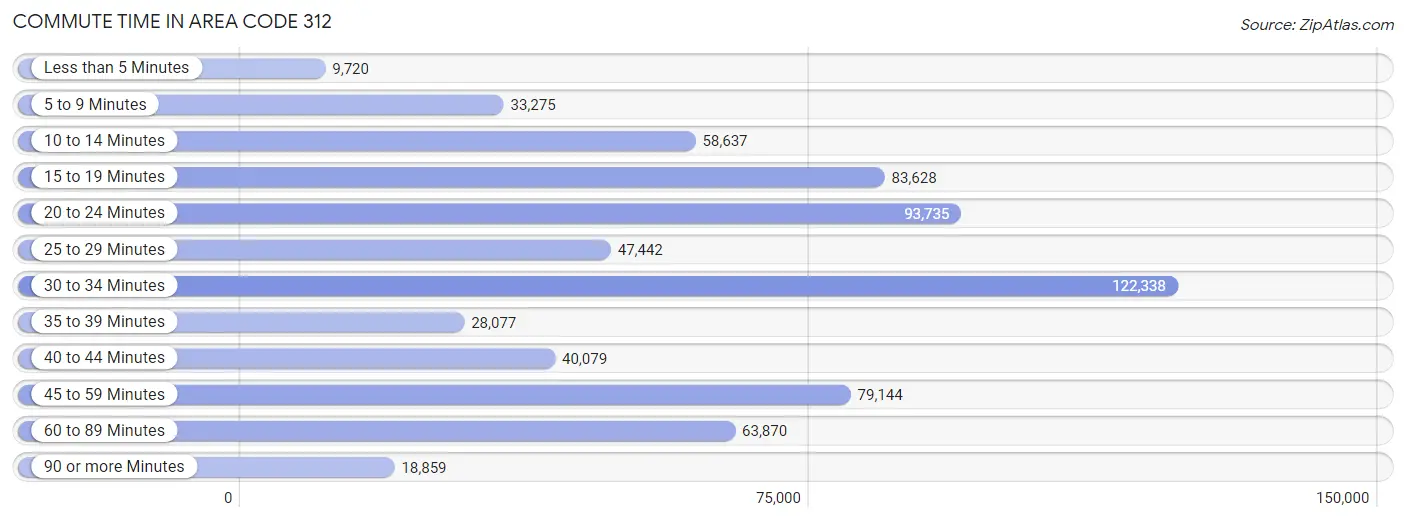
Commute Time in Area Code 312
The most frequently occuring commute durations in Area Code 312 are 30 to 34 minutes (122,338 commuters, 18.0%), 20 to 24 minutes (93,735 commuters, 13.8%), and 15 to 19 minutes (83,628 commuters, 12.3%).
| Commute Time | # Commuters | % Commuters |
| Less than 5 Minutes | 9,720 | 1.4% |
| 5 to 9 Minutes | 33,275 | 4.9% |
| 10 to 14 Minutes | 58,637 | 8.6% |
| 15 to 19 Minutes | 83,628 | 12.3% |
| 20 to 24 Minutes | 93,735 | 13.8% |
| 25 to 29 Minutes | 47,442 | 7.0% |
| 30 to 34 Minutes | 122,338 | 18.0% |
| 35 to 39 Minutes | 28,077 | 4.1% |
| 40 to 44 Minutes | 40,079 | 5.9% |
| 45 to 59 Minutes | 79,144 | 11.7% |
| 60 to 89 Minutes | 63,870 | 9.4% |
| 90 or more Minutes | 18,859 | 2.8% |
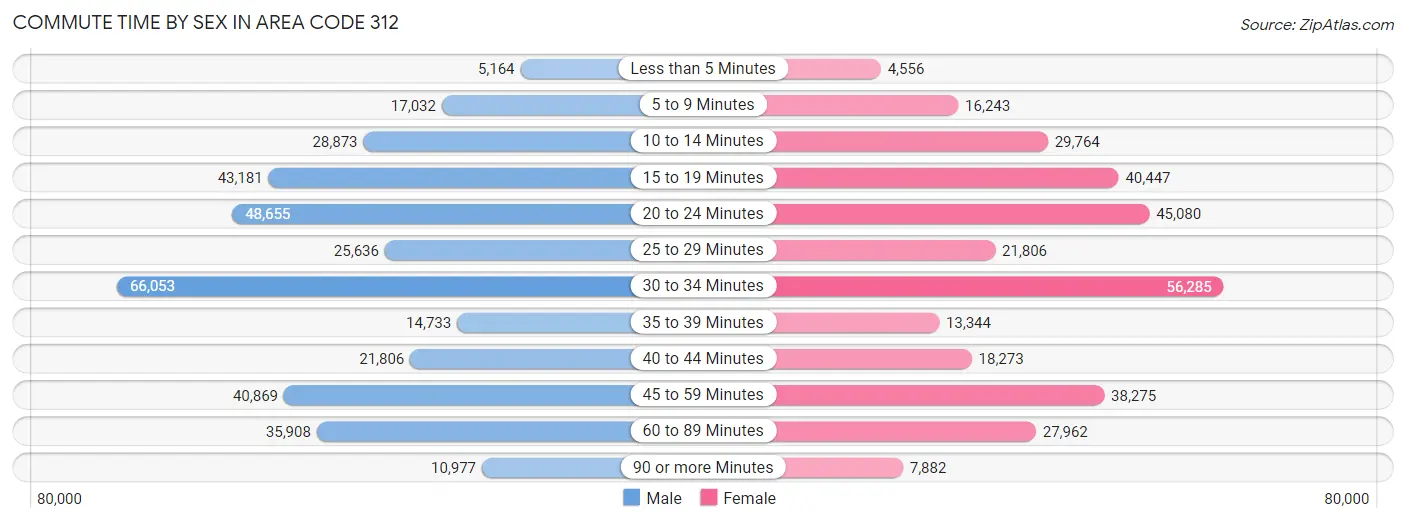
Commute Time by Sex in Area Code 312
The most common commute times in Area Code 312 are 30 to 34 minutes (66,053 commuters, 18.4%) for males and 30 to 34 minutes (56,285 commuters, 17.6%) for females.
| Commute Time | Male | Female |
| Less than 5 Minutes | 5,164 (1.4%) | 4,556 (1.4%) |
| 5 to 9 Minutes | 17,032 (4.8%) | 16,243 (5.1%) |
| 10 to 14 Minutes | 28,873 (8.1%) | 29,764 (9.3%) |
| 15 to 19 Minutes | 43,181 (12.0%) | 40,447 (12.6%) |
| 20 to 24 Minutes | 48,655 (13.6%) | 45,080 (14.1%) |
| 25 to 29 Minutes | 25,636 (7.1%) | 21,806 (6.8%) |
| 30 to 34 Minutes | 66,053 (18.4%) | 56,285 (17.6%) |
| 35 to 39 Minutes | 14,733 (4.1%) | 13,344 (4.2%) |
| 40 to 44 Minutes | 21,806 (6.1%) | 18,273 (5.7%) |
| 45 to 59 Minutes | 40,869 (11.4%) | 38,275 (12.0%) |
| 60 to 89 Minutes | 35,908 (10.0%) | 27,962 (8.7%) |
| 90 or more Minutes | 10,977 (3.1%) | 7,882 (2.5%) |
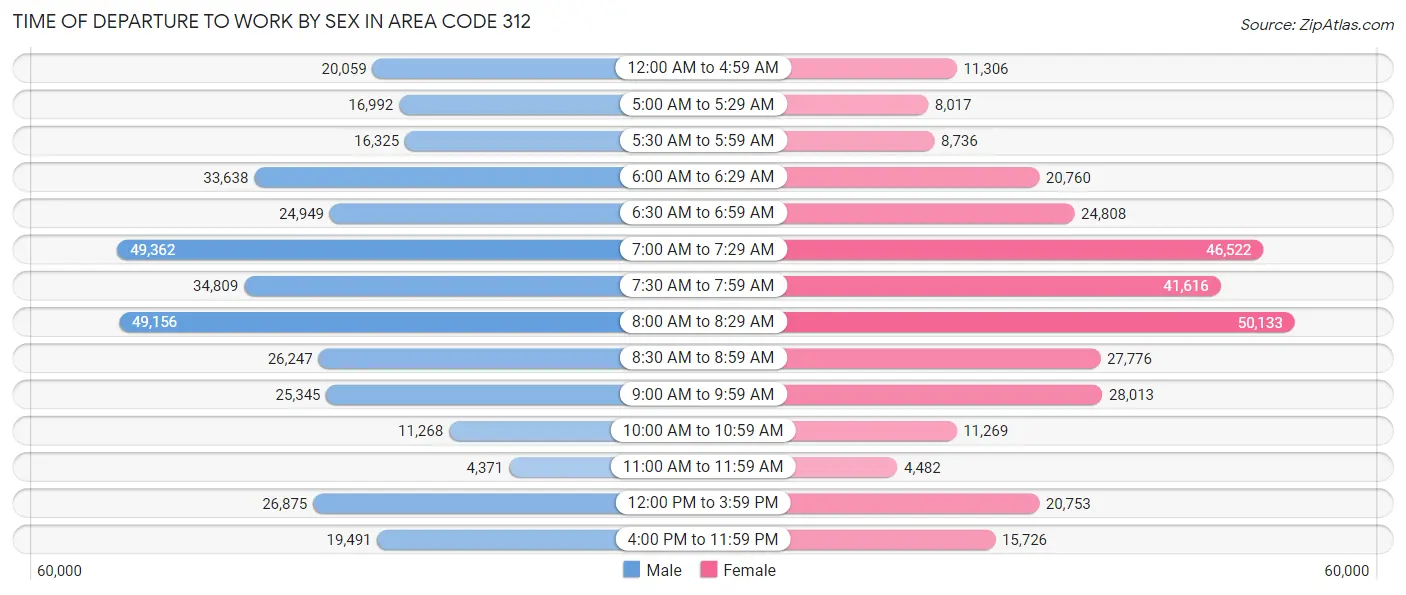
Time of Departure to Work by Sex in Area Code 312
The most frequent times of departure to work in Area Code 312 are 7:00 AM to 7:29 AM (49,362, 13.8%) for males and 8:00 AM to 8:29 AM (50,133, 15.7%) for females.
| Time of Departure | Male | Female |
| 12:00 AM to 4:59 AM | 20,059 (5.6%) | 11,306 (3.5%) |
| 5:00 AM to 5:29 AM | 16,992 (4.7%) | 8,017 (2.5%) |
| 5:30 AM to 5:59 AM | 16,325 (4.5%) | 8,736 (2.7%) |
| 6:00 AM to 6:29 AM | 33,638 (9.4%) | 20,760 (6.5%) |
| 6:30 AM to 6:59 AM | 24,949 (7.0%) | 24,808 (7.7%) |
| 7:00 AM to 7:29 AM | 49,362 (13.8%) | 46,522 (14.5%) |
| 7:30 AM to 7:59 AM | 34,809 (9.7%) | 41,616 (13.0%) |
| 8:00 AM to 8:29 AM | 49,156 (13.7%) | 50,133 (15.7%) |
| 8:30 AM to 8:59 AM | 26,247 (7.3%) | 27,776 (8.7%) |
| 9:00 AM to 9:59 AM | 25,345 (7.1%) | 28,013 (8.8%) |
| 10:00 AM to 10:59 AM | 11,268 (3.1%) | 11,269 (3.5%) |
| 11:00 AM to 11:59 AM | 4,371 (1.2%) | 4,482 (1.4%) |
| 12:00 PM to 3:59 PM | 26,875 (7.5%) | 20,753 (6.5%) |
| 4:00 PM to 11:59 PM | 19,491 (5.4%) | 15,726 (4.9%) |
| Total | 358,887 (100.0%) | 319,917 (100.0%) |
Housing Occupancy in Area Code 312
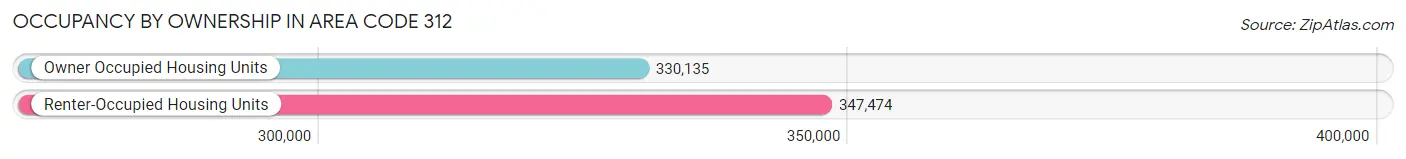
Occupancy by Ownership in Area Code 312
Of the total 677,609 dwellings in Area Code 312, owner-occupied units account for 330,135 (48.7%), while renter-occupied units make up 347,474 (51.3%).
| Occupancy | # Housing Units | % Housing Units |
| Owner Occupied Housing Units | 330,135 | 48.7% |
| Renter-Occupied Housing Units | 347,474 | 51.3% |
| Total Occupied Housing Units | 677,609 | 100.0% |
Occupancy by Household Size in Area Code 312
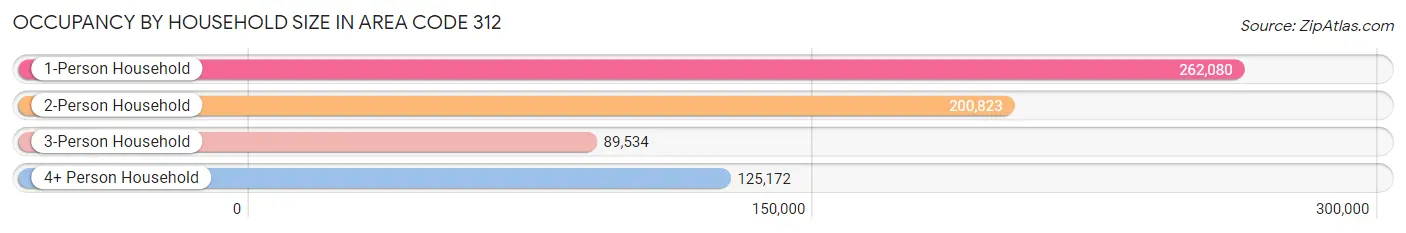
| Household Size | # Housing Units | % Housing Units |
| 1-Person Household | 262,080 | 38.7% |
| 2-Person Household | 200,823 | 29.6% |
| 3-Person Household | 89,534 | 13.2% |
| 4+ Person Household | 125,172 | 18.5% |
| Total Housing Units | 677,609 | 100.0% |
Occupancy by Ownership by Household Size in Area Code 312
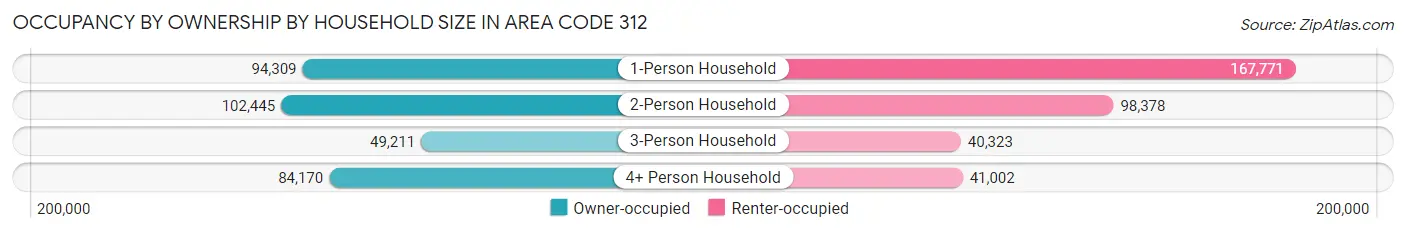
| Household Size | Owner-occupied | Renter-occupied |
| 1-Person Household | 94,309 (36.0%) | 167,771 (64.0%) |
| 2-Person Household | 102,445 (51.0%) | 98,378 (49.0%) |
| 3-Person Household | 49,211 (55.0%) | 40,323 (45.0%) |
| 4+ Person Household | 84,170 (67.2%) | 41,002 (32.8%) |
| Total Housing Units | 330,135 (48.7%) | 347,474 (51.3%) |
Occupancy by Educational Attainment in Area Code 312
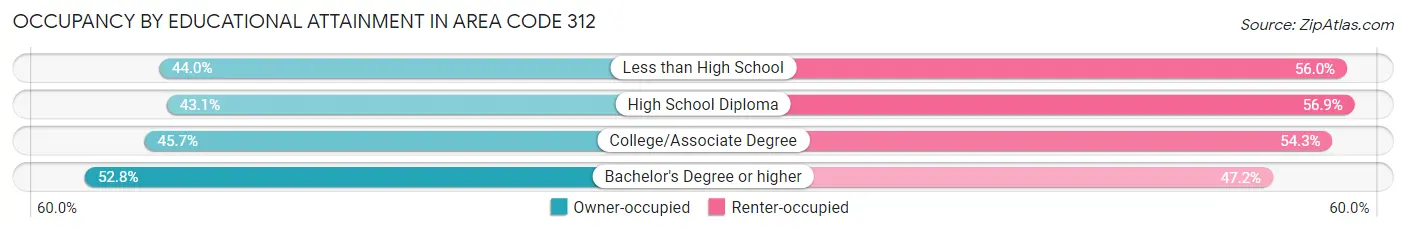
| Household Size | Owner-occupied | Renter-occupied |
| Less than High School | 30,708 (44.0%) | 39,084 (56.0%) |
| High School Diploma | 51,104 (43.1%) | 67,533 (56.9%) |
| College/Associate Degree | 64,734 (45.7%) | 76,816 (54.3%) |
| Bachelor's Degree or higher | 183,589 (52.8%) | 164,041 (47.2%) |
Occupancy by Age of Householder in Area Code 312
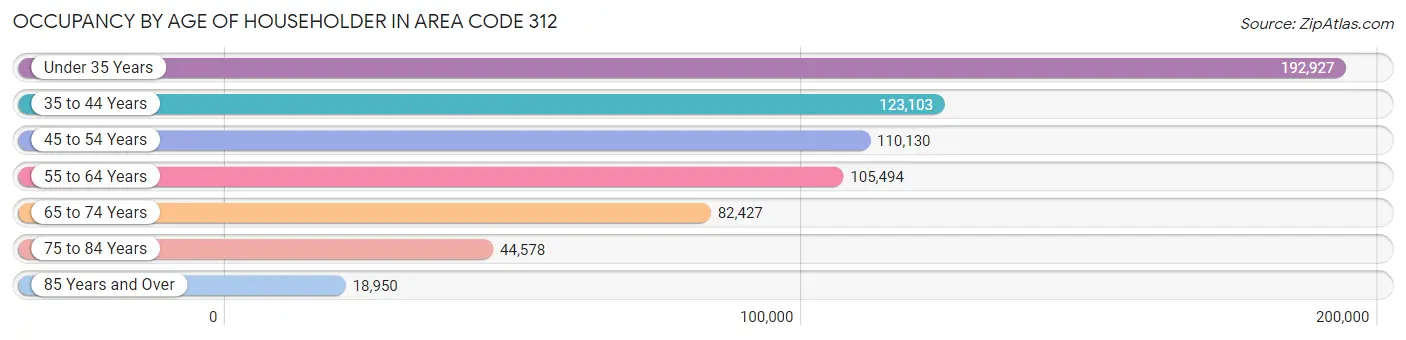
| Age Bracket | # Households | % Households |
| Under 35 Years | 192,927 | 28.5% |
| 35 to 44 Years | 123,103 | 18.2% |
| 45 to 54 Years | 110,130 | 16.3% |
| 55 to 64 Years | 105,494 | 15.6% |
| 65 to 74 Years | 82,427 | 12.2% |
| 75 to 84 Years | 44,578 | 6.6% |
| 85 Years and Over | 18,950 | 2.8% |
| Total | 677,609 | 100.0% |
Housing Finances in Area Code 312
Median Income by Occupancy in Area Code 312
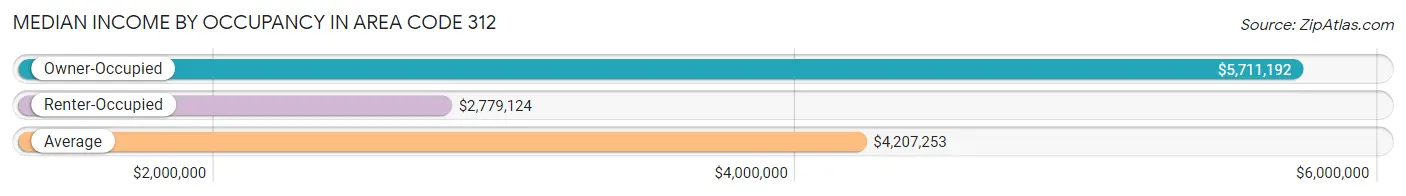
| Occupancy Type | # Households | Median Income |
| Owner-Occupied | 330,135 (48.7%) | $5,711,192 |
| Renter-Occupied | 347,474 (51.3%) | $2,779,124 |
| Average | 677,609 (100.0%) | $4,207,253 |
Occupancy by Householder Income Bracket in Area Code 312
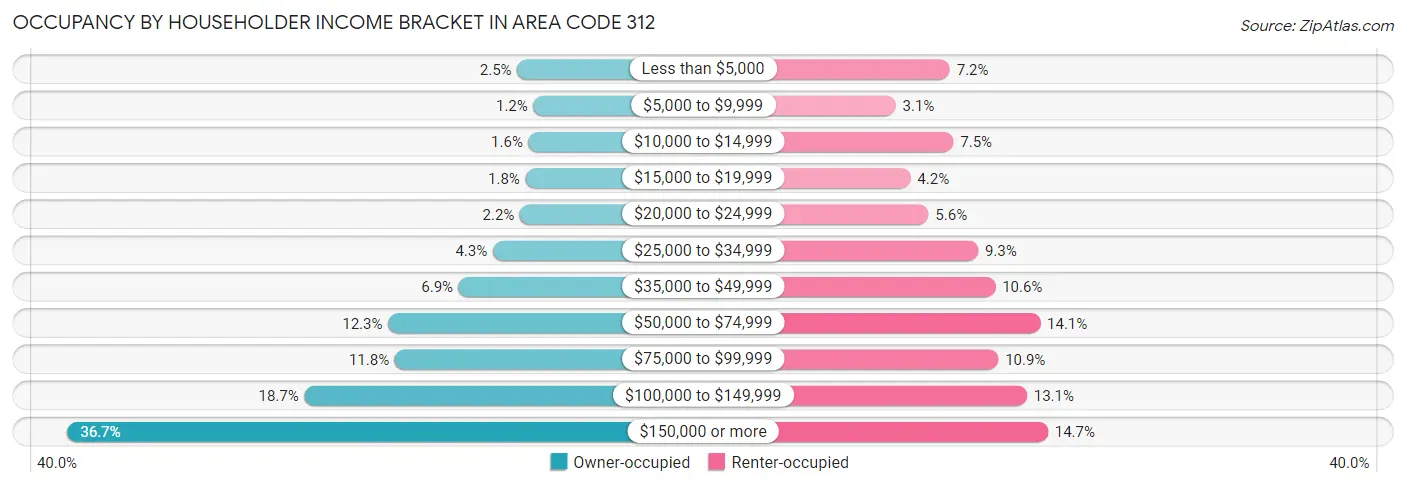
| Income Bracket | Owner-occupied | Renter-occupied |
| Less than $5,000 | 8,084 (2.5%) | 24,944 (7.2%) |
| $5,000 to $9,999 | 4,028 (1.2%) | 10,597 (3.0%) |
| $10,000 to $14,999 | 5,244 (1.6%) | 25,901 (7.4%) |
| $15,000 to $19,999 | 5,994 (1.8%) | 14,524 (4.2%) |
| $20,000 to $24,999 | 7,411 (2.2%) | 19,282 (5.6%) |
| $25,000 to $34,999 | 14,225 (4.3%) | 32,405 (9.3%) |
| $35,000 to $49,999 | 22,796 (6.9%) | 36,963 (10.6%) |
| $50,000 to $74,999 | 40,558 (12.3%) | 48,869 (14.1%) |
| $75,000 to $99,999 | 38,879 (11.8%) | 37,770 (10.9%) |
| $100,000 to $149,999 | 61,632 (18.7%) | 45,329 (13.1%) |
| $150,000 or more | 121,284 (36.7%) | 50,890 (14.6%) |
| Total | 330,135 (100.0%) | 347,474 (100.0%) |
Monthly Housing Cost Tiers in Area Code 312
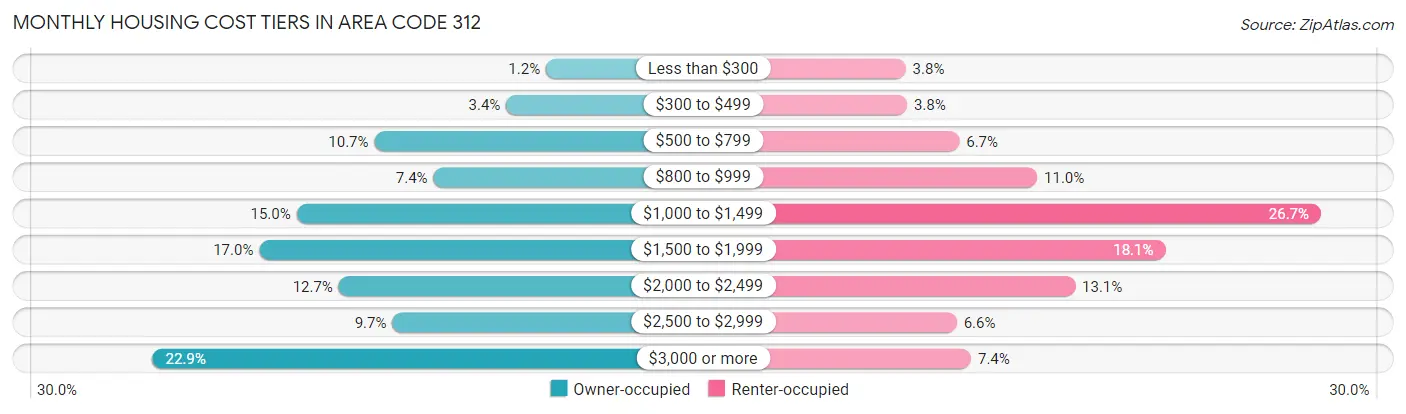
| Monthly Cost | Owner-occupied | Renter-occupied |
| Less than $300 | 3,976 (1.2%) | 13,098 (3.8%) |
| $300 to $499 | 11,232 (3.4%) | 13,348 (3.8%) |
| $500 to $799 | 35,265 (10.7%) | 23,377 (6.7%) |
| $800 to $999 | 24,505 (7.4%) | 38,339 (11.0%) |
| $1,000 to $1,499 | 49,447 (15.0%) | 92,778 (26.7%) |
| $1,500 to $1,999 | 56,260 (17.0%) | 62,914 (18.1%) |
| $2,000 to $2,499 | 41,760 (12.7%) | 45,619 (13.1%) |
| $2,500 to $2,999 | 32,006 (9.7%) | 22,912 (6.6%) |
| $3,000 or more | 75,684 (22.9%) | 25,644 (7.4%) |
| Total | 330,135 (100.0%) | 347,474 (100.0%) |
Physical Housing Characteristics in Area Code 312
Housing Structures in Area Code 312
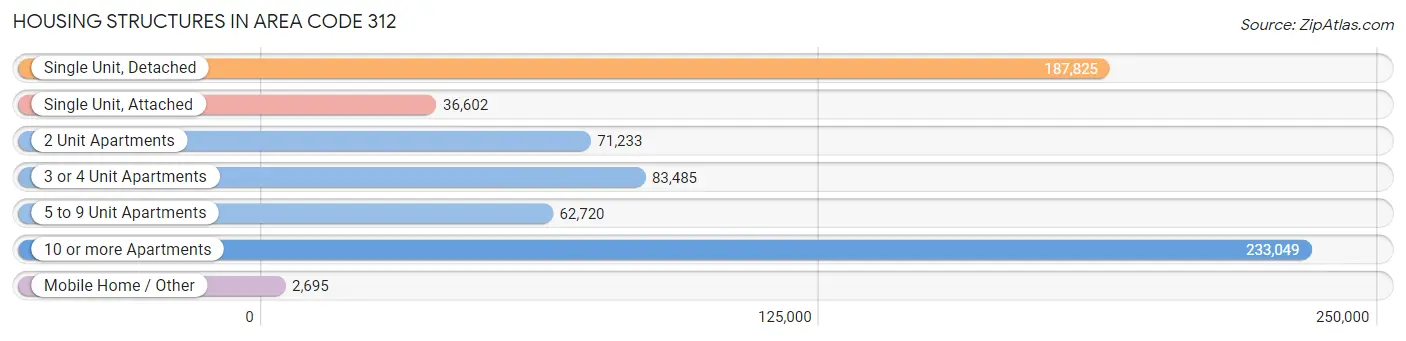
| Structure Type | # Housing Units | % Housing Units |
| Single Unit, Detached | 187,825 | 27.7% |
| Single Unit, Attached | 36,602 | 5.4% |
| 2 Unit Apartments | 71,233 | 10.5% |
| 3 or 4 Unit Apartments | 83,485 | 12.3% |
| 5 to 9 Unit Apartments | 62,720 | 9.3% |
| 10 or more Apartments | 233,049 | 34.4% |
| Mobile Home / Other | 2,695 | 0.4% |
| Total | 677,609 | 100.0% |
Housing Structures by Occupancy in Area Code 312
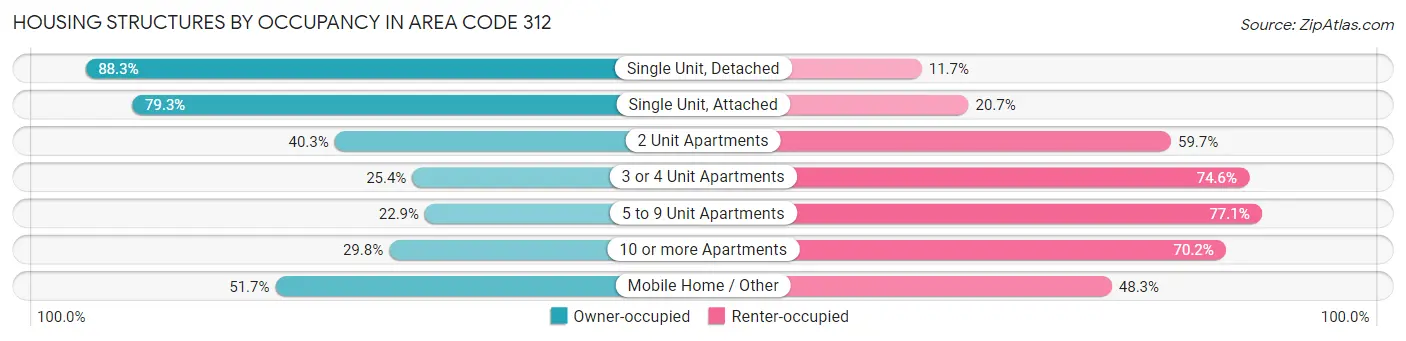
| Structure Type | Owner-occupied | Renter-occupied |
| Single Unit, Detached | 165,883 (88.3%) | 21,942 (11.7%) |
| Single Unit, Attached | 29,035 (79.3%) | 7,567 (20.7%) |
| 2 Unit Apartments | 28,725 (40.3%) | 42,508 (59.7%) |
| 3 or 4 Unit Apartments | 21,182 (25.4%) | 62,303 (74.6%) |
| 5 to 9 Unit Apartments | 14,379 (22.9%) | 48,341 (77.1%) |
| 10 or more Apartments | 69,537 (29.8%) | 163,512 (70.2%) |
| Mobile Home / Other | 1,394 (51.7%) | 1,301 (48.3%) |
| Total | 330,135 (48.7%) | 347,474 (51.3%) |
Housing Structures by Number of Rooms in Area Code 312
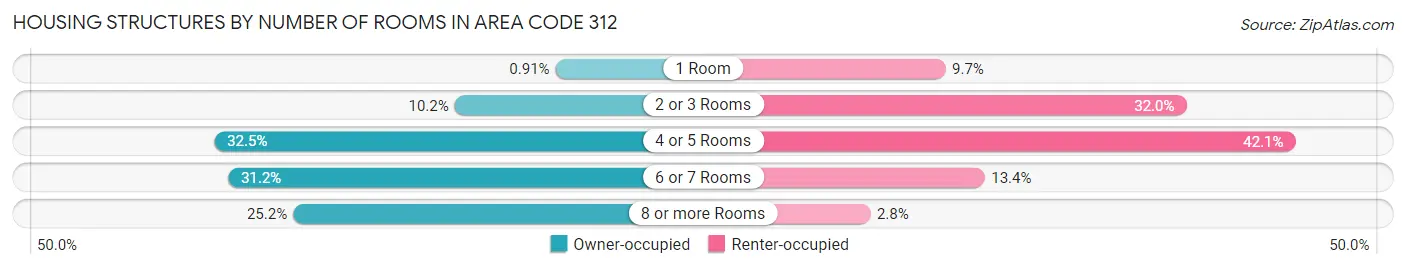
| Number of Rooms | Owner-occupied | Renter-occupied |
| 1 Room | 3,006 (0.9%) | 33,813 (9.7%) |
| 2 or 3 Rooms | 33,820 (10.2%) | 111,287 (32.0%) |
| 4 or 5 Rooms | 107,205 (32.5%) | 146,347 (42.1%) |
| 6 or 7 Rooms | 102,970 (31.2%) | 46,371 (13.4%) |
| 8 or more Rooms | 83,134 (25.2%) | 9,656 (2.8%) |
| Total | 330,135 (100.0%) | 347,474 (100.0%) |
Housing Structure by Heating Type in Area Code 312
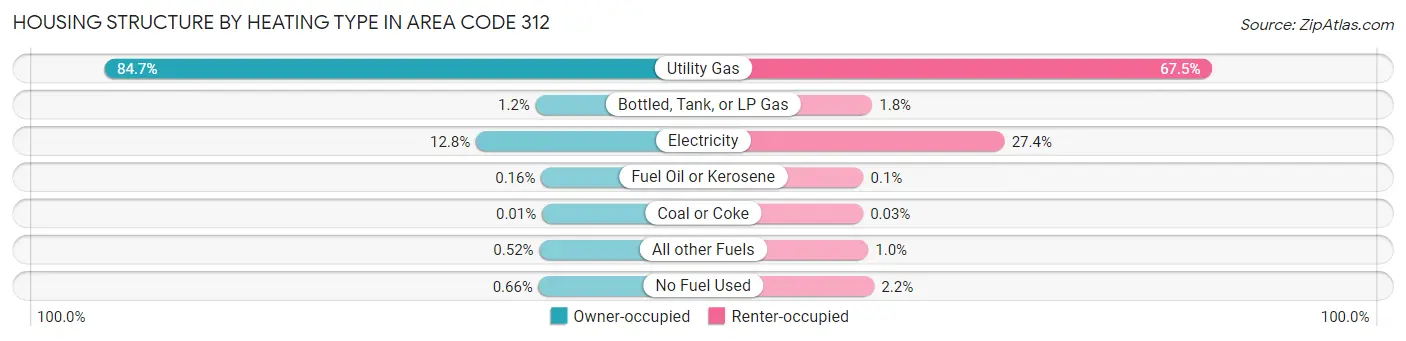
| Heating Type | Owner-occupied | Renter-occupied |
| Utility Gas | 279,454 (84.7%) | 234,432 (67.5%) |
| Bottled, Tank, or LP Gas | 4,088 (1.2%) | 6,253 (1.8%) |
| Electricity | 42,150 (12.8%) | 95,137 (27.4%) |
| Fuel Oil or Kerosene | 542 (0.2%) | 346 (0.1%) |
| Coal or Coke | 34 (0.0%) | 116 (0.0%) |
| All other Fuels | 1,703 (0.5%) | 3,543 (1.0%) |
| No Fuel Used | 2,164 (0.7%) | 7,647 (2.2%) |
| Total | 330,135 (100.0%) | 347,474 (100.0%) |
Household Vehicle Usage in Area Code 312
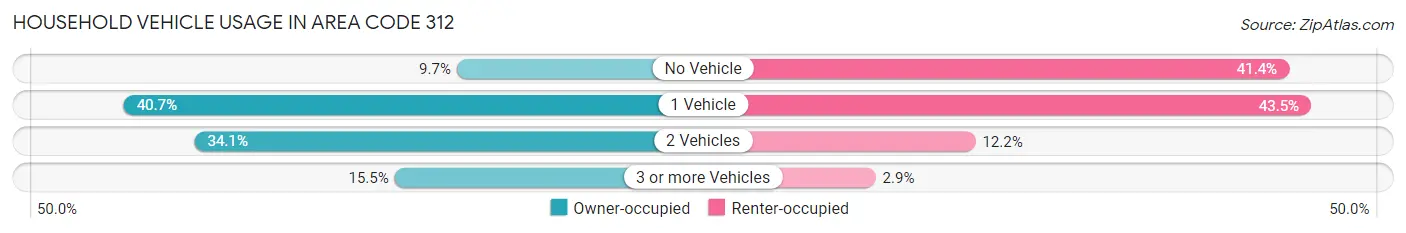
| Vehicles per Household | Owner-occupied | Renter-occupied |
| No Vehicle | 31,880 (9.7%) | 143,994 (41.4%) |
| 1 Vehicle | 134,497 (40.7%) | 151,150 (43.5%) |
| 2 Vehicles | 112,683 (34.1%) | 42,365 (12.2%) |
| 3 or more Vehicles | 51,075 (15.5%) | 9,965 (2.9%) |
| Total | 330,135 (100.0%) | 347,474 (100.0%) |
Real Estate & Mortgages in Area Code 312
Real Estate and Mortgage Overview in Area Code 312
| Characteristic | Without Mortgage | With Mortgage |
| Housing Units | 118,362 | 211,773 |
| Median Property Value | $16,862,200 | $16,875,200 |
| Median Household Income | $4,248,660 | $90,111 |
| Monthly Housing Costs | $45,819 | $70,324 |
| Real Estate Taxes | $277,691 | $3,670 |
Property Value by Mortgage Status in Area Code 312
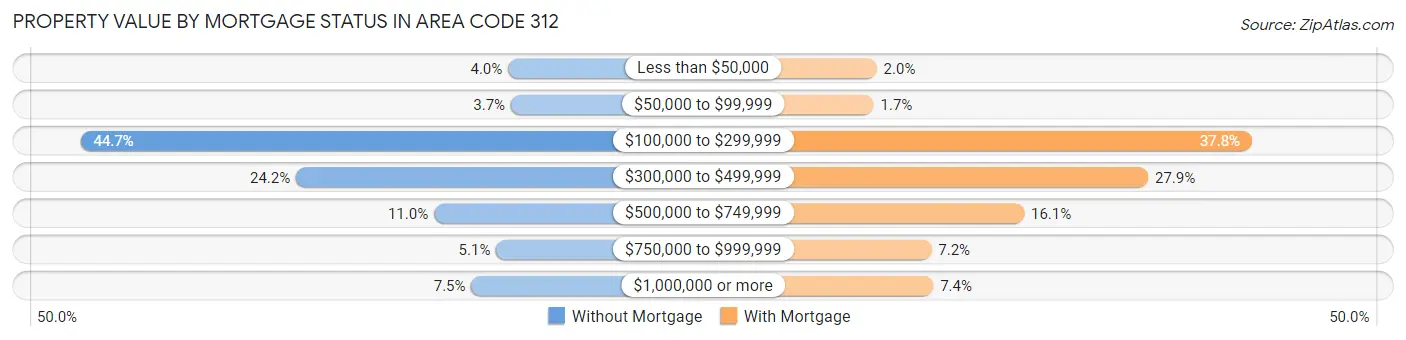
| Property Value | Without Mortgage | With Mortgage |
| Less than $50,000 | 4,670 (4.0%) | 4,250 (2.0%) |
| $50,000 to $99,999 | 4,359 (3.7%) | 3,653 (1.7%) |
| $100,000 to $299,999 | 52,889 (44.7%) | 79,938 (37.8%) |
| $300,000 to $499,999 | 28,589 (24.1%) | 58,992 (27.9%) |
| $500,000 to $749,999 | 13,031 (11.0%) | 33,979 (16.1%) |
| $750,000 to $999,999 | 6,008 (5.1%) | 15,293 (7.2%) |
| $1,000,000 or more | 8,816 (7.4%) | 15,668 (7.4%) |
| Total | 118,362 (100.0%) | 211,773 (100.0%) |
Household Income by Mortgage Status in Area Code 312
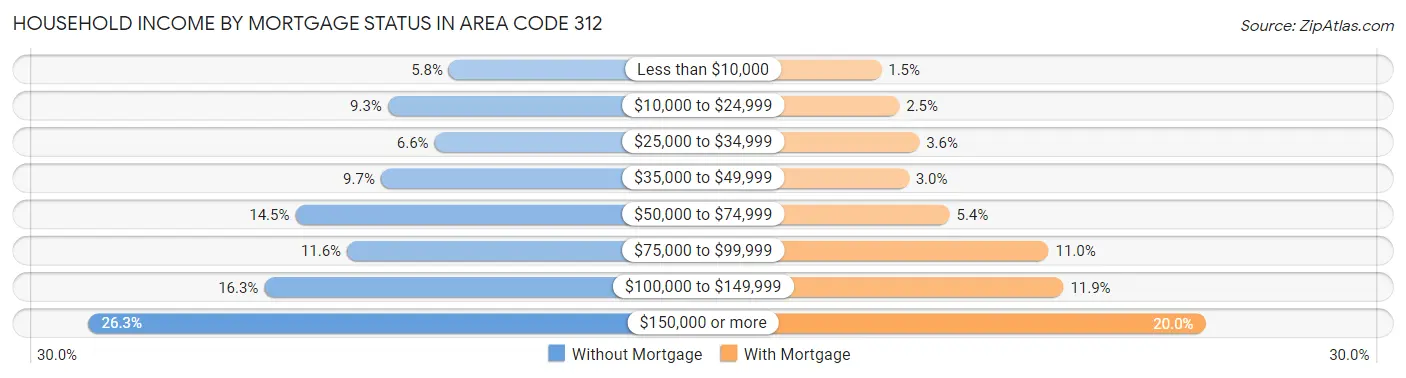
| Household Income | Without Mortgage | With Mortgage |
| Less than $10,000 | 6,813 (5.8%) | 3,103 (1.5%) |
| $10,000 to $24,999 | 10,950 (9.2%) | 5,299 (2.5%) |
| $25,000 to $34,999 | 7,788 (6.6%) | 7,699 (3.6%) |
| $35,000 to $49,999 | 11,420 (9.7%) | 6,437 (3.0%) |
| $50,000 to $74,999 | 17,201 (14.5%) | 11,376 (5.4%) |
| $75,000 to $99,999 | 13,710 (11.6%) | 23,357 (11.0%) |
| $100,000 to $149,999 | 19,307 (16.3%) | 25,169 (11.9%) |
| $150,000 or more | 31,173 (26.3%) | 42,325 (20.0%) |
| Total | 118,362 (100.0%) | 211,773 (100.0%) |
Property Value to Household Income Ratio in Area Code 312
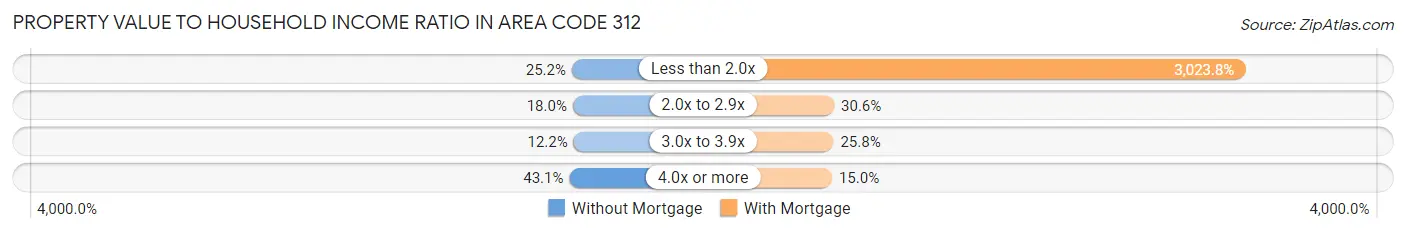
| Value-to-Income Ratio | Without Mortgage | With Mortgage |
| Less than 2.0x | 29,860 (25.2%) | 6,403,512 (3,023.8%) |
| 2.0x to 2.9x | 21,297 (18.0%) | 64,773 (30.6%) |
| 3.0x to 3.9x | 14,404 (12.2%) | 54,580 (25.8%) |
| 4.0x or more | 51,029 (43.1%) | 31,741 (15.0%) |
| Total | 118,362 (100.0%) | 211,773 (100.0%) |
Real Estate Taxes by Mortgage Status in Area Code 312
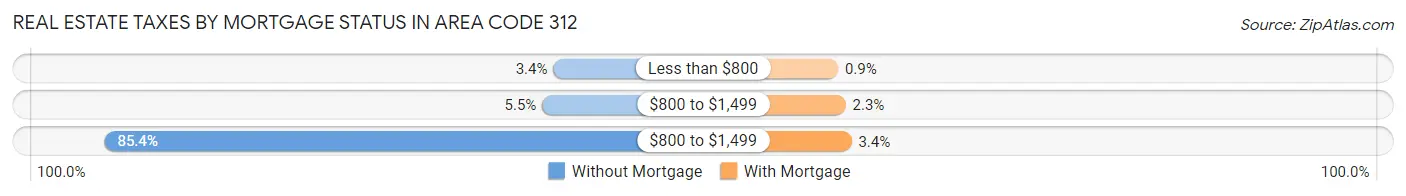
| Property Taxes | Without Mortgage | With Mortgage |
| Less than $800 | 4,063 (3.4%) | 1,916 (0.9%) |
| $800 to $1,499 | 6,465 (5.5%) | 4,859 (2.3%) |
| $800 to $1,499 | 101,075 (85.4%) | 7,116 (3.4%) |
| Total | 118,362 (100.0%) | 211,773 (100.0%) |
Health & Disability in Area Code 312
Health Insurance Coverage by Age in Area Code 312
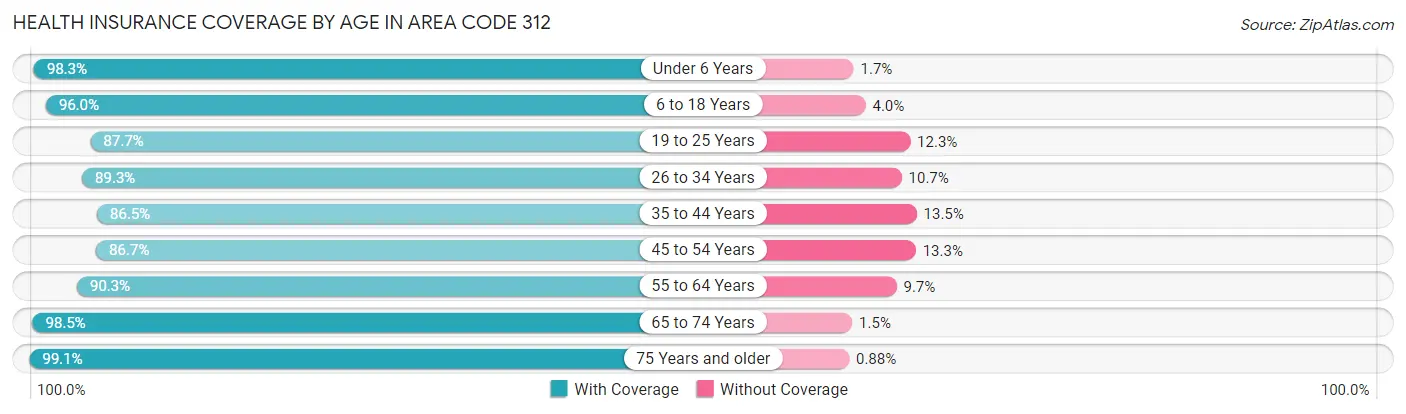
| Age Bracket | With Coverage | Without Coverage |
| Under 6 Years | 102,434 (98.3%) | 1,800 (1.7%) |
| 6 to 18 Years | 227,230 (96.0%) | 9,365 (4.0%) |
| 19 to 25 Years | 157,585 (87.7%) | 22,062 (12.3%) |
| 26 to 34 Years | 249,708 (89.3%) | 29,888 (10.7%) |
| 35 to 44 Years | 191,535 (86.5%) | 29,859 (13.5%) |
| 45 to 54 Years | 164,875 (86.7%) | 25,332 (13.3%) |
| 55 to 64 Years | 159,497 (90.3%) | 17,220 (9.7%) |
| 65 to 74 Years | 122,712 (98.5%) | 1,831 (1.5%) |
| 75 Years and older | 87,897 (99.1%) | 784 (0.9%) |
| Total | 1,463,473 (91.4%) | 138,141 (8.6%) |
Health Insurance Coverage by Citizenship Status in Area Code 312
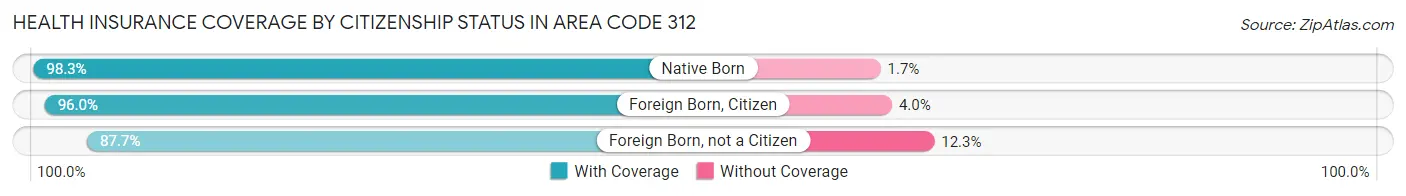
| Citizenship Status | With Coverage | Without Coverage |
| Native Born | 102,434 (98.3%) | 1,800 (1.7%) |
| Foreign Born, Citizen | 227,230 (96.0%) | 9,365 (4.0%) |
| Foreign Born, not a Citizen | 157,585 (87.7%) | 22,062 (12.3%) |
Health Insurance Coverage by Household Income in Area Code 312
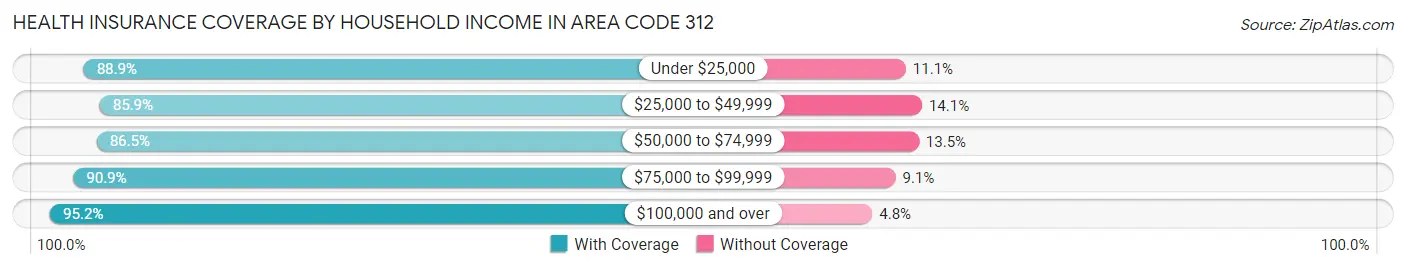
| Household Income | With Coverage | Without Coverage |
| Under $25,000 | 188,534 (88.9%) | 23,503 (11.1%) |
| $25,000 to $49,999 | 197,311 (85.9%) | 32,352 (14.1%) |
| $50,000 to $74,999 | 176,988 (86.5%) | 27,652 (13.5%) |
| $75,000 to $99,999 | 164,134 (90.9%) | 16,511 (9.1%) |
| $100,000 and over | 718,607 (95.2%) | 36,129 (4.8%) |
Public vs Private Health Insurance Coverage by Age in Area Code 312
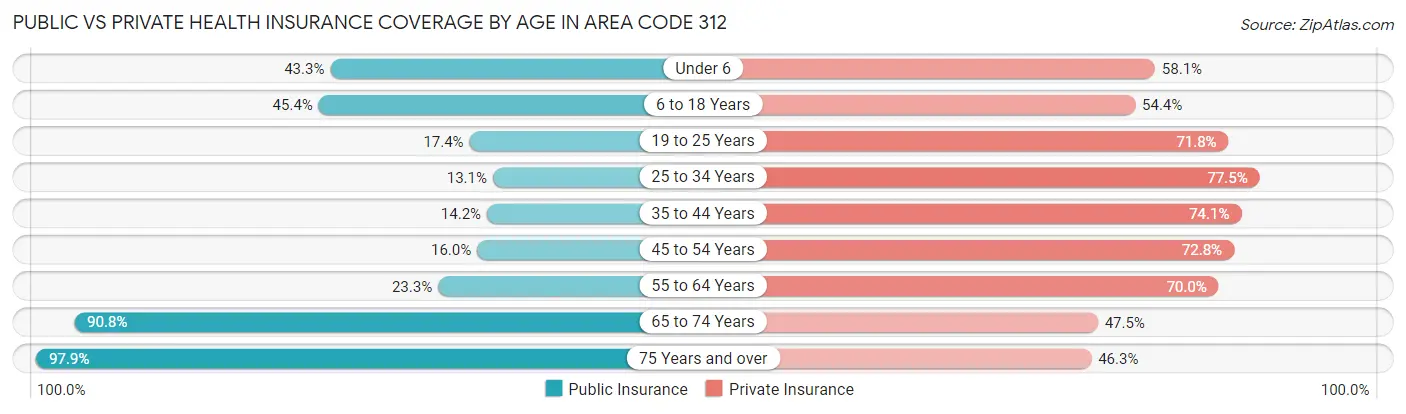
| Age Bracket | Public Insurance | Private Insurance |
| Under 6 | 45,098 (43.3%) | 60,579 (58.1%) |
| 6 to 18 Years | 107,452 (45.4%) | 128,797 (54.4%) |
| 19 to 25 Years | 31,314 (17.4%) | 128,908 (71.8%) |
| 25 to 34 Years | 36,603 (13.1%) | 216,765 (77.5%) |
| 35 to 44 Years | 31,422 (14.2%) | 164,150 (74.1%) |
| 45 to 54 Years | 30,465 (16.0%) | 138,435 (72.8%) |
| 55 to 64 Years | 41,130 (23.3%) | 123,607 (70.0%) |
| 65 to 74 Years | 113,099 (90.8%) | 59,160 (47.5%) |
| 75 Years and over | 86,804 (97.9%) | 41,056 (46.3%) |
| Total | 523,387 (32.7%) | 1,061,457 (66.3%) |
Disability Status by Sex by Age in Area Code 312
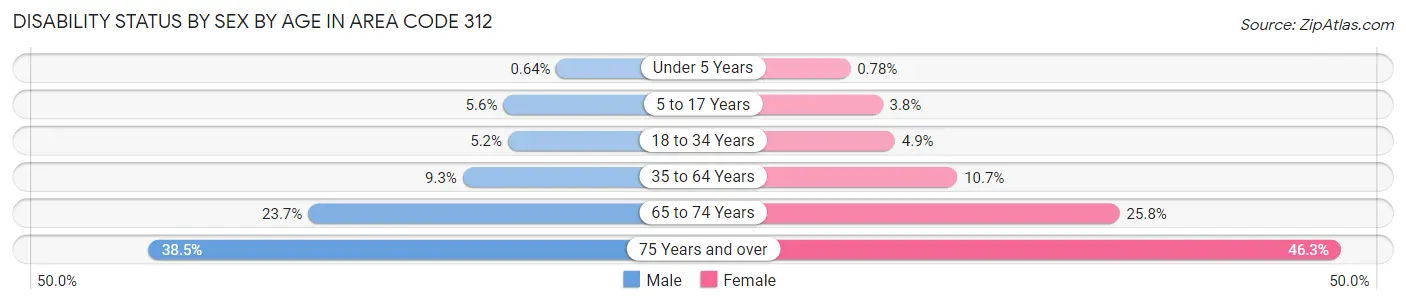
| Age Bracket | Male | Female |
| Under 5 Years | 276 (0.6%) | 346 (0.8%) |
| 5 to 17 Years | 6,654 (5.6%) | 4,263 (3.8%) |
| 18 to 34 Years | 12,093 (5.1%) | 12,099 (4.9%) |
| 35 to 64 Years | 27,108 (9.3%) | 31,919 (10.7%) |
| 65 to 74 Years | 13,565 (23.7%) | 17,354 (25.8%) |
| 75 Years and over | 13,616 (38.5%) | 24,662 (46.3%) |
Disability Class by Sex by Age in Area Code 312
Disability Class: Hearing Difficulty
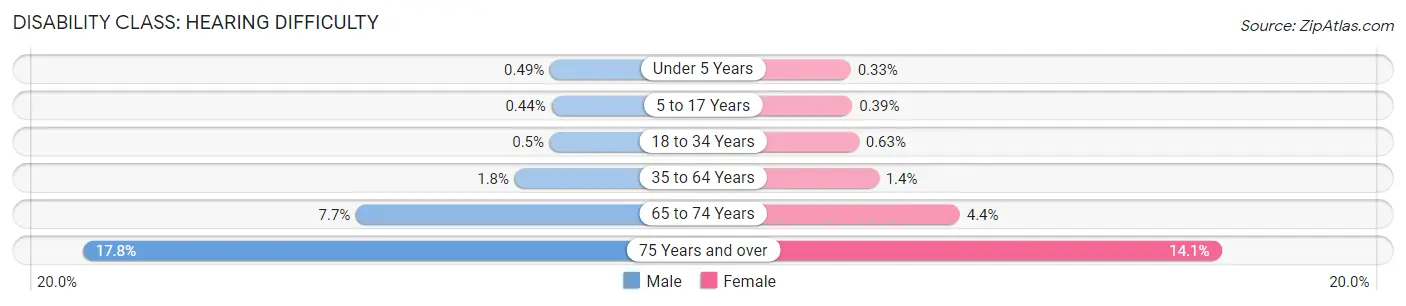
| Age Bracket | Male | Female |
| Under 5 Years | 212 (0.5%) | 145 (0.3%) |
| 5 to 17 Years | 527 (0.4%) | 438 (0.4%) |
| 18 to 34 Years | 1,162 (0.5%) | 1,537 (0.6%) |
| 35 to 64 Years | 5,225 (1.8%) | 4,075 (1.4%) |
| 65 to 74 Years | 4,401 (7.7%) | 2,945 (4.4%) |
| 75 Years and over | 6,315 (17.8%) | 7,509 (14.1%) |
Disability Class: Vision Difficulty
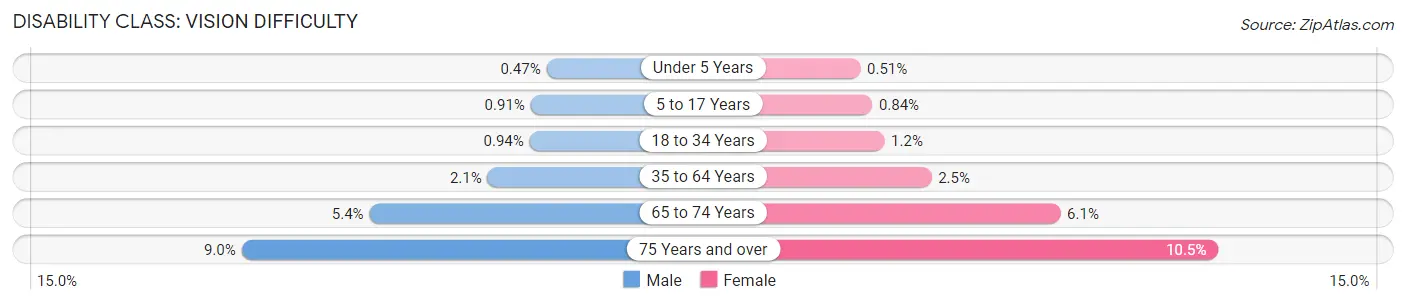
| Age Bracket | Male | Female |
| Under 5 Years | 204 (0.5%) | 226 (0.5%) |
| 5 to 17 Years | 1,088 (0.9%) | 953 (0.8%) |
| 18 to 34 Years | 2,209 (0.9%) | 2,889 (1.2%) |
| 35 to 64 Years | 6,111 (2.1%) | 7,426 (2.5%) |
| 65 to 74 Years | 3,094 (5.4%) | 4,089 (6.1%) |
| 75 Years and over | 3,172 (9.0%) | 5,583 (10.5%) |
Disability Class: Cognitive Difficulty
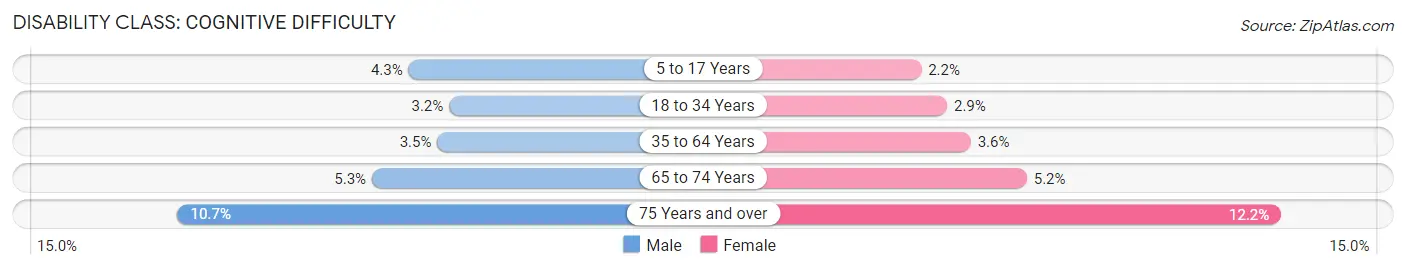
| Age Bracket | Male | Female |
| 5 to 17 Years | 5,137 (4.3%) | 2,490 (2.2%) |
| 18 to 34 Years | 7,467 (3.2%) | 7,189 (2.9%) |
| 35 to 64 Years | 10,186 (3.5%) | 10,694 (3.6%) |
| 65 to 74 Years | 3,055 (5.3%) | 3,467 (5.1%) |
| 75 Years and over | 3,803 (10.7%) | 6,516 (12.2%) |
Disability Class: Ambulatory Difficulty
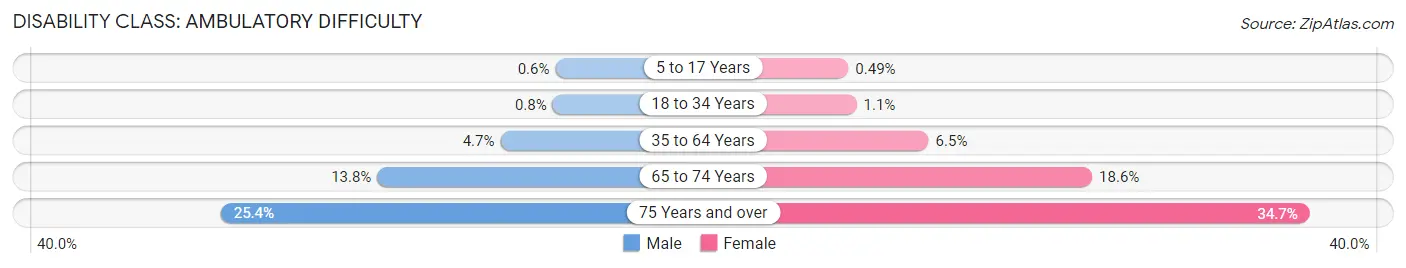
| Age Bracket | Male | Female |
| 5 to 17 Years | 712 (0.6%) | 558 (0.5%) |
| 18 to 34 Years | 1,882 (0.8%) | 2,706 (1.1%) |
| 35 to 64 Years | 13,586 (4.7%) | 19,235 (6.5%) |
| 65 to 74 Years | 7,912 (13.8%) | 12,508 (18.6%) |
| 75 Years and over | 9,002 (25.4%) | 18,501 (34.7%) |
Disability Class: Self-Care Difficulty
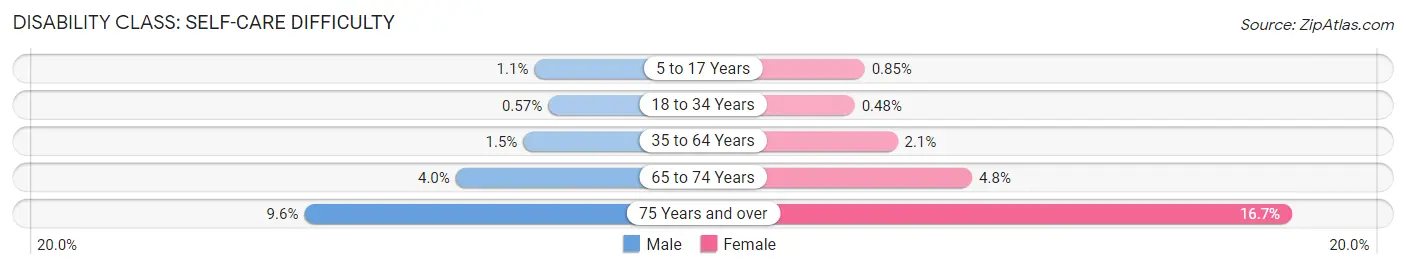
| Age Bracket | Male | Female |
| 5 to 17 Years | 1,288 (1.1%) | 964 (0.9%) |
| 18 to 34 Years | 1,332 (0.6%) | 1,170 (0.5%) |
| 35 to 64 Years | 4,329 (1.5%) | 6,167 (2.1%) |
| 65 to 74 Years | 2,292 (4.0%) | 3,256 (4.8%) |
| 75 Years and over | 3,405 (9.6%) | 8,904 (16.7%) |
Technology Access in Area Code 312
Computing Device Access in Area Code 312
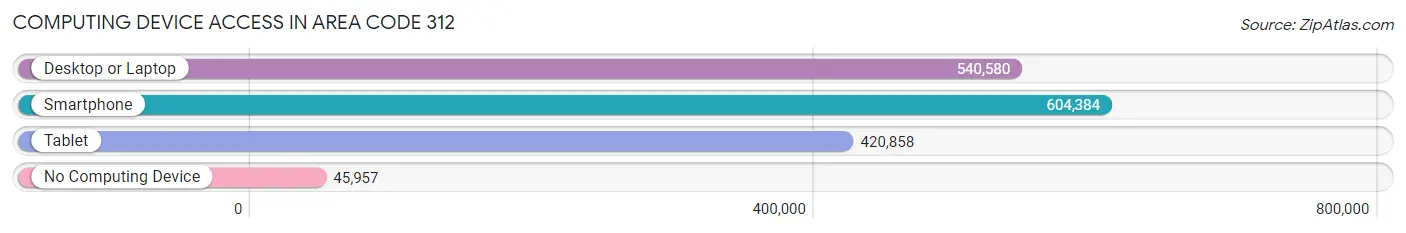
| Device Type | # Households | % Households |
| Desktop or Laptop | 540,580 | 79.8% |
| Smartphone | 604,384 | 89.2% |
| Tablet | 420,858 | 62.1% |
| No Computing Device | 45,957 | 6.8% |
| Total | 677,609 | 100.0% |
Internet Access in Area Code 312
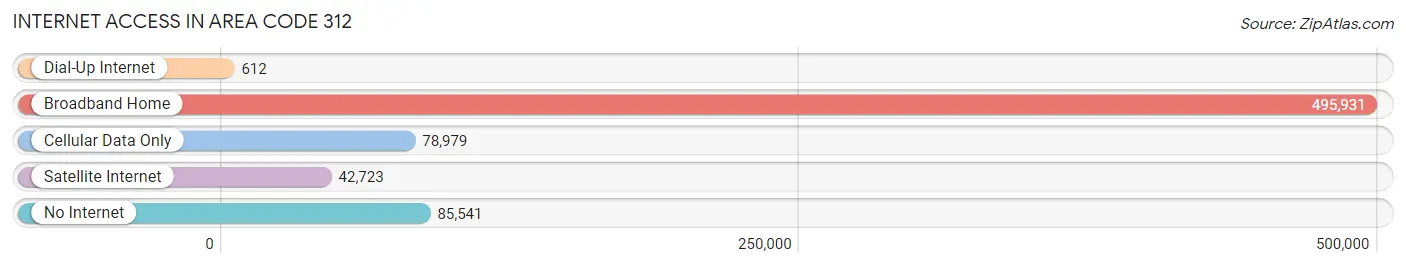
| Internet Type | # Households | % Households |
| Dial-Up Internet | 612 | 0.1% |
| Broadband Home | 495,931 | 73.2% |
| Cellular Data Only | 78,979 | 11.7% |
| Satellite Internet | 42,723 | 6.3% |
| No Internet | 85,541 | 12.6% |
| Total | 677,609 | 100.0% |
Area Code 312 Summary
Geography
Area code 312 is located in the North American Numbering Plan (NANP) and covers the city of Chicago, Illinois. It is one of the original area codes created in 1947 and is the only area code that serves the city of Chicago.
Social
Area code 312 is a major hub for communication in the city of Chicago. It is the area code for the city's downtown business district, and is also used by many of the city's residents. It is also the area code for the University of Chicago, one of the most prestigious universities in the United States.
Economics
Area code 312 is a major economic center in the Midwest. It is home to many of the city's major corporations, including Boeing, McDonald's, and United Airlines. It is also home to the Chicago Board of Trade, one of the world's largest futures exchanges.
Demographics
Area code 312 is home to a diverse population. According to the 2010 census, the population of the area code is over 2.7 million people. The population is made up of a variety of ethnicities, including African American, Hispanic, and Asian. The median household income in the area code is $50,000, which is slightly higher than the national average.
Common Questions
What is Per Capita Income in Area Code 312?
Per Capita income in Area Code 312 is $65,563.
What is the Median Family Income in Area Code 312?
Median Family Income in Area Code 312 is $138,490.
What is the Median Household income in Area Code 312?
Median Household Income in Area Code 312 is $97,843.
What is Income or Wage Gap in Area Code 312?
Income or Wage Gap in Area Code 312 is 26.3%.
Women in Area Code 312 earn 73.7 cents for every dollar earned by a man.
What is Family Income Deficit in Area Code 312?
Family Income Deficit in Area Code 312 is $11,652.
Families that are below poverty line in Area Code 312 earn $11,652 less on average than the poverty threshold level.
What is Inequality or Gini Index in Area Code 312?
Inequality or Gini Index in Area Code 312 is 20.59.
What is the Total Population of Area Code 312?
Total Population of Area Code 312 is 1,610,981.
What is the Total Male Population of Area Code 312?
Total Male Population of Area Code 312 is 785,072.
What is the Total Female Population of Area Code 312?
Total Female Population of Area Code 312 is 825,909.
What is the Ratio of Males per 100 Females in Area Code 312?
There are 95.06 Males per 100 Females in Area Code 312.
What is the Ratio of Females per 100 Males in Area Code 312?
There are 105.20 Females per 100 Males in Area Code 312.
What is the Median Population Age in Area Code 312?
Median Population Age in Area Code 312 is 37.1 Years.
What is the Average Family Size in Area Code 312
Average Family Size in Area Code 312 is 3.0 People.
What is the Average Household Size in Area Code 312
Average Household Size in Area Code 312 is 2.3 People.
How Large is the Labor Force in Area Code 312?
There are 914,572 People in the Labor Forcein in Area Code 312.
What is the Percentage of People in the Labor Force in Area Code 312?
68.9% of People are in the Labor Force in Area Code 312.
What is the Unemployment Rate in Area Code 312?
Unemployment Rate in Area Code 312 is 6.9%.