Area Code 217 Map & Demographics
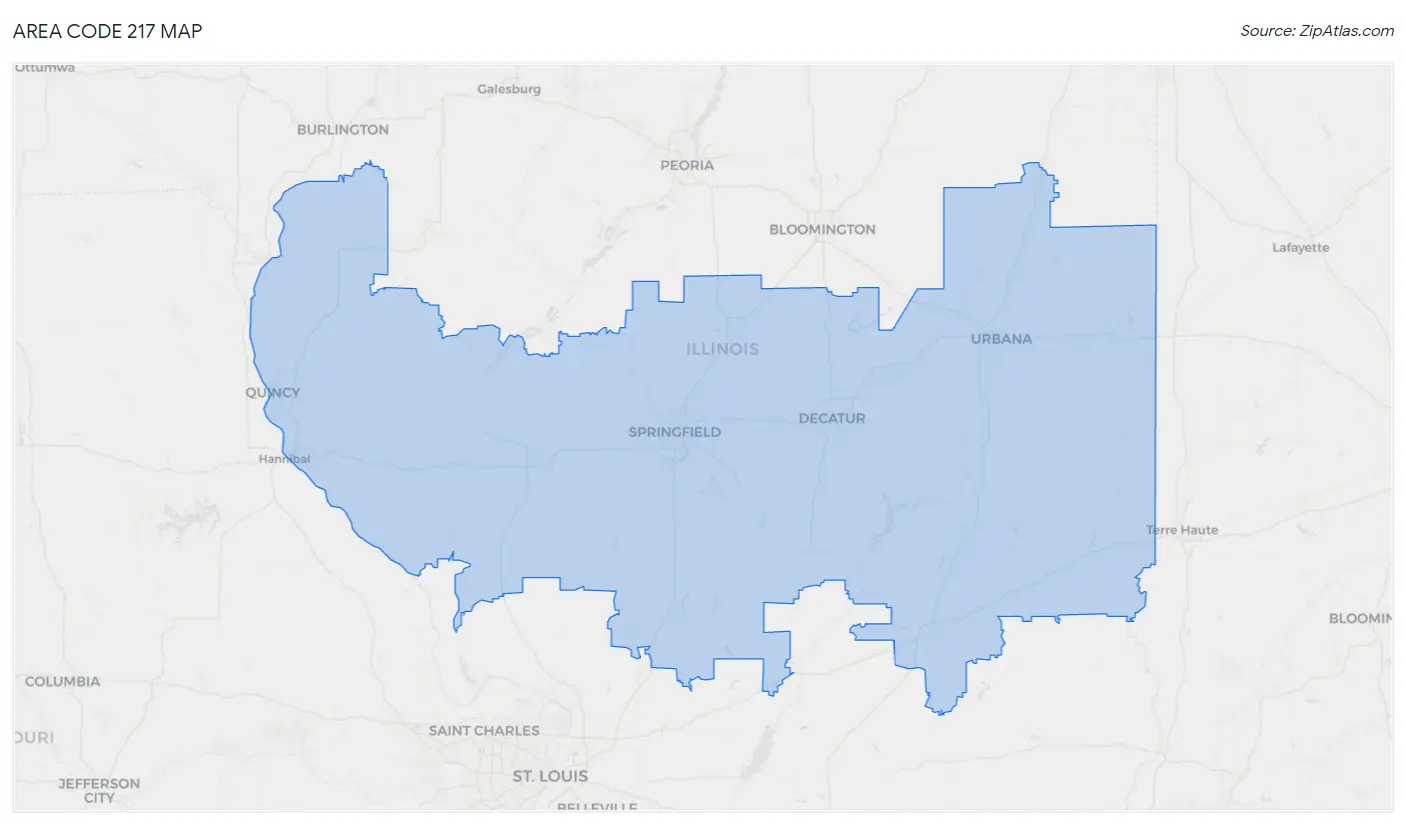
Area Code 217 Map
Area Code 217 Overview
$35,651
PER CAPITA INCOME
$87,880
AVG FAMILY INCOME
$70,864
AVG HOUSEHOLD INCOME
31.6%
WAGE / INCOME GAP [ % ]
68.4¢/ $1
WAGE / INCOME GAP [ $ ]
$11,412
FAMILY INCOME DEFICIT
123.24
INEQUALITY / GINI INDEX
1,138,824
TOTAL POPULATION
565,177
MALE POPULATION
573,647
FEMALE POPULATION
98.52
MALES / 100 FEMALES
101.50
FEMALES / 100 MALES
43.0
MEDIAN AGE
3.0
AVG FAMILY SIZE
2.4
AVG HOUSEHOLD SIZE
565,750
LABOR FORCE [ PEOPLE ]
60.9%
PERCENT IN LABOR FORCE
5.0%
UNEMPLOYMENT RATE
Income in Area Code 217
Income Overview in Area Code 217
Per Capita Income in Area Code 217 is $35,651, while median incomes of families and households are $87,880 and $70,864 respectively.
| Characteristic | Number | Measure |
| Per Capita Income | 1,138,824 | $35,651 |
| Median Family Income | 276,133 | $87,880 |
| Mean Family Income | 276,133 | $31,046,140 |
| Median Household Income | 472,937 | $70,864 |
| Mean Household Income | 472,937 | $26,341,907 |
| Income Deficit | 276,133 | $11,412 |
| Wage / Income Gap (%) | 1,138,824 | 31.60% |
| Wage / Income Gap ($) | 1,138,824 | 68.40¢ per $1 |
| Gini / Inequality Index | 1,138,824 | 123.24 |
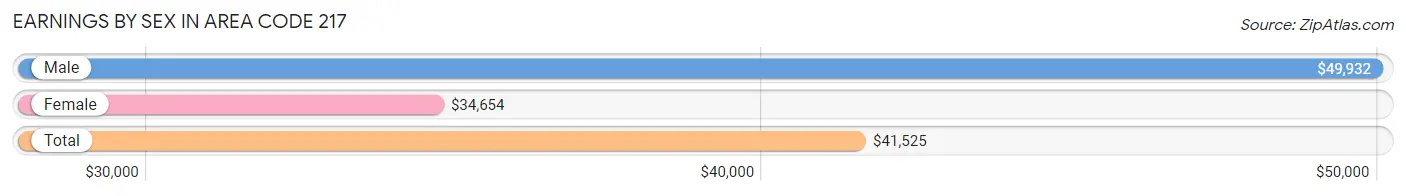
Earnings by Sex in Area Code 217
Average Earnings in Area Code 217 are $41,525, $49,932 for men and $34,654 for women, a difference of 30.6%.
| Sex | Number | Average Earnings |
| Male | 312,223 (52.3%) | $49,932 |
| Female | 284,516 (47.7%) | $34,654 |
| Total | 596,739 (100.0%) | $41,525 |
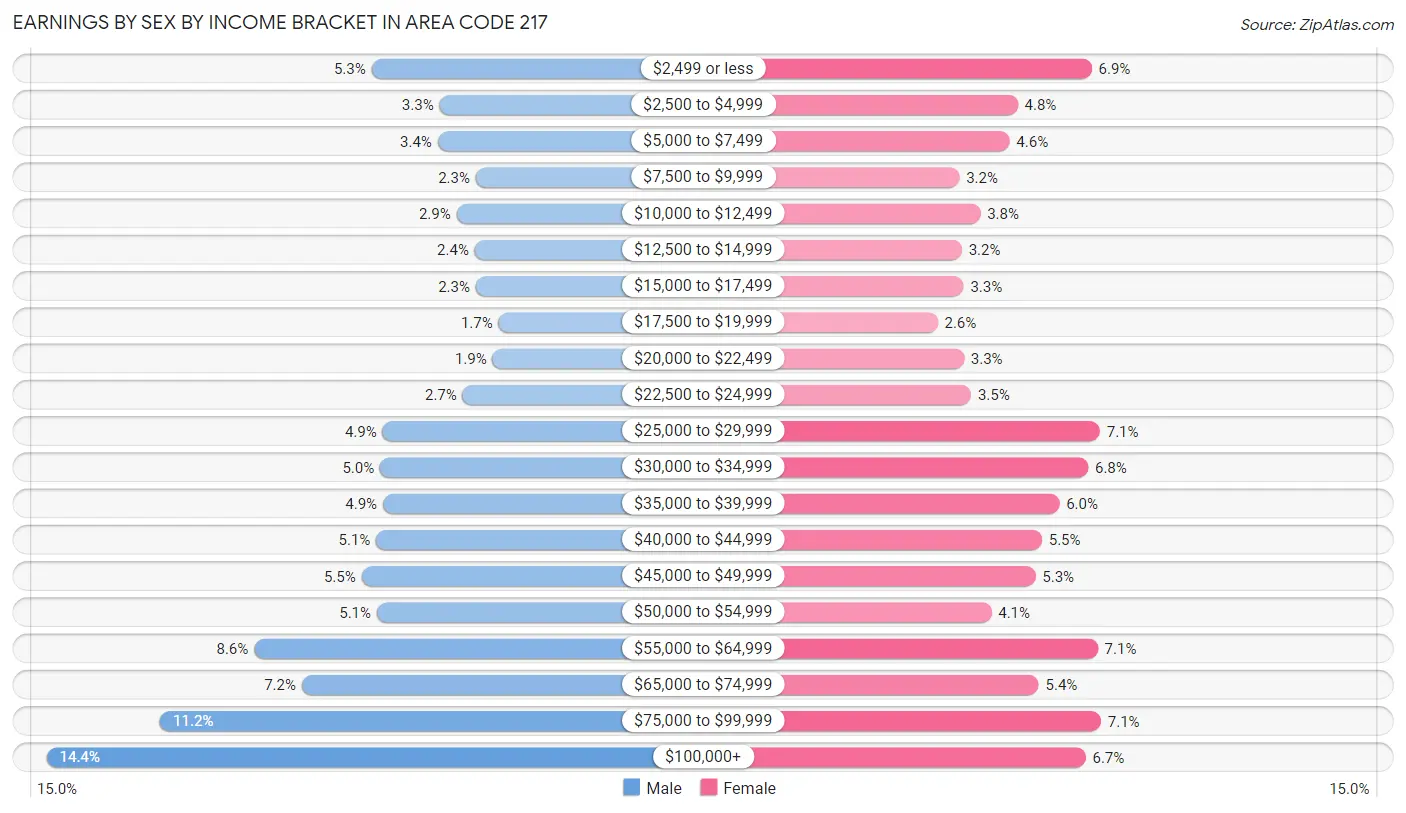
Earnings by Sex by Income Bracket in Area Code 217
The most common earnings brackets in Area Code 217 are $100,000+ for men (44,892 | 14.4%) and $75,000 to $99,999 for women (20,313 | 7.1%).
| Income | Male | Female |
| $2,499 or less | 16,391 (5.2%) | 19,576 (6.9%) |
| $2,500 to $4,999 | 10,417 (3.3%) | 13,659 (4.8%) |
| $5,000 to $7,499 | 10,596 (3.4%) | 13,016 (4.6%) |
| $7,500 to $9,999 | 7,245 (2.3%) | 8,987 (3.2%) |
| $10,000 to $12,499 | 8,941 (2.9%) | 10,661 (3.7%) |
| $12,500 to $14,999 | 7,338 (2.4%) | 9,202 (3.2%) |
| $15,000 to $17,499 | 7,244 (2.3%) | 9,337 (3.3%) |
| $17,500 to $19,999 | 5,240 (1.7%) | 7,269 (2.5%) |
| $20,000 to $22,499 | 5,764 (1.8%) | 9,352 (3.3%) |
| $22,500 to $24,999 | 8,406 (2.7%) | 9,941 (3.5%) |
| $25,000 to $29,999 | 15,414 (4.9%) | 20,219 (7.1%) |
| $30,000 to $34,999 | 15,629 (5.0%) | 19,281 (6.8%) |
| $35,000 to $39,999 | 15,389 (4.9%) | 16,979 (6.0%) |
| $40,000 to $44,999 | 15,993 (5.1%) | 15,603 (5.5%) |
| $45,000 to $49,999 | 17,266 (5.5%) | 15,093 (5.3%) |
| $50,000 to $54,999 | 15,928 (5.1%) | 11,546 (4.1%) |
| $55,000 to $64,999 | 26,683 (8.6%) | 20,069 (7.0%) |
| $65,000 to $74,999 | 22,506 (7.2%) | 15,332 (5.4%) |
| $75,000 to $99,999 | 34,941 (11.2%) | 20,313 (7.1%) |
| $100,000+ | 44,892 (14.4%) | 19,081 (6.7%) |
| Total | 312,223 (100.0%) | 284,516 (100.0%) |
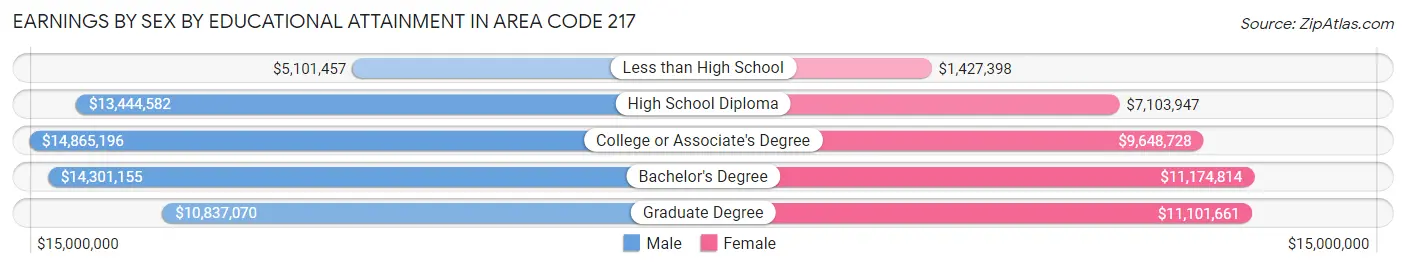
Earnings by Sex by Educational Attainment in Area Code 217
Average earnings in Area Code 217 are $16,150,068 for men and $11,401,348 for women, a difference of 29.4%. Men with an educational attainment of college or associate's degree enjoy the highest average annual earnings of $14,865,196, while those with less than high school education earn the least with $5,101,457. Women with an educational attainment of bachelor's degree earn the most with the average annual earnings of $11,174,814, while those with less than high school education have the smallest earnings of $1,427,398.
| Educational Attainment | Male Income | Female Income |
| Less than High School | $5,101,457 | $1,427,398 |
| High School Diploma | $13,444,582 | $7,103,947 |
| College or Associate's Degree | $14,865,196 | $9,648,728 |
| Bachelor's Degree | $14,301,155 | $11,174,814 |
| Graduate Degree | $10,837,070 | $11,101,661 |
| Total | $16,150,068 | $11,401,348 |
Family Income in Area Code 217
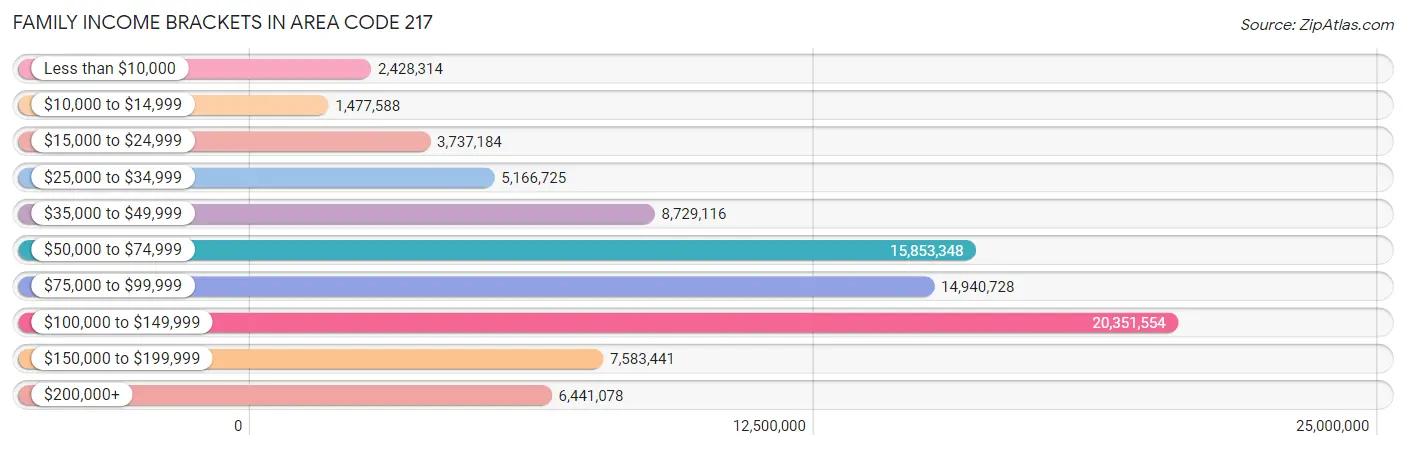
Family Income Brackets in Area Code 217
According to the Area Code 217 family income data, there are 20,351,554 families falling into the $100,000 to $149,999 income range, which is the most common income bracket and makes up 7,370.2% of all families. Conversely, the $10,000 to $14,999 income bracket is the least frequent group with only 1,477,588 families (535.1%) belonging to this category.
| Income Bracket | # Families | % Families |
| Less than $10,000 | 2,428,314 | 879.4% |
| $10,000 to $14,999 | 1,477,588 | 535.1% |
| $15,000 to $24,999 | 3,737,184 | 1,353.4% |
| $25,000 to $34,999 | 5,166,725 | 1,871.1% |
| $35,000 to $49,999 | 8,729,116 | 3,161.2% |
| $50,000 to $74,999 | 15,853,348 | 5,741.2% |
| $75,000 to $99,999 | 14,940,728 | 5,410.7% |
| $100,000 to $149,999 | 20,351,554 | 7,370.2% |
| $150,000 to $199,999 | 7,583,441 | 2,746.3% |
| $200,000+ | 6,441,078 | 2,332.6% |
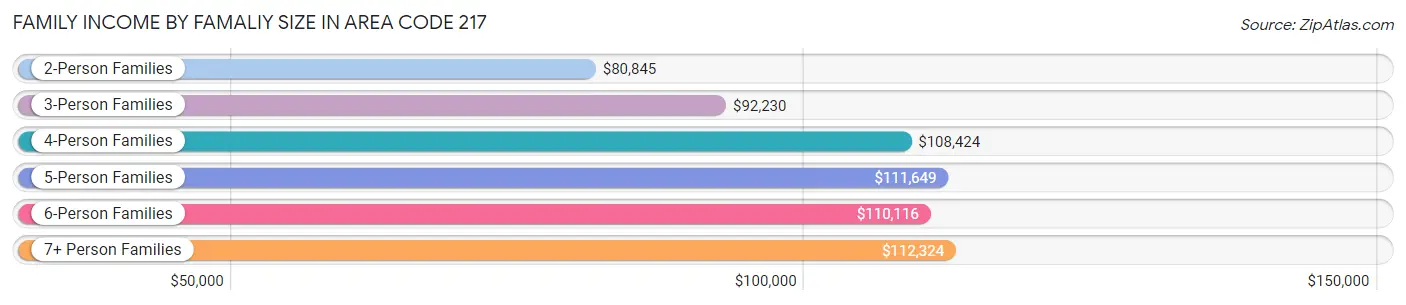
Family Income by Famaliy Size in Area Code 217
7+ person families (2,710 | 1.0%) account for the highest median family income in Area Code 217 with $112,324 per family, while 2-person families (150,425 | 54.5%) have the highest median income of $40,423 per family member.
| Income Bracket | # Families | Median Income |
| 2-Person Families | 150,425 (54.5%) | $80,845 |
| 3-Person Families | 56,192 (20.3%) | $92,230 |
| 4-Person Families | 42,341 (15.3%) | $108,424 |
| 5-Person Families | 18,047 (6.5%) | $111,649 |
| 6-Person Families | 6,418 (2.3%) | $110,116 |
| 7+ Person Families | 2,710 (1.0%) | $112,324 |
| Total | 276,133 (100.0%) | $87,880 |
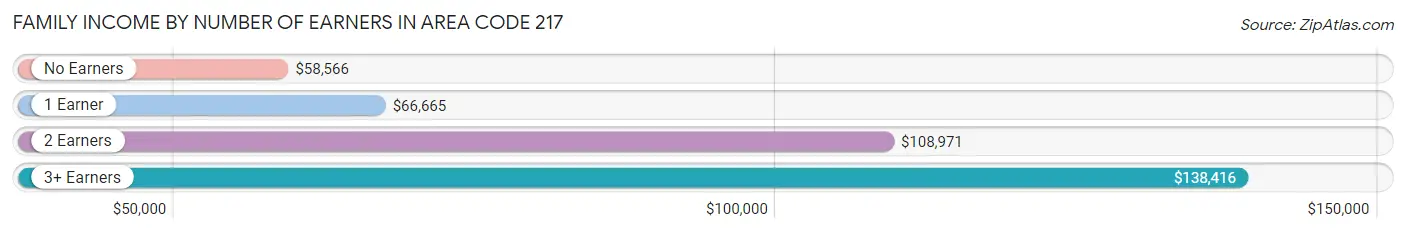
Family Income by Number of Earners in Area Code 217
The median family income in Area Code 217 is $87,880, with families comprising 3+ earners (24,305) having the highest median family income of $138,416, while families with no earners (47,305) have the lowest median family income of $58,566, accounting for 8.8% and 17.1% of families, respectively.
| Number of Earners | # Families | Median Income |
| No Earners | 47,305 (17.1%) | $58,566 |
| 1 Earner | 87,503 (31.7%) | $66,665 |
| 2 Earners | 117,020 (42.4%) | $108,971 |
| 3+ Earners | 24,305 (8.8%) | $138,416 |
| Total | 276,133 (100.0%) | $87,880 |
Household Income in Area Code 217
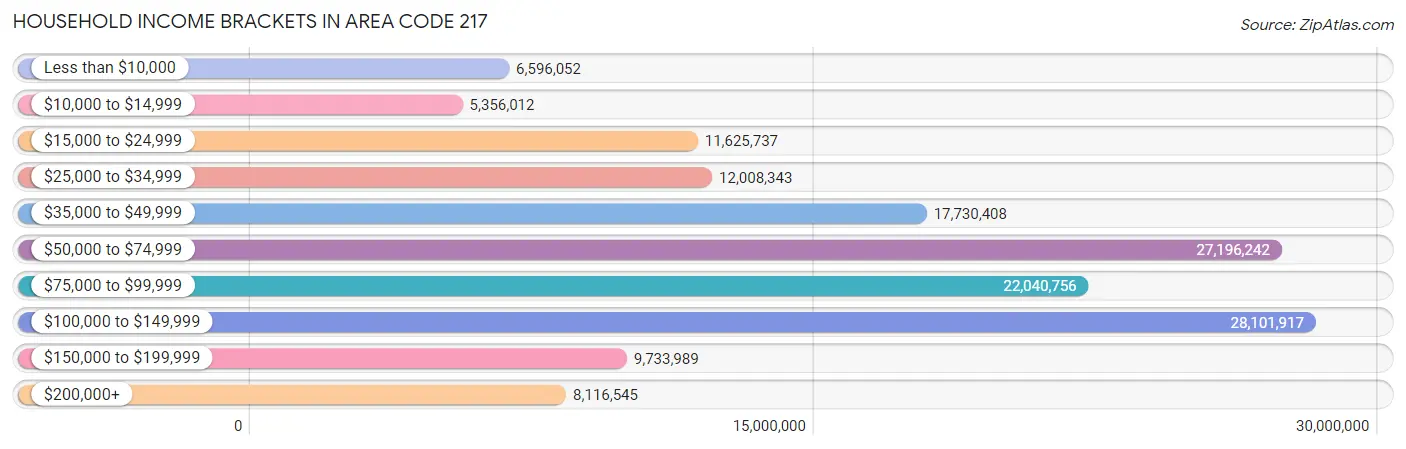
Household Income Brackets in Area Code 217
With 28,101,917 households falling in the category, the $100,000 to $149,999 income range is the most frequent in Area Code 217, accounting for 5,942.0% of all households. In contrast, only 5,356,012 households (1,132.5%) fall into the $10,000 to $14,999 income bracket, making it the least populous group.
| Income Bracket | # Households | % Households |
| Less than $10,000 | 6,596,052 | 1,394.7% |
| $10,000 to $14,999 | 5,356,012 | 1,132.5% |
| $15,000 to $24,999 | 11,625,737 | 2,458.2% |
| $25,000 to $34,999 | 12,008,343 | 2,539.1% |
| $35,000 to $49,999 | 17,730,408 | 3,749.0% |
| $50,000 to $74,999 | 27,196,242 | 5,750.5% |
| $75,000 to $99,999 | 22,040,756 | 4,660.4% |
| $100,000 to $149,999 | 28,101,917 | 5,942.0% |
| $150,000 to $199,999 | 9,733,989 | 2,058.2% |
| $200,000+ | 8,116,545 | 1,716.2% |
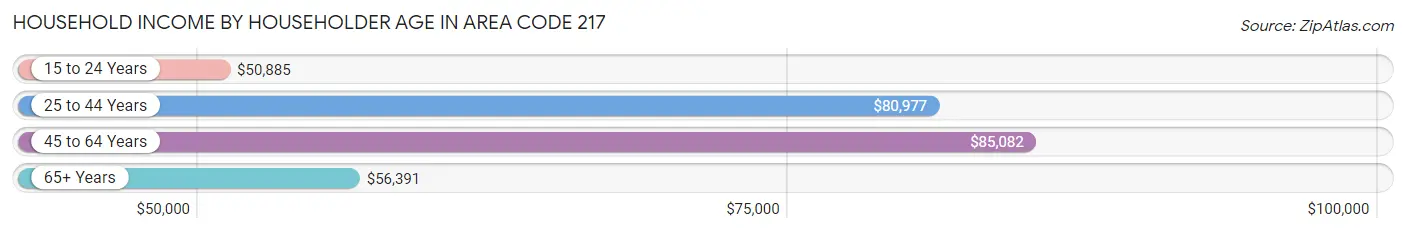
Household Income by Householder Age in Area Code 217
The median household income in Area Code 217 is $70,864, with the highest median household income of $85,082 found in the 45 to 64 years age bracket for the primary householder. A total of 161,891 households (34.2%) fall into this category. Meanwhile, the 15 to 24 years age bracket for the primary householder has the lowest median household income of $50,885, with 30,115 households (6.4%) in this group.
| Income Bracket | # Households | Median Income |
| 15 to 24 Years | 30,115 (6.4%) | $50,885 |
| 25 to 44 Years | 146,962 (31.1%) | $80,977 |
| 45 to 64 Years | 161,891 (34.2%) | $85,082 |
| 65+ Years | 133,969 (28.3%) | $56,391 |
| Total | 472,937 (100.0%) | $70,864 |
Poverty in Area Code 217
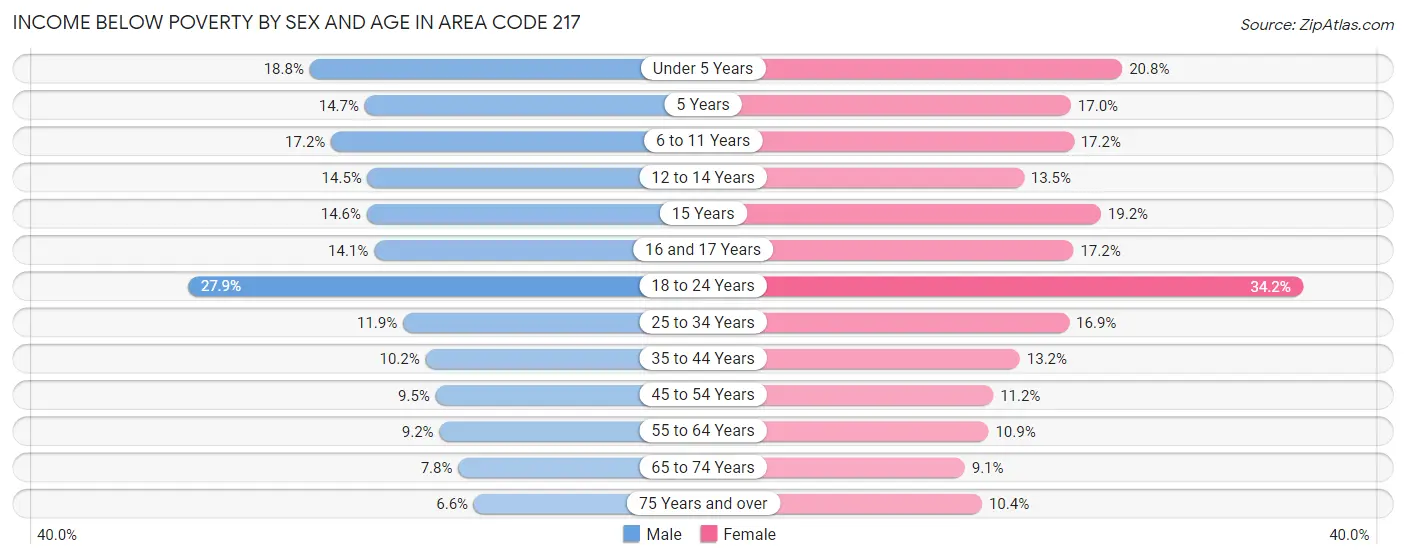
Income Below Poverty by Sex and Age in Area Code 217
With 13.0% poverty level for males and 15.3% for females among the residents of Area Code 217, 18 to 24 year old males and 18 to 24 year old females are the most vulnerable to poverty, with 15,498 males (27.9%) and 17,659 females (34.2%) in their respective age groups living below the poverty level.
| Age Bracket | Male | Female |
| Under 5 Years | 5,799 (18.8%) | 6,235 (20.8%) |
| 5 Years | 817 (14.7%) | 1,051 (17.0%) |
| 6 to 11 Years | 6,898 (17.2%) | 6,483 (17.2%) |
| 12 to 14 Years | 3,120 (14.5%) | 2,707 (13.5%) |
| 15 Years | 991 (14.6%) | 1,345 (19.2%) |
| 16 and 17 Years | 1,969 (14.1%) | 2,229 (17.2%) |
| 18 to 24 Years | 15,498 (27.9%) | 17,659 (34.2%) |
| 25 to 34 Years | 8,380 (11.9%) | 11,924 (16.9%) |
| 35 to 44 Years | 6,850 (10.2%) | 8,827 (13.2%) |
| 45 to 54 Years | 6,012 (9.5%) | 7,103 (11.2%) |
| 55 to 64 Years | 6,733 (9.2%) | 8,196 (10.9%) |
| 65 to 74 Years | 4,334 (7.8%) | 5,661 (9.1%) |
| 75 Years and over | 2,278 (6.6%) | 5,077 (10.4%) |
| Total | 69,679 (13.0%) | 84,497 (15.3%) |
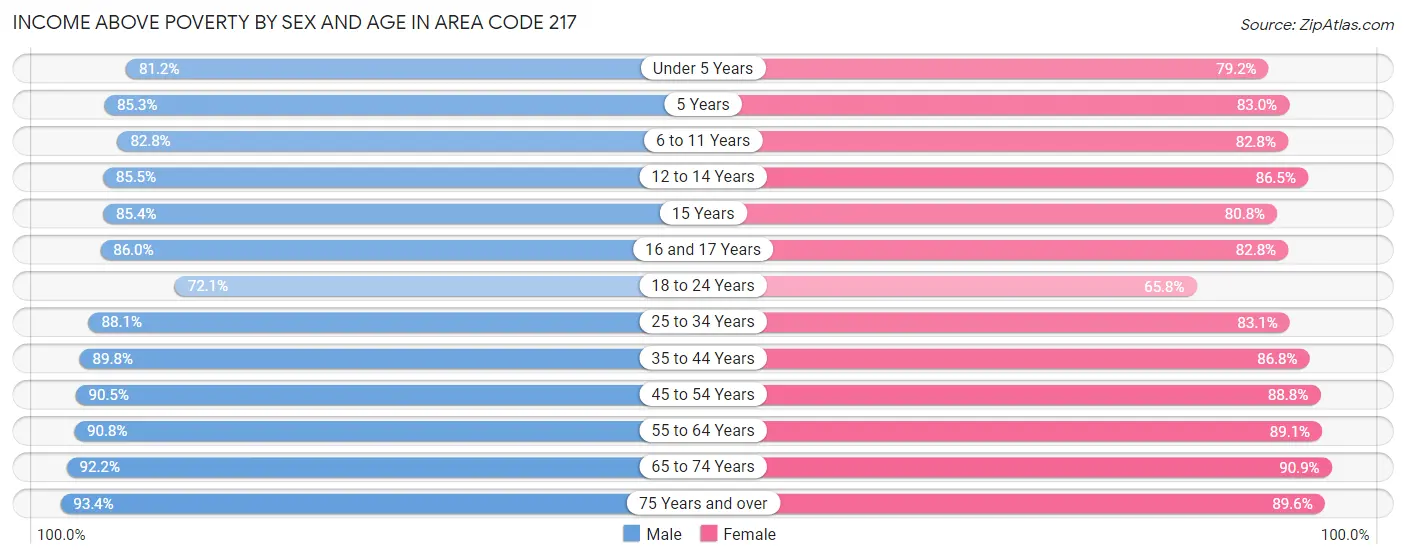
Income Above Poverty by Sex and Age in Area Code 217
According to the poverty statistics in Area Code 217, males aged 75 years and over and females aged 65 to 74 years are the age groups that are most secure financially, with 93.4% of males and 90.9% of females in these age groups living above the poverty line.
| Age Bracket | Male | Female |
| Under 5 Years | 25,005 (81.2%) | 23,709 (79.2%) |
| 5 Years | 4,726 (85.3%) | 5,126 (83.0%) |
| 6 to 11 Years | 33,112 (82.8%) | 31,159 (82.8%) |
| 12 to 14 Years | 18,349 (85.5%) | 17,337 (86.5%) |
| 15 Years | 5,799 (85.4%) | 5,645 (80.8%) |
| 16 and 17 Years | 12,042 (86.0%) | 10,728 (82.8%) |
| 18 to 24 Years | 40,100 (72.1%) | 33,956 (65.8%) |
| 25 to 34 Years | 62,056 (88.1%) | 58,702 (83.1%) |
| 35 to 44 Years | 60,098 (89.8%) | 57,966 (86.8%) |
| 45 to 54 Years | 57,379 (90.5%) | 56,104 (88.8%) |
| 55 to 64 Years | 66,415 (90.8%) | 67,061 (89.1%) |
| 65 to 74 Years | 51,224 (92.2%) | 56,328 (90.9%) |
| 75 Years and over | 32,036 (93.4%) | 43,670 (89.6%) |
| Total | 468,341 (87.1%) | 467,491 (84.7%) |
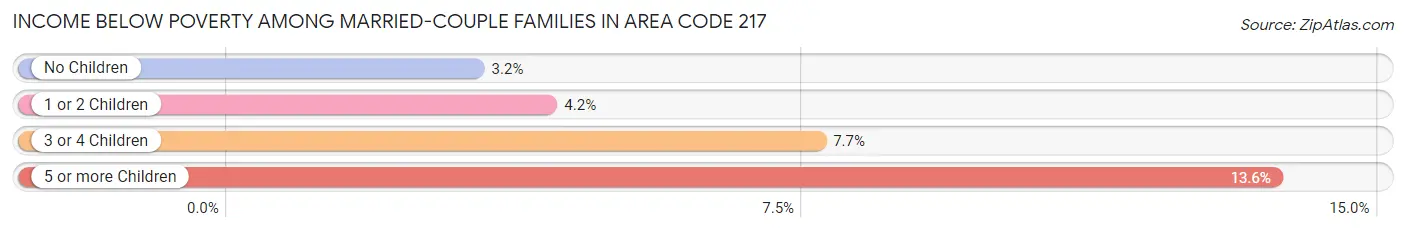
Income Below Poverty Among Married-Couple Families in Area Code 217
The poverty statistics for married-couple families in Area Code 217 show that 3.9% or 8,129 of the total 209,323 families live below the poverty line. Families with 5 or more children have the highest poverty rate of 13.6%, comprising of 181 families. On the other hand, families with no children have the lowest poverty rate of 3.2%, which includes 4,300 families.
| Children | Above Poverty | Below Poverty |
| No Children | 129,188 (96.8%) | 4,300 (3.2%) |
| 1 or 2 Children | 56,550 (95.8%) | 2,458 (4.2%) |
| 3 or 4 Children | 14,310 (92.3%) | 1,190 (7.7%) |
| 5 or more Children | 1,146 (86.4%) | 181 (13.6%) |
| Total | 201,194 (96.1%) | 8,129 (3.9%) |
Income Below Poverty Among Single-Parent Households in Area Code 217
According to the poverty data in Area Code 217, 18.0% or 3,421 single-father households and 26.4% or 12,620 single-mother households are living below the poverty line. Among single-father households, those with 3 or 4 children have the highest poverty rate, with 513 households (39.5%) experiencing poverty. Likewise, among single-mother households, those with 5 or more children have the highest poverty rate, with 488 households (63.9%) falling below the poverty line.
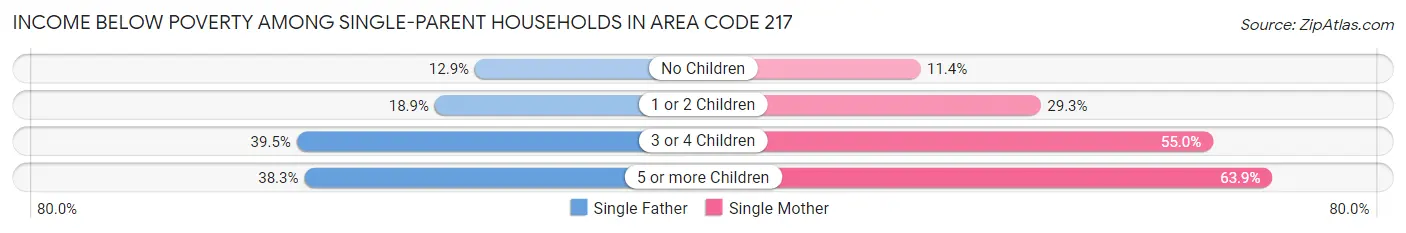
| Children | Single Father | Single Mother |
| No Children | 961 (12.9%) | 1,865 (11.4%) |
| 1 or 2 Children | 1,906 (18.9%) | 7,552 (29.3%) |
| 3 or 4 Children | 513 (39.5%) | 2,715 (55.0%) |
| 5 or more Children | 41 (38.3%) | 488 (63.9%) |
| Total | 3,421 (18.0%) | 12,620 (26.4%) |
Income Below Poverty Among Married-Couple vs Single-Parent Households in Area Code 217
The poverty data for Area Code 217 shows that 8,129 of the married-couple family households (3.9%) and 16,041 of the single-parent households (24.0%) are living below the poverty level. Within the married-couple family households, those with 5 or more children have the highest poverty rate, with 181 households (13.6%) falling below the poverty line. Among the single-parent households, those with 5 or more children have the highest poverty rate, with 529 household (60.7%) living below poverty.
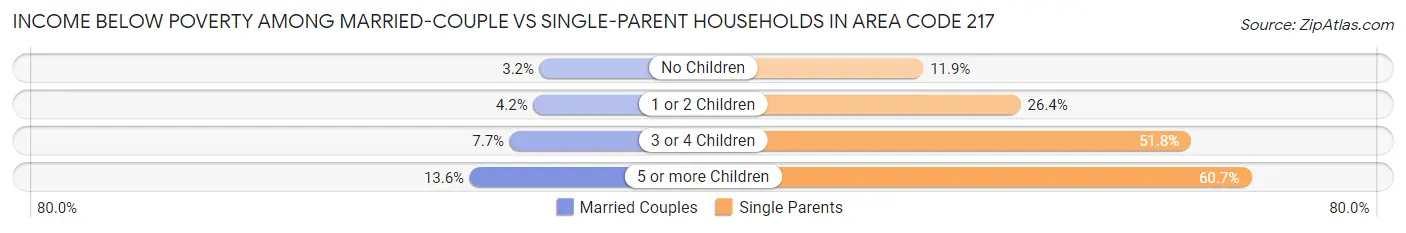
| Children | Married-Couple Families | Single-Parent Households |
| No Children | 4,300 (3.2%) | 2,826 (11.8%) |
| 1 or 2 Children | 2,458 (4.2%) | 9,458 (26.4%) |
| 3 or 4 Children | 1,190 (7.7%) | 3,228 (51.8%) |
| 5 or more Children | 181 (13.6%) | 529 (60.7%) |
| Total | 8,129 (3.9%) | 16,041 (24.0%) |
Race in Area Code 217
The most populous races in Area Code 217 are White / Caucasian (943,417 | 82.8%), Black / African American (99,003 | 8.7%), and Two or more Races (46,121 | 4.1%).
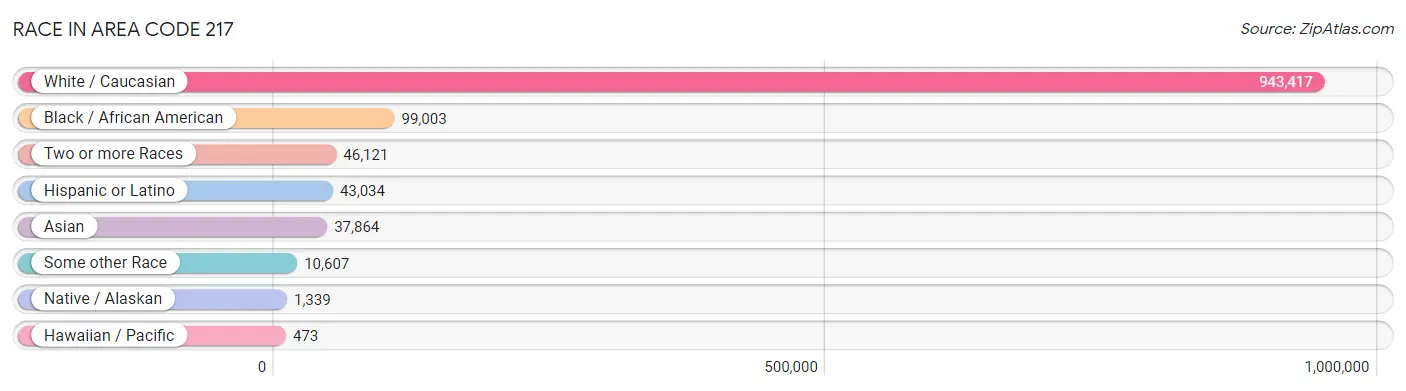
| Race | # Population | % Population |
| Asian | 37,864 | 3.3% |
| Black / African American | 99,003 | 8.7% |
| Hawaiian / Pacific | 473 | 0.0% |
| Hispanic or Latino | 43,034 | 3.8% |
| Native / Alaskan | 1,339 | 0.1% |
| White / Caucasian | 943,417 | 82.8% |
| Two or more Races | 46,121 | 4.1% |
| Some other Race | 10,607 | 0.9% |
| Total | 1,138,824 | 100.0% |
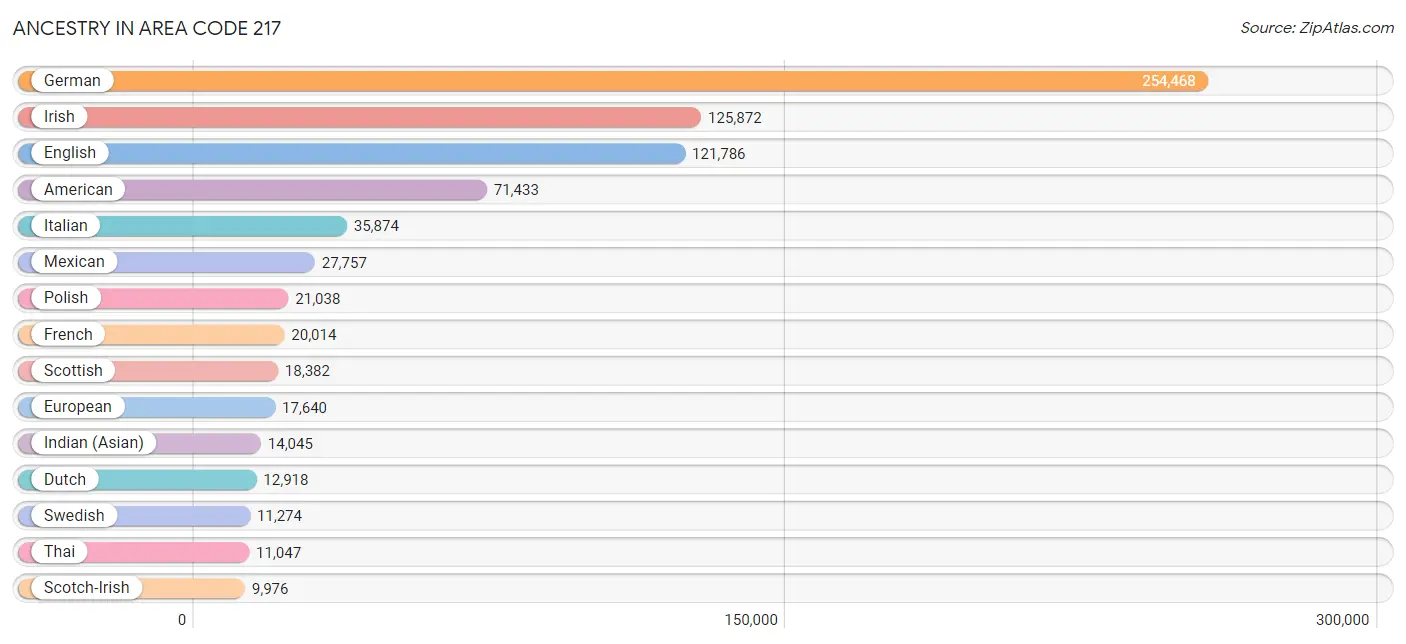
Ancestry in Area Code 217
The most populous ancestries reported in Area Code 217 are German (254,468 | 22.3%), Irish (125,872 | 11.1%), English (121,786 | 10.7%), American (71,433 | 6.3%), and Italian (35,874 | 3.2%), together accounting for 53.5% of all Area Code 217 residents.
| Ancestry | # Population | % Population |
| Afghan | 37 | 0.0% |
| African | 4,056 | 0.4% |
| Alaskan Athabascan | 16 | 0.0% |
| Albanian | 194 | 0.0% |
| Aleut | 2 | 0.0% |
| Alsatian | 46 | 0.0% |
| American | 71,433 | 6.3% |
| Apache | 163 | 0.0% |
| Arab | 3,135 | 0.3% |
| Argentinean | 222 | 0.0% |
| Armenian | 222 | 0.0% |
| Assyrian / Chaldean / Syriac | 157 | 0.0% |
| Australian | 178 | 0.0% |
| Austrian | 1,823 | 0.2% |
| Bahamian | 4 | 0.0% |
| Bangladeshi | 110 | 0.0% |
| Barbadian | 127 | 0.0% |
| Basque | 15 | 0.0% |
| Belgian | 1,046 | 0.1% |
| Belizean | 327 | 0.0% |
| Bermudan | 17 | 0.0% |
| Bhutanese | 1,628 | 0.1% |
| Blackfeet | 559 | 0.1% |
| Bolivian | 352 | 0.0% |
| Brazilian | 488 | 0.0% |
| British | 6,167 | 0.5% |
| British West Indian | 16 | 0.0% |
| Bulgarian | 130 | 0.0% |
| Burmese | 4,111 | 0.4% |
| Cajun | 80 | 0.0% |
| Cambodian | 137 | 0.0% |
| Canadian | 1,009 | 0.1% |
| Carpatho Rusyn | 20 | 0.0% |
| Celtic | 18 | 0.0% |
| Central American | 2,957 | 0.3% |
| Central American Indian | 257 | 0.0% |
| Cherokee | 2,195 | 0.2% |
| Cheyenne | 18 | 0.0% |
| Chickasaw | 80 | 0.0% |
| Chilean | 302 | 0.0% |
| Chippewa | 102 | 0.0% |
| Choctaw | 237 | 0.0% |
| Colombian | 941 | 0.1% |
| Comanche | 42 | 0.0% |
| Costa Rican | 230 | 0.0% |
| Cree | 16 | 0.0% |
| Creek | 127 | 0.0% |
| Croatian | 1,095 | 0.1% |
| Crow | 14 | 0.0% |
| Cuban | 776 | 0.1% |
| Cypriot | 14 | 0.0% |
| Czech | 2,976 | 0.3% |
| Czechoslovakian | 1,028 | 0.1% |
| Danish | 2,291 | 0.2% |
| Delaware | 4 | 0.0% |
| Dominican | 320 | 0.0% |
| Dutch | 12,918 | 1.1% |
| Dutch West Indian | 18 | 0.0% |
| Eastern European | 2,100 | 0.2% |
| Ecuadorian | 132 | 0.0% |
| Egyptian | 308 | 0.0% |
| English | 121,786 | 10.7% |
| Estonian | 63 | 0.0% |
| Ethiopian | 327 | 0.0% |
| European | 17,640 | 1.5% |
| Filipino | 733 | 0.1% |
| Finnish | 740 | 0.1% |
| French | 20,014 | 1.8% |
| French American Indian | 29 | 0.0% |
| French Canadian | 2,561 | 0.2% |
| German | 254,468 | 22.3% |
| German Russian | 142 | 0.0% |
| Ghanaian | 133 | 0.0% |
| Greek | 2,540 | 0.2% |
| Guamanian / Chamorro | 229 | 0.0% |
| Guatemalan | 1,488 | 0.1% |
| Guyanese | 1 | 0.0% |
| Haitian | 147 | 0.0% |
| Honduran | 275 | 0.0% |
| Hopi | 16 | 0.0% |
| Houma | 21 | 0.0% |
| Hungarian | 2,297 | 0.2% |
| Icelander | 67 | 0.0% |
| Indian (Asian) | 14,045 | 1.2% |
| Indonesian | 204 | 0.0% |
| Inupiat | 42 | 0.0% |
| Iranian | 796 | 0.1% |
| Iraqi | 81 | 0.0% |
| Irish | 125,872 | 11.1% |
| Iroquois | 78 | 0.0% |
| Israeli | 202 | 0.0% |
| Italian | 35,874 | 3.2% |
| Jamaican | 245 | 0.0% |
| Japanese | 196 | 0.0% |
| Jordanian | 175 | 0.0% |
| Kenyan | 113 | 0.0% |
| Kiowa | 5 | 0.0% |
| Korean | 5,337 | 0.5% |
| Laotian | 226 | 0.0% |
| Latvian | 172 | 0.0% |
| Lebanese | 582 | 0.1% |
| Liberian | 14 | 0.0% |
| Lithuanian | 2,736 | 0.2% |
| Luxembourger | 14 | 0.0% |
| Macedonian | 100 | 0.0% |
| Malaysian | 638 | 0.1% |
| Menominee | 59 | 0.0% |
| Mexican | 27,757 | 2.4% |
| Mexican American Indian | 361 | 0.0% |
| Mongolian | 56 | 0.0% |
| Moroccan | 505 | 0.0% |
| Native Hawaiian | 512 | 0.0% |
| Navajo | 109 | 0.0% |
| New Zealander | 33 | 0.0% |
| Nicaraguan | 129 | 0.0% |
| Nigerian | 1,178 | 0.1% |
| Northern European | 1,565 | 0.1% |
| Norwegian | 7,714 | 0.7% |
| Okinawan | 35 | 0.0% |
| Osage | 18 | 0.0% |
| Paiute | 3 | 0.0% |
| Pakistani | 1,059 | 0.1% |
| Palestinian | 358 | 0.0% |
| Panamanian | 212 | 0.0% |
| Paraguayan | 6 | 0.0% |
| Pennsylvania German | 1,316 | 0.1% |
| Peruvian | 410 | 0.0% |
| Polish | 21,038 | 1.8% |
| Portuguese | 2,060 | 0.2% |
| Potawatomi | 72 | 0.0% |
| Pueblo | 20 | 0.0% |
| Puerto Rican | 4,605 | 0.4% |
| Romanian | 694 | 0.1% |
| Russian | 3,467 | 0.3% |
| Salvadoran | 623 | 0.1% |
| Samoan | 121 | 0.0% |
| Scandinavian | 2,934 | 0.3% |
| Scotch-Irish | 9,976 | 0.9% |
| Scottish | 18,382 | 1.6% |
| Seminole | 10 | 0.0% |
| Senegalese | 73 | 0.0% |
| Serbian | 431 | 0.0% |
| Shoshone | 66 | 0.0% |
| Sierra Leonean | 20 | 0.0% |
| Sioux | 144 | 0.0% |
| Slavic | 305 | 0.0% |
| Slovak | 1,992 | 0.2% |
| Slovene | 457 | 0.0% |
| Somali | 22 | 0.0% |
| South African | 275 | 0.0% |
| South American | 2,777 | 0.2% |
| Spaniard | 915 | 0.1% |
| Spanish | 783 | 0.1% |
| Sri Lankan | 2,951 | 0.3% |
| Subsaharan African | 7,482 | 0.7% |
| Sudanese | 99 | 0.0% |
| Swedish | 11,274 | 1.0% |
| Swiss | 3,798 | 0.3% |
| Syrian | 123 | 0.0% |
| Thai | 11,047 | 1.0% |
| Tohono O'Odham | 5 | 0.0% |
| Tongan | 11 | 0.0% |
| Trinidadian and Tobagonian | 19 | 0.0% |
| Turkish | 440 | 0.0% |
| U.S. Virgin Islander | 72 | 0.0% |
| Ugandan | 15 | 0.0% |
| Ukrainian | 1,171 | 0.1% |
| Uruguayan | 66 | 0.0% |
| Venezuelan | 346 | 0.0% |
| Vietnamese | 291 | 0.0% |
| Welsh | 6,276 | 0.5% |
| West Indian | 98 | 0.0% |
| Yaqui | 32 | 0.0% |
| Yugoslavian | 284 | 0.0% |
| Yup'ik | 14 | 0.0% |
| Zimbabwean | 80 | 0.0% | View All 176 Rows |
Immigrants in Area Code 217
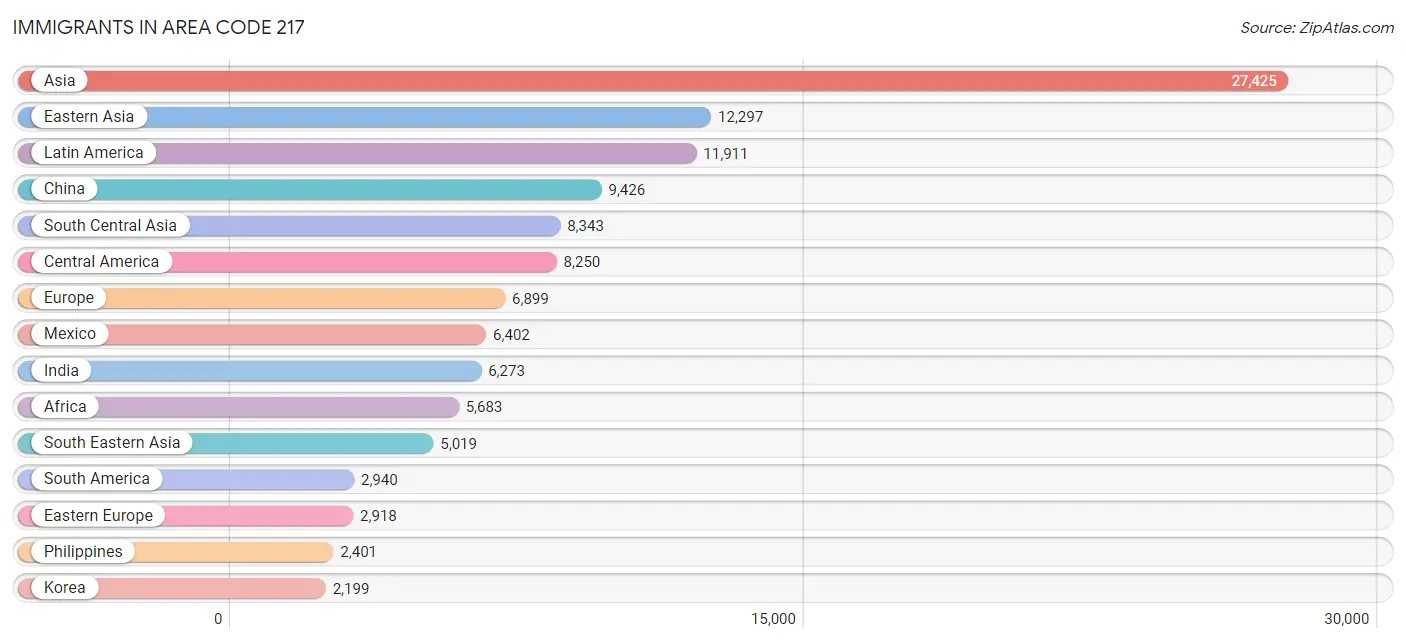
The most numerous immigrant groups reported in Area Code 217 came from Asia (27,425 | 2.4%), Eastern Asia (12,297 | 1.1%), Latin America (11,911 | 1.1%), China (9,426 | 0.8%), and South Central Asia (8,343 | 0.7%), together accounting for 6.1% of all Area Code 217 residents.
| Immigration Origin | # Population | % Population |
| Afghanistan | 18 | 0.0% |
| Africa | 5,683 | 0.5% |
| Albania | 12 | 0.0% |
| Argentina | 193 | 0.0% |
| Asia | 27,425 | 2.4% |
| Australia | 25 | 0.0% |
| Austria | 147 | 0.0% |
| Bahamas | 1 | 0.0% |
| Bangladesh | 286 | 0.0% |
| Belarus | 75 | 0.0% |
| Belgium | 28 | 0.0% |
| Belize | 225 | 0.0% |
| Bolivia | 132 | 0.0% |
| Bosnia and Herzegovina | 6 | 0.0% |
| Brazil | 897 | 0.1% |
| Bulgaria | 67 | 0.0% |
| Cambodia | 68 | 0.0% |
| Cameroon | 317 | 0.0% |
| Canada | 1,315 | 0.1% |
| Caribbean | 721 | 0.1% |
| Central America | 8,250 | 0.7% |
| Chile | 215 | 0.0% |
| China | 9,426 | 0.8% |
| Colombia | 699 | 0.1% |
| Congo | 196 | 0.0% |
| Costa Rica | 109 | 0.0% |
| Croatia | 33 | 0.0% |
| Cuba | 230 | 0.0% |
| Czechoslovakia | 214 | 0.0% |
| Denmark | 56 | 0.0% |
| Dominican Republic | 192 | 0.0% |
| Eastern Africa | 628 | 0.1% |
| Eastern Asia | 12,297 | 1.1% |
| Eastern Europe | 2,918 | 0.3% |
| Ecuador | 81 | 0.0% |
| Egypt | 265 | 0.0% |
| El Salvador | 546 | 0.1% |
| England | 532 | 0.1% |
| Eritrea | 4 | 0.0% |
| Ethiopia | 193 | 0.0% |
| Europe | 6,899 | 0.6% |
| Fiji | 30 | 0.0% |
| France | 264 | 0.0% |
| Germany | 984 | 0.1% |
| Ghana | 141 | 0.0% |
| Greece | 168 | 0.0% |
| Guatemala | 658 | 0.1% |
| Guyana | 86 | 0.0% |
| Haiti | 63 | 0.0% |
| Honduras | 138 | 0.0% |
| Hong Kong | 230 | 0.0% |
| Hungary | 25 | 0.0% |
| India | 6,273 | 0.5% |
| Indonesia | 214 | 0.0% |
| Iran | 730 | 0.1% |
| Iraq | 160 | 0.0% |
| Ireland | 67 | 0.0% |
| Israel | 342 | 0.0% |
| Italy | 444 | 0.0% |
| Jamaica | 130 | 0.0% |
| Japan | 561 | 0.1% |
| Jordan | 310 | 0.0% |
| Kazakhstan | 144 | 0.0% |
| Kenya | 128 | 0.0% |
| Korea | 2,199 | 0.2% |
| Kuwait | 38 | 0.0% |
| Laos | 361 | 0.0% |
| Latin America | 11,911 | 1.1% |
| Latvia | 1 | 0.0% |
| Lebanon | 123 | 0.0% |
| Liberia | 14 | 0.0% |
| Lithuania | 112 | 0.0% |
| Malaysia | 27 | 0.0% |
| Mexico | 6,402 | 0.6% |
| Micronesia | 159 | 0.0% |
| Middle Africa | 1,945 | 0.2% |
| Moldova | 31 | 0.0% |
| Morocco | 335 | 0.0% |
| Nepal | 272 | 0.0% |
| Netherlands | 146 | 0.0% |
| Nicaragua | 35 | 0.0% |
| Nigeria | 897 | 0.1% |
| North Macedonia | 151 | 0.0% |
| Northern Africa | 927 | 0.1% |
| Northern Europe | 1,554 | 0.1% |
| Norway | 85 | 0.0% |
| Oceania | 288 | 0.0% |
| Pakistan | 549 | 0.1% |
| Panama | 137 | 0.0% |
| Peru | 295 | 0.0% |
| Philippines | 2,401 | 0.2% |
| Poland | 630 | 0.1% |
| Portugal | 34 | 0.0% |
| Romania | 233 | 0.0% |
| Russia | 773 | 0.1% |
| Saudi Arabia | 264 | 0.0% |
| Scotland | 69 | 0.0% |
| Senegal | 128 | 0.0% |
| Serbia | 60 | 0.0% |
| Sierra Leone | 5 | 0.0% |
| Singapore | 112 | 0.0% |
| Somalia | 57 | 0.0% |
| South Africa | 333 | 0.0% |
| South America | 2,940 | 0.3% |
| South Central Asia | 8,343 | 0.7% |
| South Eastern Asia | 5,019 | 0.4% |
| Southern Europe | 839 | 0.1% |
| Spain | 193 | 0.0% |
| Sri Lanka | 56 | 0.0% |
| St. Vincent and the Grenadines | 2 | 0.0% |
| Sudan | 11 | 0.0% |
| Sweden | 13 | 0.0% |
| Syria | 45 | 0.0% |
| Taiwan | 501 | 0.0% |
| Thailand | 325 | 0.0% |
| Trinidad and Tobago | 68 | 0.0% |
| Turkey | 228 | 0.0% |
| Uganda | 15 | 0.0% |
| Ukraine | 374 | 0.0% |
| Uruguay | 47 | 0.0% |
| Uzbekistan | 3 | 0.0% |
| Venezuela | 294 | 0.0% |
| Vietnam | 1,422 | 0.1% |
| Western Africa | 1,236 | 0.1% |
| Western Asia | 1,626 | 0.1% |
| Western Europe | 1,569 | 0.1% |
| Yemen | 20 | 0.0% |
| Zaire | 1,401 | 0.1% |
| Zimbabwe | 43 | 0.0% | View All 129 Rows |
Sex and Age in Area Code 217
Sex and Age in Area Code 217
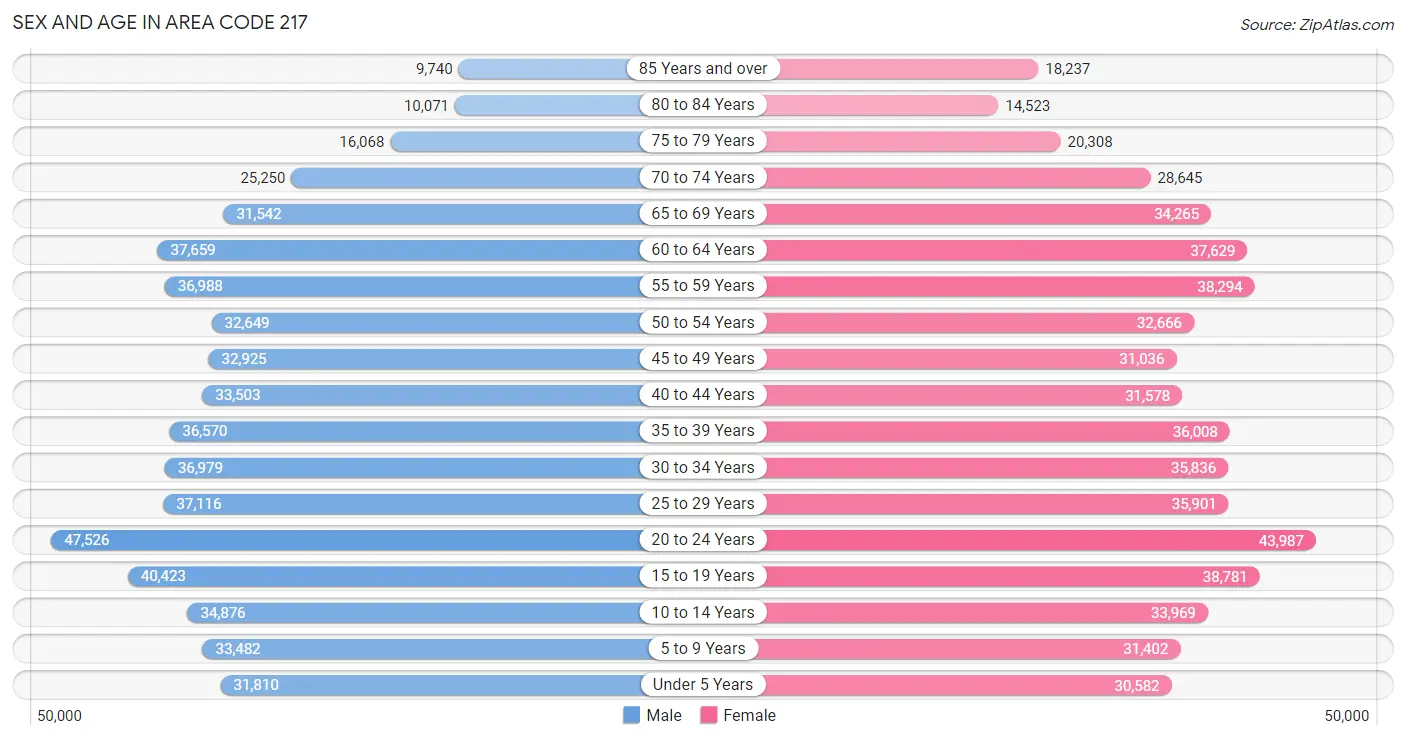
The most populous age groups in Area Code 217 are 20 to 24 Years (47,526 | 8.4%) for men and 20 to 24 Years (43,987 | 7.7%) for women.
| Age Bracket | Male | Female |
| Under 5 Years | 31,810 (5.6%) | 30,582 (5.3%) |
| 5 to 9 Years | 33,482 (5.9%) | 31,402 (5.5%) |
| 10 to 14 Years | 34,876 (6.2%) | 33,969 (5.9%) |
| 15 to 19 Years | 40,423 (7.1%) | 38,781 (6.8%) |
| 20 to 24 Years | 47,526 (8.4%) | 43,987 (7.7%) |
| 25 to 29 Years | 37,116 (6.6%) | 35,901 (6.3%) |
| 30 to 34 Years | 36,979 (6.5%) | 35,836 (6.2%) |
| 35 to 39 Years | 36,570 (6.5%) | 36,008 (6.3%) |
| 40 to 44 Years | 33,503 (5.9%) | 31,578 (5.5%) |
| 45 to 49 Years | 32,925 (5.8%) | 31,036 (5.4%) |
| 50 to 54 Years | 32,649 (5.8%) | 32,666 (5.7%) |
| 55 to 59 Years | 36,988 (6.5%) | 38,294 (6.7%) |
| 60 to 64 Years | 37,659 (6.7%) | 37,629 (6.6%) |
| 65 to 69 Years | 31,542 (5.6%) | 34,265 (6.0%) |
| 70 to 74 Years | 25,250 (4.5%) | 28,645 (5.0%) |
| 75 to 79 Years | 16,068 (2.8%) | 20,308 (3.5%) |
| 80 to 84 Years | 10,071 (1.8%) | 14,523 (2.5%) |
| 85 Years and over | 9,740 (1.7%) | 18,237 (3.2%) |
| Total | 565,177 (100.0%) | 573,647 (100.0%) |
Families and Households in Area Code 217
Median Family Size in Area Code 217
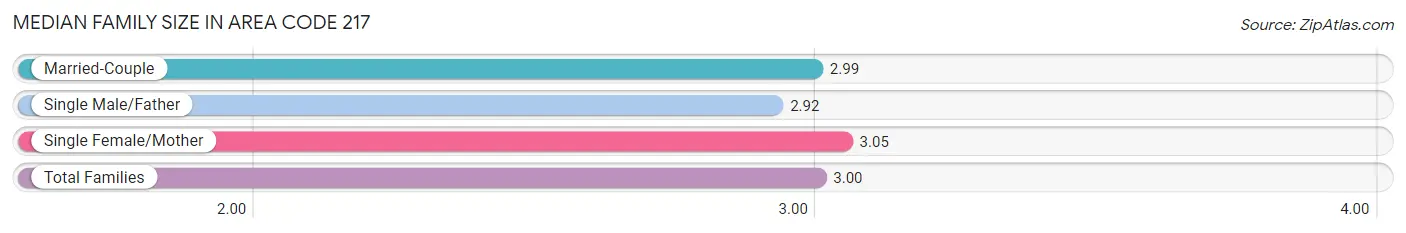
The median family size in Area Code 217 is 3.00 persons per family, with single female/mother families (47,857 | 17.3%) accounting for the largest median family size of 3.04723 persons per family. On the other hand, single male/father families (18,953 | 6.9%) represent the smallest median family size with 2.92 persons per family.
| Family Type | # Families | Family Size |
| Married-Couple | 209,323 (75.8%) | 2.99 |
| Single Male/Father | 18,953 (6.9%) | 2.92 |
| Single Female/Mother | 47,857 (17.3%) | 3.05 |
| Total Families | 276,133 (100.0%) | 3.00 |
Median Household Size in Area Code 217
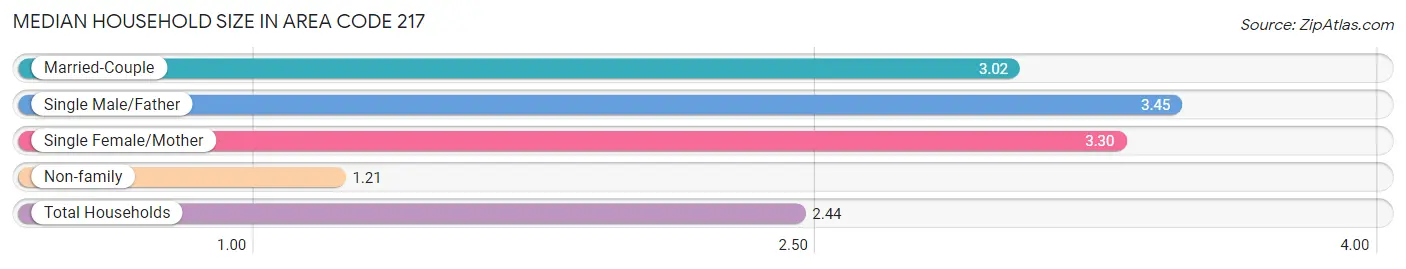
The median household size in Area Code 217 is 2.44 persons per household, with single male/father households (18,953 | 4.0%) accounting for the largest median household size of 3.45217 persons per household. non-family households (196,804 | 41.6%) represent the smallest median household size with 1.21 persons per household.
| Household Type | # Households | Household Size |
| Married-Couple | 209,323 (44.3%) | 3.02 |
| Single Male/Father | 18,953 (4.0%) | 3.45 |
| Single Female/Mother | 47,857 (10.1%) | 3.30 |
| Non-family | 196,804 (41.6%) | 1.21 |
| Total Households | 472,937 (100.0%) | 2.44 |
Household Size by Marriage Status in Area Code 217
Out of a total of 472,937 households in Area Code 217, 276,133 (58.4%) are family households, while 196,804 (41.6%) are nonfamily households. The most numerous type of family households are 2-person households, comprising 141,770, and the most common type of nonfamily households are 1-person households, comprising 162,726.
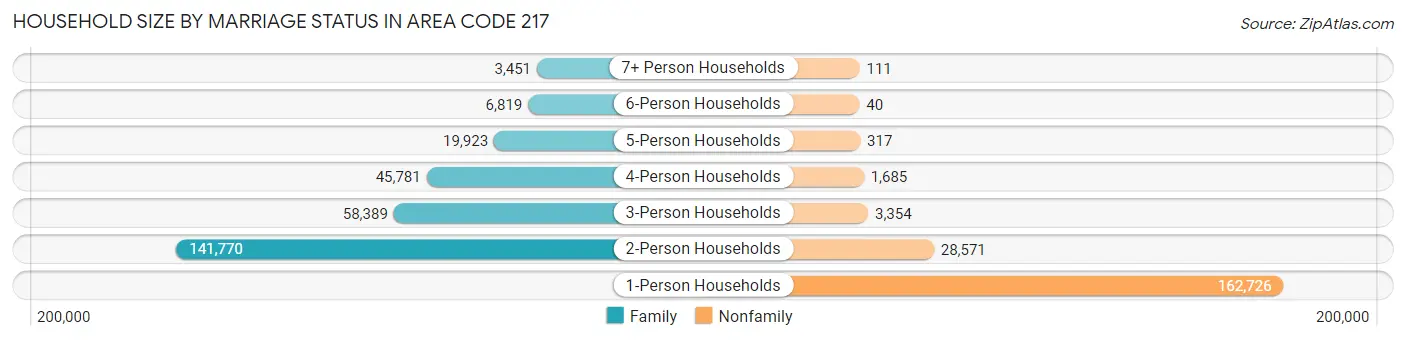
| Household Size | Family Households | Nonfamily Households |
| 1-Person Households | - | 162,726 (34.4%) |
| 2-Person Households | 141,770 (30.0%) | 28,571 (6.0%) |
| 3-Person Households | 58,389 (12.3%) | 3,354 (0.7%) |
| 4-Person Households | 45,781 (9.7%) | 1,685 (0.4%) |
| 5-Person Households | 19,923 (4.2%) | 317 (0.1%) |
| 6-Person Households | 6,819 (1.4%) | 40 (0.0%) |
| 7+ Person Households | 3,451 (0.7%) | 111 (0.0%) |
| Total | 276,133 (58.4%) | 196,804 (41.6%) |
Female Fertility in Area Code 217
Fertility by Age in Area Code 217
Average fertility rate in Area Code 217 is 71.2 births per 1,000 women. Women in the age bracket of 20 to 34 years have the highest fertility rate with 149.2 births per 1,000 women. Women in the age bracket of 20 to 34 years acount for 72.6% of all women with births.
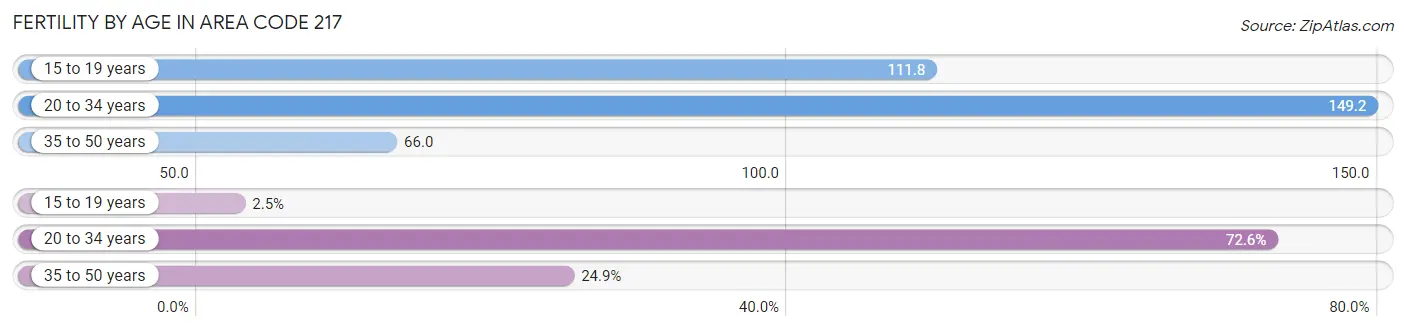
| Age Bracket | Women with Births | Births / 1,000 Women |
| 15 to 19 years | 356 (2.5%) | 111.8 |
| 20 to 34 years | 10,235 (72.6%) | 149.2 |
| 35 to 50 years | 3,502 (24.8%) | 66.0 |
| Total | 14,093 (100.0%) | 71.2 |
Fertility by Age by Marriage Status in Area Code 217
42.2% of women with births (14,093) in Area Code 217 are married. The highest percentage of unmarried women with births falls into 15 to 19 years age bracket with 95.5% of them unmarried at the time of birth, while the lowest percentage of unmarried women with births belong to 20 to 34 years age bracket with 62.1% of them unmarried.
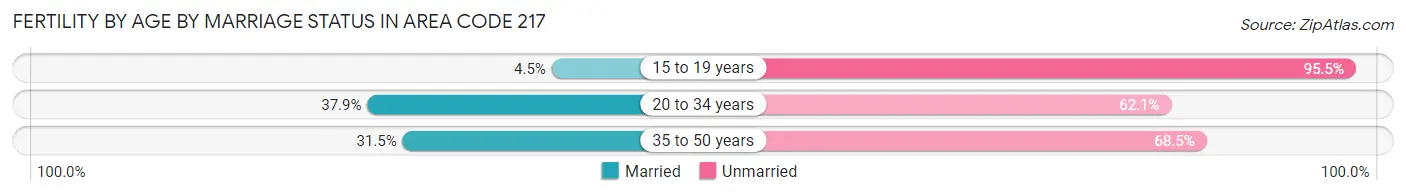
| Age Bracket | Married | Unmarried |
| 15 to 19 years | 16 (4.5%) | 340 (95.5%) |
| 20 to 34 years | 3,880 (37.9%) | 6,355 (62.1%) |
| 35 to 50 years | 1,104 (31.5%) | 2,398 (68.5%) |
| Total | 5,953 (42.2%) | 8,140 (57.8%) |
Fertility by Education in Area Code 217
Average fertility rate in Area Code 217 is 71.2 births per 1,000 women. Women with the education attainment of graduate degree have the highest fertility rate of 233.1 births per 1,000 women, while women with the education attainment of college or associate's degree have the lowest fertility at 101.7 births per 1,000 women. Women with the education attainment of college or associate's degree represent 30.5% of all women with births.
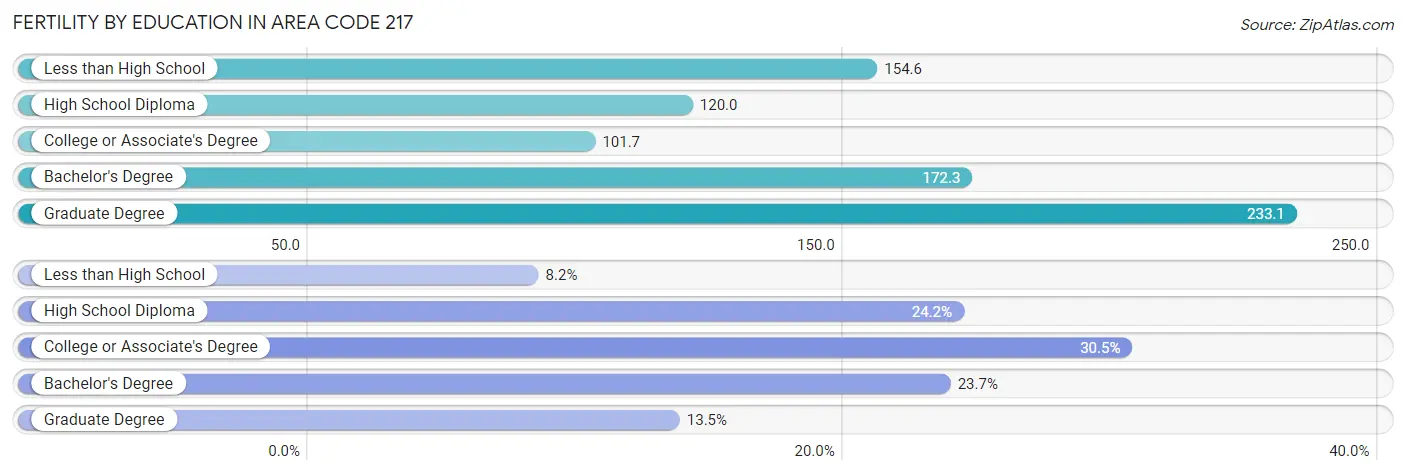
| Educational Attainment | Women with Births | Births / 1,000 Women |
| Less than High School | 1,159 (8.2%) | 154.6 |
| High School Diploma | 3,403 (24.1%) | 120.0 |
| College or Associate's Degree | 4,293 (30.5%) | 101.7 |
| Bachelor's Degree | 3,334 (23.7%) | 172.3 |
| Graduate Degree | 1,904 (13.5%) | 233.1 |
| Total | 14,093 (100.0%) | 71.2 |
Fertility by Education by Marriage Status in Area Code 217
57.8% of women with births in Area Code 217 are unmarried. Women with the educational attainment of bachelor's degree are most likely to be married with 42.3% of them married at childbirth, while women with the educational attainment of less than high school are least likely to be married with 92.1% of them unmarried at childbirth.
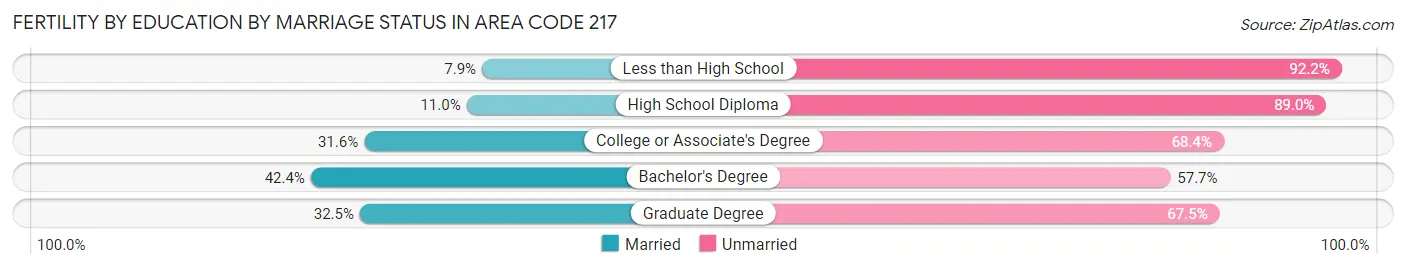
| Educational Attainment | Married | Unmarried |
| Less than High School | 91 (7.9%) | 1,068 (92.1%) |
| High School Diploma | 373 (11.0%) | 3,030 (89.0%) |
| College or Associate's Degree | 1,357 (31.6%) | 2,936 (68.4%) |
| Bachelor's Degree | 1,412 (42.3%) | 1,922 (57.7%) |
| Graduate Degree | 618 (32.5%) | 1,286 (67.5%) |
| Total | 5,953 (42.2%) | 8,140 (57.8%) |
Employment Characteristics in Area Code 217
Employment by Class of Employer in Area Code 217
Among the 527,740 employed individuals in Area Code 217, private company employees (327,904 | 62.1%), not-for-profit organizations (53,550 | 10.2%), and state government employees (51,689 | 9.8%) make up the most common classes of employment.
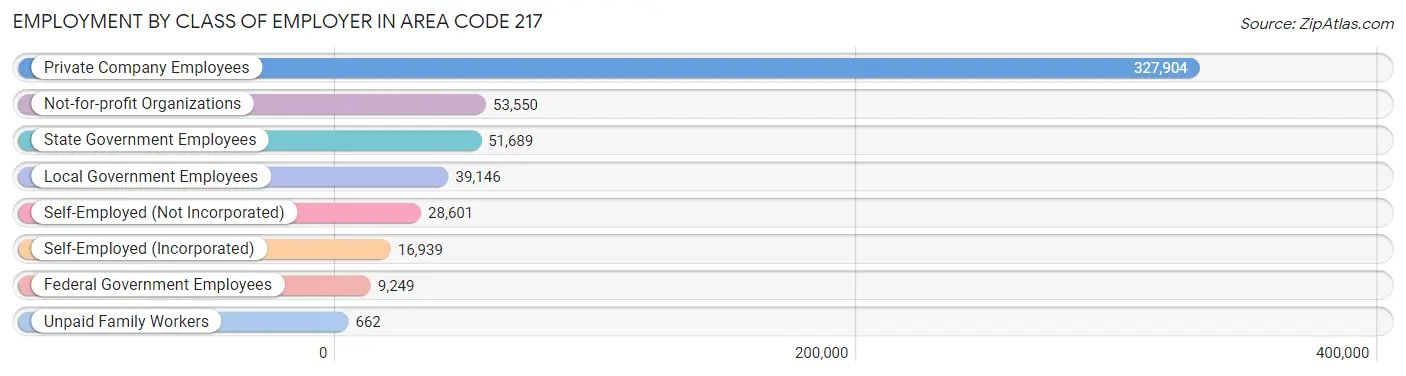
| Employer Class | # Employees | % Employees |
| Private Company Employees | 327,904 | 62.1% |
| Self-Employed (Incorporated) | 16,939 | 3.2% |
| Self-Employed (Not Incorporated) | 28,601 | 5.4% |
| Not-for-profit Organizations | 53,550 | 10.2% |
| Local Government Employees | 39,146 | 7.4% |
| State Government Employees | 51,689 | 9.8% |
| Federal Government Employees | 9,249 | 1.8% |
| Unpaid Family Workers | 662 | 0.1% |
| Total | 527,740 | 100.0% |
Employment Status by Age in Area Code 217
According to the labor force statistics for Area Code 217, out of the total population over 16 years of age (928,875), 60.9% or 565,778 individuals are in the labor force, with 5.0% or 28,289 of them unemployed. The age group with the highest labor force participation rate is 30 to 34 years, with 85.4% or 62,169 individuals in the labor force. Within the labor force, the 16 to 19 years age range has the highest percentage of unemployed individuals, with 3,174.9% or 1,020,381 of them being unemployed.
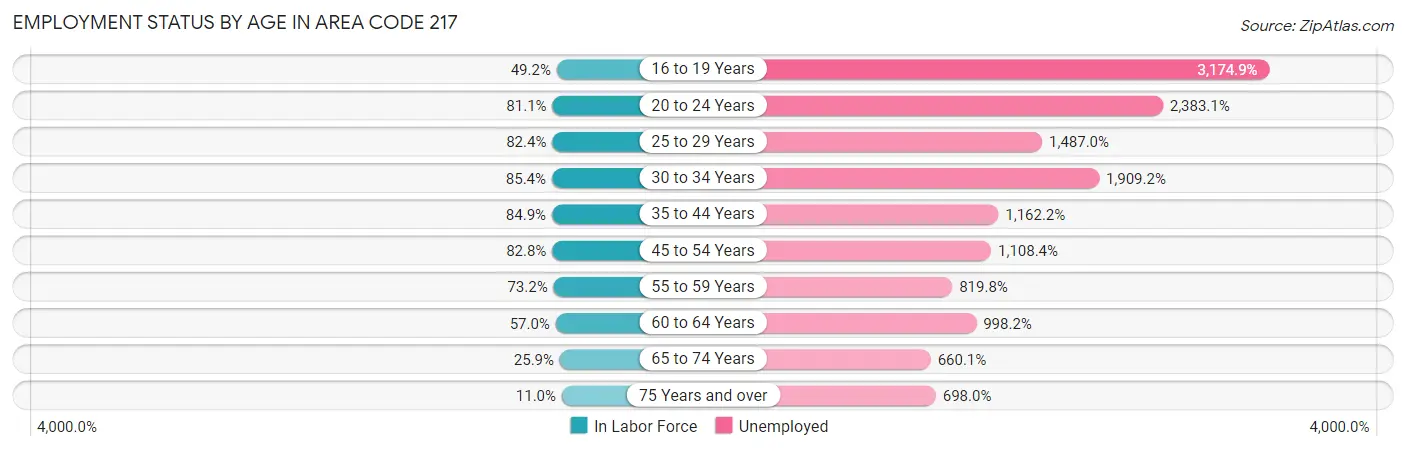
| Age Bracket | In Labor Force | Unemployed |
| 16 to 19 Years | 32,137 (49.2%) | 1,020,381 (3,174.9%) |
| 20 to 24 Years | 74,257 (81.1%) | 1,769,547 (2,383.1%) |
| 25 to 29 Years | 60,183 (82.4%) | 894,891 (1,487.0%) |
| 30 to 34 Years | 62,171 (85.4%) | 1,186,931 (1,909.2%) |
| 35 to 44 Years | 116,913 (84.9%) | 1,358,775 (1,162.2%) |
| 45 to 54 Years | 106,970 (82.8%) | 1,185,722 (1,108.4%) |
| 55 to 59 Years | 55,076 (73.2%) | 451,513 (819.8%) |
| 60 to 64 Years | 42,891 (57.0%) | 428,148 (998.2%) |
| 65 to 74 Years | 30,959 (25.9%) | 204,334 (660.1%) |
| 75 Years and over | 9,762 (11.0%) | 68,104 (698.0%) |
| Total | 565,750 (60.9%) | 28,301 (5.0%) |
Employment Status by Educational Attainment in Area Code 217
According to labor force statistics for Area Code 217, 77.8% of individuals (438,445) out of the total population between 25 and 64 years of age (563,337) are in the labor force, with 1,250.5% or 5,482,755 of them being unemployed. The group with the highest labor force participation rate are those with the educational attainment of bachelor's degree or higher, with 87.7% or 157,447 individuals in the labor force. Within the labor force, individuals with less than high school education have the highest percentage of unemployment, with 2,879.1% or 690,667 of them being unemployed.
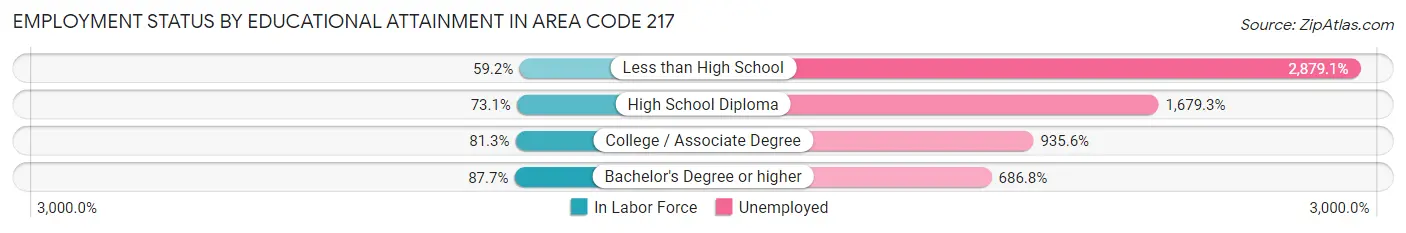
| Educational Attainment | In Labor Force | Unemployed |
| Less than High School | 23,989 (59.2%) | 1,167,245 (2,879.1%) |
| High School Diploma | 122,299 (73.1%) | 2,808,797 (1,679.3%) |
| College / Associate Degree | 143,116 (81.3%) | 1,646,899 (935.6%) |
| Bachelor's Degree or higher | 157,454 (87.7%) | 1,232,868 (686.8%) |
| Total | 438,418 (77.8%) | 7,044,529 (1,250.5%) |
Employment Occupations by Sex in Area Code 217
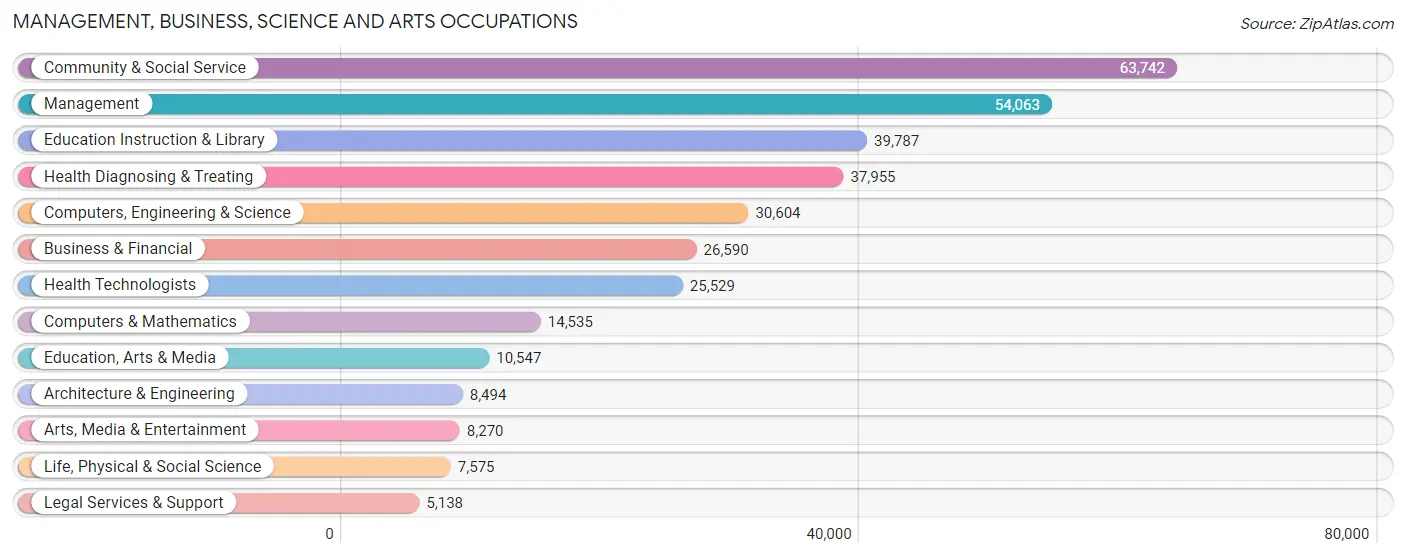
Management, Business, Science and Arts Occupations
The most common Management, Business, Science and Arts occupations in Area Code 217 are Community & Social Service (63,742 | 11.9%), Management (54,063 | 10.1%), Education Instruction & Library (39,787 | 7.4%), Health Diagnosing & Treating (37,955 | 7.1%), and Computers, Engineering & Science (30,604 | 5.7%).
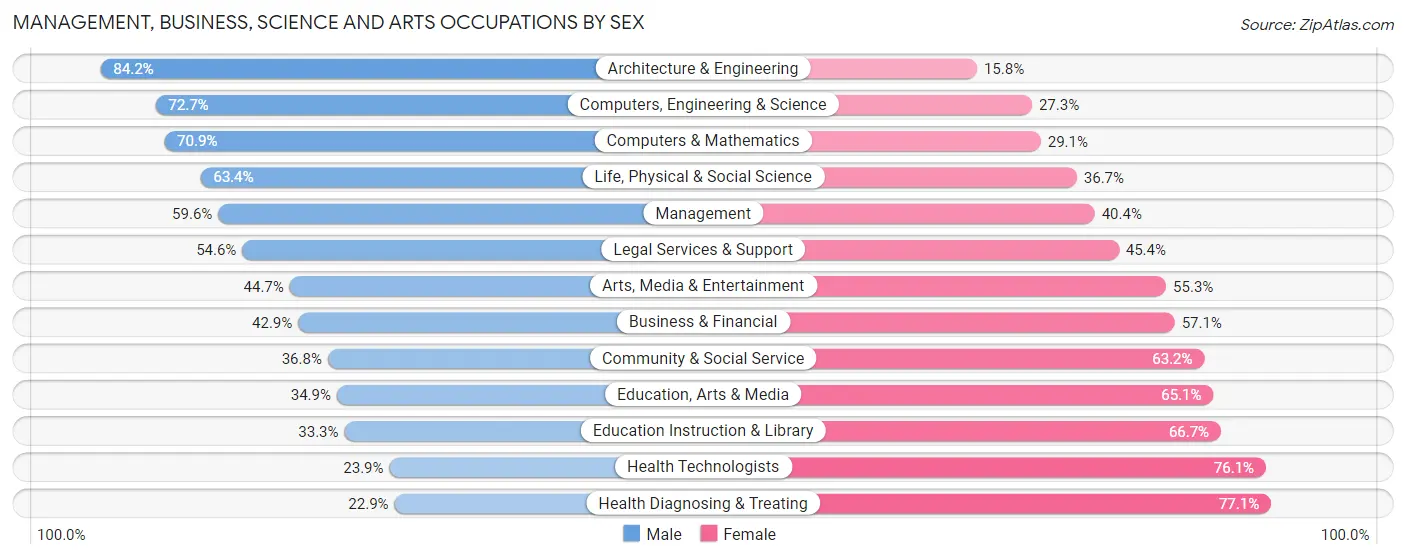
Management, Business, Science and Arts Occupations by Sex
Within the Management, Business, Science and Arts occupations in Area Code 217, the most male-oriented occupations are Architecture & Engineering (84.2%), Computers, Engineering & Science (72.7%), and Computers & Mathematics (70.9%), while the most female-oriented occupations are Health Diagnosing & Treating (77.1%), Health Technologists (76.1%), and Education Instruction & Library (66.7%).
| Occupation | Male | Female |
| Management | 32,235 (59.6%) | 21,828 (40.4%) |
| Business & Financial | 11,417 (42.9%) | 15,173 (57.1%) |
| Computers, Engineering & Science | 22,251 (72.7%) | 8,353 (27.3%) |
| Computers & Mathematics | 10,302 (70.9%) | 4,233 (29.1%) |
| Architecture & Engineering | 7,150 (84.2%) | 1,344 (15.8%) |
| Life, Physical & Social Science | 4,799 (63.3%) | 2,776 (36.6%) |
| Community & Social Service | 23,431 (36.8%) | 40,311 (63.2%) |
| Education, Arts & Media | 3,679 (34.9%) | 6,868 (65.1%) |
| Legal Services & Support | 2,806 (54.6%) | 2,332 (45.4%) |
| Education Instruction & Library | 13,248 (33.3%) | 26,539 (66.7%) |
| Arts, Media & Entertainment | 3,698 (44.7%) | 4,572 (55.3%) |
| Health Diagnosing & Treating | 8,675 (22.9%) | 29,280 (77.1%) |
| Health Technologists | 6,103 (23.9%) | 19,426 (76.1%) |
| Total (Category) | 98,009 (46.0%) | 114,945 (54.0%) |
| Total (Overall) | 279,842 (52.2%) | 256,006 (47.8%) |
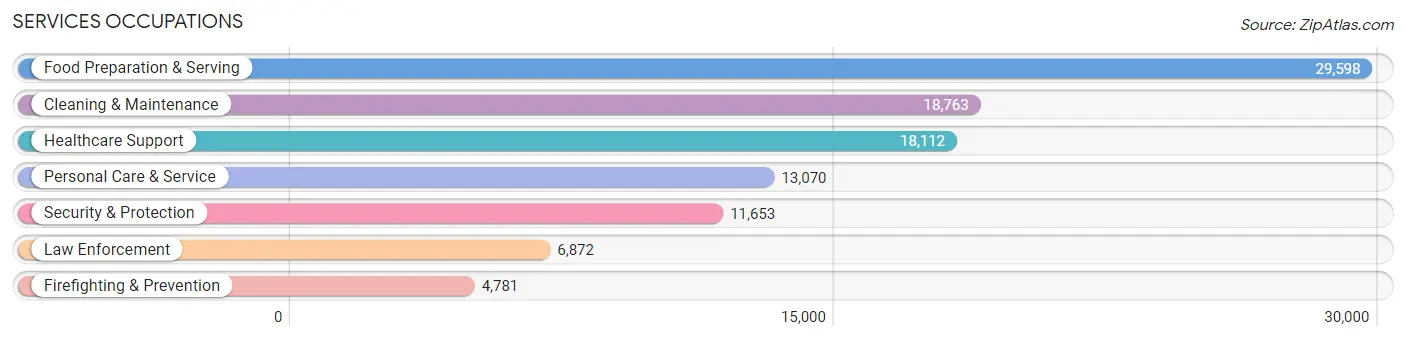
Services Occupations
The most common Services occupations in Area Code 217 are Food Preparation & Serving (29,598 | 5.5%), Cleaning & Maintenance (18,763 | 3.5%), Healthcare Support (18,112 | 3.4%), Personal Care & Service (13,070 | 2.4%), and Security & Protection (11,653 | 2.2%).
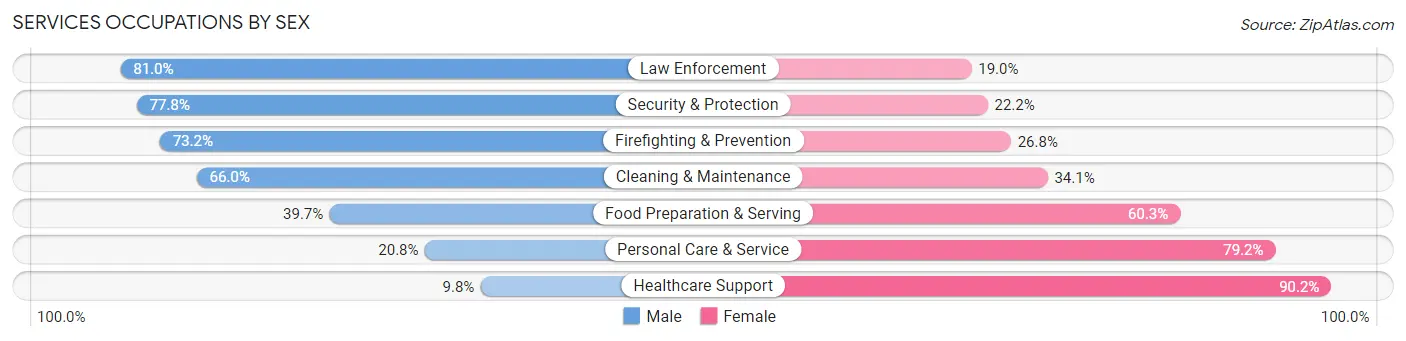
Services Occupations by Sex
Within the Services occupations in Area Code 217, the most male-oriented occupations are Law Enforcement (81.0%), Security & Protection (77.8%), and Firefighting & Prevention (73.2%), while the most female-oriented occupations are Healthcare Support (90.2%), Personal Care & Service (79.2%), and Food Preparation & Serving (60.3%).
| Occupation | Male | Female |
| Healthcare Support | 1,771 (9.8%) | 16,341 (90.2%) |
| Security & Protection | 9,070 (77.8%) | 2,583 (22.2%) |
| Firefighting & Prevention | 3,501 (73.2%) | 1,280 (26.8%) |
| Law Enforcement | 5,569 (81.0%) | 1,303 (19.0%) |
| Food Preparation & Serving | 11,751 (39.7%) | 17,847 (60.3%) |
| Cleaning & Maintenance | 12,374 (65.9%) | 6,389 (34.1%) |
| Personal Care & Service | 2,724 (20.8%) | 10,346 (79.2%) |
| Total (Category) | 37,690 (41.3%) | 53,506 (58.7%) |
| Total (Overall) | 279,842 (52.2%) | 256,006 (47.8%) |
Sales and Office Occupations
The most common Sales and Office occupations in Area Code 217 are Office & Administration (59,872 | 11.2%), and Sales & Related (47,065 | 8.8%).
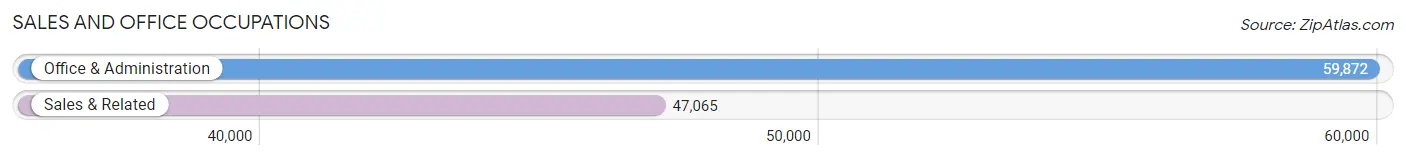
Sales and Office Occupations by Sex
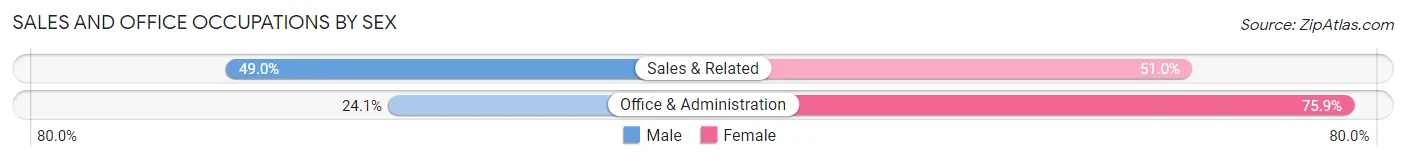
| Occupation | Male | Female |
| Sales & Related | 23,073 (49.0%) | 23,992 (51.0%) |
| Office & Administration | 14,431 (24.1%) | 45,441 (75.9%) |
| Total (Category) | 37,504 (35.1%) | 69,433 (64.9%) |
| Total (Overall) | 279,842 (52.2%) | 256,006 (47.8%) |
Natural Resources, Construction and Maintenance Occupations
The most common Natural Resources, Construction and Maintenance occupations in Area Code 217 are Construction & Extraction (22,023 | 4.1%), Installation, Maintenance & Repair (17,664 | 3.3%), and Farming, Fishing & Forestry (4,344 | 0.8%).
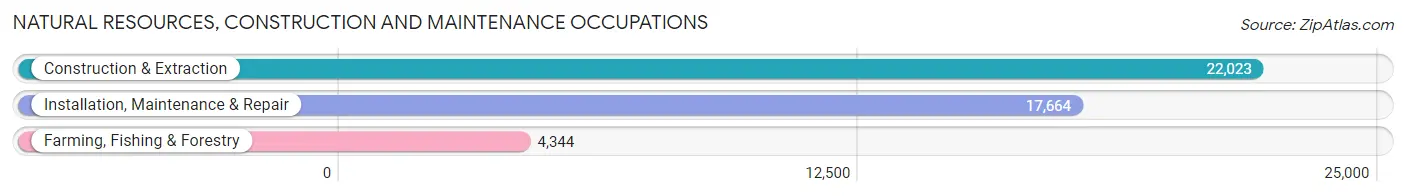
Natural Resources, Construction and Maintenance Occupations by Sex
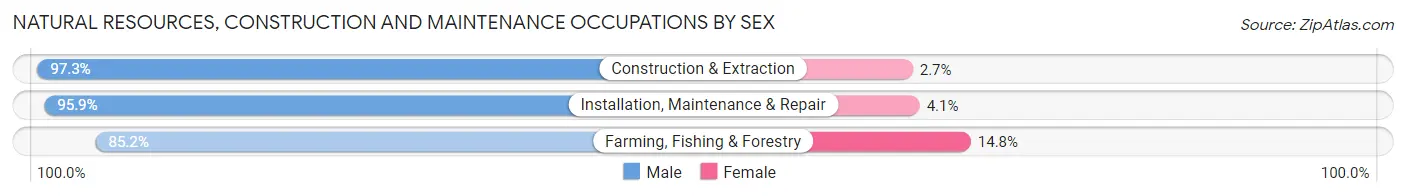
| Occupation | Male | Female |
| Farming, Fishing & Forestry | 3,703 (85.2%) | 641 (14.8%) |
| Construction & Extraction | 21,435 (97.3%) | 588 (2.7%) |
| Installation, Maintenance & Repair | 16,937 (95.9%) | 727 (4.1%) |
| Total (Category) | 42,075 (95.6%) | 1,956 (4.4%) |
| Total (Overall) | 279,842 (52.2%) | 256,006 (47.8%) |
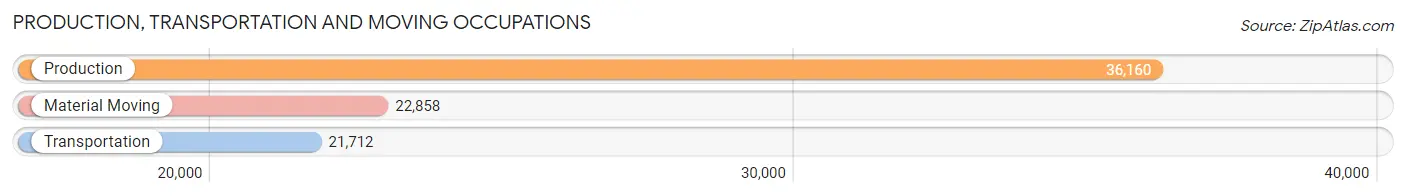
Production, Transportation and Moving Occupations
The most common Production, Transportation and Moving occupations in Area Code 217 are Production (36,160 | 6.8%), Material Moving (22,858 | 4.3%), and Transportation (21,712 | 4.1%).
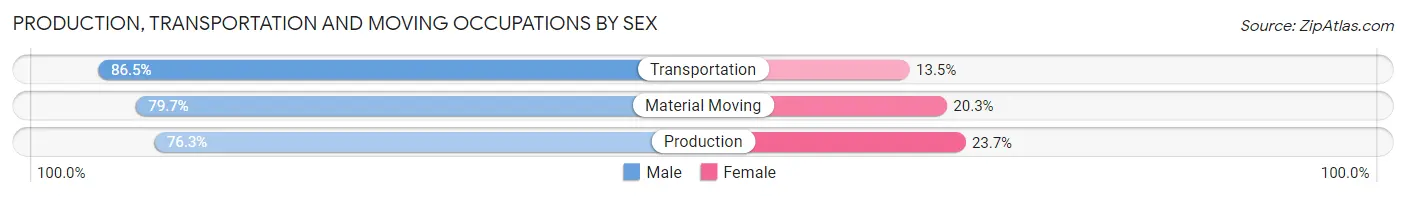
Production, Transportation and Moving Occupations by Sex
| Occupation | Male | Female |
| Production | 27,576 (76.3%) | 8,584 (23.7%) |
| Transportation | 18,780 (86.5%) | 2,932 (13.5%) |
| Material Moving | 18,208 (79.7%) | 4,650 (20.3%) |
| Total (Category) | 64,564 (80.0%) | 16,166 (20.0%) |
| Total (Overall) | 279,842 (52.2%) | 256,006 (47.8%) |
Employment Industries by Sex in Area Code 217
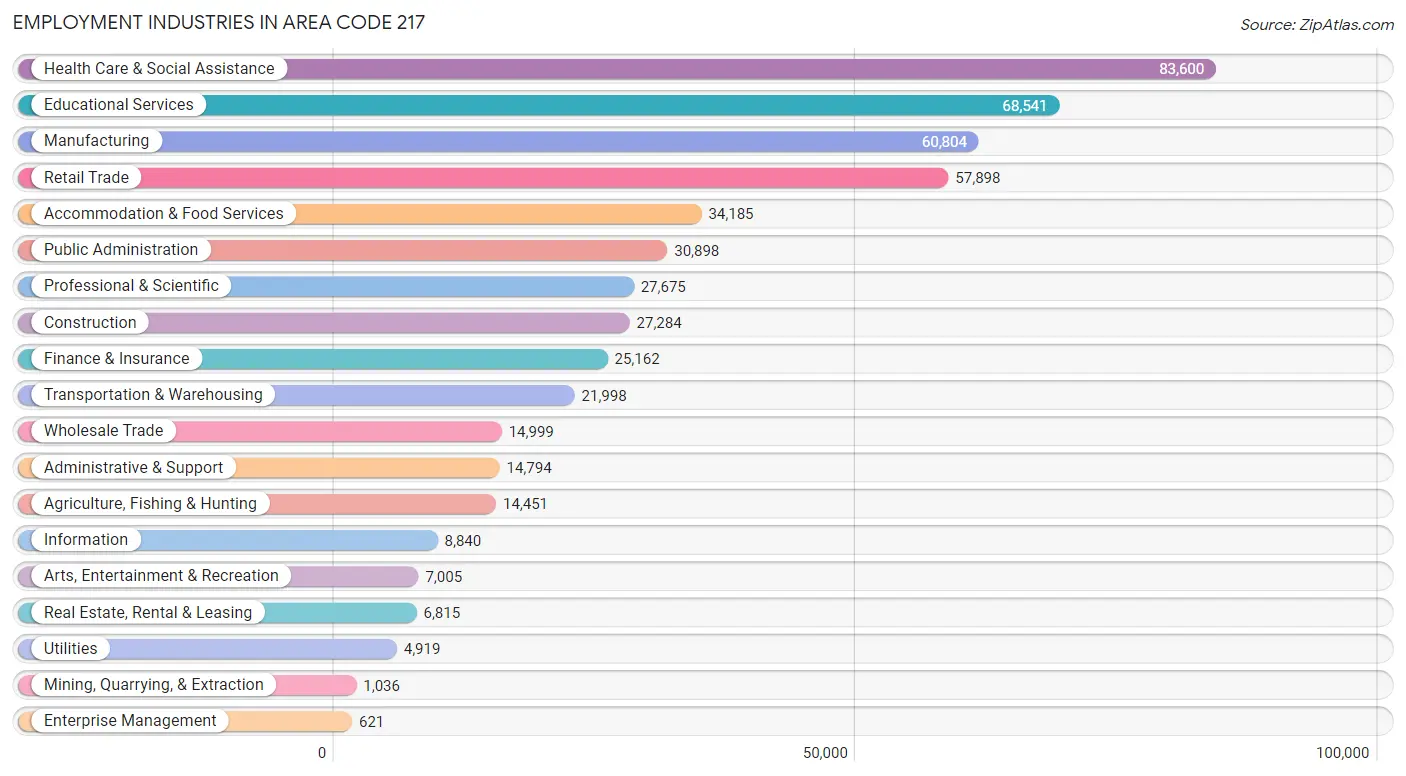
Employment Industries in Area Code 217
The major employment industries in Area Code 217 include Health Care & Social Assistance (83,600 | 15.6%), Educational Services (68,541 | 12.8%), Manufacturing (60,804 | 11.4%), Retail Trade (57,898 | 10.8%), and Accommodation & Food Services (34,185 | 6.4%).
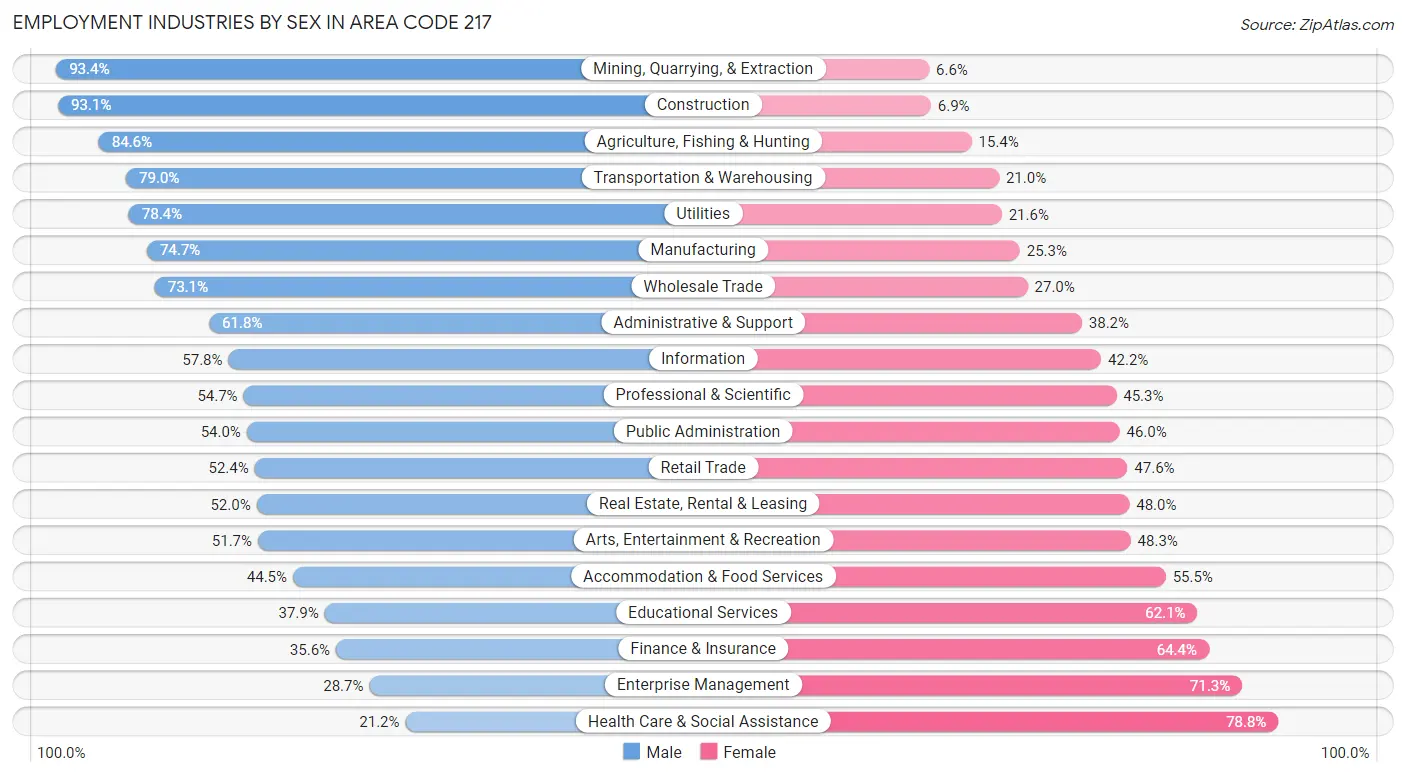
Employment Industries by Sex in Area Code 217
The Area Code 217 industries that see more men than women are Mining, Quarrying, & Extraction (93.4%), Construction (93.1%), and Agriculture, Fishing & Hunting (84.6%), whereas the industries that tend to have a higher number of women are Health Care & Social Assistance (78.8%), Enterprise Management (71.3%), and Finance & Insurance (64.4%).
| Industry | Male | Female |
| Agriculture, Fishing & Hunting | 12,232 (84.6%) | 2,219 (15.4%) |
| Mining, Quarrying, & Extraction | 968 (93.4%) | 68 (6.6%) |
| Construction | 25,395 (93.1%) | 1,889 (6.9%) |
| Manufacturing | 45,400 (74.7%) | 15,404 (25.3%) |
| Wholesale Trade | 10,957 (73.1%) | 4,042 (27.0%) |
| Retail Trade | 30,337 (52.4%) | 27,561 (47.6%) |
| Transportation & Warehousing | 17,373 (79.0%) | 4,625 (21.0%) |
| Utilities | 3,857 (78.4%) | 1,062 (21.6%) |
| Information | 5,112 (57.8%) | 3,728 (42.2%) |
| Finance & Insurance | 8,948 (35.6%) | 16,214 (64.4%) |
| Real Estate, Rental & Leasing | 3,544 (52.0%) | 3,271 (48.0%) |
| Professional & Scientific | 15,139 (54.7%) | 12,536 (45.3%) |
| Enterprise Management | 178 (28.7%) | 443 (71.3%) |
| Administrative & Support | 9,145 (61.8%) | 5,649 (38.2%) |
| Educational Services | 25,989 (37.9%) | 42,552 (62.1%) |
| Health Care & Social Assistance | 17,715 (21.2%) | 65,885 (78.8%) |
| Arts, Entertainment & Recreation | 3,623 (51.7%) | 3,382 (48.3%) |
| Accommodation & Food Services | 15,201 (44.5%) | 18,984 (55.5%) |
| Public Administration | 16,695 (54.0%) | 14,203 (46.0%) |
| Total | 279,842 (52.2%) | 256,006 (47.8%) |
Education in Area Code 217
School Enrollment in Area Code 217
The most common levels of schooling among the 280,322 students in Area Code 217 are college / undergraduate (69,765 | 24.9%), high school (54,784 | 19.5%), and middle school (53,446 | 19.1%).
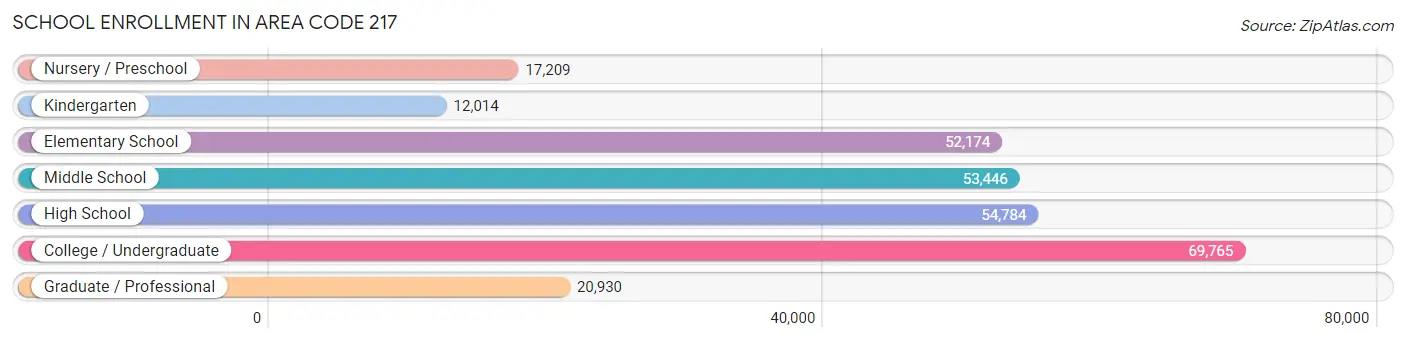
| School Level | # Students | % Students |
| Nursery / Preschool | 17,209 | 6.1% |
| Kindergarten | 12,014 | 4.3% |
| Elementary School | 52,174 | 18.6% |
| Middle School | 53,446 | 19.1% |
| High School | 54,784 | 19.5% |
| College / Undergraduate | 69,765 | 24.9% |
| Graduate / Professional | 20,930 | 7.5% |
| Total | 280,322 | 100.0% |
School Enrollment by Age by Funding Source in Area Code 217
Out of a total of 280,322 students who are enrolled in schools in Area Code 217, 40,776 (14.5%) attend a private institution, while the remaining 239,546 (85.5%) are enrolled in public schools. The age group of 3 to 4 year olds has the highest likelihood of being enrolled in private schools, with 4,011 (30.7% in the age bracket) enrolled. Conversely, the age group of 15 to 17 year olds has the lowest likelihood of being enrolled in a private school, with 36,249 (92.5% in the age bracket) attending a public institution.
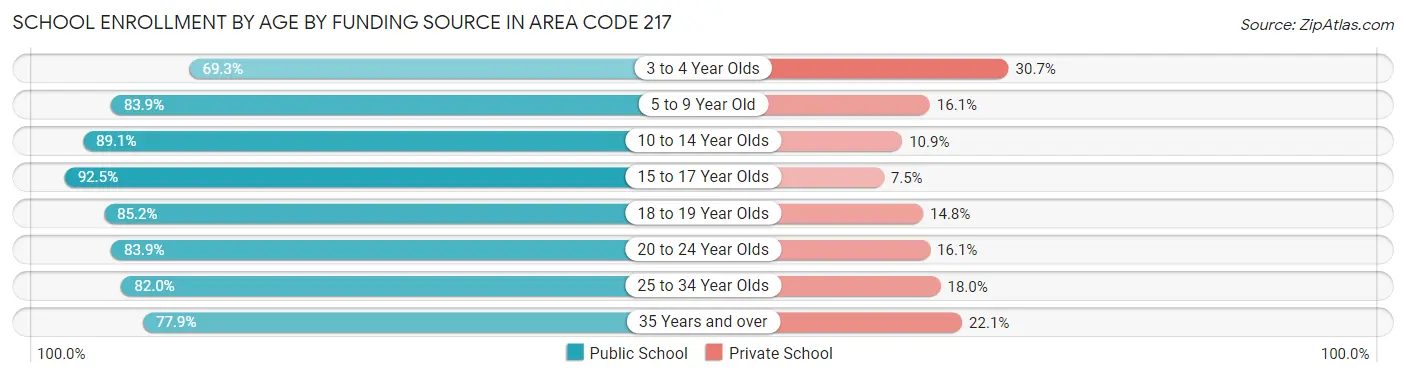
| Age Bracket | Public School | Private School |
| 3 to 4 Year Olds | 9,043 (69.3%) | 4,011 (30.7%) |
| 5 to 9 Year Old | 51,751 (83.9%) | 9,902 (16.1%) |
| 10 to 14 Year Olds | 59,695 (89.1%) | 7,313 (10.9%) |
| 15 to 17 Year Olds | 36,249 (92.5%) | 2,932 (7.5%) |
| 18 to 19 Year Olds | 25,579 (85.2%) | 4,443 (14.8%) |
| 20 to 24 Year Olds | 34,698 (83.9%) | 6,662 (16.1%) |
| 25 to 34 Year Olds | 13,640 (82.0%) | 3,002 (18.0%) |
| 35 Years and over | 8,886 (77.9%) | 2,516 (22.1%) |
| Total | 239,546 (85.5%) | 40,776 (14.5%) |
Educational Attainment by Field of Study in Area Code 217
Business (40,357 | 16.2%), education (38,872 | 15.6%), science & technology (26,627 | 10.7%), bio, nature & agricultural (22,187 | 8.9%), and arts & humanities (17,138 | 6.9%) are the most common fields of study among 248,463 individuals in Area Code 217 who have obtained a bachelor's degree or higher.
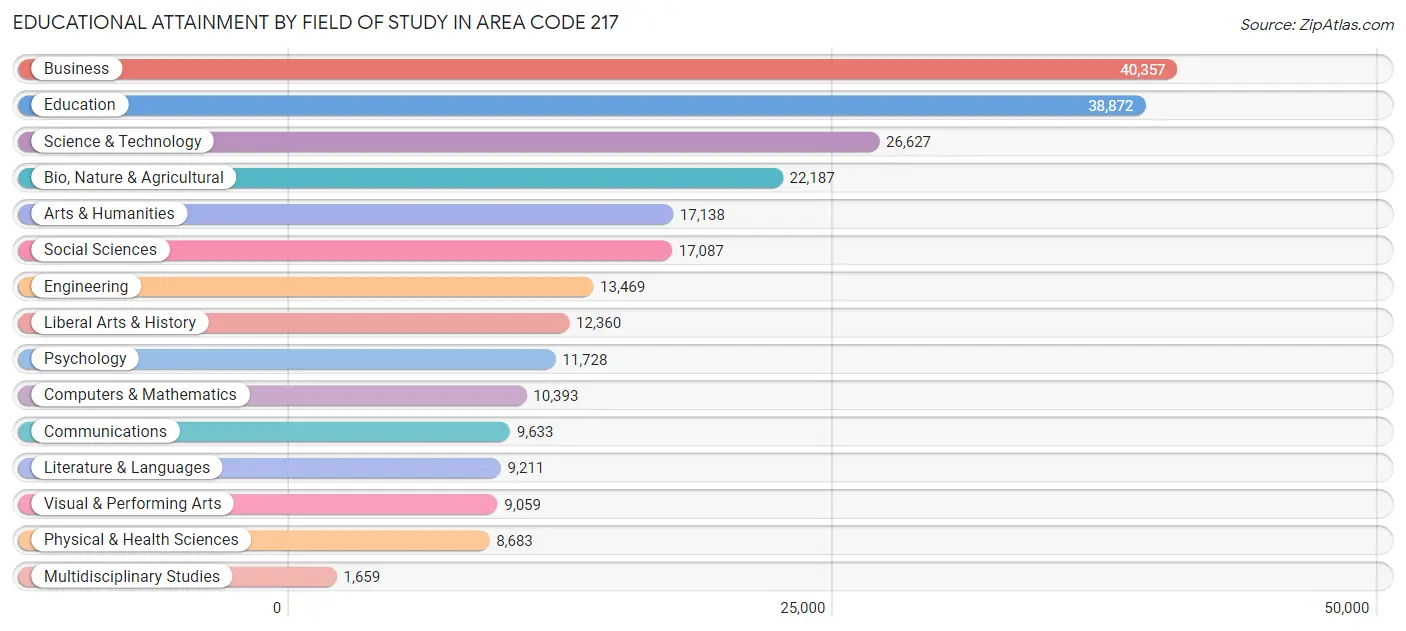
| Field of Study | # Graduates | % Graduates |
| Computers & Mathematics | 10,393 | 4.2% |
| Bio, Nature & Agricultural | 22,187 | 8.9% |
| Physical & Health Sciences | 8,683 | 3.5% |
| Psychology | 11,728 | 4.7% |
| Social Sciences | 17,087 | 6.9% |
| Engineering | 13,469 | 5.4% |
| Multidisciplinary Studies | 1,659 | 0.7% |
| Science & Technology | 26,627 | 10.7% |
| Business | 40,357 | 16.2% |
| Education | 38,872 | 15.6% |
| Literature & Languages | 9,211 | 3.7% |
| Liberal Arts & History | 12,360 | 5.0% |
| Visual & Performing Arts | 9,059 | 3.6% |
| Communications | 9,633 | 3.9% |
| Arts & Humanities | 17,138 | 6.9% |
| Total | 248,463 | 100.0% |
Transportation & Commute in Area Code 217
Vehicle Availability by Sex in Area Code 217
The most prevalent vehicle ownership categories in Area Code 217 are males with 2 vehicles (113,542, accounting for 41.5%) and females with 2 vehicles (98,613, making up 45.9%).
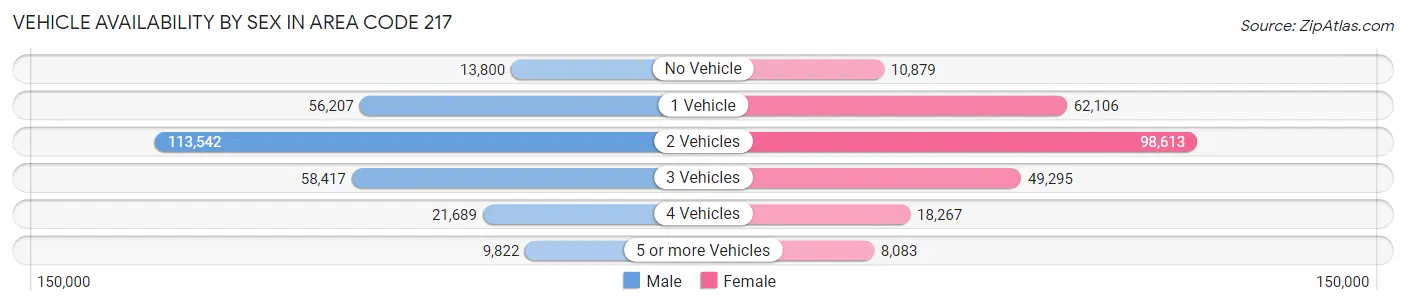
| Vehicles Available | Male | Female |
| No Vehicle | 13,800 (5.1%) | 10,879 (4.4%) |
| 1 Vehicle | 56,207 (20.5%) | 62,106 (25.1%) |
| 2 Vehicles | 113,542 (41.5%) | 98,613 (39.9%) |
| 3 Vehicles | 58,417 (21.4%) | 49,295 (19.9%) |
| 4 Vehicles | 21,689 (7.9%) | 18,267 (7.4%) |
| 5 or more Vehicles | 9,822 (3.6%) | 8,083 (3.3%) |
| Total | 273,477 (100.0%) | 247,243 (100.0%) |
Commute Time in Area Code 217
The most frequently occuring commute durations in Area Code 217 are 10 to 14 minutes (92,235 commuters, 19.2%), 15 to 19 minutes (89,021 commuters, 18.5%), and 5 to 9 minutes (75,584 commuters, 15.7%).
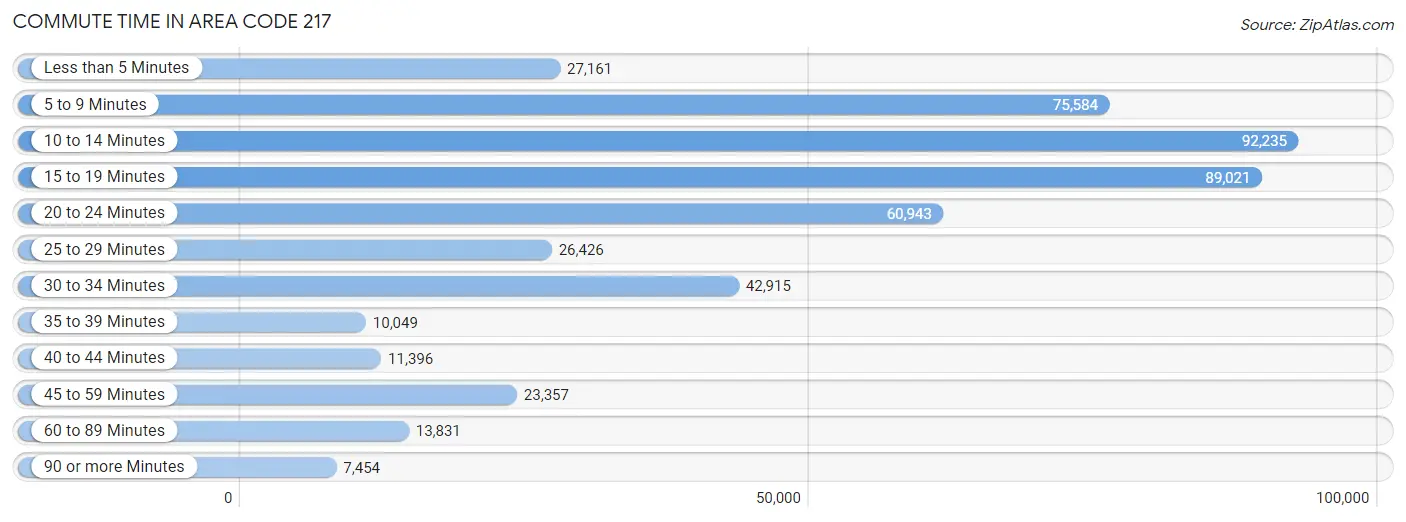
| Commute Time | # Commuters | % Commuters |
| Less than 5 Minutes | 27,161 | 5.7% |
| 5 to 9 Minutes | 75,584 | 15.7% |
| 10 to 14 Minutes | 92,235 | 19.2% |
| 15 to 19 Minutes | 89,021 | 18.5% |
| 20 to 24 Minutes | 60,943 | 12.7% |
| 25 to 29 Minutes | 26,426 | 5.5% |
| 30 to 34 Minutes | 42,915 | 8.9% |
| 35 to 39 Minutes | 10,049 | 2.1% |
| 40 to 44 Minutes | 11,396 | 2.4% |
| 45 to 59 Minutes | 23,357 | 4.9% |
| 60 to 89 Minutes | 13,831 | 2.9% |
| 90 or more Minutes | 7,454 | 1.5% |
Commute Time by Sex in Area Code 217
The most common commute times in Area Code 217 are 10 to 14 minutes (47,706 commuters, 18.7%) for males and 10 to 14 minutes (44,529 commuters, 19.7%) for females.
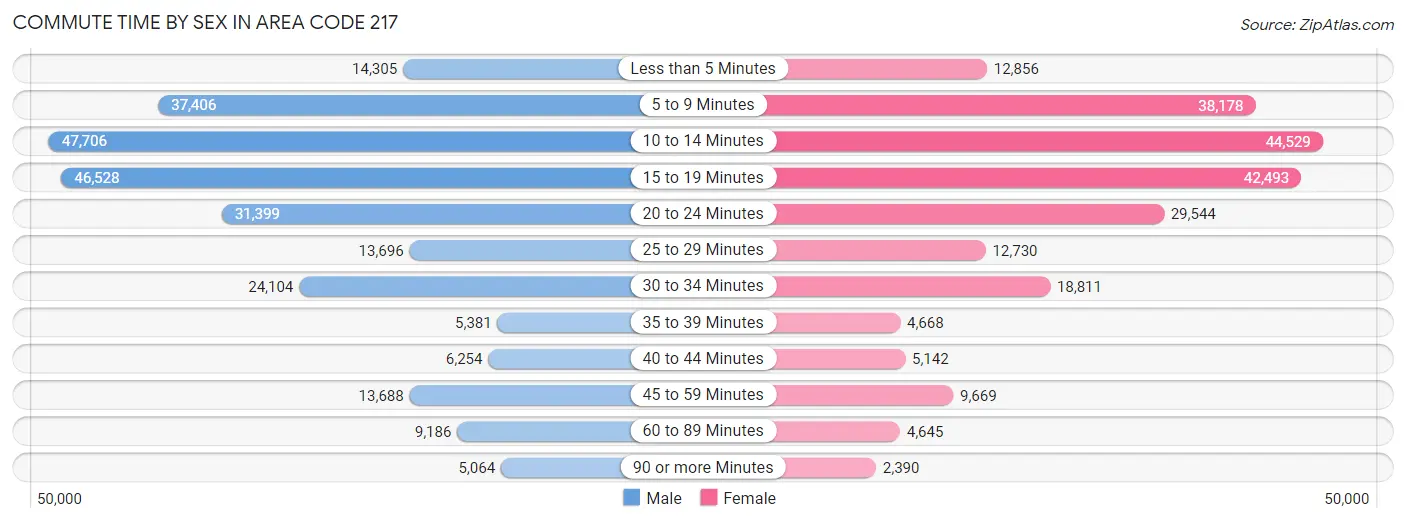
| Commute Time | Male | Female |
| Less than 5 Minutes | 14,305 (5.6%) | 12,856 (5.7%) |
| 5 to 9 Minutes | 37,406 (14.7%) | 38,178 (16.9%) |
| 10 to 14 Minutes | 47,706 (18.7%) | 44,529 (19.7%) |
| 15 to 19 Minutes | 46,528 (18.3%) | 42,493 (18.8%) |
| 20 to 24 Minutes | 31,399 (12.3%) | 29,544 (13.1%) |
| 25 to 29 Minutes | 13,696 (5.4%) | 12,730 (5.6%) |
| 30 to 34 Minutes | 24,104 (9.5%) | 18,811 (8.3%) |
| 35 to 39 Minutes | 5,381 (2.1%) | 4,668 (2.1%) |
| 40 to 44 Minutes | 6,254 (2.5%) | 5,142 (2.3%) |
| 45 to 59 Minutes | 13,688 (5.4%) | 9,669 (4.3%) |
| 60 to 89 Minutes | 9,186 (3.6%) | 4,645 (2.1%) |
| 90 or more Minutes | 5,064 (2.0%) | 2,390 (1.1%) |
Time of Departure to Work by Sex in Area Code 217
The most frequent times of departure to work in Area Code 217 are 7:00 AM to 7:29 AM (34,708, 13.6%) for males and 7:30 AM to 7:59 AM (42,408, 18.8%) for females.
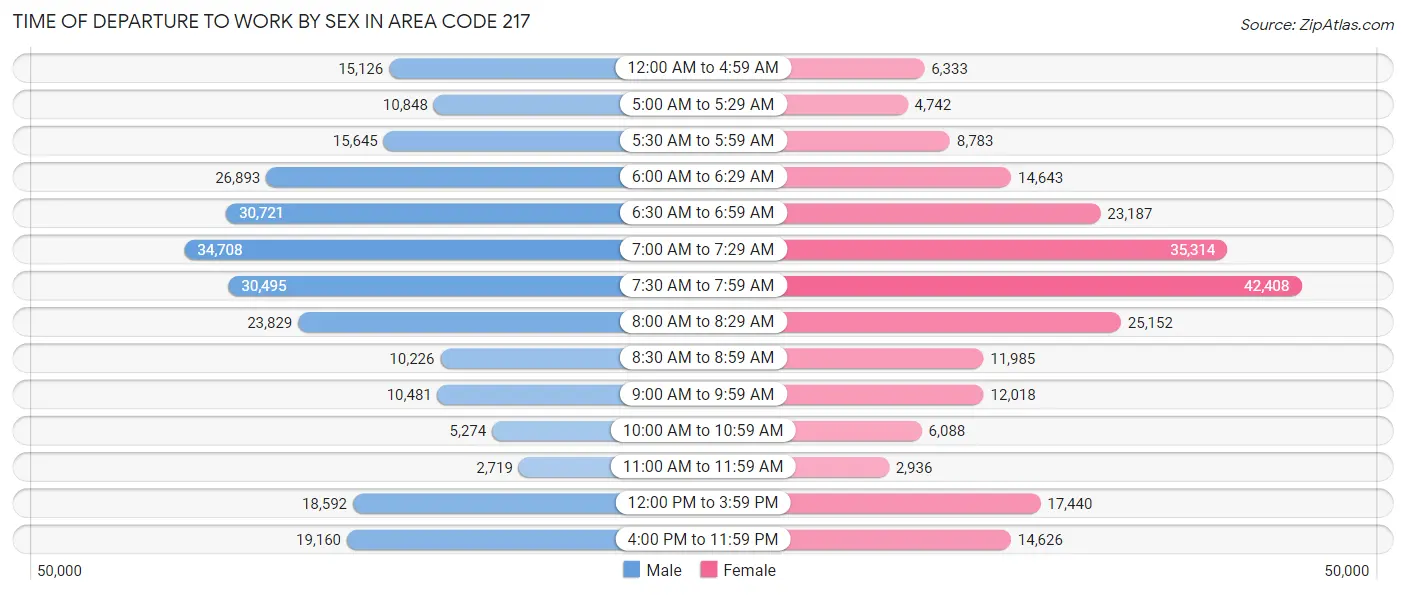
| Time of Departure | Male | Female |
| 12:00 AM to 4:59 AM | 15,126 (5.9%) | 6,333 (2.8%) |
| 5:00 AM to 5:29 AM | 10,848 (4.3%) | 4,742 (2.1%) |
| 5:30 AM to 5:59 AM | 15,645 (6.1%) | 8,783 (3.9%) |
| 6:00 AM to 6:29 AM | 26,893 (10.6%) | 14,643 (6.5%) |
| 6:30 AM to 6:59 AM | 30,721 (12.1%) | 23,187 (10.3%) |
| 7:00 AM to 7:29 AM | 34,708 (13.6%) | 35,314 (15.7%) |
| 7:30 AM to 7:59 AM | 30,495 (12.0%) | 42,408 (18.8%) |
| 8:00 AM to 8:29 AM | 23,829 (9.4%) | 25,152 (11.2%) |
| 8:30 AM to 8:59 AM | 10,226 (4.0%) | 11,985 (5.3%) |
| 9:00 AM to 9:59 AM | 10,481 (4.1%) | 12,018 (5.3%) |
| 10:00 AM to 10:59 AM | 5,274 (2.1%) | 6,088 (2.7%) |
| 11:00 AM to 11:59 AM | 2,719 (1.1%) | 2,936 (1.3%) |
| 12:00 PM to 3:59 PM | 18,592 (7.3%) | 17,440 (7.7%) |
| 4:00 PM to 11:59 PM | 19,160 (7.5%) | 14,626 (6.5%) |
| Total | 254,717 (100.0%) | 225,655 (100.0%) |
Housing Occupancy in Area Code 217
Occupancy by Ownership in Area Code 217
Of the total 472,937 dwellings in Area Code 217, owner-occupied units account for 321,285 (67.9%), while renter-occupied units make up 151,652 (32.1%).
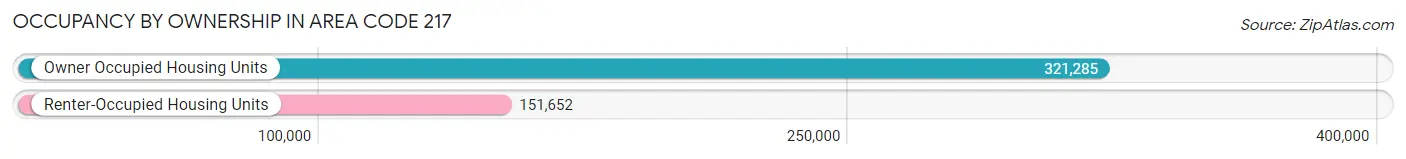
| Occupancy | # Housing Units | % Housing Units |
| Owner Occupied Housing Units | 321,285 | 67.9% |
| Renter-Occupied Housing Units | 151,652 | 32.1% |
| Total Occupied Housing Units | 472,937 | 100.0% |
Occupancy by Household Size in Area Code 217
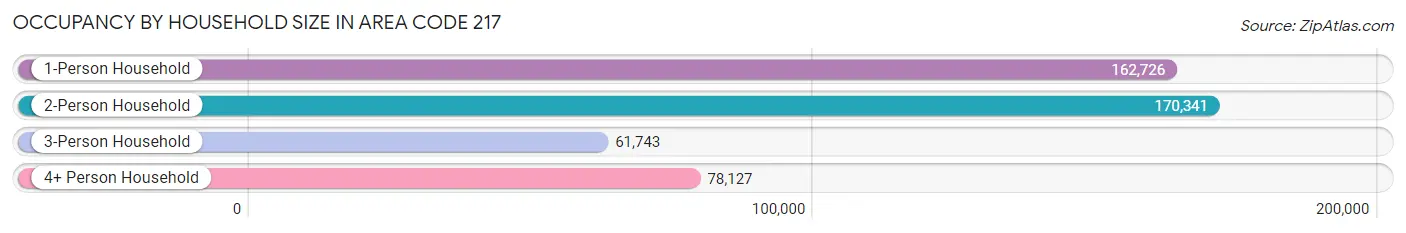
| Household Size | # Housing Units | % Housing Units |
| 1-Person Household | 162,726 | 34.4% |
| 2-Person Household | 170,341 | 36.0% |
| 3-Person Household | 61,743 | 13.1% |
| 4+ Person Household | 78,127 | 16.5% |
| Total Housing Units | 472,937 | 100.0% |
Occupancy by Ownership by Household Size in Area Code 217
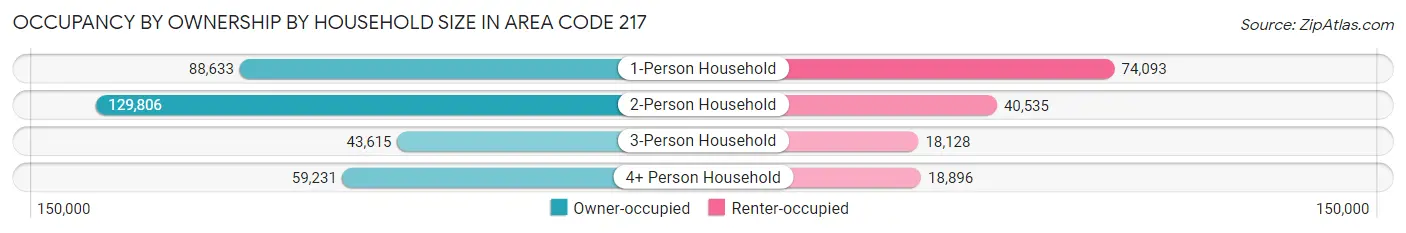
| Household Size | Owner-occupied | Renter-occupied |
| 1-Person Household | 88,633 (54.5%) | 74,093 (45.5%) |
| 2-Person Household | 129,806 (76.2%) | 40,535 (23.8%) |
| 3-Person Household | 43,615 (70.6%) | 18,128 (29.4%) |
| 4+ Person Household | 59,231 (75.8%) | 18,896 (24.2%) |
| Total Housing Units | 321,285 (67.9%) | 151,652 (32.1%) |
Occupancy by Educational Attainment in Area Code 217
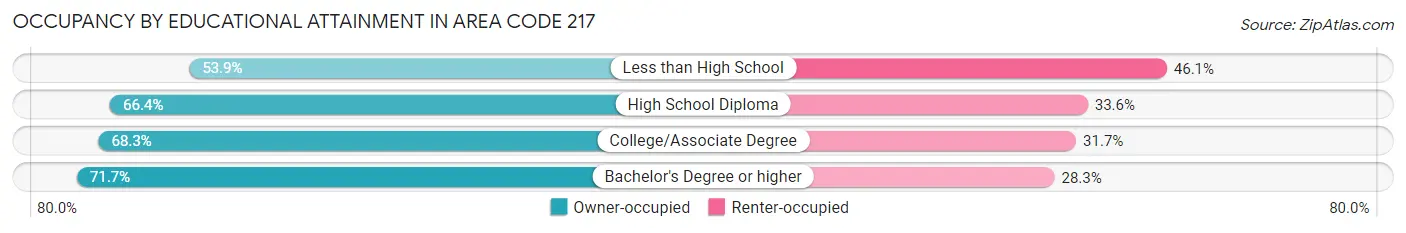
| Household Size | Owner-occupied | Renter-occupied |
| Less than High School | 15,816 (53.9%) | 13,530 (46.1%) |
| High School Diploma | 93,399 (66.4%) | 47,200 (33.6%) |
| College/Associate Degree | 103,420 (68.3%) | 48,049 (31.7%) |
| Bachelor's Degree or higher | 108,650 (71.7%) | 42,873 (28.3%) |
Occupancy by Age of Householder in Area Code 217
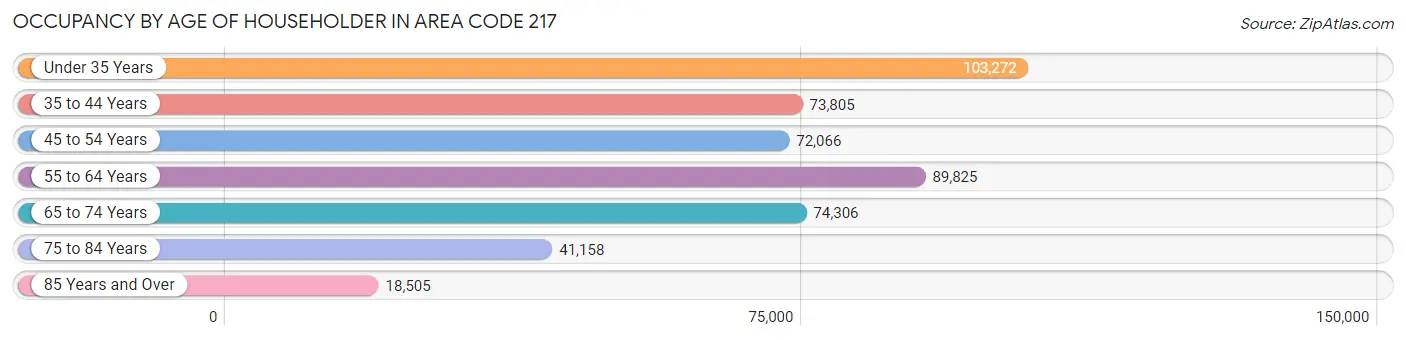
| Age Bracket | # Households | % Households |
| Under 35 Years | 103,272 | 21.8% |
| 35 to 44 Years | 73,805 | 15.6% |
| 45 to 54 Years | 72,066 | 15.2% |
| 55 to 64 Years | 89,825 | 19.0% |
| 65 to 74 Years | 74,306 | 15.7% |
| 75 to 84 Years | 41,158 | 8.7% |
| 85 Years and Over | 18,505 | 3.9% |
| Total | 472,937 | 100.0% |
Housing Finances in Area Code 217
Median Income by Occupancy in Area Code 217
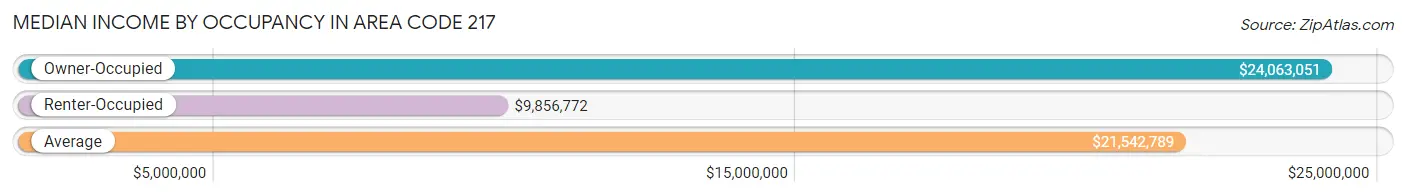
| Occupancy Type | # Households | Median Income |
| Owner-Occupied | 321,285 (67.9%) | $24,063,051 |
| Renter-Occupied | 151,652 (32.1%) | $9,856,772 |
| Average | 472,937 (100.0%) | $21,542,789 |
Occupancy by Householder Income Bracket in Area Code 217
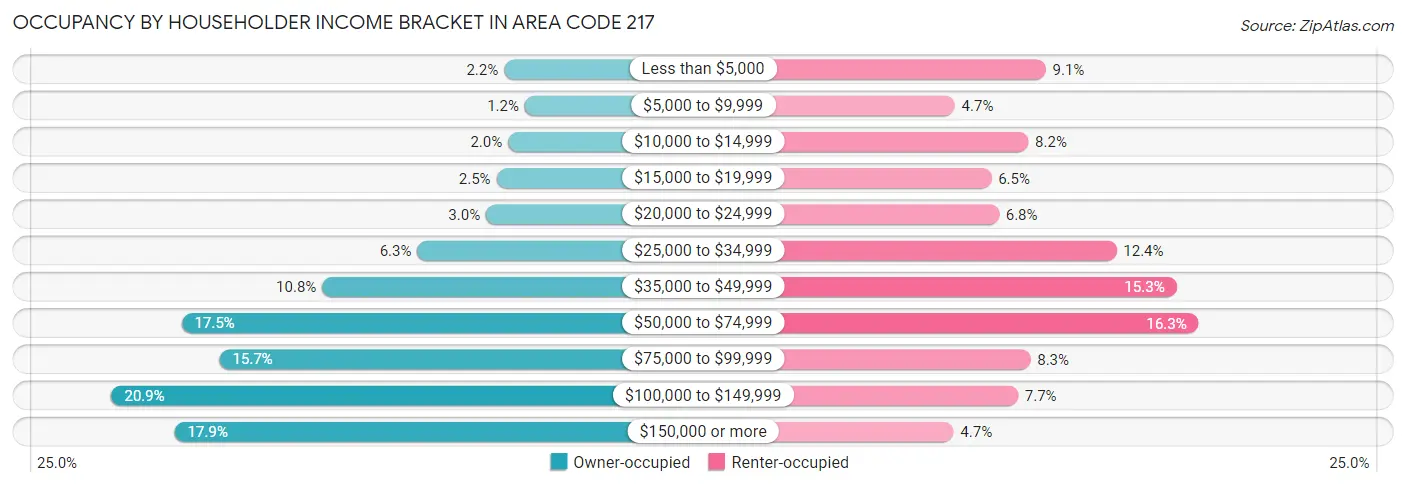
| Income Bracket | Owner-occupied | Renter-occupied |
| Less than $5,000 | 6,966 (2.2%) | 13,721 (9.0%) |
| $5,000 to $9,999 | 3,787 (1.2%) | 7,160 (4.7%) |
| $10,000 to $14,999 | 6,368 (2.0%) | 12,461 (8.2%) |
| $15,000 to $19,999 | 8,116 (2.5%) | 9,803 (6.5%) |
| $20,000 to $24,999 | 9,721 (3.0%) | 10,338 (6.8%) |
| $25,000 to $34,999 | 20,251 (6.3%) | 18,840 (12.4%) |
| $35,000 to $49,999 | 34,786 (10.8%) | 23,171 (15.3%) |
| $50,000 to $74,999 | 56,337 (17.5%) | 24,762 (16.3%) |
| $75,000 to $99,999 | 50,519 (15.7%) | 12,616 (8.3%) |
| $100,000 to $149,999 | 67,060 (20.9%) | 11,718 (7.7%) |
| $150,000 or more | 57,374 (17.9%) | 7,062 (4.7%) |
| Total | 321,285 (100.0%) | 151,652 (100.0%) |
Monthly Housing Cost Tiers in Area Code 217
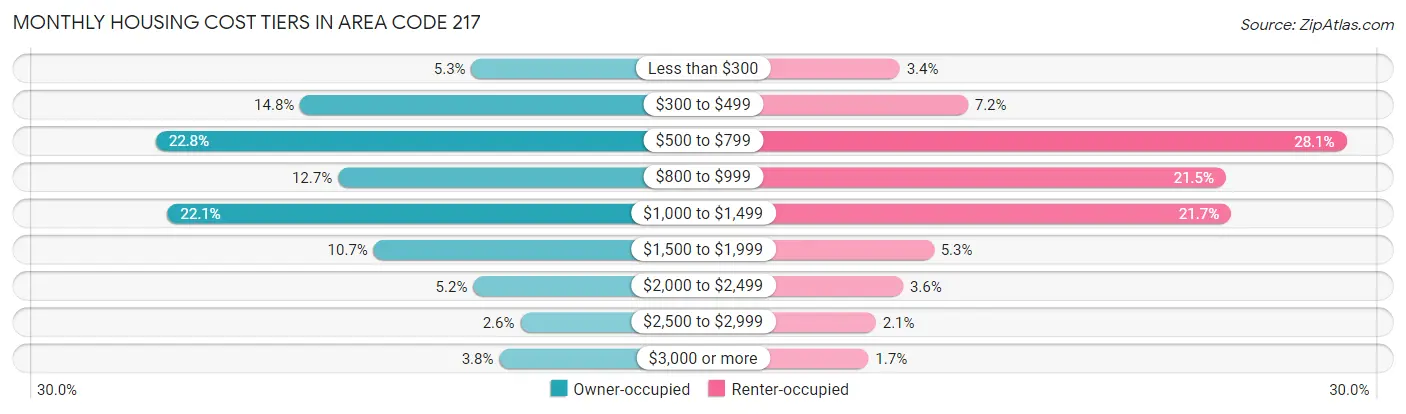
| Monthly Cost | Owner-occupied | Renter-occupied |
| Less than $300 | 17,107 (5.3%) | 5,216 (3.4%) |
| $300 to $499 | 47,483 (14.8%) | 10,926 (7.2%) |
| $500 to $799 | 73,093 (22.8%) | 42,623 (28.1%) |
| $800 to $999 | 40,781 (12.7%) | 32,531 (21.4%) |
| $1,000 to $1,499 | 71,047 (22.1%) | 32,964 (21.7%) |
| $1,500 to $1,999 | 34,443 (10.7%) | 8,070 (5.3%) |
| $2,000 to $2,499 | 16,767 (5.2%) | 5,491 (3.6%) |
| $2,500 to $2,999 | 8,429 (2.6%) | 3,212 (2.1%) |
| $3,000 or more | 12,135 (3.8%) | 2,592 (1.7%) |
| Total | 321,285 (100.0%) | 151,652 (100.0%) |
Physical Housing Characteristics in Area Code 217
Housing Structures in Area Code 217
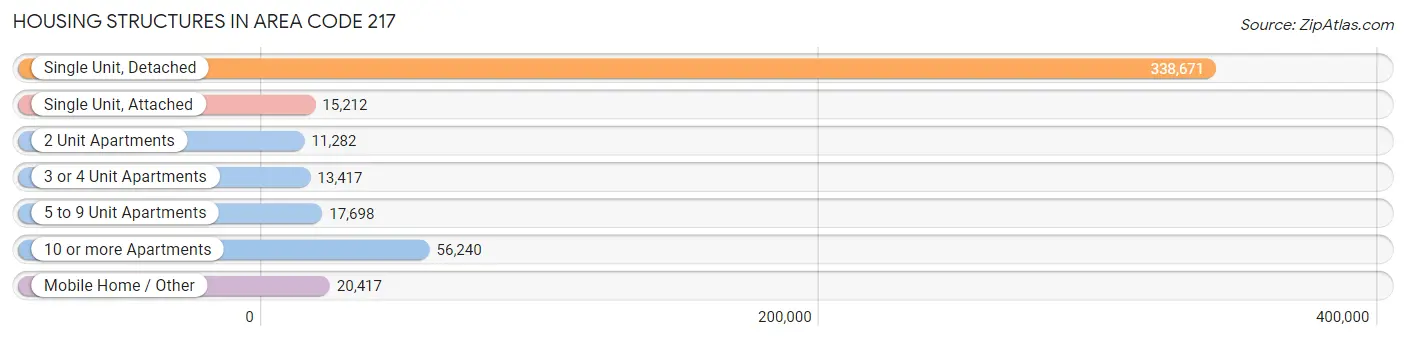
| Structure Type | # Housing Units | % Housing Units |
| Single Unit, Detached | 338,671 | 71.6% |
| Single Unit, Attached | 15,212 | 3.2% |
| 2 Unit Apartments | 11,282 | 2.4% |
| 3 or 4 Unit Apartments | 13,417 | 2.8% |
| 5 to 9 Unit Apartments | 17,698 | 3.7% |
| 10 or more Apartments | 56,240 | 11.9% |
| Mobile Home / Other | 20,417 | 4.3% |
| Total | 472,937 | 100.0% |
Housing Structures by Occupancy in Area Code 217
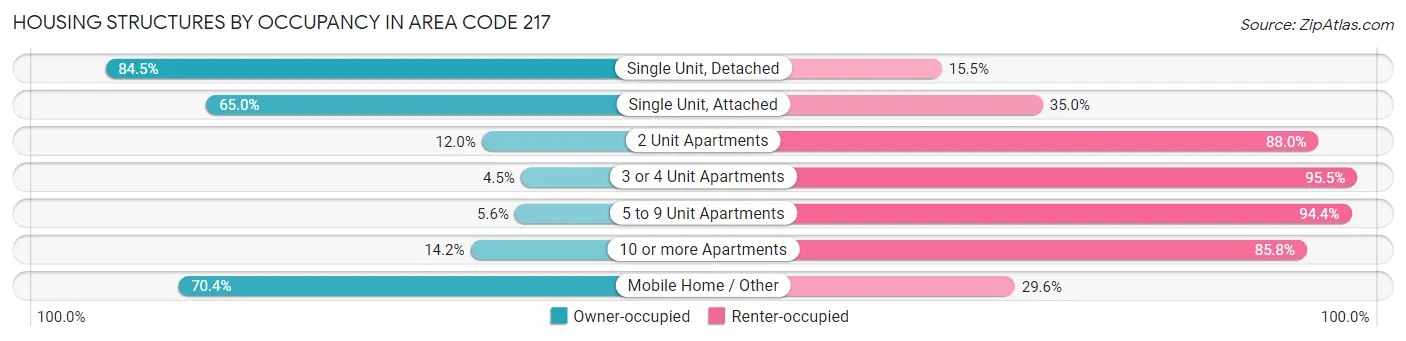
| Structure Type | Owner-occupied | Renter-occupied |
| Single Unit, Detached | 286,074 (84.5%) | 52,597 (15.5%) |
| Single Unit, Attached | 9,893 (65.0%) | 5,319 (35.0%) |
| 2 Unit Apartments | 1,356 (12.0%) | 9,926 (88.0%) |
| 3 or 4 Unit Apartments | 602 (4.5%) | 12,815 (95.5%) |
| 5 to 9 Unit Apartments | 997 (5.6%) | 16,701 (94.4%) |
| 10 or more Apartments | 7,985 (14.2%) | 48,255 (85.8%) |
| Mobile Home / Other | 14,378 (70.4%) | 6,039 (29.6%) |
| Total | 321,285 (67.9%) | 151,652 (32.1%) |
Housing Structures by Number of Rooms in Area Code 217
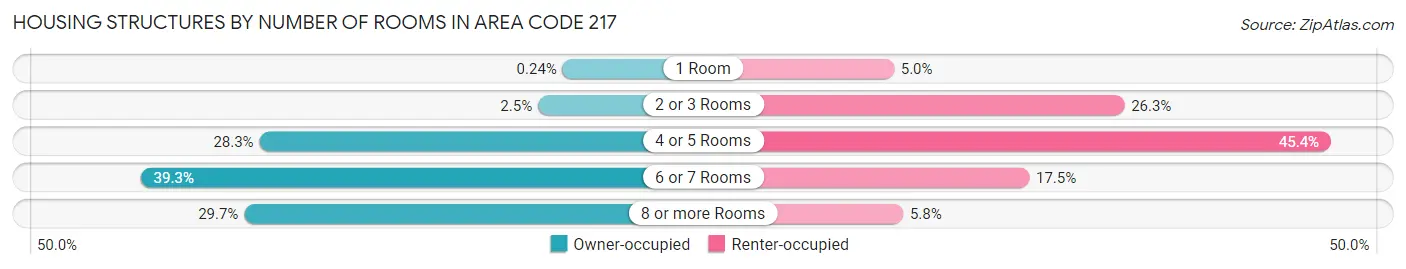
| Number of Rooms | Owner-occupied | Renter-occupied |
| 1 Room | 756 (0.2%) | 7,550 (5.0%) |
| 2 or 3 Rooms | 8,103 (2.5%) | 39,865 (26.3%) |
| 4 or 5 Rooms | 90,847 (28.3%) | 68,870 (45.4%) |
| 6 or 7 Rooms | 126,184 (39.3%) | 26,527 (17.5%) |
| 8 or more Rooms | 95,395 (29.7%) | 8,840 (5.8%) |
| Total | 321,285 (100.0%) | 151,652 (100.0%) |
Housing Structure by Heating Type in Area Code 217
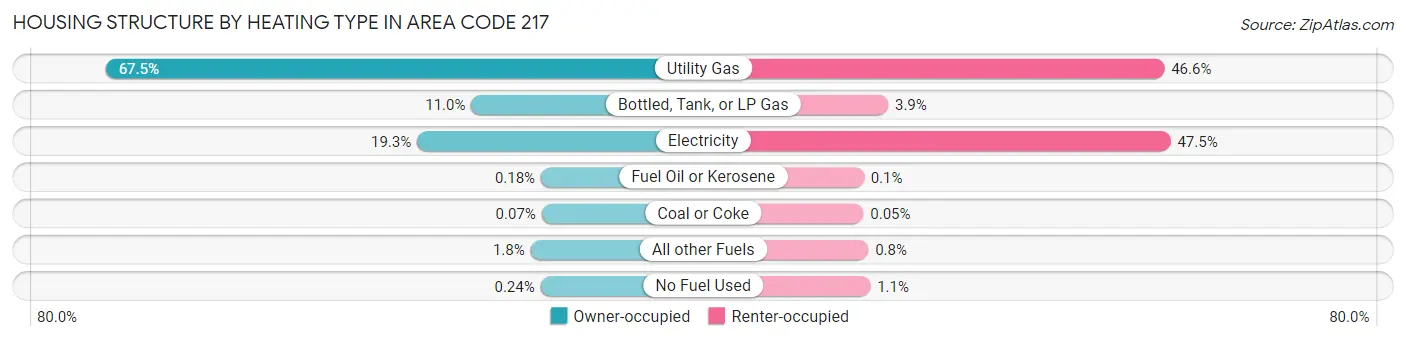
| Heating Type | Owner-occupied | Renter-occupied |
| Utility Gas | 216,703 (67.4%) | 70,612 (46.6%) |
| Bottled, Tank, or LP Gas | 35,170 (11.0%) | 5,850 (3.9%) |
| Electricity | 62,092 (19.3%) | 72,073 (47.5%) |
| Fuel Oil or Kerosene | 566 (0.2%) | 147 (0.1%) |
| Coal or Coke | 234 (0.1%) | 73 (0.1%) |
| All other Fuels | 5,741 (1.8%) | 1,216 (0.8%) |
| No Fuel Used | 779 (0.2%) | 1,681 (1.1%) |
| Total | 321,285 (100.0%) | 151,652 (100.0%) |
Household Vehicle Usage in Area Code 217
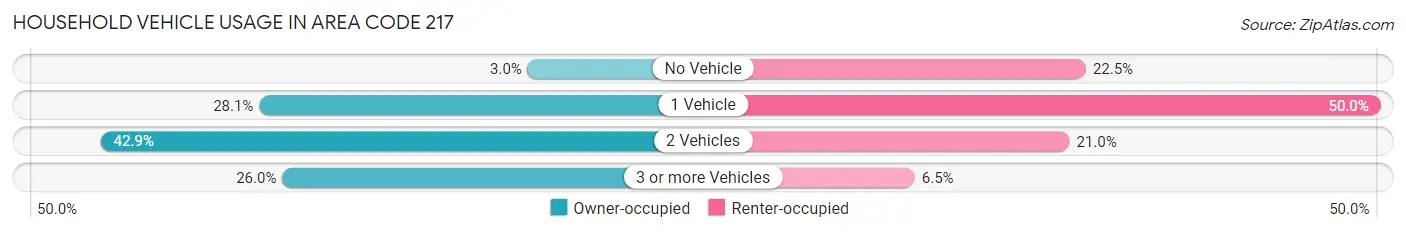
| Vehicles per Household | Owner-occupied | Renter-occupied |
| No Vehicle | 9,755 (3.0%) | 34,128 (22.5%) |
| 1 Vehicle | 90,290 (28.1%) | 75,822 (50.0%) |
| 2 Vehicles | 137,862 (42.9%) | 31,797 (21.0%) |
| 3 or more Vehicles | 83,378 (26.0%) | 9,905 (6.5%) |
| Total | 321,285 (100.0%) | 151,652 (100.0%) |
Real Estate & Mortgages in Area Code 217
Real Estate and Mortgage Overview in Area Code 217
| Characteristic | Without Mortgage | With Mortgage |
| Housing Units | 145,155 | 176,130 |
| Median Property Value | $37,128,000 | $39,928,700 |
| Median Household Income | $18,978,686 | $37,819 |
| Monthly Housing Costs | $159,808 | $11,443 |
| Real Estate Taxes | $612,470 | $2,834 |
Property Value by Mortgage Status in Area Code 217
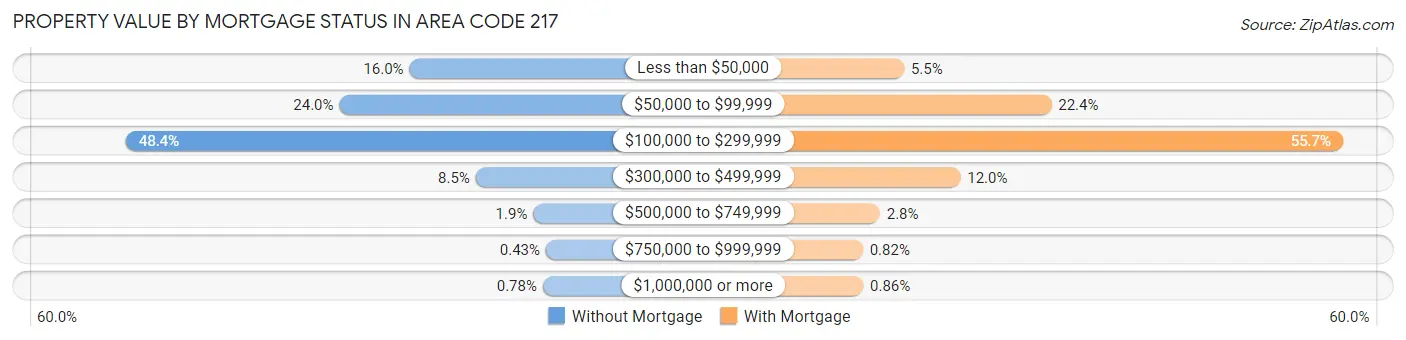
| Property Value | Without Mortgage | With Mortgage |
| Less than $50,000 | 23,250 (16.0%) | 9,746 (5.5%) |
| $50,000 to $99,999 | 34,878 (24.0%) | 39,397 (22.4%) |
| $100,000 to $299,999 | 70,282 (48.4%) | 98,068 (55.7%) |
| $300,000 to $499,999 | 12,272 (8.5%) | 21,080 (12.0%) |
| $500,000 to $749,999 | 2,716 (1.9%) | 4,877 (2.8%) |
| $750,000 to $999,999 | 621 (0.4%) | 1,447 (0.8%) |
| $1,000,000 or more | 1,136 (0.8%) | 1,515 (0.9%) |
| Total | 145,155 (100.0%) | 176,130 (100.0%) |
Household Income by Mortgage Status in Area Code 217
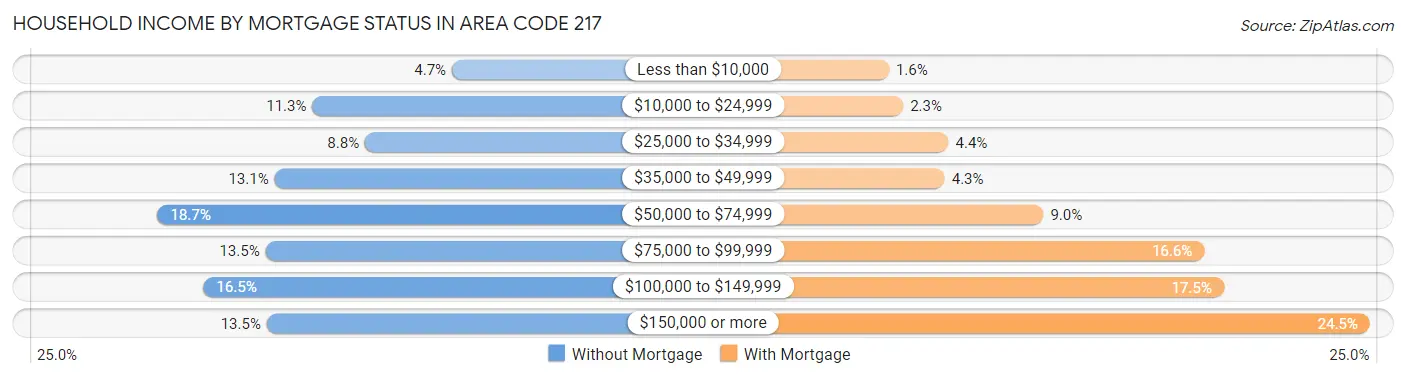
| Household Income | Without Mortgage | With Mortgage |
| Less than $10,000 | 6,753 (4.6%) | 2,803 (1.6%) |
| $10,000 to $24,999 | 16,404 (11.3%) | 4,000 (2.3%) |
| $25,000 to $34,999 | 12,760 (8.8%) | 7,801 (4.4%) |
| $35,000 to $49,999 | 19,020 (13.1%) | 7,491 (4.3%) |
| $50,000 to $74,999 | 27,094 (18.7%) | 15,766 (8.9%) |
| $75,000 to $99,999 | 19,642 (13.5%) | 29,243 (16.6%) |
| $100,000 to $149,999 | 23,927 (16.5%) | 30,877 (17.5%) |
| $150,000 or more | 19,555 (13.5%) | 43,133 (24.5%) |
| Total | 145,155 (100.0%) | 176,130 (100.0%) |
Property Value to Household Income Ratio in Area Code 217
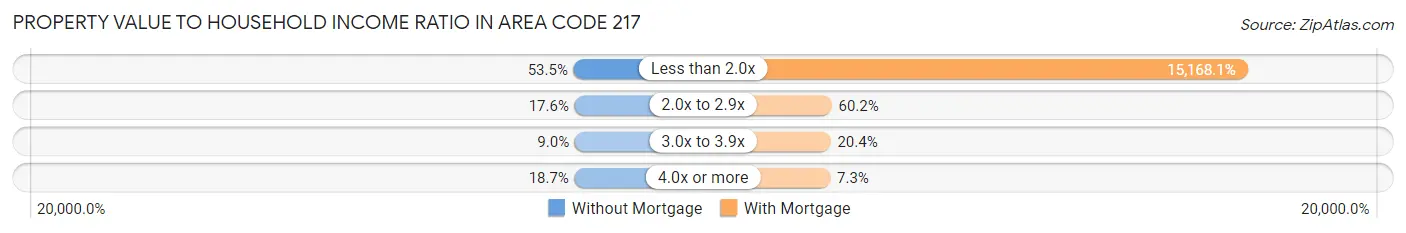
| Value-to-Income Ratio | Without Mortgage | With Mortgage |
| Less than 2.0x | 77,657 (53.5%) | 26,715,504 (15,168.1%) |
| 2.0x to 2.9x | 25,608 (17.6%) | 105,956 (60.2%) |
| 3.0x to 3.9x | 13,024 (9.0%) | 35,940 (20.4%) |
| 4.0x or more | 27,187 (18.7%) | 12,812 (7.3%) |
| Total | 145,155 (100.0%) | 176,130 (100.0%) |
Real Estate Taxes by Mortgage Status in Area Code 217
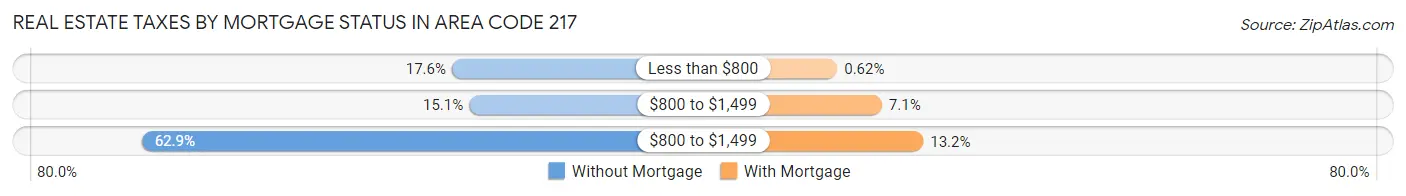
| Property Taxes | Without Mortgage | With Mortgage |
| Less than $800 | 25,523 (17.6%) | 1,085 (0.6%) |
| $800 to $1,499 | 21,863 (15.1%) | 12,576 (7.1%) |
| $800 to $1,499 | 91,277 (62.9%) | 23,235 (13.2%) |
| Total | 145,155 (100.0%) | 176,130 (100.0%) |
Health & Disability in Area Code 217
Health Insurance Coverage by Age in Area Code 217
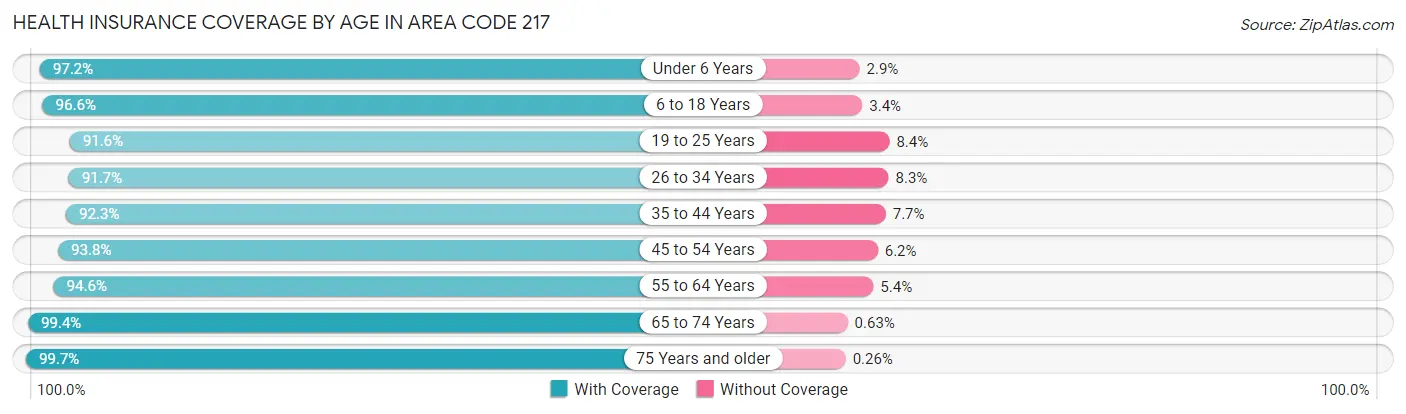
| Age Bracket | With Coverage | Without Coverage |
| Under 6 Years | 72,296 (97.2%) | 2,120 (2.9%) |
| 6 to 18 Years | 174,910 (96.6%) | 6,105 (3.4%) |
| 19 to 25 Years | 112,017 (91.6%) | 10,313 (8.4%) |
| 26 to 34 Years | 117,529 (91.7%) | 10,575 (8.3%) |
| 35 to 44 Years | 123,178 (92.3%) | 10,339 (7.7%) |
| 45 to 54 Years | 118,587 (93.8%) | 7,895 (6.2%) |
| 55 to 64 Years | 140,336 (94.6%) | 8,053 (5.4%) |
| 65 to 74 Years | 116,809 (99.4%) | 738 (0.6%) |
| 75 Years and older | 82,844 (99.7%) | 217 (0.3%) |
| Total | 1,058,506 (95.0%) | 56,355 (5.1%) |
Health Insurance Coverage by Citizenship Status in Area Code 217
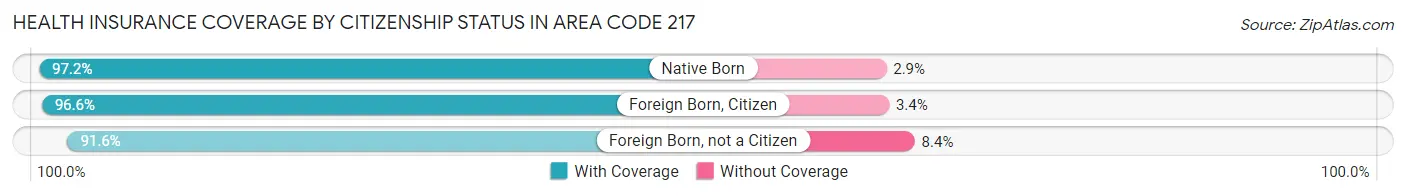
| Citizenship Status | With Coverage | Without Coverage |
| Native Born | 72,296 (97.2%) | 2,120 (2.9%) |
| Foreign Born, Citizen | 174,910 (96.6%) | 6,105 (3.4%) |
| Foreign Born, not a Citizen | 112,017 (91.6%) | 10,313 (8.4%) |
Health Insurance Coverage by Household Income in Area Code 217
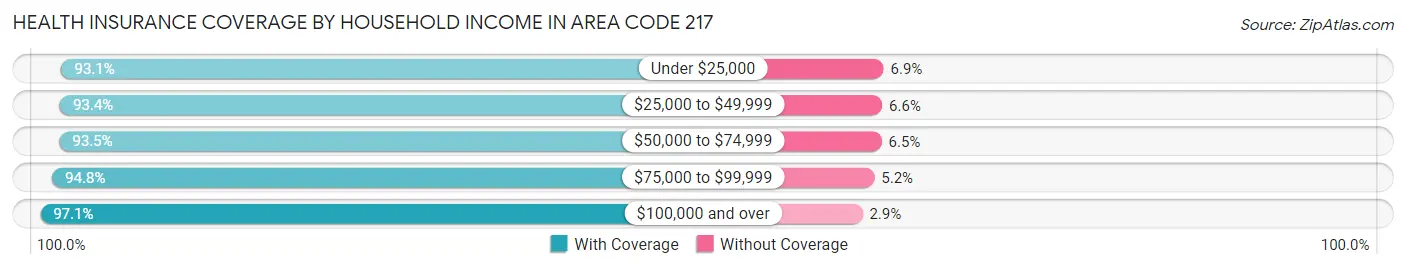
| Household Income | With Coverage | Without Coverage |
| Under $25,000 | 137,257 (93.1%) | 10,174 (6.9%) |
| $25,000 to $49,999 | 176,639 (93.4%) | 12,533 (6.6%) |
| $50,000 to $74,999 | 167,671 (93.5%) | 11,692 (6.5%) |
| $75,000 to $99,999 | 153,636 (94.8%) | 8,364 (5.2%) |
| $100,000 and over | 399,388 (97.1%) | 12,040 (2.9%) |
Public vs Private Health Insurance Coverage by Age in Area Code 217
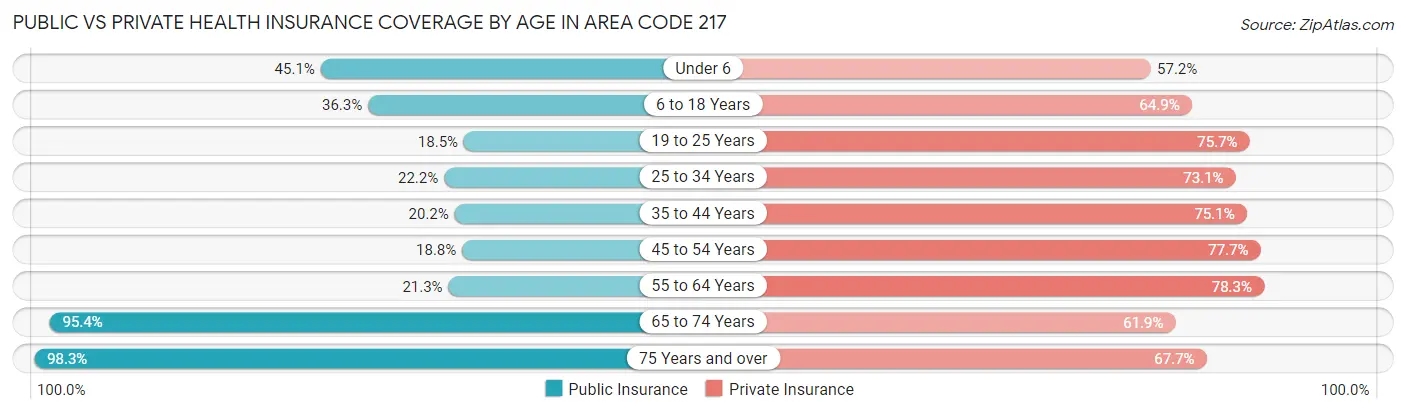
| Age Bracket | Public Insurance | Private Insurance |
| Under 6 | 33,522 (45.1%) | 42,591 (57.2%) |
| 6 to 18 Years | 65,624 (36.2%) | 117,523 (64.9%) |
| 19 to 25 Years | 22,577 (18.5%) | 92,543 (75.6%) |
| 25 to 34 Years | 28,374 (22.2%) | 93,576 (73.1%) |
| 35 to 44 Years | 26,940 (20.2%) | 100,290 (75.1%) |
| 45 to 54 Years | 23,770 (18.8%) | 98,266 (77.7%) |
| 55 to 64 Years | 31,644 (21.3%) | 116,236 (78.3%) |
| 65 to 74 Years | 112,115 (95.4%) | 72,761 (61.9%) |
| 75 Years and over | 81,619 (98.3%) | 56,206 (67.7%) |
| Total | 426,185 (38.2%) | 789,992 (70.9%) |
Disability Status by Sex by Age in Area Code 217
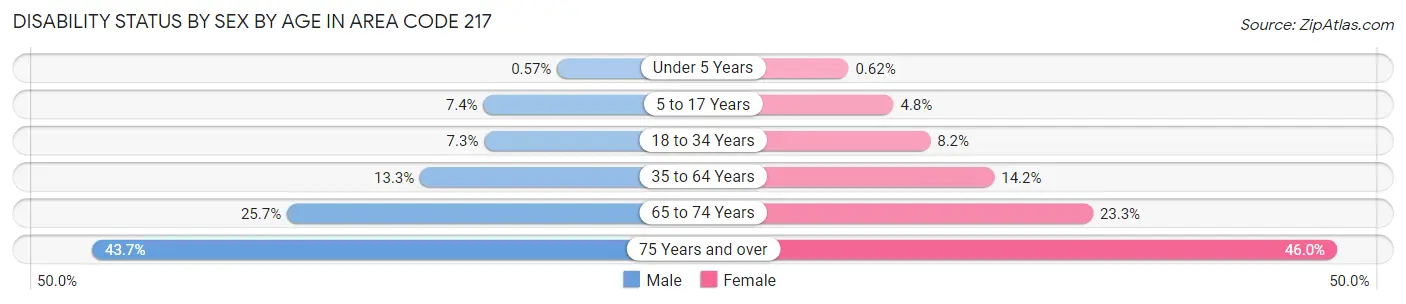
| Age Bracket | Male | Female |
| Under 5 Years | 182 (0.6%) | 190 (0.6%) |
| 5 to 17 Years | 6,614 (7.4%) | 4,100 (4.8%) |
| 18 to 34 Years | 9,978 (7.3%) | 10,921 (8.2%) |
| 35 to 64 Years | 27,028 (13.3%) | 29,035 (14.1%) |
| 65 to 74 Years | 14,248 (25.7%) | 14,448 (23.3%) |
| 75 Years and over | 15,009 (43.7%) | 22,397 (46.0%) |
Disability Class by Sex by Age in Area Code 217
Disability Class: Hearing Difficulty
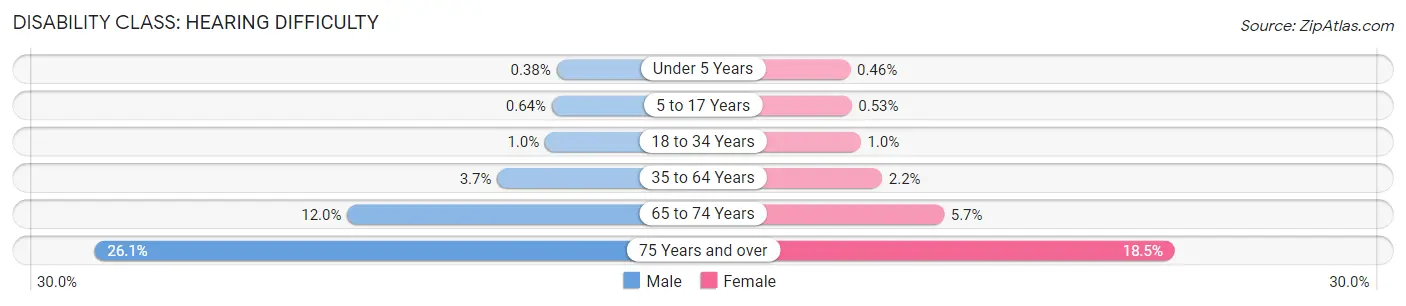
| Age Bracket | Male | Female |
| Under 5 Years | 122 (0.4%) | 140 (0.5%) |
| 5 to 17 Years | 574 (0.6%) | 452 (0.5%) |
| 18 to 34 Years | 1,391 (1.0%) | 1,384 (1.0%) |
| 35 to 64 Years | 7,471 (3.7%) | 4,584 (2.2%) |
| 65 to 74 Years | 6,682 (12.0%) | 3,522 (5.7%) |
| 75 Years and over | 8,961 (26.1%) | 9,039 (18.5%) |
Disability Class: Vision Difficulty
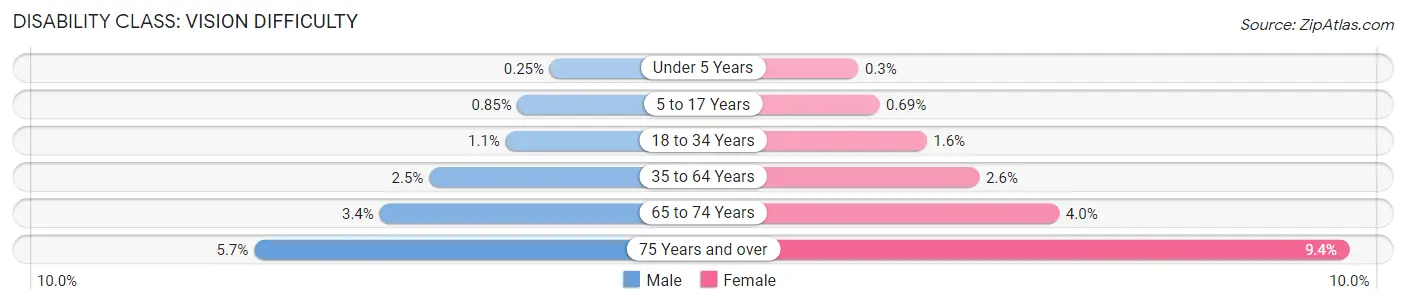
| Age Bracket | Male | Female |
| Under 5 Years | 81 (0.3%) | 93 (0.3%) |
| 5 to 17 Years | 757 (0.9%) | 593 (0.7%) |
| 18 to 34 Years | 1,449 (1.1%) | 2,088 (1.6%) |
| 35 to 64 Years | 5,066 (2.5%) | 5,234 (2.5%) |
| 65 to 74 Years | 1,896 (3.4%) | 2,498 (4.0%) |
| 75 Years and over | 1,968 (5.7%) | 4,588 (9.4%) |
Disability Class: Cognitive Difficulty
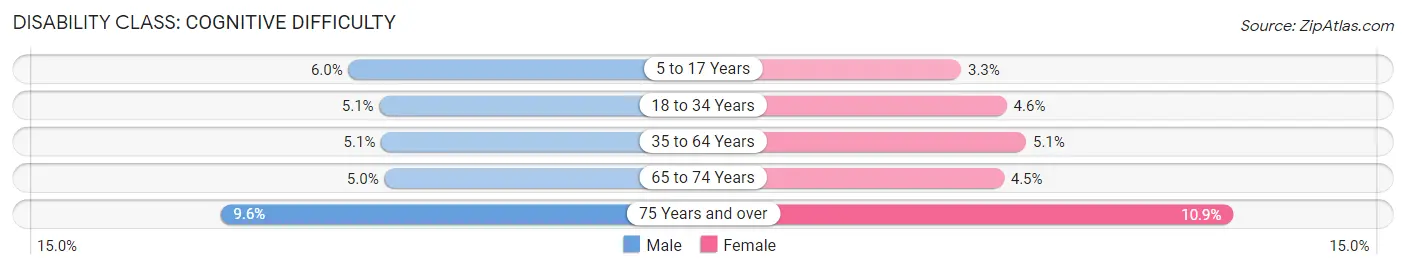
| Age Bracket | Male | Female |
| 5 to 17 Years | 5,332 (6.0%) | 2,831 (3.3%) |
| 18 to 34 Years | 6,963 (5.1%) | 6,113 (4.6%) |
| 35 to 64 Years | 10,301 (5.1%) | 10,521 (5.1%) |
| 65 to 74 Years | 2,767 (5.0%) | 2,793 (4.5%) |
| 75 Years and over | 3,276 (9.6%) | 5,311 (10.9%) |
Disability Class: Ambulatory Difficulty
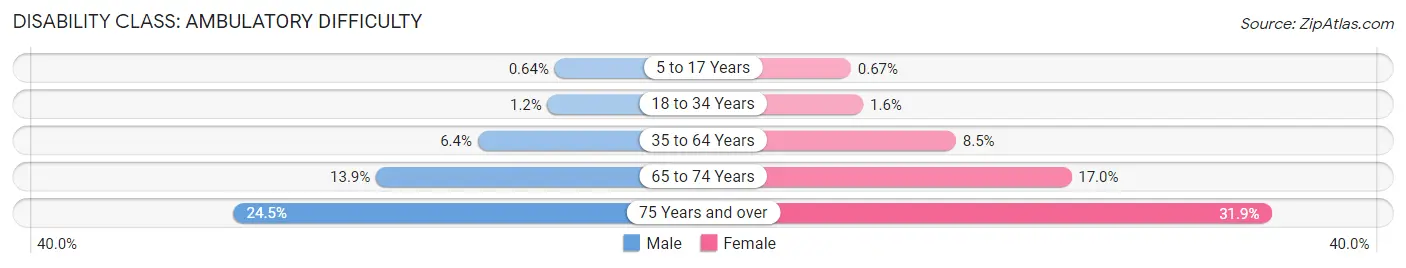
| Age Bracket | Male | Female |
| 5 to 17 Years | 574 (0.6%) | 571 (0.7%) |
| 18 to 34 Years | 1,590 (1.2%) | 2,108 (1.6%) |
| 35 to 64 Years | 12,900 (6.4%) | 17,376 (8.5%) |
| 65 to 74 Years | 7,723 (13.9%) | 10,566 (17.0%) |
| 75 Years and over | 8,400 (24.5%) | 15,542 (31.9%) |
Disability Class: Self-Care Difficulty
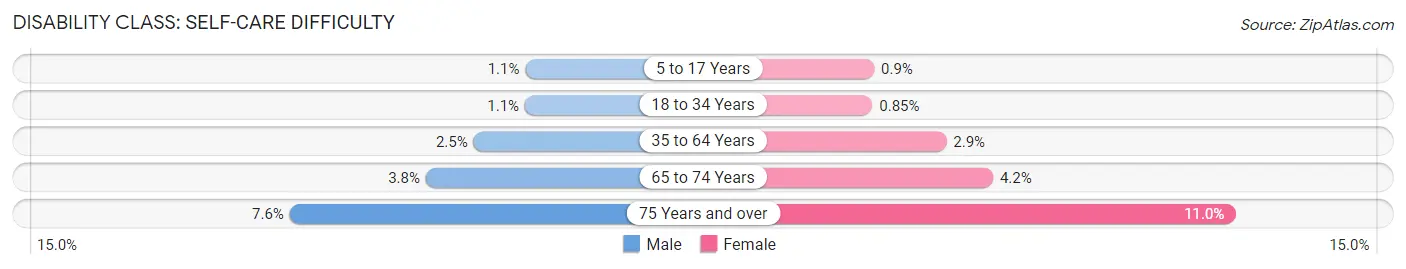
| Age Bracket | Male | Female |
| 5 to 17 Years | 947 (1.1%) | 765 (0.9%) |
| 18 to 34 Years | 1,460 (1.1%) | 1,129 (0.9%) |
| 35 to 64 Years | 5,072 (2.5%) | 5,970 (2.9%) |
| 65 to 74 Years | 2,130 (3.8%) | 2,608 (4.2%) |
| 75 Years and over | 2,614 (7.6%) | 5,352 (11.0%) |
Technology Access in Area Code 217
Computing Device Access in Area Code 217
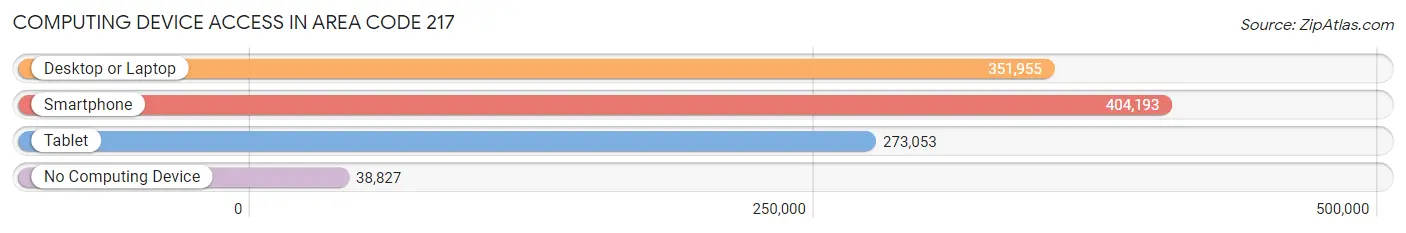
| Device Type | # Households | % Households |
| Desktop or Laptop | 351,955 | 74.4% |
| Smartphone | 404,193 | 85.5% |
| Tablet | 273,053 | 57.7% |
| No Computing Device | 38,827 | 8.2% |
| Total | 472,937 | 100.0% |
Internet Access in Area Code 217
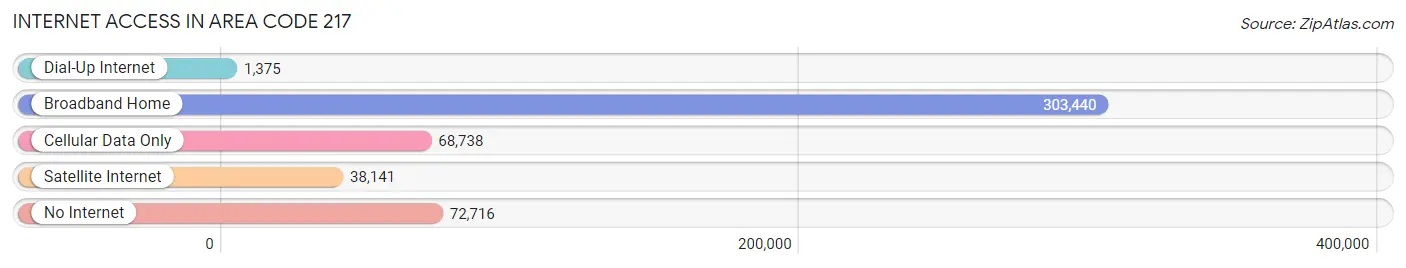
| Internet Type | # Households | % Households |
| Dial-Up Internet | 1,375 | 0.3% |
| Broadband Home | 303,440 | 64.2% |
| Cellular Data Only | 68,738 | 14.5% |
| Satellite Internet | 38,141 | 8.1% |
| No Internet | 72,716 | 15.4% |
| Total | 472,937 | 100.0% |
Area Code 217 Summary
Geography
Area code 217 is located in the central part of Illinois, covering the cities of Springfield, Champaign, Decatur, and Danville. It also covers the counties of Adams, Champaign, Christian, DeWitt, Douglas, Macon, Mason, Menard, Morgan, Moultrie, Piatt, Sangamon, and Shelby.
Social
Area code 217 is home to a variety of cultures and lifestyles. The cities of Springfield, Champaign, Decatur, and Danville are all home to a variety of universities, museums, and other attractions. The area is also home to a variety of festivals and events throughout the year.
Economics
Area code 217 is home to a variety of industries, including manufacturing, agriculture, and technology. The area is also home to a variety of businesses, including retail, restaurants, and entertainment.
Demographics
Area code 217 is home to a diverse population, with a median age of 35. The area is also home to a variety of ethnicities, including African American, Hispanic, and Asian. The area is also home to a variety of religions, including Christianity, Judaism, and Islam.
Common Questions
What is Per Capita Income in Area Code 217?
Per Capita income in Area Code 217 is $35,651.
What is the Median Family Income in Area Code 217?
Median Family Income in Area Code 217 is $87,880.
What is the Median Household income in Area Code 217?
Median Household Income in Area Code 217 is $70,864.
What is Income or Wage Gap in Area Code 217?
Income or Wage Gap in Area Code 217 is 31.6%.
Women in Area Code 217 earn 68.4 cents for every dollar earned by a man.
What is Family Income Deficit in Area Code 217?
Family Income Deficit in Area Code 217 is $11,412.
Families that are below poverty line in Area Code 217 earn $11,412 less on average than the poverty threshold level.
What is Inequality or Gini Index in Area Code 217?
Inequality or Gini Index in Area Code 217 is 123.24.
What is the Total Population of Area Code 217?
Total Population of Area Code 217 is 1,138,824.
What is the Total Male Population of Area Code 217?
Total Male Population of Area Code 217 is 565,177.
What is the Total Female Population of Area Code 217?
Total Female Population of Area Code 217 is 573,647.
What is the Ratio of Males per 100 Females in Area Code 217?
There are 98.52 Males per 100 Females in Area Code 217.
What is the Ratio of Females per 100 Males in Area Code 217?
There are 101.50 Females per 100 Males in Area Code 217.
What is the Median Population Age in Area Code 217?
Median Population Age in Area Code 217 is 43.0 Years.
What is the Average Family Size in Area Code 217
Average Family Size in Area Code 217 is 3.0 People.
What is the Average Household Size in Area Code 217
Average Household Size in Area Code 217 is 2.4 People.
How Large is the Labor Force in Area Code 217?
There are 565,750 People in the Labor Forcein in Area Code 217.
What is the Percentage of People in the Labor Force in Area Code 217?
60.9% of People are in the Labor Force in Area Code 217.
What is the Unemployment Rate in Area Code 217?
Unemployment Rate in Area Code 217 is 5.0%.