Iroquois County, IL Map & Demographics
Iroquois County Map
Iroquois County Overview
$33,347
PER CAPITA INCOME
$81,000
AVG FAMILY INCOME
$62,866
AVG HOUSEHOLD INCOME
37.1%
WAGE / INCOME GAP [ % ]
62.9¢/ $1
WAGE / INCOME GAP [ $ ]
$10,308
FAMILY INCOME DEFICIT
0.43
INEQUALITY / GINI INDEX
27,043
TOTAL POPULATION
13,380
MALE POPULATION
13,663
FEMALE POPULATION
97.93
MALES / 100 FEMALES
102.12
FEMALES / 100 MALES
44.5
MEDIAN AGE
2.9
AVG FAMILY SIZE
2.4
AVG HOUSEHOLD SIZE
12,985
LABOR FORCE [ PEOPLE ]
58.9%
PERCENT IN LABOR FORCE
4.9%
UNEMPLOYMENT RATE
Income in Iroquois County
Income Overview in Iroquois County
Per Capita Income in Iroquois County is $33,347, while median incomes of families and households are $81,000 and $62,866 respectively.
| Characteristic | Number | Measure |
| Per Capita Income | 27,043 | $33,347 |
| Median Family Income | 7,164 | $81,000 |
| Mean Family Income | 7,164 | $98,141 |
| Median Household Income | 11,217 | $62,866 |
| Mean Household Income | 11,217 | $79,788 |
| Income Deficit | 7,164 | $10,308 |
| Wage / Income Gap (%) | 27,043 | 37.13% |
| Wage / Income Gap ($) | 27,043 | 62.87¢ per $1 |
| Gini / Inequality Index | 27,043 | 0.43 |
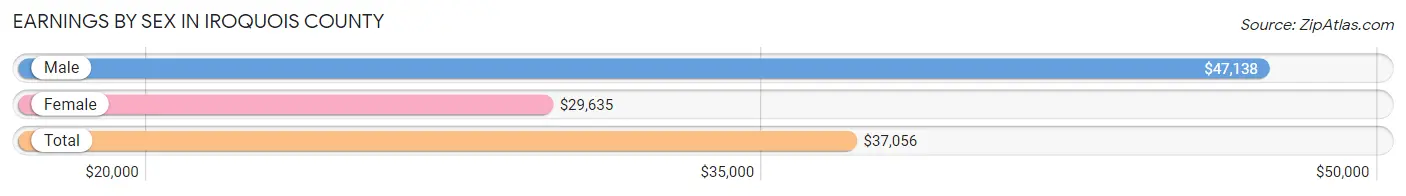
Earnings by Sex in Iroquois County
Average Earnings in Iroquois County are $37,056, $47,138 for men and $29,635 for women, a difference of 37.1%.
| Sex | Number | Average Earnings |
| Male | 7,291 (53.5%) | $47,138 |
| Female | 6,339 (46.5%) | $29,635 |
| Total | 13,630 (100.0%) | $37,056 |
Earnings by Sex by Income Bracket in Iroquois County
The most common earnings brackets in Iroquois County are $100,000+ for men (1,105 | 15.2%) and $25,000 to $29,999 for women (693 | 10.9%).
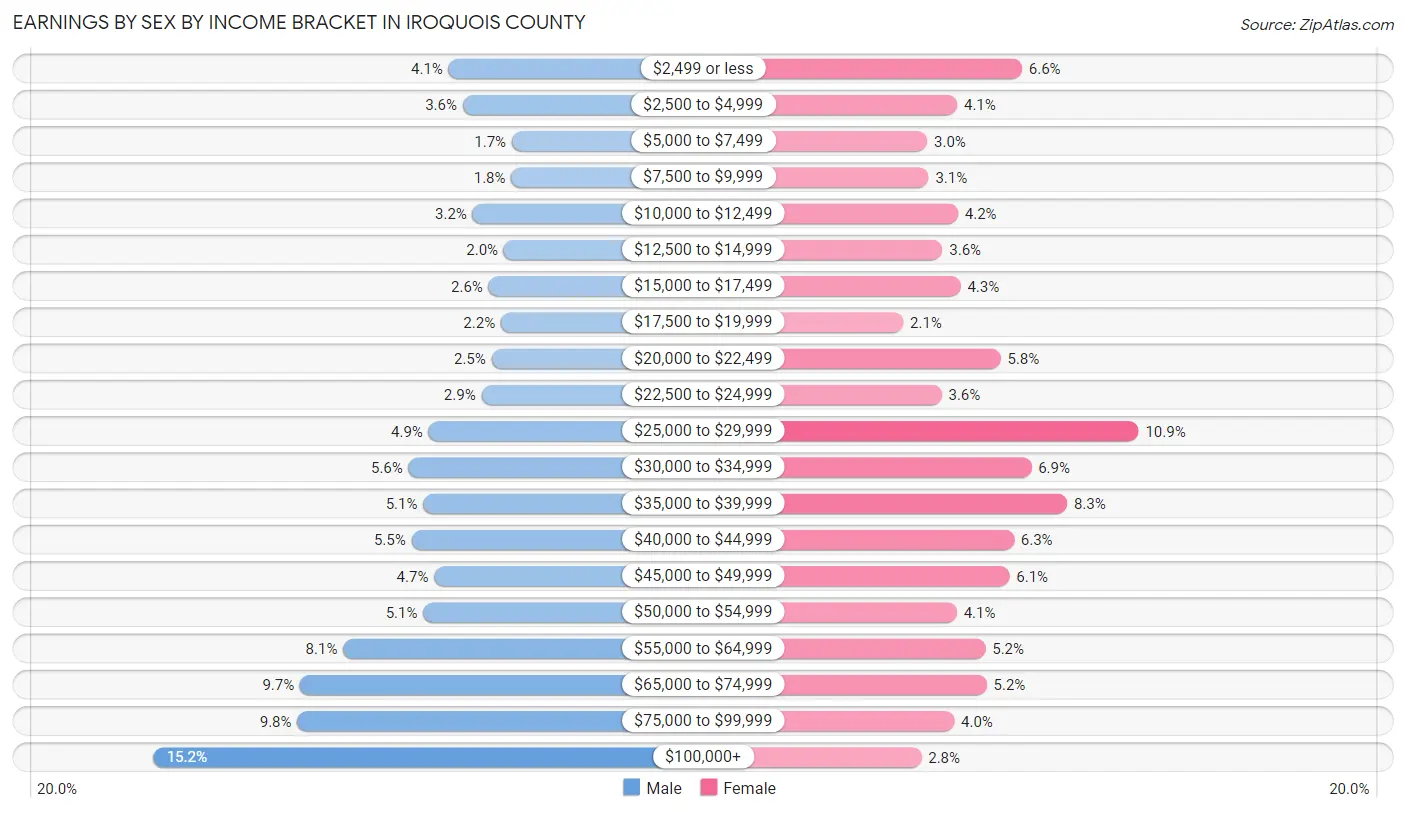
| Income | Male | Female |
| $2,499 or less | 300 (4.1%) | 416 (6.6%) |
| $2,500 to $4,999 | 261 (3.6%) | 262 (4.1%) |
| $5,000 to $7,499 | 127 (1.7%) | 191 (3.0%) |
| $7,500 to $9,999 | 128 (1.8%) | 194 (3.1%) |
| $10,000 to $12,499 | 234 (3.2%) | 264 (4.2%) |
| $12,500 to $14,999 | 149 (2.0%) | 227 (3.6%) |
| $15,000 to $17,499 | 190 (2.6%) | 270 (4.3%) |
| $17,500 to $19,999 | 157 (2.1%) | 134 (2.1%) |
| $20,000 to $22,499 | 182 (2.5%) | 365 (5.8%) |
| $22,500 to $24,999 | 210 (2.9%) | 225 (3.5%) |
| $25,000 to $29,999 | 354 (4.9%) | 693 (10.9%) |
| $30,000 to $34,999 | 409 (5.6%) | 438 (6.9%) |
| $35,000 to $39,999 | 369 (5.1%) | 523 (8.3%) |
| $40,000 to $44,999 | 401 (5.5%) | 397 (6.3%) |
| $45,000 to $49,999 | 339 (4.6%) | 386 (6.1%) |
| $50,000 to $54,999 | 369 (5.1%) | 261 (4.1%) |
| $55,000 to $64,999 | 588 (8.1%) | 329 (5.2%) |
| $65,000 to $74,999 | 706 (9.7%) | 332 (5.2%) |
| $75,000 to $99,999 | 713 (9.8%) | 255 (4.0%) |
| $100,000+ | 1,105 (15.2%) | 177 (2.8%) |
| Total | 7,291 (100.0%) | 6,339 (100.0%) |
Earnings by Sex by Educational Attainment in Iroquois County
Average earnings in Iroquois County are $53,520 for men and $32,780 for women, a difference of 38.8%. Men with an educational attainment of bachelor's degree enjoy the highest average annual earnings of $70,214, while those with less than high school education earn the least with $35,951. Women with an educational attainment of graduate degree earn the most with the average annual earnings of $50,083, while those with less than high school education have the smallest earnings of $21,196.
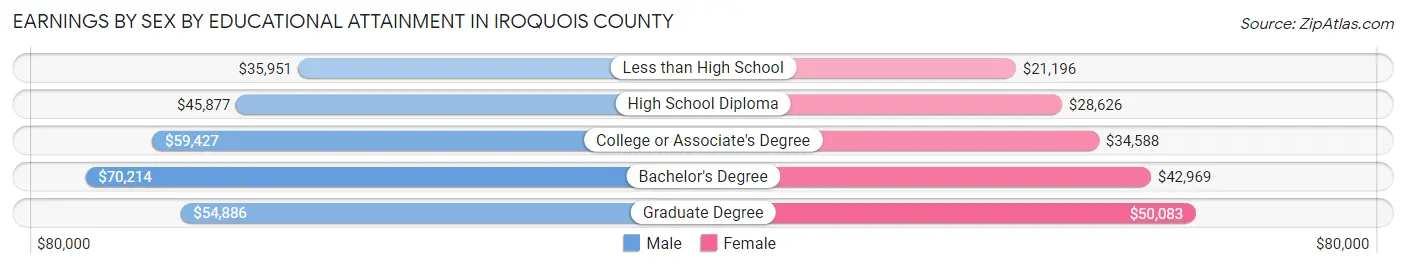
| Educational Attainment | Male Income | Female Income |
| Less than High School | $35,951 | $21,196 |
| High School Diploma | $45,877 | $28,626 |
| College or Associate's Degree | $59,427 | $34,588 |
| Bachelor's Degree | $70,214 | $42,969 |
| Graduate Degree | $54,886 | $50,083 |
| Total | $53,520 | $32,780 |
Family Income in Iroquois County
Family Income Brackets in Iroquois County
According to the Iroquois County family income data, there are 1,590 families falling into the $100,000 to $149,999 income range, which is the most common income bracket and makes up 22.2% of all families. Conversely, the $10,000 to $14,999 income bracket is the least frequent group with only 136 families (1.9%) belonging to this category.
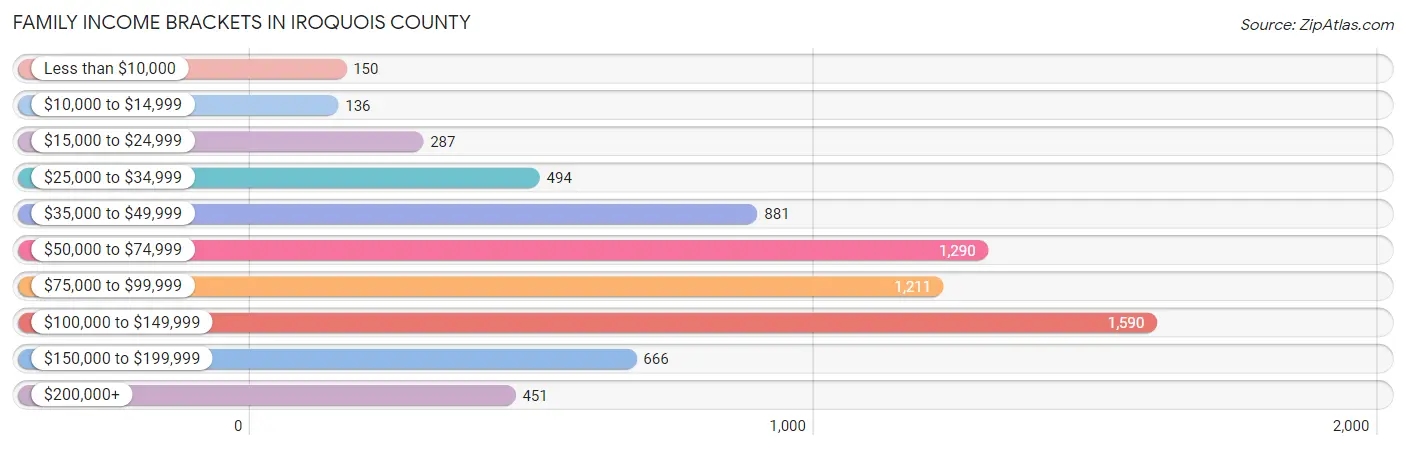
| Income Bracket | # Families | % Families |
| Less than $10,000 | 150 | 2.1% |
| $10,000 to $14,999 | 136 | 1.9% |
| $15,000 to $24,999 | 287 | 4.0% |
| $25,000 to $34,999 | 494 | 6.9% |
| $35,000 to $49,999 | 881 | 12.3% |
| $50,000 to $74,999 | 1,290 | 18.0% |
| $75,000 to $99,999 | 1,211 | 16.9% |
| $100,000 to $149,999 | 1,590 | 22.2% |
| $150,000 to $199,999 | 666 | 9.3% |
| $200,000+ | 451 | 6.3% |
Family Income by Famaliy Size in Iroquois County
7+ person families (67 | 0.9%) account for the highest median family income in Iroquois County with $113,977 per family, while 2-person families (3,931 | 54.9%) have the highest median income of $36,712 per family member.
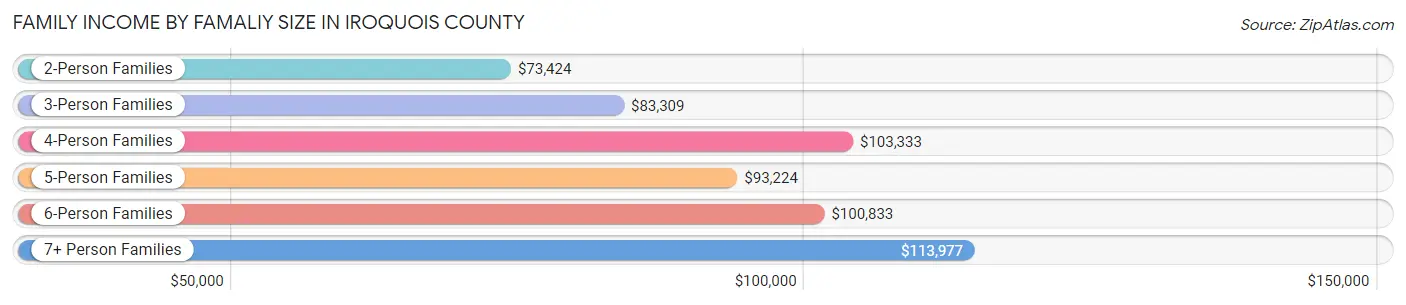
| Income Bracket | # Families | Median Income |
| 2-Person Families | 3,931 (54.9%) | $73,424 |
| 3-Person Families | 1,251 (17.5%) | $83,309 |
| 4-Person Families | 1,134 (15.8%) | $103,333 |
| 5-Person Families | 581 (8.1%) | $93,224 |
| 6-Person Families | 200 (2.8%) | $100,833 |
| 7+ Person Families | 67 (0.9%) | $113,977 |
| Total | 7,164 (100.0%) | $81,000 |
Family Income by Number of Earners in Iroquois County
The median family income in Iroquois County is $81,000, with families comprising 3+ earners (648) having the highest median family income of $125,167, while families with no earners (1,176) have the lowest median family income of $42,244, accounting for 9.0% and 16.4% of families, respectively.
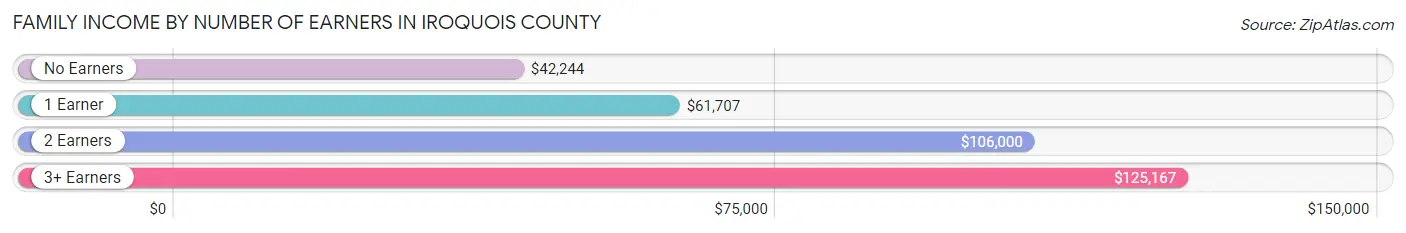
| Number of Earners | # Families | Median Income |
| No Earners | 1,176 (16.4%) | $42,244 |
| 1 Earner | 2,444 (34.1%) | $61,707 |
| 2 Earners | 2,896 (40.4%) | $106,000 |
| 3+ Earners | 648 (9.0%) | $125,167 |
| Total | 7,164 (100.0%) | $81,000 |
Household Income in Iroquois County
Household Income Brackets in Iroquois County
With 2,041 households falling in the category, the $50,000 to $74,999 income range is the most frequent in Iroquois County, accounting for 18.2% of all households. In contrast, only 460 households (4.1%) fall into the $10,000 to $14,999 income bracket, making it the least populous group.
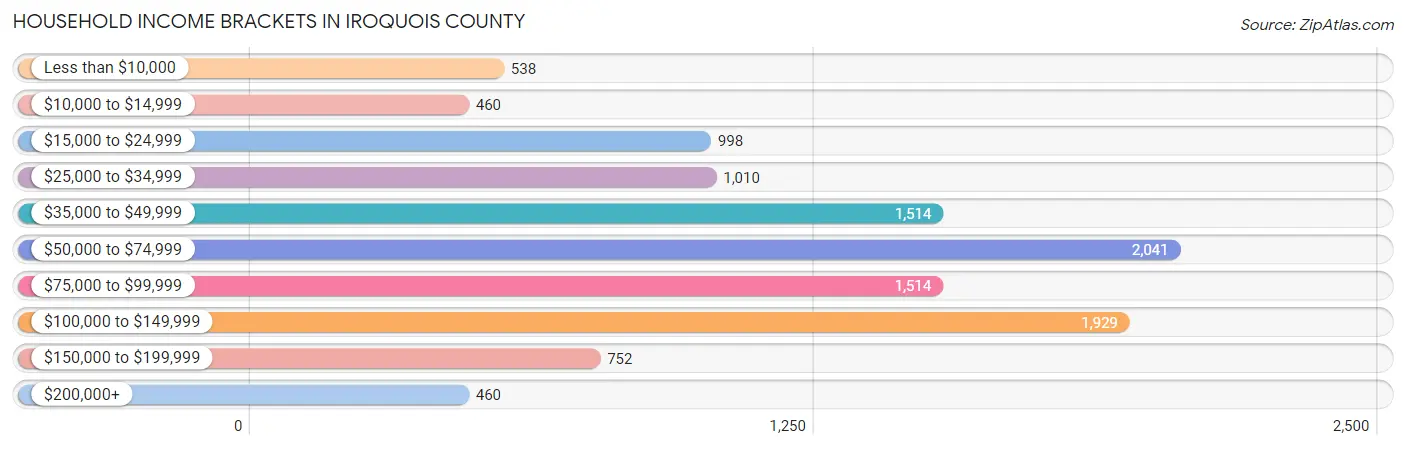
| Income Bracket | # Households | % Households |
| Less than $10,000 | 538 | 4.8% |
| $10,000 to $14,999 | 460 | 4.1% |
| $15,000 to $24,999 | 998 | 8.9% |
| $25,000 to $34,999 | 1,010 | 9.0% |
| $35,000 to $49,999 | 1,514 | 13.5% |
| $50,000 to $74,999 | 2,041 | 18.2% |
| $75,000 to $99,999 | 1,514 | 13.5% |
| $100,000 to $149,999 | 1,929 | 17.2% |
| $150,000 to $199,999 | 752 | 6.7% |
| $200,000+ | 460 | 4.1% |
Household Income by Householder Age in Iroquois County
The median household income in Iroquois County is $62,866, with the highest median household income of $80,075 found in the 25 to 44 years age bracket for the primary householder. A total of 2,732 households (24.4%) fall into this category. Meanwhile, the 15 to 24 years age bracket for the primary householder has the lowest median household income of $39,069, with 366 households (3.3%) in this group.
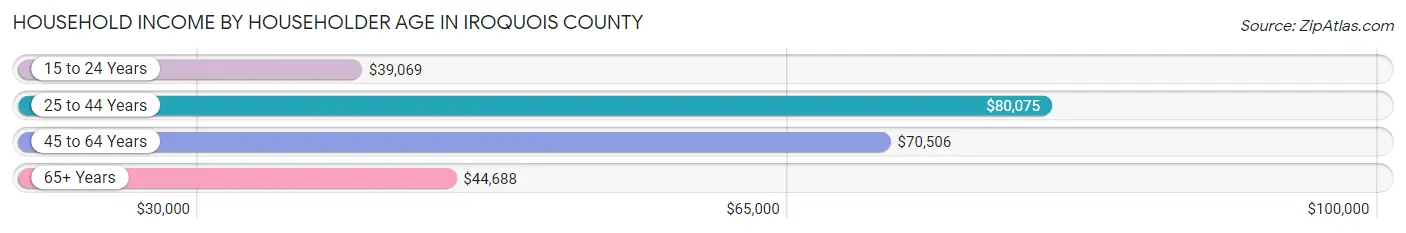
| Income Bracket | # Households | Median Income |
| 15 to 24 Years | 366 (3.3%) | $39,069 |
| 25 to 44 Years | 2,732 (24.4%) | $80,075 |
| 45 to 64 Years | 4,431 (39.5%) | $70,506 |
| 65+ Years | 3,688 (32.9%) | $44,688 |
| Total | 11,217 (100.0%) | $62,866 |
Poverty in Iroquois County
Income Below Poverty by Sex and Age in Iroquois County
With 9.2% poverty level for males and 12.2% for females among the residents of Iroquois County, 16 and 17 year old males and under 5 year old females are the most vulnerable to poverty, with 101 males (24.2%) and 111 females (17.5%) in their respective age groups living below the poverty level.
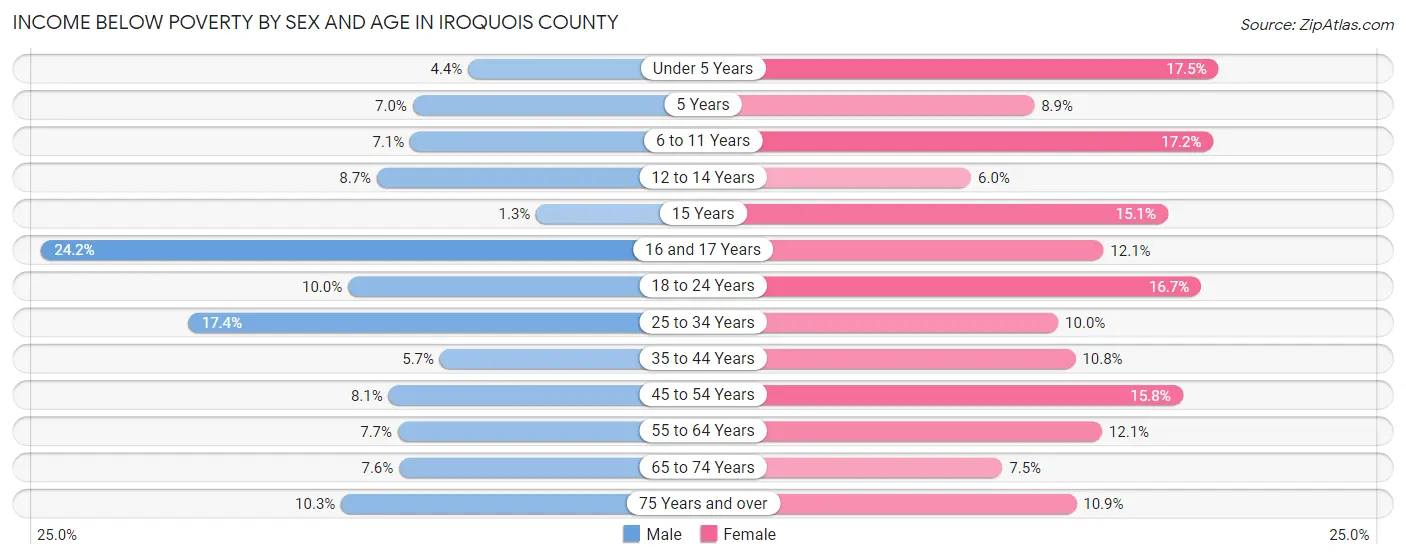
| Age Bracket | Male | Female |
| Under 5 Years | 31 (4.4%) | 111 (17.5%) |
| 5 Years | 10 (7.0%) | 20 (8.9%) |
| 6 to 11 Years | 56 (7.1%) | 151 (17.2%) |
| 12 to 14 Years | 48 (8.6%) | 27 (6.0%) |
| 15 Years | 2 (1.3%) | 23 (15.1%) |
| 16 and 17 Years | 101 (24.2%) | 47 (12.1%) |
| 18 to 24 Years | 112 (10.0%) | 158 (16.7%) |
| 25 to 34 Years | 240 (17.4%) | 130 (10.0%) |
| 35 to 44 Years | 88 (5.7%) | 175 (10.8%) |
| 45 to 54 Years | 132 (8.1%) | 250 (15.8%) |
| 55 to 64 Years | 154 (7.7%) | 258 (12.1%) |
| 65 to 74 Years | 122 (7.6%) | 116 (7.4%) |
| 75 Years and over | 105 (10.3%) | 156 (10.9%) |
| Total | 1,201 (9.2%) | 1,622 (12.2%) |
Income Above Poverty by Sex and Age in Iroquois County
According to the poverty statistics in Iroquois County, males aged 15 years and females aged 12 to 14 years are the age groups that are most secure financially, with 98.7% of males and 94.0% of females in these age groups living above the poverty line.
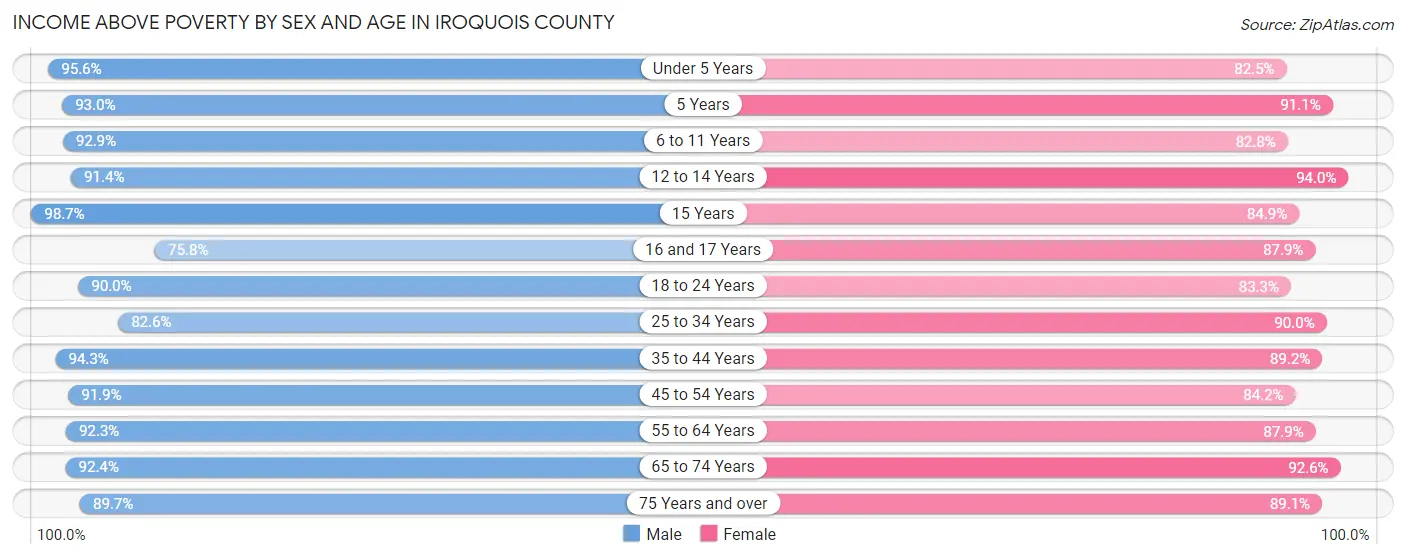
| Age Bracket | Male | Female |
| Under 5 Years | 671 (95.6%) | 524 (82.5%) |
| 5 Years | 133 (93.0%) | 204 (91.1%) |
| 6 to 11 Years | 732 (92.9%) | 725 (82.8%) |
| 12 to 14 Years | 507 (91.3%) | 423 (94.0%) |
| 15 Years | 157 (98.7%) | 129 (84.9%) |
| 16 and 17 Years | 316 (75.8%) | 340 (87.9%) |
| 18 to 24 Years | 1,009 (90.0%) | 790 (83.3%) |
| 25 to 34 Years | 1,141 (82.6%) | 1,165 (90.0%) |
| 35 to 44 Years | 1,449 (94.3%) | 1,440 (89.2%) |
| 45 to 54 Years | 1,496 (91.9%) | 1,331 (84.2%) |
| 55 to 64 Years | 1,850 (92.3%) | 1,880 (87.9%) |
| 65 to 74 Years | 1,479 (92.4%) | 1,442 (92.5%) |
| 75 Years and over | 913 (89.7%) | 1,278 (89.1%) |
| Total | 11,853 (90.8%) | 11,671 (87.8%) |
Income Below Poverty Among Married-Couple Families in Iroquois County
The poverty statistics for married-couple families in Iroquois County show that 2.9% or 162 of the total 5,607 families live below the poverty line. Families with 5 or more children have the highest poverty rate of 10.0%, comprising of 3 families. On the other hand, families with 3 or 4 children have the lowest poverty rate of 0.0%, which includes 0 families.
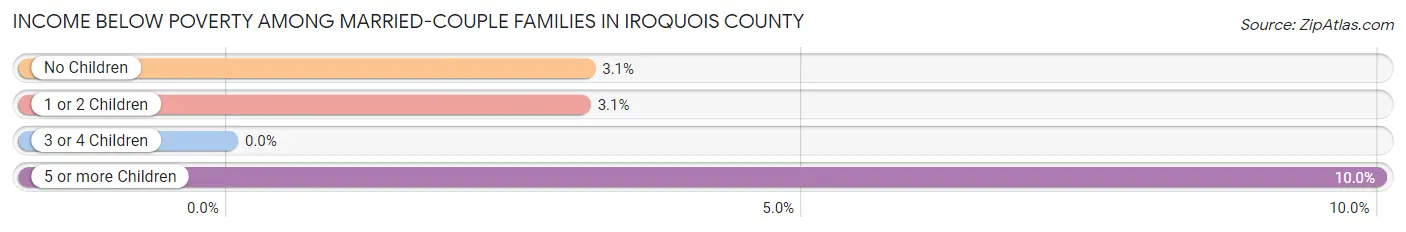
| Children | Above Poverty | Below Poverty |
| No Children | 3,494 (96.9%) | 112 (3.1%) |
| 1 or 2 Children | 1,485 (96.9%) | 47 (3.1%) |
| 3 or 4 Children | 439 (100.0%) | 0 (0.0%) |
| 5 or more Children | 27 (90.0%) | 3 (10.0%) |
| Total | 5,445 (97.1%) | 162 (2.9%) |
Income Below Poverty Among Single-Parent Households in Iroquois County
According to the poverty data in Iroquois County, 18.2% or 76 single-father households and 18.7% or 213 single-mother households are living below the poverty line. Among single-father households, those with 5 or more children have the highest poverty rate, with 5 households (100.0%) experiencing poverty. Likewise, among single-mother households, those with 5 or more children have the highest poverty rate, with 2 households (100.0%) falling below the poverty line.
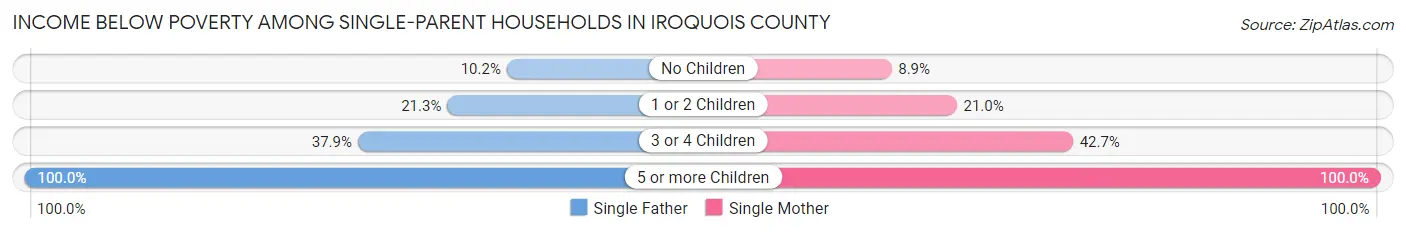
| Children | Single Father | Single Mother |
| No Children | 20 (10.2%) | 43 (8.9%) |
| 1 or 2 Children | 40 (21.3%) | 107 (21.0%) |
| 3 or 4 Children | 11 (37.9%) | 61 (42.7%) |
| 5 or more Children | 5 (100.0%) | 2 (100.0%) |
| Total | 76 (18.2%) | 213 (18.7%) |
Income Below Poverty Among Married-Couple vs Single-Parent Households in Iroquois County
The poverty data for Iroquois County shows that 162 of the married-couple family households (2.9%) and 289 of the single-parent households (18.6%) are living below the poverty level. Within the married-couple family households, those with 5 or more children have the highest poverty rate, with 3 households (10.0%) falling below the poverty line. Among the single-parent households, those with 5 or more children have the highest poverty rate, with 7 household (100.0%) living below poverty.
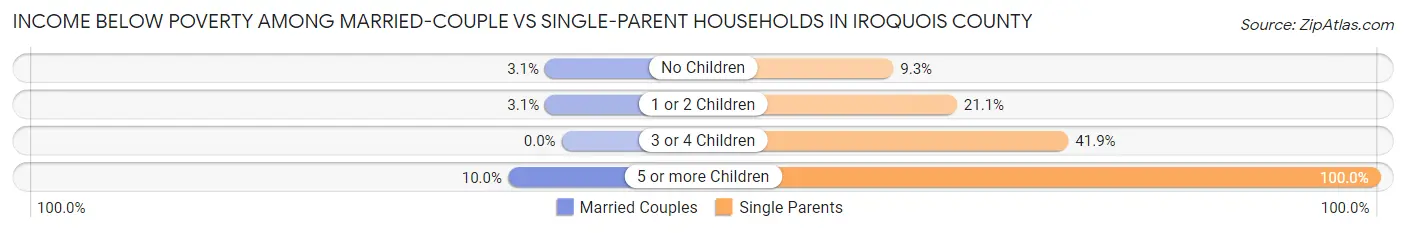
| Children | Married-Couple Families | Single-Parent Households |
| No Children | 112 (3.1%) | 63 (9.2%) |
| 1 or 2 Children | 47 (3.1%) | 147 (21.1%) |
| 3 or 4 Children | 0 (0.0%) | 72 (41.9%) |
| 5 or more Children | 3 (10.0%) | 7 (100.0%) |
| Total | 162 (2.9%) | 289 (18.6%) |
Race in Iroquois County
The most populous races in Iroquois County are White / Caucasian (24,509 | 90.6%), Hispanic or Latino (2,042 | 7.5%), and Some other Race (1,093 | 4.0%).
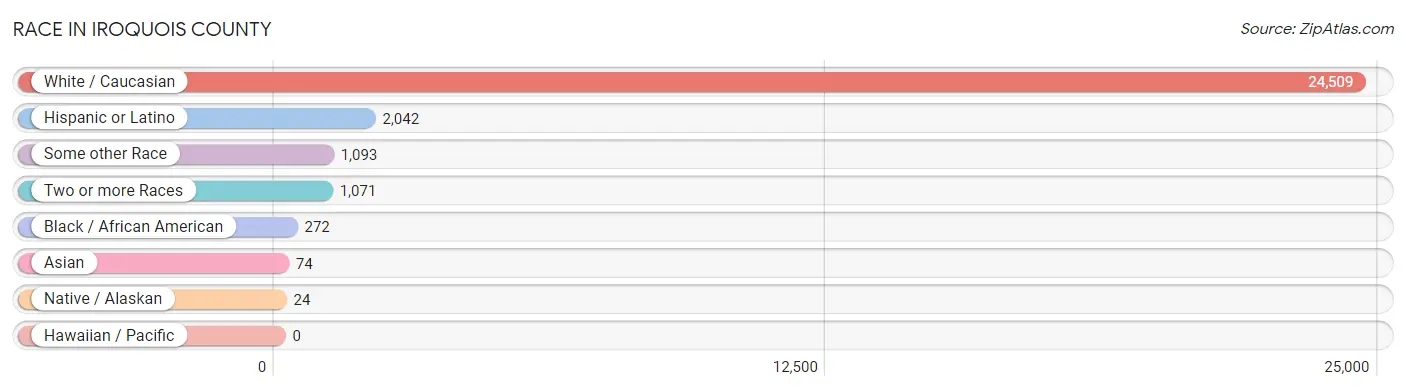
| Race | # Population | % Population |
| Asian | 74 | 0.3% |
| Black / African American | 272 | 1.0% |
| Hawaiian / Pacific | 0 | 0.0% |
| Hispanic or Latino | 2,042 | 7.5% |
| Native / Alaskan | 24 | 0.1% |
| White / Caucasian | 24,509 | 90.6% |
| Two or more Races | 1,071 | 4.0% |
| Some other Race | 1,093 | 4.0% |
| Total | 27,043 | 100.0% |
Ancestry in Iroquois County
The most populous ancestries reported in Iroquois County are German (8,838 | 32.7%), Irish (3,706 | 13.7%), English (2,529 | 9.3%), French (1,837 | 6.8%), and Mexican (1,728 | 6.4%), together accounting for 68.9% of all Iroquois County residents.
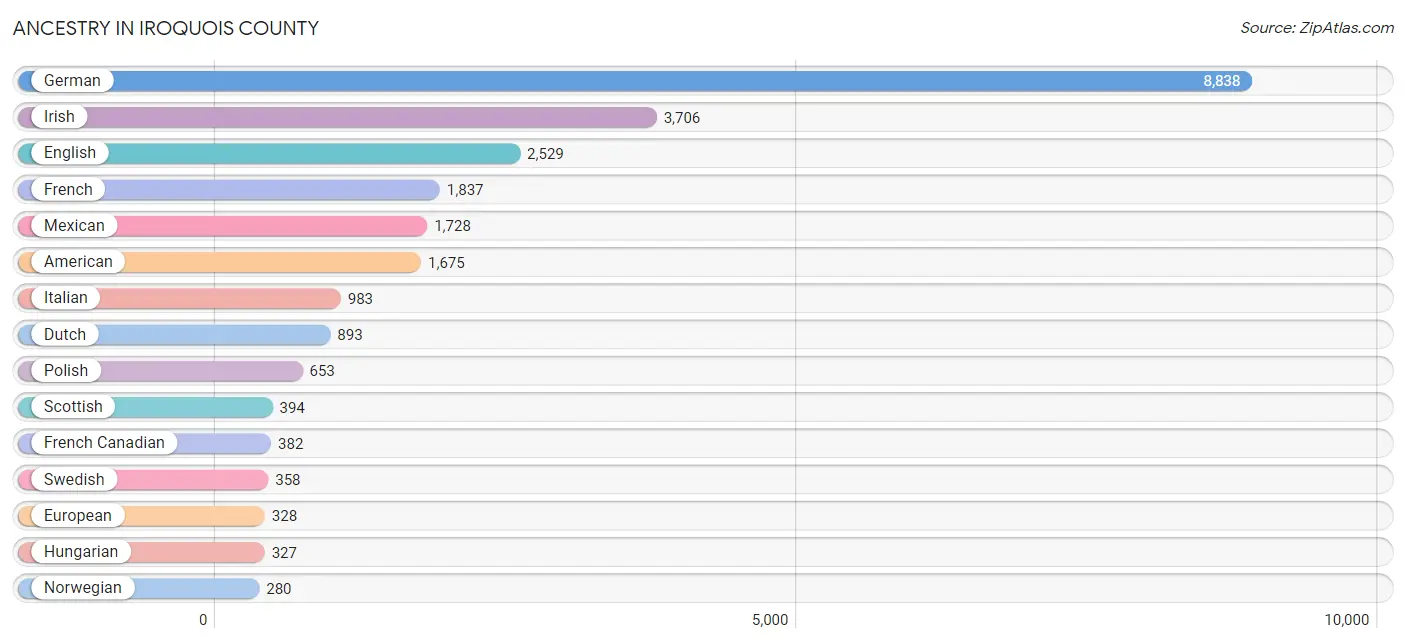
| Ancestry | # Population | % Population |
| African | 14 | 0.1% |
| Albanian | 44 | 0.2% |
| American | 1,675 | 6.2% |
| Apache | 7 | 0.0% |
| Armenian | 4 | 0.0% |
| Australian | 11 | 0.0% |
| Austrian | 18 | 0.1% |
| Barbadian | 24 | 0.1% |
| Belgian | 47 | 0.2% |
| Bhutanese | 9 | 0.0% |
| Blackfeet | 59 | 0.2% |
| British | 176 | 0.6% |
| Burmese | 27 | 0.1% |
| Cajun | 19 | 0.1% |
| Canadian | 13 | 0.1% |
| Central American | 117 | 0.4% |
| Cherokee | 43 | 0.2% |
| Choctaw | 2 | 0.0% |
| Colombian | 42 | 0.2% |
| Croatian | 18 | 0.1% |
| Cuban | 23 | 0.1% |
| Czech | 82 | 0.3% |
| Czechoslovakian | 22 | 0.1% |
| Danish | 133 | 0.5% |
| Dutch | 893 | 3.3% |
| Eastern European | 67 | 0.3% |
| Ecuadorian | 34 | 0.1% |
| English | 2,529 | 9.3% |
| European | 328 | 1.2% |
| French | 1,837 | 6.8% |
| French American Indian | 24 | 0.1% |
| French Canadian | 382 | 1.4% |
| German | 8,838 | 32.7% |
| Greek | 19 | 0.1% |
| Honduran | 5 | 0.0% |
| Hopi | 5 | 0.0% |
| Hungarian | 327 | 1.2% |
| Indian (Asian) | 2 | 0.0% |
| Irish | 3,706 | 13.7% |
| Italian | 983 | 3.6% |
| Korean | 145 | 0.5% |
| Lithuanian | 68 | 0.3% |
| Luxembourger | 57 | 0.2% |
| Macedonian | 21 | 0.1% |
| Mexican | 1,728 | 6.4% |
| Mexican American Indian | 4 | 0.0% |
| Native Hawaiian | 12 | 0.0% |
| Navajo | 5 | 0.0% |
| Northern European | 31 | 0.1% |
| Norwegian | 280 | 1.0% |
| Polish | 653 | 2.4% |
| Puerto Rican | 74 | 0.3% |
| Romanian | 7 | 0.0% |
| Russian | 130 | 0.5% |
| Salvadoran | 112 | 0.4% |
| Scandinavian | 143 | 0.5% |
| Scotch-Irish | 159 | 0.6% |
| Scottish | 394 | 1.5% |
| Sioux | 9 | 0.0% |
| Slovak | 29 | 0.1% |
| Slovene | 10 | 0.0% |
| South American | 76 | 0.3% |
| Spaniard | 10 | 0.0% |
| Subsaharan African | 14 | 0.1% |
| Swedish | 358 | 1.3% |
| Swiss | 132 | 0.5% |
| Thai | 11 | 0.0% |
| Ukrainian | 19 | 0.1% |
| Welsh | 200 | 0.7% |
| Yugoslavian | 9 | 0.0% | View All 70 Rows |
Immigrants in Iroquois County
The most numerous immigrant groups reported in Iroquois County came from Latin America (683 | 2.5%), Central America (632 | 2.3%), Mexico (601 | 2.2%), Europe (134 | 0.5%), and Asia (94 | 0.4%), together accounting for 7.9% of all Iroquois County residents.
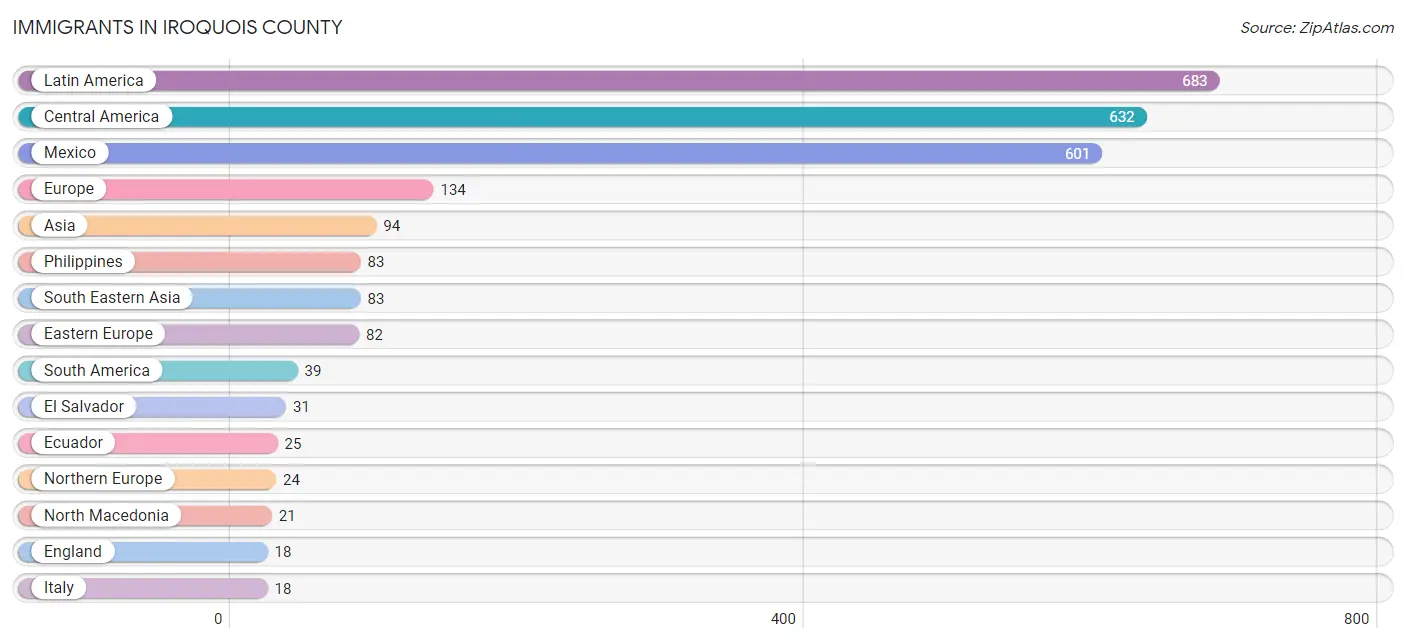
| Immigration Origin | # Population | % Population |
| Asia | 94 | 0.4% |
| Australia | 5 | 0.0% |
| Barbados | 12 | 0.0% |
| Brazil | 9 | 0.0% |
| Canada | 2 | 0.0% |
| Caribbean | 12 | 0.0% |
| Central America | 632 | 2.3% |
| Colombia | 5 | 0.0% |
| Croatia | 1 | 0.0% |
| Eastern Asia | 6 | 0.0% |
| Eastern Europe | 82 | 0.3% |
| Ecuador | 25 | 0.1% |
| El Salvador | 31 | 0.1% |
| England | 18 | 0.1% |
| Europe | 134 | 0.5% |
| France | 8 | 0.0% |
| Germany | 2 | 0.0% |
| India | 2 | 0.0% |
| Ireland | 6 | 0.0% |
| Italy | 18 | 0.1% |
| Japan | 1 | 0.0% |
| Korea | 5 | 0.0% |
| Latin America | 683 | 2.5% |
| Mexico | 601 | 2.2% |
| North Macedonia | 21 | 0.1% |
| Northern Europe | 24 | 0.1% |
| Oceania | 5 | 0.0% |
| Pakistan | 3 | 0.0% |
| Philippines | 83 | 0.3% |
| Poland | 14 | 0.1% |
| Russia | 2 | 0.0% |
| South America | 39 | 0.1% |
| South Central Asia | 5 | 0.0% |
| South Eastern Asia | 83 | 0.3% |
| Southern Europe | 18 | 0.1% |
| Western Europe | 10 | 0.0% | View All 36 Rows |
Sex and Age in Iroquois County
Sex and Age in Iroquois County
The most populous age groups in Iroquois County are 60 to 64 Years (1,060 | 7.9%) for men and 60 to 64 Years (1,162 | 8.5%) for women.
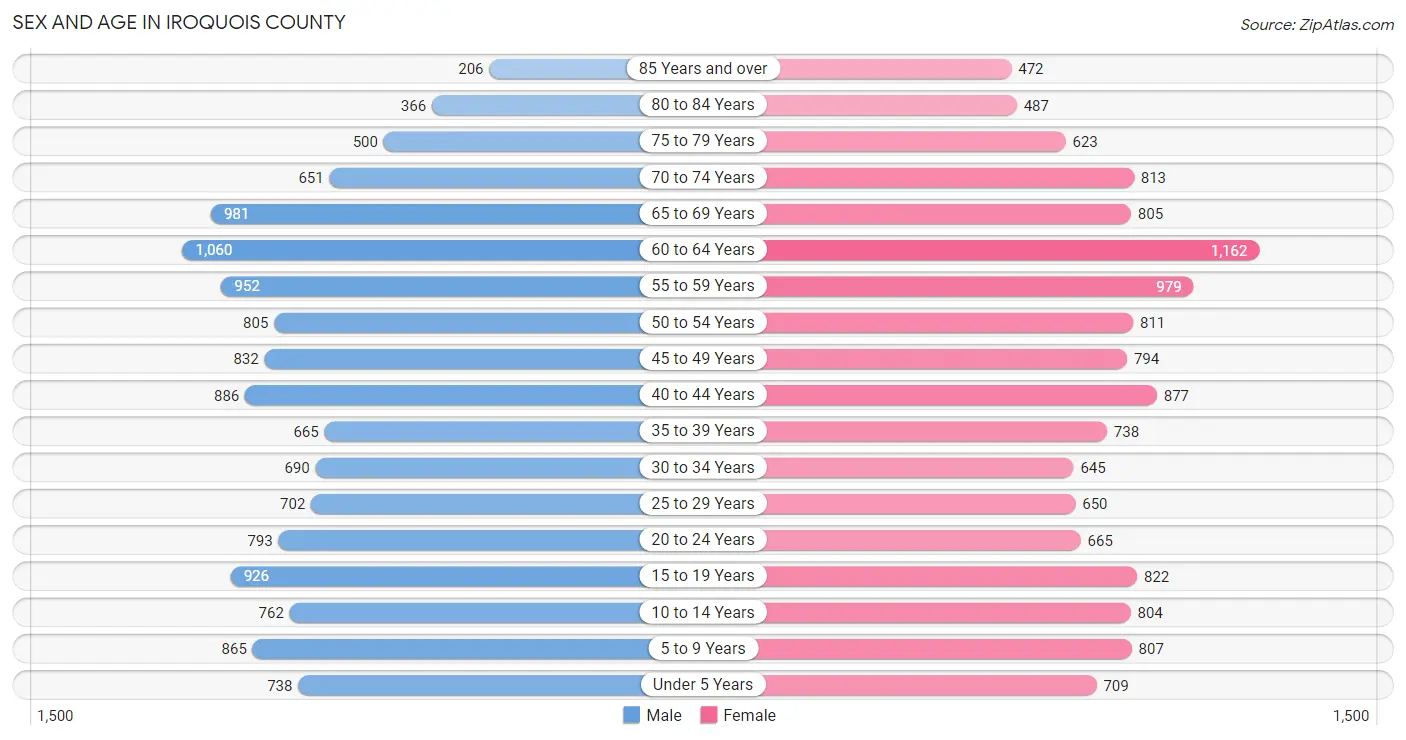
| Age Bracket | Male | Female |
| Under 5 Years | 738 (5.5%) | 709 (5.2%) |
| 5 to 9 Years | 865 (6.5%) | 807 (5.9%) |
| 10 to 14 Years | 762 (5.7%) | 804 (5.9%) |
| 15 to 19 Years | 926 (6.9%) | 822 (6.0%) |
| 20 to 24 Years | 793 (5.9%) | 665 (4.9%) |
| 25 to 29 Years | 702 (5.2%) | 650 (4.8%) |
| 30 to 34 Years | 690 (5.2%) | 645 (4.7%) |
| 35 to 39 Years | 665 (5.0%) | 738 (5.4%) |
| 40 to 44 Years | 886 (6.6%) | 877 (6.4%) |
| 45 to 49 Years | 832 (6.2%) | 794 (5.8%) |
| 50 to 54 Years | 805 (6.0%) | 811 (5.9%) |
| 55 to 59 Years | 952 (7.1%) | 979 (7.2%) |
| 60 to 64 Years | 1,060 (7.9%) | 1,162 (8.5%) |
| 65 to 69 Years | 981 (7.3%) | 805 (5.9%) |
| 70 to 74 Years | 651 (4.9%) | 813 (5.9%) |
| 75 to 79 Years | 500 (3.7%) | 623 (4.6%) |
| 80 to 84 Years | 366 (2.7%) | 487 (3.6%) |
| 85 Years and over | 206 (1.5%) | 472 (3.5%) |
| Total | 13,380 (100.0%) | 13,663 (100.0%) |
Families and Households in Iroquois County
Median Family Size in Iroquois County
The median family size in Iroquois County is 2.89 persons per family, with married-couple families (5,607 | 78.3%) accounting for the largest median family size of 2.94 persons per family. On the other hand, single male/father families (418 | 5.8%) represent the smallest median family size with 2.66 persons per family.
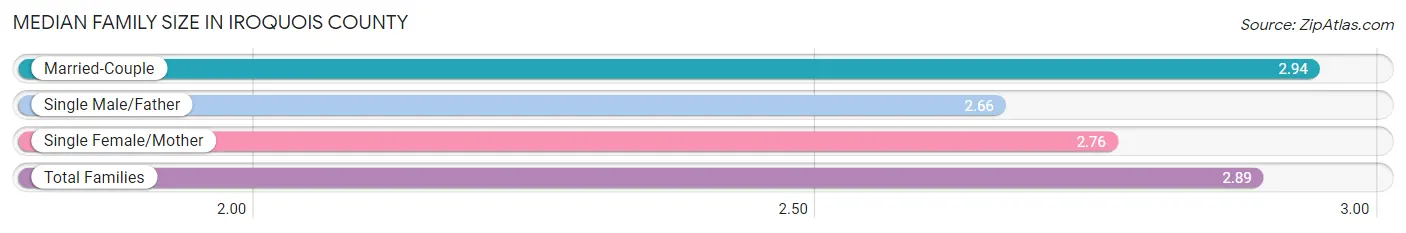
| Family Type | # Families | Family Size |
| Married-Couple | 5,607 (78.3%) | 2.94 |
| Single Male/Father | 418 (5.8%) | 2.66 |
| Single Female/Mother | 1,139 (15.9%) | 2.76 |
| Total Families | 7,164 (100.0%) | 2.89 |
Median Household Size in Iroquois County
The median household size in Iroquois County is 2.37 persons per household, with single male/father households (418 | 3.7%) accounting for the largest median household size of 3.13 persons per household. non-family households (4,053 | 36.1%) represent the smallest median household size with 1.31 persons per household.
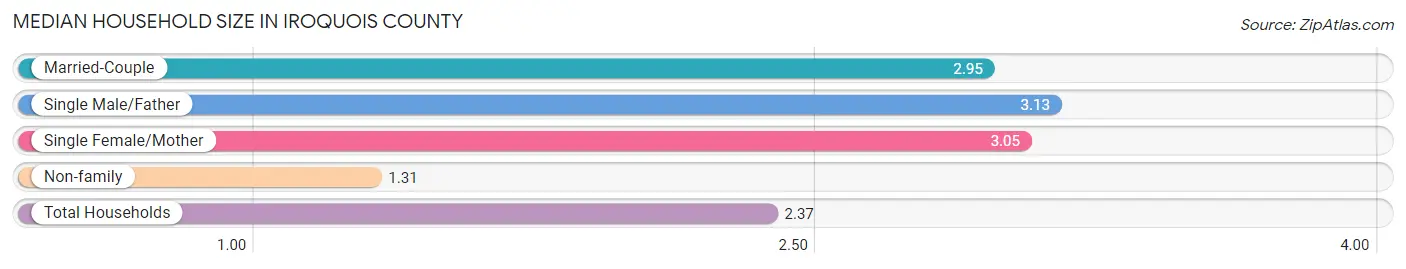
| Household Type | # Households | Household Size |
| Married-Couple | 5,607 (50.0%) | 2.95 |
| Single Male/Father | 418 (3.7%) | 3.13 |
| Single Female/Mother | 1,139 (10.2%) | 3.05 |
| Non-family | 4,053 (36.1%) | 1.31 |
| Total Households | 11,217 (100.0%) | 2.37 |
Household Size by Marriage Status in Iroquois County
Out of a total of 11,217 households in Iroquois County, 7,164 (63.9%) are family households, while 4,053 (36.1%) are nonfamily households. The most numerous type of family households are 2-person households, comprising 3,757, and the most common type of nonfamily households are 1-person households, comprising 3,487.
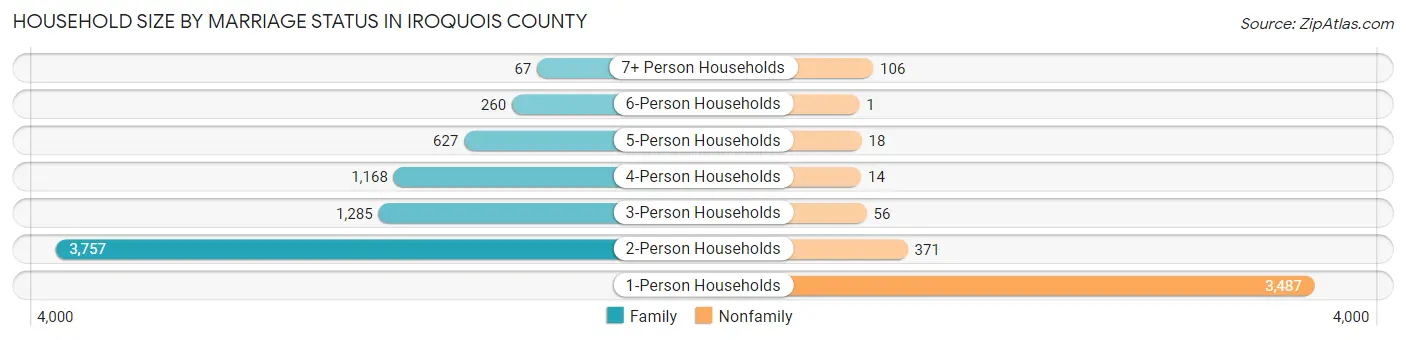
| Household Size | Family Households | Nonfamily Households |
| 1-Person Households | - | 3,487 (31.1%) |
| 2-Person Households | 3,757 (33.5%) | 371 (3.3%) |
| 3-Person Households | 1,285 (11.5%) | 56 (0.5%) |
| 4-Person Households | 1,168 (10.4%) | 14 (0.1%) |
| 5-Person Households | 627 (5.6%) | 18 (0.2%) |
| 6-Person Households | 260 (2.3%) | 1 (0.0%) |
| 7+ Person Households | 67 (0.6%) | 106 (0.9%) |
| Total | 7,164 (63.9%) | 4,053 (36.1%) |
Female Fertility in Iroquois County
Fertility by Age in Iroquois County
Average fertility rate in Iroquois County is 45.0 births per 1,000 women. Women in the age bracket of 20 to 34 years have the highest fertility rate with 90.0 births per 1,000 women. Women in the age bracket of 20 to 34 years acount for 74.1% of all women with births.
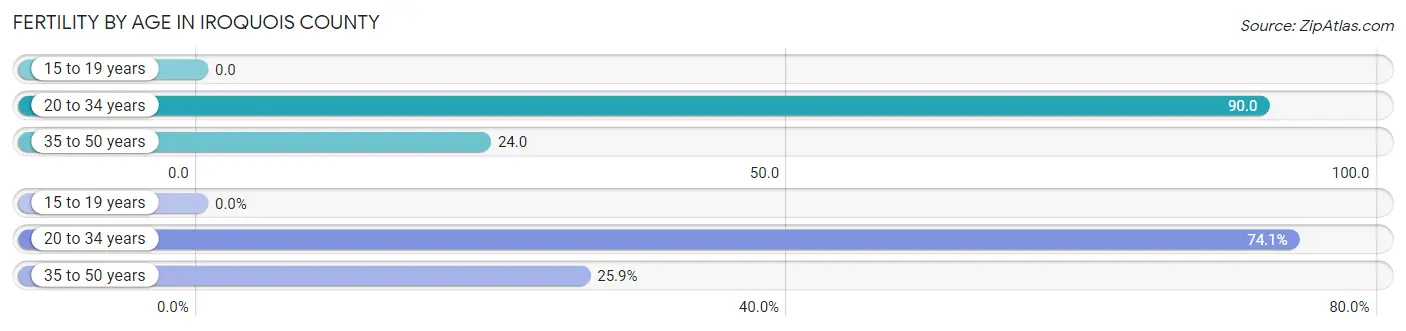
| Age Bracket | Women with Births | Births / 1,000 Women |
| 15 to 19 years | 0 (0.0%) | 0.0 |
| 20 to 34 years | 177 (74.1%) | 90.0 |
| 35 to 50 years | 62 (25.9%) | 24.0 |
| Total | 239 (100.0%) | 45.0 |
Fertility by Age by Marriage Status in Iroquois County
72.4% of women with births (239) in Iroquois County are married. The highest percentage of unmarried women with births falls into 20 to 34 years age bracket with 36.7% of them unmarried at the time of birth, while the lowest percentage of unmarried women with births belong to 35 to 50 years age bracket with 1.6% of them unmarried.
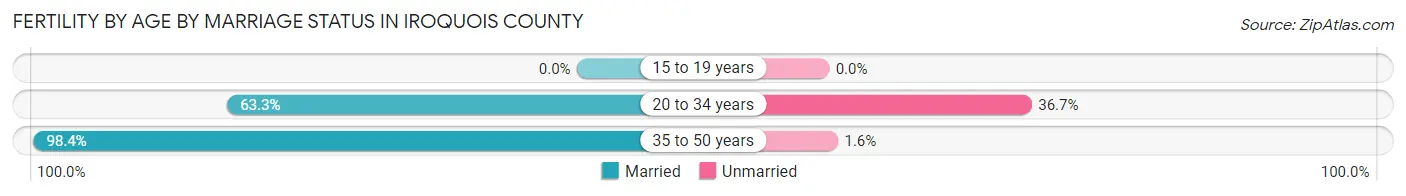
| Age Bracket | Married | Unmarried |
| 15 to 19 years | 0 (0.0%) | 0 (0.0%) |
| 20 to 34 years | 112 (63.3%) | 65 (36.7%) |
| 35 to 50 years | 61 (98.4%) | 1 (1.6%) |
| Total | 173 (72.4%) | 66 (27.6%) |
Fertility by Education in Iroquois County
Average fertility rate in Iroquois County is 45.0 births per 1,000 women. Women with the education attainment of bachelor's degree have the highest fertility rate of 75.0 births per 1,000 women, while women with the education attainment of graduate degree have the lowest fertility at 19.0 births per 1,000 women. Women with the education attainment of college or associate's degree represent 36.4% of all women with births.
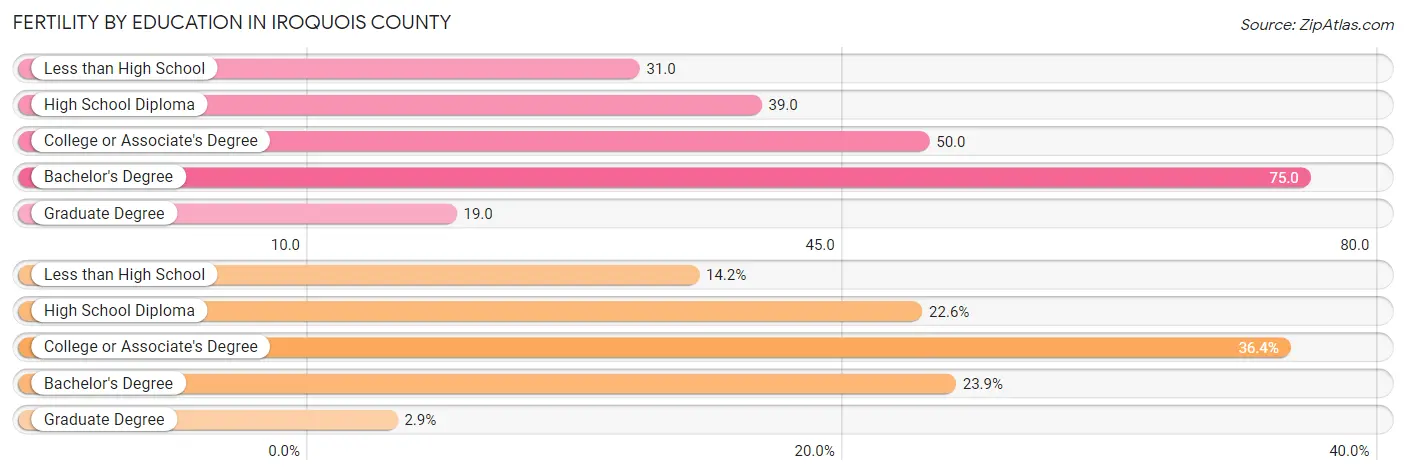
| Educational Attainment | Women with Births | Births / 1,000 Women |
| Less than High School | 34 (14.2%) | 31.0 |
| High School Diploma | 54 (22.6%) | 39.0 |
| College or Associate's Degree | 87 (36.4%) | 50.0 |
| Bachelor's Degree | 57 (23.8%) | 75.0 |
| Graduate Degree | 7 (2.9%) | 19.0 |
| Total | 239 (100.0%) | 45.0 |
Fertility by Education by Marriage Status in Iroquois County
27.6% of women with births in Iroquois County are unmarried. Women with the educational attainment of bachelor's degree are most likely to be married with 100.0% of them married at childbirth, while women with the educational attainment of less than high school are least likely to be married with 44.1% of them unmarried at childbirth.
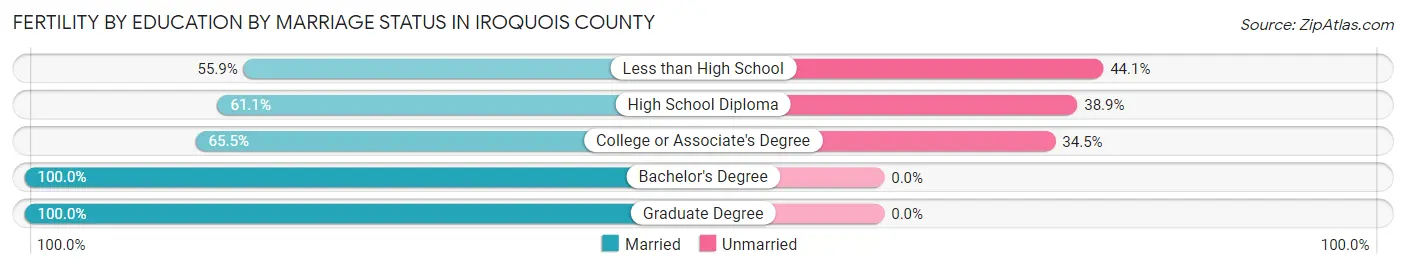
| Educational Attainment | Married | Unmarried |
| Less than High School | 19 (55.9%) | 15 (44.1%) |
| High School Diploma | 33 (61.1%) | 21 (38.9%) |
| College or Associate's Degree | 57 (65.5%) | 30 (34.5%) |
| Bachelor's Degree | 57 (100.0%) | 0 (0.0%) |
| Graduate Degree | 7 (100.0%) | 0 (0.0%) |
| Total | 173 (72.4%) | 66 (27.6%) |
Employment Characteristics in Iroquois County
Employment by Class of Employer in Iroquois County
Among the 12,171 employed individuals in Iroquois County, private company employees (8,231 | 67.6%), self-employed (not incorporated) (1,051 | 8.6%), and not-for-profit organizations (1,027 | 8.4%) make up the most common classes of employment.
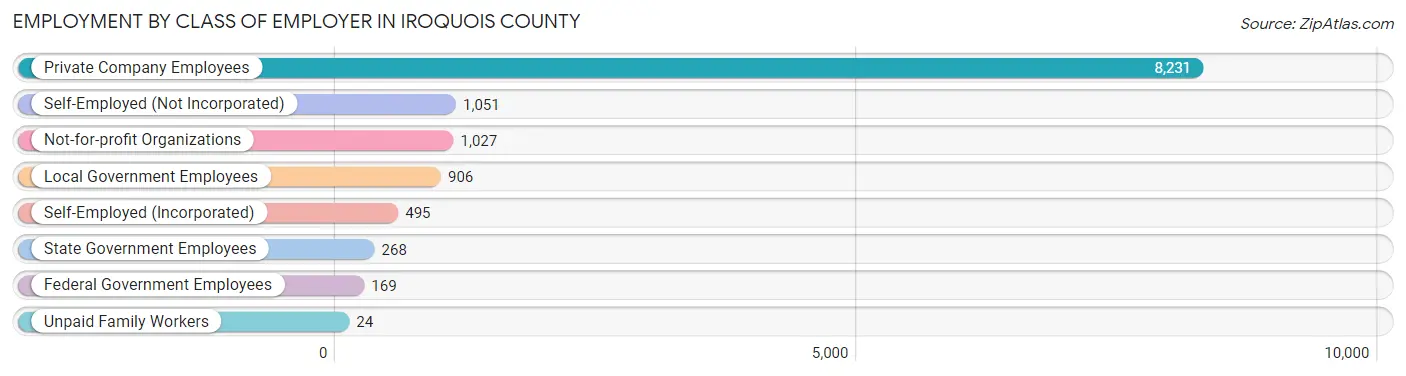
| Employer Class | # Employees | % Employees |
| Private Company Employees | 8,231 | 67.6% |
| Self-Employed (Incorporated) | 495 | 4.1% |
| Self-Employed (Not Incorporated) | 1,051 | 8.6% |
| Not-for-profit Organizations | 1,027 | 8.4% |
| Local Government Employees | 906 | 7.4% |
| State Government Employees | 268 | 2.2% |
| Federal Government Employees | 169 | 1.4% |
| Unpaid Family Workers | 24 | 0.2% |
| Total | 12,171 | 100.0% |
Employment Status by Age in Iroquois County
According to the labor force statistics for Iroquois County, out of the total population over 16 years of age (22,046), 58.9% or 12,985 individuals are in the labor force, with 4.9% or 636 of them unemployed. The age group with the highest labor force participation rate is 30 to 34 years, with 85.2% or 1,137 individuals in the labor force. Within the labor force, the 16 to 19 years age range has the highest percentage of unemployed individuals, with 15.3% or 104 of them being unemployed.
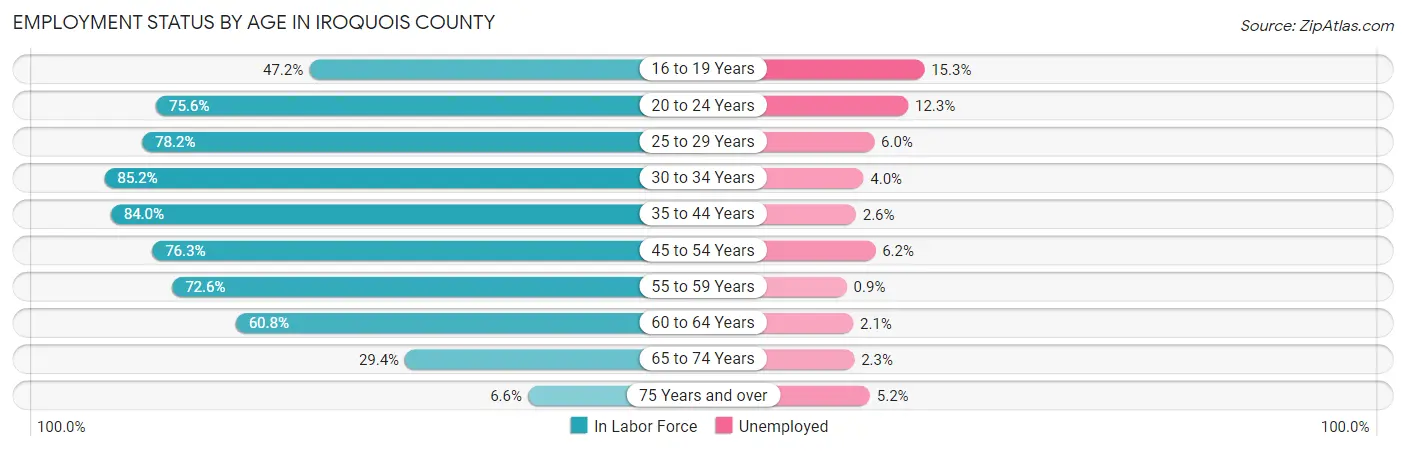
| Age Bracket | In Labor Force | Unemployed |
| 16 to 19 Years | 678 (47.2%) | 104 (15.3%) |
| 20 to 24 Years | 1,102 (75.6%) | 136 (12.3%) |
| 25 to 29 Years | 1,057 (78.2%) | 63 (6.0%) |
| 30 to 34 Years | 1,137 (85.2%) | 45 (4.0%) |
| 35 to 44 Years | 2,659 (84.0%) | 69 (2.6%) |
| 45 to 54 Years | 2,474 (76.3%) | 153 (6.2%) |
| 55 to 59 Years | 1,402 (72.6%) | 13 (0.9%) |
| 60 to 64 Years | 1,351 (60.8%) | 28 (2.1%) |
| 65 to 74 Years | 956 (29.4%) | 22 (2.3%) |
| 75 Years and over | 175 (6.6%) | 9 (5.2%) |
| Total | 12,985 (58.9%) | 636 (4.9%) |
Employment Status by Educational Attainment in Iroquois County
According to labor force statistics for Iroquois County, 76.1% of individuals (10,082) out of the total population between 25 and 64 years of age (13,248) are in the labor force, with 3.7% or 373 of them being unemployed. The group with the highest labor force participation rate are those with the educational attainment of bachelor's degree or higher, with 83.9% or 2,040 individuals in the labor force. Within the labor force, individuals with less than high school education have the highest percentage of unemployment, with 13.6% or 115 of them being unemployed.
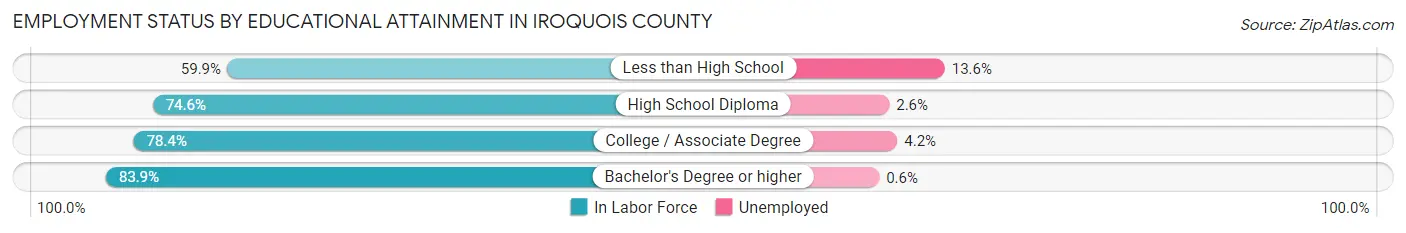
| Educational Attainment | In Labor Force | Unemployed |
| Less than High School | 846 (59.9%) | 192 (13.6%) |
| High School Diploma | 3,549 (74.6%) | 124 (2.6%) |
| College / Associate Degree | 3,643 (78.4%) | 195 (4.2%) |
| Bachelor's Degree or higher | 2,040 (83.9%) | 15 (0.6%) |
| Total | 10,082 (76.1%) | 490 (3.7%) |
Employment Occupations by Sex in Iroquois County
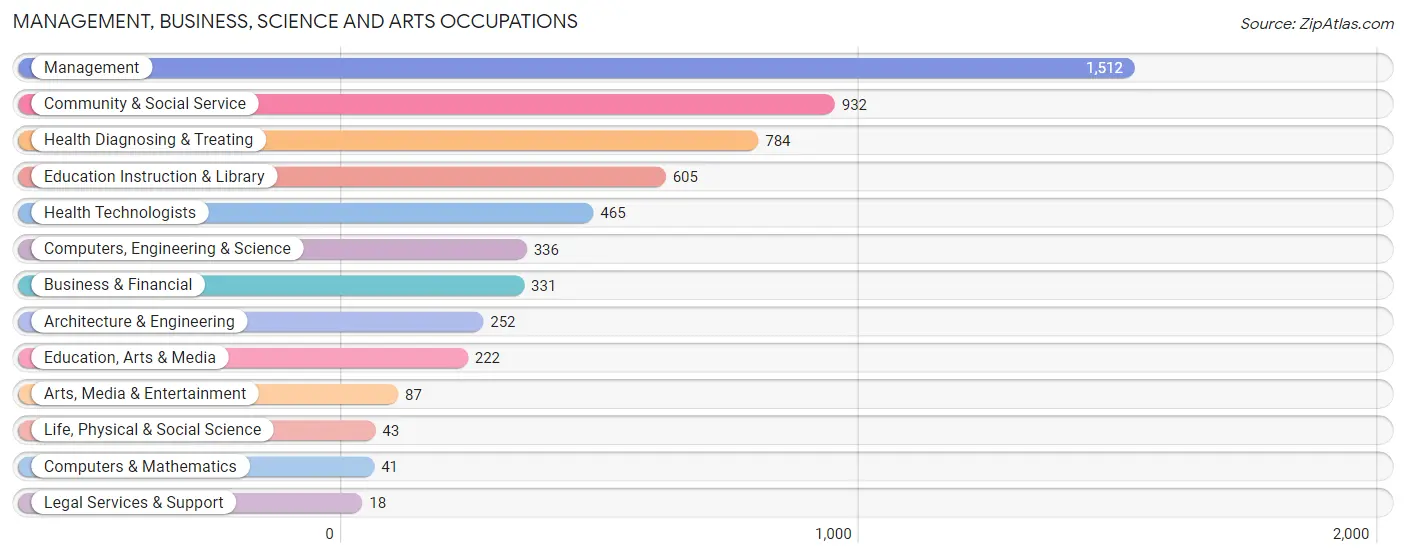
Management, Business, Science and Arts Occupations
The most common Management, Business, Science and Arts occupations in Iroquois County are Management (1,512 | 12.2%), Community & Social Service (932 | 7.5%), Health Diagnosing & Treating (784 | 6.4%), Education Instruction & Library (605 | 4.9%), and Health Technologists (465 | 3.8%).
Management, Business, Science and Arts Occupations by Sex
Within the Management, Business, Science and Arts occupations in Iroquois County, the most male-oriented occupations are Architecture & Engineering (90.1%), Computers & Mathematics (85.4%), and Computers, Engineering & Science (85.1%), while the most female-oriented occupations are Health Technologists (94.6%), Health Diagnosing & Treating (89.5%), and Education Instruction & Library (78.5%).

| Occupation | Male | Female |
| Management | 944 (62.4%) | 568 (37.6%) |
| Business & Financial | 144 (43.5%) | 187 (56.5%) |
| Computers, Engineering & Science | 286 (85.1%) | 50 (14.9%) |
| Computers & Mathematics | 35 (85.4%) | 6 (14.6%) |
| Architecture & Engineering | 227 (90.1%) | 25 (9.9%) |
| Life, Physical & Social Science | 24 (55.8%) | 19 (44.2%) |
| Community & Social Service | 245 (26.3%) | 687 (73.7%) |
| Education, Arts & Media | 68 (30.6%) | 154 (69.4%) |
| Legal Services & Support | 8 (44.4%) | 10 (55.6%) |
| Education Instruction & Library | 130 (21.5%) | 475 (78.5%) |
| Arts, Media & Entertainment | 39 (44.8%) | 48 (55.2%) |
| Health Diagnosing & Treating | 82 (10.5%) | 702 (89.5%) |
| Health Technologists | 25 (5.4%) | 440 (94.6%) |
| Total (Category) | 1,701 (43.7%) | 2,194 (56.3%) |
| Total (Overall) | 6,690 (54.2%) | 5,658 (45.8%) |
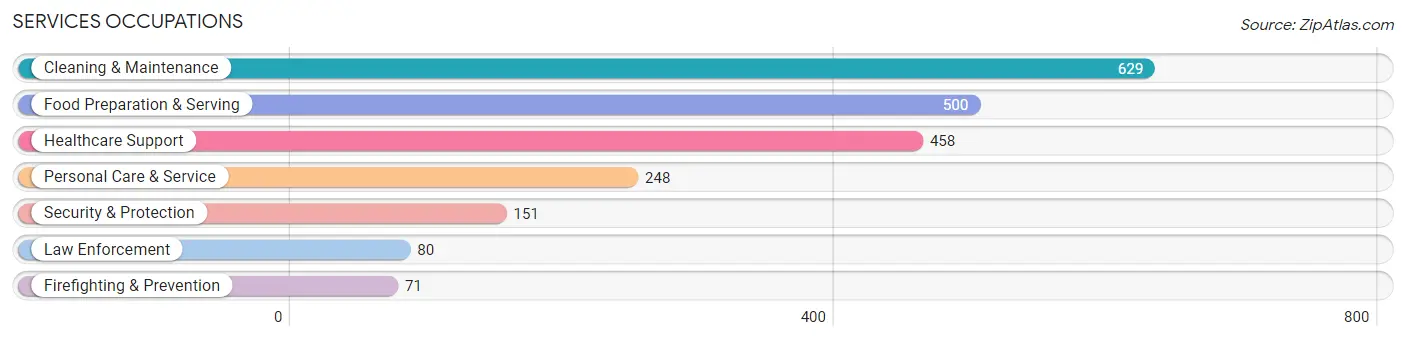
Services Occupations
The most common Services occupations in Iroquois County are Cleaning & Maintenance (629 | 5.1%), Food Preparation & Serving (500 | 4.1%), Healthcare Support (458 | 3.7%), Personal Care & Service (248 | 2.0%), and Security & Protection (151 | 1.2%).
Services Occupations by Sex
Within the Services occupations in Iroquois County, the most male-oriented occupations are Law Enforcement (100.0%), Security & Protection (98.0%), and Firefighting & Prevention (95.8%), while the most female-oriented occupations are Healthcare Support (97.8%), Personal Care & Service (87.1%), and Food Preparation & Serving (62.4%).
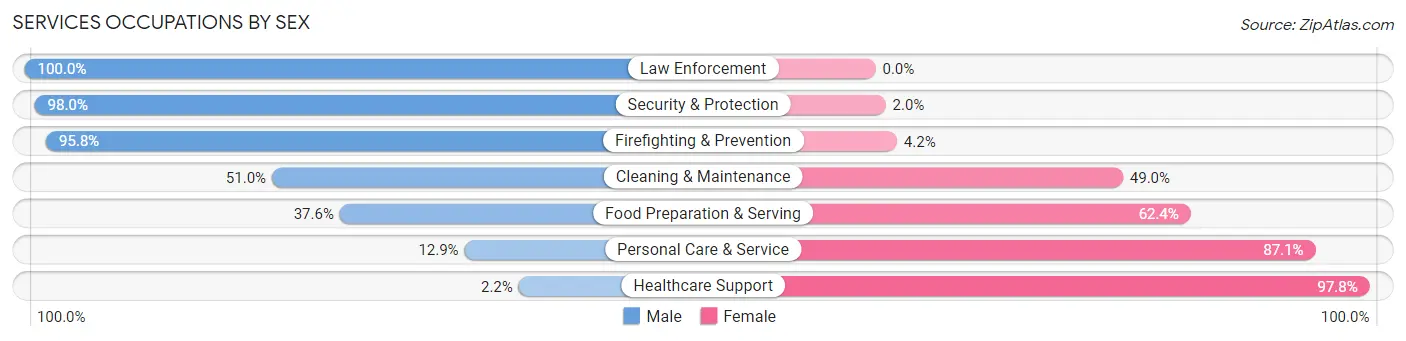
| Occupation | Male | Female |
| Healthcare Support | 10 (2.2%) | 448 (97.8%) |
| Security & Protection | 148 (98.0%) | 3 (2.0%) |
| Firefighting & Prevention | 68 (95.8%) | 3 (4.2%) |
| Law Enforcement | 80 (100.0%) | 0 (0.0%) |
| Food Preparation & Serving | 188 (37.6%) | 312 (62.4%) |
| Cleaning & Maintenance | 321 (51.0%) | 308 (49.0%) |
| Personal Care & Service | 32 (12.9%) | 216 (87.1%) |
| Total (Category) | 699 (35.2%) | 1,287 (64.8%) |
| Total (Overall) | 6,690 (54.2%) | 5,658 (45.8%) |
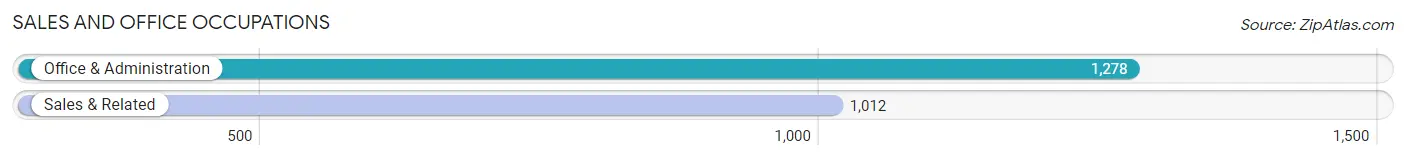
Sales and Office Occupations
The most common Sales and Office occupations in Iroquois County are Office & Administration (1,278 | 10.3%), and Sales & Related (1,012 | 8.2%).
Sales and Office Occupations by Sex
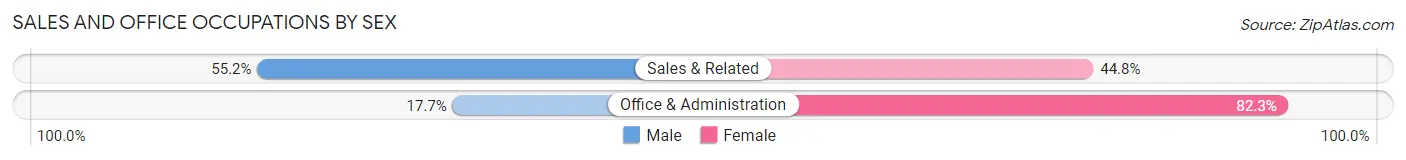
| Occupation | Male | Female |
| Sales & Related | 559 (55.2%) | 453 (44.8%) |
| Office & Administration | 226 (17.7%) | 1,052 (82.3%) |
| Total (Category) | 785 (34.3%) | 1,505 (65.7%) |
| Total (Overall) | 6,690 (54.2%) | 5,658 (45.8%) |
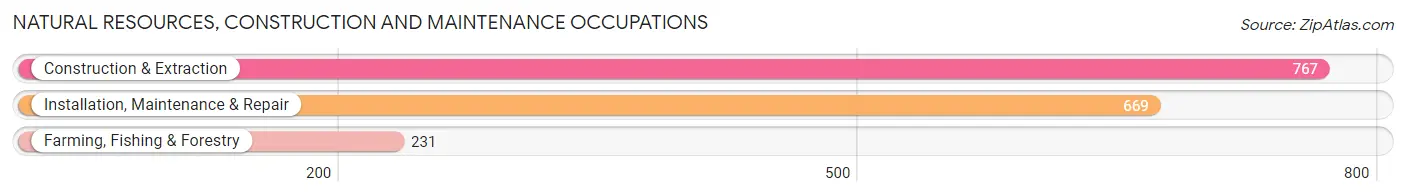
Natural Resources, Construction and Maintenance Occupations
The most common Natural Resources, Construction and Maintenance occupations in Iroquois County are Construction & Extraction (767 | 6.2%), Installation, Maintenance & Repair (669 | 5.4%), and Farming, Fishing & Forestry (231 | 1.9%).
Natural Resources, Construction and Maintenance Occupations by Sex
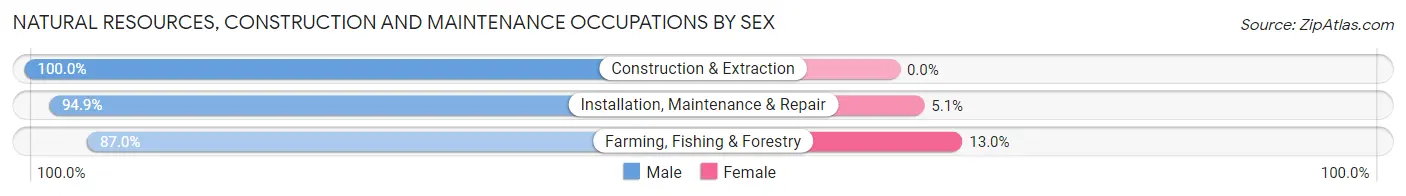
| Occupation | Male | Female |
| Farming, Fishing & Forestry | 201 (87.0%) | 30 (13.0%) |
| Construction & Extraction | 767 (100.0%) | 0 (0.0%) |
| Installation, Maintenance & Repair | 635 (94.9%) | 34 (5.1%) |
| Total (Category) | 1,603 (96.2%) | 64 (3.8%) |
| Total (Overall) | 6,690 (54.2%) | 5,658 (45.8%) |
Production, Transportation and Moving Occupations
The most common Production, Transportation and Moving occupations in Iroquois County are Material Moving (937 | 7.6%), Production (824 | 6.7%), and Transportation (749 | 6.1%).
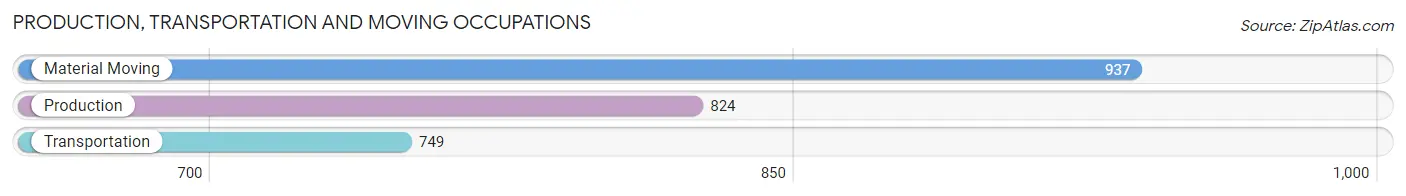
Production, Transportation and Moving Occupations by Sex
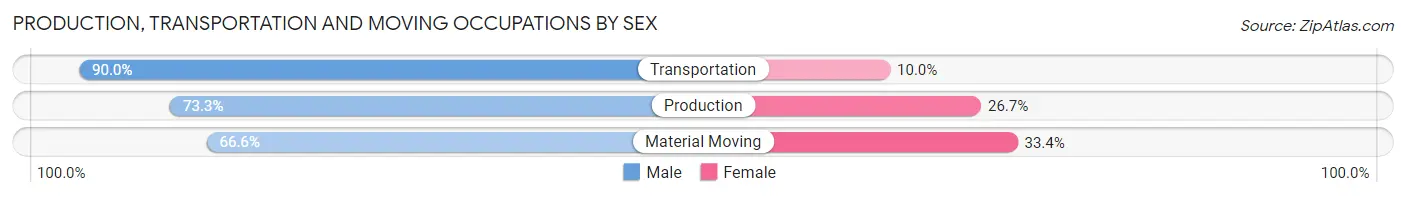
| Occupation | Male | Female |
| Production | 604 (73.3%) | 220 (26.7%) |
| Transportation | 674 (90.0%) | 75 (10.0%) |
| Material Moving | 624 (66.6%) | 313 (33.4%) |
| Total (Category) | 1,902 (75.8%) | 608 (24.2%) |
| Total (Overall) | 6,690 (54.2%) | 5,658 (45.8%) |
Employment Industries by Sex in Iroquois County
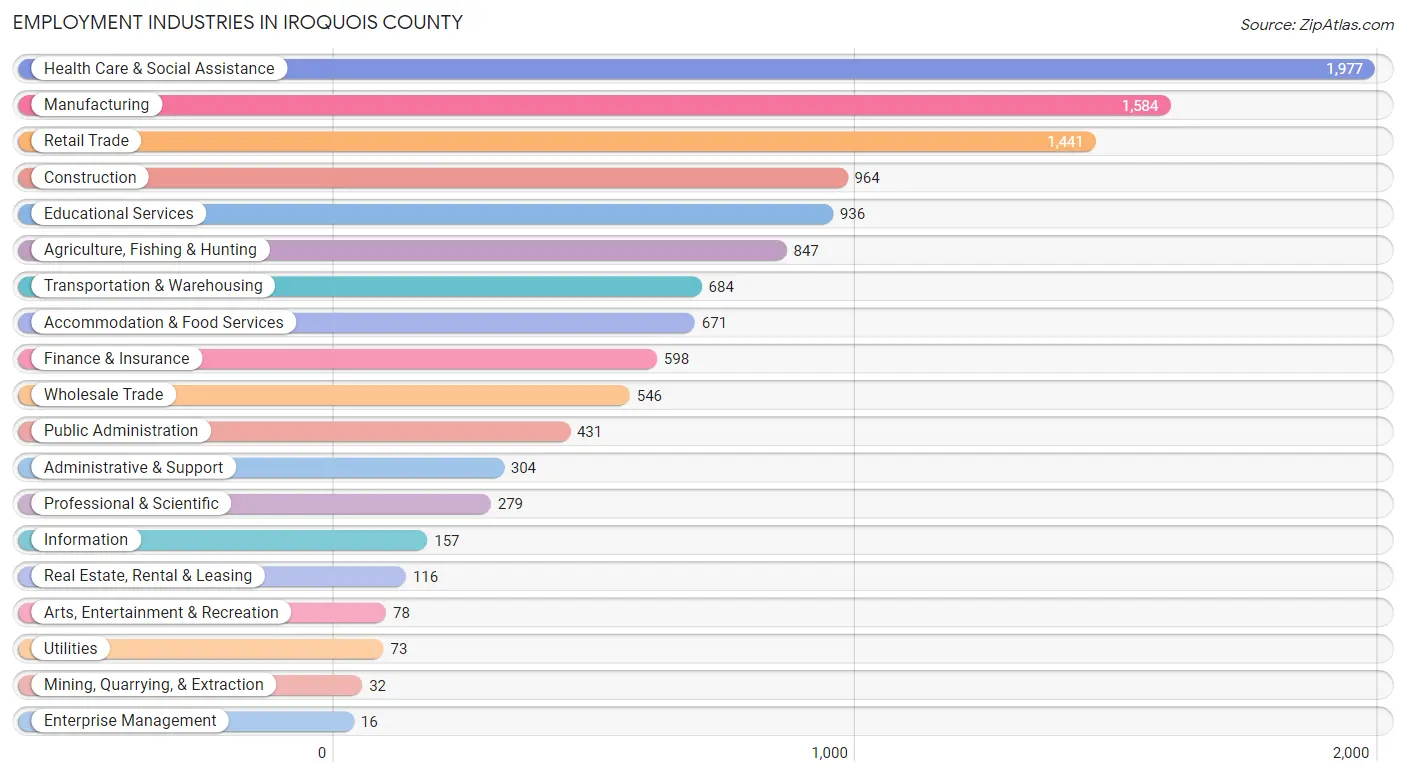
Employment Industries in Iroquois County
The major employment industries in Iroquois County include Health Care & Social Assistance (1,977 | 16.0%), Manufacturing (1,584 | 12.8%), Retail Trade (1,441 | 11.7%), Construction (964 | 7.8%), and Educational Services (936 | 7.6%).
Employment Industries by Sex in Iroquois County
The Iroquois County industries that see more men than women are Utilities (95.9%), Construction (92.2%), and Mining, Quarrying, & Extraction (90.6%), whereas the industries that tend to have a higher number of women are Enterprise Management (100.0%), Health Care & Social Assistance (87.7%), and Finance & Insurance (81.6%).
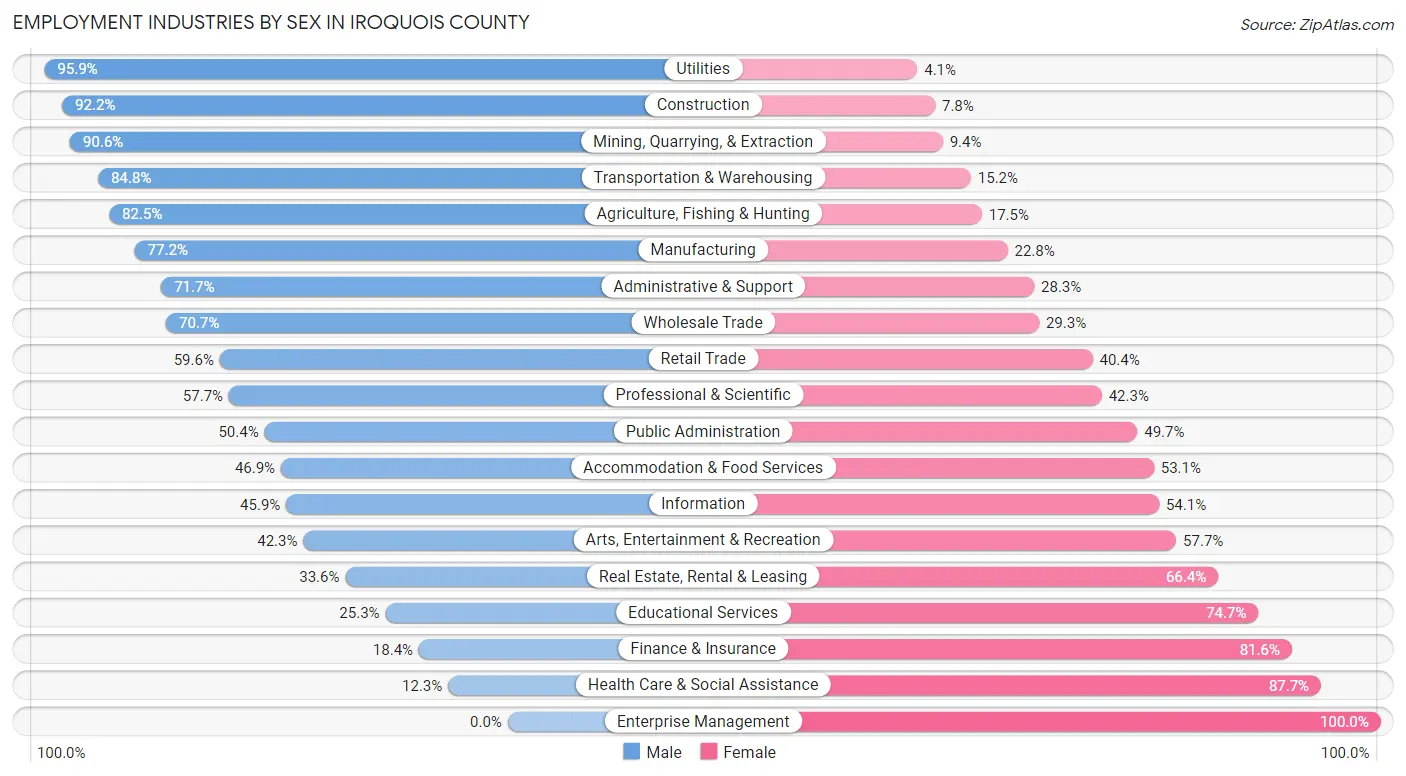
| Industry | Male | Female |
| Agriculture, Fishing & Hunting | 699 (82.5%) | 148 (17.5%) |
| Mining, Quarrying, & Extraction | 29 (90.6%) | 3 (9.4%) |
| Construction | 889 (92.2%) | 75 (7.8%) |
| Manufacturing | 1,223 (77.2%) | 361 (22.8%) |
| Wholesale Trade | 386 (70.7%) | 160 (29.3%) |
| Retail Trade | 859 (59.6%) | 582 (40.4%) |
| Transportation & Warehousing | 580 (84.8%) | 104 (15.2%) |
| Utilities | 70 (95.9%) | 3 (4.1%) |
| Information | 72 (45.9%) | 85 (54.1%) |
| Finance & Insurance | 110 (18.4%) | 488 (81.6%) |
| Real Estate, Rental & Leasing | 39 (33.6%) | 77 (66.4%) |
| Professional & Scientific | 161 (57.7%) | 118 (42.3%) |
| Enterprise Management | 0 (0.0%) | 16 (100.0%) |
| Administrative & Support | 218 (71.7%) | 86 (28.3%) |
| Educational Services | 237 (25.3%) | 699 (74.7%) |
| Health Care & Social Assistance | 244 (12.3%) | 1,733 (87.7%) |
| Arts, Entertainment & Recreation | 33 (42.3%) | 45 (57.7%) |
| Accommodation & Food Services | 315 (46.9%) | 356 (53.1%) |
| Public Administration | 217 (50.3%) | 214 (49.6%) |
| Total | 6,690 (54.2%) | 5,658 (45.8%) |
Education in Iroquois County
School Enrollment in Iroquois County
The most common levels of schooling among the 5,544 students in Iroquois County are high school (1,604 | 28.9%), middle school (1,230 | 22.2%), and elementary school (1,209 | 21.8%).
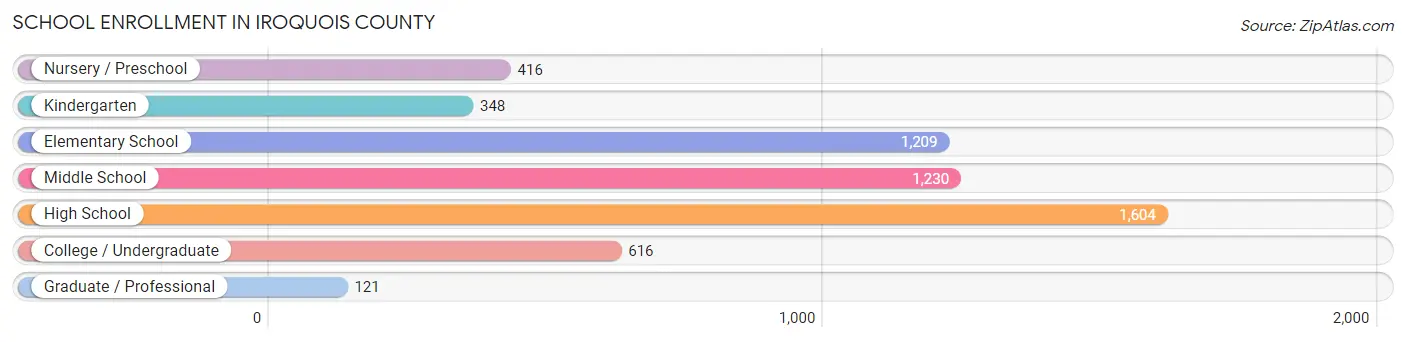
| School Level | # Students | % Students |
| Nursery / Preschool | 416 | 7.5% |
| Kindergarten | 348 | 6.3% |
| Elementary School | 1,209 | 21.8% |
| Middle School | 1,230 | 22.2% |
| High School | 1,604 | 28.9% |
| College / Undergraduate | 616 | 11.1% |
| Graduate / Professional | 121 | 2.2% |
| Total | 5,544 | 100.0% |
School Enrollment by Age by Funding Source in Iroquois County
Out of a total of 5,544 students who are enrolled in schools in Iroquois County, 687 (12.4%) attend a private institution, while the remaining 4,857 (87.6%) are enrolled in public schools. The age group of 3 to 4 year olds has the highest likelihood of being enrolled in private schools, with 133 (53.2% in the age bracket) enrolled. Conversely, the age group of 15 to 17 year olds has the lowest likelihood of being enrolled in a private school, with 1,049 (93.6% in the age bracket) attending a public institution.
| Age Bracket | Public School | Private School |
| 3 to 4 Year Olds | 117 (46.8%) | 133 (53.2%) |
| 5 to 9 Year Old | 1,378 (86.8%) | 209 (13.2%) |
| 10 to 14 Year Olds | 1,457 (93.3%) | 105 (6.7%) |
| 15 to 17 Year Olds | 1,049 (93.6%) | 72 (6.4%) |
| 18 to 19 Year Olds | 390 (93.5%) | 27 (6.5%) |
| 20 to 24 Year Olds | 204 (83.6%) | 40 (16.4%) |
| 25 to 34 Year Olds | 109 (91.6%) | 10 (8.4%) |
| 35 Years and over | 152 (62.3%) | 92 (37.7%) |
| Total | 4,857 (87.6%) | 687 (12.4%) |
Educational Attainment by Field of Study in Iroquois County
Education (940 | 26.4%), business (562 | 15.8%), science & technology (400 | 11.2%), bio, nature & agricultural (321 | 9.0%), and arts & humanities (214 | 6.0%) are the most common fields of study among 3,563 individuals in Iroquois County who have obtained a bachelor's degree or higher.
| Field of Study | # Graduates | % Graduates |
| Computers & Mathematics | 115 | 3.2% |
| Bio, Nature & Agricultural | 321 | 9.0% |
| Physical & Health Sciences | 64 | 1.8% |
| Psychology | 109 | 3.1% |
| Social Sciences | 167 | 4.7% |
| Engineering | 185 | 5.2% |
| Multidisciplinary Studies | 26 | 0.7% |
| Science & Technology | 400 | 11.2% |
| Business | 562 | 15.8% |
| Education | 940 | 26.4% |
| Literature & Languages | 107 | 3.0% |
| Liberal Arts & History | 158 | 4.4% |
| Visual & Performing Arts | 67 | 1.9% |
| Communications | 128 | 3.6% |
| Arts & Humanities | 214 | 6.0% |
| Total | 3,563 | 100.0% |
Transportation & Commute in Iroquois County
Vehicle Availability by Sex in Iroquois County
The most prevalent vehicle ownership categories in Iroquois County are males with 2 vehicles (2,677, accounting for 40.7%) and females with 2 vehicles (2,193, making up 47.9%).
| Vehicles Available | Male | Female |
| No Vehicle | 109 (1.7%) | 62 (1.1%) |
| 1 Vehicle | 806 (12.2%) | 1,174 (21.0%) |
| 2 Vehicles | 2,677 (40.7%) | 2,193 (39.3%) |
| 3 Vehicles | 1,682 (25.6%) | 1,171 (21.0%) |
| 4 Vehicles | 964 (14.6%) | 719 (12.9%) |
| 5 or more Vehicles | 340 (5.2%) | 264 (4.7%) |
| Total | 6,578 (100.0%) | 5,583 (100.0%) |
Commute Time in Iroquois County
The most frequently occuring commute durations in Iroquois County are 5 to 9 minutes (1,741 commuters, 15.2%), 10 to 14 minutes (1,540 commuters, 13.5%), and 15 to 19 minutes (1,471 commuters, 12.9%).
| Commute Time | # Commuters | % Commuters |
| Less than 5 Minutes | 898 | 7.9% |
| 5 to 9 Minutes | 1,741 | 15.2% |
| 10 to 14 Minutes | 1,540 | 13.5% |
| 15 to 19 Minutes | 1,471 | 12.9% |
| 20 to 24 Minutes | 1,043 | 9.1% |
| 25 to 29 Minutes | 805 | 7.0% |
| 30 to 34 Minutes | 1,078 | 9.4% |
| 35 to 39 Minutes | 505 | 4.4% |
| 40 to 44 Minutes | 420 | 3.7% |
| 45 to 59 Minutes | 1,030 | 9.0% |
| 60 to 89 Minutes | 617 | 5.4% |
| 90 or more Minutes | 279 | 2.4% |
Commute Time by Sex in Iroquois County
The most common commute times in Iroquois County are 5 to 9 minutes (889 commuters, 14.1%) for males and 5 to 9 minutes (852 commuters, 16.6%) for females.
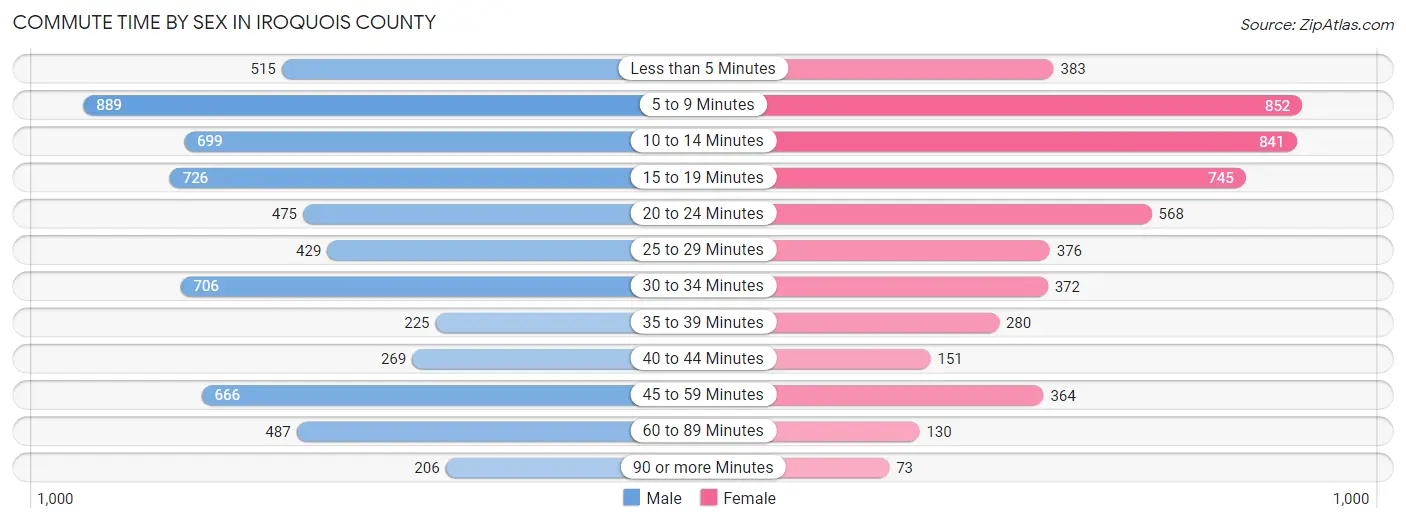
| Commute Time | Male | Female |
| Less than 5 Minutes | 515 (8.2%) | 383 (7.5%) |
| 5 to 9 Minutes | 889 (14.1%) | 852 (16.6%) |
| 10 to 14 Minutes | 699 (11.1%) | 841 (16.4%) |
| 15 to 19 Minutes | 726 (11.5%) | 745 (14.5%) |
| 20 to 24 Minutes | 475 (7.5%) | 568 (11.1%) |
| 25 to 29 Minutes | 429 (6.8%) | 376 (7.3%) |
| 30 to 34 Minutes | 706 (11.2%) | 372 (7.2%) |
| 35 to 39 Minutes | 225 (3.6%) | 280 (5.4%) |
| 40 to 44 Minutes | 269 (4.3%) | 151 (2.9%) |
| 45 to 59 Minutes | 666 (10.6%) | 364 (7.1%) |
| 60 to 89 Minutes | 487 (7.7%) | 130 (2.5%) |
| 90 or more Minutes | 206 (3.3%) | 73 (1.4%) |
Time of Departure to Work by Sex in Iroquois County
The most frequent times of departure to work in Iroquois County are 6:00 AM to 6:29 AM (926, 14.7%) for males and 7:30 AM to 7:59 AM (929, 18.1%) for females.
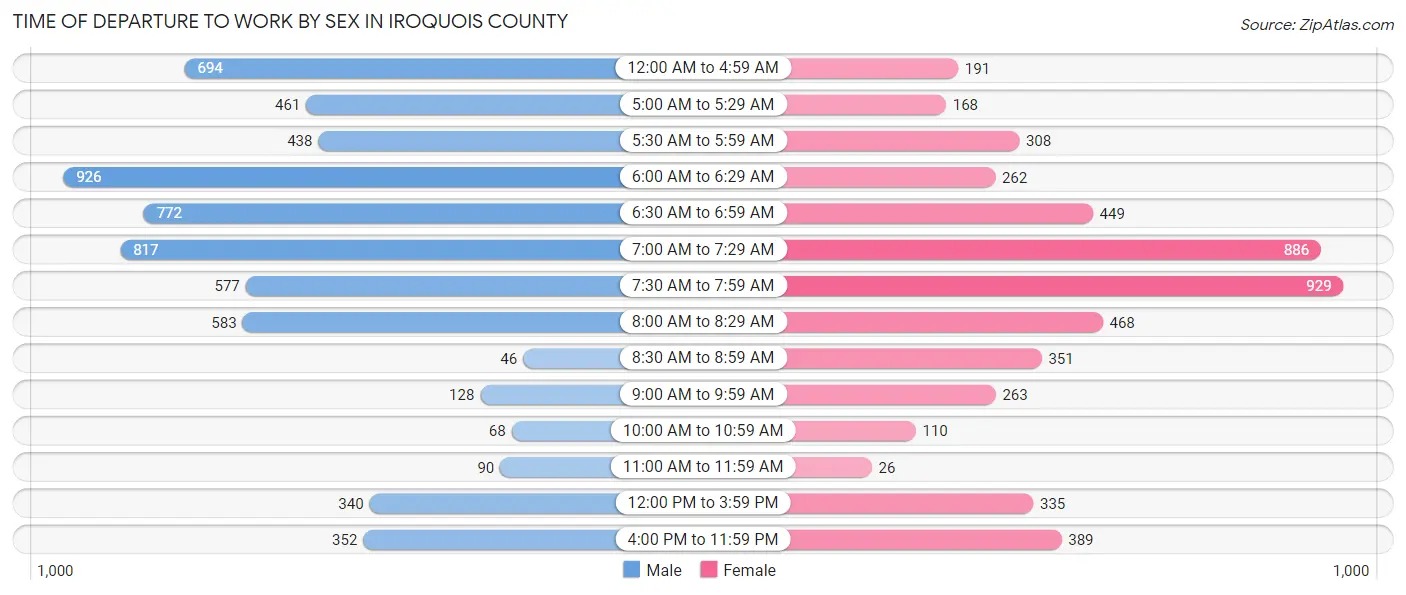
| Time of Departure | Male | Female |
| 12:00 AM to 4:59 AM | 694 (11.0%) | 191 (3.7%) |
| 5:00 AM to 5:29 AM | 461 (7.3%) | 168 (3.3%) |
| 5:30 AM to 5:59 AM | 438 (7.0%) | 308 (6.0%) |
| 6:00 AM to 6:29 AM | 926 (14.7%) | 262 (5.1%) |
| 6:30 AM to 6:59 AM | 772 (12.3%) | 449 (8.7%) |
| 7:00 AM to 7:29 AM | 817 (13.0%) | 886 (17.2%) |
| 7:30 AM to 7:59 AM | 577 (9.2%) | 929 (18.1%) |
| 8:00 AM to 8:29 AM | 583 (9.3%) | 468 (9.1%) |
| 8:30 AM to 8:59 AM | 46 (0.7%) | 351 (6.8%) |
| 9:00 AM to 9:59 AM | 128 (2.0%) | 263 (5.1%) |
| 10:00 AM to 10:59 AM | 68 (1.1%) | 110 (2.1%) |
| 11:00 AM to 11:59 AM | 90 (1.4%) | 26 (0.5%) |
| 12:00 PM to 3:59 PM | 340 (5.4%) | 335 (6.5%) |
| 4:00 PM to 11:59 PM | 352 (5.6%) | 389 (7.6%) |
| Total | 6,292 (100.0%) | 5,135 (100.0%) |
Housing Occupancy in Iroquois County
Occupancy by Ownership in Iroquois County
Of the total 11,217 dwellings in Iroquois County, owner-occupied units account for 8,880 (79.2%), while renter-occupied units make up 2,337 (20.8%).
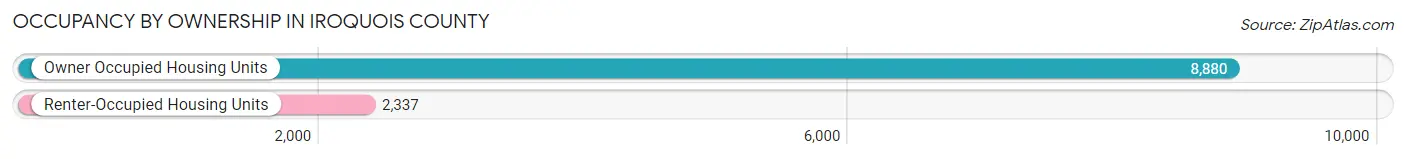
| Occupancy | # Housing Units | % Housing Units |
| Owner Occupied Housing Units | 8,880 | 79.2% |
| Renter-Occupied Housing Units | 2,337 | 20.8% |
| Total Occupied Housing Units | 11,217 | 100.0% |
Occupancy by Household Size in Iroquois County
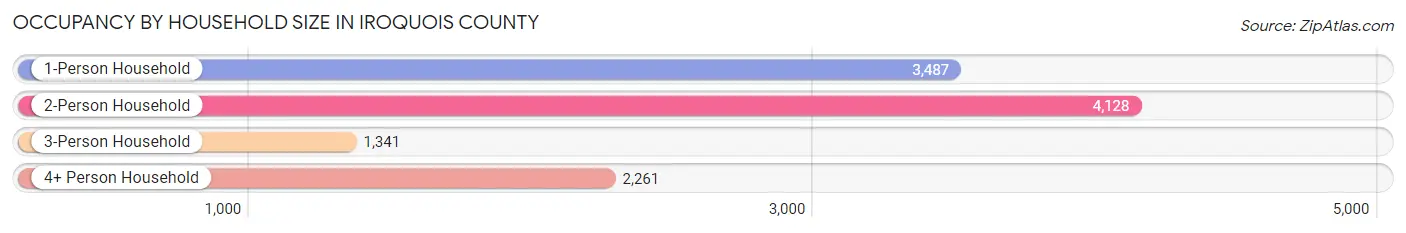
| Household Size | # Housing Units | % Housing Units |
| 1-Person Household | 3,487 | 31.1% |
| 2-Person Household | 4,128 | 36.8% |
| 3-Person Household | 1,341 | 12.0% |
| 4+ Person Household | 2,261 | 20.2% |
| Total Housing Units | 11,217 | 100.0% |
Occupancy by Ownership by Household Size in Iroquois County
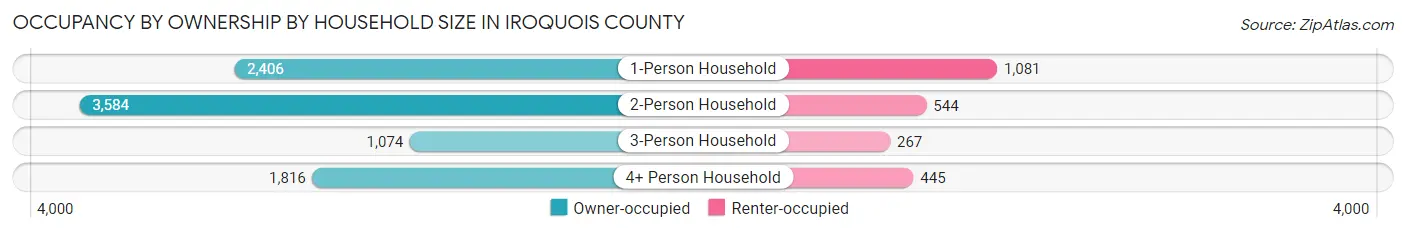
| Household Size | Owner-occupied | Renter-occupied |
| 1-Person Household | 2,406 (69.0%) | 1,081 (31.0%) |
| 2-Person Household | 3,584 (86.8%) | 544 (13.2%) |
| 3-Person Household | 1,074 (80.1%) | 267 (19.9%) |
| 4+ Person Household | 1,816 (80.3%) | 445 (19.7%) |
| Total Housing Units | 8,880 (79.2%) | 2,337 (20.8%) |
Occupancy by Educational Attainment in Iroquois County
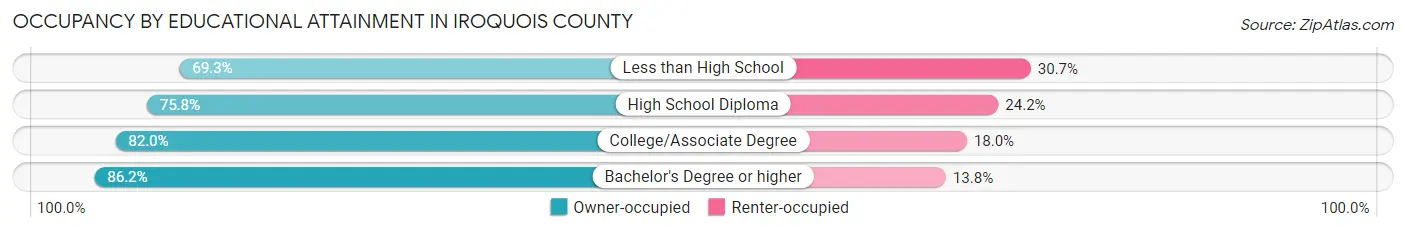
| Household Size | Owner-occupied | Renter-occupied |
| Less than High School | 773 (69.3%) | 342 (30.7%) |
| High School Diploma | 3,247 (75.8%) | 1,039 (24.2%) |
| College/Associate Degree | 2,980 (82.0%) | 654 (18.0%) |
| Bachelor's Degree or higher | 1,880 (86.2%) | 302 (13.8%) |
Occupancy by Age of Householder in Iroquois County
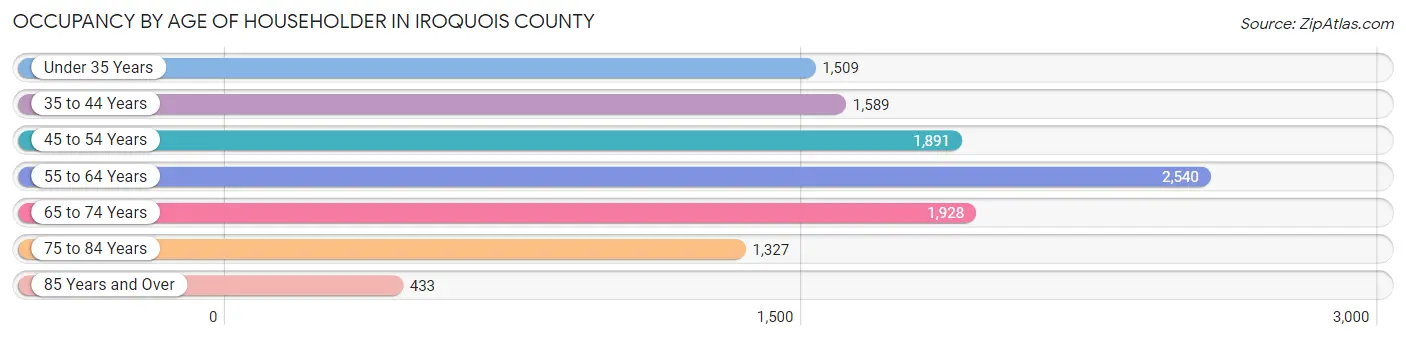
| Age Bracket | # Households | % Households |
| Under 35 Years | 1,509 | 13.5% |
| 35 to 44 Years | 1,589 | 14.2% |
| 45 to 54 Years | 1,891 | 16.9% |
| 55 to 64 Years | 2,540 | 22.6% |
| 65 to 74 Years | 1,928 | 17.2% |
| 75 to 84 Years | 1,327 | 11.8% |
| 85 Years and Over | 433 | 3.9% |
| Total | 11,217 | 100.0% |
Housing Finances in Iroquois County
Median Income by Occupancy in Iroquois County
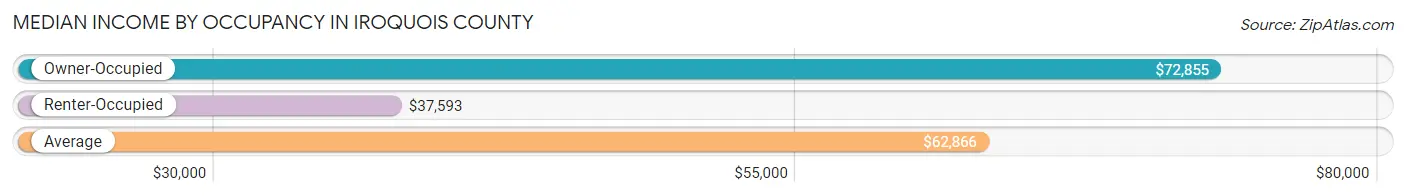
| Occupancy Type | # Households | Median Income |
| Owner-Occupied | 8,880 (79.2%) | $72,855 |
| Renter-Occupied | 2,337 (20.8%) | $37,593 |
| Average | 11,217 (100.0%) | $62,866 |
Occupancy by Householder Income Bracket in Iroquois County

| Income Bracket | Owner-occupied | Renter-occupied |
| Less than $5,000 | 264 (3.0%) | 139 (5.9%) |
| $5,000 to $9,999 | 71 (0.8%) | 60 (2.6%) |
| $10,000 to $14,999 | 288 (3.2%) | 176 (7.5%) |
| $15,000 to $19,999 | 226 (2.5%) | 160 (6.9%) |
| $20,000 to $24,999 | 362 (4.1%) | 249 (10.6%) |
| $25,000 to $34,999 | 746 (8.4%) | 260 (11.1%) |
| $35,000 to $49,999 | 1,013 (11.4%) | 500 (21.4%) |
| $50,000 to $74,999 | 1,621 (18.2%) | 418 (17.9%) |
| $75,000 to $99,999 | 1,337 (15.1%) | 178 (7.6%) |
| $100,000 to $149,999 | 1,769 (19.9%) | 161 (6.9%) |
| $150,000 or more | 1,183 (13.3%) | 36 (1.5%) |
| Total | 8,880 (100.0%) | 2,337 (100.0%) |
Monthly Housing Cost Tiers in Iroquois County
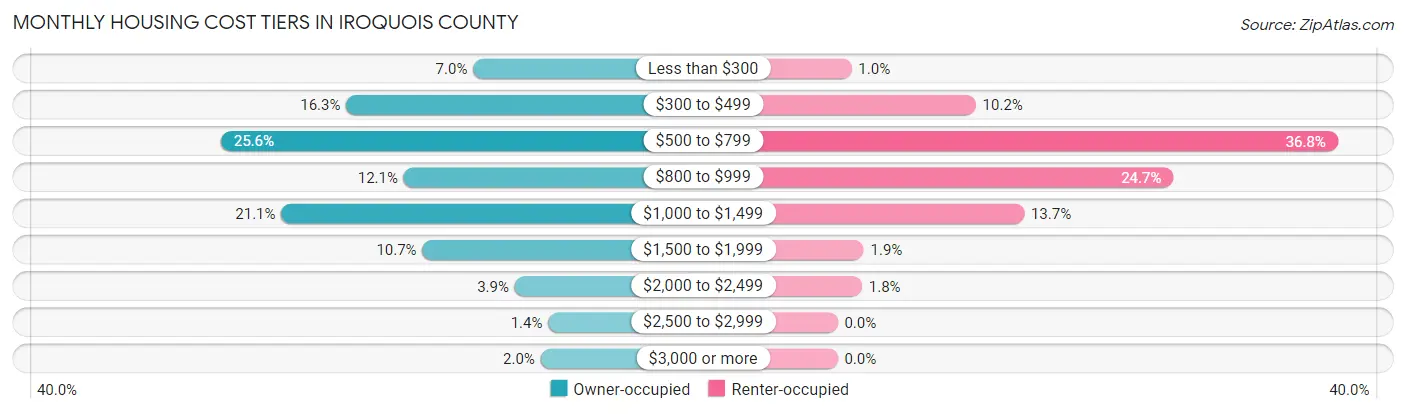
| Monthly Cost | Owner-occupied | Renter-occupied |
| Less than $300 | 618 (7.0%) | 24 (1.0%) |
| $300 to $499 | 1,448 (16.3%) | 238 (10.2%) |
| $500 to $799 | 2,269 (25.6%) | 861 (36.8%) |
| $800 to $999 | 1,072 (12.1%) | 578 (24.7%) |
| $1,000 to $1,499 | 1,873 (21.1%) | 321 (13.7%) |
| $1,500 to $1,999 | 950 (10.7%) | 45 (1.9%) |
| $2,000 to $2,499 | 346 (3.9%) | 42 (1.8%) |
| $2,500 to $2,999 | 127 (1.4%) | 0 (0.0%) |
| $3,000 or more | 177 (2.0%) | 0 (0.0%) |
| Total | 8,880 (100.0%) | 2,337 (100.0%) |
Physical Housing Characteristics in Iroquois County
Housing Structures in Iroquois County
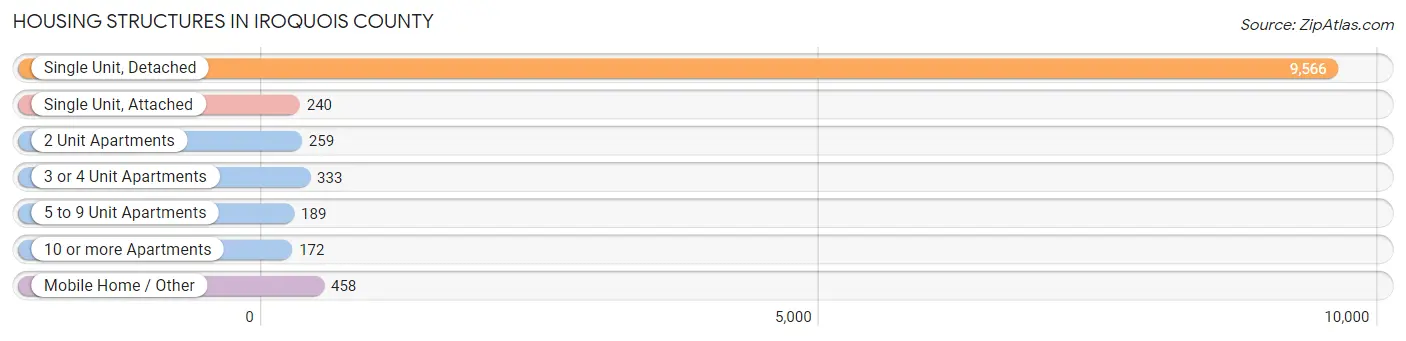
| Structure Type | # Housing Units | % Housing Units |
| Single Unit, Detached | 9,566 | 85.3% |
| Single Unit, Attached | 240 | 2.1% |
| 2 Unit Apartments | 259 | 2.3% |
| 3 or 4 Unit Apartments | 333 | 3.0% |
| 5 to 9 Unit Apartments | 189 | 1.7% |
| 10 or more Apartments | 172 | 1.5% |
| Mobile Home / Other | 458 | 4.1% |
| Total | 11,217 | 100.0% |
Housing Structures by Occupancy in Iroquois County
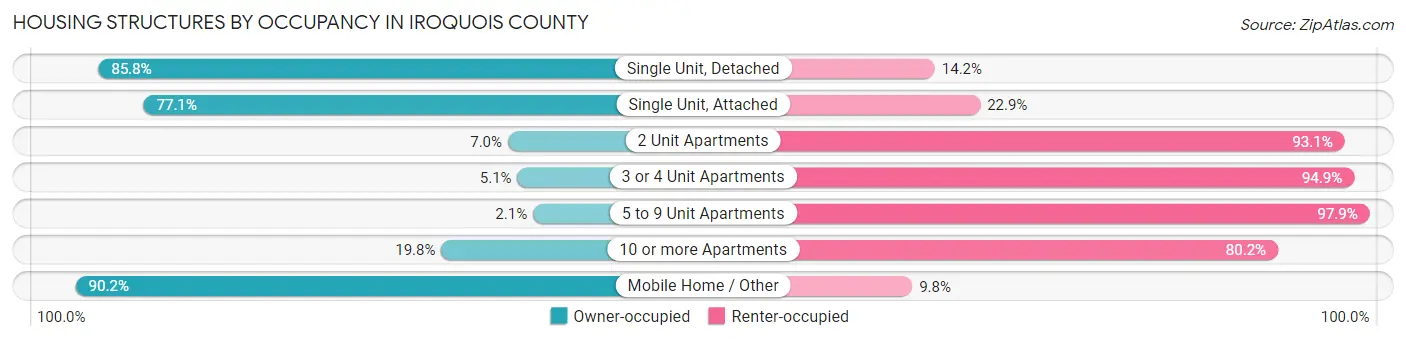
| Structure Type | Owner-occupied | Renter-occupied |
| Single Unit, Detached | 8,209 (85.8%) | 1,357 (14.2%) |
| Single Unit, Attached | 185 (77.1%) | 55 (22.9%) |
| 2 Unit Apartments | 18 (7.0%) | 241 (93.0%) |
| 3 or 4 Unit Apartments | 17 (5.1%) | 316 (94.9%) |
| 5 to 9 Unit Apartments | 4 (2.1%) | 185 (97.9%) |
| 10 or more Apartments | 34 (19.8%) | 138 (80.2%) |
| Mobile Home / Other | 413 (90.2%) | 45 (9.8%) |
| Total | 8,880 (79.2%) | 2,337 (20.8%) |
Housing Structures by Number of Rooms in Iroquois County
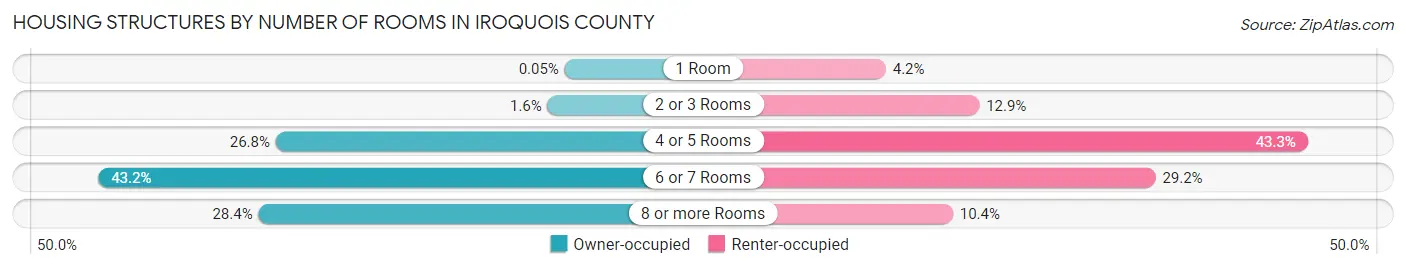
| Number of Rooms | Owner-occupied | Renter-occupied |
| 1 Room | 4 (0.1%) | 99 (4.2%) |
| 2 or 3 Rooms | 145 (1.6%) | 301 (12.9%) |
| 4 or 5 Rooms | 2,377 (26.8%) | 1,011 (43.3%) |
| 6 or 7 Rooms | 3,835 (43.2%) | 682 (29.2%) |
| 8 or more Rooms | 2,519 (28.4%) | 244 (10.4%) |
| Total | 8,880 (100.0%) | 2,337 (100.0%) |
Housing Structure by Heating Type in Iroquois County
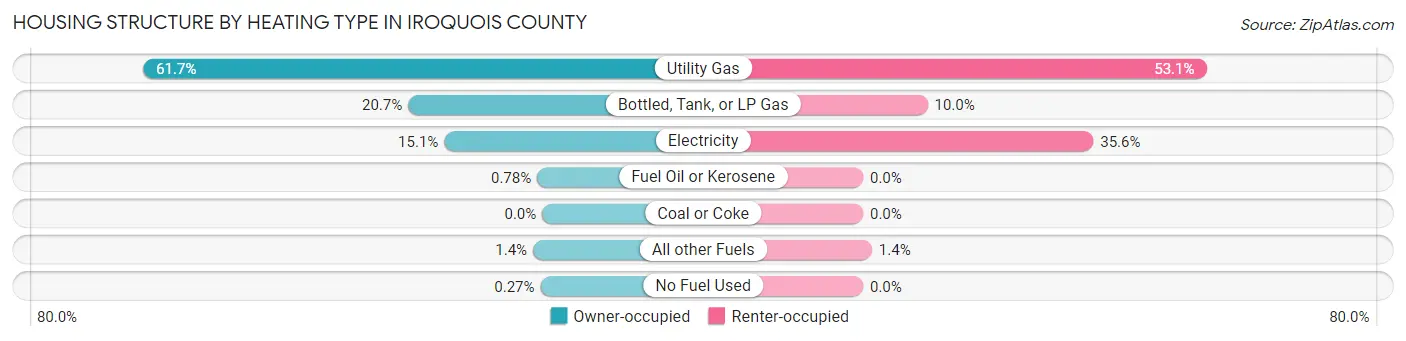
| Heating Type | Owner-occupied | Renter-occupied |
| Utility Gas | 5,477 (61.7%) | 1,240 (53.1%) |
| Bottled, Tank, or LP Gas | 1,840 (20.7%) | 233 (10.0%) |
| Electricity | 1,344 (15.1%) | 832 (35.6%) |
| Fuel Oil or Kerosene | 69 (0.8%) | 0 (0.0%) |
| Coal or Coke | 0 (0.0%) | 0 (0.0%) |
| All other Fuels | 126 (1.4%) | 32 (1.4%) |
| No Fuel Used | 24 (0.3%) | 0 (0.0%) |
| Total | 8,880 (100.0%) | 2,337 (100.0%) |
Household Vehicle Usage in Iroquois County
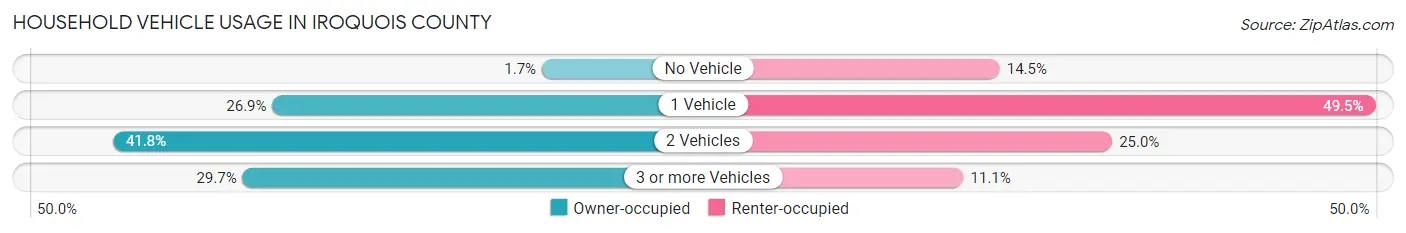
| Vehicles per Household | Owner-occupied | Renter-occupied |
| No Vehicle | 152 (1.7%) | 338 (14.5%) |
| 1 Vehicle | 2,386 (26.9%) | 1,157 (49.5%) |
| 2 Vehicles | 3,708 (41.8%) | 583 (24.9%) |
| 3 or more Vehicles | 2,634 (29.7%) | 259 (11.1%) |
| Total | 8,880 (100.0%) | 2,337 (100.0%) |
Real Estate & Mortgages in Iroquois County
Real Estate and Mortgage Overview in Iroquois County
| Characteristic | Without Mortgage | With Mortgage |
| Housing Units | 4,409 | 4,471 |
| Median Property Value | $112,500 | $131,300 |
| Median Household Income | $57,041 | $680 |
| Monthly Housing Costs | $524 | $113 |
| Real Estate Taxes | $2,204 | $55 |
Property Value by Mortgage Status in Iroquois County
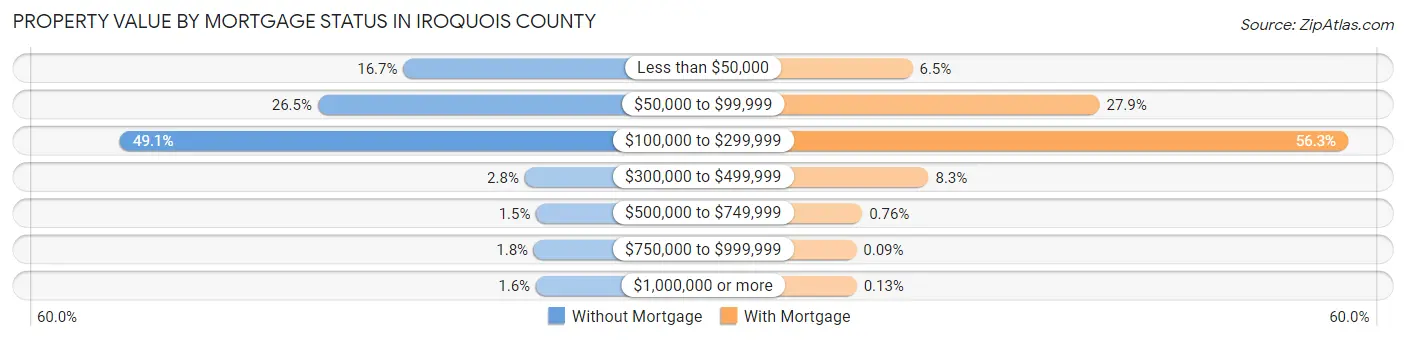
| Property Value | Without Mortgage | With Mortgage |
| Less than $50,000 | 737 (16.7%) | 291 (6.5%) |
| $50,000 to $99,999 | 1,168 (26.5%) | 1,247 (27.9%) |
| $100,000 to $299,999 | 2,164 (49.1%) | 2,516 (56.3%) |
| $300,000 to $499,999 | 125 (2.8%) | 373 (8.3%) |
| $500,000 to $749,999 | 67 (1.5%) | 34 (0.8%) |
| $750,000 to $999,999 | 79 (1.8%) | 4 (0.1%) |
| $1,000,000 or more | 69 (1.6%) | 6 (0.1%) |
| Total | 4,409 (100.0%) | 4,471 (100.0%) |
Household Income by Mortgage Status in Iroquois County
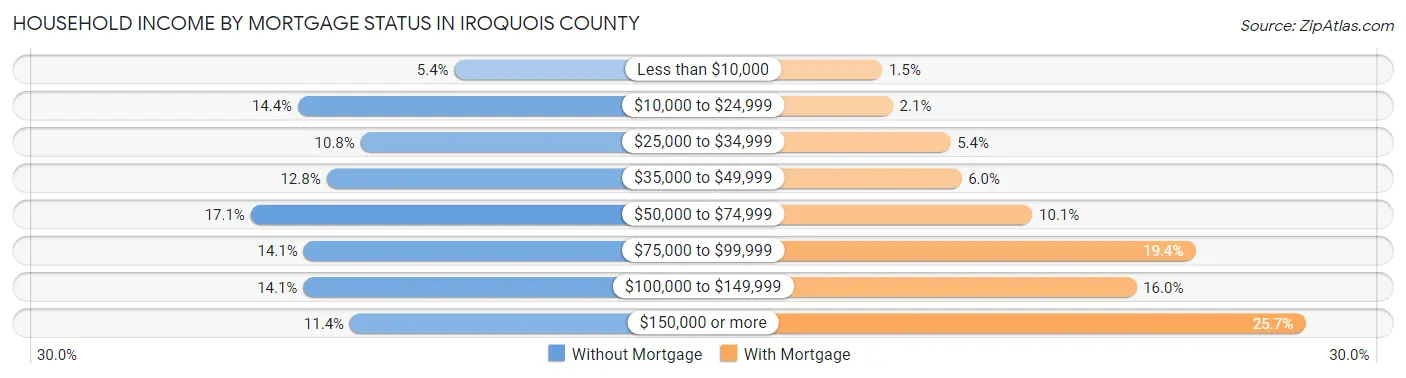
| Household Income | Without Mortgage | With Mortgage |
| Less than $10,000 | 240 (5.4%) | 68 (1.5%) |
| $10,000 to $24,999 | 634 (14.4%) | 95 (2.1%) |
| $25,000 to $34,999 | 476 (10.8%) | 242 (5.4%) |
| $35,000 to $49,999 | 562 (12.8%) | 270 (6.0%) |
| $50,000 to $74,999 | 753 (17.1%) | 451 (10.1%) |
| $75,000 to $99,999 | 620 (14.1%) | 868 (19.4%) |
| $100,000 to $149,999 | 621 (14.1%) | 717 (16.0%) |
| $150,000 or more | 503 (11.4%) | 1,148 (25.7%) |
| Total | 4,409 (100.0%) | 4,471 (100.0%) |
Property Value to Household Income Ratio in Iroquois County
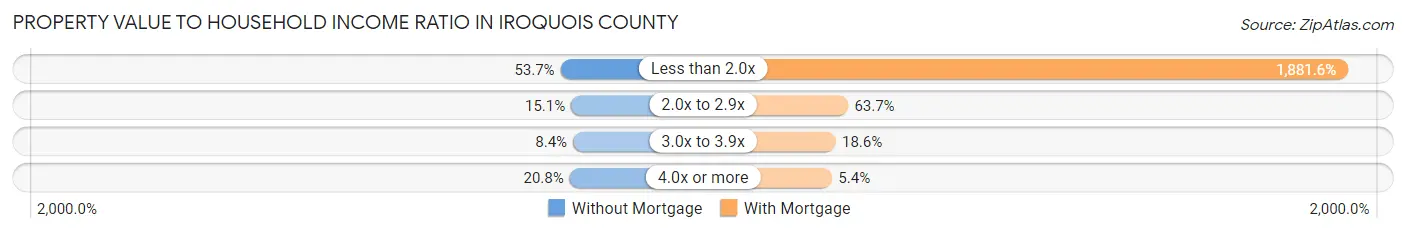
| Value-to-Income Ratio | Without Mortgage | With Mortgage |
| Less than 2.0x | 2,367 (53.7%) | 84,125 (1,881.6%) |
| 2.0x to 2.9x | 666 (15.1%) | 2,848 (63.7%) |
| 3.0x to 3.9x | 369 (8.4%) | 830 (18.6%) |
| 4.0x or more | 915 (20.7%) | 240 (5.4%) |
| Total | 4,409 (100.0%) | 4,471 (100.0%) |
Real Estate Taxes by Mortgage Status in Iroquois County
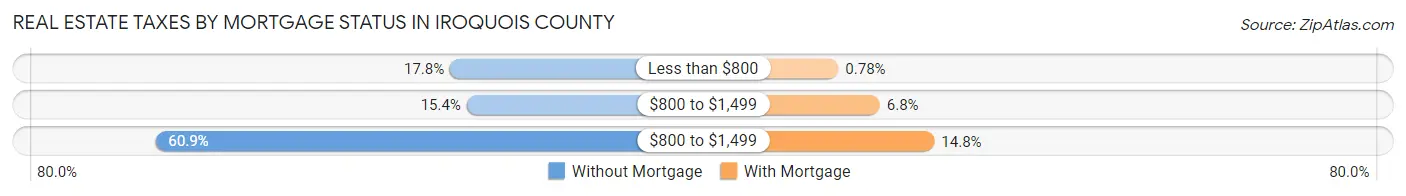
| Property Taxes | Without Mortgage | With Mortgage |
| Less than $800 | 786 (17.8%) | 35 (0.8%) |
| $800 to $1,499 | 679 (15.4%) | 306 (6.8%) |
| $800 to $1,499 | 2,684 (60.9%) | 662 (14.8%) |
| Total | 4,409 (100.0%) | 4,471 (100.0%) |
Health & Disability in Iroquois County
Health Insurance Coverage by Age in Iroquois County
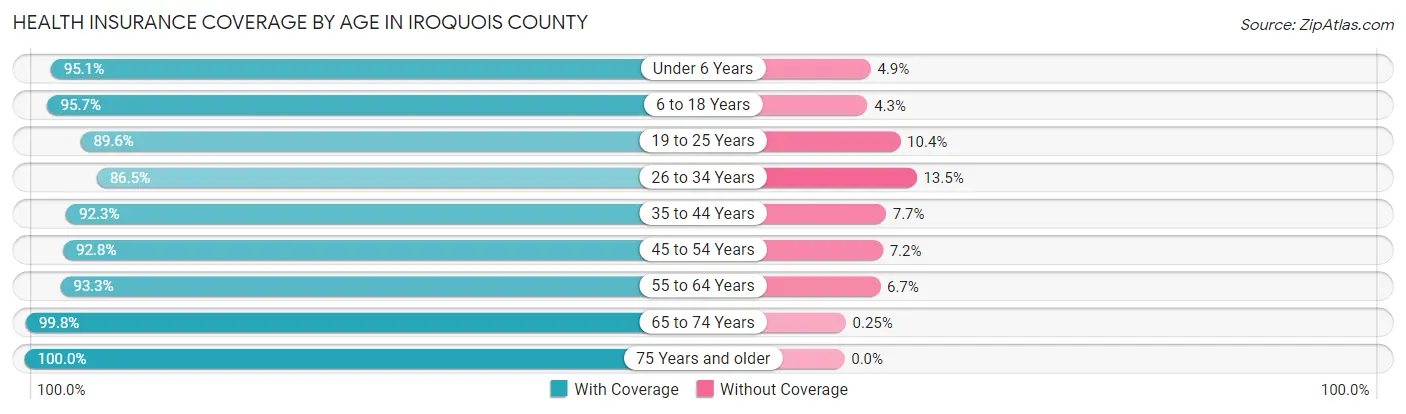
| Age Bracket | With Coverage | Without Coverage |
| Under 6 Years | 1,730 (95.1%) | 89 (4.9%) |
| 6 to 18 Years | 4,179 (95.7%) | 187 (4.3%) |
| 19 to 25 Years | 1,659 (89.6%) | 193 (10.4%) |
| 26 to 34 Years | 2,166 (86.5%) | 337 (13.5%) |
| 35 to 44 Years | 2,908 (92.3%) | 244 (7.7%) |
| 45 to 54 Years | 2,979 (92.8%) | 230 (7.2%) |
| 55 to 64 Years | 3,866 (93.3%) | 276 (6.7%) |
| 65 to 74 Years | 3,151 (99.8%) | 8 (0.3%) |
| 75 Years and older | 2,452 (100.0%) | 0 (0.0%) |
| Total | 25,090 (94.1%) | 1,564 (5.9%) |
Health Insurance Coverage by Citizenship Status in Iroquois County
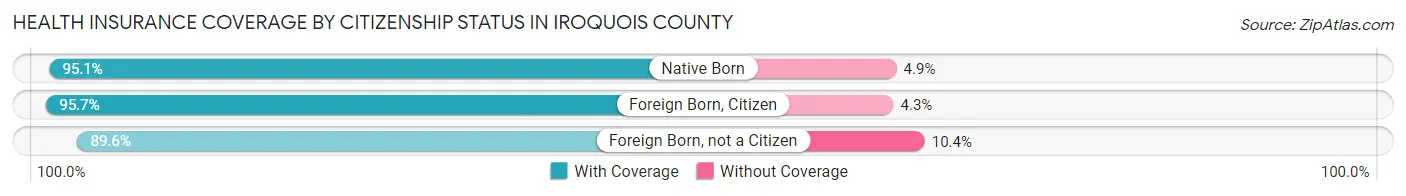
| Citizenship Status | With Coverage | Without Coverage |
| Native Born | 1,730 (95.1%) | 89 (4.9%) |
| Foreign Born, Citizen | 4,179 (95.7%) | 187 (4.3%) |
| Foreign Born, not a Citizen | 1,659 (89.6%) | 193 (10.4%) |
Health Insurance Coverage by Household Income in Iroquois County
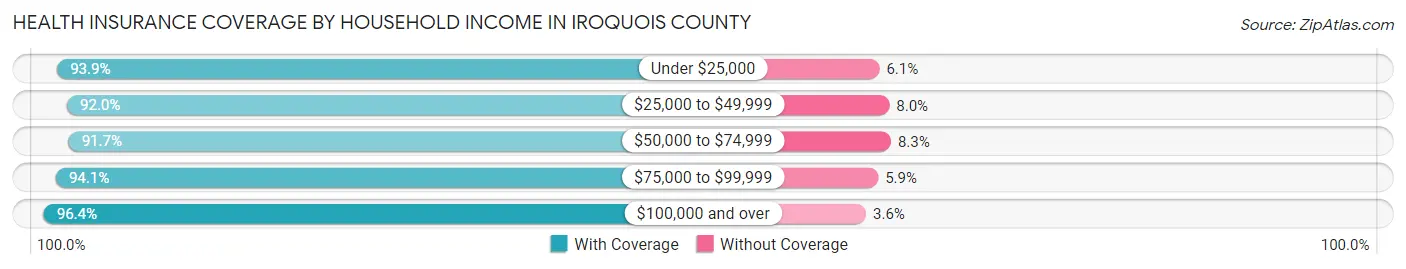
| Household Income | With Coverage | Without Coverage |
| Under $25,000 | 2,759 (93.9%) | 180 (6.1%) |
| $25,000 to $49,999 | 4,482 (92.0%) | 388 (8.0%) |
| $50,000 to $74,999 | 4,410 (91.7%) | 398 (8.3%) |
| $75,000 to $99,999 | 3,816 (94.1%) | 239 (5.9%) |
| $100,000 and over | 9,593 (96.4%) | 359 (3.6%) |
Public vs Private Health Insurance Coverage by Age in Iroquois County
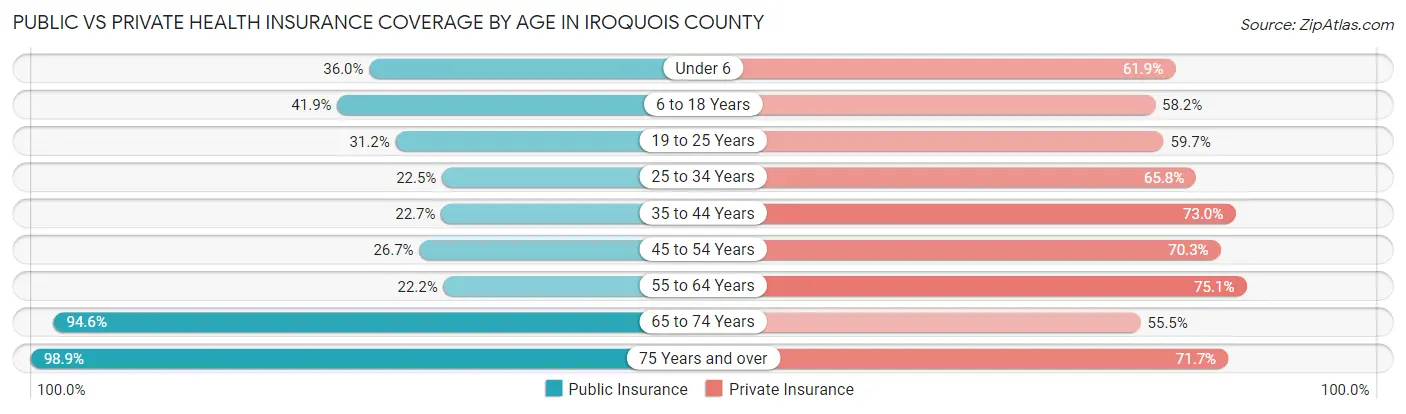
| Age Bracket | Public Insurance | Private Insurance |
| Under 6 | 655 (36.0%) | 1,125 (61.9%) |
| 6 to 18 Years | 1,831 (41.9%) | 2,539 (58.2%) |
| 19 to 25 Years | 577 (31.2%) | 1,106 (59.7%) |
| 25 to 34 Years | 563 (22.5%) | 1,646 (65.8%) |
| 35 to 44 Years | 714 (22.7%) | 2,301 (73.0%) |
| 45 to 54 Years | 857 (26.7%) | 2,255 (70.3%) |
| 55 to 64 Years | 921 (22.2%) | 3,109 (75.1%) |
| 65 to 74 Years | 2,989 (94.6%) | 1,752 (55.5%) |
| 75 Years and over | 2,424 (98.9%) | 1,757 (71.7%) |
| Total | 11,531 (43.3%) | 17,590 (66.0%) |
Disability Status by Sex by Age in Iroquois County
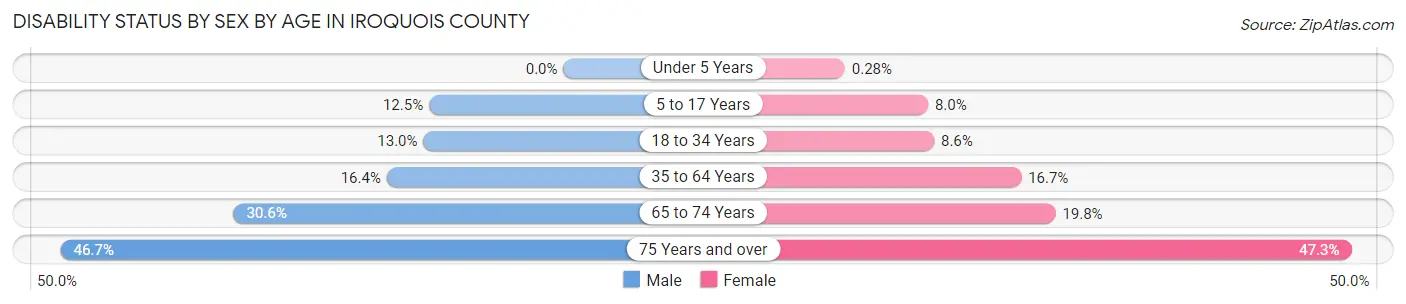
| Age Bracket | Male | Female |
| Under 5 Years | 0 (0.0%) | 2 (0.3%) |
| 5 to 17 Years | 274 (12.5%) | 172 (8.0%) |
| 18 to 34 Years | 325 (13.0%) | 192 (8.6%) |
| 35 to 64 Years | 847 (16.4%) | 888 (16.7%) |
| 65 to 74 Years | 490 (30.6%) | 309 (19.8%) |
| 75 Years and over | 475 (46.7%) | 678 (47.3%) |
Disability Class by Sex by Age in Iroquois County
Disability Class: Hearing Difficulty
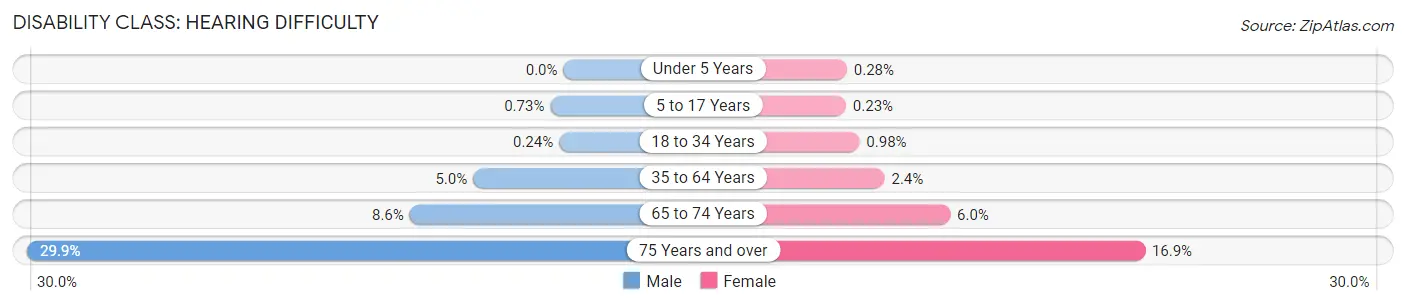
| Age Bracket | Male | Female |
| Under 5 Years | 0 (0.0%) | 2 (0.3%) |
| 5 to 17 Years | 16 (0.7%) | 5 (0.2%) |
| 18 to 34 Years | 6 (0.2%) | 22 (1.0%) |
| 35 to 64 Years | 260 (5.0%) | 127 (2.4%) |
| 65 to 74 Years | 137 (8.6%) | 94 (6.0%) |
| 75 Years and over | 304 (29.9%) | 242 (16.9%) |
Disability Class: Vision Difficulty
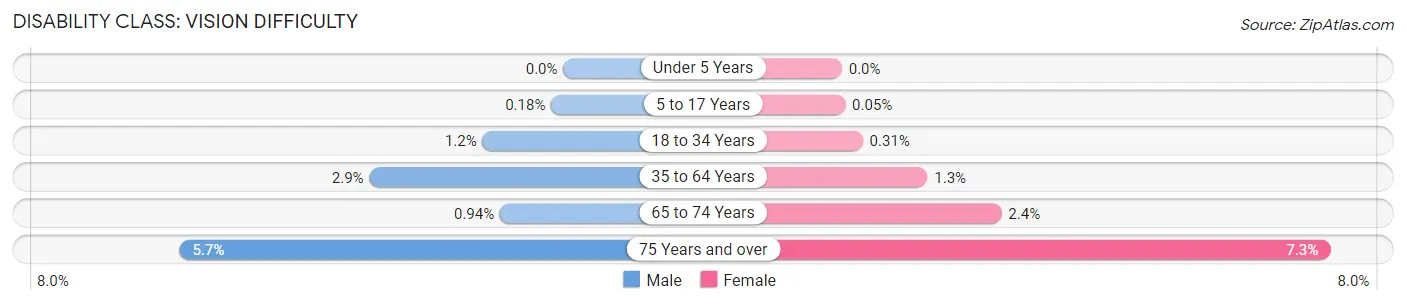
| Age Bracket | Male | Female |
| Under 5 Years | 0 (0.0%) | 0 (0.0%) |
| 5 to 17 Years | 4 (0.2%) | 1 (0.1%) |
| 18 to 34 Years | 30 (1.2%) | 7 (0.3%) |
| 35 to 64 Years | 149 (2.9%) | 68 (1.3%) |
| 65 to 74 Years | 15 (0.9%) | 37 (2.4%) |
| 75 Years and over | 58 (5.7%) | 104 (7.2%) |
Disability Class: Cognitive Difficulty
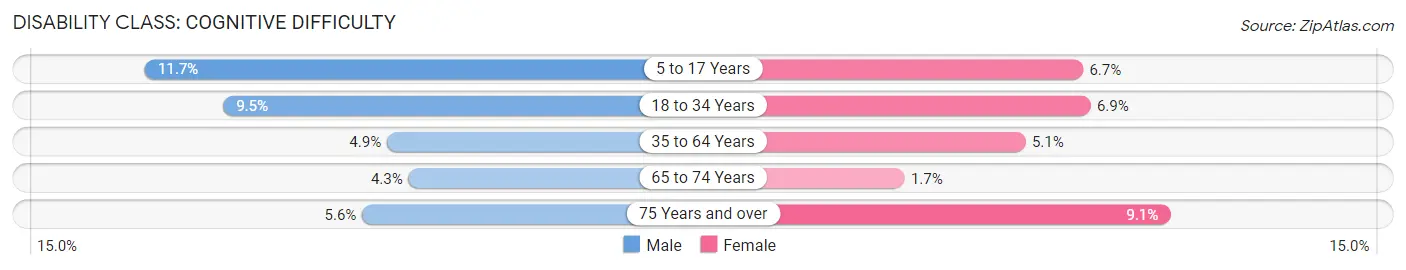
| Age Bracket | Male | Female |
| 5 to 17 Years | 256 (11.7%) | 144 (6.7%) |
| 18 to 34 Years | 237 (9.5%) | 155 (6.9%) |
| 35 to 64 Years | 254 (4.9%) | 272 (5.1%) |
| 65 to 74 Years | 69 (4.3%) | 27 (1.7%) |
| 75 Years and over | 57 (5.6%) | 131 (9.1%) |
Disability Class: Ambulatory Difficulty
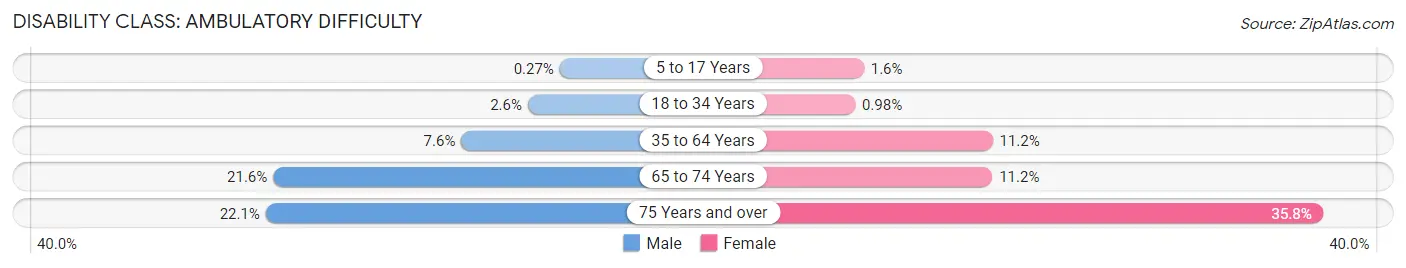
| Age Bracket | Male | Female |
| 5 to 17 Years | 6 (0.3%) | 35 (1.6%) |
| 18 to 34 Years | 66 (2.6%) | 22 (1.0%) |
| 35 to 64 Years | 392 (7.6%) | 597 (11.2%) |
| 65 to 74 Years | 345 (21.5%) | 174 (11.2%) |
| 75 Years and over | 225 (22.1%) | 513 (35.8%) |
Disability Class: Self-Care Difficulty
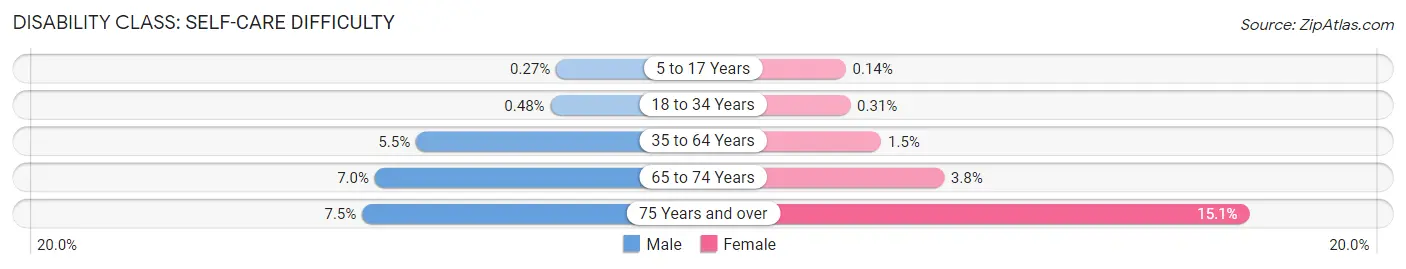
| Age Bracket | Male | Female |
| 5 to 17 Years | 6 (0.3%) | 3 (0.1%) |
| 18 to 34 Years | 12 (0.5%) | 7 (0.3%) |
| 35 to 64 Years | 283 (5.5%) | 78 (1.5%) |
| 65 to 74 Years | 112 (7.0%) | 59 (3.8%) |
| 75 Years and over | 76 (7.5%) | 217 (15.1%) |
Technology Access in Iroquois County
Computing Device Access in Iroquois County
| Device Type | # Households | % Households |
| Desktop or Laptop | 8,037 | 71.7% |
| Smartphone | 9,426 | 84.0% |
| Tablet | 6,373 | 56.8% |
| No Computing Device | 1,081 | 9.6% |
| Total | 11,217 | 100.0% |
Internet Access in Iroquois County
| Internet Type | # Households | % Households |
| Dial-Up Internet | 20 | 0.2% |
| Broadband Home | 6,203 | 55.3% |
| Cellular Data Only | 1,822 | 16.2% |
| Satellite Internet | 1,556 | 13.9% |
| No Internet | 1,775 | 15.8% |
| Total | 11,217 | 100.0% |
Iroquois County Summary
Iroquois County is a county located in the northeastern part of the U.S. state of Illinois. As of the 2010 census, the population was 29,718. Its county seat is Watseka. Iroquois County is part of the Kankakee-Bradley, IL Metropolitan Statistical Area.
History
Iroquois County was formed in 1833 out of a portion of Vermilion County. It was named after the Iroquois, a Native American tribe that once lived in the area. The county was originally settled by French and British immigrants, and the first permanent settlement was established in 1834.
The county was home to several Native American tribes, including the Potawatomi, Kickapoo, and Ottawa. The Potawatomi were the largest tribe in the area, and they were the first to be forcibly removed from the county in 1836.
Geography
Iroquois County is located in the northeastern part of Illinois, and is bordered by Kankakee County to the north, Vermilion County to the east, Ford County to the south, and Will County to the west. The county has a total area of 576 square miles, of which 574 square miles is land and 2 square miles (0.3%) is water.
The county is mostly flat, with some rolling hills in the northern and western parts. The Iroquois River runs through the county, and there are several small lakes and ponds scattered throughout.
Economy
The economy of Iroquois County is largely based on agriculture. The county is home to several large farms, and the main crops grown are corn, soybeans, and wheat. Other industries in the county include manufacturing, retail, and tourism.
Demographics
As of the 2010 census, there were 29,718 people, 11,845 households, and 8,072 families living in the county. The population density was 51.6 people per square mile. The racial makeup of the county was 95.2% White, 0.7% African American, 0.3% Native American, 0.4% Asian, 0.1% Pacific Islander, 1.7% from other races, and 1.5% from two or more races. Hispanic or Latino of any race were 4.2% of the population.
The median income for a household in the county was $45,945, and the median income for a family was $54,945. The per capita income for the county was $21,845. About 8.7% of families and 11.7% of the population were below the poverty line, including 15.2% of those under age 18 and 8.2% of those age 65 or over.
Conclusion
Iroquois County is a rural county located in the northeastern part of Illinois. It was formed in 1833 and is named after the Iroquois, a Native American tribe that once lived in the area. The county is mostly flat, with some rolling hills in the northern and western parts. The economy of Iroquois County is largely based on agriculture, and the main crops grown are corn, soybeans, and wheat. As of the 2010 census, the population was 29,718. The median income for a household in the county was $45,945, and the median income for a family was $54,945.
Common Questions
What is Per Capita Income in Iroquois County?
Per Capita income in Iroquois County is $33,347.
What is the Median Family Income in Iroquois County?
Median Family Income in Iroquois County is $81,000.
What is the Median Household income in Iroquois County?
Median Household Income in Iroquois County is $62,866.
What is Income or Wage Gap in Iroquois County?
Income or Wage Gap in Iroquois County is 37.1%.
Women in Iroquois County earn 62.9 cents for every dollar earned by a man.
What is Family Income Deficit in Iroquois County?
Family Income Deficit in Iroquois County is $10,308.
Families that are below poverty line in Iroquois County earn $10,308 less on average than the poverty threshold level.
What is Inequality or Gini Index in Iroquois County?
Inequality or Gini Index in Iroquois County is 0.43.
What is the Total Population of Iroquois County?
Total Population of Iroquois County is 27,043.
What is the Total Male Population of Iroquois County?
Total Male Population of Iroquois County is 13,380.
What is the Total Female Population of Iroquois County?
Total Female Population of Iroquois County is 13,663.
What is the Ratio of Males per 100 Females in Iroquois County?
There are 97.93 Males per 100 Females in Iroquois County.
What is the Ratio of Females per 100 Males in Iroquois County?
There are 102.12 Females per 100 Males in Iroquois County.
What is the Median Population Age in Iroquois County?
Median Population Age in Iroquois County is 44.5 Years.
What is the Average Family Size in Iroquois County
Average Family Size in Iroquois County is 2.9 People.
What is the Average Household Size in Iroquois County
Average Household Size in Iroquois County is 2.4 People.
How Large is the Labor Force in Iroquois County?
There are 12,985 People in the Labor Forcein in Iroquois County.
What is the Percentage of People in the Labor Force in Iroquois County?
58.9% of People are in the Labor Force in Iroquois County.
What is the Unemployment Rate in Iroquois County?
Unemployment Rate in Iroquois County is 4.9%.