Area Code 779 Map & Demographics
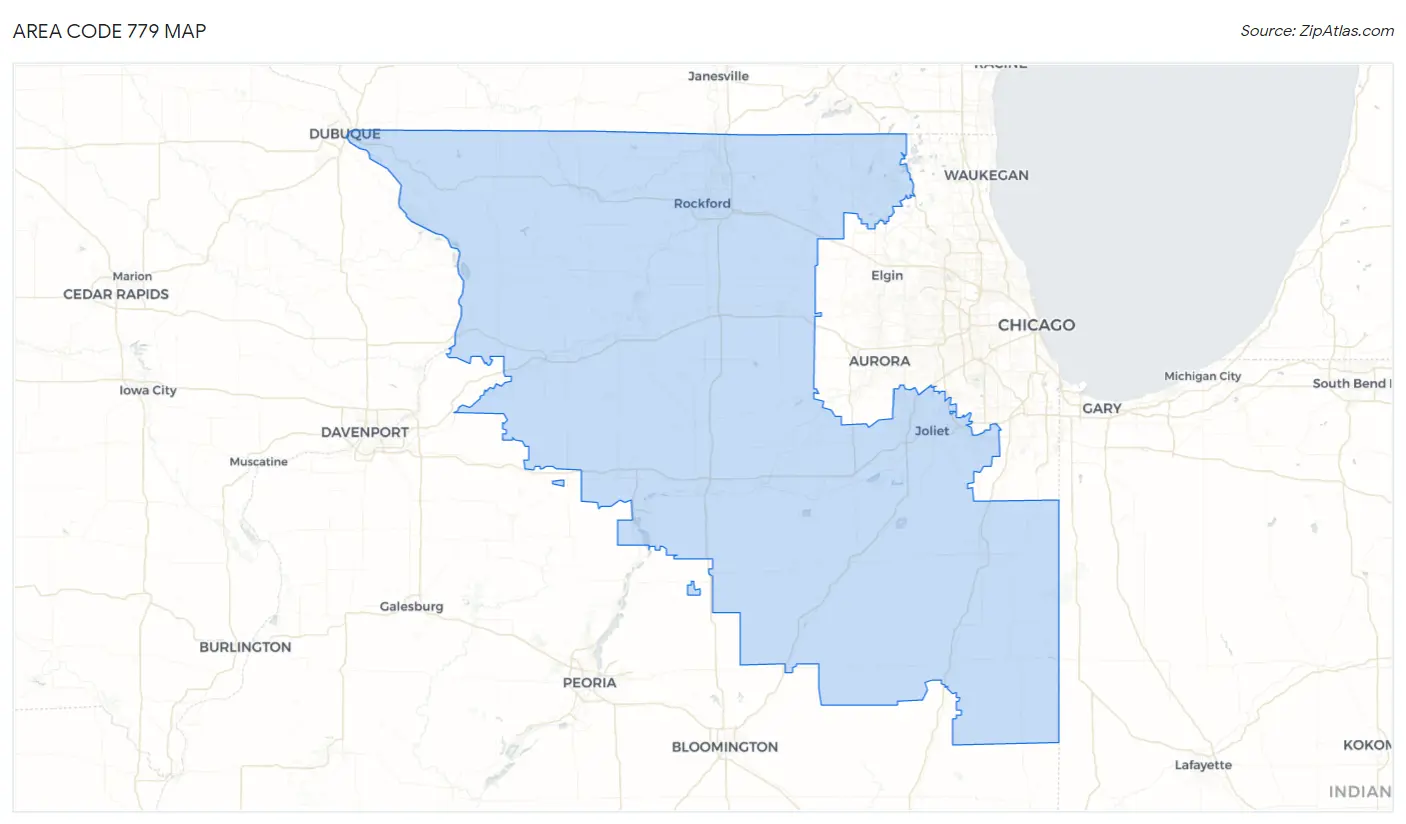
Area Code 779 Map
Area Code 779 Overview
$37,807
PER CAPITA INCOME
$94,440
AVG FAMILY INCOME
$79,255
AVG HOUSEHOLD INCOME
36.8%
WAGE / INCOME GAP [ % ]
63.2¢/ $1
WAGE / INCOME GAP [ $ ]
$11,485
FAMILY INCOME DEFICIT
19.60
INEQUALITY / GINI INDEX
781,698
TOTAL POPULATION
391,469
MALE POPULATION
390,229
FEMALE POPULATION
100.32
MALES / 100 FEMALES
99.68
FEMALES / 100 MALES
40.8
MEDIAN AGE
3.1
AVG FAMILY SIZE
2.5
AVG HOUSEHOLD SIZE
400,968
LABOR FORCE [ PEOPLE ]
64.4%
PERCENT IN LABOR FORCE
5.5%
UNEMPLOYMENT RATE
Income in Area Code 779
Income Overview in Area Code 779
Per Capita Income in Area Code 779 is $37,807, while median incomes of families and households are $94,440 and $79,255 respectively.
| Characteristic | Number | Measure |
| Per Capita Income | 781,698 | $37,807 |
| Median Family Income | 198,167 | $94,440 |
| Mean Family Income | 198,167 | $5,238,272 |
| Median Household Income | 295,205 | $79,255 |
| Mean Household Income | 295,205 | $4,533,989 |
| Income Deficit | 198,167 | $11,485 |
| Wage / Income Gap (%) | 781,698 | 36.81% |
| Wage / Income Gap ($) | 781,698 | 63.19¢ per $1 |
| Gini / Inequality Index | 781,698 | 19.60 |
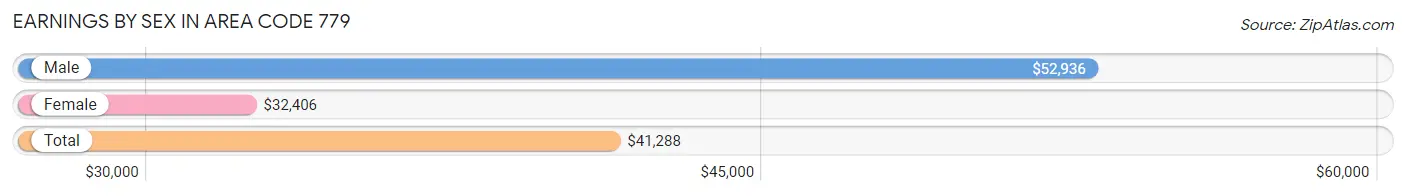
Earnings by Sex in Area Code 779
Average Earnings in Area Code 779 are $41,288, $52,936 for men and $32,406 for women, a difference of 38.8%.
| Sex | Number | Average Earnings |
| Male | 223,543 (52.9%) | $52,936 |
| Female | 198,995 (47.1%) | $32,406 |
| Total | 422,538 (100.0%) | $41,288 |
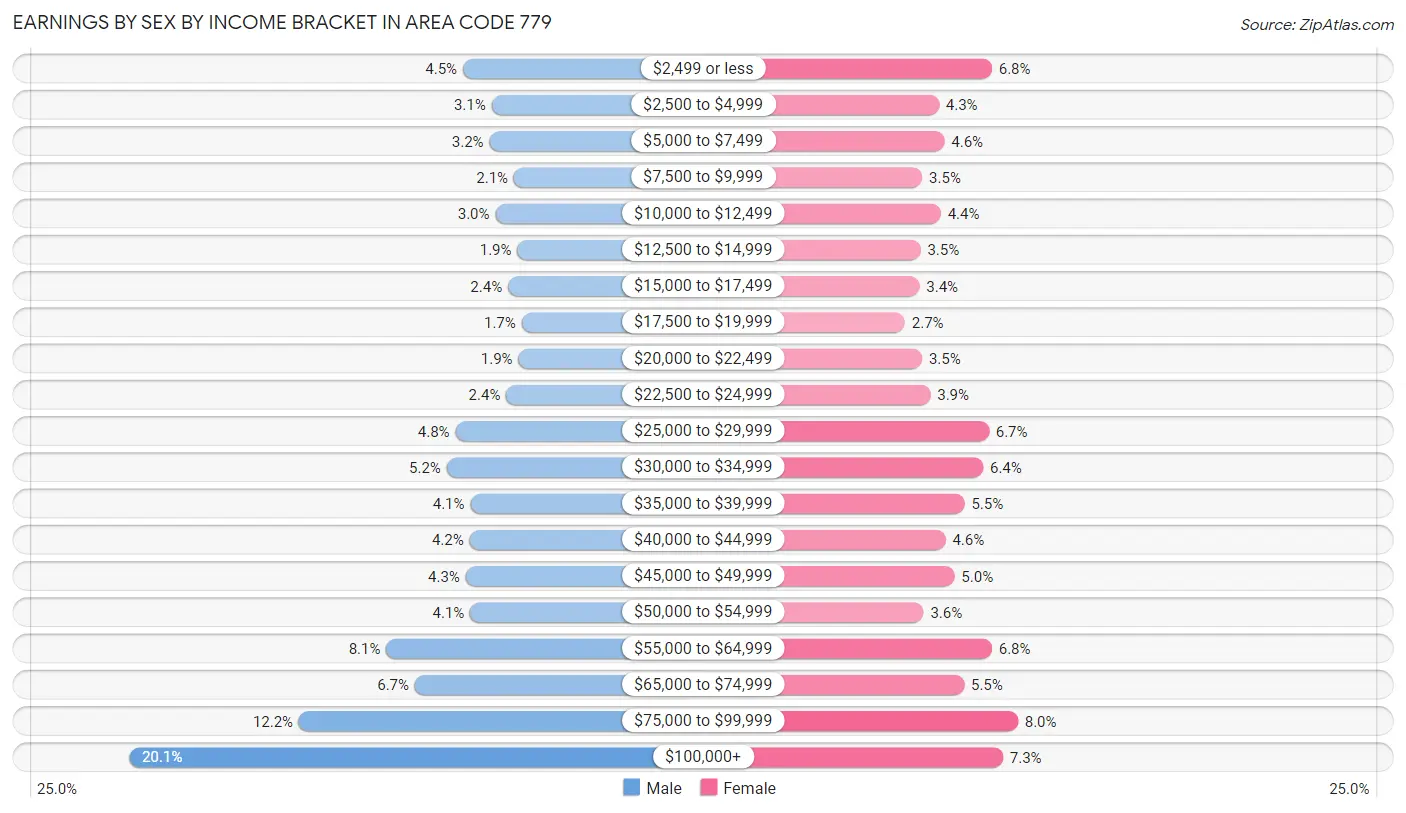
Earnings by Sex by Income Bracket in Area Code 779
The most common earnings brackets in Area Code 779 are $100,000+ for men (44,948 | 20.1%) and $75,000 to $99,999 for women (15,930 | 8.0%).
| Income | Male | Female |
| $2,499 or less | 9,983 (4.5%) | 13,521 (6.8%) |
| $2,500 to $4,999 | 7,007 (3.1%) | 8,586 (4.3%) |
| $5,000 to $7,499 | 7,229 (3.2%) | 9,086 (4.6%) |
| $7,500 to $9,999 | 4,642 (2.1%) | 7,025 (3.5%) |
| $10,000 to $12,499 | 6,596 (2.9%) | 8,756 (4.4%) |
| $12,500 to $14,999 | 4,292 (1.9%) | 6,866 (3.5%) |
| $15,000 to $17,499 | 5,281 (2.4%) | 6,763 (3.4%) |
| $17,500 to $19,999 | 3,839 (1.7%) | 5,417 (2.7%) |
| $20,000 to $22,499 | 4,176 (1.9%) | 7,010 (3.5%) |
| $22,500 to $24,999 | 5,464 (2.4%) | 7,787 (3.9%) |
| $25,000 to $29,999 | 10,774 (4.8%) | 13,243 (6.7%) |
| $30,000 to $34,999 | 11,698 (5.2%) | 12,694 (6.4%) |
| $35,000 to $39,999 | 9,205 (4.1%) | 10,959 (5.5%) |
| $40,000 to $44,999 | 9,299 (4.2%) | 9,201 (4.6%) |
| $45,000 to $49,999 | 9,695 (4.3%) | 10,033 (5.0%) |
| $50,000 to $54,999 | 9,226 (4.1%) | 7,149 (3.6%) |
| $55,000 to $64,999 | 18,021 (8.1%) | 13,505 (6.8%) |
| $65,000 to $74,999 | 15,014 (6.7%) | 10,921 (5.5%) |
| $75,000 to $99,999 | 27,154 (12.1%) | 15,930 (8.0%) |
| $100,000+ | 44,948 (20.1%) | 14,543 (7.3%) |
| Total | 223,543 (100.0%) | 198,995 (100.0%) |
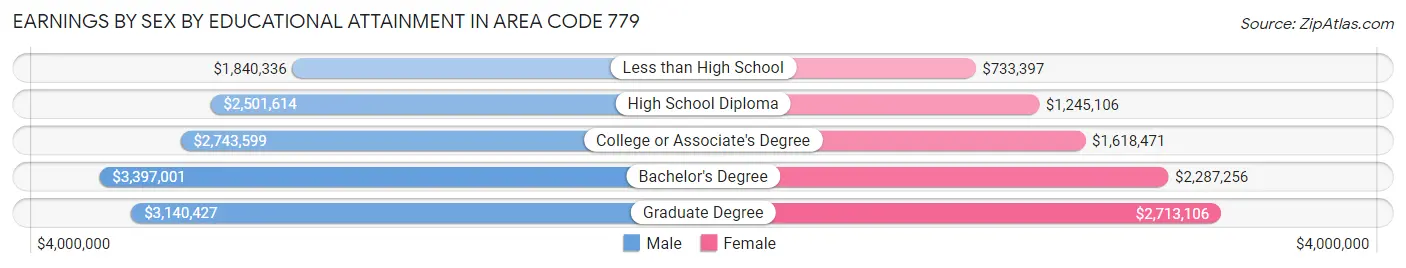
Earnings by Sex by Educational Attainment in Area Code 779
Average earnings in Area Code 779 are $2,879,140 for men and $1,752,781 for women, a difference of 39.1%. Men with an educational attainment of bachelor's degree enjoy the highest average annual earnings of $3,397,001, while those with less than high school education earn the least with $1,840,336. Women with an educational attainment of graduate degree earn the most with the average annual earnings of $2,713,106, while those with less than high school education have the smallest earnings of $733,397.
| Educational Attainment | Male Income | Female Income |
| Less than High School | $1,840,336 | $733,397 |
| High School Diploma | $2,501,614 | $1,245,106 |
| College or Associate's Degree | $2,743,599 | $1,618,471 |
| Bachelor's Degree | $3,397,001 | $2,287,256 |
| Graduate Degree | $3,140,427 | $2,713,106 |
| Total | $2,879,140 | $1,752,781 |
Family Income in Area Code 779
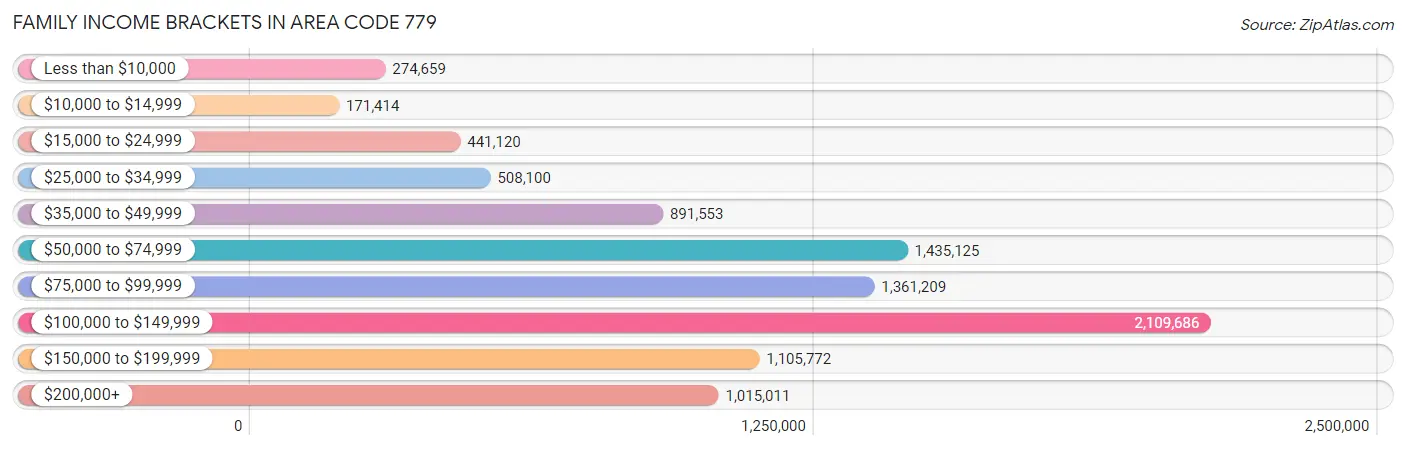
Family Income Brackets in Area Code 779
According to the Area Code 779 family income data, there are 2,109,686 families falling into the $100,000 to $149,999 income range, which is the most common income bracket and makes up 1,064.6% of all families. Conversely, the $10,000 to $14,999 income bracket is the least frequent group with only 171,414 families (86.5%) belonging to this category.
| Income Bracket | # Families | % Families |
| Less than $10,000 | 274,659 | 138.6% |
| $10,000 to $14,999 | 171,414 | 86.5% |
| $15,000 to $24,999 | 441,120 | 222.6% |
| $25,000 to $34,999 | 508,100 | 256.4% |
| $35,000 to $49,999 | 891,553 | 449.9% |
| $50,000 to $74,999 | 1,435,125 | 724.2% |
| $75,000 to $99,999 | 1,361,209 | 686.9% |
| $100,000 to $149,999 | 2,109,686 | 1,064.6% |
| $150,000 to $199,999 | 1,105,772 | 558.0% |
| $200,000+ | 1,015,011 | 512.2% |
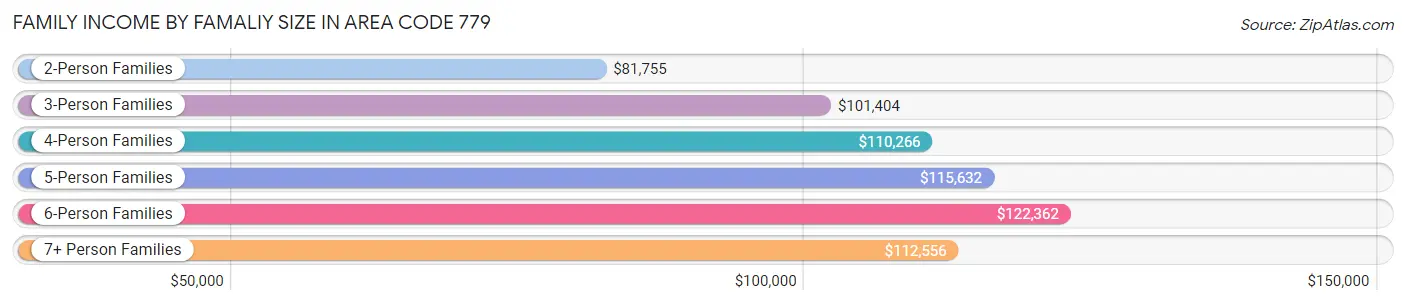
Family Income by Famaliy Size in Area Code 779
6-person families (6,187 | 3.1%) account for the highest median family income in Area Code 779 with $122,362 per family, while 2-person families (88,836 | 44.8%) have the highest median income of $40,878 per family member.
| Income Bracket | # Families | Median Income |
| 2-Person Families | 88,836 (44.8%) | $81,755 |
| 3-Person Families | 44,804 (22.6%) | $101,404 |
| 4-Person Families | 37,371 (18.9%) | $110,266 |
| 5-Person Families | 17,768 (9.0%) | $115,632 |
| 6-Person Families | 6,187 (3.1%) | $122,362 |
| 7+ Person Families | 3,201 (1.6%) | $112,556 |
| Total | 198,167 (100.0%) | $94,440 |
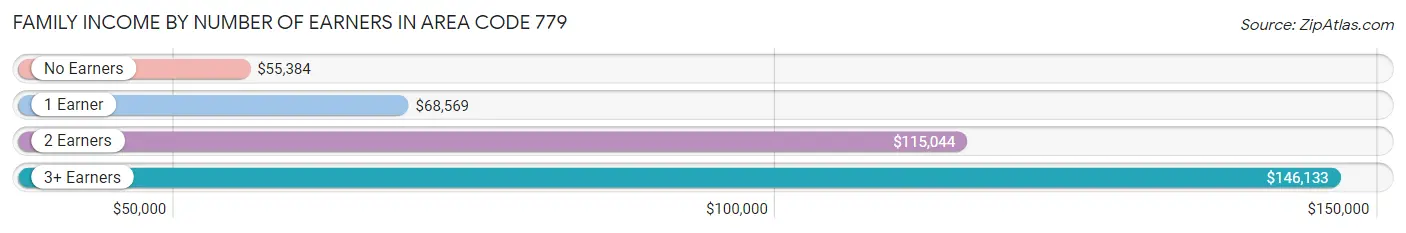
Family Income by Number of Earners in Area Code 779
The median family income in Area Code 779 is $94,440, with families comprising 3+ earners (29,536) having the highest median family income of $146,133, while families with no earners (27,290) have the lowest median family income of $55,384, accounting for 14.9% and 13.8% of families, respectively.
| Number of Earners | # Families | Median Income |
| No Earners | 27,290 (13.8%) | $55,384 |
| 1 Earner | 60,397 (30.5%) | $68,569 |
| 2 Earners | 80,944 (40.8%) | $115,044 |
| 3+ Earners | 29,536 (14.9%) | $146,133 |
| Total | 198,167 (100.0%) | $94,440 |
Household Income in Area Code 779
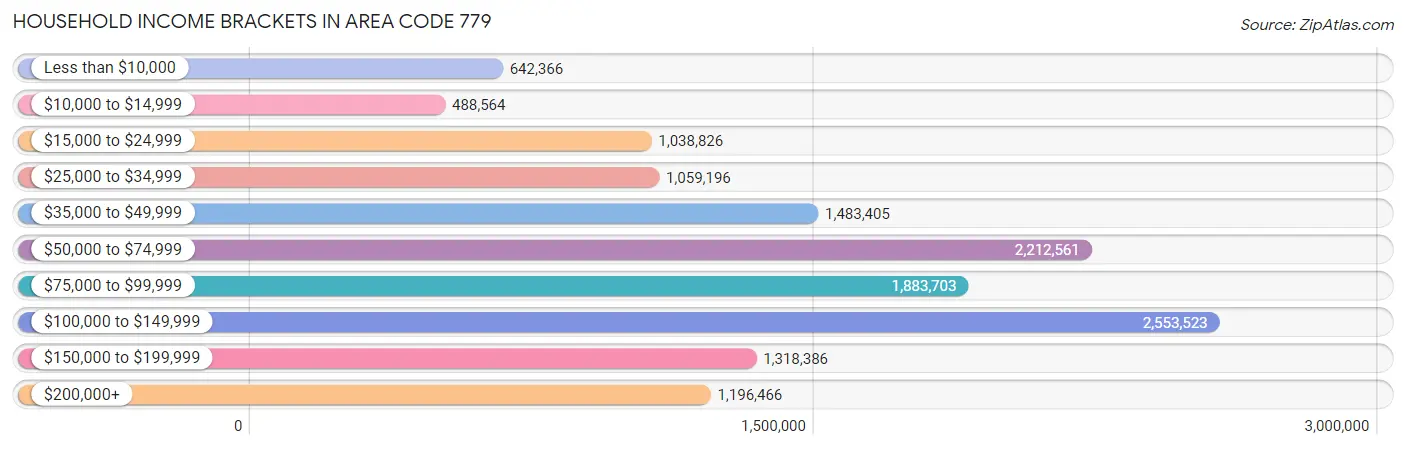
Household Income Brackets in Area Code 779
With 2,553,523 households falling in the category, the $100,000 to $149,999 income range is the most frequent in Area Code 779, accounting for 865.0% of all households. In contrast, only 488,564 households (165.5%) fall into the $10,000 to $14,999 income bracket, making it the least populous group.
| Income Bracket | # Households | % Households |
| Less than $10,000 | 642,366 | 217.6% |
| $10,000 to $14,999 | 488,564 | 165.5% |
| $15,000 to $24,999 | 1,038,826 | 351.9% |
| $25,000 to $34,999 | 1,059,196 | 358.8% |
| $35,000 to $49,999 | 1,483,405 | 502.5% |
| $50,000 to $74,999 | 2,212,561 | 749.5% |
| $75,000 to $99,999 | 1,883,703 | 638.1% |
| $100,000 to $149,999 | 2,553,523 | 865.0% |
| $150,000 to $199,999 | 1,318,386 | 446.6% |
| $200,000+ | 1,196,466 | 405.3% |
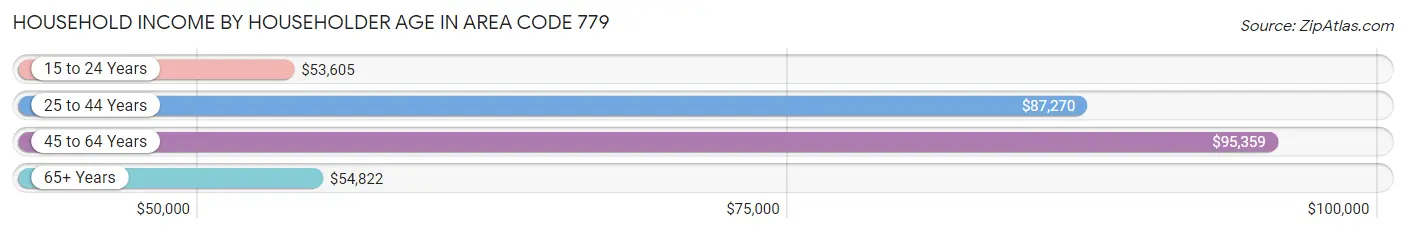
Household Income by Householder Age in Area Code 779
The median household income in Area Code 779 is $79,255, with the highest median household income of $95,359 found in the 45 to 64 years age bracket for the primary householder. A total of 114,807 households (38.9%) fall into this category. Meanwhile, the 15 to 24 years age bracket for the primary householder has the lowest median household income of $53,605, with 11,511 households (3.9%) in this group.
| Income Bracket | # Households | Median Income |
| 15 to 24 Years | 11,511 (3.9%) | $53,605 |
| 25 to 44 Years | 90,151 (30.5%) | $87,270 |
| 45 to 64 Years | 114,807 (38.9%) | $95,359 |
| 65+ Years | 78,736 (26.7%) | $54,822 |
| Total | 295,205 (100.0%) | $79,255 |
Poverty in Area Code 779
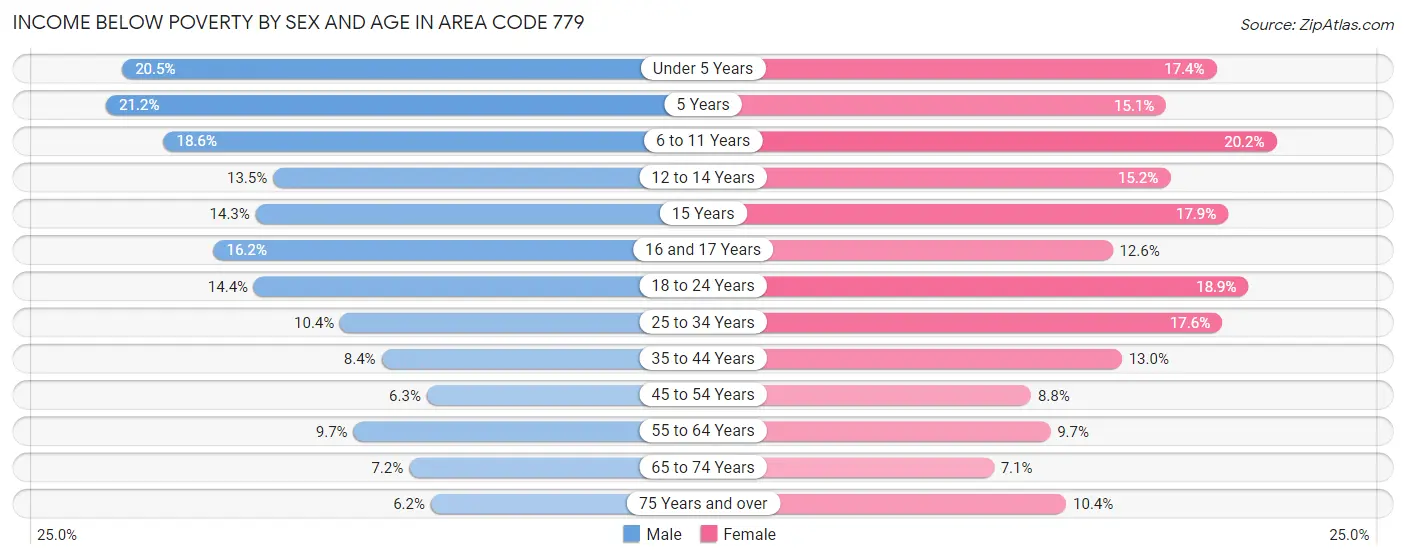
Income Below Poverty by Sex and Age in Area Code 779
With 11.2% poverty level for males and 13.3% for females among the residents of Area Code 779, 5 year old males and 6 to 11 year old females are the most vulnerable to poverty, with 1,110 males (21.2%) and 5,554 females (20.2%) in their respective age groups living below the poverty level.
| Age Bracket | Male | Female |
| Under 5 Years | 4,504 (20.5%) | 3,597 (17.4%) |
| 5 Years | 1,110 (21.2%) | 730 (15.0%) |
| 6 to 11 Years | 5,874 (18.5%) | 5,554 (20.2%) |
| 12 to 14 Years | 2,341 (13.5%) | 2,445 (15.2%) |
| 15 Years | 823 (14.3%) | 993 (17.9%) |
| 16 and 17 Years | 1,818 (16.2%) | 1,331 (12.6%) |
| 18 to 24 Years | 5,505 (14.4%) | 6,901 (18.9%) |
| 25 to 34 Years | 4,757 (10.4%) | 8,161 (17.6%) |
| 35 to 44 Years | 4,005 (8.4%) | 6,271 (13.0%) |
| 45 to 54 Years | 3,318 (6.3%) | 4,420 (8.8%) |
| 55 to 64 Years | 4,866 (9.7%) | 4,939 (9.7%) |
| 65 to 74 Years | 2,505 (7.2%) | 2,649 (7.0%) |
| 75 Years and over | 1,219 (6.1%) | 2,964 (10.4%) |
| Total | 42,645 (11.2%) | 50,955 (13.3%) |
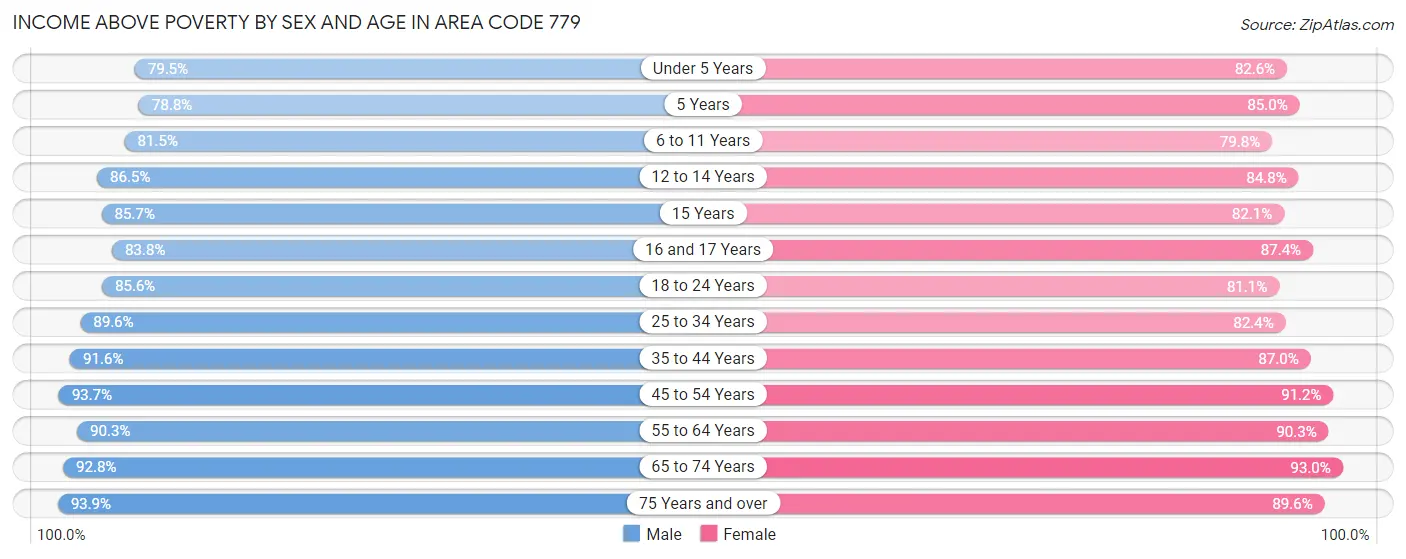
Income Above Poverty by Sex and Age in Area Code 779
According to the poverty statistics in Area Code 779, males aged 75 years and over and females aged 65 to 74 years are the age groups that are most secure financially, with 93.9% of males and 92.9% of females in these age groups living above the poverty line.
| Age Bracket | Male | Female |
| Under 5 Years | 17,501 (79.5%) | 17,100 (82.6%) |
| 5 Years | 4,120 (78.8%) | 4,122 (85.0%) |
| 6 to 11 Years | 25,791 (81.5%) | 21,990 (79.8%) |
| 12 to 14 Years | 15,037 (86.5%) | 13,613 (84.8%) |
| 15 Years | 4,939 (85.7%) | 4,549 (82.1%) |
| 16 and 17 Years | 9,381 (83.8%) | 9,262 (87.4%) |
| 18 to 24 Years | 32,824 (85.6%) | 29,694 (81.1%) |
| 25 to 34 Years | 41,154 (89.6%) | 38,102 (82.4%) |
| 35 to 44 Years | 43,452 (91.6%) | 42,023 (87.0%) |
| 45 to 54 Years | 49,028 (93.7%) | 45,919 (91.2%) |
| 55 to 64 Years | 45,091 (90.3%) | 46,119 (90.3%) |
| 65 to 74 Years | 32,484 (92.8%) | 34,943 (92.9%) |
| 75 Years and over | 18,612 (93.9%) | 25,506 (89.6%) |
| Total | 339,414 (88.8%) | 332,942 (86.7%) |
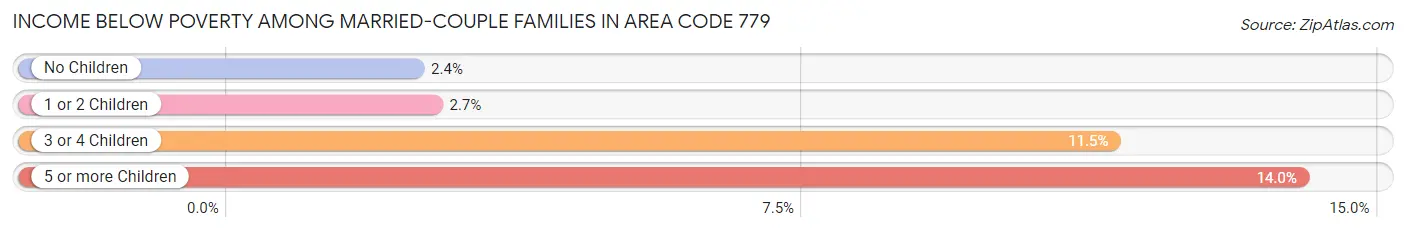
Income Below Poverty Among Married-Couple Families in Area Code 779
The poverty statistics for married-couple families in Area Code 779 show that 3.4% or 4,972 of the total 147,686 families live below the poverty line. Families with 5 or more children have the highest poverty rate of 14.0%, comprising of 139 families. On the other hand, families with no children have the lowest poverty rate of 2.4%, which includes 2,100 families.
| Children | Above Poverty | Below Poverty |
| No Children | 84,479 (97.6%) | 2,100 (2.4%) |
| 1 or 2 Children | 46,091 (97.3%) | 1,263 (2.7%) |
| 3 or 4 Children | 11,289 (88.5%) | 1,470 (11.5%) |
| 5 or more Children | 855 (86.0%) | 139 (14.0%) |
| Total | 142,714 (96.6%) | 4,972 (3.4%) |
Income Below Poverty Among Single-Parent Households in Area Code 779
According to the poverty data in Area Code 779, 12.1% or 1,778 single-father households and 28.2% or 10,102 single-mother households are living below the poverty line. Among single-father households, those with 5 or more children have the highest poverty rate, with 81 households (48.2%) experiencing poverty. Likewise, among single-mother households, those with 5 or more children have the highest poverty rate, with 361 households (72.9%) falling below the poverty line.
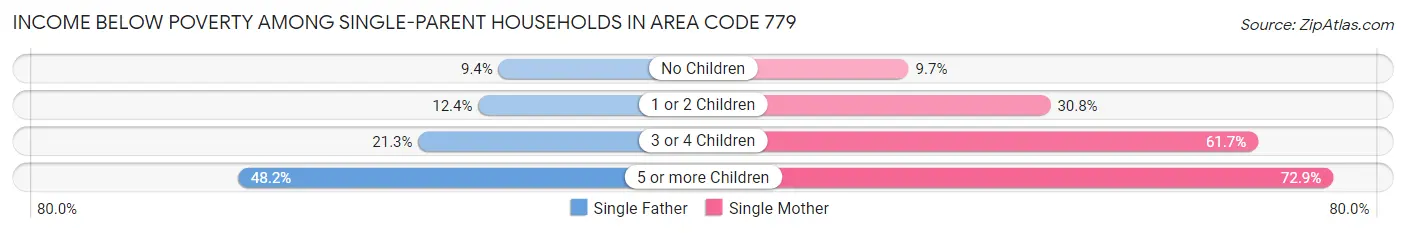
| Children | Single Father | Single Mother |
| No Children | 630 (9.4%) | 1,191 (9.7%) |
| 1 or 2 Children | 811 (12.4%) | 5,654 (30.8%) |
| 3 or 4 Children | 256 (21.3%) | 2,896 (61.7%) |
| 5 or more Children | 81 (48.2%) | 361 (72.9%) |
| Total | 1,778 (12.1%) | 10,102 (28.2%) |
Income Below Poverty Among Married-Couple vs Single-Parent Households in Area Code 779
The poverty data for Area Code 779 shows that 4,972 of the married-couple family households (3.4%) and 11,880 of the single-parent households (23.5%) are living below the poverty level. Within the married-couple family households, those with 5 or more children have the highest poverty rate, with 139 households (14.0%) falling below the poverty line. Among the single-parent households, those with 5 or more children have the highest poverty rate, with 442 household (66.7%) living below poverty.
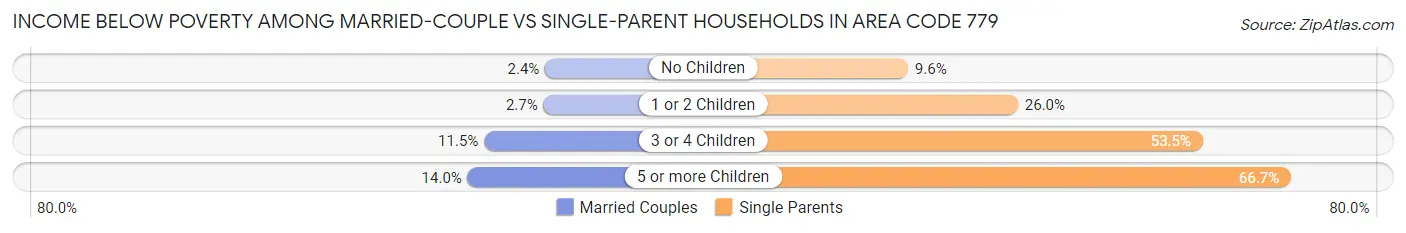
| Children | Married-Couple Families | Single-Parent Households |
| No Children | 2,100 (2.4%) | 1,821 (9.6%) |
| 1 or 2 Children | 1,263 (2.7%) | 6,465 (26.0%) |
| 3 or 4 Children | 1,470 (11.5%) | 3,152 (53.5%) |
| 5 or more Children | 139 (14.0%) | 442 (66.7%) |
| Total | 4,972 (3.4%) | 11,880 (23.5%) |
Race in Area Code 779
The most populous races in Area Code 779 are White / Caucasian (584,697 | 74.8%), Hispanic or Latino (127,084 | 16.3%), and Black / African American (79,056 | 10.1%).
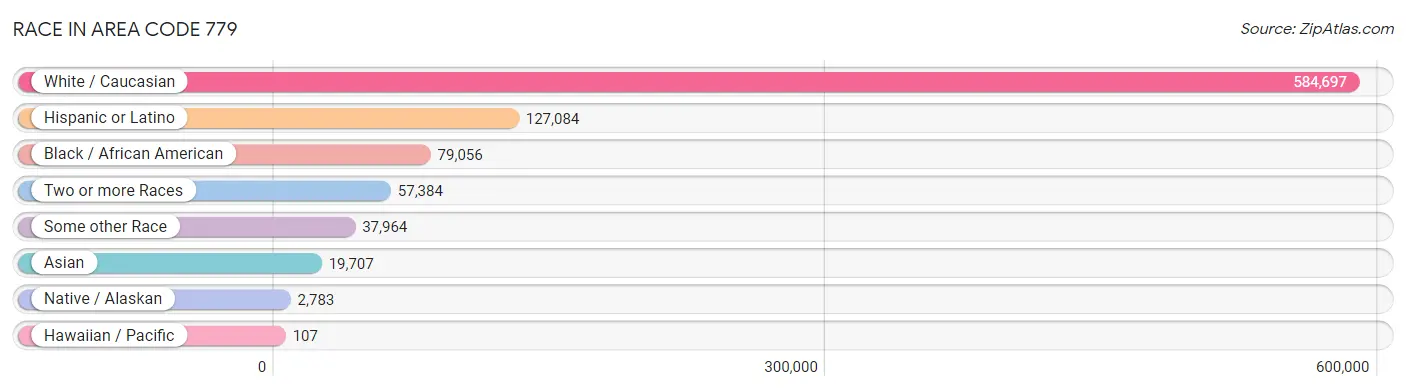
| Race | # Population | % Population |
| Asian | 19,707 | 2.5% |
| Black / African American | 79,056 | 10.1% |
| Hawaiian / Pacific | 107 | 0.0% |
| Hispanic or Latino | 127,084 | 16.3% |
| Native / Alaskan | 2,783 | 0.4% |
| White / Caucasian | 584,697 | 74.8% |
| Two or more Races | 57,384 | 7.3% |
| Some other Race | 37,964 | 4.9% |
| Total | 781,698 | 100.0% |
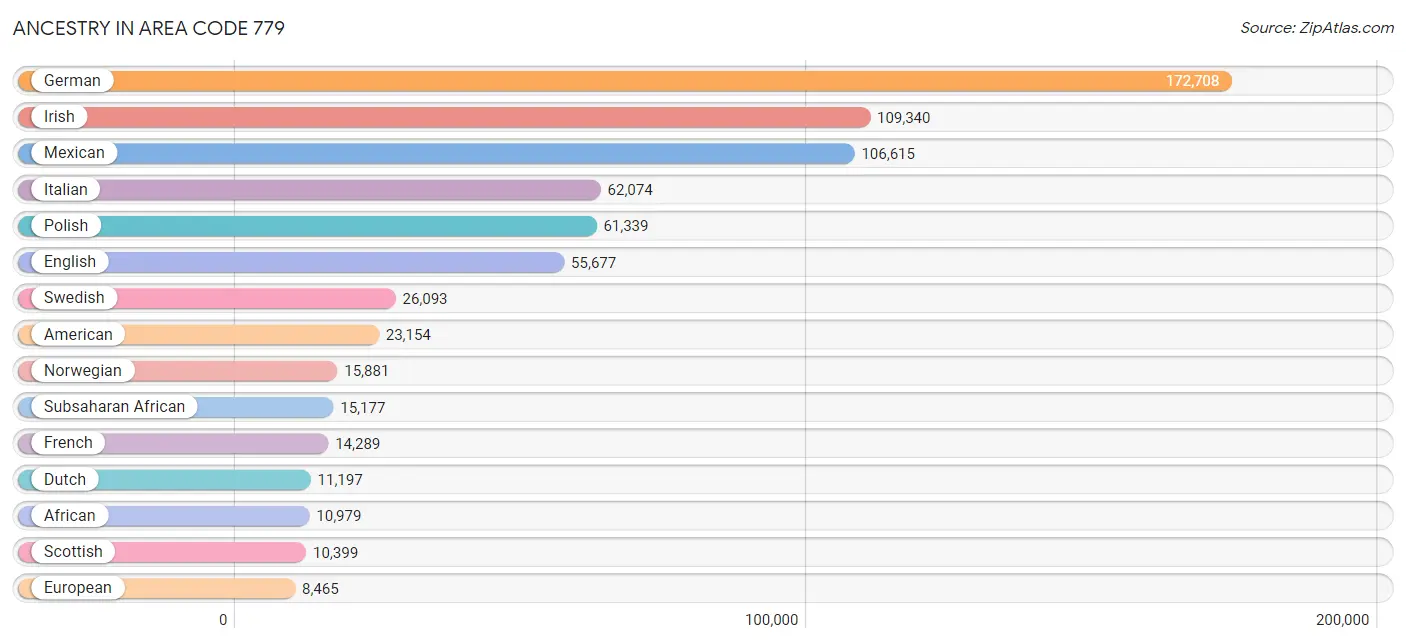
Ancestry in Area Code 779
The most populous ancestries reported in Area Code 779 are German (172,708 | 22.1%), Irish (109,340 | 14.0%), Mexican (106,615 | 13.6%), Italian (62,074 | 7.9%), and Polish (61,339 | 7.9%), together accounting for 65.5% of all Area Code 779 residents.
| Ancestry | # Population | % Population |
| African | 10,979 | 1.4% |
| Albanian | 183 | 0.0% |
| Alsatian | 9 | 0.0% |
| American | 23,154 | 3.0% |
| Apache | 347 | 0.0% |
| Arab | 2,644 | 0.3% |
| Arapaho | 34 | 0.0% |
| Argentinean | 239 | 0.0% |
| Armenian | 380 | 0.1% |
| Assyrian / Chaldean / Syriac | 34 | 0.0% |
| Australian | 176 | 0.0% |
| Austrian | 1,667 | 0.2% |
| Bahamian | 7 | 0.0% |
| Bangladeshi | 49 | 0.0% |
| Barbadian | 67 | 0.0% |
| Basque | 12 | 0.0% |
| Belgian | 1,711 | 0.2% |
| Belizean | 174 | 0.0% |
| Bhutanese | 996 | 0.1% |
| Blackfeet | 592 | 0.1% |
| Brazilian | 283 | 0.0% |
| British | 2,785 | 0.4% |
| British West Indian | 64 | 0.0% |
| Bulgarian | 447 | 0.1% |
| Burmese | 1,820 | 0.2% |
| Cajun | 32 | 0.0% |
| Cambodian | 198 | 0.0% |
| Canadian | 833 | 0.1% |
| Carpatho Rusyn | 7 | 0.0% |
| Celtic | 45 | 0.0% |
| Central American | 2,501 | 0.3% |
| Central American Indian | 524 | 0.1% |
| Cherokee | 2,239 | 0.3% |
| Cheyenne | 38 | 0.0% |
| Chickasaw | 11 | 0.0% |
| Chilean | 368 | 0.1% |
| Chinese | 18 | 0.0% |
| Chippewa | 203 | 0.0% |
| Choctaw | 250 | 0.0% |
| Colombian | 1,397 | 0.2% |
| Comanche | 58 | 0.0% |
| Costa Rican | 117 | 0.0% |
| Cree | 3 | 0.0% |
| Creek | 22 | 0.0% |
| Croatian | 2,160 | 0.3% |
| Cuban | 1,395 | 0.2% |
| Cypriot | 35 | 0.0% |
| Czech | 6,959 | 0.9% |
| Czechoslovakian | 1,041 | 0.1% |
| Danish | 4,178 | 0.5% |
| Dominican | 444 | 0.1% |
| Dutch | 11,197 | 1.4% |
| Eastern European | 1,364 | 0.2% |
| Ecuadorian | 231 | 0.0% |
| Egyptian | 557 | 0.1% |
| English | 55,677 | 7.1% |
| Estonian | 88 | 0.0% |
| Ethiopian | 176 | 0.0% |
| European | 8,465 | 1.1% |
| Filipino | 27 | 0.0% |
| Finnish | 1,010 | 0.1% |
| French | 14,289 | 1.8% |
| French American Indian | 10 | 0.0% |
| French Canadian | 2,878 | 0.4% |
| German | 172,708 | 22.1% |
| Ghanaian | 126 | 0.0% |
| Greek | 4,361 | 0.6% |
| Guamanian / Chamorro | 126 | 0.0% |
| Guatemalan | 665 | 0.1% |
| Guyanese | 45 | 0.0% |
| Haitian | 345 | 0.0% |
| Honduran | 289 | 0.0% |
| Hopi | 5 | 0.0% |
| Hungarian | 3,276 | 0.4% |
| Icelander | 19 | 0.0% |
| Indian (Asian) | 3,286 | 0.4% |
| Indonesian | 530 | 0.1% |
| Inupiat | 2 | 0.0% |
| Iranian | 169 | 0.0% |
| Iraqi | 153 | 0.0% |
| Irish | 109,340 | 14.0% |
| Iroquois | 90 | 0.0% |
| Israeli | 112 | 0.0% |
| Italian | 62,074 | 7.9% |
| Jamaican | 708 | 0.1% |
| Japanese | 158 | 0.0% |
| Jordanian | 217 | 0.0% |
| Kenyan | 57 | 0.0% |
| Korean | 6,966 | 0.9% |
| Laotian | 266 | 0.0% |
| Latvian | 333 | 0.0% |
| Lebanese | 348 | 0.0% |
| Liberian | 17 | 0.0% |
| Lithuanian | 5,051 | 0.6% |
| Lumbee | 68 | 0.0% |
| Luxembourger | 251 | 0.0% |
| Macedonian | 305 | 0.0% |
| Malaysian | 1,362 | 0.2% |
| Maltese | 201 | 0.0% |
| Menominee | 47 | 0.0% |
| Mexican | 106,615 | 13.6% |
| Mexican American Indian | 2,345 | 0.3% |
| Mongolian | 176 | 0.0% |
| Moroccan | 17 | 0.0% |
| Native Hawaiian | 275 | 0.0% |
| Navajo | 47 | 0.0% |
| New Zealander | 5 | 0.0% |
| Nicaraguan | 211 | 0.0% |
| Nigerian | 2,647 | 0.3% |
| Northern European | 880 | 0.1% |
| Norwegian | 15,881 | 2.0% |
| Ottawa | 8 | 0.0% |
| Pakistani | 692 | 0.1% |
| Palestinian | 506 | 0.1% |
| Panamanian | 198 | 0.0% |
| Pennsylvania German | 216 | 0.0% |
| Peruvian | 452 | 0.1% |
| Polish | 61,339 | 7.9% |
| Portuguese | 456 | 0.1% |
| Potawatomi | 17 | 0.0% |
| Pueblo | 22 | 0.0% |
| Puerto Rican | 7,688 | 1.0% |
| Romanian | 1,154 | 0.2% |
| Russian | 4,144 | 0.5% |
| Salvadoran | 1,021 | 0.1% |
| Samoan | 116 | 0.0% |
| Scandinavian | 1,984 | 0.3% |
| Scotch-Irish | 4,068 | 0.5% |
| Scottish | 10,399 | 1.3% |
| Seminole | 11 | 0.0% |
| Serbian | 737 | 0.1% |
| Shoshone | 1 | 0.0% |
| Sioux | 214 | 0.0% |
| Slavic | 359 | 0.1% |
| Slovak | 2,085 | 0.3% |
| Slovene | 1,612 | 0.2% |
| Somali | 56 | 0.0% |
| South African | 223 | 0.0% |
| South American | 3,012 | 0.4% |
| South American Indian | 163 | 0.0% |
| Spaniard | 2,504 | 0.3% |
| Spanish | 656 | 0.1% |
| Spanish American Indian | 11 | 0.0% |
| Sri Lankan | 1,442 | 0.2% |
| Subsaharan African | 15,177 | 1.9% |
| Sudanese | 82 | 0.0% |
| Swedish | 26,093 | 3.3% |
| Swiss | 1,932 | 0.3% |
| Syrian | 137 | 0.0% |
| Taiwanese | 22 | 0.0% |
| Thai | 6,418 | 0.8% |
| Tongan | 90 | 0.0% |
| Trinidadian and Tobagonian | 58 | 0.0% |
| Turkish | 108 | 0.0% |
| Ukrainian | 2,328 | 0.3% |
| Uruguayan | 15 | 0.0% |
| Venezuelan | 271 | 0.0% |
| Vietnamese | 84 | 0.0% |
| Welsh | 3,493 | 0.4% |
| West Indian | 109 | 0.0% |
| Yaqui | 1 | 0.0% |
| Yugoslavian | 675 | 0.1% | View All 162 Rows |
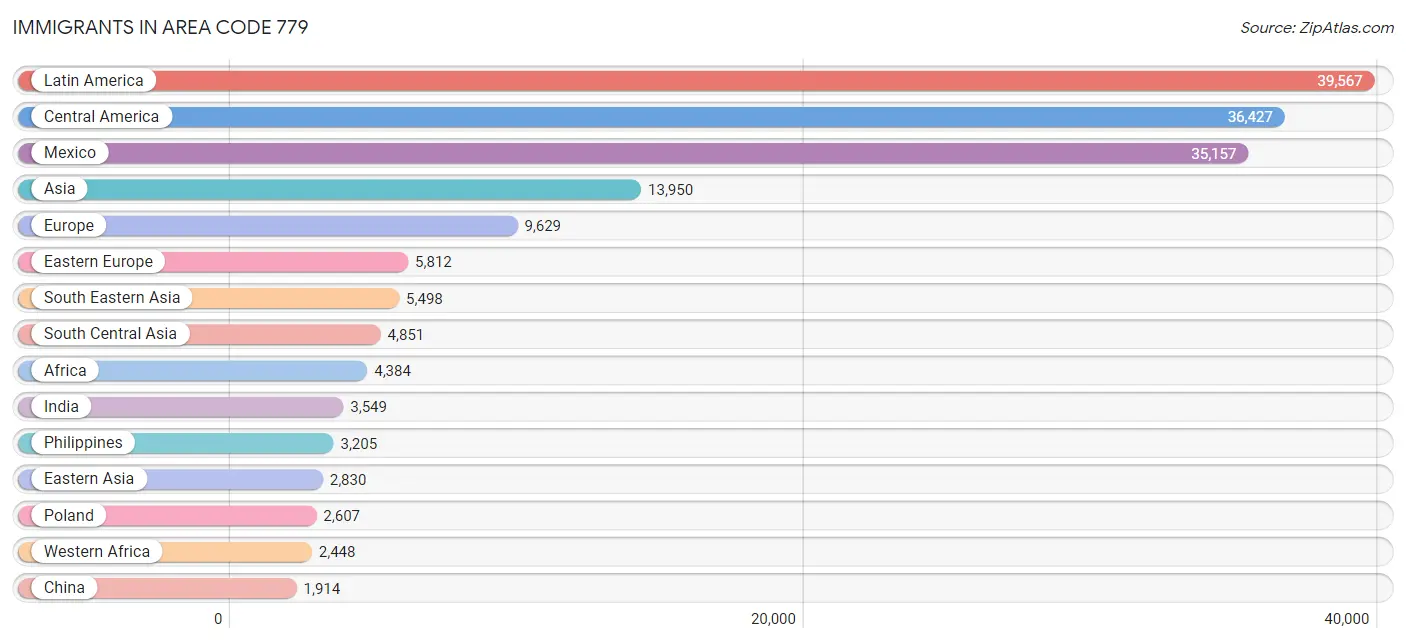
Immigrants in Area Code 779
The most numerous immigrant groups reported in Area Code 779 came from Latin America (39,567 | 5.1%), Central America (36,427 | 4.7%), Mexico (35,157 | 4.5%), Asia (13,950 | 1.8%), and Europe (9,629 | 1.2%), together accounting for 17.2% of all Area Code 779 residents.
| Immigration Origin | # Population | % Population |
| Africa | 4,384 | 0.6% |
| Albania | 4 | 0.0% |
| Argentina | 131 | 0.0% |
| Asia | 13,950 | 1.8% |
| Australia | 117 | 0.0% |
| Austria | 46 | 0.0% |
| Bangladesh | 67 | 0.0% |
| Barbados | 91 | 0.0% |
| Belarus | 109 | 0.0% |
| Belgium | 23 | 0.0% |
| Belize | 18 | 0.0% |
| Bosnia and Herzegovina | 193 | 0.0% |
| Brazil | 178 | 0.0% |
| Bulgaria | 185 | 0.0% |
| Cambodia | 63 | 0.0% |
| Cameroon | 74 | 0.0% |
| Canada | 980 | 0.1% |
| Caribbean | 1,285 | 0.2% |
| Central America | 36,427 | 4.7% |
| Chile | 138 | 0.0% |
| China | 1,914 | 0.2% |
| Colombia | 797 | 0.1% |
| Congo | 69 | 0.0% |
| Croatia | 66 | 0.0% |
| Cuba | 411 | 0.1% |
| Czechoslovakia | 234 | 0.0% |
| Denmark | 30 | 0.0% |
| Dominica | 31 | 0.0% |
| Dominican Republic | 243 | 0.0% |
| Eastern Africa | 776 | 0.1% |
| Eastern Asia | 2,830 | 0.4% |
| Eastern Europe | 5,812 | 0.7% |
| Ecuador | 95 | 0.0% |
| Egypt | 409 | 0.1% |
| El Salvador | 463 | 0.1% |
| England | 416 | 0.1% |
| Eritrea | 40 | 0.0% |
| Ethiopia | 38 | 0.0% |
| Europe | 9,629 | 1.2% |
| Fiji | 14 | 0.0% |
| France | 176 | 0.0% |
| Germany | 1,005 | 0.1% |
| Ghana | 396 | 0.1% |
| Greece | 395 | 0.1% |
| Guatemala | 301 | 0.0% |
| Haiti | 255 | 0.0% |
| Honduras | 315 | 0.0% |
| Hong Kong | 108 | 0.0% |
| Hungary | 77 | 0.0% |
| India | 3,549 | 0.4% |
| Indonesia | 80 | 0.0% |
| Iran | 110 | 0.0% |
| Iraq | 202 | 0.0% |
| Ireland | 226 | 0.0% |
| Israel | 5 | 0.0% |
| Italy | 427 | 0.1% |
| Jamaica | 156 | 0.0% |
| Japan | 168 | 0.0% |
| Jordan | 141 | 0.0% |
| Kazakhstan | 27 | 0.0% |
| Kenya | 147 | 0.0% |
| Korea | 634 | 0.1% |
| Kuwait | 41 | 0.0% |
| Laos | 632 | 0.1% |
| Latin America | 39,567 | 5.1% |
| Latvia | 37 | 0.0% |
| Lebanon | 41 | 0.0% |
| Liberia | 12 | 0.0% |
| Lithuania | 521 | 0.1% |
| Malaysia | 178 | 0.0% |
| Mexico | 35,157 | 4.5% |
| Middle Africa | 392 | 0.1% |
| Moldova | 171 | 0.0% |
| Morocco | 14 | 0.0% |
| Nepal | 94 | 0.0% |
| Netherlands | 106 | 0.0% |
| Nicaragua | 63 | 0.0% |
| Nigeria | 1,901 | 0.2% |
| North Macedonia | 180 | 0.0% |
| Northern Africa | 576 | 0.1% |
| Northern Europe | 1,445 | 0.2% |
| Norway | 41 | 0.0% |
| Oceania | 138 | 0.0% |
| Pakistan | 866 | 0.1% |
| Panama | 110 | 0.0% |
| Peru | 143 | 0.0% |
| Philippines | 3,205 | 0.4% |
| Poland | 2,607 | 0.3% |
| Romania | 144 | 0.0% |
| Russia | 455 | 0.1% |
| Saudi Arabia | 156 | 0.0% |
| Scotland | 189 | 0.0% |
| Serbia | 126 | 0.0% |
| South Africa | 146 | 0.0% |
| South America | 1,855 | 0.2% |
| South Central Asia | 4,851 | 0.6% |
| South Eastern Asia | 5,498 | 0.7% |
| Southern Europe | 938 | 0.1% |
| Spain | 116 | 0.0% |
| Sri Lanka | 11 | 0.0% |
| Sudan | 70 | 0.0% |
| Sweden | 100 | 0.0% |
| Switzerland | 55 | 0.0% |
| Syria | 29 | 0.0% |
| Taiwan | 86 | 0.0% |
| Thailand | 479 | 0.1% |
| Trinidad and Tobago | 79 | 0.0% |
| Turkey | 6 | 0.0% |
| Uganda | 39 | 0.0% |
| Ukraine | 302 | 0.0% |
| Uruguay | 15 | 0.0% |
| Uzbekistan | 61 | 0.0% |
| Venezuela | 331 | 0.0% |
| Vietnam | 649 | 0.1% |
| Western Africa | 2,448 | 0.3% |
| Western Asia | 738 | 0.1% |
| Western Europe | 1,411 | 0.2% |
| Yemen | 41 | 0.0% |
| Zaire | 233 | 0.0% |
| Zimbabwe | 6 | 0.0% | View All 120 Rows |
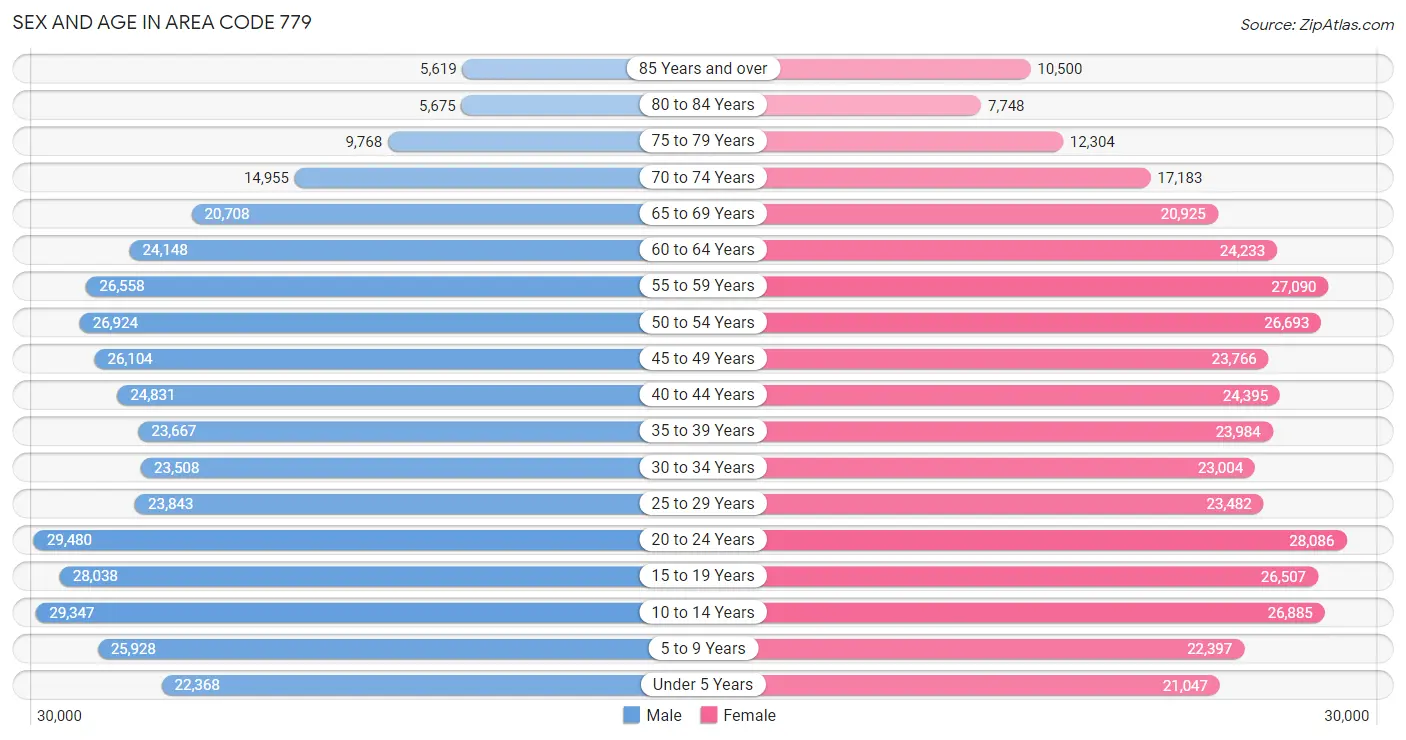
Sex and Age in Area Code 779
Sex and Age in Area Code 779
The most populous age groups in Area Code 779 are 20 to 24 Years (29,480 | 7.5%) for men and 20 to 24 Years (28,086 | 7.2%) for women.
| Age Bracket | Male | Female |
| Under 5 Years | 22,368 (5.7%) | 21,047 (5.4%) |
| 5 to 9 Years | 25,928 (6.6%) | 22,397 (5.7%) |
| 10 to 14 Years | 29,347 (7.5%) | 26,885 (6.9%) |
| 15 to 19 Years | 28,038 (7.2%) | 26,507 (6.8%) |
| 20 to 24 Years | 29,480 (7.5%) | 28,086 (7.2%) |
| 25 to 29 Years | 23,843 (6.1%) | 23,482 (6.0%) |
| 30 to 34 Years | 23,508 (6.0%) | 23,004 (5.9%) |
| 35 to 39 Years | 23,667 (6.0%) | 23,984 (6.1%) |
| 40 to 44 Years | 24,831 (6.3%) | 24,395 (6.2%) |
| 45 to 49 Years | 26,104 (6.7%) | 23,766 (6.1%) |
| 50 to 54 Years | 26,924 (6.9%) | 26,693 (6.8%) |
| 55 to 59 Years | 26,558 (6.8%) | 27,090 (6.9%) |
| 60 to 64 Years | 24,148 (6.2%) | 24,233 (6.2%) |
| 65 to 69 Years | 20,708 (5.3%) | 20,925 (5.4%) |
| 70 to 74 Years | 14,955 (3.8%) | 17,183 (4.4%) |
| 75 to 79 Years | 9,768 (2.5%) | 12,304 (3.2%) |
| 80 to 84 Years | 5,675 (1.5%) | 7,748 (2.0%) |
| 85 Years and over | 5,619 (1.4%) | 10,500 (2.7%) |
| Total | 391,469 (100.0%) | 390,229 (100.0%) |
Families and Households in Area Code 779
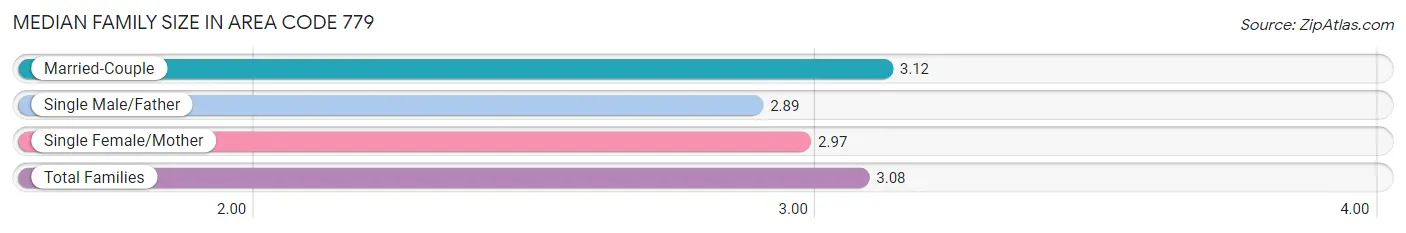
Median Family Size in Area Code 779
The median family size in Area Code 779 is 3.08 persons per family, with married-couple families (147,686 | 74.5%) accounting for the largest median family size of 3.11893 persons per family. On the other hand, single male/father families (14,641 | 7.4%) represent the smallest median family size with 2.89 persons per family.
| Family Type | # Families | Family Size |
| Married-Couple | 147,686 (74.5%) | 3.12 |
| Single Male/Father | 14,641 (7.4%) | 2.89 |
| Single Female/Mother | 35,840 (18.1%) | 2.97 |
| Total Families | 198,167 (100.0%) | 3.08 |
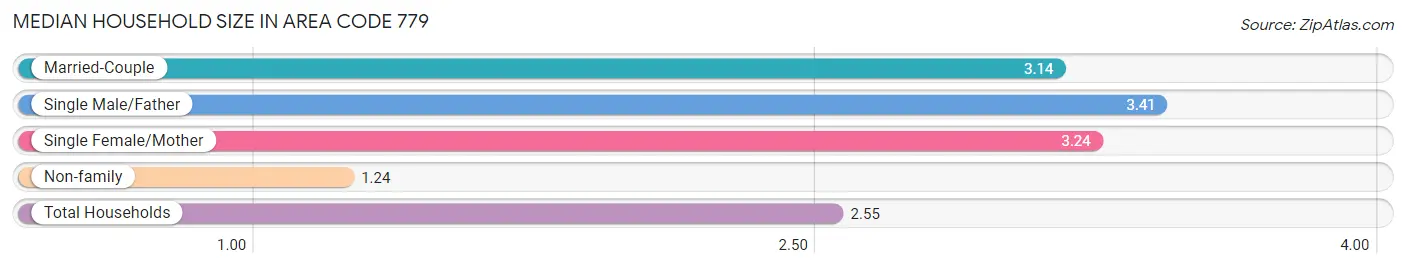
Median Household Size in Area Code 779
The median household size in Area Code 779 is 2.55 persons per household, with single male/father households (14,641 | 5.0%) accounting for the largest median household size of 3.41276 persons per household. non-family households (97,038 | 32.9%) represent the smallest median household size with 1.24 persons per household.
| Household Type | # Households | Household Size |
| Married-Couple | 147,686 (50.0%) | 3.14 |
| Single Male/Father | 14,641 (5.0%) | 3.41 |
| Single Female/Mother | 35,840 (12.1%) | 3.24 |
| Non-family | 97,038 (32.9%) | 1.24 |
| Total Households | 295,205 (100.0%) | 2.55 |
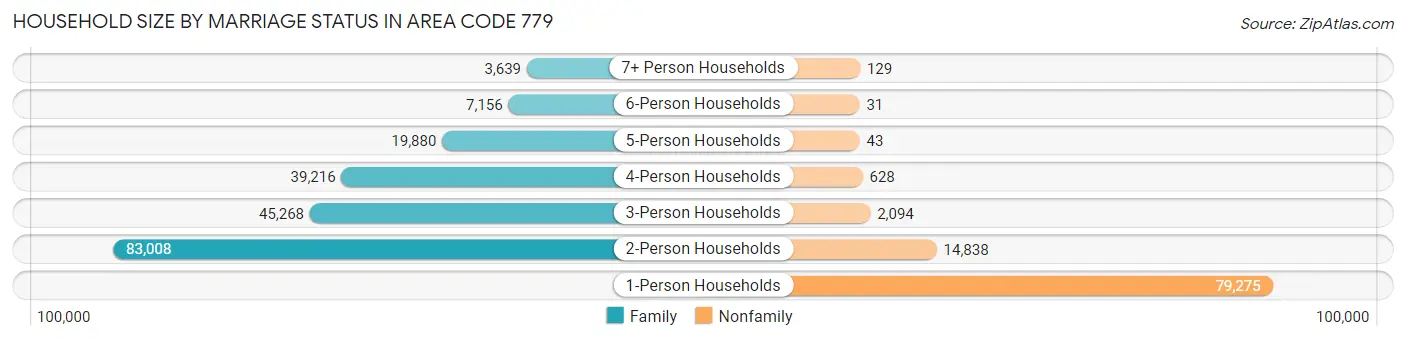
Household Size by Marriage Status in Area Code 779
Out of a total of 295,205 households in Area Code 779, 198,167 (67.1%) are family households, while 97,038 (32.9%) are nonfamily households. The most numerous type of family households are 2-person households, comprising 83,008, and the most common type of nonfamily households are 1-person households, comprising 79,275.
| Household Size | Family Households | Nonfamily Households |
| 1-Person Households | - | 79,275 (26.9%) |
| 2-Person Households | 83,008 (28.1%) | 14,838 (5.0%) |
| 3-Person Households | 45,268 (15.3%) | 2,094 (0.7%) |
| 4-Person Households | 39,216 (13.3%) | 628 (0.2%) |
| 5-Person Households | 19,880 (6.7%) | 43 (0.0%) |
| 6-Person Households | 7,156 (2.4%) | 31 (0.0%) |
| 7+ Person Households | 3,639 (1.2%) | 129 (0.0%) |
| Total | 198,167 (67.1%) | 97,038 (32.9%) |
Female Fertility in Area Code 779
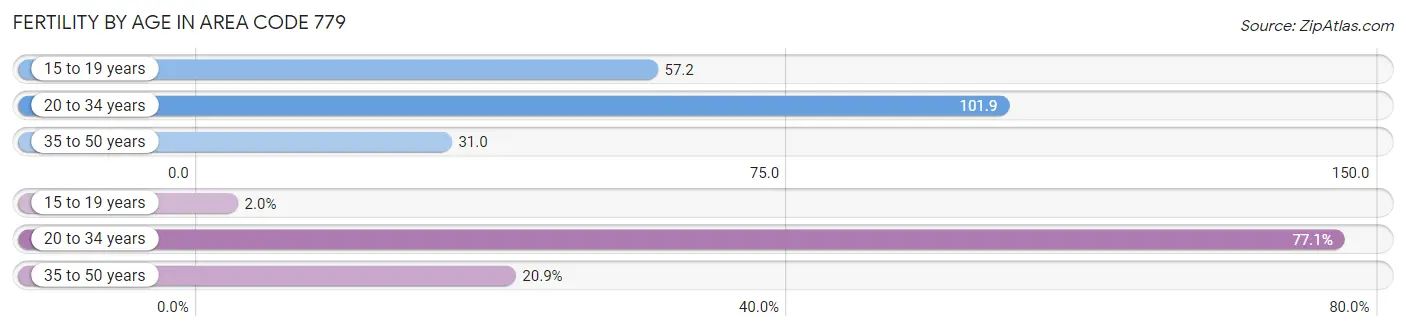
Fertility by Age in Area Code 779
Average fertility rate in Area Code 779 is 56.8 births per 1,000 women. Women in the age bracket of 20 to 34 years have the highest fertility rate with 101.9 births per 1,000 women. Women in the age bracket of 20 to 34 years acount for 77.1% of all women with births.
| Age Bracket | Women with Births | Births / 1,000 Women |
| 15 to 19 years | 196 (2.0%) | 57.2 |
| 20 to 34 years | 7,538 (77.1%) | 101.9 |
| 35 to 50 years | 2,039 (20.9%) | 31.0 |
| Total | 9,773 (100.0%) | 56.8 |
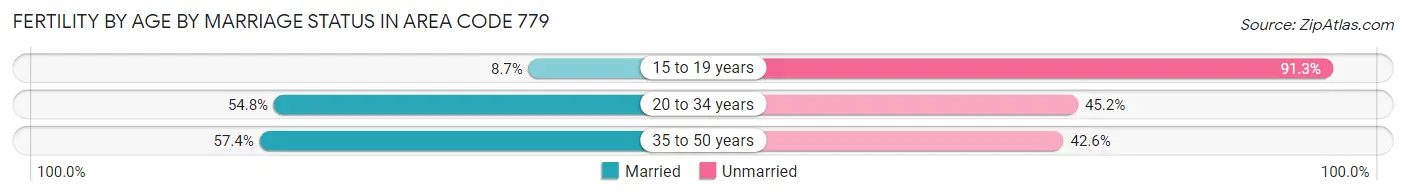
Fertility by Age by Marriage Status in Area Code 779
57.9% of women with births (9,773) in Area Code 779 are married. The highest percentage of unmarried women with births falls into 15 to 19 years age bracket with 91.3% of them unmarried at the time of birth, while the lowest percentage of unmarried women with births belong to 35 to 50 years age bracket with 42.6% of them unmarried.
| Age Bracket | Married | Unmarried |
| 15 to 19 years | 17 (8.7%) | 179 (91.3%) |
| 20 to 34 years | 4,132 (54.8%) | 3,406 (45.2%) |
| 35 to 50 years | 1,171 (57.4%) | 868 (42.6%) |
| Total | 5,657 (57.9%) | 4,116 (42.1%) |
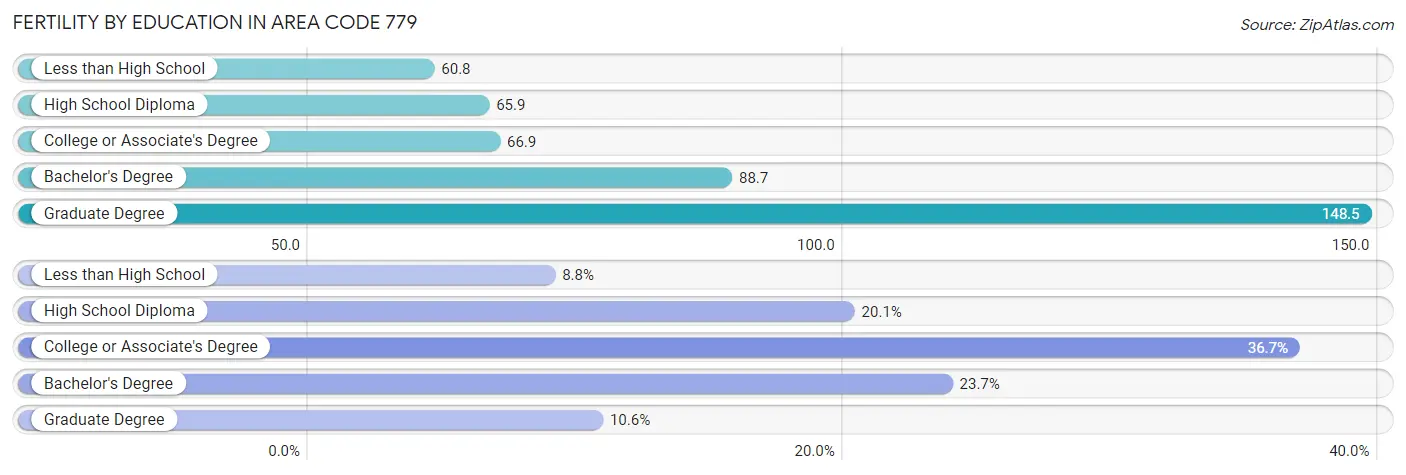
Fertility by Education in Area Code 779
Average fertility rate in Area Code 779 is 56.8 births per 1,000 women. Women with the education attainment of graduate degree have the highest fertility rate of 148.5 births per 1,000 women, while women with the education attainment of less than high school have the lowest fertility at 60.8 births per 1,000 women. Women with the education attainment of college or associate's degree represent 36.7% of all women with births.
| Educational Attainment | Women with Births | Births / 1,000 Women |
| Less than High School | 864 (8.8%) | 60.8 |
| High School Diploma | 1,960 (20.1%) | 65.9 |
| College or Associate's Degree | 3,591 (36.7%) | 66.9 |
| Bachelor's Degree | 2,319 (23.7%) | 88.7 |
| Graduate Degree | 1,039 (10.6%) | 148.5 |
| Total | 9,773 (100.0%) | 56.8 |
Fertility by Education by Marriage Status in Area Code 779
42.1% of women with births in Area Code 779 are unmarried. Women with the educational attainment of bachelor's degree are most likely to be married with 73.1% of them married at childbirth, while women with the educational attainment of graduate degree are least likely to be married with 82.3% of them unmarried at childbirth.
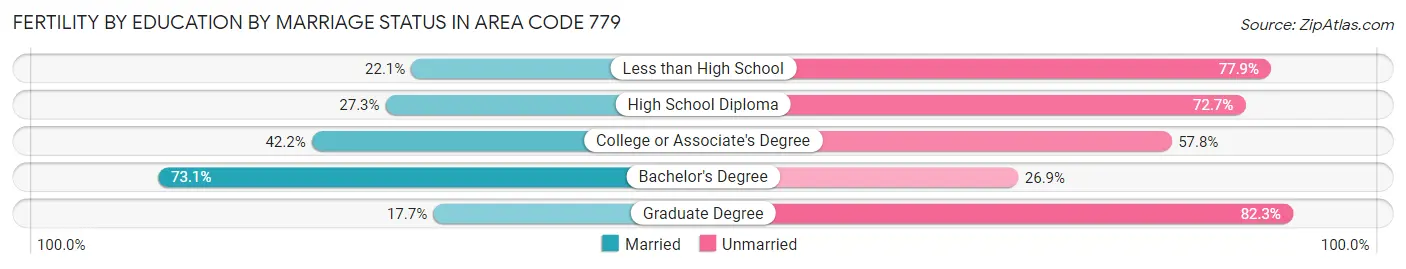
| Educational Attainment | Married | Unmarried |
| Less than High School | 191 (22.1%) | 673 (77.9%) |
| High School Diploma | 535 (27.3%) | 1,425 (72.7%) |
| College or Associate's Degree | 1,515 (42.2%) | 2,076 (57.8%) |
| Bachelor's Degree | 1,695 (73.1%) | 624 (26.9%) |
| Graduate Degree | 184 (17.7%) | 855 (82.3%) |
| Total | 5,657 (57.9%) | 4,116 (42.1%) |
Employment Characteristics in Area Code 779
Employment by Class of Employer in Area Code 779
Among the 373,809 employed individuals in Area Code 779, private company employees (269,100 | 72.0%), local government employees (30,160 | 8.1%), and not-for-profit organizations (28,146 | 7.5%) make up the most common classes of employment.
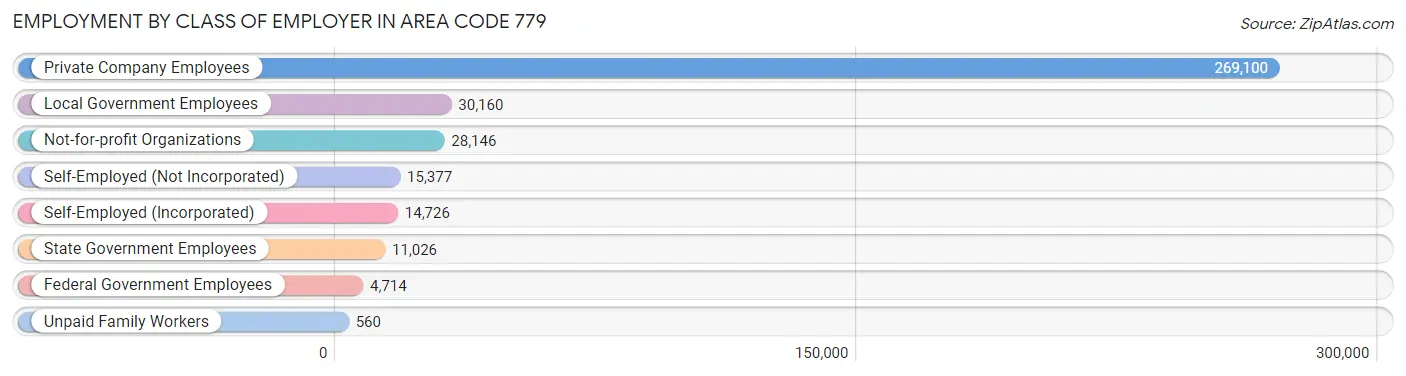
| Employer Class | # Employees | % Employees |
| Private Company Employees | 269,100 | 72.0% |
| Self-Employed (Incorporated) | 14,726 | 3.9% |
| Self-Employed (Not Incorporated) | 15,377 | 4.1% |
| Not-for-profit Organizations | 28,146 | 7.5% |
| Local Government Employees | 30,160 | 8.1% |
| State Government Employees | 11,026 | 2.9% |
| Federal Government Employees | 4,714 | 1.3% |
| Unpaid Family Workers | 560 | 0.2% |
| Total | 373,809 | 100.0% |
Employment Status by Age in Area Code 779
According to the labor force statistics for Area Code 779, out of the total population over 16 years of age (622,374), 64.4% or 400,996 individuals are in the labor force, with 5.5% or 22,055 of them unemployed. The age group with the highest labor force participation rate is 25 to 29 years, with 86.4% or 40,865 individuals in the labor force. Within the labor force, the 16 to 19 years age range has the highest percentage of unemployed individuals, with 759.6% or 168,836 of them being unemployed.
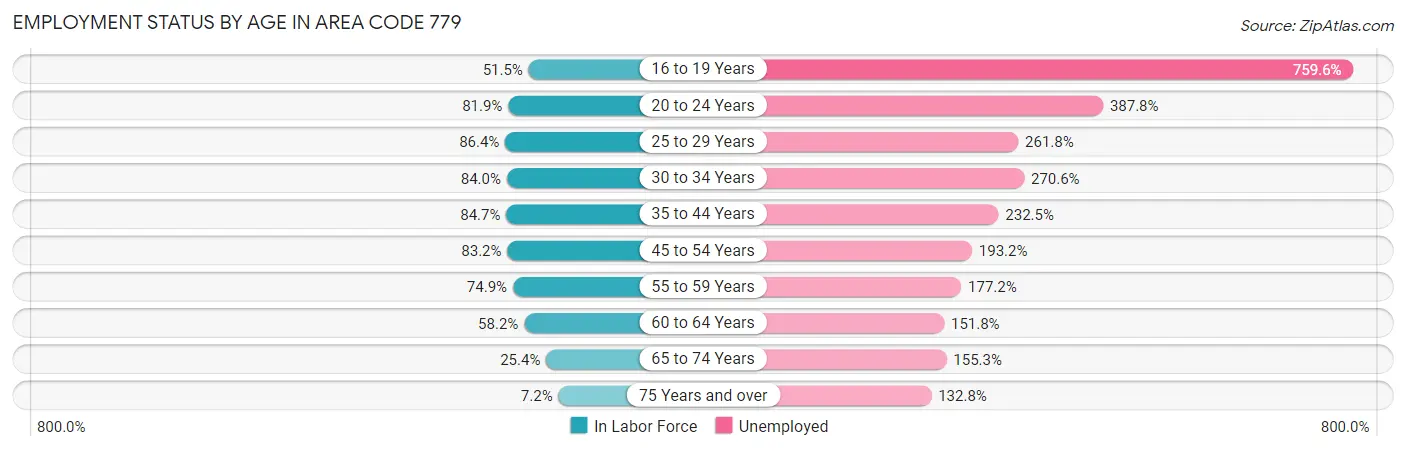
| Age Bracket | In Labor Force | Unemployed |
| 16 to 19 Years | 22,226 (51.5%) | 168,836 (759.6%) |
| 20 to 24 Years | 47,161 (81.9%) | 182,902 (387.8%) |
| 25 to 29 Years | 40,866 (86.4%) | 106,985 (261.8%) |
| 30 to 34 Years | 39,066 (84.0%) | 105,710 (270.6%) |
| 35 to 44 Years | 82,022 (84.7%) | 190,710 (232.5%) |
| 45 to 54 Years | 86,055 (83.2%) | 166,268 (193.2%) |
| 55 to 59 Years | 40,180 (74.9%) | 71,203 (177.2%) |
| 60 to 64 Years | 28,169 (58.2%) | 42,758 (151.8%) |
| 65 to 74 Years | 18,744 (25.4%) | 29,111 (155.3%) |
| 75 Years and over | 3,726 (7.2%) | 4,949 (132.8%) |
| Total | 400,968 (64.4%) | 22,055 (5.5%) |
Employment Status by Educational Attainment in Area Code 779
According to labor force statistics for Area Code 779, 79.6% of individuals (315,241) out of the total population between 25 and 64 years of age (396,230) are in the labor force, with 217.4% or 685,334 of them being unemployed. The group with the highest labor force participation rate are those with the educational attainment of bachelor's degree or higher, with 86.9% or 102,904 individuals in the labor force. Within the labor force, individuals with less than high school education have the highest percentage of unemployment, with 403.5% or 112,060 of them being unemployed.
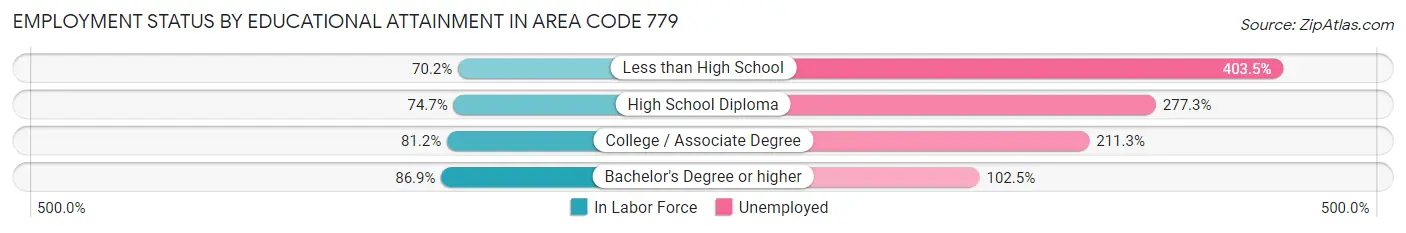
| Educational Attainment | In Labor Force | Unemployed |
| Less than High School | 27,773 (70.2%) | 159,560 (403.5%) |
| High School Diploma | 82,084 (74.7%) | 304,547 (277.3%) |
| College / Associate Degree | 104,285 (81.2%) | 271,400 (211.3%) |
| Bachelor's Degree or higher | 102,907 (86.9%) | 121,377 (102.5%) |
| Total | 315,256 (79.6%) | 861,404 (217.4%) |
Employment Occupations by Sex in Area Code 779
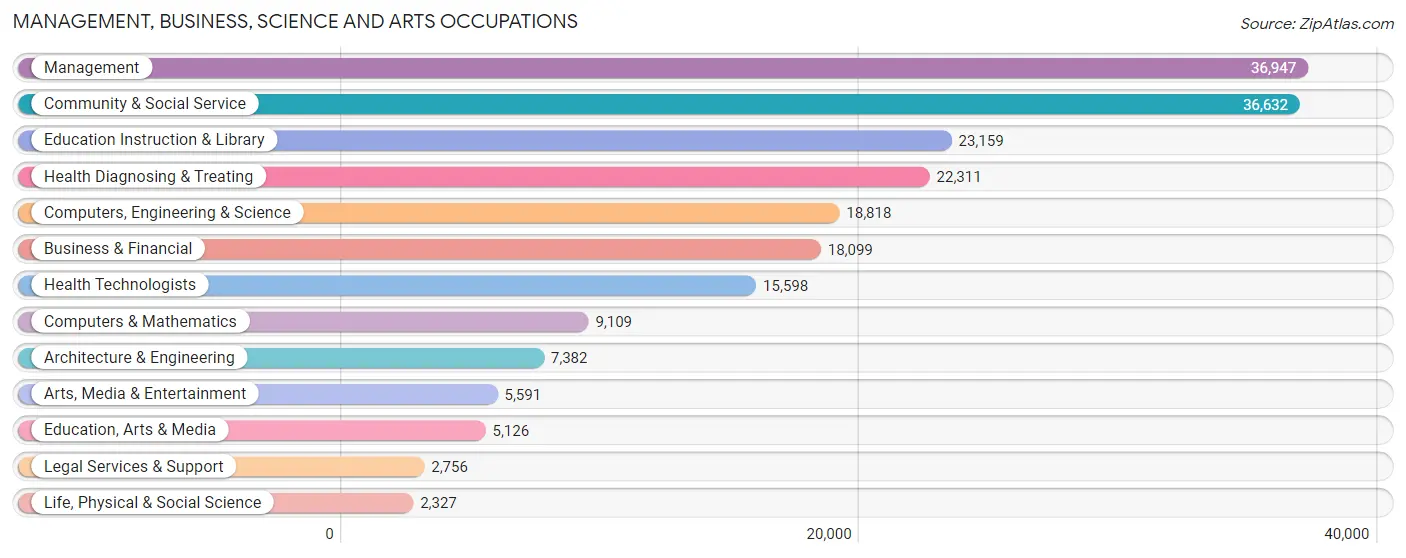
Management, Business, Science and Arts Occupations
The most common Management, Business, Science and Arts occupations in Area Code 779 are Management (36,947 | 9.7%), Community & Social Service (36,632 | 9.6%), Education Instruction & Library (23,159 | 6.1%), Health Diagnosing & Treating (22,311 | 5.9%), and Computers, Engineering & Science (18,818 | 4.9%).
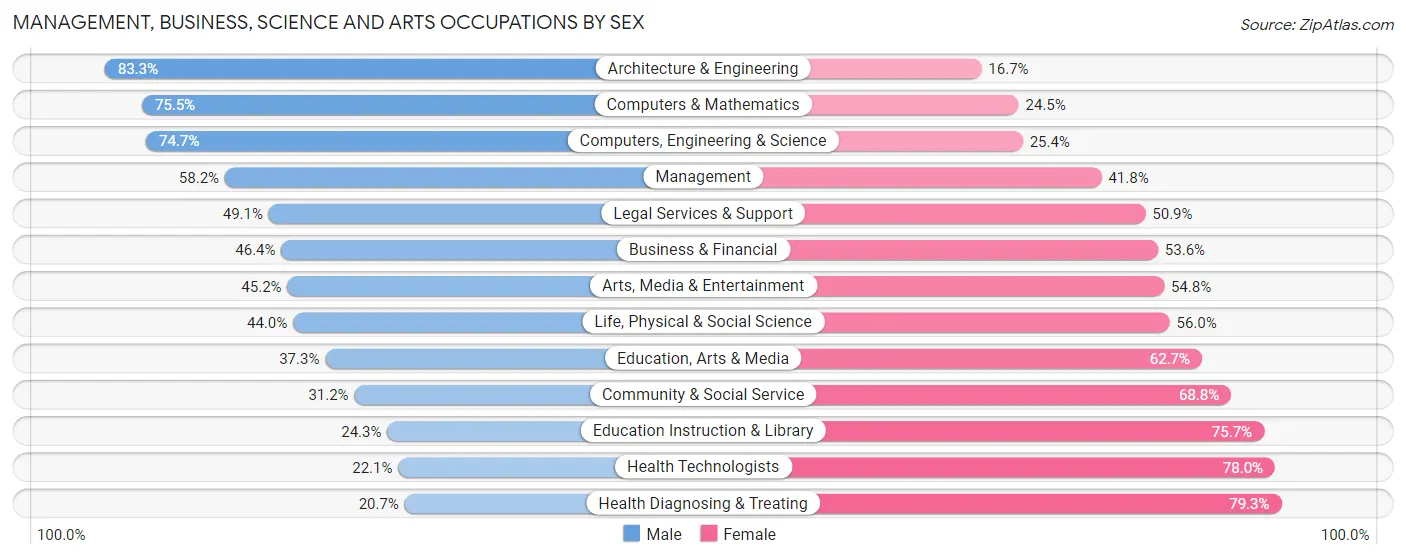
Management, Business, Science and Arts Occupations by Sex
Within the Management, Business, Science and Arts occupations in Area Code 779, the most male-oriented occupations are Architecture & Engineering (83.3%), Computers & Mathematics (75.5%), and Computers, Engineering & Science (74.7%), while the most female-oriented occupations are Health Diagnosing & Treating (79.3%), Health Technologists (77.9%), and Education Instruction & Library (75.7%).
| Occupation | Male | Female |
| Management | 21,507 (58.2%) | 15,440 (41.8%) |
| Business & Financial | 8,406 (46.4%) | 9,693 (53.6%) |
| Computers, Engineering & Science | 14,048 (74.7%) | 4,770 (25.4%) |
| Computers & Mathematics | 6,878 (75.5%) | 2,231 (24.5%) |
| Architecture & Engineering | 6,146 (83.3%) | 1,236 (16.7%) |
| Life, Physical & Social Science | 1,024 (44.0%) | 1,303 (56.0%) |
| Community & Social Service | 11,425 (31.2%) | 25,207 (68.8%) |
| Education, Arts & Media | 1,911 (37.3%) | 3,215 (62.7%) |
| Legal Services & Support | 1,352 (49.1%) | 1,404 (50.9%) |
| Education Instruction & Library | 5,636 (24.3%) | 17,523 (75.7%) |
| Arts, Media & Entertainment | 2,526 (45.2%) | 3,065 (54.8%) |
| Health Diagnosing & Treating | 4,620 (20.7%) | 17,691 (79.3%) |
| Health Technologists | 3,440 (22.1%) | 12,158 (77.9%) |
| Total (Category) | 60,006 (45.2%) | 72,801 (54.8%) |
| Total (Overall) | 202,343 (53.0%) | 179,127 (47.0%) |
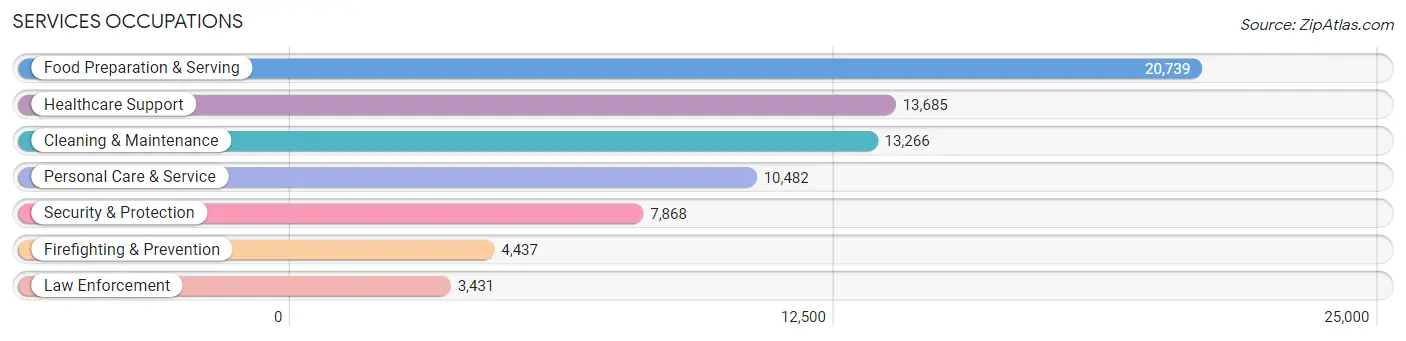
Services Occupations
The most common Services occupations in Area Code 779 are Food Preparation & Serving (20,739 | 5.4%), Healthcare Support (13,685 | 3.6%), Cleaning & Maintenance (13,266 | 3.5%), Personal Care & Service (10,482 | 2.8%), and Security & Protection (7,868 | 2.1%).
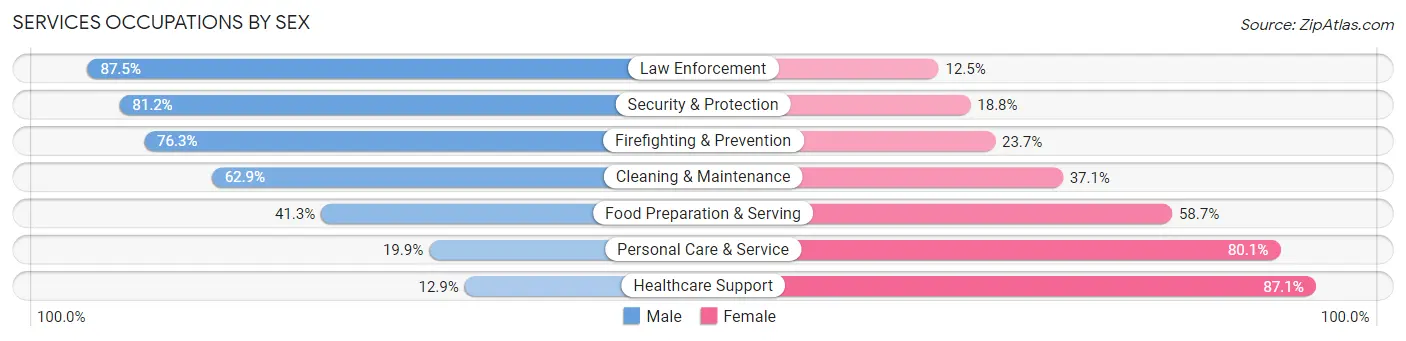
Services Occupations by Sex
Within the Services occupations in Area Code 779, the most male-oriented occupations are Law Enforcement (87.5%), Security & Protection (81.2%), and Firefighting & Prevention (76.3%), while the most female-oriented occupations are Healthcare Support (87.1%), Personal Care & Service (80.1%), and Food Preparation & Serving (58.7%).
| Occupation | Male | Female |
| Healthcare Support | 1,762 (12.9%) | 11,923 (87.1%) |
| Security & Protection | 6,390 (81.2%) | 1,478 (18.8%) |
| Firefighting & Prevention | 3,387 (76.3%) | 1,050 (23.7%) |
| Law Enforcement | 3,003 (87.5%) | 428 (12.5%) |
| Food Preparation & Serving | 8,566 (41.3%) | 12,173 (58.7%) |
| Cleaning & Maintenance | 8,350 (62.9%) | 4,916 (37.1%) |
| Personal Care & Service | 2,088 (19.9%) | 8,394 (80.1%) |
| Total (Category) | 27,156 (41.1%) | 38,884 (58.9%) |
| Total (Overall) | 202,343 (53.0%) | 179,127 (47.0%) |
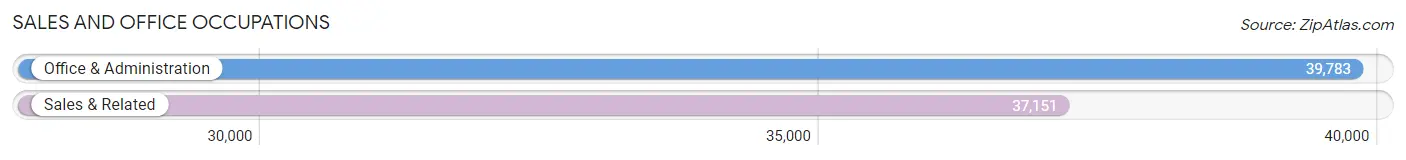
Sales and Office Occupations
The most common Sales and Office occupations in Area Code 779 are Office & Administration (39,783 | 10.4%), and Sales & Related (37,151 | 9.7%).
Sales and Office Occupations by Sex
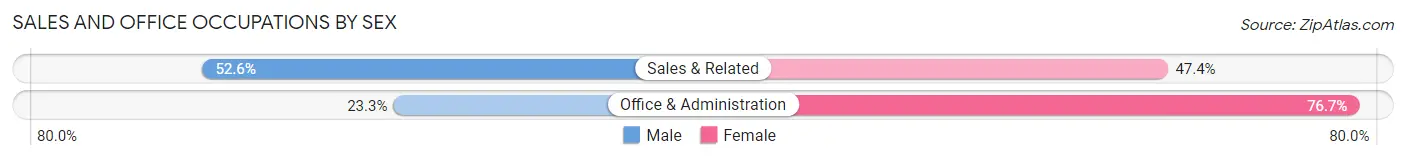
| Occupation | Male | Female |
| Sales & Related | 19,554 (52.6%) | 17,597 (47.4%) |
| Office & Administration | 9,265 (23.3%) | 30,518 (76.7%) |
| Total (Category) | 28,819 (37.5%) | 48,115 (62.5%) |
| Total (Overall) | 202,343 (53.0%) | 179,127 (47.0%) |
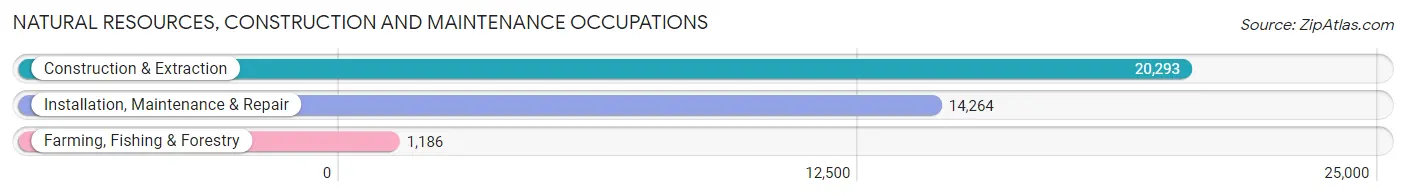
Natural Resources, Construction and Maintenance Occupations
The most common Natural Resources, Construction and Maintenance occupations in Area Code 779 are Construction & Extraction (20,293 | 5.3%), Installation, Maintenance & Repair (14,264 | 3.7%), and Farming, Fishing & Forestry (1,186 | 0.3%).
Natural Resources, Construction and Maintenance Occupations by Sex
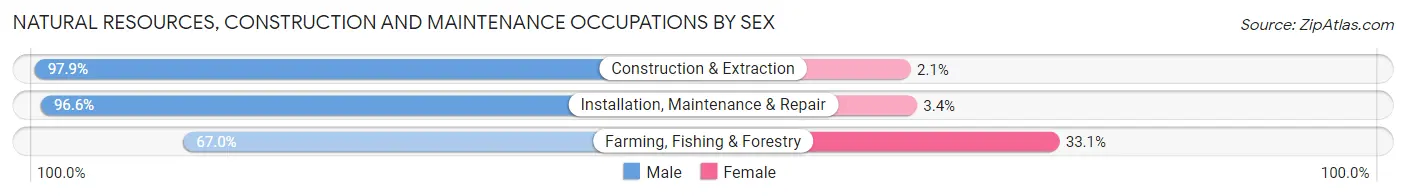
| Occupation | Male | Female |
| Farming, Fishing & Forestry | 794 (66.9%) | 392 (33.1%) |
| Construction & Extraction | 19,863 (97.9%) | 430 (2.1%) |
| Installation, Maintenance & Repair | 13,778 (96.6%) | 486 (3.4%) |
| Total (Category) | 34,435 (96.3%) | 1,308 (3.7%) |
| Total (Overall) | 202,343 (53.0%) | 179,127 (47.0%) |
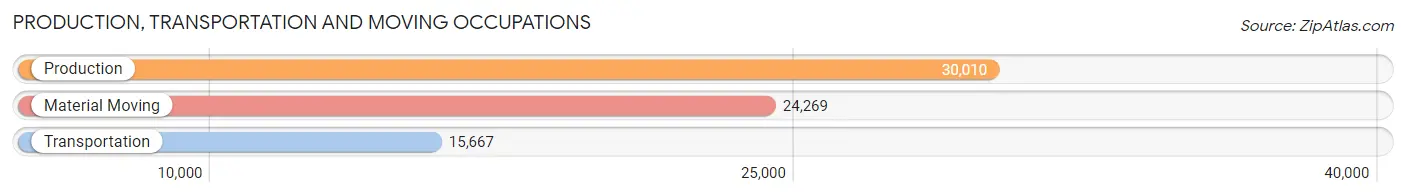
Production, Transportation and Moving Occupations
The most common Production, Transportation and Moving occupations in Area Code 779 are Production (30,010 | 7.9%), Material Moving (24,269 | 6.4%), and Transportation (15,667 | 4.1%).
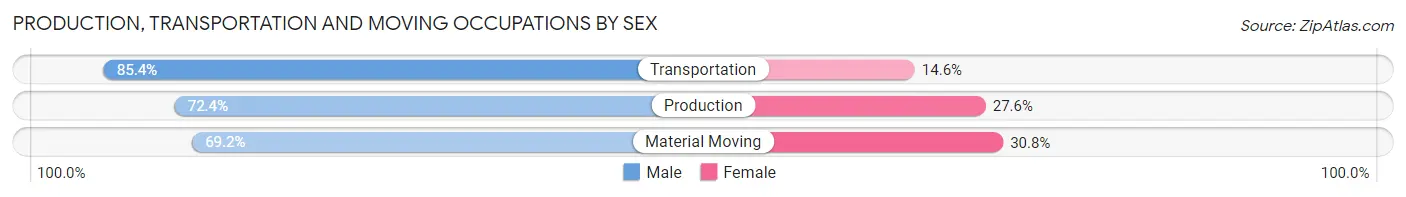
Production, Transportation and Moving Occupations by Sex
| Occupation | Male | Female |
| Production | 21,736 (72.4%) | 8,274 (27.6%) |
| Transportation | 13,386 (85.4%) | 2,281 (14.6%) |
| Material Moving | 16,805 (69.2%) | 7,464 (30.8%) |
| Total (Category) | 51,927 (74.2%) | 18,019 (25.8%) |
| Total (Overall) | 202,343 (53.0%) | 179,127 (47.0%) |
Employment Industries by Sex in Area Code 779
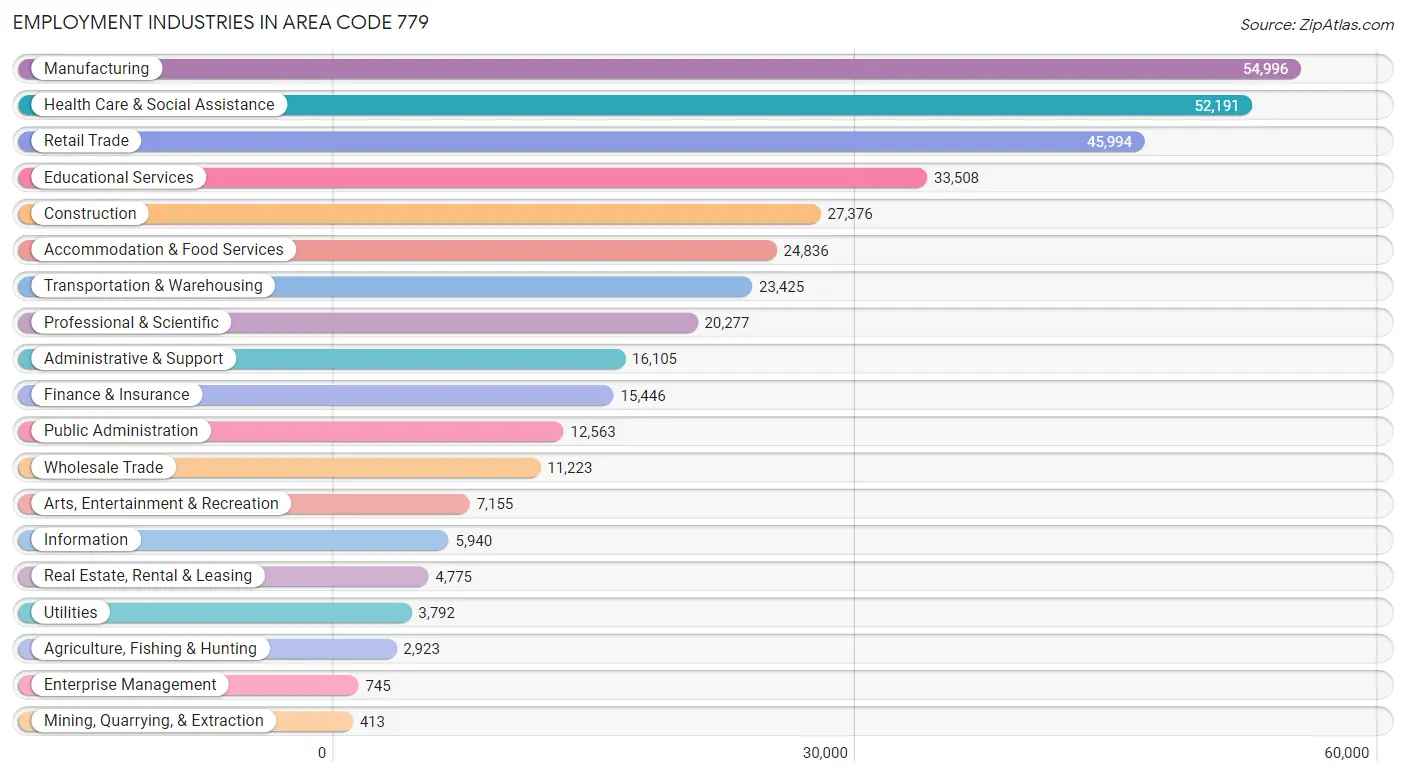
Employment Industries in Area Code 779
The major employment industries in Area Code 779 include Manufacturing (54,996 | 14.4%), Health Care & Social Assistance (52,191 | 13.7%), Retail Trade (45,994 | 12.1%), Educational Services (33,508 | 8.8%), and Construction (27,376 | 7.2%).
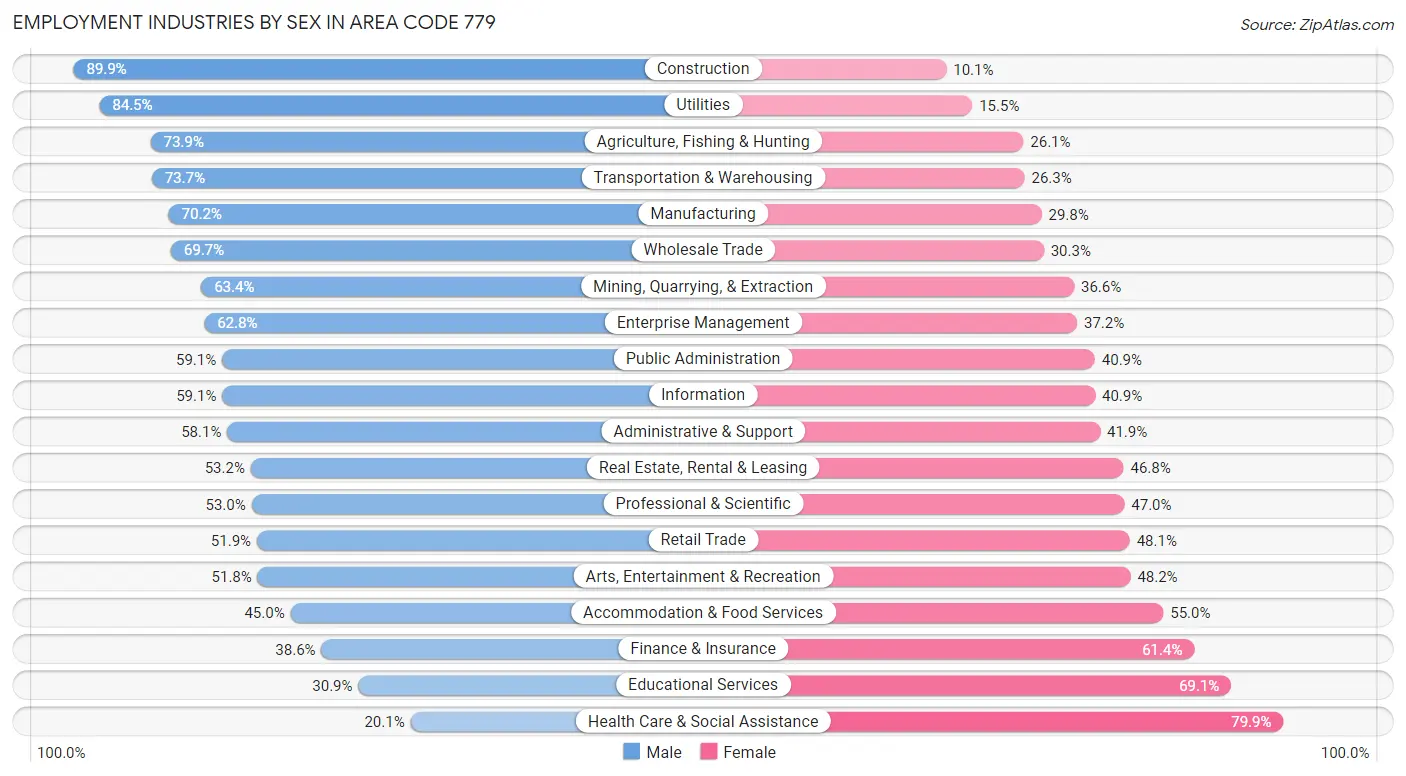
Employment Industries by Sex in Area Code 779
The Area Code 779 industries that see more men than women are Construction (89.9%), Utilities (84.5%), and Agriculture, Fishing & Hunting (73.9%), whereas the industries that tend to have a higher number of women are Health Care & Social Assistance (79.9%), Educational Services (69.1%), and Finance & Insurance (61.4%).
| Industry | Male | Female |
| Agriculture, Fishing & Hunting | 2,161 (73.9%) | 762 (26.1%) |
| Mining, Quarrying, & Extraction | 262 (63.4%) | 151 (36.6%) |
| Construction | 24,605 (89.9%) | 2,771 (10.1%) |
| Manufacturing | 38,588 (70.2%) | 16,408 (29.8%) |
| Wholesale Trade | 7,825 (69.7%) | 3,398 (30.3%) |
| Retail Trade | 23,878 (51.9%) | 22,116 (48.1%) |
| Transportation & Warehousing | 17,260 (73.7%) | 6,165 (26.3%) |
| Utilities | 3,205 (84.5%) | 587 (15.5%) |
| Information | 3,510 (59.1%) | 2,430 (40.9%) |
| Finance & Insurance | 5,957 (38.6%) | 9,489 (61.4%) |
| Real Estate, Rental & Leasing | 2,540 (53.2%) | 2,235 (46.8%) |
| Professional & Scientific | 10,750 (53.0%) | 9,527 (47.0%) |
| Enterprise Management | 468 (62.8%) | 277 (37.2%) |
| Administrative & Support | 9,350 (58.1%) | 6,755 (41.9%) |
| Educational Services | 10,362 (30.9%) | 23,146 (69.1%) |
| Health Care & Social Assistance | 10,506 (20.1%) | 41,685 (79.9%) |
| Arts, Entertainment & Recreation | 3,704 (51.8%) | 3,451 (48.2%) |
| Accommodation & Food Services | 11,169 (45.0%) | 13,667 (55.0%) |
| Public Administration | 7,428 (59.1%) | 5,135 (40.9%) |
| Total | 202,343 (53.0%) | 179,127 (47.0%) |
Education in Area Code 779
School Enrollment in Area Code 779
The most common levels of schooling among the 195,746 students in Area Code 779 are high school (44,775 | 22.9%), middle school (42,807 | 21.9%), and college / undergraduate (39,234 | 20.0%).
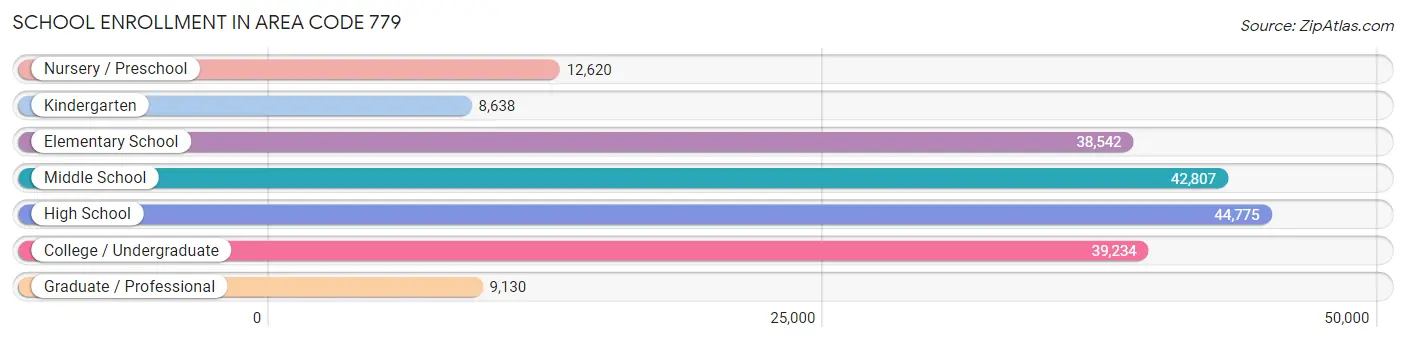
| School Level | # Students | % Students |
| Nursery / Preschool | 12,620 | 6.5% |
| Kindergarten | 8,638 | 4.4% |
| Elementary School | 38,542 | 19.7% |
| Middle School | 42,807 | 21.9% |
| High School | 44,775 | 22.9% |
| College / Undergraduate | 39,234 | 20.0% |
| Graduate / Professional | 9,130 | 4.7% |
| Total | 195,746 | 100.0% |
School Enrollment by Age by Funding Source in Area Code 779
Out of a total of 195,746 students who are enrolled in schools in Area Code 779, 28,286 (14.4%) attend a private institution, while the remaining 167,460 (85.6%) are enrolled in public schools. The age group of 35 years and over has the highest likelihood of being enrolled in private schools, with 2,767 (30.0% in the age bracket) enrolled. Conversely, the age group of 18 to 19 year olds has the lowest likelihood of being enrolled in a private school, with 13,470 (89.3% in the age bracket) attending a public institution.
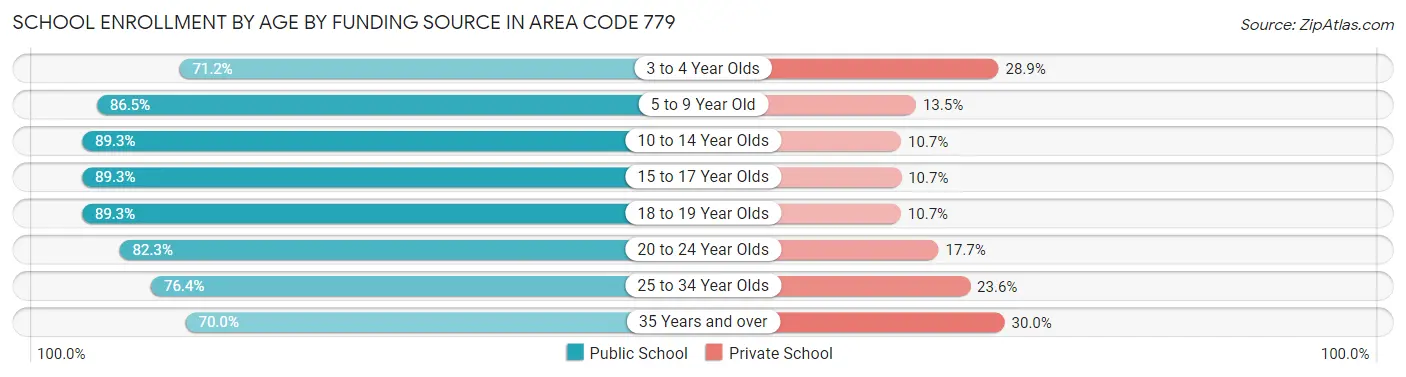
| Age Bracket | Public School | Private School |
| 3 to 4 Year Olds | 6,315 (71.2%) | 2,561 (28.8%) |
| 5 to 9 Year Old | 38,922 (86.5%) | 6,061 (13.5%) |
| 10 to 14 Year Olds | 48,378 (89.3%) | 5,797 (10.7%) |
| 15 to 17 Year Olds | 28,451 (89.3%) | 3,415 (10.7%) |
| 18 to 19 Year Olds | 13,470 (89.3%) | 1,607 (10.7%) |
| 20 to 24 Year Olds | 18,446 (82.3%) | 3,961 (17.7%) |
| 25 to 34 Year Olds | 6,980 (76.4%) | 2,151 (23.6%) |
| 35 Years and over | 6,464 (70.0%) | 2,767 (30.0%) |
| Total | 167,460 (85.6%) | 28,286 (14.4%) |
Educational Attainment by Field of Study in Area Code 779
Business (31,866 | 20.0%), education (24,638 | 15.5%), science & technology (19,268 | 12.1%), engineering (10,277 | 6.5%), and arts & humanities (10,249 | 6.4%) are the most common fields of study among 159,102 individuals in Area Code 779 who have obtained a bachelor's degree or higher.
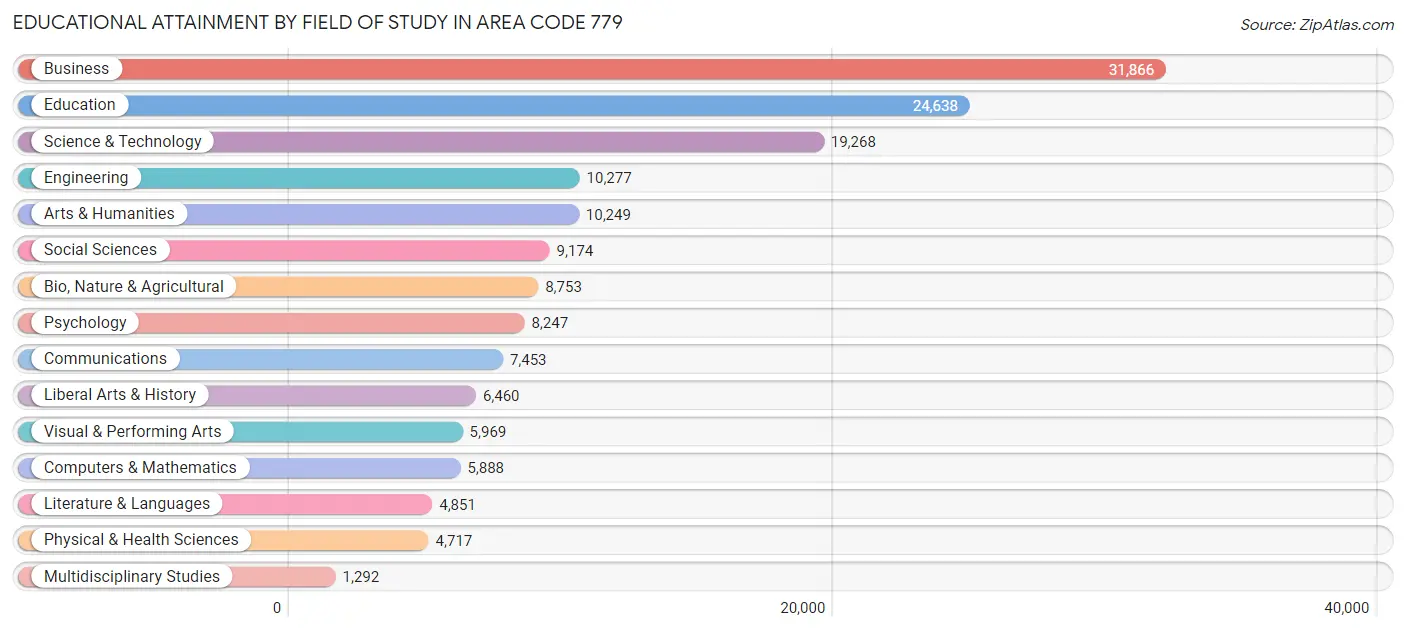
| Field of Study | # Graduates | % Graduates |
| Computers & Mathematics | 5,888 | 3.7% |
| Bio, Nature & Agricultural | 8,753 | 5.5% |
| Physical & Health Sciences | 4,717 | 3.0% |
| Psychology | 8,247 | 5.2% |
| Social Sciences | 9,174 | 5.8% |
| Engineering | 10,277 | 6.5% |
| Multidisciplinary Studies | 1,292 | 0.8% |
| Science & Technology | 19,268 | 12.1% |
| Business | 31,866 | 20.0% |
| Education | 24,638 | 15.5% |
| Literature & Languages | 4,851 | 3.0% |
| Liberal Arts & History | 6,460 | 4.1% |
| Visual & Performing Arts | 5,969 | 3.7% |
| Communications | 7,453 | 4.7% |
| Arts & Humanities | 10,249 | 6.4% |
| Total | 159,102 | 100.0% |
Transportation & Commute in Area Code 779
Vehicle Availability by Sex in Area Code 779
The most prevalent vehicle ownership categories in Area Code 779 are males with 2 vehicles (85,495, accounting for 43.1%) and females with 2 vehicles (71,578, making up 49.2%).
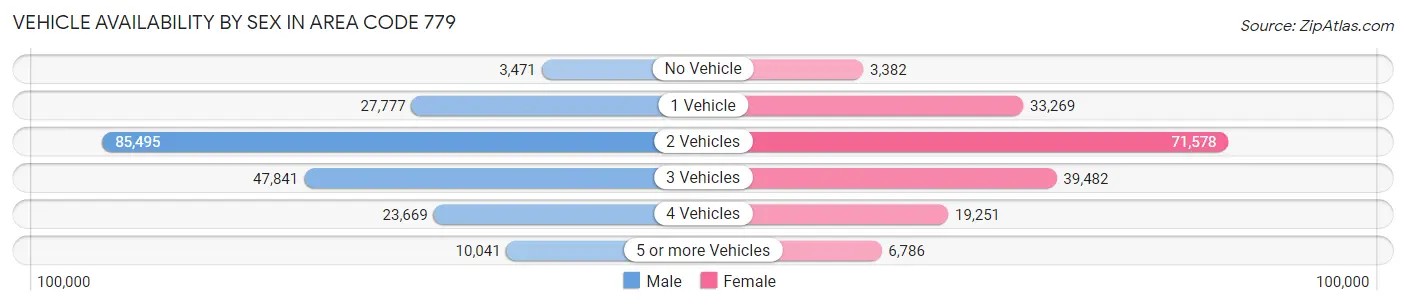
| Vehicles Available | Male | Female |
| No Vehicle | 3,471 (1.8%) | 3,382 (1.9%) |
| 1 Vehicle | 27,777 (14.0%) | 33,269 (19.2%) |
| 2 Vehicles | 85,495 (43.1%) | 71,578 (41.2%) |
| 3 Vehicles | 47,841 (24.1%) | 39,482 (22.7%) |
| 4 Vehicles | 23,669 (11.9%) | 19,251 (11.1%) |
| 5 or more Vehicles | 10,041 (5.1%) | 6,786 (3.9%) |
| Total | 198,294 (100.0%) | 173,748 (100.0%) |
Commute Time in Area Code 779
The most frequently occuring commute durations in Area Code 779 are 10 to 14 minutes (50,701 commuters, 14.9%), 15 to 19 minutes (48,269 commuters, 14.2%), and 20 to 24 minutes (41,015 commuters, 12.0%).
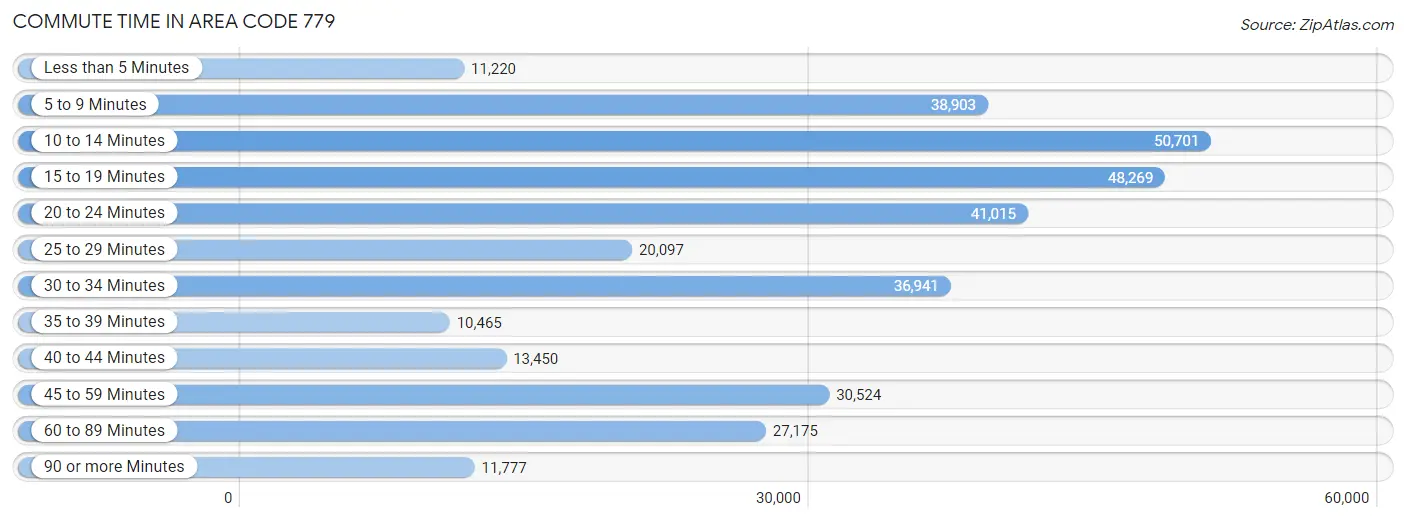
| Commute Time | # Commuters | % Commuters |
| Less than 5 Minutes | 11,220 | 3.3% |
| 5 to 9 Minutes | 38,903 | 11.4% |
| 10 to 14 Minutes | 50,701 | 14.9% |
| 15 to 19 Minutes | 48,269 | 14.2% |
| 20 to 24 Minutes | 41,015 | 12.0% |
| 25 to 29 Minutes | 20,097 | 5.9% |
| 30 to 34 Minutes | 36,941 | 10.8% |
| 35 to 39 Minutes | 10,465 | 3.1% |
| 40 to 44 Minutes | 13,450 | 4.0% |
| 45 to 59 Minutes | 30,524 | 9.0% |
| 60 to 89 Minutes | 27,175 | 8.0% |
| 90 or more Minutes | 11,777 | 3.5% |
Commute Time by Sex in Area Code 779
The most common commute times in Area Code 779 are 10 to 14 minutes (25,262 commuters, 13.7%) for males and 10 to 14 minutes (25,439 commuters, 16.3%) for females.
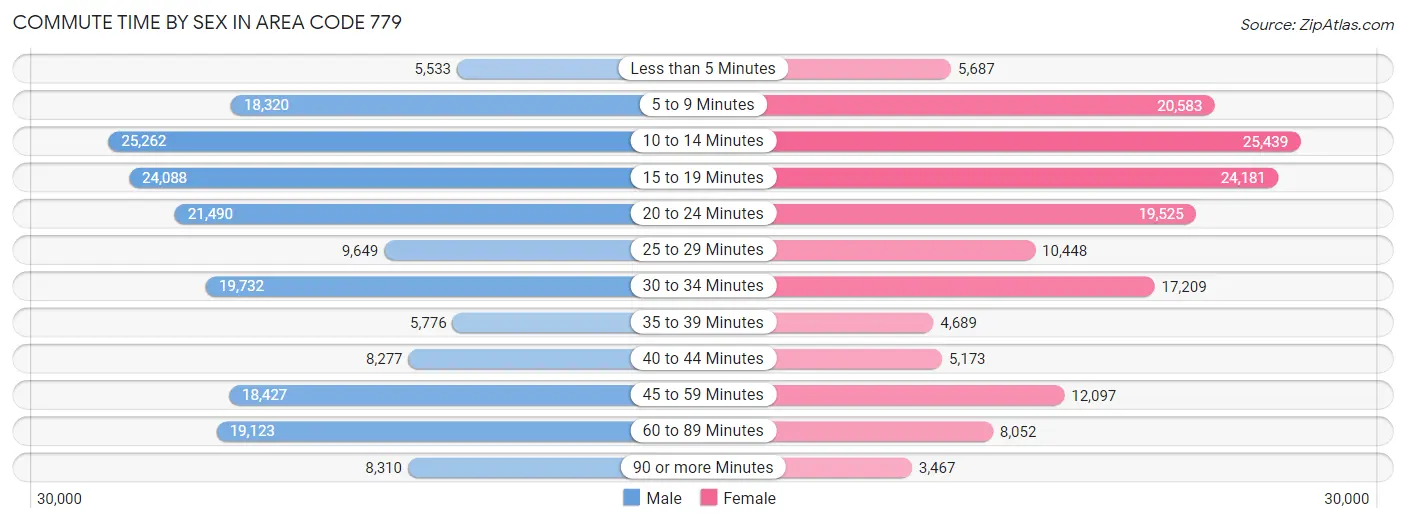
| Commute Time | Male | Female |
| Less than 5 Minutes | 5,533 (3.0%) | 5,687 (3.6%) |
| 5 to 9 Minutes | 18,320 (10.0%) | 20,583 (13.2%) |
| 10 to 14 Minutes | 25,262 (13.7%) | 25,439 (16.3%) |
| 15 to 19 Minutes | 24,088 (13.1%) | 24,181 (15.4%) |
| 20 to 24 Minutes | 21,490 (11.7%) | 19,525 (12.5%) |
| 25 to 29 Minutes | 9,649 (5.2%) | 10,448 (6.7%) |
| 30 to 34 Minutes | 19,732 (10.7%) | 17,209 (11.0%) |
| 35 to 39 Minutes | 5,776 (3.1%) | 4,689 (3.0%) |
| 40 to 44 Minutes | 8,277 (4.5%) | 5,173 (3.3%) |
| 45 to 59 Minutes | 18,427 (10.0%) | 12,097 (7.7%) |
| 60 to 89 Minutes | 19,123 (10.4%) | 8,052 (5.1%) |
| 90 or more Minutes | 8,310 (4.5%) | 3,467 (2.2%) |
Time of Departure to Work by Sex in Area Code 779
The most frequent times of departure to work in Area Code 779 are 6:00 AM to 6:29 AM (22,581, 12.3%) for males and 7:00 AM to 7:29 AM (22,001, 14.1%) for females.
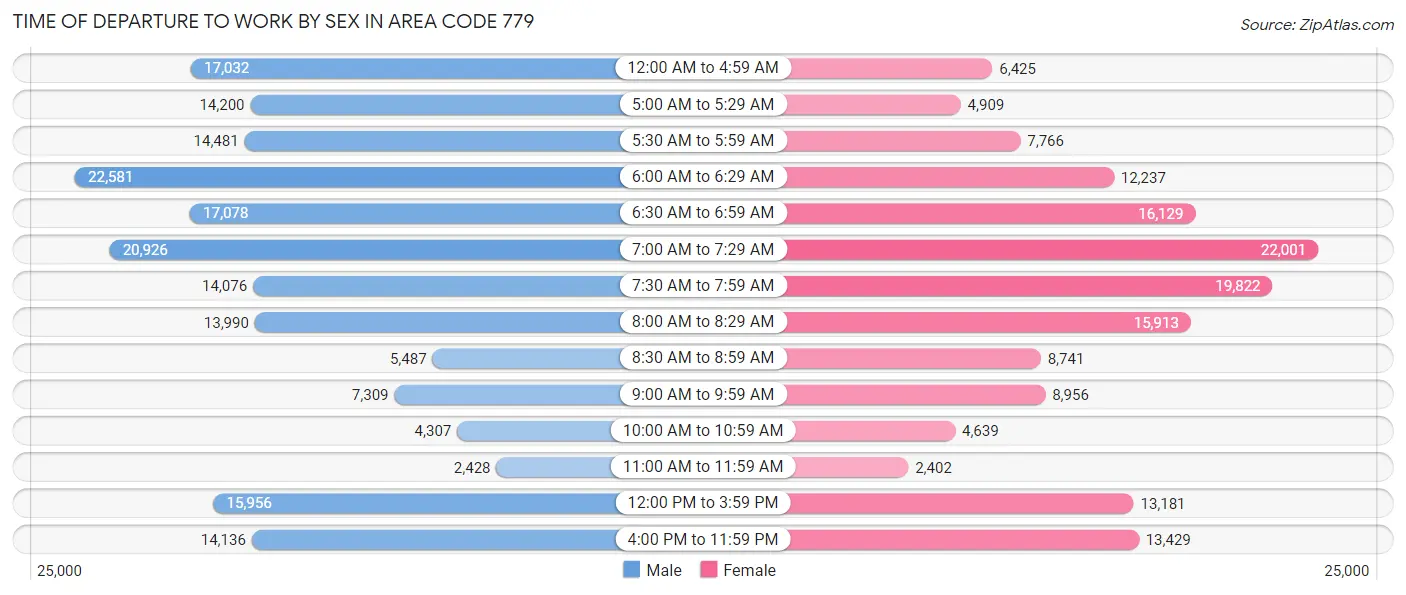
| Time of Departure | Male | Female |
| 12:00 AM to 4:59 AM | 17,032 (9.3%) | 6,425 (4.1%) |
| 5:00 AM to 5:29 AM | 14,200 (7.7%) | 4,909 (3.1%) |
| 5:30 AM to 5:59 AM | 14,481 (7.9%) | 7,766 (5.0%) |
| 6:00 AM to 6:29 AM | 22,581 (12.3%) | 12,237 (7.8%) |
| 6:30 AM to 6:59 AM | 17,078 (9.3%) | 16,129 (10.3%) |
| 7:00 AM to 7:29 AM | 20,926 (11.4%) | 22,001 (14.1%) |
| 7:30 AM to 7:59 AM | 14,076 (7.6%) | 19,822 (12.7%) |
| 8:00 AM to 8:29 AM | 13,990 (7.6%) | 15,913 (10.2%) |
| 8:30 AM to 8:59 AM | 5,487 (3.0%) | 8,741 (5.6%) |
| 9:00 AM to 9:59 AM | 7,309 (4.0%) | 8,956 (5.7%) |
| 10:00 AM to 10:59 AM | 4,307 (2.3%) | 4,639 (3.0%) |
| 11:00 AM to 11:59 AM | 2,428 (1.3%) | 2,402 (1.5%) |
| 12:00 PM to 3:59 PM | 15,956 (8.7%) | 13,181 (8.4%) |
| 4:00 PM to 11:59 PM | 14,136 (7.7%) | 13,429 (8.6%) |
| Total | 183,987 (100.0%) | 156,550 (100.0%) |
Housing Occupancy in Area Code 779
Occupancy by Ownership in Area Code 779
Of the total 295,205 dwellings in Area Code 779, owner-occupied units account for 211,821 (71.8%), while renter-occupied units make up 83,384 (28.2%).
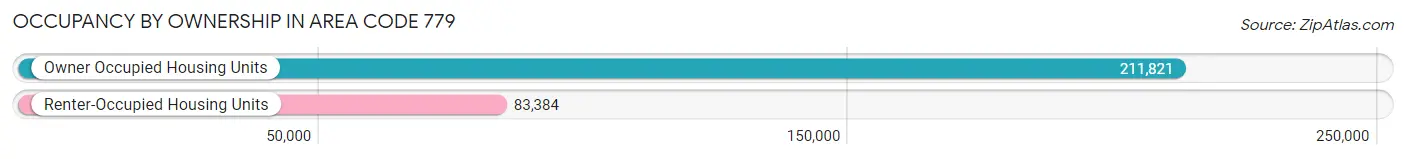
| Occupancy | # Housing Units | % Housing Units |
| Owner Occupied Housing Units | 211,821 | 71.8% |
| Renter-Occupied Housing Units | 83,384 | 28.2% |
| Total Occupied Housing Units | 295,205 | 100.0% |
Occupancy by Household Size in Area Code 779
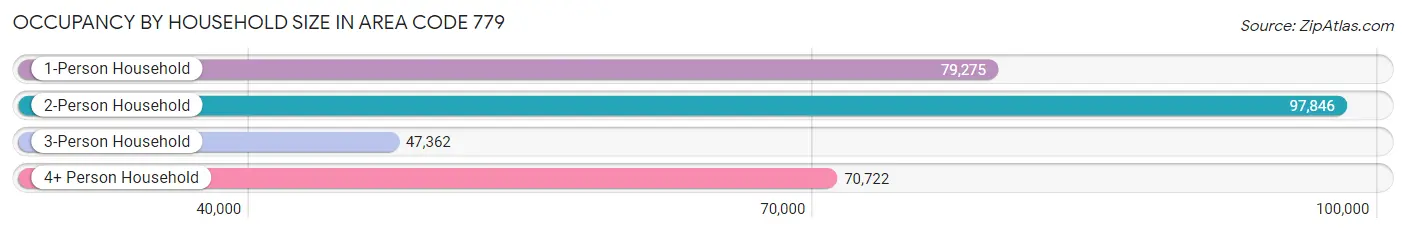
| Household Size | # Housing Units | % Housing Units |
| 1-Person Household | 79,275 | 26.9% |
| 2-Person Household | 97,846 | 33.2% |
| 3-Person Household | 47,362 | 16.0% |
| 4+ Person Household | 70,722 | 24.0% |
| Total Housing Units | 295,205 | 100.0% |
Occupancy by Ownership by Household Size in Area Code 779
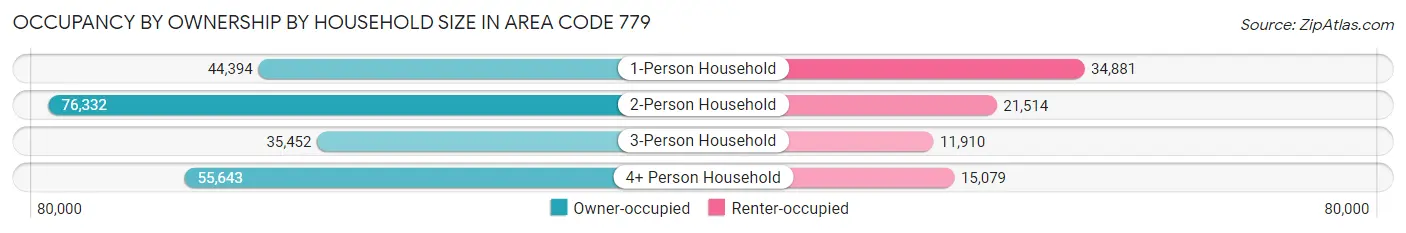
| Household Size | Owner-occupied | Renter-occupied |
| 1-Person Household | 44,394 (56.0%) | 34,881 (44.0%) |
| 2-Person Household | 76,332 (78.0%) | 21,514 (22.0%) |
| 3-Person Household | 35,452 (74.9%) | 11,910 (25.2%) |
| 4+ Person Household | 55,643 (78.7%) | 15,079 (21.3%) |
| Total Housing Units | 211,821 (71.8%) | 83,384 (28.2%) |
Occupancy by Educational Attainment in Area Code 779
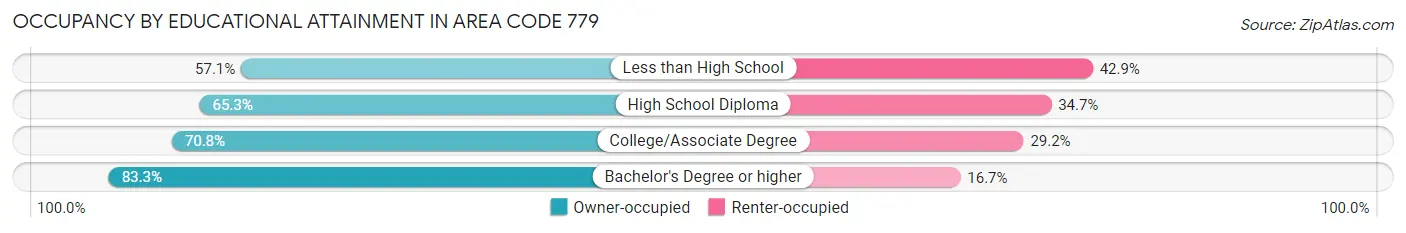
| Household Size | Owner-occupied | Renter-occupied |
| Less than High School | 15,748 (57.1%) | 11,848 (42.9%) |
| High School Diploma | 51,379 (65.3%) | 27,306 (34.7%) |
| College/Associate Degree | 71,876 (70.8%) | 29,646 (29.2%) |
| Bachelor's Degree or higher | 72,818 (83.3%) | 14,584 (16.7%) |
Occupancy by Age of Householder in Area Code 779
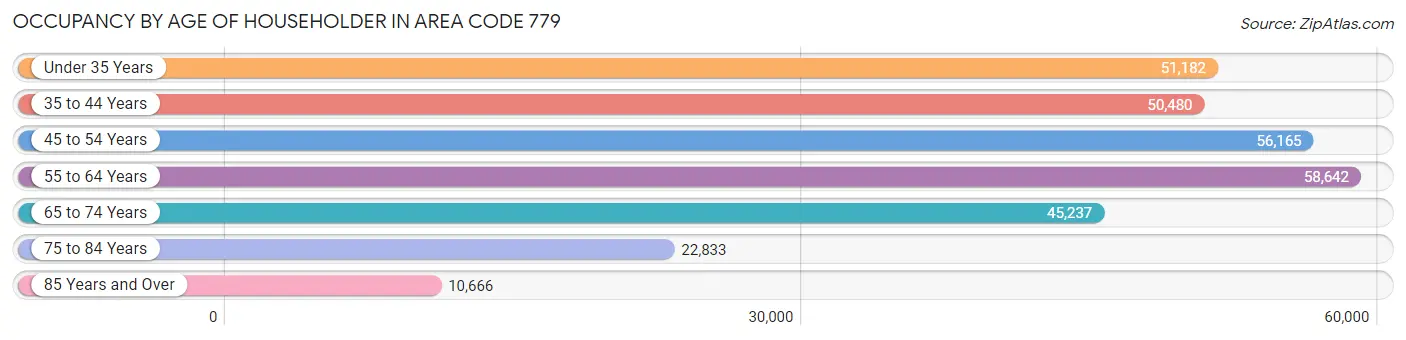
| Age Bracket | # Households | % Households |
| Under 35 Years | 51,182 | 17.3% |
| 35 to 44 Years | 50,480 | 17.1% |
| 45 to 54 Years | 56,165 | 19.0% |
| 55 to 64 Years | 58,642 | 19.9% |
| 65 to 74 Years | 45,237 | 15.3% |
| 75 to 84 Years | 22,833 | 7.7% |
| 85 Years and Over | 10,666 | 3.6% |
| Total | 295,205 | 100.0% |
Housing Finances in Area Code 779
Median Income by Occupancy in Area Code 779
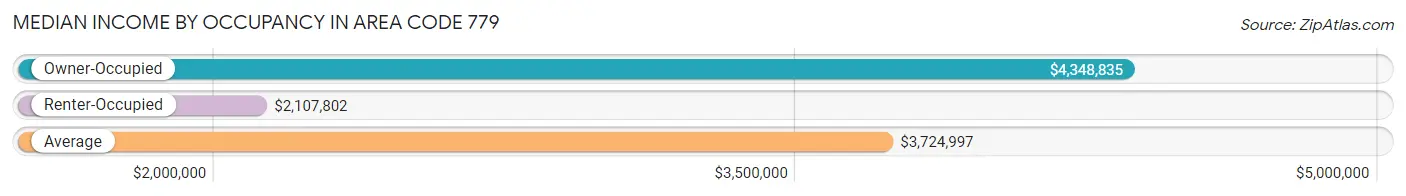
| Occupancy Type | # Households | Median Income |
| Owner-Occupied | 211,821 (71.8%) | $4,348,835 |
| Renter-Occupied | 83,384 (28.2%) | $2,107,802 |
| Average | 295,205 (100.0%) | $3,724,997 |
Occupancy by Householder Income Bracket in Area Code 779
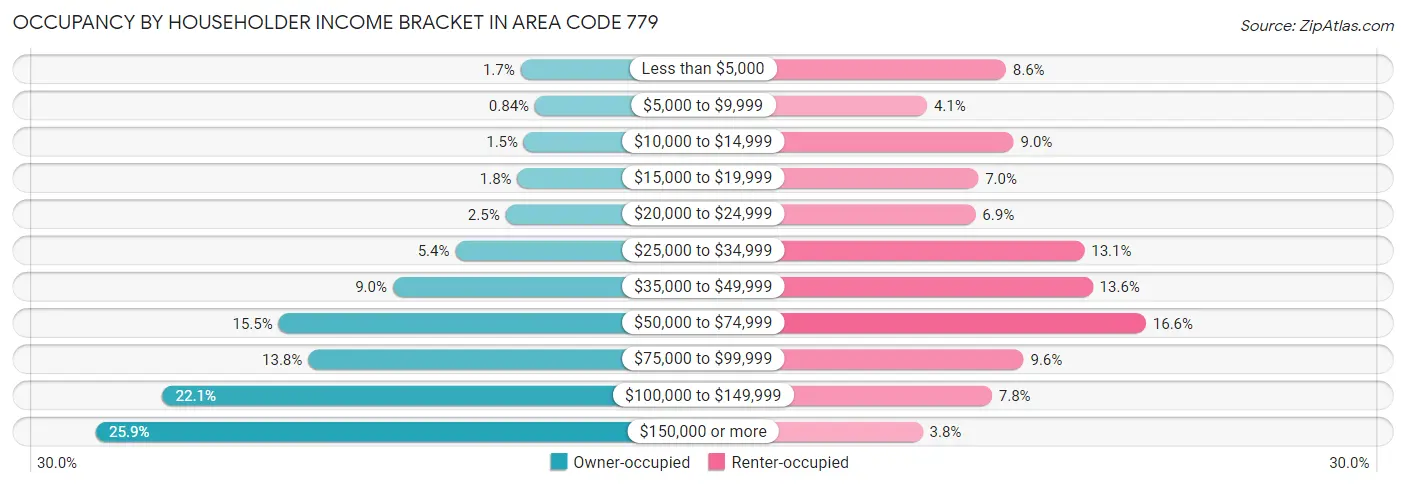
| Income Bracket | Owner-occupied | Renter-occupied |
| Less than $5,000 | 3,513 (1.7%) | 7,163 (8.6%) |
| $5,000 to $9,999 | 1,773 (0.8%) | 3,405 (4.1%) |
| $10,000 to $14,999 | 3,118 (1.5%) | 7,533 (9.0%) |
| $15,000 to $19,999 | 3,904 (1.8%) | 5,842 (7.0%) |
| $20,000 to $24,999 | 5,346 (2.5%) | 5,715 (6.9%) |
| $25,000 to $34,999 | 11,407 (5.4%) | 10,902 (13.1%) |
| $35,000 to $49,999 | 18,976 (9.0%) | 11,297 (13.6%) |
| $50,000 to $74,999 | 32,808 (15.5%) | 13,834 (16.6%) |
| $75,000 to $99,999 | 29,240 (13.8%) | 8,005 (9.6%) |
| $100,000 to $149,999 | 46,844 (22.1%) | 6,495 (7.8%) |
| $150,000 or more | 54,892 (25.9%) | 3,193 (3.8%) |
| Total | 211,821 (100.0%) | 83,384 (100.0%) |
Monthly Housing Cost Tiers in Area Code 779
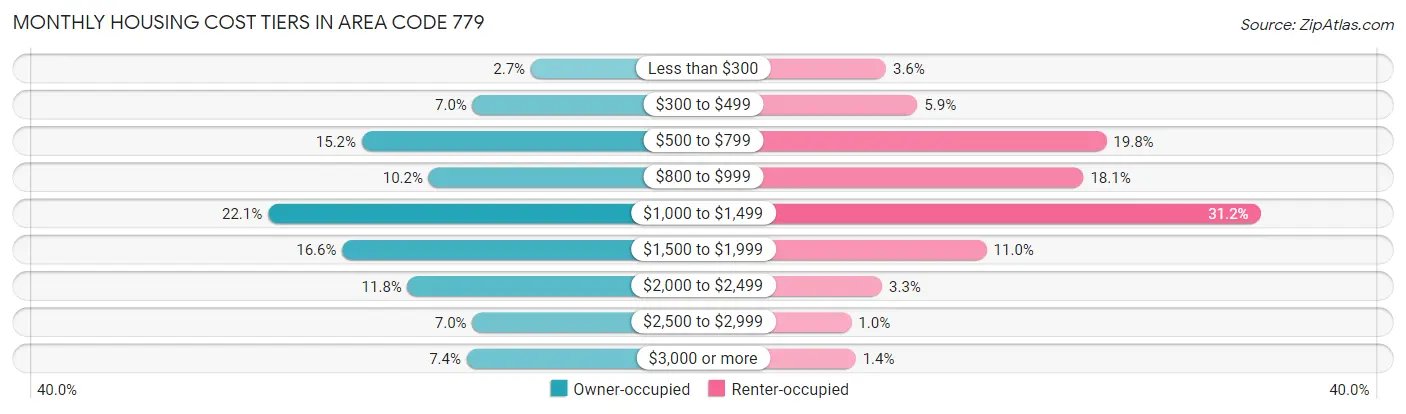
| Monthly Cost | Owner-occupied | Renter-occupied |
| Less than $300 | 5,739 (2.7%) | 2,981 (3.6%) |
| $300 to $499 | 14,821 (7.0%) | 4,911 (5.9%) |
| $500 to $799 | 32,109 (15.2%) | 16,522 (19.8%) |
| $800 to $999 | 21,667 (10.2%) | 15,111 (18.1%) |
| $1,000 to $1,499 | 46,743 (22.1%) | 25,973 (31.1%) |
| $1,500 to $1,999 | 35,164 (16.6%) | 9,163 (11.0%) |
| $2,000 to $2,499 | 24,965 (11.8%) | 2,740 (3.3%) |
| $2,500 to $2,999 | 14,872 (7.0%) | 856 (1.0%) |
| $3,000 or more | 15,741 (7.4%) | 1,126 (1.3%) |
| Total | 211,821 (100.0%) | 83,384 (100.0%) |
Physical Housing Characteristics in Area Code 779
Housing Structures in Area Code 779
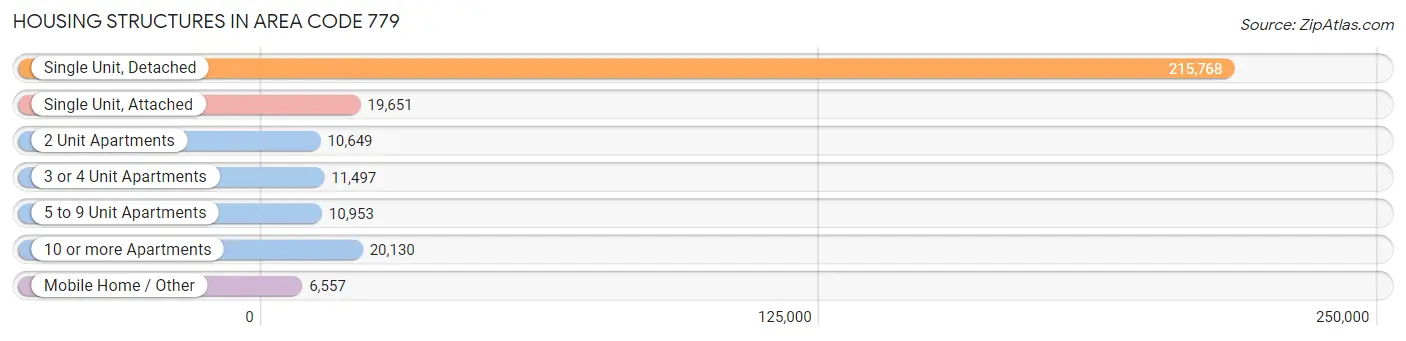
| Structure Type | # Housing Units | % Housing Units |
| Single Unit, Detached | 215,768 | 73.1% |
| Single Unit, Attached | 19,651 | 6.7% |
| 2 Unit Apartments | 10,649 | 3.6% |
| 3 or 4 Unit Apartments | 11,497 | 3.9% |
| 5 to 9 Unit Apartments | 10,953 | 3.7% |
| 10 or more Apartments | 20,130 | 6.8% |
| Mobile Home / Other | 6,557 | 2.2% |
| Total | 295,205 | 100.0% |
Housing Structures by Occupancy in Area Code 779
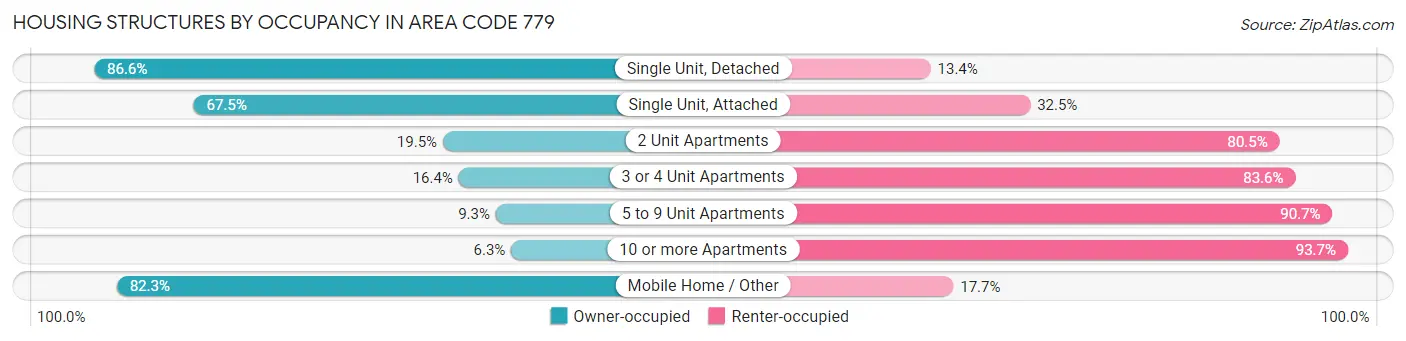
| Structure Type | Owner-occupied | Renter-occupied |
| Single Unit, Detached | 186,924 (86.6%) | 28,844 (13.4%) |
| Single Unit, Attached | 13,257 (67.5%) | 6,394 (32.5%) |
| 2 Unit Apartments | 2,072 (19.5%) | 8,577 (80.5%) |
| 3 or 4 Unit Apartments | 1,888 (16.4%) | 9,609 (83.6%) |
| 5 to 9 Unit Apartments | 1,016 (9.3%) | 9,937 (90.7%) |
| 10 or more Apartments | 1,270 (6.3%) | 18,860 (93.7%) |
| Mobile Home / Other | 5,394 (82.3%) | 1,163 (17.7%) |
| Total | 211,821 (71.8%) | 83,384 (28.2%) |
Housing Structures by Number of Rooms in Area Code 779
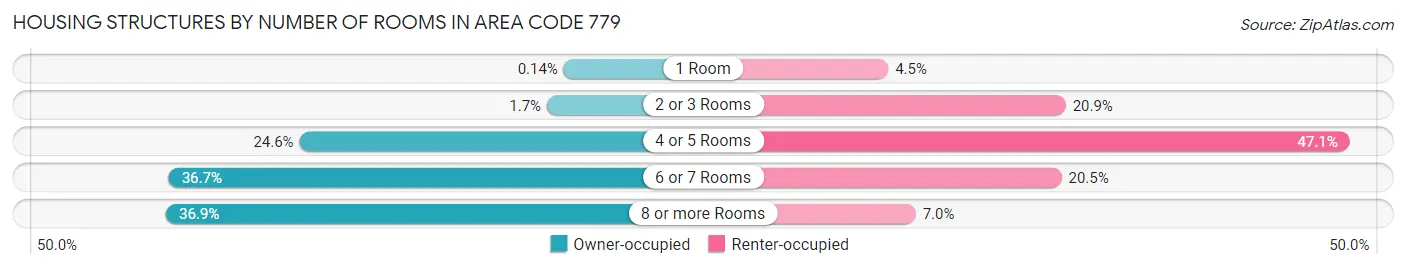
| Number of Rooms | Owner-occupied | Renter-occupied |
| 1 Room | 302 (0.1%) | 3,727 (4.5%) |
| 2 or 3 Rooms | 3,587 (1.7%) | 17,410 (20.9%) |
| 4 or 5 Rooms | 52,066 (24.6%) | 39,304 (47.1%) |
| 6 or 7 Rooms | 77,678 (36.7%) | 17,095 (20.5%) |
| 8 or more Rooms | 78,188 (36.9%) | 5,848 (7.0%) |
| Total | 211,821 (100.0%) | 83,384 (100.0%) |
Housing Structure by Heating Type in Area Code 779
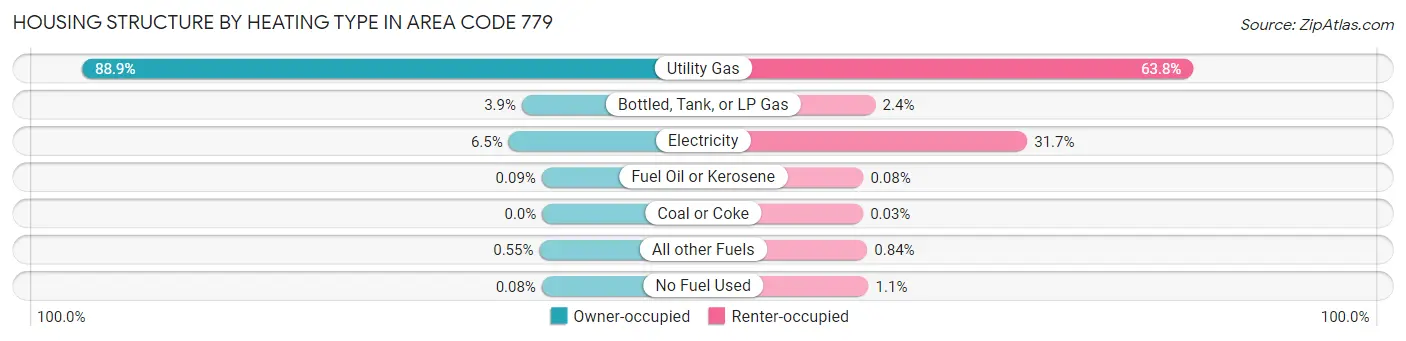
| Heating Type | Owner-occupied | Renter-occupied |
| Utility Gas | 188,289 (88.9%) | 53,189 (63.8%) |
| Bottled, Tank, or LP Gas | 8,299 (3.9%) | 2,037 (2.4%) |
| Electricity | 13,725 (6.5%) | 26,465 (31.7%) |
| Fuel Oil or Kerosene | 185 (0.1%) | 66 (0.1%) |
| Coal or Coke | 0 (0.0%) | 23 (0.0%) |
| All other Fuels | 1,156 (0.5%) | 702 (0.8%) |
| No Fuel Used | 167 (0.1%) | 902 (1.1%) |
| Total | 211,821 (100.0%) | 83,384 (100.0%) |
Household Vehicle Usage in Area Code 779
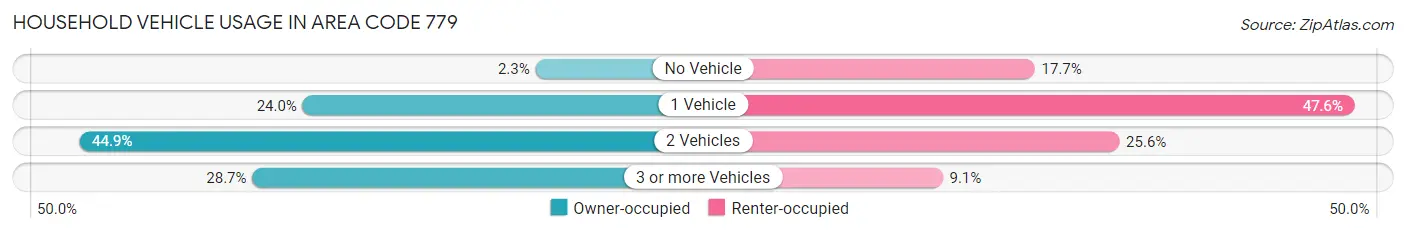
| Vehicles per Household | Owner-occupied | Renter-occupied |
| No Vehicle | 4,876 (2.3%) | 14,755 (17.7%) |
| 1 Vehicle | 50,931 (24.0%) | 39,682 (47.6%) |
| 2 Vehicles | 95,135 (44.9%) | 21,349 (25.6%) |
| 3 or more Vehicles | 60,879 (28.7%) | 7,598 (9.1%) |
| Total | 211,821 (100.0%) | 83,384 (100.0%) |
Real Estate & Mortgages in Area Code 779
Real Estate and Mortgage Overview in Area Code 779
| Characteristic | Without Mortgage | With Mortgage |
| Housing Units | 75,471 | 136,350 |
| Median Property Value | $8,423,900 | $9,330,700 |
| Median Household Income | $3,427,462 | $40,561 |
| Monthly Housing Costs | $32,499 | $15,409 |
| Real Estate Taxes | $191,207 | $2,108 |
Property Value by Mortgage Status in Area Code 779
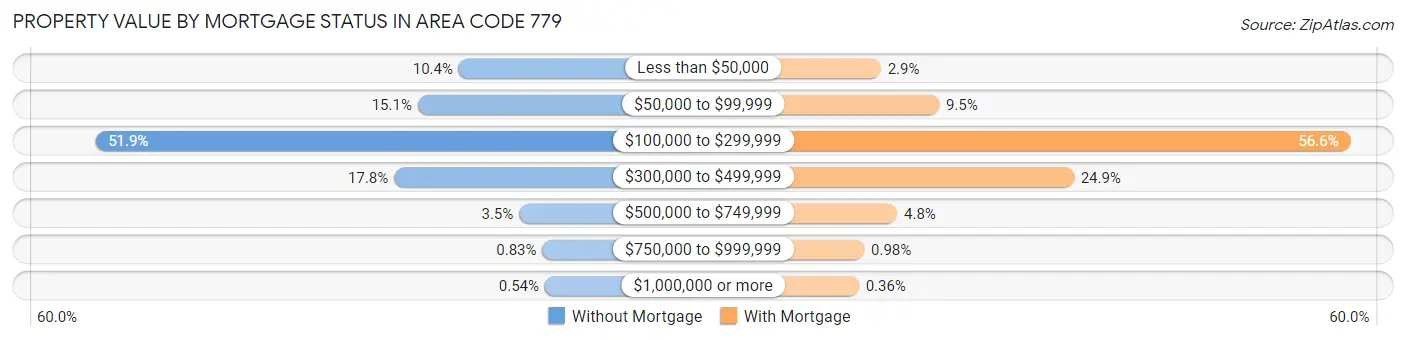
| Property Value | Without Mortgage | With Mortgage |
| Less than $50,000 | 7,835 (10.4%) | 3,931 (2.9%) |
| $50,000 to $99,999 | 11,374 (15.1%) | 12,998 (9.5%) |
| $100,000 to $299,999 | 39,190 (51.9%) | 77,122 (56.6%) |
| $300,000 to $499,999 | 13,410 (17.8%) | 33,993 (24.9%) |
| $500,000 to $749,999 | 2,626 (3.5%) | 6,482 (4.8%) |
| $750,000 to $999,999 | 629 (0.8%) | 1,338 (1.0%) |
| $1,000,000 or more | 407 (0.5%) | 486 (0.4%) |
| Total | 75,471 (100.0%) | 136,350 (100.0%) |
Household Income by Mortgage Status in Area Code 779
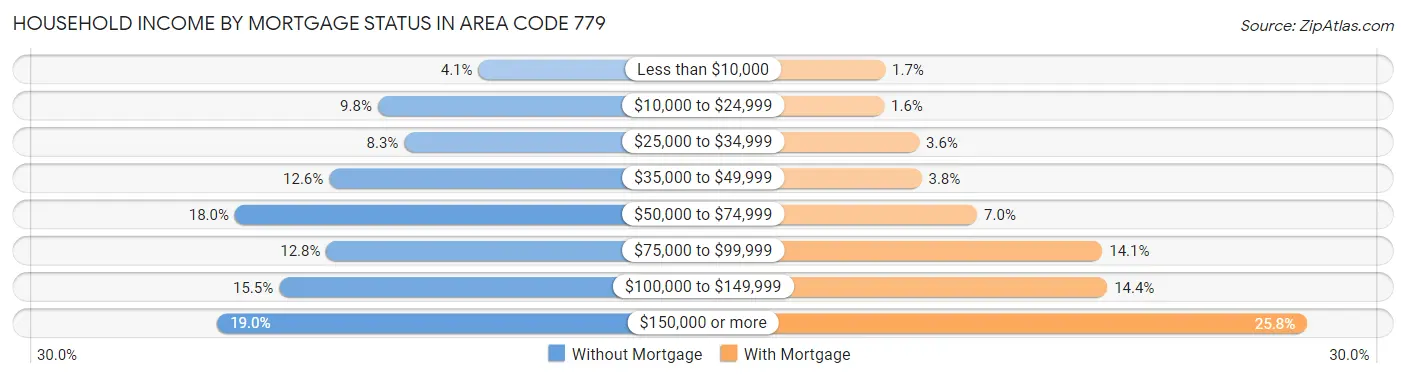
| Household Income | Without Mortgage | With Mortgage |
| Less than $10,000 | 3,068 (4.1%) | 2,298 (1.7%) |
| $10,000 to $24,999 | 7,415 (9.8%) | 2,218 (1.6%) |
| $25,000 to $34,999 | 6,272 (8.3%) | 4,953 (3.6%) |
| $35,000 to $49,999 | 9,506 (12.6%) | 5,135 (3.8%) |
| $50,000 to $74,999 | 13,581 (18.0%) | 9,470 (7.0%) |
| $75,000 to $99,999 | 9,627 (12.8%) | 19,227 (14.1%) |
| $100,000 to $149,999 | 11,671 (15.5%) | 19,613 (14.4%) |
| $150,000 or more | 14,331 (19.0%) | 35,173 (25.8%) |
| Total | 75,471 (100.0%) | 136,350 (100.0%) |
Property Value to Household Income Ratio in Area Code 779
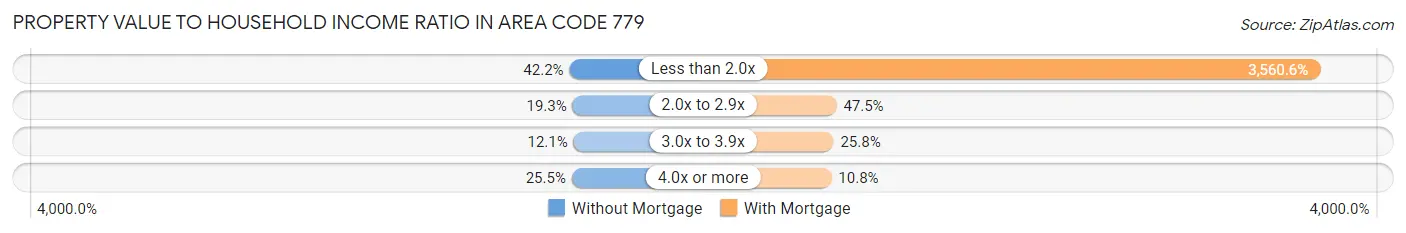
| Value-to-Income Ratio | Without Mortgage | With Mortgage |
| Less than 2.0x | 31,829 (42.2%) | 4,854,816 (3,560.5%) |
| 2.0x to 2.9x | 14,572 (19.3%) | 64,778 (47.5%) |
| 3.0x to 3.9x | 9,095 (12.0%) | 35,168 (25.8%) |
| 4.0x or more | 19,262 (25.5%) | 14,681 (10.8%) |
| Total | 75,471 (100.0%) | 136,350 (100.0%) |
Real Estate Taxes by Mortgage Status in Area Code 779
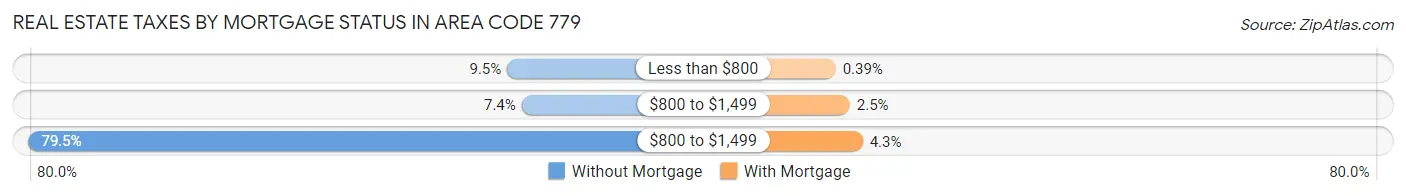
| Property Taxes | Without Mortgage | With Mortgage |
| Less than $800 | 7,169 (9.5%) | 535 (0.4%) |
| $800 to $1,499 | 5,568 (7.4%) | 3,361 (2.5%) |
| $800 to $1,499 | 59,968 (79.5%) | 5,922 (4.3%) |
| Total | 75,471 (100.0%) | 136,350 (100.0%) |
Health & Disability in Area Code 779
Health Insurance Coverage by Age in Area Code 779
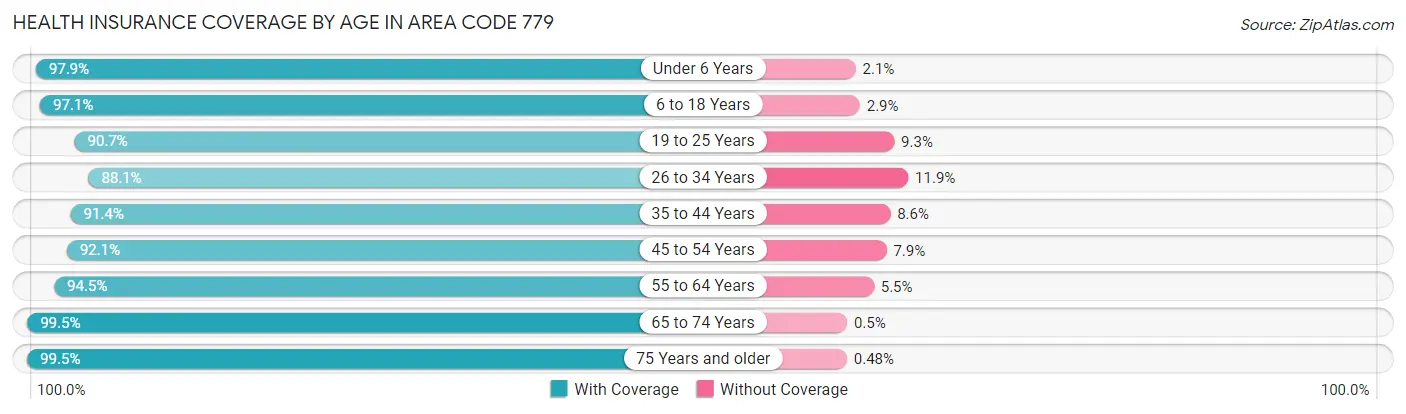
| Age Bracket | With Coverage | Without Coverage |
| Under 6 Years | 52,449 (97.9%) | 1,133 (2.1%) |
| 6 to 18 Years | 134,678 (97.1%) | 4,009 (2.9%) |
| 19 to 25 Years | 68,286 (90.7%) | 7,005 (9.3%) |
| 26 to 34 Years | 73,762 (88.1%) | 9,971 (11.9%) |
| 35 to 44 Years | 87,527 (91.4%) | 8,192 (8.6%) |
| 45 to 54 Years | 94,613 (92.1%) | 8,067 (7.9%) |
| 55 to 64 Years | 95,452 (94.5%) | 5,557 (5.5%) |
| 65 to 74 Years | 72,220 (99.5%) | 361 (0.5%) |
| 75 Years and older | 48,067 (99.5%) | 234 (0.5%) |
| Total | 727,054 (94.2%) | 44,529 (5.8%) |
Health Insurance Coverage by Citizenship Status in Area Code 779
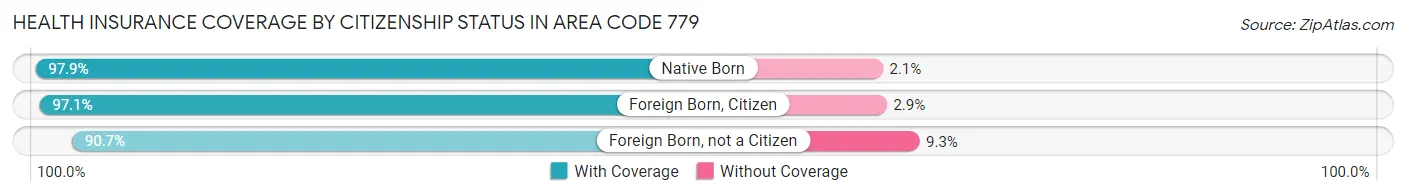
| Citizenship Status | With Coverage | Without Coverage |
| Native Born | 52,449 (97.9%) | 1,133 (2.1%) |
| Foreign Born, Citizen | 134,678 (97.1%) | 4,009 (2.9%) |
| Foreign Born, not a Citizen | 68,286 (90.7%) | 7,005 (9.3%) |
Health Insurance Coverage by Household Income in Area Code 779
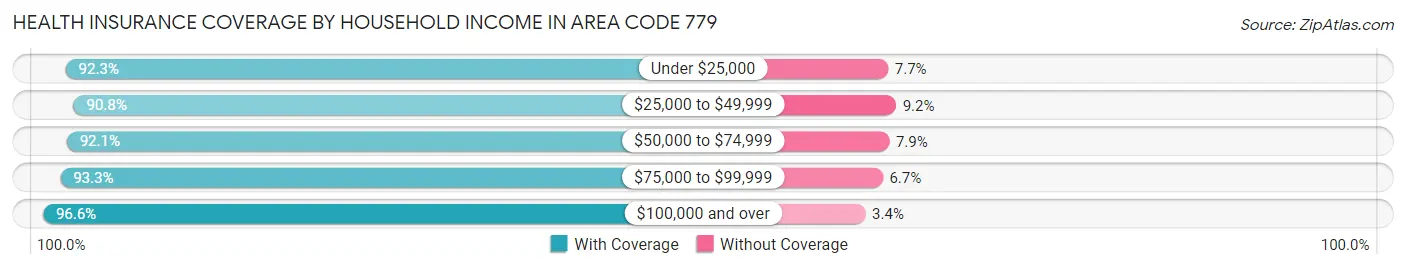
| Household Income | With Coverage | Without Coverage |
| Under $25,000 | 76,790 (92.3%) | 6,399 (7.7%) |
| $25,000 to $49,999 | 97,246 (90.8%) | 9,814 (9.2%) |
| $50,000 to $74,999 | 103,172 (92.1%) | 8,855 (7.9%) |
| $75,000 to $99,999 | 93,321 (93.3%) | 6,676 (6.7%) |
| $100,000 and over | 350,670 (96.6%) | 12,486 (3.4%) |
Public vs Private Health Insurance Coverage by Age in Area Code 779
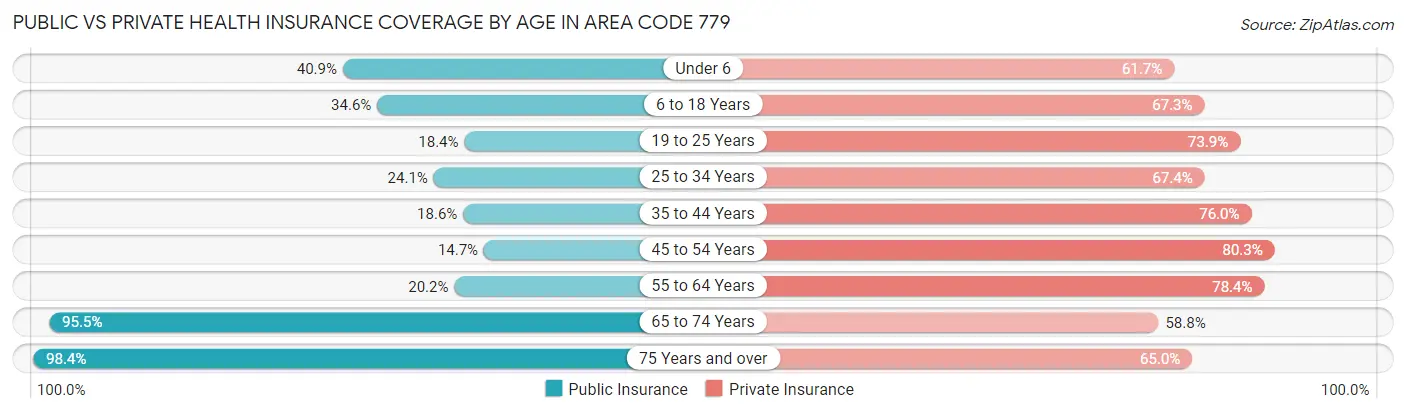
| Age Bracket | Public Insurance | Private Insurance |
| Under 6 | 21,930 (40.9%) | 33,033 (61.7%) |
| 6 to 18 Years | 47,934 (34.6%) | 93,316 (67.3%) |
| 19 to 25 Years | 13,836 (18.4%) | 55,654 (73.9%) |
| 25 to 34 Years | 20,152 (24.1%) | 56,396 (67.3%) |
| 35 to 44 Years | 17,806 (18.6%) | 72,757 (76.0%) |
| 45 to 54 Years | 15,140 (14.7%) | 82,475 (80.3%) |
| 55 to 64 Years | 20,441 (20.2%) | 79,215 (78.4%) |
| 65 to 74 Years | 69,282 (95.5%) | 42,661 (58.8%) |
| 75 Years and over | 47,533 (98.4%) | 31,409 (65.0%) |
| Total | 274,054 (35.5%) | 546,916 (70.9%) |
Disability Status by Sex by Age in Area Code 779
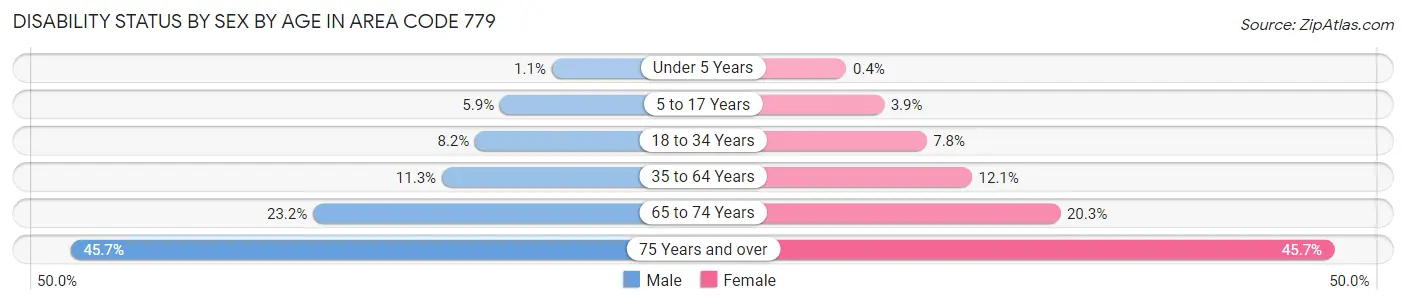
| Age Bracket | Male | Female |
| Under 5 Years | 241 (1.1%) | 84 (0.4%) |
| 5 to 17 Years | 4,245 (5.9%) | 2,546 (3.9%) |
| 18 to 34 Years | 7,008 (8.2%) | 6,634 (7.8%) |
| 35 to 64 Years | 16,879 (11.3%) | 18,044 (12.0%) |
| 65 to 74 Years | 8,127 (23.2%) | 7,611 (20.3%) |
| 75 Years and over | 9,070 (45.7%) | 13,002 (45.7%) |
Disability Class by Sex by Age in Area Code 779
Disability Class: Hearing Difficulty
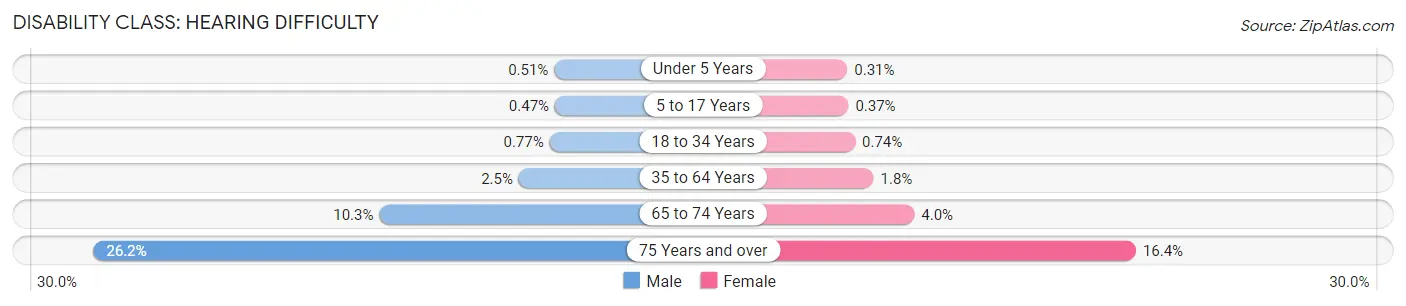
| Age Bracket | Male | Female |
| Under 5 Years | 113 (0.5%) | 65 (0.3%) |
| 5 to 17 Years | 336 (0.5%) | 239 (0.4%) |
| 18 to 34 Years | 661 (0.8%) | 625 (0.7%) |
| 35 to 64 Years | 3,708 (2.5%) | 2,651 (1.8%) |
| 65 to 74 Years | 3,586 (10.2%) | 1,519 (4.0%) |
| 75 Years and over | 5,190 (26.2%) | 4,662 (16.4%) |
Disability Class: Vision Difficulty
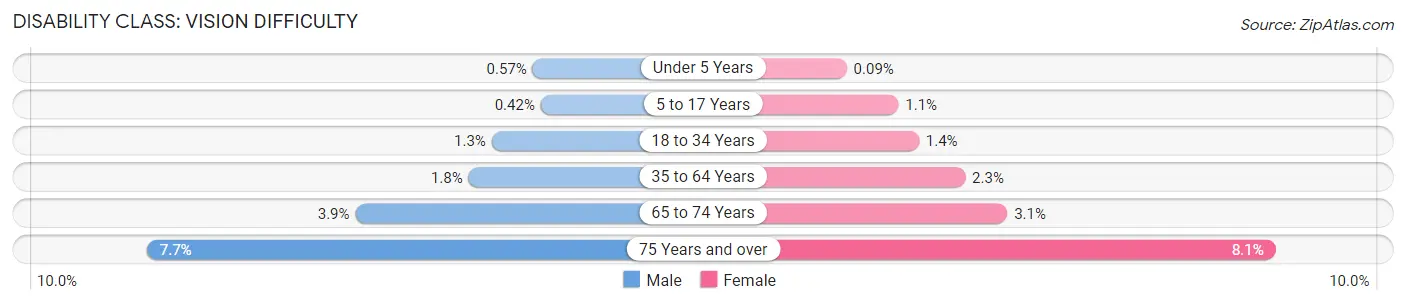
| Age Bracket | Male | Female |
| Under 5 Years | 128 (0.6%) | 19 (0.1%) |
| 5 to 17 Years | 303 (0.4%) | 688 (1.1%) |
| 18 to 34 Years | 1,136 (1.3%) | 1,209 (1.4%) |
| 35 to 64 Years | 2,641 (1.8%) | 3,435 (2.3%) |
| 65 to 74 Years | 1,350 (3.9%) | 1,154 (3.1%) |
| 75 Years and over | 1,533 (7.7%) | 2,291 (8.1%) |
Disability Class: Cognitive Difficulty
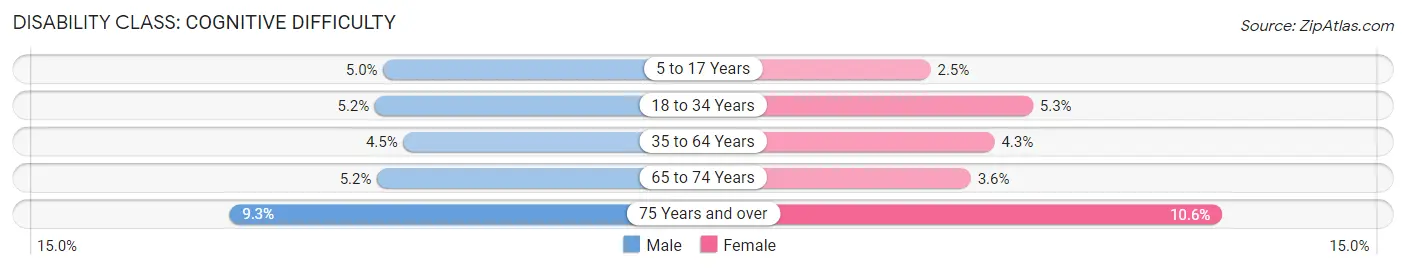
| Age Bracket | Male | Female |
| 5 to 17 Years | 3,617 (5.0%) | 1,616 (2.5%) |
| 18 to 34 Years | 4,482 (5.2%) | 4,502 (5.3%) |
| 35 to 64 Years | 6,661 (4.4%) | 6,360 (4.3%) |
| 65 to 74 Years | 1,812 (5.2%) | 1,349 (3.6%) |
| 75 Years and over | 1,845 (9.3%) | 3,014 (10.6%) |
Disability Class: Ambulatory Difficulty
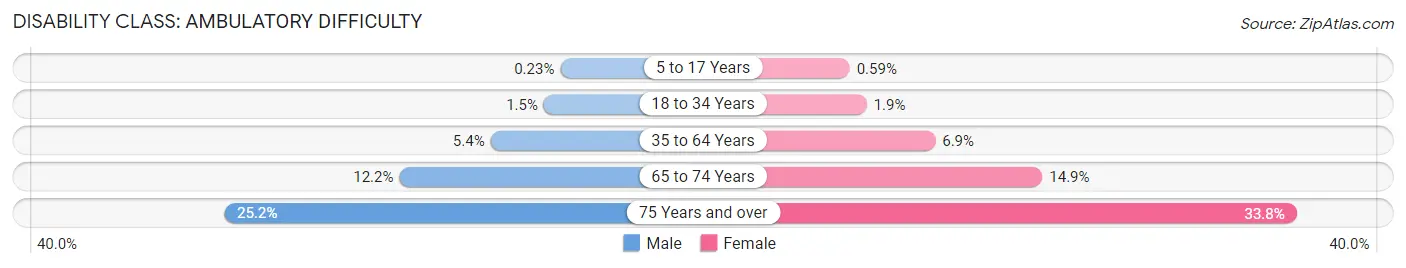
| Age Bracket | Male | Female |
| 5 to 17 Years | 169 (0.2%) | 389 (0.6%) |
| 18 to 34 Years | 1,240 (1.5%) | 1,566 (1.8%) |
| 35 to 64 Years | 8,095 (5.4%) | 10,385 (6.9%) |
| 65 to 74 Years | 4,262 (12.2%) | 5,597 (14.9%) |
| 75 Years and over | 4,996 (25.2%) | 9,612 (33.8%) |
Disability Class: Self-Care Difficulty
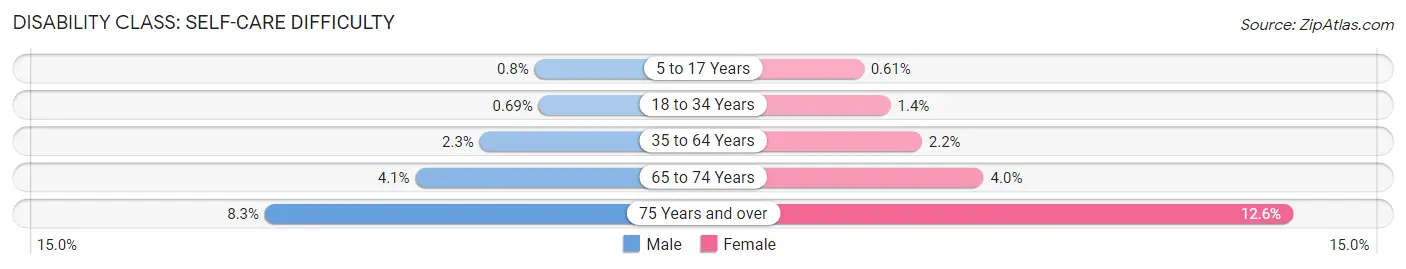
| Age Bracket | Male | Female |
| 5 to 17 Years | 579 (0.8%) | 399 (0.6%) |
| 18 to 34 Years | 587 (0.7%) | 1,152 (1.4%) |
| 35 to 64 Years | 3,487 (2.3%) | 3,331 (2.2%) |
| 65 to 74 Years | 1,443 (4.1%) | 1,485 (4.0%) |
| 75 Years and over | 1,647 (8.3%) | 3,576 (12.6%) |
Technology Access in Area Code 779
Computing Device Access in Area Code 779
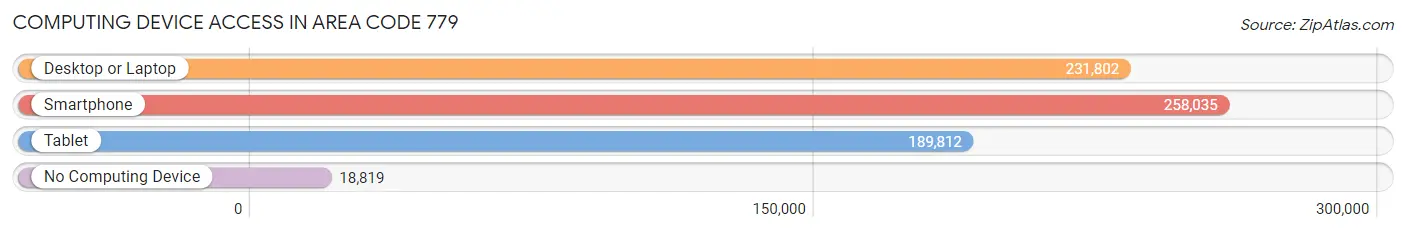
| Device Type | # Households | % Households |
| Desktop or Laptop | 231,802 | 78.5% |
| Smartphone | 258,035 | 87.4% |
| Tablet | 189,812 | 64.3% |
| No Computing Device | 18,819 | 6.4% |
| Total | 295,205 | 100.0% |
Internet Access in Area Code 779
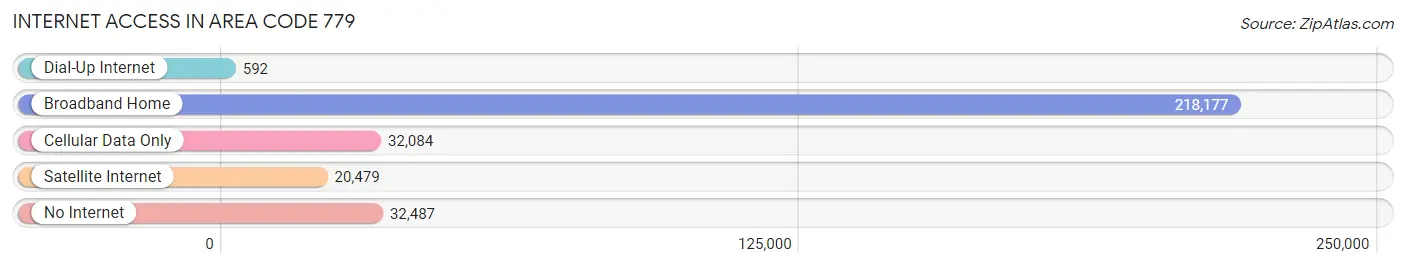
| Internet Type | # Households | % Households |
| Dial-Up Internet | 592 | 0.2% |
| Broadband Home | 218,177 | 73.9% |
| Cellular Data Only | 32,084 | 10.9% |
| Satellite Internet | 20,479 | 6.9% |
| No Internet | 32,487 | 11.0% |
| Total | 295,205 | 100.0% |
Area Code 779 Summary
Geography
Area code 779 is located in the state of Illinois and covers the northern and western suburbs of Chicago, including Rockford, Freeport, and DeKalb. It also includes parts of McHenry, Kane, and Winnebago counties.
Social
Area code 779 is home to a diverse population of people from all walks of life. The area is known for its vibrant music and art scene, as well as its many outdoor activities. The area is also home to a number of universities and colleges, making it a great place for students to live and learn.
Economics
Area code 779 is a major economic hub in the state of Illinois. The area is home to a number of large corporations, including Caterpillar, Woodward, and Rockford Corporation. The area also has a thriving small business sector, with many local businesses providing goods and services to the community.
Demographics
Area code 779 is home to a diverse population of people from all walks of life. The area is home to a large number of African Americans, Hispanics, and Asians. The median household income in the area is $60,000, and the median age is 37. The area is also home to a large number of college students, making it a great place for young professionals to live and work.
Common Questions
What is Per Capita Income in Area Code 779?
Per Capita income in Area Code 779 is $37,807.
What is the Median Family Income in Area Code 779?
Median Family Income in Area Code 779 is $94,440.
What is the Median Household income in Area Code 779?
Median Household Income in Area Code 779 is $79,255.
What is Income or Wage Gap in Area Code 779?
Income or Wage Gap in Area Code 779 is 36.8%.
Women in Area Code 779 earn 63.2 cents for every dollar earned by a man.
What is Family Income Deficit in Area Code 779?
Family Income Deficit in Area Code 779 is $11,485.
Families that are below poverty line in Area Code 779 earn $11,485 less on average than the poverty threshold level.
What is Inequality or Gini Index in Area Code 779?
Inequality or Gini Index in Area Code 779 is 19.60.
What is the Total Population of Area Code 779?
Total Population of Area Code 779 is 781,698.
What is the Total Male Population of Area Code 779?
Total Male Population of Area Code 779 is 391,469.
What is the Total Female Population of Area Code 779?
Total Female Population of Area Code 779 is 390,229.
What is the Ratio of Males per 100 Females in Area Code 779?
There are 100.32 Males per 100 Females in Area Code 779.
What is the Ratio of Females per 100 Males in Area Code 779?
There are 99.68 Females per 100 Males in Area Code 779.
What is the Median Population Age in Area Code 779?
Median Population Age in Area Code 779 is 40.8 Years.
What is the Average Family Size in Area Code 779
Average Family Size in Area Code 779 is 3.1 People.
What is the Average Household Size in Area Code 779
Average Household Size in Area Code 779 is 2.5 People.
How Large is the Labor Force in Area Code 779?
There are 400,968 People in the Labor Forcein in Area Code 779.
What is the Percentage of People in the Labor Force in Area Code 779?
64.4% of People are in the Labor Force in Area Code 779.
What is the Unemployment Rate in Area Code 779?
Unemployment Rate in Area Code 779 is 5.5%.