Cook County, IL Map & Demographics
Cook County Map
Cook County Overview
$45,646
PER CAPITA INCOME
$97,520
AVG FAMILY INCOME
$78,304
AVG HOUSEHOLD INCOME
22.6%
WAGE / INCOME GAP [ % ]
77.4¢/ $1
WAGE / INCOME GAP [ $ ]
$11,452
FAMILY INCOME DEFICIT
0.50
INEQUALITY / GINI INDEX
5,225,367
TOTAL POPULATION
2,554,641
MALE POPULATION
2,670,726
FEMALE POPULATION
95.65
MALES / 100 FEMALES
104.54
FEMALES / 100 MALES
37.5
MEDIAN AGE
3.3
AVG FAMILY SIZE
2.5
AVG HOUSEHOLD SIZE
2,801,266
LABOR FORCE [ PEOPLE ]
66.2%
PERCENT IN LABOR FORCE
7.1%
UNEMPLOYMENT RATE
Income in Cook County
Income Overview in Cook County
Per Capita Income in Cook County is $45,646, while median incomes of families and households are $97,520 and $78,304 respectively.
| Characteristic | Number | Measure |
| Per Capita Income | 5,225,367 | $45,646 |
| Median Family Income | 1,210,670 | $97,520 |
| Mean Family Income | 1,210,670 | $137,033 |
| Median Household Income | 2,066,248 | $78,304 |
| Mean Household Income | 2,066,248 | $113,411 |
| Income Deficit | 1,210,670 | $11,452 |
| Wage / Income Gap (%) | 5,225,367 | 22.64% |
| Wage / Income Gap ($) | 5,225,367 | 77.36¢ per $1 |
| Gini / Inequality Index | 5,225,367 | 0.50 |
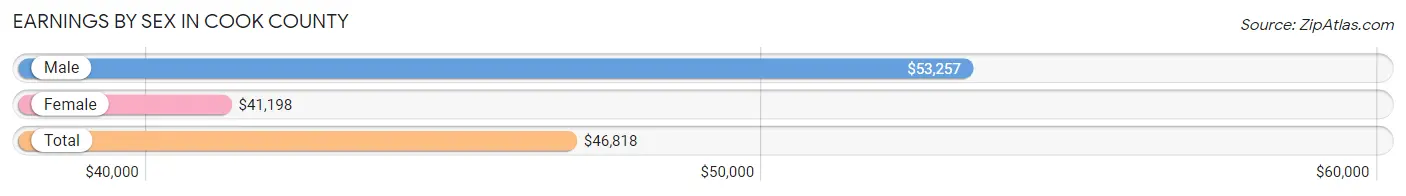
Earnings by Sex in Cook County
Average Earnings in Cook County are $46,818, $53,257 for men and $41,198 for women, a difference of 22.6%.
| Sex | Number | Average Earnings |
| Male | 1,470,769 (51.9%) | $53,257 |
| Female | 1,363,713 (48.1%) | $41,198 |
| Total | 2,834,482 (100.0%) | $46,818 |
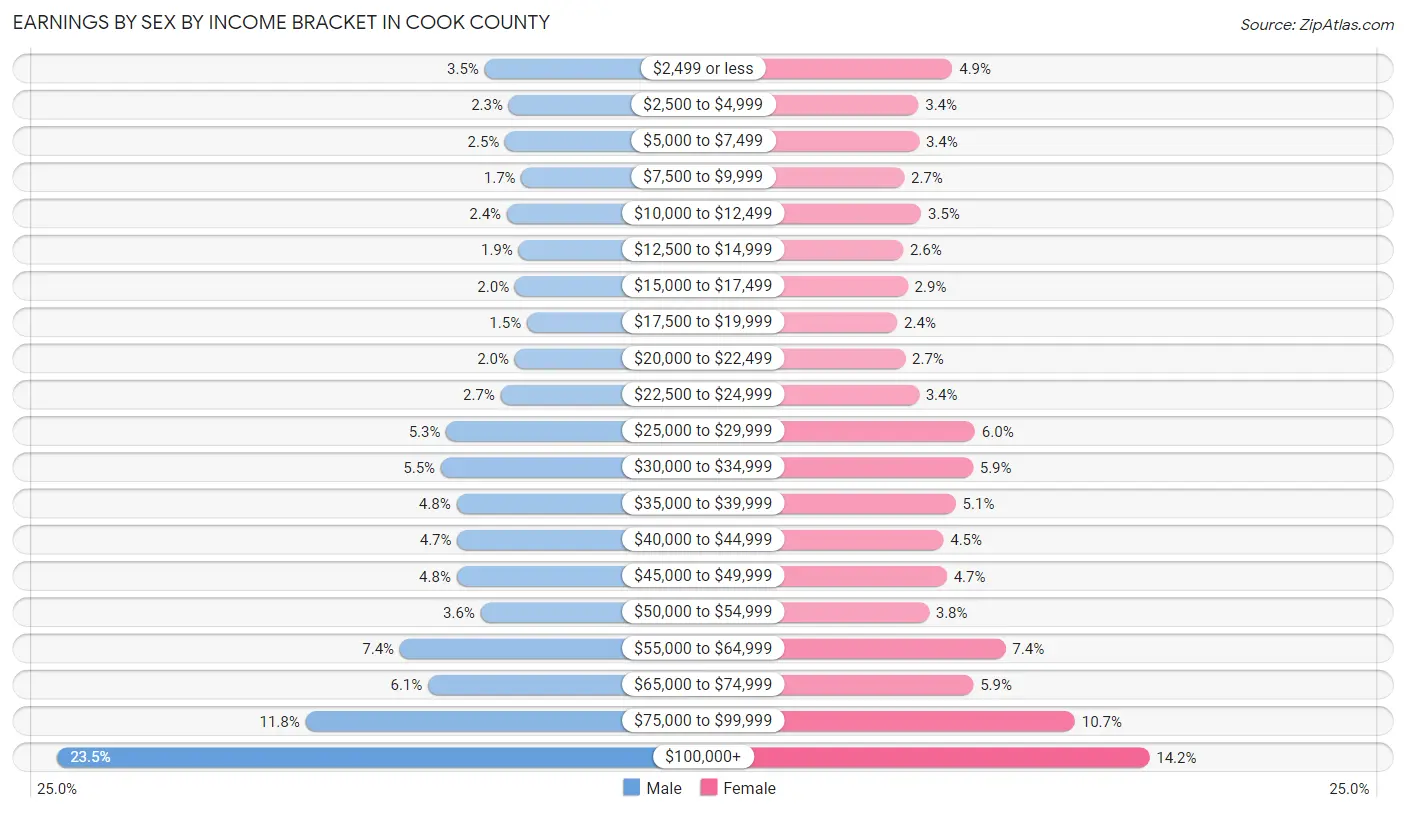
Earnings by Sex by Income Bracket in Cook County
The most common earnings brackets in Cook County are $100,000+ for men (345,232 | 23.5%) and $100,000+ for women (193,226 | 14.2%).
| Income | Male | Female |
| $2,499 or less | 50,774 (3.5%) | 67,348 (4.9%) |
| $2,500 to $4,999 | 34,142 (2.3%) | 45,721 (3.4%) |
| $5,000 to $7,499 | 36,572 (2.5%) | 46,121 (3.4%) |
| $7,500 to $9,999 | 25,447 (1.7%) | 36,500 (2.7%) |
| $10,000 to $12,499 | 35,480 (2.4%) | 47,401 (3.5%) |
| $12,500 to $14,999 | 27,403 (1.9%) | 35,872 (2.6%) |
| $15,000 to $17,499 | 29,918 (2.0%) | 38,825 (2.9%) |
| $17,500 to $19,999 | 21,641 (1.5%) | 32,166 (2.4%) |
| $20,000 to $22,499 | 29,961 (2.0%) | 37,250 (2.7%) |
| $22,500 to $24,999 | 39,751 (2.7%) | 45,959 (3.4%) |
| $25,000 to $29,999 | 77,160 (5.2%) | 81,765 (6.0%) |
| $30,000 to $34,999 | 80,922 (5.5%) | 80,495 (5.9%) |
| $35,000 to $39,999 | 70,146 (4.8%) | 69,509 (5.1%) |
| $40,000 to $44,999 | 69,612 (4.7%) | 61,622 (4.5%) |
| $45,000 to $49,999 | 70,082 (4.8%) | 63,846 (4.7%) |
| $50,000 to $54,999 | 53,561 (3.6%) | 52,420 (3.8%) |
| $55,000 to $64,999 | 109,076 (7.4%) | 101,298 (7.4%) |
| $65,000 to $74,999 | 89,710 (6.1%) | 80,712 (5.9%) |
| $75,000 to $99,999 | 174,179 (11.8%) | 145,657 (10.7%) |
| $100,000+ | 345,232 (23.5%) | 193,226 (14.2%) |
| Total | 1,470,769 (100.0%) | 1,363,713 (100.0%) |
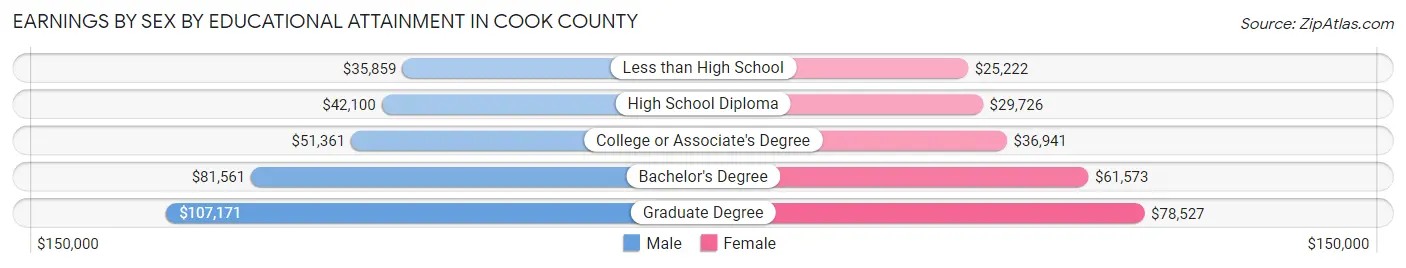
Earnings by Sex by Educational Attainment in Cook County
Average earnings in Cook County are $59,306 for men and $46,756 for women, a difference of 21.2%. Men with an educational attainment of graduate degree enjoy the highest average annual earnings of $107,171, while those with less than high school education earn the least with $35,859. Women with an educational attainment of graduate degree earn the most with the average annual earnings of $78,527, while those with less than high school education have the smallest earnings of $25,222.
| Educational Attainment | Male Income | Female Income |
| Less than High School | $35,859 | $25,222 |
| High School Diploma | $42,100 | $29,726 |
| College or Associate's Degree | $51,361 | $36,941 |
| Bachelor's Degree | $81,561 | $61,573 |
| Graduate Degree | $107,171 | $78,527 |
| Total | $59,306 | $46,756 |
Family Income in Cook County
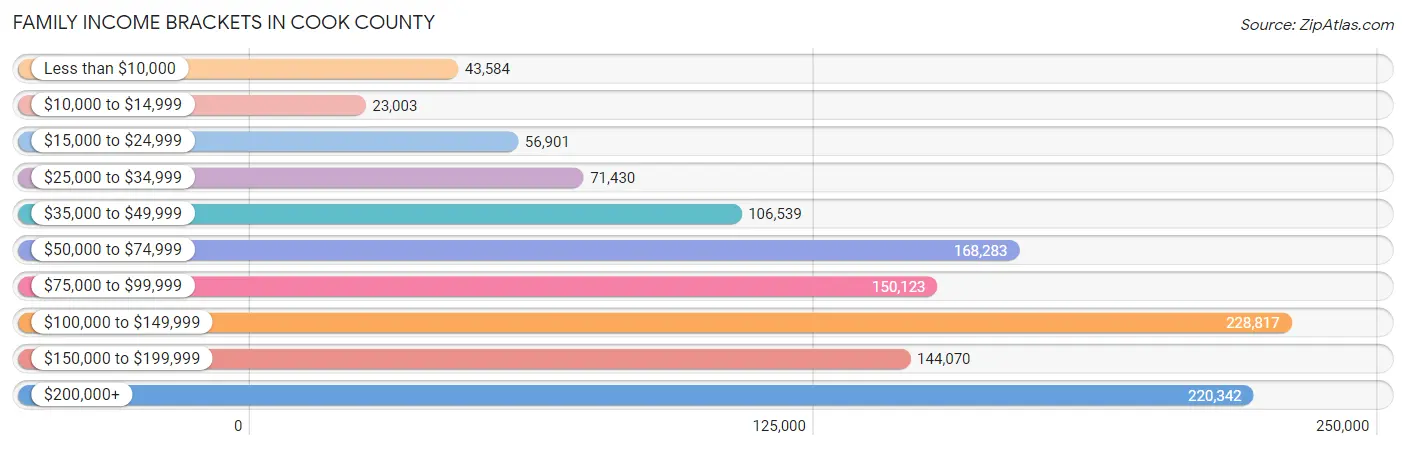
Family Income Brackets in Cook County
According to the Cook County family income data, there are 228,817 families falling into the $100,000 to $149,999 income range, which is the most common income bracket and makes up 18.9% of all families. Conversely, the $10,000 to $14,999 income bracket is the least frequent group with only 23,003 families (1.9%) belonging to this category.
| Income Bracket | # Families | % Families |
| Less than $10,000 | 43,584 | 3.6% |
| $10,000 to $14,999 | 23,003 | 1.9% |
| $15,000 to $24,999 | 56,901 | 4.7% |
| $25,000 to $34,999 | 71,430 | 5.9% |
| $35,000 to $49,999 | 106,539 | 8.8% |
| $50,000 to $74,999 | 168,283 | 13.9% |
| $75,000 to $99,999 | 150,123 | 12.4% |
| $100,000 to $149,999 | 228,817 | 18.9% |
| $150,000 to $199,999 | 144,070 | 11.9% |
| $200,000+ | 220,342 | 18.2% |
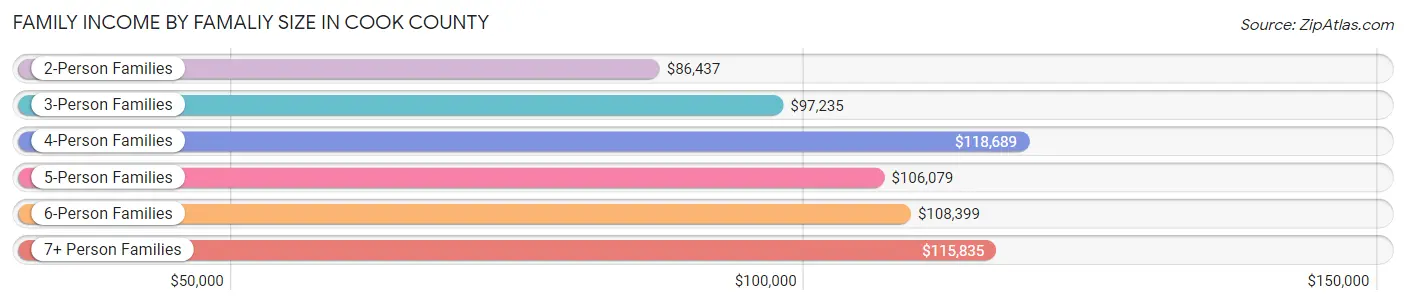
Family Income by Famaliy Size in Cook County
4-person families (232,010 | 19.2%) account for the highest median family income in Cook County with $118,689 per family, while 2-person families (518,977 | 42.9%) have the highest median income of $43,218 per family member.
| Income Bracket | # Families | Median Income |
| 2-Person Families | 518,977 (42.9%) | $86,437 |
| 3-Person Families | 283,709 (23.4%) | $97,235 |
| 4-Person Families | 232,010 (19.2%) | $118,689 |
| 5-Person Families | 109,785 (9.1%) | $106,079 |
| 6-Person Families | 40,751 (3.4%) | $108,399 |
| 7+ Person Families | 25,438 (2.1%) | $115,835 |
| Total | 1,210,670 (100.0%) | $97,520 |
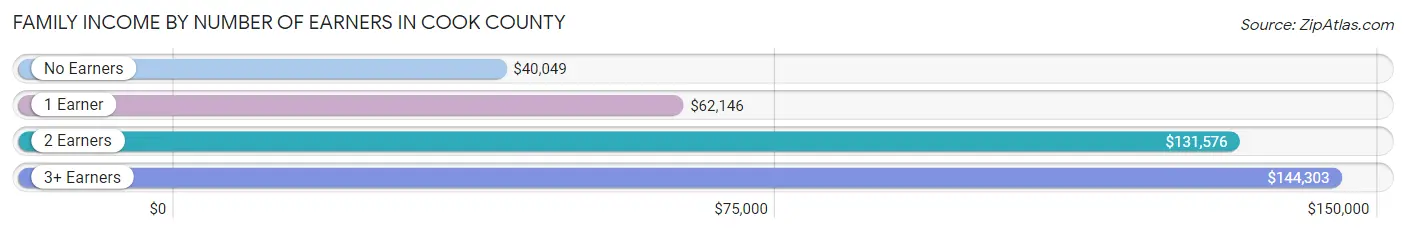
Family Income by Number of Earners in Cook County
The median family income in Cook County is $97,520, with families comprising 3+ earners (161,118) having the highest median family income of $144,303, while families with no earners (148,695) have the lowest median family income of $40,049, accounting for 13.3% and 12.3% of families, respectively.
| Number of Earners | # Families | Median Income |
| No Earners | 148,695 (12.3%) | $40,049 |
| 1 Earner | 388,991 (32.1%) | $62,146 |
| 2 Earners | 511,866 (42.3%) | $131,576 |
| 3+ Earners | 161,118 (13.3%) | $144,303 |
| Total | 1,210,670 (100.0%) | $97,520 |
Household Income in Cook County
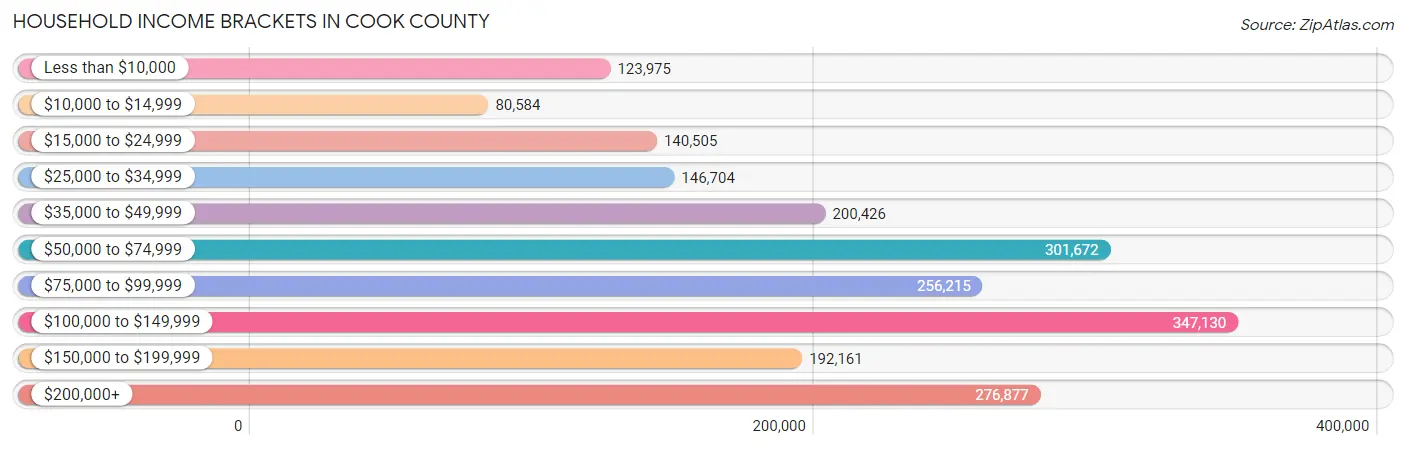
Household Income Brackets in Cook County
With 347,130 households falling in the category, the $100,000 to $149,999 income range is the most frequent in Cook County, accounting for 16.8% of all households. In contrast, only 80,584 households (3.9%) fall into the $10,000 to $14,999 income bracket, making it the least populous group.
| Income Bracket | # Households | % Households |
| Less than $10,000 | 123,975 | 6.0% |
| $10,000 to $14,999 | 80,584 | 3.9% |
| $15,000 to $24,999 | 140,505 | 6.8% |
| $25,000 to $34,999 | 146,704 | 7.1% |
| $35,000 to $49,999 | 200,426 | 9.7% |
| $50,000 to $74,999 | 301,672 | 14.6% |
| $75,000 to $99,999 | 256,215 | 12.4% |
| $100,000 to $149,999 | 347,130 | 16.8% |
| $150,000 to $199,999 | 192,161 | 9.3% |
| $200,000+ | 276,877 | 13.4% |
Household Income by Householder Age in Cook County
The median household income in Cook County is $78,304, with the highest median household income of $90,088 found in the 45 to 64 years age bracket for the primary householder. A total of 734,214 households (35.5%) fall into this category. Meanwhile, the 15 to 24 years age bracket for the primary householder has the lowest median household income of $44,540, with 67,266 households (3.3%) in this group.
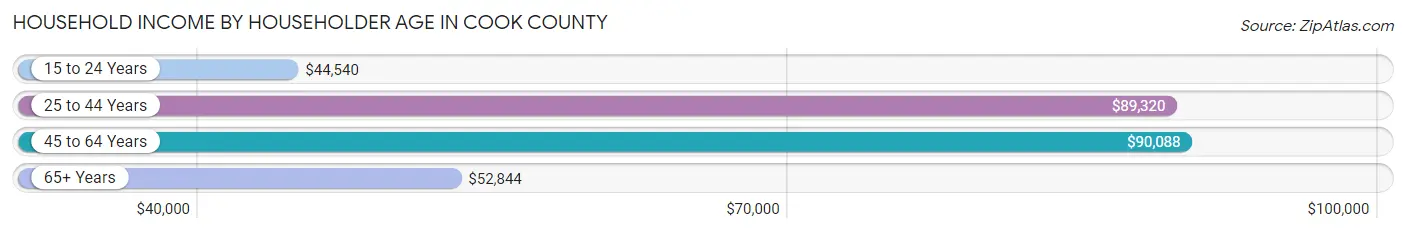
| Income Bracket | # Households | Median Income |
| 15 to 24 Years | 67,266 (3.3%) | $44,540 |
| 25 to 44 Years | 755,953 (36.6%) | $89,320 |
| 45 to 64 Years | 734,214 (35.5%) | $90,088 |
| 65+ Years | 508,815 (24.6%) | $52,844 |
| Total | 2,066,248 (100.0%) | $78,304 |
Poverty in Cook County
Income Below Poverty by Sex and Age in Cook County
With 12.0% poverty level for males and 14.6% for females among the residents of Cook County, 15 year old males and 15 year old females are the most vulnerable to poverty, with 6,588 males (19.7%) and 6,944 females (21.5%) in their respective age groups living below the poverty level.
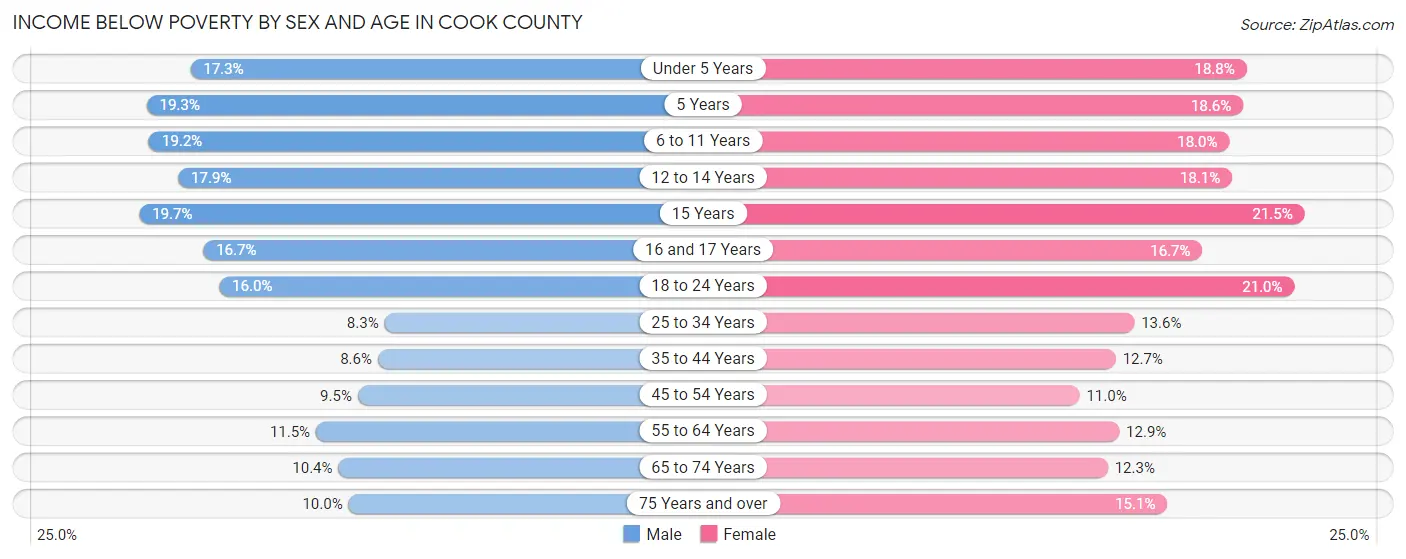
| Age Bracket | Male | Female |
| Under 5 Years | 25,976 (17.3%) | 27,208 (18.8%) |
| 5 Years | 5,743 (19.3%) | 5,145 (18.6%) |
| 6 to 11 Years | 36,117 (19.2%) | 32,759 (18.0%) |
| 12 to 14 Years | 17,784 (17.9%) | 16,938 (18.1%) |
| 15 Years | 6,588 (19.7%) | 6,944 (21.5%) |
| 16 and 17 Years | 10,796 (16.7%) | 10,489 (16.7%) |
| 18 to 24 Years | 34,556 (16.0%) | 46,125 (21.0%) |
| 25 to 34 Years | 34,187 (8.3%) | 56,269 (13.6%) |
| 35 to 44 Years | 30,956 (8.6%) | 45,582 (12.7%) |
| 45 to 54 Years | 30,577 (9.5%) | 35,930 (11.0%) |
| 55 to 64 Years | 35,233 (11.5%) | 42,241 (12.9%) |
| 65 to 74 Years | 21,706 (10.4%) | 30,654 (12.3%) |
| 75 Years and over | 12,207 (10.0%) | 29,196 (15.1%) |
| Total | 302,426 (12.0%) | 385,480 (14.6%) |
Income Above Poverty by Sex and Age in Cook County
According to the poverty statistics in Cook County, males aged 25 to 34 years and females aged 45 to 54 years are the age groups that are most secure financially, with 91.7% of males and 89.0% of females in these age groups living above the poverty line.
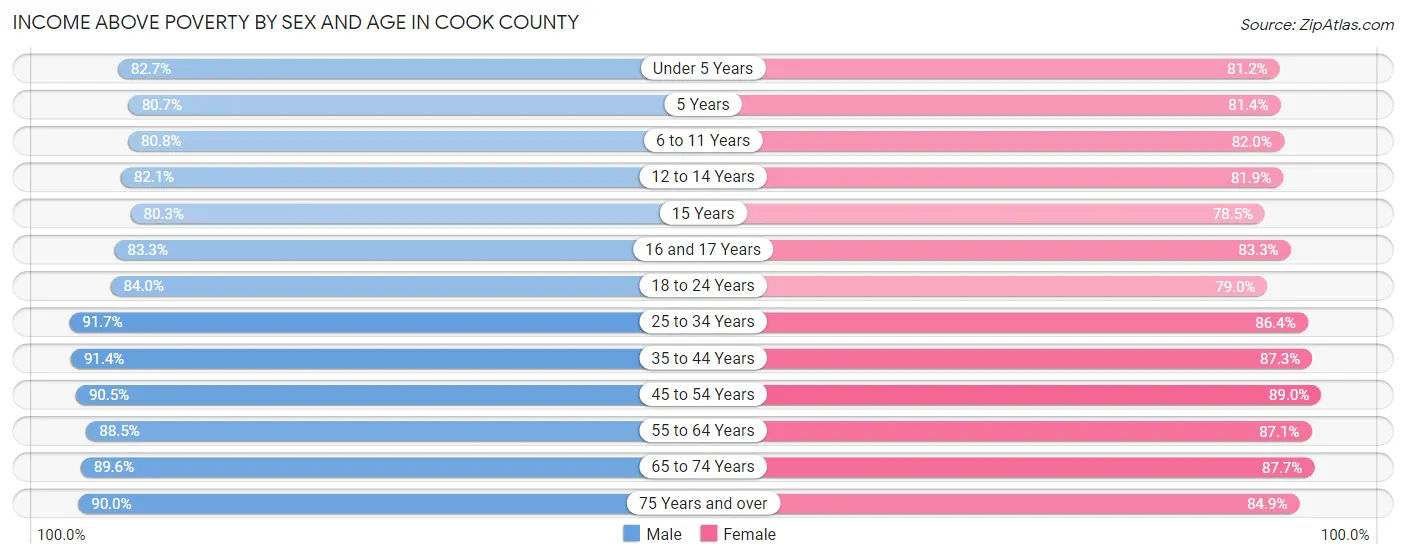
| Age Bracket | Male | Female |
| Under 5 Years | 124,078 (82.7%) | 117,666 (81.2%) |
| 5 Years | 23,951 (80.7%) | 22,493 (81.4%) |
| 6 to 11 Years | 151,732 (80.8%) | 149,421 (82.0%) |
| 12 to 14 Years | 81,667 (82.1%) | 76,576 (81.9%) |
| 15 Years | 26,895 (80.3%) | 25,404 (78.5%) |
| 16 and 17 Years | 53,801 (83.3%) | 52,209 (83.3%) |
| 18 to 24 Years | 181,817 (84.0%) | 173,486 (79.0%) |
| 25 to 34 Years | 377,819 (91.7%) | 358,531 (86.4%) |
| 35 to 44 Years | 328,507 (91.4%) | 312,924 (87.3%) |
| 45 to 54 Years | 290,058 (90.5%) | 289,815 (89.0%) |
| 55 to 64 Years | 271,680 (88.5%) | 285,967 (87.1%) |
| 65 to 74 Years | 186,277 (89.6%) | 217,845 (87.7%) |
| 75 Years and over | 110,252 (90.0%) | 164,187 (84.9%) |
| Total | 2,208,534 (88.0%) | 2,246,524 (85.4%) |
Income Below Poverty Among Married-Couple Families in Cook County
The poverty statistics for married-couple families in Cook County show that 4.8% or 39,334 of the total 820,634 families live below the poverty line. Families with 5 or more children have the highest poverty rate of 25.6%, comprising of 1,056 families. On the other hand, families with no children have the lowest poverty rate of 3.6%, which includes 16,647 families.
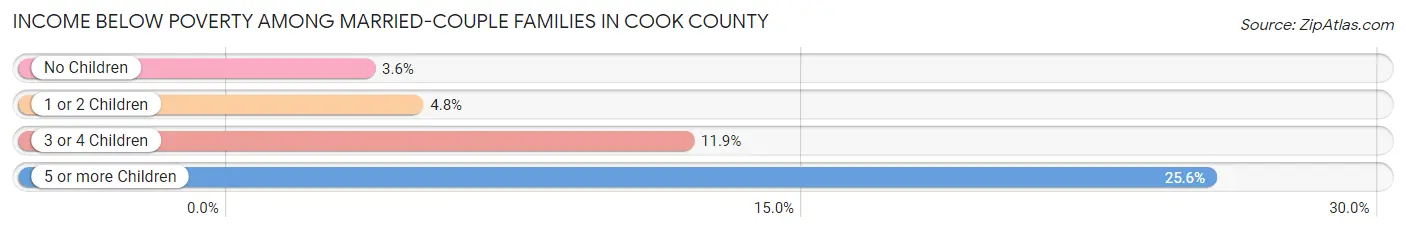
| Children | Above Poverty | Below Poverty |
| No Children | 448,033 (96.4%) | 16,647 (3.6%) |
| 1 or 2 Children | 272,867 (95.2%) | 13,879 (4.8%) |
| 3 or 4 Children | 57,324 (88.1%) | 7,752 (11.9%) |
| 5 or more Children | 3,076 (74.4%) | 1,056 (25.6%) |
| Total | 781,300 (95.2%) | 39,334 (4.8%) |
Income Below Poverty Among Single-Parent Households in Cook County
According to the poverty data in Cook County, 12.2% or 12,776 single-father households and 23.2% or 66,173 single-mother households are living below the poverty line. Among single-father households, those with 5 or more children have the highest poverty rate, with 281 households (42.1%) experiencing poverty. Likewise, among single-mother households, those with 5 or more children have the highest poverty rate, with 2,323 households (66.8%) falling below the poverty line.
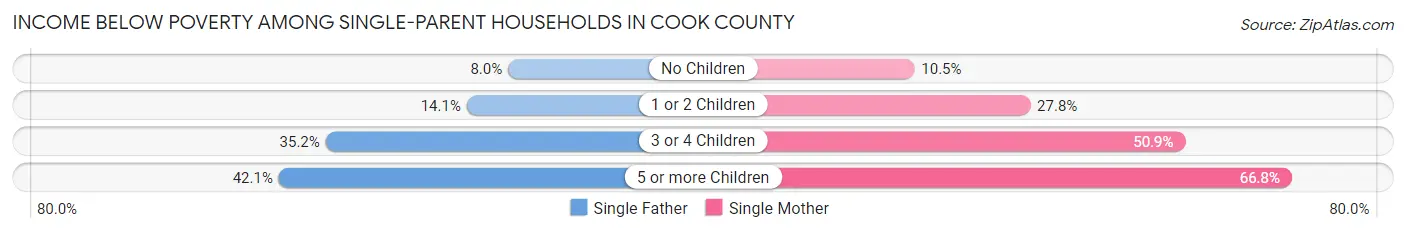
| Children | Single Father | Single Mother |
| No Children | 4,590 (8.0%) | 12,719 (10.5%) |
| 1 or 2 Children | 5,580 (14.1%) | 37,232 (27.8%) |
| 3 or 4 Children | 2,325 (35.1%) | 13,899 (50.9%) |
| 5 or more Children | 281 (42.1%) | 2,323 (66.8%) |
| Total | 12,776 (12.2%) | 66,173 (23.2%) |
Income Below Poverty Among Married-Couple vs Single-Parent Households in Cook County
The poverty data for Cook County shows that 39,334 of the married-couple family households (4.8%) and 78,949 of the single-parent households (20.2%) are living below the poverty level. Within the married-couple family households, those with 5 or more children have the highest poverty rate, with 1,056 households (25.6%) falling below the poverty line. Among the single-parent households, those with 5 or more children have the highest poverty rate, with 2,604 household (62.8%) living below poverty.
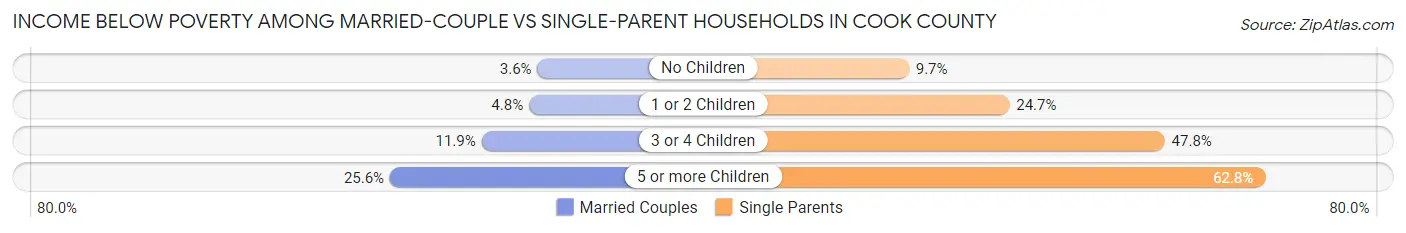
| Children | Married-Couple Families | Single-Parent Households |
| No Children | 16,647 (3.6%) | 17,309 (9.7%) |
| 1 or 2 Children | 13,879 (4.8%) | 42,812 (24.7%) |
| 3 or 4 Children | 7,752 (11.9%) | 16,224 (47.8%) |
| 5 or more Children | 1,056 (25.6%) | 2,604 (62.8%) |
| Total | 39,334 (4.8%) | 78,949 (20.2%) |
Race in Cook County
The most populous races in Cook County are White / Caucasian (2,580,789 | 49.4%), Hispanic or Latino (1,352,482 | 25.9%), and Black / African American (1,189,365 | 22.8%).
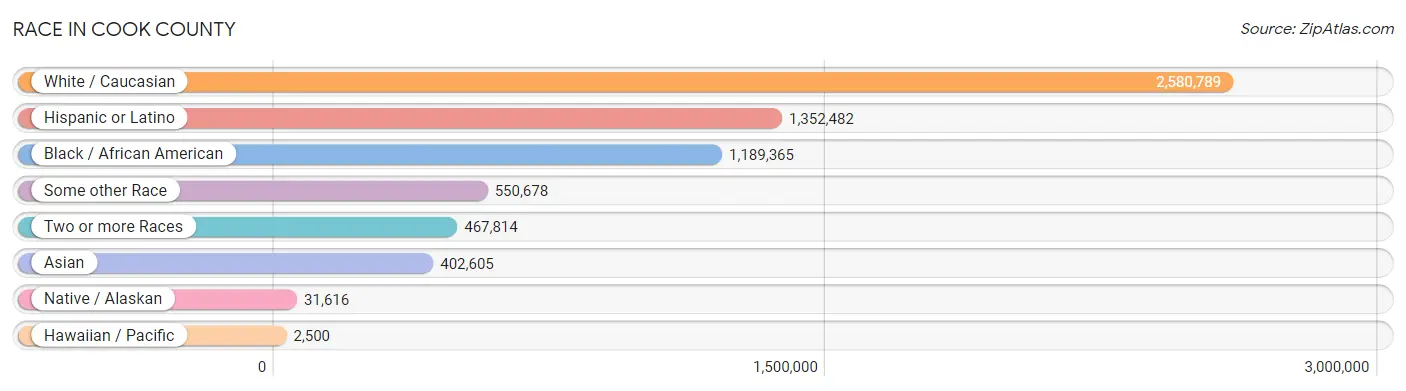
| Race | # Population | % Population |
| Asian | 402,605 | 7.7% |
| Black / African American | 1,189,365 | 22.8% |
| Hawaiian / Pacific | 2,500 | 0.1% |
| Hispanic or Latino | 1,352,482 | 25.9% |
| Native / Alaskan | 31,616 | 0.6% |
| White / Caucasian | 2,580,789 | 49.4% |
| Two or more Races | 467,814 | 8.9% |
| Some other Race | 550,678 | 10.5% |
| Total | 5,225,367 | 100.0% |
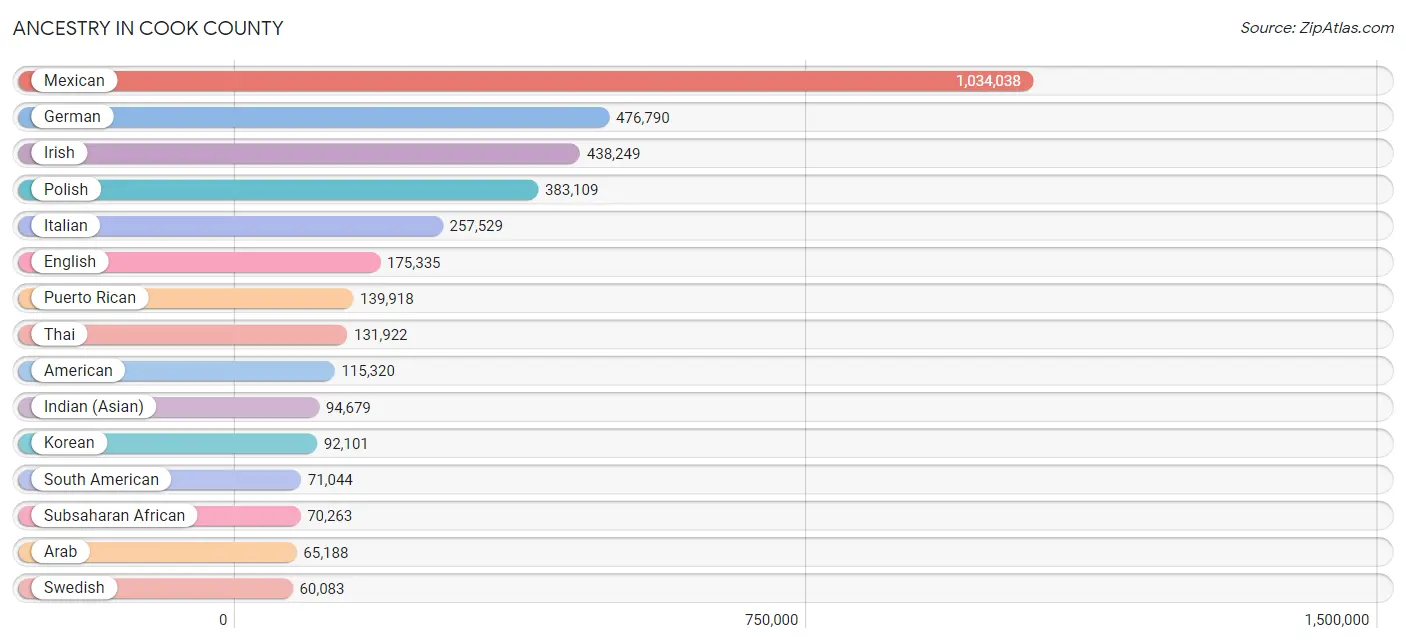
Ancestry in Cook County
The most populous ancestries reported in Cook County are Mexican (1,034,038 | 19.8%), German (476,790 | 9.1%), Irish (438,249 | 8.4%), Polish (383,109 | 7.3%), and Italian (257,529 | 4.9%), together accounting for 49.6% of all Cook County residents.
| Ancestry | # Population | % Population |
| Afghan | 1,101 | 0.0% |
| African | 30,347 | 0.6% |
| Alaska Native | 41 | 0.0% |
| Alaskan Athabascan | 7 | 0.0% |
| Albanian | 7,485 | 0.1% |
| Aleut | 24 | 0.0% |
| Alsatian | 159 | 0.0% |
| American | 115,320 | 2.2% |
| Apache | 1,159 | 0.0% |
| Arab | 65,188 | 1.3% |
| Argentinean | 3,656 | 0.1% |
| Armenian | 5,001 | 0.1% |
| Assyrian / Chaldean / Syriac | 13,053 | 0.3% |
| Australian | 1,818 | 0.0% |
| Austrian | 14,533 | 0.3% |
| Bahamian | 306 | 0.0% |
| Bangladeshi | 327 | 0.0% |
| Barbadian | 396 | 0.0% |
| Basque | 419 | 0.0% |
| Belgian | 5,637 | 0.1% |
| Belizean | 4,324 | 0.1% |
| Bermudan | 131 | 0.0% |
| Bhutanese | 20,747 | 0.4% |
| Blackfeet | 1,100 | 0.0% |
| Bolivian | 1,877 | 0.0% |
| Brazilian | 4,703 | 0.1% |
| British | 15,279 | 0.3% |
| British West Indian | 177 | 0.0% |
| Bulgarian | 12,053 | 0.2% |
| Burmese | 43,109 | 0.8% |
| Cajun | 145 | 0.0% |
| Cambodian | 5,004 | 0.1% |
| Canadian | 5,024 | 0.1% |
| Cape Verdean | 176 | 0.0% |
| Carpatho Rusyn | 51 | 0.0% |
| Celtic | 346 | 0.0% |
| Central American | 53,970 | 1.0% |
| Central American Indian | 7,329 | 0.1% |
| Cherokee | 7,842 | 0.2% |
| Cheyenne | 28 | 0.0% |
| Chickasaw | 209 | 0.0% |
| Chilean | 2,521 | 0.1% |
| Chinese | 15 | 0.0% |
| Chippewa | 1,645 | 0.0% |
| Choctaw | 1,260 | 0.0% |
| Colombian | 18,355 | 0.4% |
| Comanche | 47 | 0.0% |
| Costa Rican | 1,364 | 0.0% |
| Cree | 174 | 0.0% |
| Creek | 352 | 0.0% |
| Croatian | 17,394 | 0.3% |
| Crow | 52 | 0.0% |
| Cuban | 16,571 | 0.3% |
| Cypriot | 157 | 0.0% |
| Czech | 34,628 | 0.7% |
| Czechoslovakian | 4,635 | 0.1% |
| Danish | 12,239 | 0.2% |
| Delaware | 69 | 0.0% |
| Dominican | 5,271 | 0.1% |
| Dutch | 36,415 | 0.7% |
| Dutch West Indian | 21 | 0.0% |
| Eastern European | 21,086 | 0.4% |
| Ecuadorian | 26,550 | 0.5% |
| Egyptian | 3,839 | 0.1% |
| English | 175,335 | 3.4% |
| Estonian | 453 | 0.0% |
| Ethiopian | 5,049 | 0.1% |
| European | 50,204 | 1.0% |
| Fijian | 86 | 0.0% |
| Filipino | 4,230 | 0.1% |
| Finnish | 5,506 | 0.1% |
| French | 49,083 | 0.9% |
| French American Indian | 161 | 0.0% |
| French Canadian | 8,748 | 0.2% |
| German | 476,790 | 9.1% |
| German Russian | 128 | 0.0% |
| Ghanaian | 3,681 | 0.1% |
| Greek | 46,218 | 0.9% |
| Guamanian / Chamorro | 510 | 0.0% |
| Guatemalan | 28,091 | 0.5% |
| Guyanese | 930 | 0.0% |
| Haitian | 7,571 | 0.1% |
| Hmong | 67 | 0.0% |
| Honduran | 9,539 | 0.2% |
| Hopi | 31 | 0.0% |
| Houma | 9 | 0.0% |
| Hungarian | 16,362 | 0.3% |
| Icelander | 335 | 0.0% |
| Indian (Asian) | 94,679 | 1.8% |
| Indonesian | 2,256 | 0.0% |
| Inupiat | 167 | 0.0% |
| Iranian | 6,553 | 0.1% |
| Iraqi | 5,532 | 0.1% |
| Irish | 438,249 | 8.4% |
| Iroquois | 775 | 0.0% |
| Israeli | 2,320 | 0.0% |
| Italian | 257,529 | 4.9% |
| Jamaican | 9,649 | 0.2% |
| Japanese | 2,953 | 0.1% |
| Jordanian | 7,574 | 0.1% |
| Kenyan | 745 | 0.0% |
| Kiowa | 92 | 0.0% |
| Korean | 92,101 | 1.8% |
| Laotian | 1,038 | 0.0% |
| Latvian | 2,666 | 0.1% |
| Lebanese | 5,731 | 0.1% |
| Liberian | 502 | 0.0% |
| Lithuanian | 32,465 | 0.6% |
| Lumbee | 118 | 0.0% |
| Luxembourger | 1,959 | 0.0% |
| Macedonian | 4,462 | 0.1% |
| Malaysian | 1,325 | 0.0% |
| Maltese | 362 | 0.0% |
| Menominee | 368 | 0.0% |
| Mexican | 1,034,038 | 19.8% |
| Mexican American Indian | 22,099 | 0.4% |
| Mongolian | 966 | 0.0% |
| Moroccan | 3,445 | 0.1% |
| Native Hawaiian | 2,726 | 0.1% |
| Navajo | 1,154 | 0.0% |
| New Zealander | 140 | 0.0% |
| Nicaraguan | 2,290 | 0.0% |
| Nigerian | 20,266 | 0.4% |
| Northern European | 4,483 | 0.1% |
| Norwegian | 37,632 | 0.7% |
| Okinawan | 260 | 0.0% |
| Osage | 82 | 0.0% |
| Ottawa | 47 | 0.0% |
| Paiute | 73 | 0.0% |
| Pakistani | 8,295 | 0.2% |
| Palestinian | 15,450 | 0.3% |
| Panamanian | 1,488 | 0.0% |
| Paraguayan | 233 | 0.0% |
| Pennsylvania German | 214 | 0.0% |
| Peruvian | 9,005 | 0.2% |
| Pima | 27 | 0.0% |
| Polish | 383,109 | 7.3% |
| Portuguese | 4,425 | 0.1% |
| Potawatomi | 388 | 0.0% |
| Pueblo | 117 | 0.0% |
| Puerto Rican | 139,918 | 2.7% |
| Puget Sound Salish | 54 | 0.0% |
| Romanian | 21,004 | 0.4% |
| Russian | 55,017 | 1.1% |
| Salvadoran | 10,827 | 0.2% |
| Samoan | 965 | 0.0% |
| Scandinavian | 8,065 | 0.2% |
| Scotch-Irish | 14,306 | 0.3% |
| Scottish | 37,212 | 0.7% |
| Seminole | 129 | 0.0% |
| Senegalese | 667 | 0.0% |
| Serbian | 15,877 | 0.3% |
| Shoshone | 55 | 0.0% |
| Sierra Leonean | 198 | 0.0% |
| Sioux | 924 | 0.0% |
| Slavic | 1,724 | 0.0% |
| Slovak | 12,478 | 0.2% |
| Slovene | 3,619 | 0.1% |
| Somali | 1,074 | 0.0% |
| South African | 945 | 0.0% |
| South American | 71,044 | 1.4% |
| South American Indian | 1,198 | 0.0% |
| Soviet Union | 97 | 0.0% |
| Spaniard | 9,071 | 0.2% |
| Spanish | 5,488 | 0.1% |
| Spanish American | 115 | 0.0% |
| Spanish American Indian | 27 | 0.0% |
| Sri Lankan | 20,568 | 0.4% |
| Subsaharan African | 70,263 | 1.3% |
| Sudanese | 1,015 | 0.0% |
| Swedish | 60,083 | 1.1% |
| Swiss | 8,283 | 0.2% |
| Syrian | 4,111 | 0.1% |
| Taiwanese | 182 | 0.0% |
| Thai | 131,922 | 2.5% |
| Tlingit-Haida | 22 | 0.0% |
| Tohono O'Odham | 11 | 0.0% |
| Tongan | 114 | 0.0% |
| Trinidadian and Tobagonian | 915 | 0.0% |
| Turkish | 4,730 | 0.1% |
| U.S. Virgin Islander | 101 | 0.0% |
| Ugandan | 376 | 0.0% |
| Ukrainian | 32,662 | 0.6% |
| Uruguayan | 489 | 0.0% |
| Ute | 20 | 0.0% |
| Venezuelan | 7,742 | 0.2% |
| Vietnamese | 1,428 | 0.0% |
| Welsh | 12,252 | 0.2% |
| West Indian | 2,556 | 0.1% |
| Yakama | 18 | 0.0% |
| Yaqui | 198 | 0.0% |
| Yugoslavian | 10,522 | 0.2% |
| Yuman | 33 | 0.0% |
| Zimbabwean | 187 | 0.0% | View All 194 Rows |
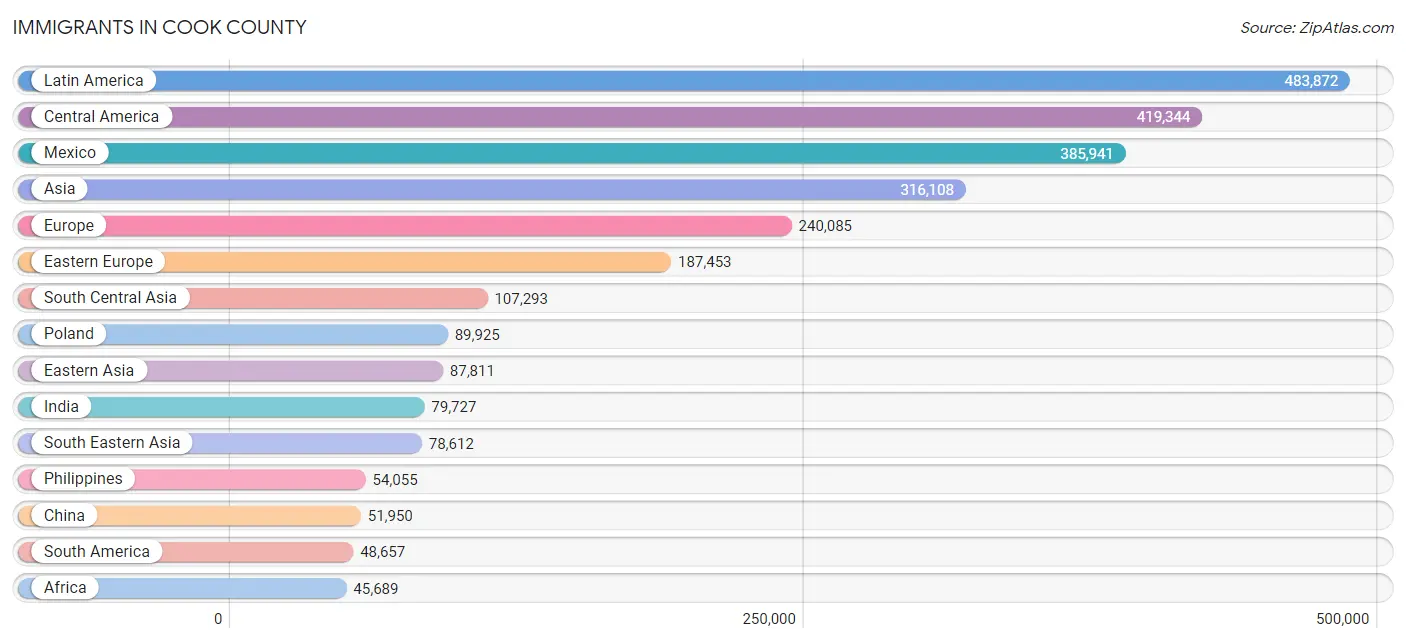
Immigrants in Cook County
The most numerous immigrant groups reported in Cook County came from Latin America (483,872 | 9.3%), Central America (419,344 | 8.0%), Mexico (385,941 | 7.4%), Asia (316,108 | 6.0%), and Europe (240,085 | 4.6%), together accounting for 35.3% of all Cook County residents.
| Immigration Origin | # Population | % Population |
| Afghanistan | 859 | 0.0% |
| Africa | 45,689 | 0.9% |
| Albania | 3,033 | 0.1% |
| Argentina | 2,332 | 0.0% |
| Armenia | 413 | 0.0% |
| Asia | 316,108 | 6.0% |
| Australia | 1,568 | 0.0% |
| Austria | 1,475 | 0.0% |
| Bahamas | 261 | 0.0% |
| Bangladesh | 1,256 | 0.0% |
| Barbados | 129 | 0.0% |
| Belarus | 4,478 | 0.1% |
| Belgium | 359 | 0.0% |
| Belize | 2,697 | 0.1% |
| Bolivia | 1,189 | 0.0% |
| Bosnia and Herzegovina | 8,212 | 0.2% |
| Brazil | 5,521 | 0.1% |
| Bulgaria | 10,669 | 0.2% |
| Cabo Verde | 12 | 0.0% |
| Cambodia | 1,707 | 0.0% |
| Cameroon | 998 | 0.0% |
| Canada | 10,118 | 0.2% |
| Caribbean | 15,871 | 0.3% |
| Central America | 419,344 | 8.0% |
| Chile | 1,427 | 0.0% |
| China | 51,950 | 1.0% |
| Colombia | 10,010 | 0.2% |
| Congo | 272 | 0.0% |
| Costa Rica | 790 | 0.0% |
| Croatia | 2,974 | 0.1% |
| Cuba | 4,268 | 0.1% |
| Czechoslovakia | 2,287 | 0.0% |
| Denmark | 457 | 0.0% |
| Dominica | 35 | 0.0% |
| Dominican Republic | 2,055 | 0.0% |
| Eastern Africa | 8,840 | 0.2% |
| Eastern Asia | 87,811 | 1.7% |
| Eastern Europe | 187,453 | 3.6% |
| Ecuador | 14,218 | 0.3% |
| Egypt | 2,762 | 0.1% |
| El Salvador | 6,248 | 0.1% |
| England | 4,007 | 0.1% |
| Eritrea | 645 | 0.0% |
| Ethiopia | 3,413 | 0.1% |
| Europe | 240,085 | 4.6% |
| Fiji | 168 | 0.0% |
| France | 3,932 | 0.1% |
| Germany | 8,700 | 0.2% |
| Ghana | 4,206 | 0.1% |
| Greece | 7,615 | 0.2% |
| Grenada | 84 | 0.0% |
| Guatemala | 15,433 | 0.3% |
| Guyana | 723 | 0.0% |
| Haiti | 3,479 | 0.1% |
| Honduras | 6,063 | 0.1% |
| Hong Kong | 3,683 | 0.1% |
| Hungary | 758 | 0.0% |
| India | 79,727 | 1.5% |
| Indonesia | 710 | 0.0% |
| Iran | 3,912 | 0.1% |
| Iraq | 10,131 | 0.2% |
| Ireland | 4,604 | 0.1% |
| Israel | 3,260 | 0.1% |
| Italy | 9,677 | 0.2% |
| Jamaica | 4,946 | 0.1% |
| Japan | 7,027 | 0.1% |
| Jordan | 6,941 | 0.1% |
| Kazakhstan | 818 | 0.0% |
| Kenya | 936 | 0.0% |
| Korea | 25,479 | 0.5% |
| Kuwait | 1,016 | 0.0% |
| Laos | 609 | 0.0% |
| Latin America | 483,872 | 9.3% |
| Latvia | 797 | 0.0% |
| Lebanon | 1,688 | 0.0% |
| Liberia | 277 | 0.0% |
| Lithuania | 4,551 | 0.1% |
| Malaysia | 2,165 | 0.0% |
| Mexico | 385,941 | 7.4% |
| Middle Africa | 2,637 | 0.1% |
| Moldova | 2,311 | 0.0% |
| Morocco | 2,482 | 0.1% |
| Nepal | 1,480 | 0.0% |
| Netherlands | 1,045 | 0.0% |
| Nicaragua | 1,206 | 0.0% |
| Nigeria | 14,704 | 0.3% |
| North Macedonia | 2,750 | 0.1% |
| Northern Africa | 8,182 | 0.2% |
| Northern Europe | 16,022 | 0.3% |
| Norway | 313 | 0.0% |
| Oceania | 2,175 | 0.0% |
| Pakistan | 15,343 | 0.3% |
| Panama | 864 | 0.0% |
| Peru | 5,722 | 0.1% |
| Philippines | 54,055 | 1.0% |
| Poland | 89,925 | 1.7% |
| Portugal | 323 | 0.0% |
| Romania | 11,141 | 0.2% |
| Russia | 9,863 | 0.2% |
| Saudi Arabia | 1,785 | 0.0% |
| Scotland | 560 | 0.0% |
| Senegal | 489 | 0.0% |
| Serbia | 6,542 | 0.1% |
| Sierra Leone | 330 | 0.0% |
| Singapore | 673 | 0.0% |
| Somalia | 793 | 0.0% |
| South Africa | 1,534 | 0.0% |
| South America | 48,657 | 0.9% |
| South Central Asia | 107,293 | 2.1% |
| South Eastern Asia | 78,612 | 1.5% |
| Southern Europe | 19,372 | 0.4% |
| Spain | 1,736 | 0.0% |
| Sri Lanka | 651 | 0.0% |
| St. Vincent and the Grenadines | 16 | 0.0% |
| Sudan | 512 | 0.0% |
| Sweden | 664 | 0.0% |
| Switzerland | 606 | 0.0% |
| Syria | 4,907 | 0.1% |
| Taiwan | 3,830 | 0.1% |
| Thailand | 4,547 | 0.1% |
| Trinidad and Tobago | 479 | 0.0% |
| Turkey | 3,485 | 0.1% |
| Uganda | 439 | 0.0% |
| Ukraine | 20,480 | 0.4% |
| Uruguay | 289 | 0.0% |
| Uzbekistan | 1,039 | 0.0% |
| Venezuela | 6,940 | 0.1% |
| Vietnam | 12,934 | 0.3% |
| West Indies | 84 | 0.0% |
| Western Africa | 22,604 | 0.4% |
| Western Asia | 36,669 | 0.7% |
| Western Europe | 16,141 | 0.3% |
| Yemen | 1,603 | 0.0% |
| Zaire | 1,103 | 0.0% |
| Zimbabwe | 257 | 0.0% | View All 135 Rows |
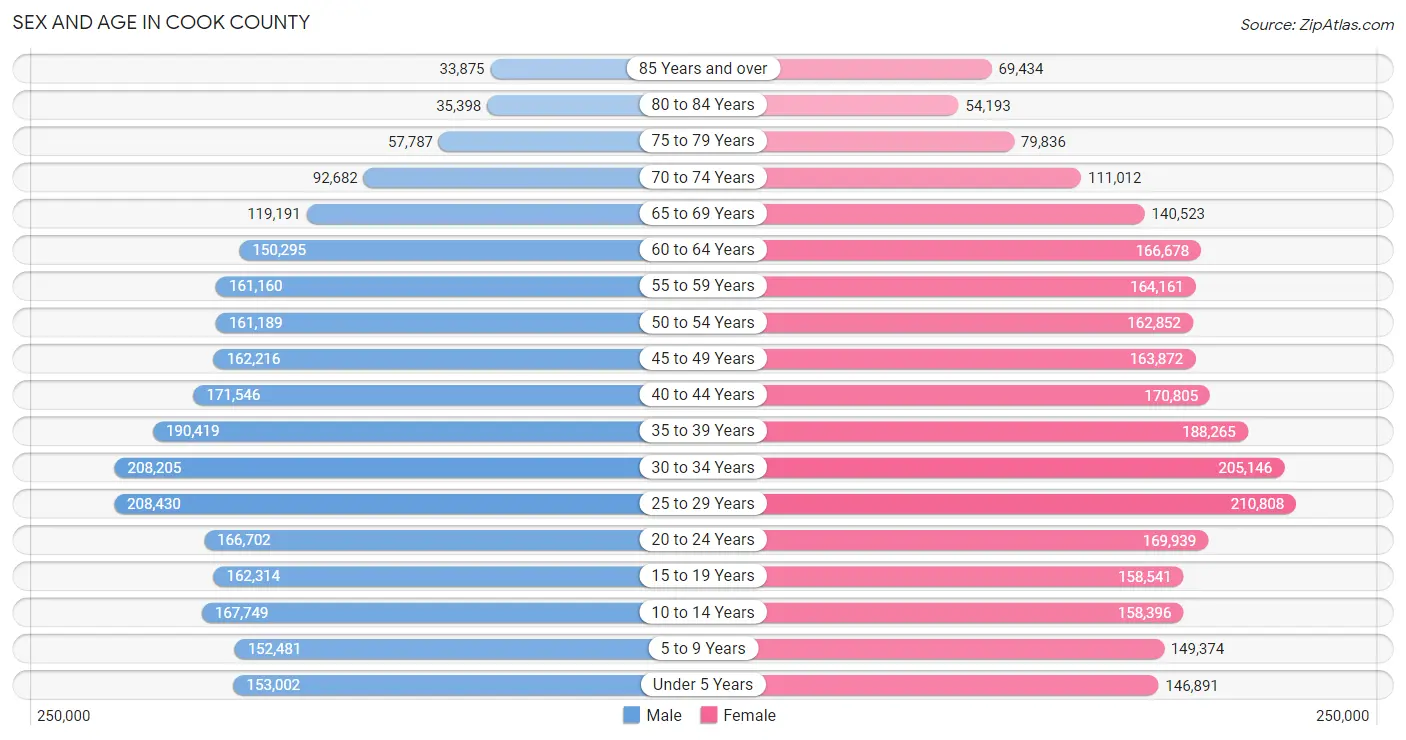
Sex and Age in Cook County
Sex and Age in Cook County
The most populous age groups in Cook County are 25 to 29 Years (208,430 | 8.2%) for men and 25 to 29 Years (210,808 | 7.9%) for women.
| Age Bracket | Male | Female |
| Under 5 Years | 153,002 (6.0%) | 146,891 (5.5%) |
| 5 to 9 Years | 152,481 (6.0%) | 149,374 (5.6%) |
| 10 to 14 Years | 167,749 (6.6%) | 158,396 (5.9%) |
| 15 to 19 Years | 162,314 (6.4%) | 158,541 (5.9%) |
| 20 to 24 Years | 166,702 (6.5%) | 169,939 (6.4%) |
| 25 to 29 Years | 208,430 (8.2%) | 210,808 (7.9%) |
| 30 to 34 Years | 208,205 (8.2%) | 205,146 (7.7%) |
| 35 to 39 Years | 190,419 (7.4%) | 188,265 (7.0%) |
| 40 to 44 Years | 171,546 (6.7%) | 170,805 (6.4%) |
| 45 to 49 Years | 162,216 (6.4%) | 163,872 (6.1%) |
| 50 to 54 Years | 161,189 (6.3%) | 162,852 (6.1%) |
| 55 to 59 Years | 161,160 (6.3%) | 164,161 (6.1%) |
| 60 to 64 Years | 150,295 (5.9%) | 166,678 (6.2%) |
| 65 to 69 Years | 119,191 (4.7%) | 140,523 (5.3%) |
| 70 to 74 Years | 92,682 (3.6%) | 111,012 (4.2%) |
| 75 to 79 Years | 57,787 (2.3%) | 79,836 (3.0%) |
| 80 to 84 Years | 35,398 (1.4%) | 54,193 (2.0%) |
| 85 Years and over | 33,875 (1.3%) | 69,434 (2.6%) |
| Total | 2,554,641 (100.0%) | 2,670,726 (100.0%) |
Families and Households in Cook County
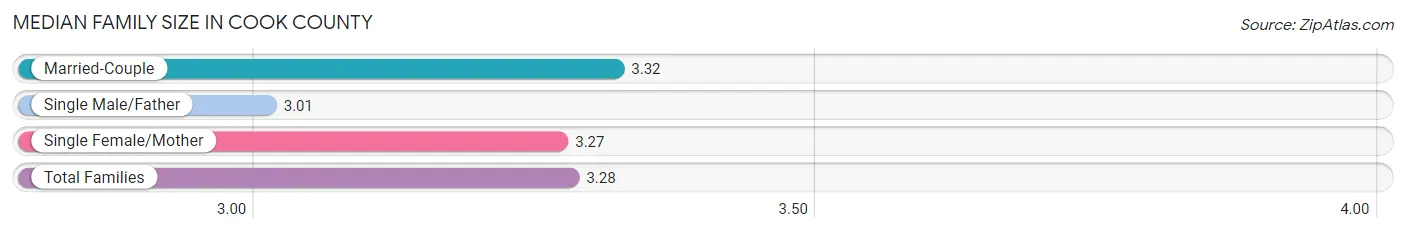
Median Family Size in Cook County
The median family size in Cook County is 3.28 persons per family, with married-couple families (820,634 | 67.8%) accounting for the largest median family size of 3.32 persons per family. On the other hand, single male/father families (104,442 | 8.6%) represent the smallest median family size with 3.01 persons per family.
| Family Type | # Families | Family Size |
| Married-Couple | 820,634 (67.8%) | 3.32 |
| Single Male/Father | 104,442 (8.6%) | 3.01 |
| Single Female/Mother | 285,594 (23.6%) | 3.27 |
| Total Families | 1,210,670 (100.0%) | 3.28 |
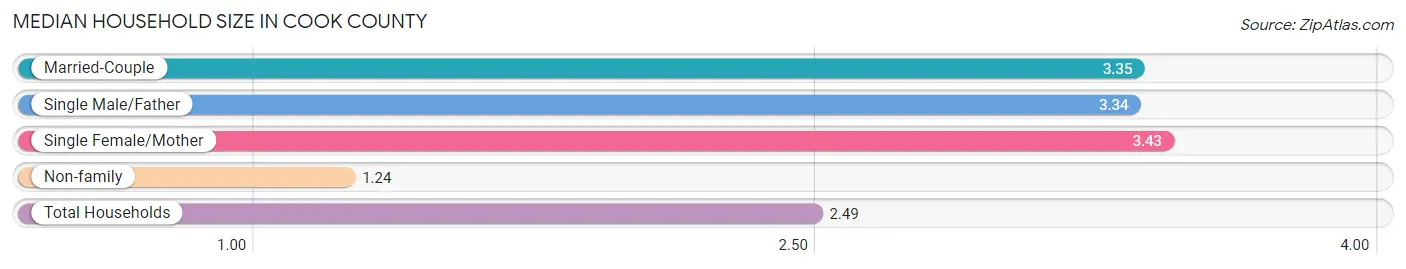
Median Household Size in Cook County
The median household size in Cook County is 2.49 persons per household, with single female/mother households (285,594 | 13.8%) accounting for the largest median household size of 3.43 persons per household. non-family households (855,578 | 41.4%) represent the smallest median household size with 1.24 persons per household.
| Household Type | # Households | Household Size |
| Married-Couple | 820,634 (39.7%) | 3.35 |
| Single Male/Father | 104,442 (5.1%) | 3.34 |
| Single Female/Mother | 285,594 (13.8%) | 3.43 |
| Non-family | 855,578 (41.4%) | 1.24 |
| Total Households | 2,066,248 (100.0%) | 2.49 |
Household Size by Marriage Status in Cook County
Out of a total of 2,066,248 households in Cook County, 1,210,670 (58.6%) are family households, while 855,578 (41.4%) are nonfamily households. The most numerous type of family households are 2-person households, comprising 487,338, and the most common type of nonfamily households are 1-person households, comprising 698,796.
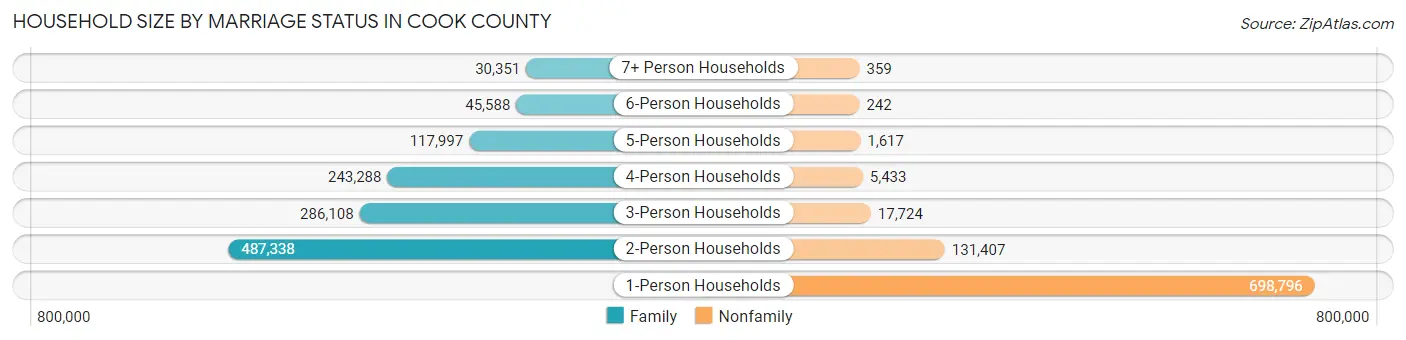
| Household Size | Family Households | Nonfamily Households |
| 1-Person Households | - | 698,796 (33.8%) |
| 2-Person Households | 487,338 (23.6%) | 131,407 (6.4%) |
| 3-Person Households | 286,108 (13.9%) | 17,724 (0.9%) |
| 4-Person Households | 243,288 (11.8%) | 5,433 (0.3%) |
| 5-Person Households | 117,997 (5.7%) | 1,617 (0.1%) |
| 6-Person Households | 45,588 (2.2%) | 242 (0.0%) |
| 7+ Person Households | 30,351 (1.5%) | 359 (0.0%) |
| Total | 1,210,670 (58.6%) | 855,578 (41.4%) |
Female Fertility in Cook County
Fertility by Age in Cook County
Average fertility rate in Cook County is 48.0 births per 1,000 women. Women in the age bracket of 20 to 34 years have the highest fertility rate with 70.0 births per 1,000 women. Women in the age bracket of 20 to 34 years acount for 65.5% of all women with births.
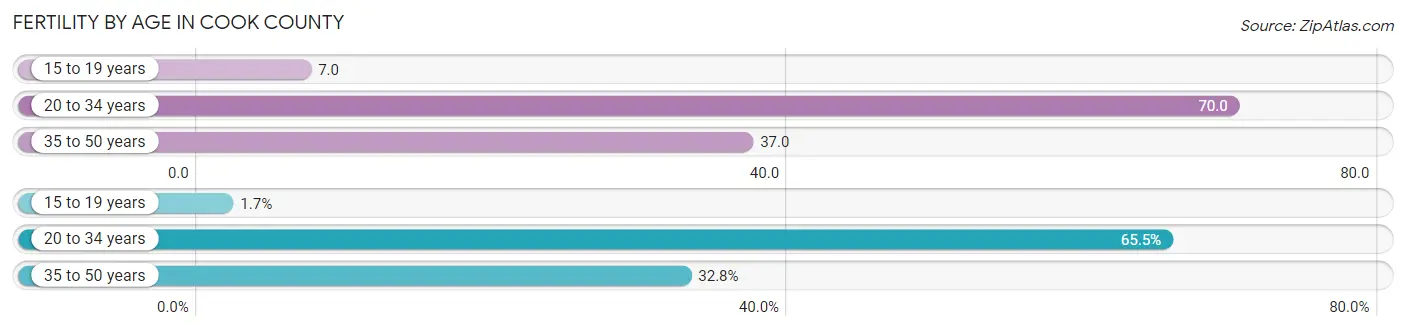
| Age Bracket | Women with Births | Births / 1,000 Women |
| 15 to 19 years | 1,069 (1.7%) | 7.0 |
| 20 to 34 years | 40,809 (65.5%) | 70.0 |
| 35 to 50 years | 20,442 (32.8%) | 37.0 |
| Total | 62,320 (100.0%) | 48.0 |
Fertility by Age by Marriage Status in Cook County
67.7% of women with births (62,320) in Cook County are married. The highest percentage of unmarried women with births falls into 15 to 19 years age bracket with 96.2% of them unmarried at the time of birth, while the lowest percentage of unmarried women with births belong to 35 to 50 years age bracket with 19.1% of them unmarried.
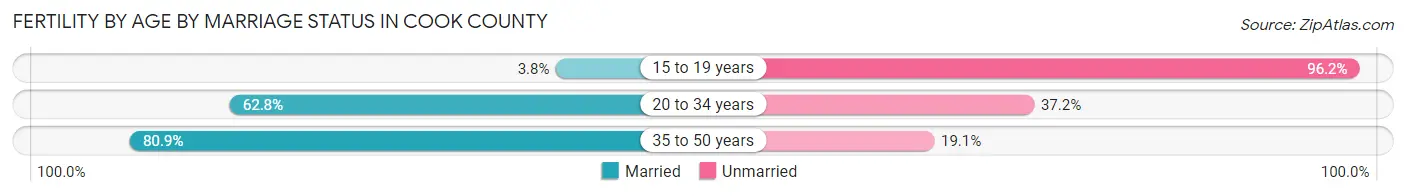
| Age Bracket | Married | Unmarried |
| 15 to 19 years | 41 (3.8%) | 1,028 (96.2%) |
| 20 to 34 years | 25,628 (62.8%) | 15,181 (37.2%) |
| 35 to 50 years | 16,538 (80.9%) | 3,904 (19.1%) |
| Total | 42,191 (67.7%) | 20,129 (32.3%) |
Fertility by Education in Cook County
Average fertility rate in Cook County is 48.0 births per 1,000 women. Women with the education attainment of graduate degree have the highest fertility rate of 63.0 births per 1,000 women, while women with the education attainment of less than high school have the lowest fertility at 30.0 births per 1,000 women. Women with the education attainment of bachelor's degree represent 24.9% of all women with births.
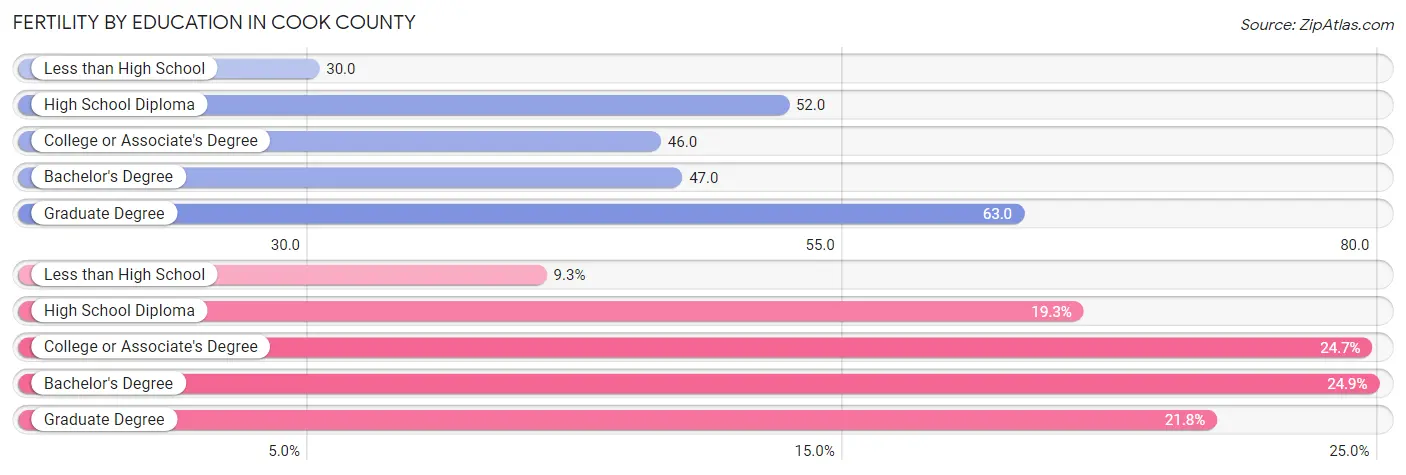
| Educational Attainment | Women with Births | Births / 1,000 Women |
| Less than High School | 5,772 (9.3%) | 30.0 |
| High School Diploma | 12,040 (19.3%) | 52.0 |
| College or Associate's Degree | 15,413 (24.7%) | 46.0 |
| Bachelor's Degree | 15,495 (24.9%) | 47.0 |
| Graduate Degree | 13,600 (21.8%) | 63.0 |
| Total | 62,320 (100.0%) | 48.0 |
Fertility by Education by Marriage Status in Cook County
32.3% of women with births in Cook County are unmarried. Women with the educational attainment of graduate degree are most likely to be married with 92.2% of them married at childbirth, while women with the educational attainment of less than high school are least likely to be married with 53.4% of them unmarried at childbirth.
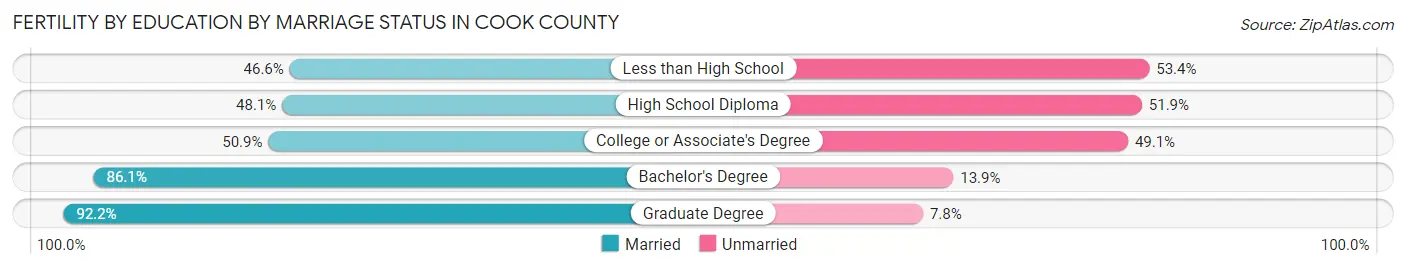
| Educational Attainment | Married | Unmarried |
| Less than High School | 2,690 (46.6%) | 3,082 (53.4%) |
| High School Diploma | 5,791 (48.1%) | 6,249 (51.9%) |
| College or Associate's Degree | 7,845 (50.9%) | 7,568 (49.1%) |
| Bachelor's Degree | 13,341 (86.1%) | 2,154 (13.9%) |
| Graduate Degree | 12,539 (92.2%) | 1,061 (7.8%) |
| Total | 42,191 (67.7%) | 20,129 (32.3%) |
Employment Characteristics in Cook County
Employment by Class of Employer in Cook County
Among the 2,547,260 employed individuals in Cook County, private company employees (1,744,905 | 68.5%), not-for-profit organizations (270,376 | 10.6%), and local government employees (183,978 | 7.2%) make up the most common classes of employment.
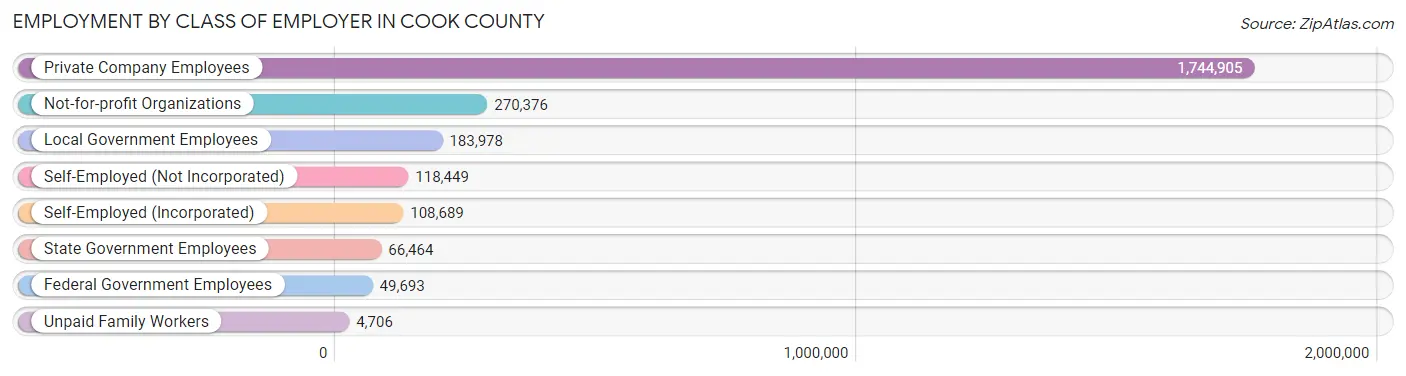
| Employer Class | # Employees | % Employees |
| Private Company Employees | 1,744,905 | 68.5% |
| Self-Employed (Incorporated) | 108,689 | 4.3% |
| Self-Employed (Not Incorporated) | 118,449 | 4.6% |
| Not-for-profit Organizations | 270,376 | 10.6% |
| Local Government Employees | 183,978 | 7.2% |
| State Government Employees | 66,464 | 2.6% |
| Federal Government Employees | 49,693 | 1.9% |
| Unpaid Family Workers | 4,706 | 0.2% |
| Total | 2,547,260 | 100.0% |
Employment Status by Age in Cook County
According to the labor force statistics for Cook County, out of the total population over 16 years of age (4,231,520), 66.2% or 2,801,266 individuals are in the labor force, with 7.1% or 198,890 of them unemployed. The age group with the highest labor force participation rate is 30 to 34 years, with 86.6% or 357,962 individuals in the labor force. Within the labor force, the 16 to 19 years age range has the highest percentage of unemployed individuals, with 22.1% or 18,027 of them being unemployed.
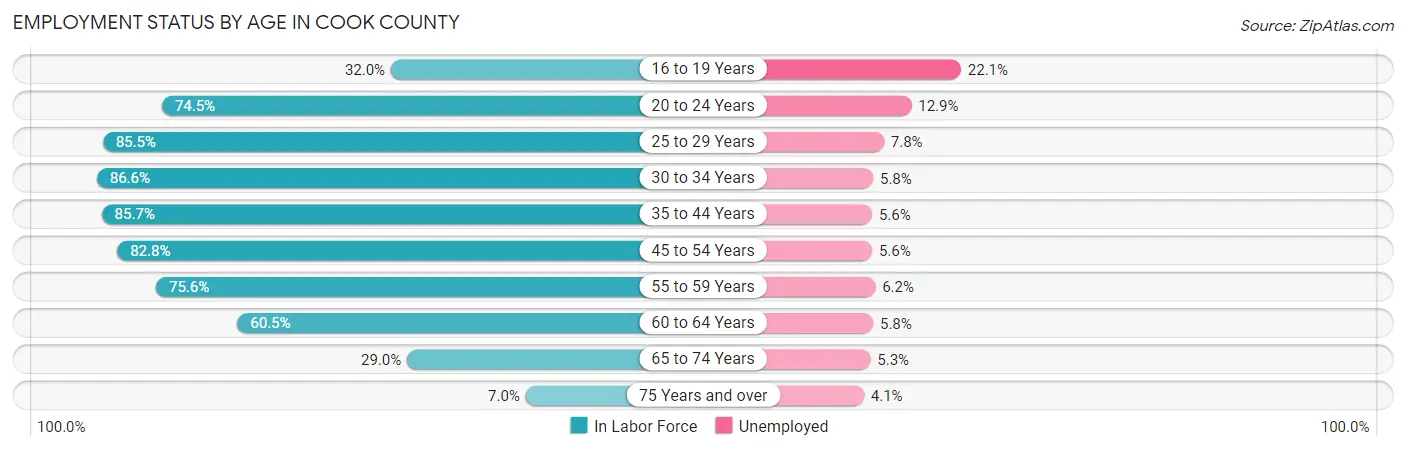
| Age Bracket | In Labor Force | Unemployed |
| 16 to 19 Years | 81,568 (32.0%) | 18,027 (22.1%) |
| 20 to 24 Years | 250,798 (74.5%) | 32,353 (12.9%) |
| 25 to 29 Years | 358,448 (85.5%) | 27,959 (7.8%) |
| 30 to 34 Years | 357,962 (86.6%) | 20,762 (5.8%) |
| 35 to 44 Years | 617,927 (85.7%) | 34,604 (5.6%) |
| 45 to 54 Years | 538,307 (82.8%) | 30,145 (5.6%) |
| 55 to 59 Years | 245,943 (75.6%) | 15,248 (6.2%) |
| 60 to 64 Years | 191,769 (60.5%) | 11,123 (5.8%) |
| 65 to 74 Years | 134,388 (29.0%) | 7,123 (5.3%) |
| 75 Years and over | 23,137 (7.0%) | 949 (4.1%) |
| Total | 2,801,266 (66.2%) | 198,890 (7.1%) |
Employment Status by Educational Attainment in Cook County
According to labor force statistics for Cook County, 81.2% of individuals (2,310,990) out of the total population between 25 and 64 years of age (2,846,047) are in the labor force, with 6.1% or 140,970 of them being unemployed. The group with the highest labor force participation rate are those with the educational attainment of bachelor's degree or higher, with 89.2% or 1,117,820 individuals in the labor force. Within the labor force, individuals with high school diploma education have the highest percentage of unemployment, with 9.7% or 42,039 of them being unemployed.
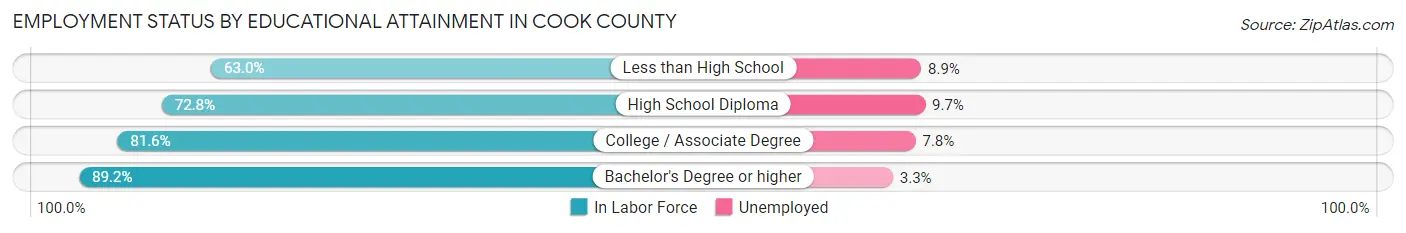
| Educational Attainment | In Labor Force | Unemployed |
| Less than High School | 186,033 (63.0%) | 26,281 (8.9%) |
| High School Diploma | 433,389 (72.8%) | 57,745 (9.7%) |
| College / Associate Degree | 573,062 (81.6%) | 54,778 (7.8%) |
| Bachelor's Degree or higher | 1,117,820 (89.2%) | 41,354 (3.3%) |
| Total | 2,310,990 (81.2%) | 173,609 (6.1%) |
Employment Occupations by Sex in Cook County
Management, Business, Science and Arts Occupations
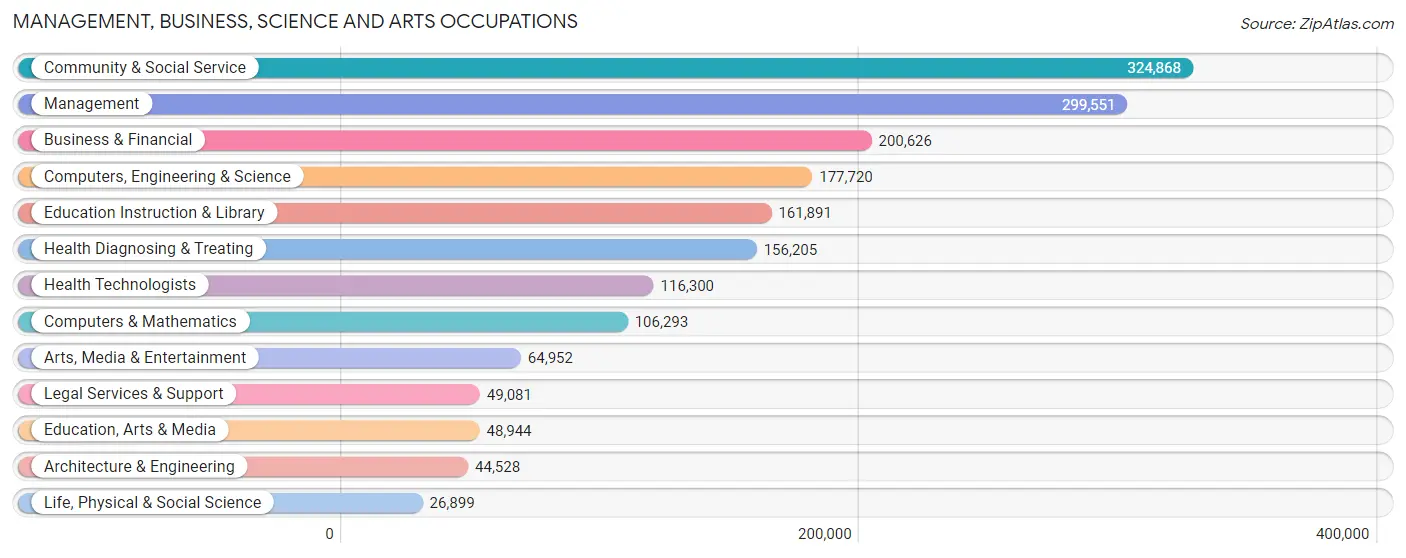
The most common Management, Business, Science and Arts occupations in Cook County are Community & Social Service (324,868 | 12.5%), Management (299,551 | 11.5%), Business & Financial (200,626 | 7.7%), Computers, Engineering & Science (177,720 | 6.8%), and Education Instruction & Library (161,891 | 6.2%).
Management, Business, Science and Arts Occupations by Sex
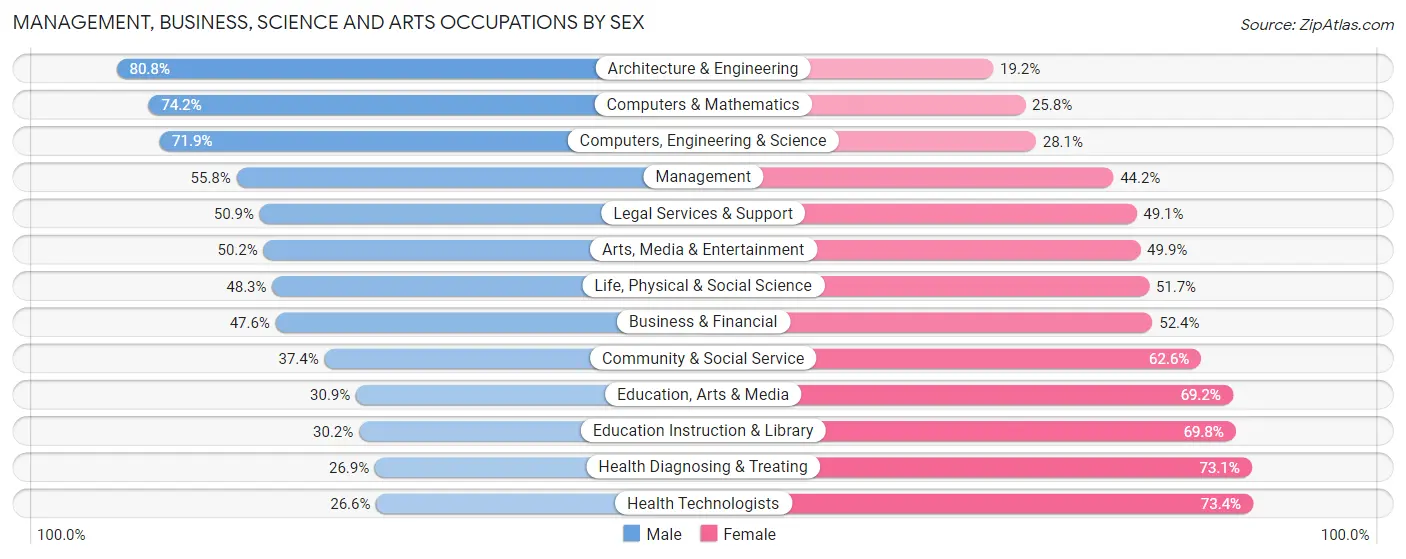
Within the Management, Business, Science and Arts occupations in Cook County, the most male-oriented occupations are Architecture & Engineering (80.8%), Computers & Mathematics (74.2%), and Computers, Engineering & Science (71.9%), while the most female-oriented occupations are Health Technologists (73.4%), Health Diagnosing & Treating (73.1%), and Education Instruction & Library (69.8%).
| Occupation | Male | Female |
| Management | 167,070 (55.8%) | 132,481 (44.2%) |
| Business & Financial | 95,540 (47.6%) | 105,086 (52.4%) |
| Computers, Engineering & Science | 127,818 (71.9%) | 49,902 (28.1%) |
| Computers & Mathematics | 78,836 (74.2%) | 27,457 (25.8%) |
| Architecture & Engineering | 35,986 (80.8%) | 8,542 (19.2%) |
| Life, Physical & Social Science | 12,996 (48.3%) | 13,903 (51.7%) |
| Community & Social Service | 121,595 (37.4%) | 203,273 (62.6%) |
| Education, Arts & Media | 15,101 (30.8%) | 33,843 (69.2%) |
| Legal Services & Support | 25,003 (50.9%) | 24,078 (49.1%) |
| Education Instruction & Library | 48,918 (30.2%) | 112,973 (69.8%) |
| Arts, Media & Entertainment | 32,573 (50.1%) | 32,379 (49.8%) |
| Health Diagnosing & Treating | 42,022 (26.9%) | 114,183 (73.1%) |
| Health Technologists | 30,969 (26.6%) | 85,331 (73.4%) |
| Total (Category) | 554,045 (47.8%) | 604,925 (52.2%) |
| Total (Overall) | 1,356,099 (52.1%) | 1,244,520 (47.8%) |
Services Occupations
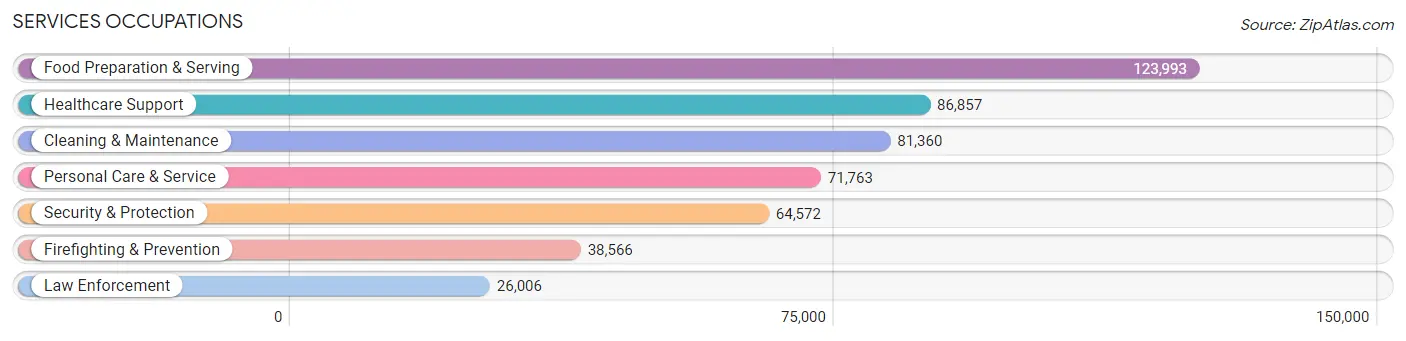
The most common Services occupations in Cook County are Food Preparation & Serving (123,993 | 4.8%), Healthcare Support (86,857 | 3.3%), Cleaning & Maintenance (81,360 | 3.1%), Personal Care & Service (71,763 | 2.8%), and Security & Protection (64,572 | 2.5%).
Services Occupations by Sex
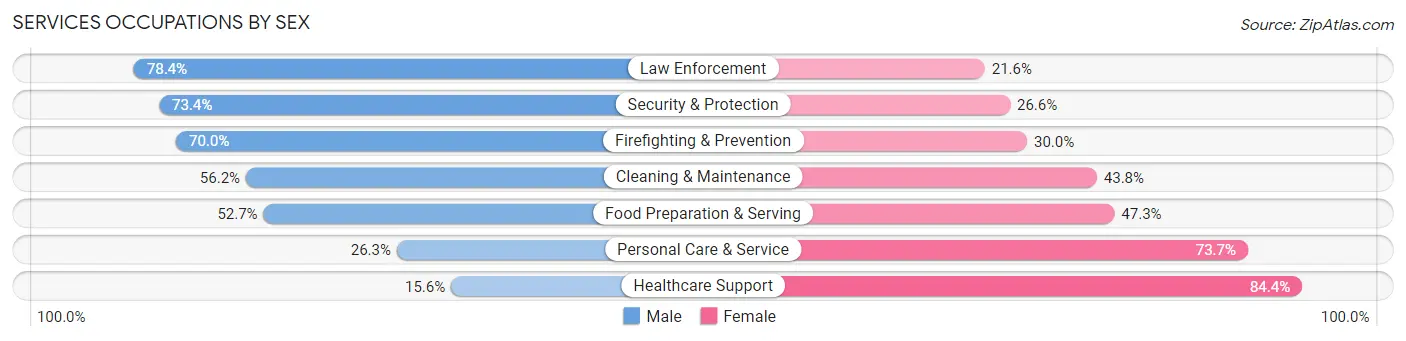
Within the Services occupations in Cook County, the most male-oriented occupations are Law Enforcement (78.4%), Security & Protection (73.4%), and Firefighting & Prevention (70.0%), while the most female-oriented occupations are Healthcare Support (84.4%), Personal Care & Service (73.7%), and Food Preparation & Serving (47.3%).
| Occupation | Male | Female |
| Healthcare Support | 13,519 (15.6%) | 73,338 (84.4%) |
| Security & Protection | 47,374 (73.4%) | 17,198 (26.6%) |
| Firefighting & Prevention | 26,996 (70.0%) | 11,570 (30.0%) |
| Law Enforcement | 20,378 (78.4%) | 5,628 (21.6%) |
| Food Preparation & Serving | 65,349 (52.7%) | 58,644 (47.3%) |
| Cleaning & Maintenance | 45,711 (56.2%) | 35,649 (43.8%) |
| Personal Care & Service | 18,871 (26.3%) | 52,892 (73.7%) |
| Total (Category) | 190,824 (44.5%) | 237,721 (55.5%) |
| Total (Overall) | 1,356,099 (52.1%) | 1,244,520 (47.8%) |
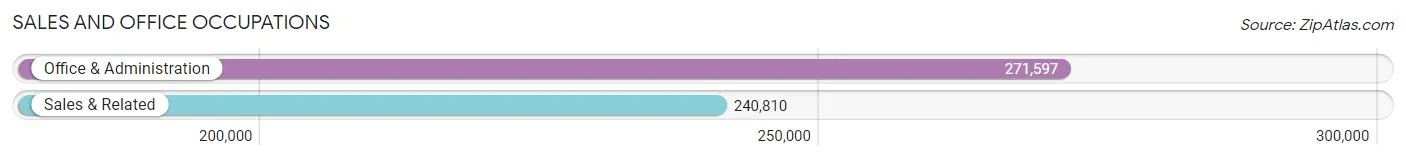
Sales and Office Occupations
The most common Sales and Office occupations in Cook County are Office & Administration (271,597 | 10.4%), and Sales & Related (240,810 | 9.3%).
Sales and Office Occupations by Sex
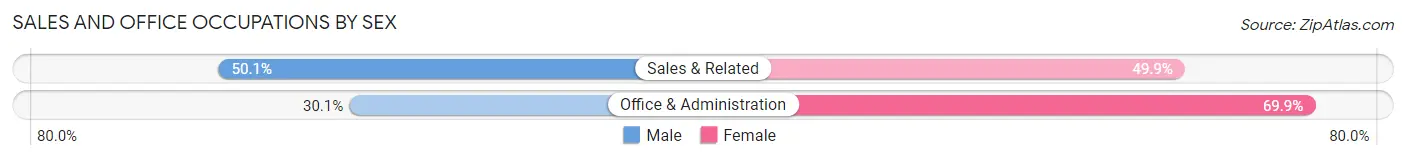
| Occupation | Male | Female |
| Sales & Related | 120,748 (50.1%) | 120,062 (49.9%) |
| Office & Administration | 81,720 (30.1%) | 189,877 (69.9%) |
| Total (Category) | 202,468 (39.5%) | 309,939 (60.5%) |
| Total (Overall) | 1,356,099 (52.1%) | 1,244,520 (47.8%) |
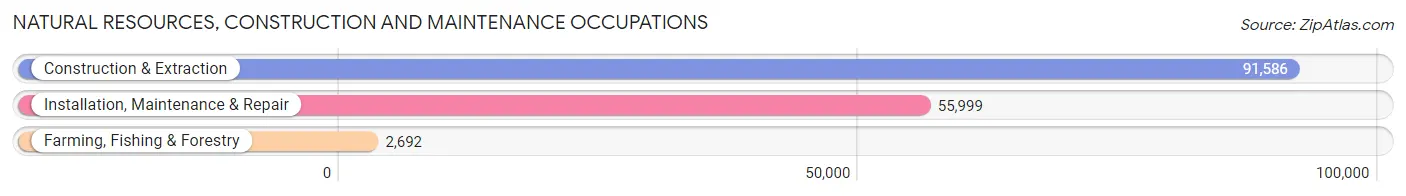
Natural Resources, Construction and Maintenance Occupations
The most common Natural Resources, Construction and Maintenance occupations in Cook County are Construction & Extraction (91,586 | 3.5%), Installation, Maintenance & Repair (55,999 | 2.1%), and Farming, Fishing & Forestry (2,692 | 0.1%).
Natural Resources, Construction and Maintenance Occupations by Sex
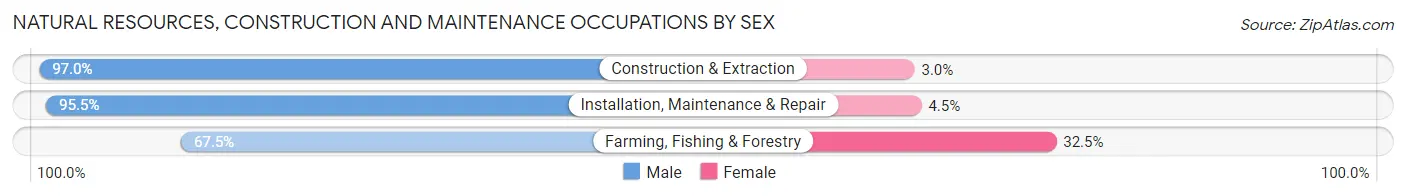
| Occupation | Male | Female |
| Farming, Fishing & Forestry | 1,816 (67.5%) | 876 (32.5%) |
| Construction & Extraction | 88,804 (97.0%) | 2,782 (3.0%) |
| Installation, Maintenance & Repair | 53,489 (95.5%) | 2,510 (4.5%) |
| Total (Category) | 144,109 (95.9%) | 6,168 (4.1%) |
| Total (Overall) | 1,356,099 (52.1%) | 1,244,520 (47.8%) |
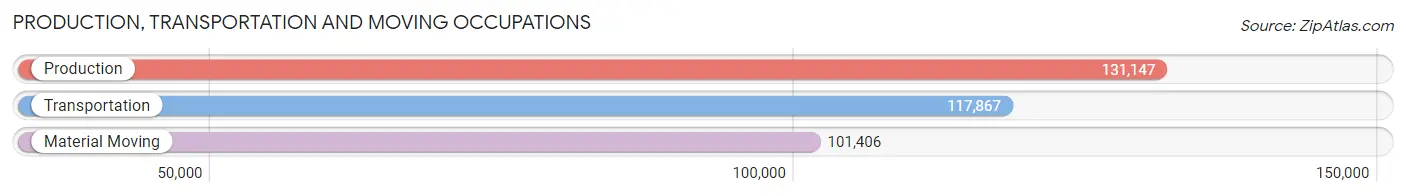
Production, Transportation and Moving Occupations
The most common Production, Transportation and Moving occupations in Cook County are Production (131,147 | 5.0%), Transportation (117,867 | 4.5%), and Material Moving (101,406 | 3.9%).
Production, Transportation and Moving Occupations by Sex
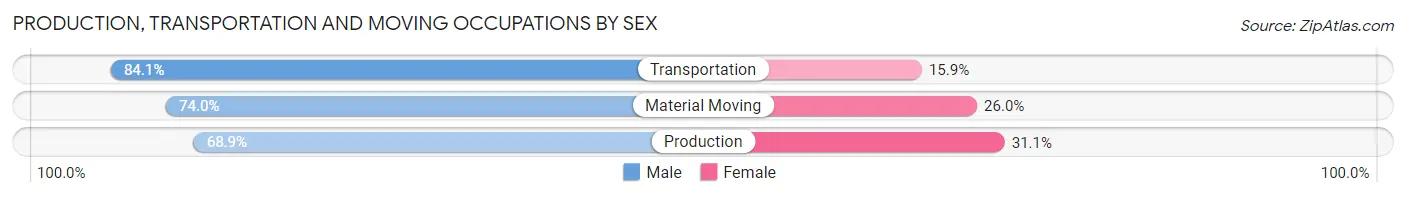
| Occupation | Male | Female |
| Production | 90,413 (68.9%) | 40,734 (31.1%) |
| Transportation | 99,175 (84.1%) | 18,692 (15.9%) |
| Material Moving | 75,065 (74.0%) | 26,341 (26.0%) |
| Total (Category) | 264,653 (75.5%) | 85,767 (24.5%) |
| Total (Overall) | 1,356,099 (52.1%) | 1,244,520 (47.8%) |
Employment Industries by Sex in Cook County
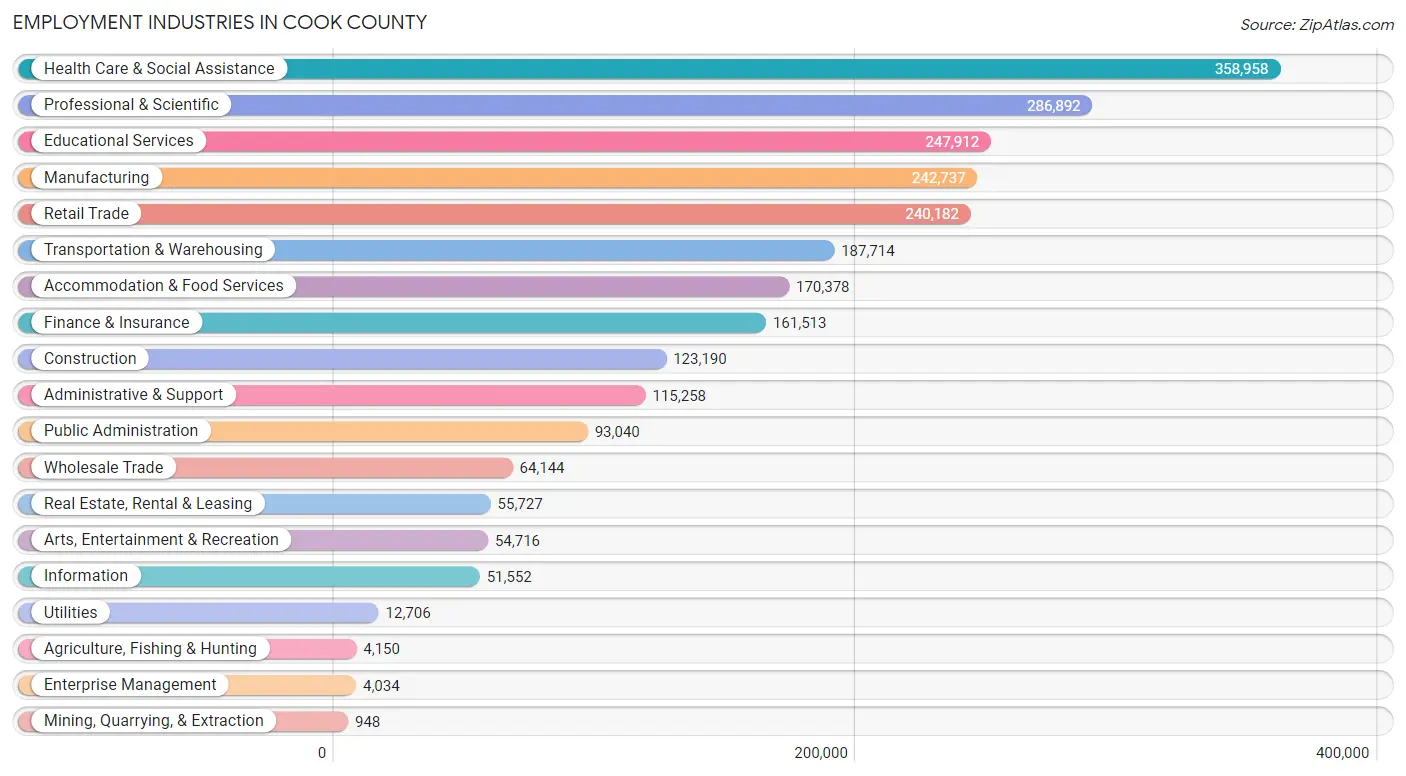
Employment Industries in Cook County
The major employment industries in Cook County include Health Care & Social Assistance (358,958 | 13.8%), Professional & Scientific (286,892 | 11.0%), Educational Services (247,912 | 9.5%), Manufacturing (242,737 | 9.3%), and Retail Trade (240,182 | 9.2%).
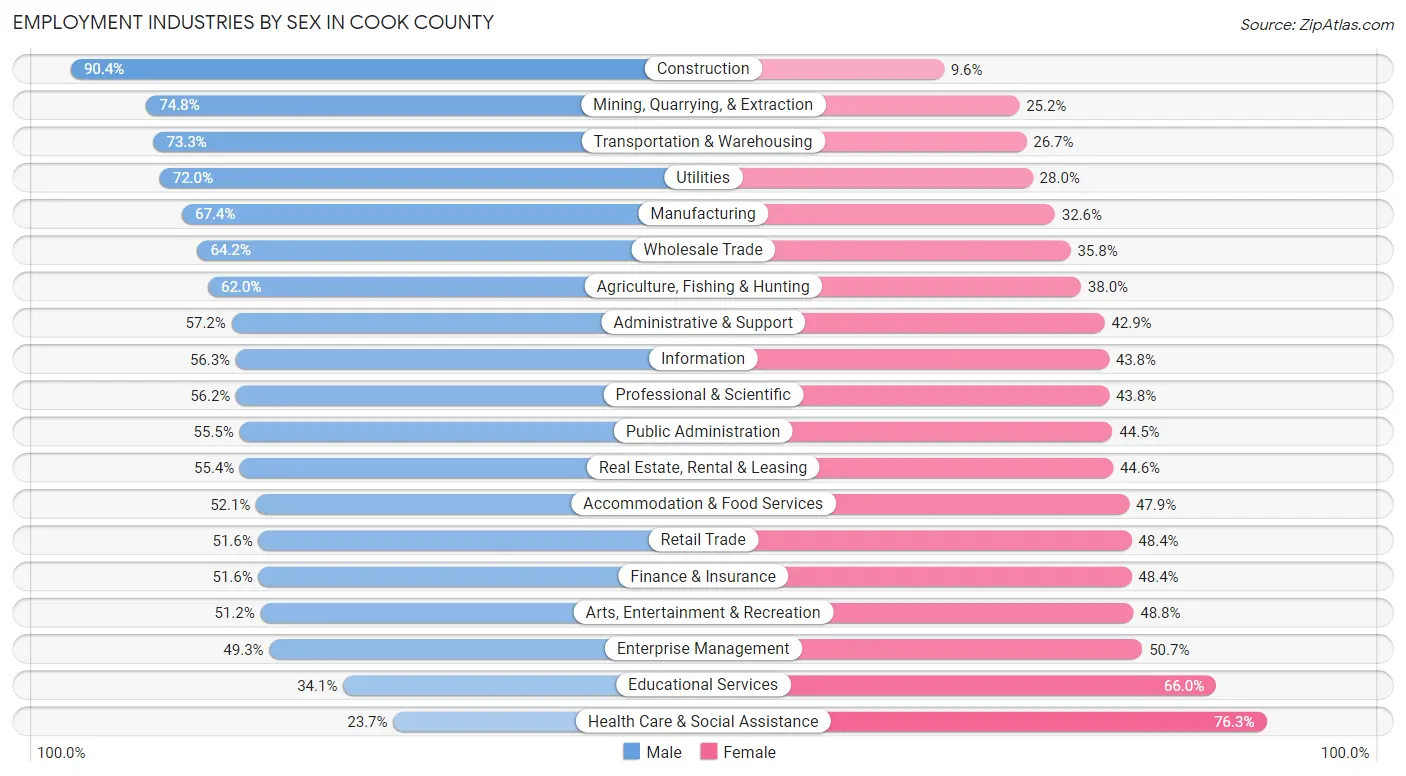
Employment Industries by Sex in Cook County
The Cook County industries that see more men than women are Construction (90.4%), Mining, Quarrying, & Extraction (74.8%), and Transportation & Warehousing (73.3%), whereas the industries that tend to have a higher number of women are Health Care & Social Assistance (76.3%), Educational Services (65.9%), and Enterprise Management (50.7%).
| Industry | Male | Female |
| Agriculture, Fishing & Hunting | 2,574 (62.0%) | 1,576 (38.0%) |
| Mining, Quarrying, & Extraction | 709 (74.8%) | 239 (25.2%) |
| Construction | 111,358 (90.4%) | 11,832 (9.6%) |
| Manufacturing | 163,640 (67.4%) | 79,097 (32.6%) |
| Wholesale Trade | 41,168 (64.2%) | 22,976 (35.8%) |
| Retail Trade | 123,862 (51.6%) | 116,320 (48.4%) |
| Transportation & Warehousing | 137,641 (73.3%) | 50,073 (26.7%) |
| Utilities | 9,149 (72.0%) | 3,557 (28.0%) |
| Information | 28,998 (56.2%) | 22,554 (43.8%) |
| Finance & Insurance | 83,289 (51.6%) | 78,224 (48.4%) |
| Real Estate, Rental & Leasing | 30,867 (55.4%) | 24,860 (44.6%) |
| Professional & Scientific | 161,233 (56.2%) | 125,659 (43.8%) |
| Enterprise Management | 1,990 (49.3%) | 2,044 (50.7%) |
| Administrative & Support | 65,875 (57.2%) | 49,383 (42.8%) |
| Educational Services | 84,418 (34.1%) | 163,494 (65.9%) |
| Health Care & Social Assistance | 84,957 (23.7%) | 274,001 (76.3%) |
| Arts, Entertainment & Recreation | 28,001 (51.2%) | 26,715 (48.8%) |
| Accommodation & Food Services | 88,696 (52.1%) | 81,682 (47.9%) |
| Public Administration | 51,639 (55.5%) | 41,401 (44.5%) |
| Total | 1,356,099 (52.1%) | 1,244,520 (47.8%) |
Education in Cook County
School Enrollment in Cook County
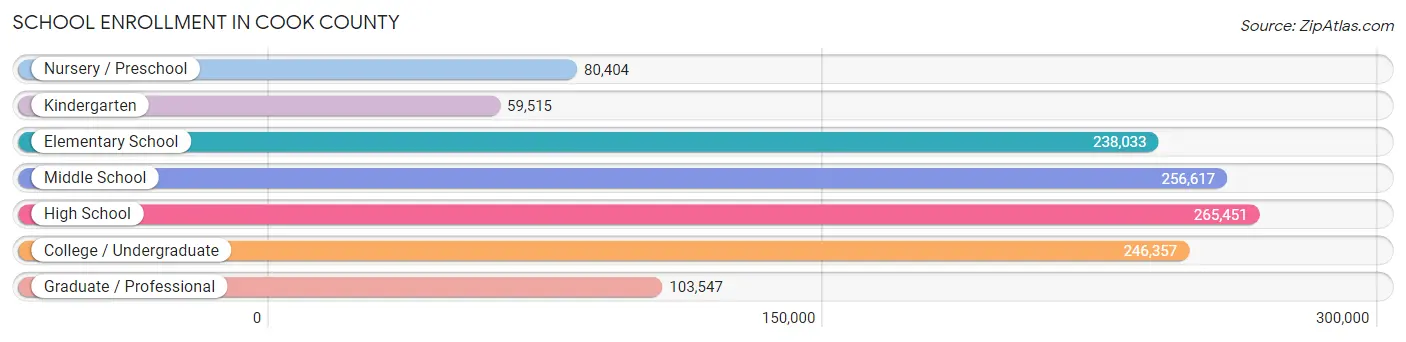
The most common levels of schooling among the 1,249,924 students in Cook County are high school (265,451 | 21.2%), middle school (256,617 | 20.5%), and college / undergraduate (246,357 | 19.7%).
| School Level | # Students | % Students |
| Nursery / Preschool | 80,404 | 6.4% |
| Kindergarten | 59,515 | 4.8% |
| Elementary School | 238,033 | 19.0% |
| Middle School | 256,617 | 20.5% |
| High School | 265,451 | 21.2% |
| College / Undergraduate | 246,357 | 19.7% |
| Graduate / Professional | 103,547 | 8.3% |
| Total | 1,249,924 | 100.0% |
School Enrollment by Age by Funding Source in Cook County
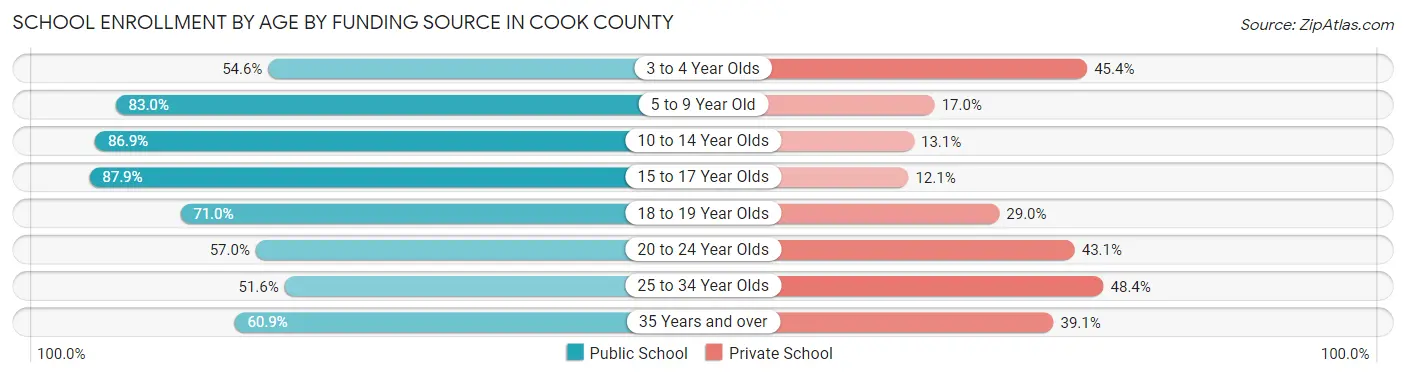
Out of a total of 1,249,924 students who are enrolled in schools in Cook County, 299,982 (24.0%) attend a private institution, while the remaining 949,942 (76.0%) are enrolled in public schools. The age group of 25 to 34 year olds has the highest likelihood of being enrolled in private schools, with 46,032 (48.4% in the age bracket) enrolled. Conversely, the age group of 15 to 17 year olds has the lowest likelihood of being enrolled in a private school, with 165,198 (87.9% in the age bracket) attending a public institution.
| Age Bracket | Public School | Private School |
| 3 to 4 Year Olds | 35,345 (54.6%) | 29,355 (45.4%) |
| 5 to 9 Year Old | 236,382 (83.0%) | 48,272 (17.0%) |
| 10 to 14 Year Olds | 276,282 (86.9%) | 41,702 (13.1%) |
| 15 to 17 Year Olds | 165,198 (87.9%) | 22,679 (12.1%) |
| 18 to 19 Year Olds | 69,586 (71.0%) | 28,416 (29.0%) |
| 20 to 24 Year Olds | 76,292 (57.0%) | 57,682 (43.0%) |
| 25 to 34 Year Olds | 49,028 (51.6%) | 46,032 (48.4%) |
| 35 Years and over | 41,219 (60.9%) | 26,454 (39.1%) |
| Total | 949,942 (76.0%) | 299,982 (24.0%) |
Educational Attainment by Field of Study in Cook County
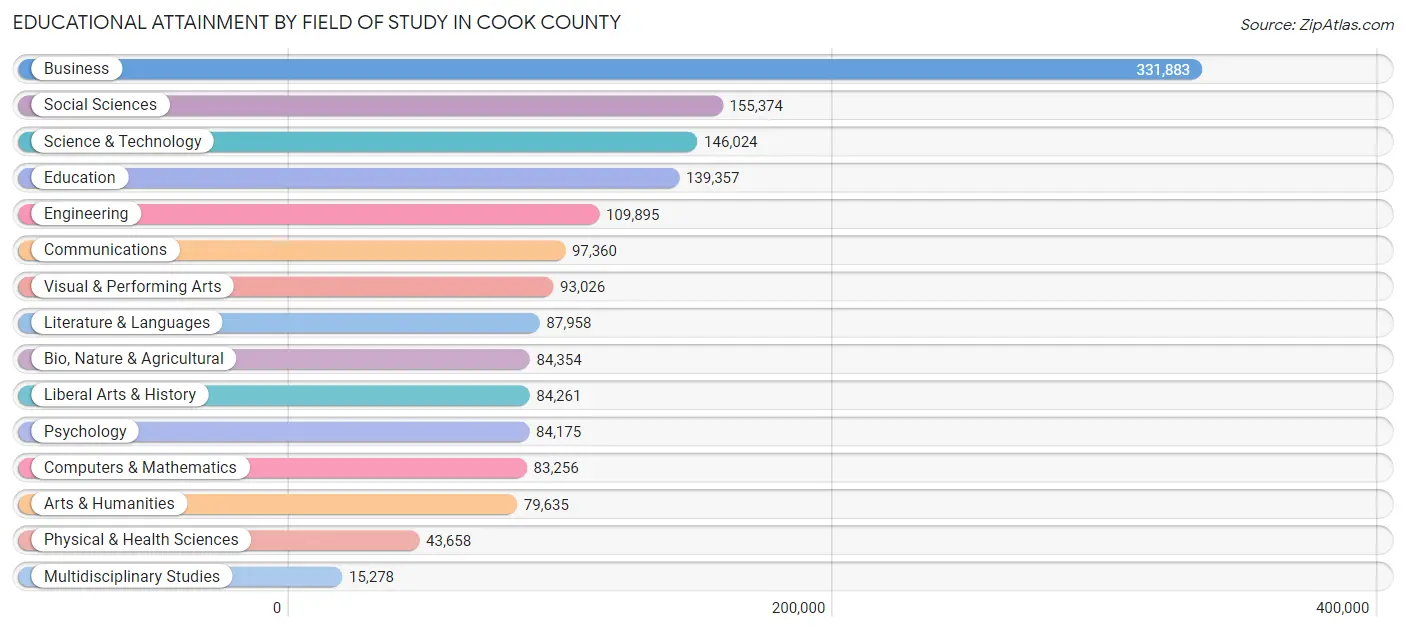
Business (331,883 | 20.3%), social sciences (155,374 | 9.5%), science & technology (146,024 | 8.9%), education (139,357 | 8.5%), and engineering (109,895 | 6.7%) are the most common fields of study among 1,635,494 individuals in Cook County who have obtained a bachelor's degree or higher.
| Field of Study | # Graduates | % Graduates |
| Computers & Mathematics | 83,256 | 5.1% |
| Bio, Nature & Agricultural | 84,354 | 5.2% |
| Physical & Health Sciences | 43,658 | 2.7% |
| Psychology | 84,175 | 5.1% |
| Social Sciences | 155,374 | 9.5% |
| Engineering | 109,895 | 6.7% |
| Multidisciplinary Studies | 15,278 | 0.9% |
| Science & Technology | 146,024 | 8.9% |
| Business | 331,883 | 20.3% |
| Education | 139,357 | 8.5% |
| Literature & Languages | 87,958 | 5.4% |
| Liberal Arts & History | 84,261 | 5.1% |
| Visual & Performing Arts | 93,026 | 5.7% |
| Communications | 97,360 | 5.9% |
| Arts & Humanities | 79,635 | 4.9% |
| Total | 1,635,494 | 100.0% |
Transportation & Commute in Cook County
Vehicle Availability by Sex in Cook County
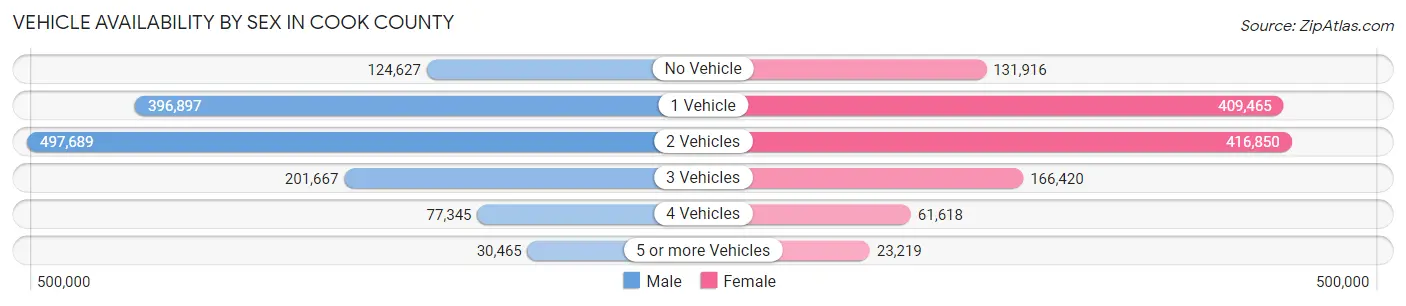
The most prevalent vehicle ownership categories in Cook County are males with 2 vehicles (497,689, accounting for 37.5%) and females with 2 vehicles (416,850, making up 41.1%).
| Vehicles Available | Male | Female |
| No Vehicle | 124,627 (9.4%) | 131,916 (10.9%) |
| 1 Vehicle | 396,897 (29.9%) | 409,465 (33.9%) |
| 2 Vehicles | 497,689 (37.5%) | 416,850 (34.5%) |
| 3 Vehicles | 201,667 (15.2%) | 166,420 (13.8%) |
| 4 Vehicles | 77,345 (5.8%) | 61,618 (5.1%) |
| 5 or more Vehicles | 30,465 (2.3%) | 23,219 (1.9%) |
| Total | 1,328,690 (100.0%) | 1,209,488 (100.0%) |
Commute Time in Cook County
The most frequently occuring commute durations in Cook County are 30 to 34 minutes (388,308 commuters, 17.8%), 45 to 59 minutes (290,671 commuters, 13.3%), and 20 to 24 minutes (273,098 commuters, 12.5%).
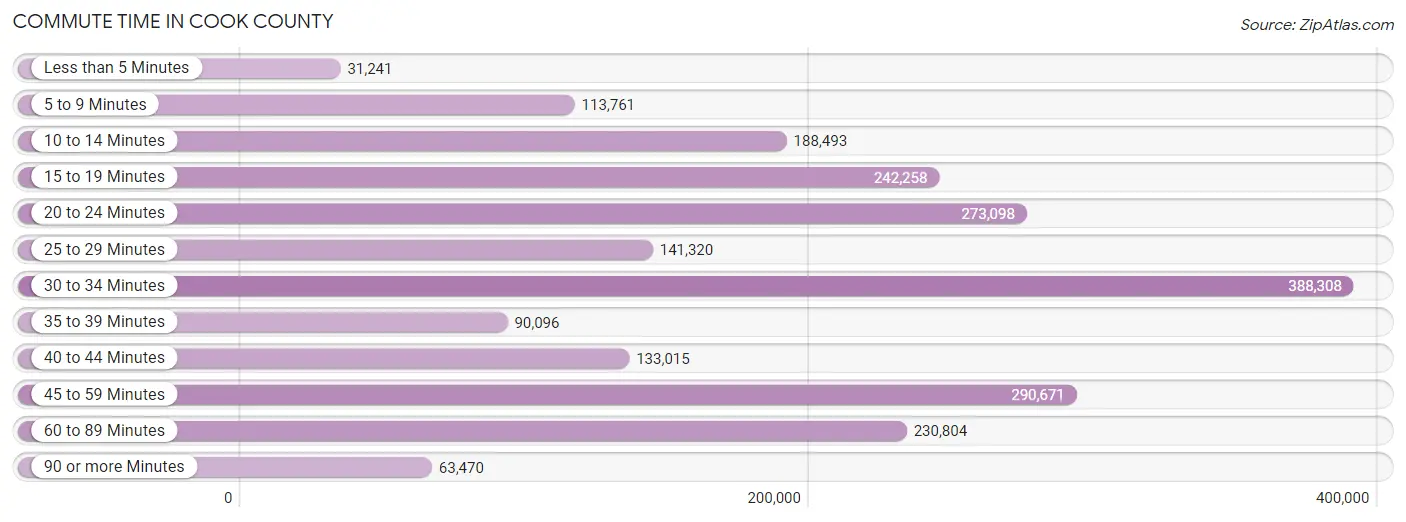
| Commute Time | # Commuters | % Commuters |
| Less than 5 Minutes | 31,241 | 1.4% |
| 5 to 9 Minutes | 113,761 | 5.2% |
| 10 to 14 Minutes | 188,493 | 8.6% |
| 15 to 19 Minutes | 242,258 | 11.1% |
| 20 to 24 Minutes | 273,098 | 12.5% |
| 25 to 29 Minutes | 141,320 | 6.5% |
| 30 to 34 Minutes | 388,308 | 17.8% |
| 35 to 39 Minutes | 90,096 | 4.1% |
| 40 to 44 Minutes | 133,015 | 6.1% |
| 45 to 59 Minutes | 290,671 | 13.3% |
| 60 to 89 Minutes | 230,804 | 10.6% |
| 90 or more Minutes | 63,470 | 2.9% |
Commute Time by Sex in Cook County
The most common commute times in Cook County are 30 to 34 minutes (213,818 commuters, 18.5%) for males and 30 to 34 minutes (174,490 commuters, 16.9%) for females.
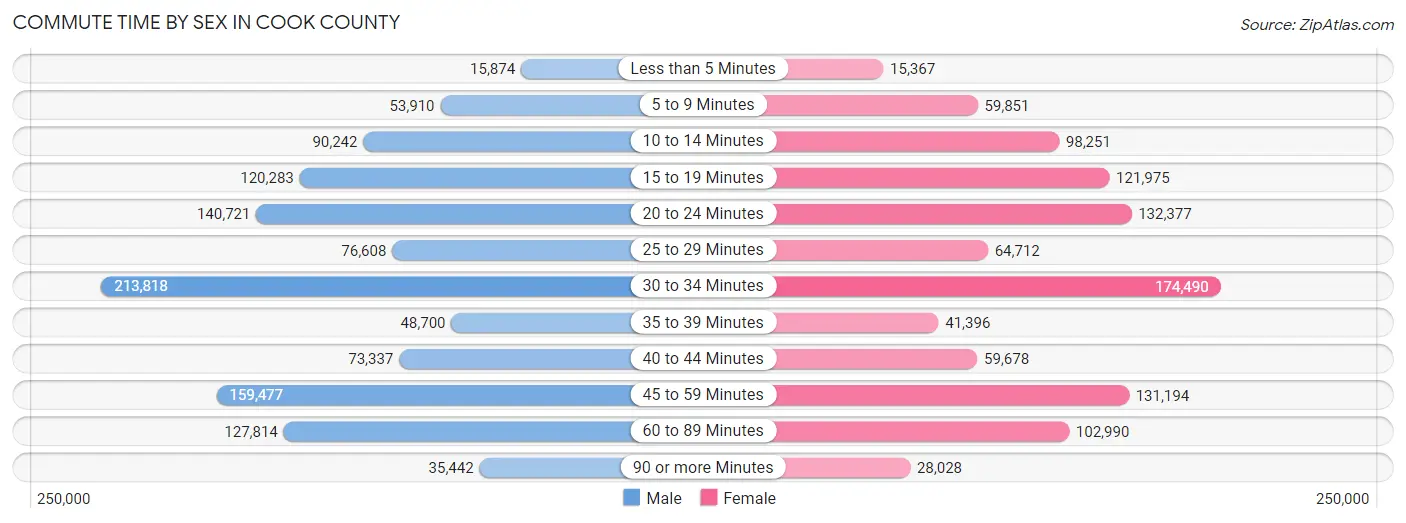
| Commute Time | Male | Female |
| Less than 5 Minutes | 15,874 (1.4%) | 15,367 (1.5%) |
| 5 to 9 Minutes | 53,910 (4.7%) | 59,851 (5.8%) |
| 10 to 14 Minutes | 90,242 (7.8%) | 98,251 (9.5%) |
| 15 to 19 Minutes | 120,283 (10.4%) | 121,975 (11.8%) |
| 20 to 24 Minutes | 140,721 (12.2%) | 132,377 (12.9%) |
| 25 to 29 Minutes | 76,608 (6.6%) | 64,712 (6.3%) |
| 30 to 34 Minutes | 213,818 (18.5%) | 174,490 (16.9%) |
| 35 to 39 Minutes | 48,700 (4.2%) | 41,396 (4.0%) |
| 40 to 44 Minutes | 73,337 (6.3%) | 59,678 (5.8%) |
| 45 to 59 Minutes | 159,477 (13.8%) | 131,194 (12.7%) |
| 60 to 89 Minutes | 127,814 (11.1%) | 102,990 (10.0%) |
| 90 or more Minutes | 35,442 (3.1%) | 28,028 (2.7%) |
Time of Departure to Work by Sex in Cook County
The most frequent times of departure to work in Cook County are 7:00 AM to 7:29 AM (161,714, 14.0%) for males and 7:00 AM to 7:29 AM (160,969, 15.6%) for females.
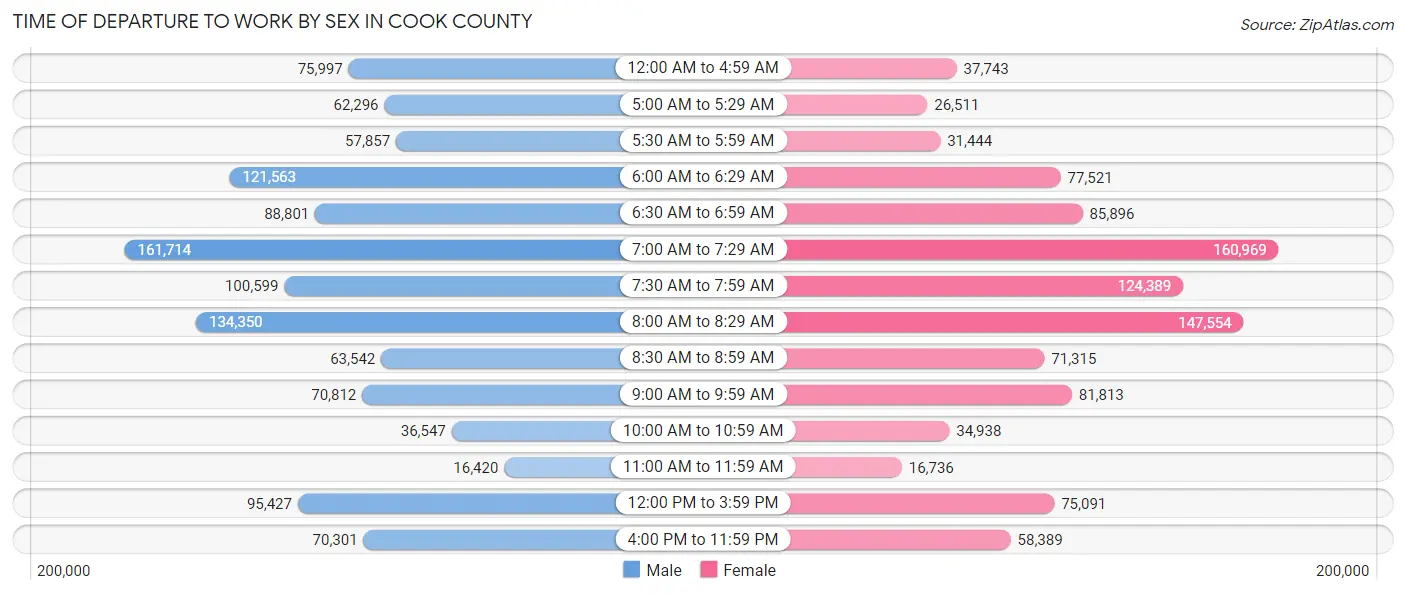
| Time of Departure | Male | Female |
| 12:00 AM to 4:59 AM | 75,997 (6.6%) | 37,743 (3.7%) |
| 5:00 AM to 5:29 AM | 62,296 (5.4%) | 26,511 (2.6%) |
| 5:30 AM to 5:59 AM | 57,857 (5.0%) | 31,444 (3.0%) |
| 6:00 AM to 6:29 AM | 121,563 (10.5%) | 77,521 (7.5%) |
| 6:30 AM to 6:59 AM | 88,801 (7.7%) | 85,896 (8.3%) |
| 7:00 AM to 7:29 AM | 161,714 (14.0%) | 160,969 (15.6%) |
| 7:30 AM to 7:59 AM | 100,599 (8.7%) | 124,389 (12.1%) |
| 8:00 AM to 8:29 AM | 134,350 (11.6%) | 147,554 (14.3%) |
| 8:30 AM to 8:59 AM | 63,542 (5.5%) | 71,315 (6.9%) |
| 9:00 AM to 9:59 AM | 70,812 (6.1%) | 81,813 (7.9%) |
| 10:00 AM to 10:59 AM | 36,547 (3.2%) | 34,938 (3.4%) |
| 11:00 AM to 11:59 AM | 16,420 (1.4%) | 16,736 (1.6%) |
| 12:00 PM to 3:59 PM | 95,427 (8.3%) | 75,091 (7.3%) |
| 4:00 PM to 11:59 PM | 70,301 (6.1%) | 58,389 (5.7%) |
| Total | 1,156,226 (100.0%) | 1,030,309 (100.0%) |
Housing Occupancy in Cook County
Occupancy by Ownership in Cook County
Of the total 2,066,248 dwellings in Cook County, owner-occupied units account for 1,188,945 (57.5%), while renter-occupied units make up 877,303 (42.5%).
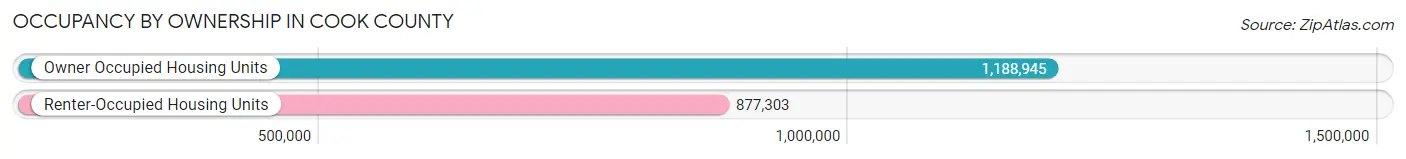
| Occupancy | # Housing Units | % Housing Units |
| Owner Occupied Housing Units | 1,188,945 | 57.5% |
| Renter-Occupied Housing Units | 877,303 | 42.5% |
| Total Occupied Housing Units | 2,066,248 | 100.0% |
Occupancy by Household Size in Cook County
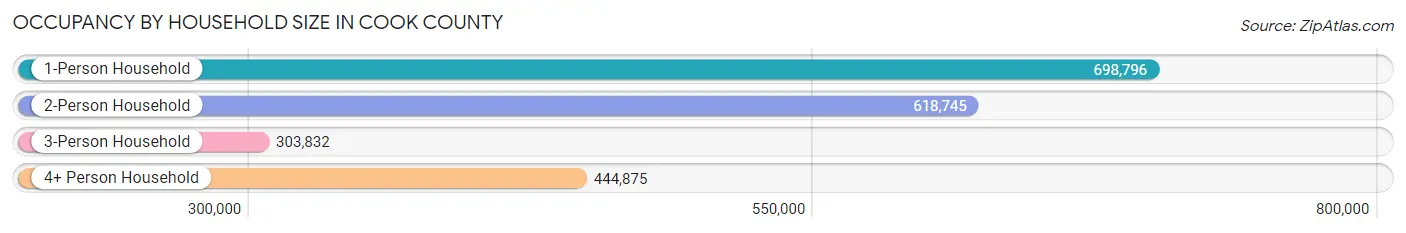
| Household Size | # Housing Units | % Housing Units |
| 1-Person Household | 698,796 | 33.8% |
| 2-Person Household | 618,745 | 29.9% |
| 3-Person Household | 303,832 | 14.7% |
| 4+ Person Household | 444,875 | 21.5% |
| Total Housing Units | 2,066,248 | 100.0% |
Occupancy by Ownership by Household Size in Cook County
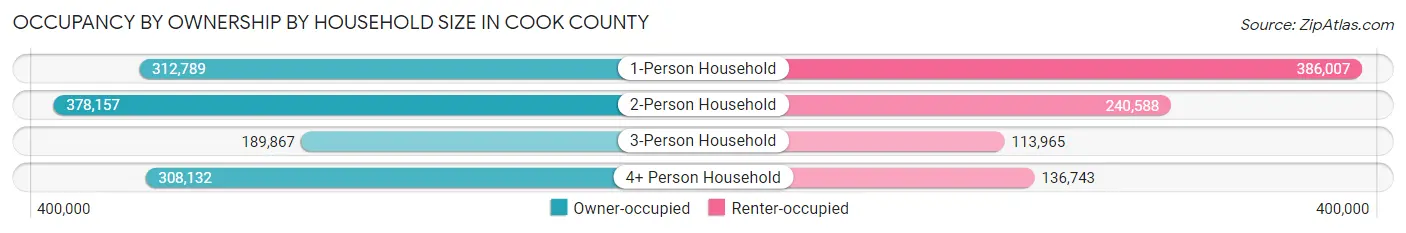
| Household Size | Owner-occupied | Renter-occupied |
| 1-Person Household | 312,789 (44.8%) | 386,007 (55.2%) |
| 2-Person Household | 378,157 (61.1%) | 240,588 (38.9%) |
| 3-Person Household | 189,867 (62.5%) | 113,965 (37.5%) |
| 4+ Person Household | 308,132 (69.3%) | 136,743 (30.7%) |
| Total Housing Units | 1,188,945 (57.5%) | 877,303 (42.5%) |
Occupancy by Educational Attainment in Cook County
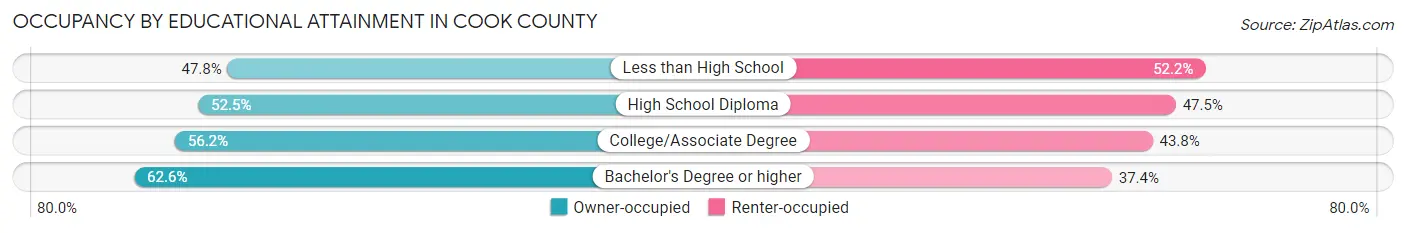
| Household Size | Owner-occupied | Renter-occupied |
| Less than High School | 96,557 (47.8%) | 105,385 (52.2%) |
| High School Diploma | 212,022 (52.5%) | 191,900 (47.5%) |
| College/Associate Degree | 297,701 (56.2%) | 232,427 (43.8%) |
| Bachelor's Degree or higher | 582,665 (62.6%) | 347,591 (37.4%) |
Occupancy by Age of Householder in Cook County
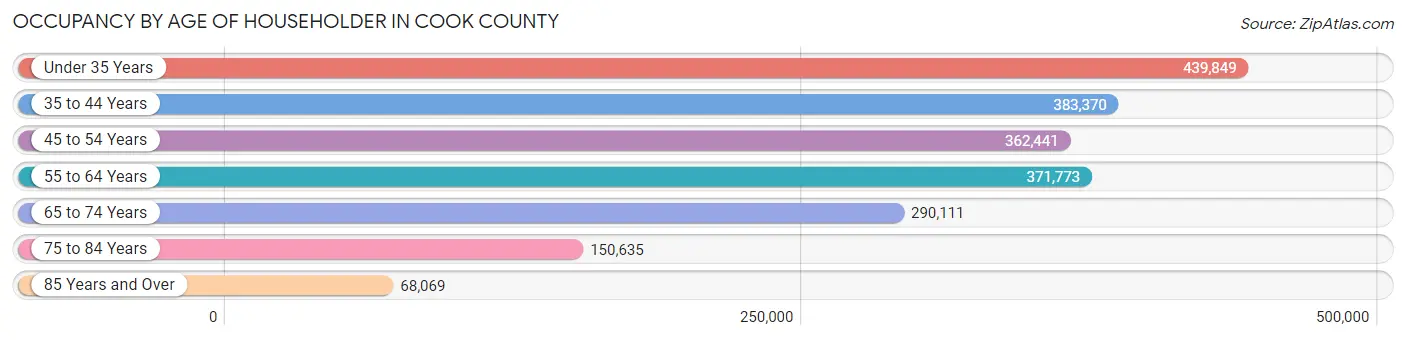
| Age Bracket | # Households | % Households |
| Under 35 Years | 439,849 | 21.3% |
| 35 to 44 Years | 383,370 | 18.5% |
| 45 to 54 Years | 362,441 | 17.5% |
| 55 to 64 Years | 371,773 | 18.0% |
| 65 to 74 Years | 290,111 | 14.0% |
| 75 to 84 Years | 150,635 | 7.3% |
| 85 Years and Over | 68,069 | 3.3% |
| Total | 2,066,248 | 100.0% |
Housing Finances in Cook County
Median Income by Occupancy in Cook County
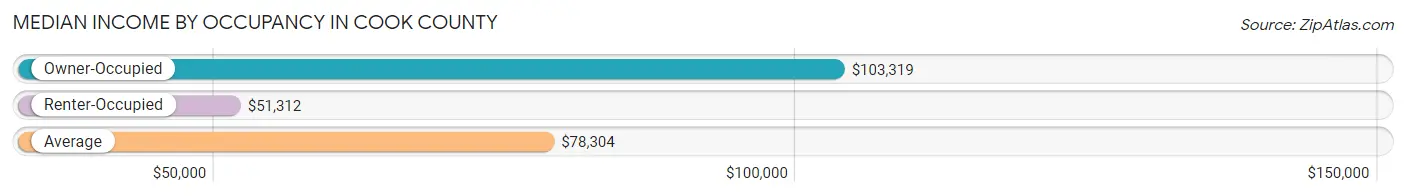
| Occupancy Type | # Households | Median Income |
| Owner-Occupied | 1,188,945 (57.5%) | $103,319 |
| Renter-Occupied | 877,303 (42.5%) | $51,312 |
| Average | 2,066,248 (100.0%) | $78,304 |
Occupancy by Householder Income Bracket in Cook County
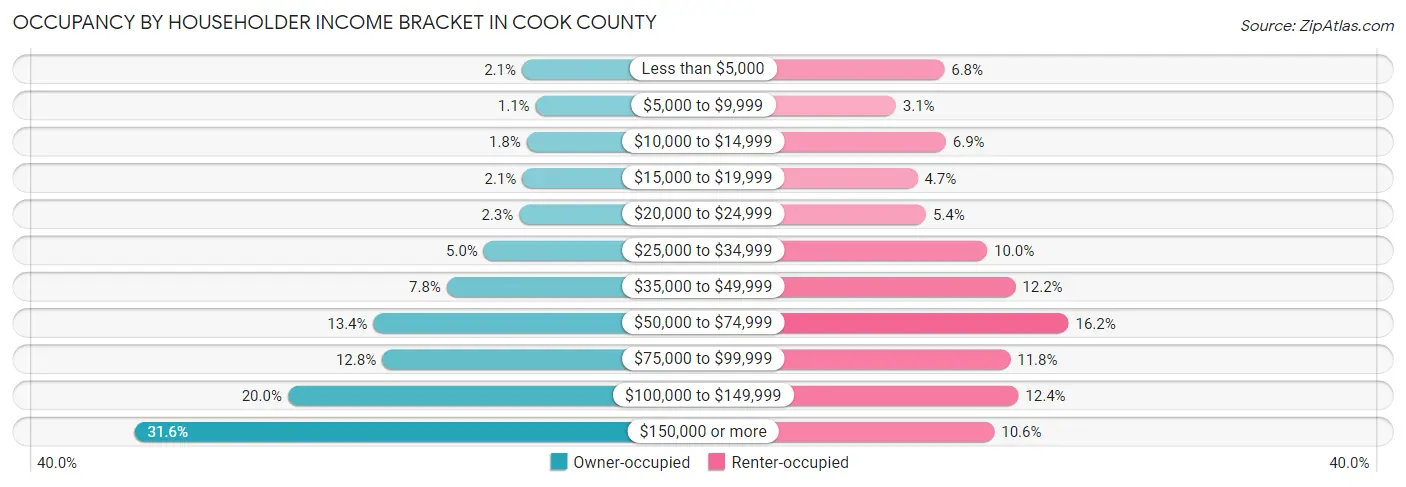
| Income Bracket | Owner-occupied | Renter-occupied |
| Less than $5,000 | 25,257 (2.1%) | 59,328 (6.8%) |
| $5,000 to $9,999 | 12,851 (1.1%) | 26,940 (3.1%) |
| $10,000 to $14,999 | 20,854 (1.8%) | 60,367 (6.9%) |
| $15,000 to $19,999 | 24,841 (2.1%) | 41,396 (4.7%) |
| $20,000 to $24,999 | 27,541 (2.3%) | 47,109 (5.4%) |
| $25,000 to $34,999 | 59,677 (5.0%) | 87,905 (10.0%) |
| $35,000 to $49,999 | 93,265 (7.8%) | 106,872 (12.2%) |
| $50,000 to $74,999 | 159,622 (13.4%) | 142,347 (16.2%) |
| $75,000 to $99,999 | 151,877 (12.8%) | 103,473 (11.8%) |
| $100,000 to $149,999 | 237,243 (20.0%) | 108,873 (12.4%) |
| $150,000 or more | 375,917 (31.6%) | 92,693 (10.6%) |
| Total | 1,188,945 (100.0%) | 877,303 (100.0%) |
Monthly Housing Cost Tiers in Cook County
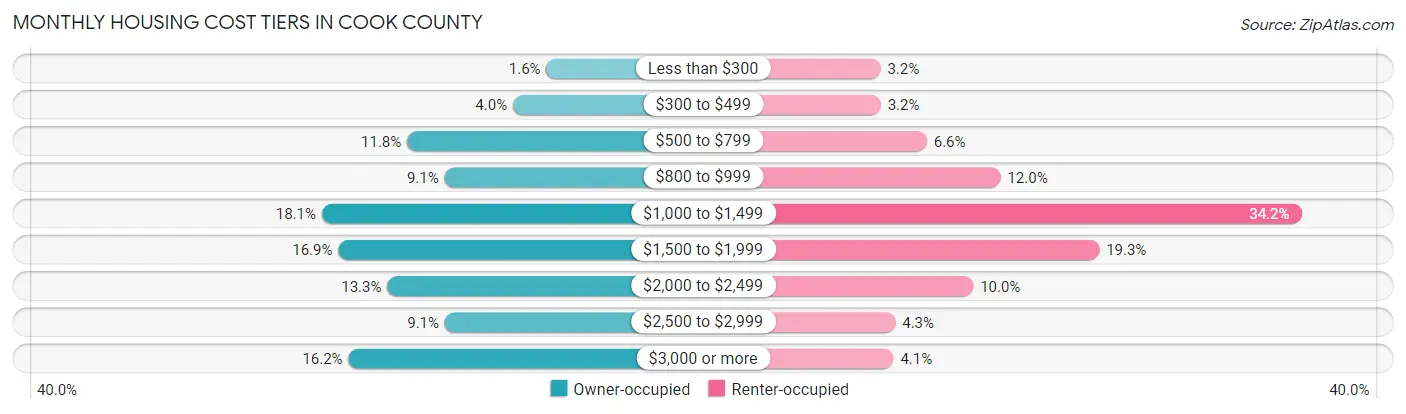
| Monthly Cost | Owner-occupied | Renter-occupied |
| Less than $300 | 18,637 (1.6%) | 27,842 (3.2%) |
| $300 to $499 | 47,909 (4.0%) | 27,992 (3.2%) |
| $500 to $799 | 140,624 (11.8%) | 57,691 (6.6%) |
| $800 to $999 | 107,885 (9.1%) | 105,390 (12.0%) |
| $1,000 to $1,499 | 215,364 (18.1%) | 299,698 (34.2%) |
| $1,500 to $1,999 | 200,924 (16.9%) | 169,182 (19.3%) |
| $2,000 to $2,499 | 157,997 (13.3%) | 87,747 (10.0%) |
| $2,500 to $2,999 | 107,599 (9.0%) | 37,397 (4.3%) |
| $3,000 or more | 192,006 (16.2%) | 36,206 (4.1%) |
| Total | 1,188,945 (100.0%) | 877,303 (100.0%) |
Physical Housing Characteristics in Cook County
Housing Structures in Cook County
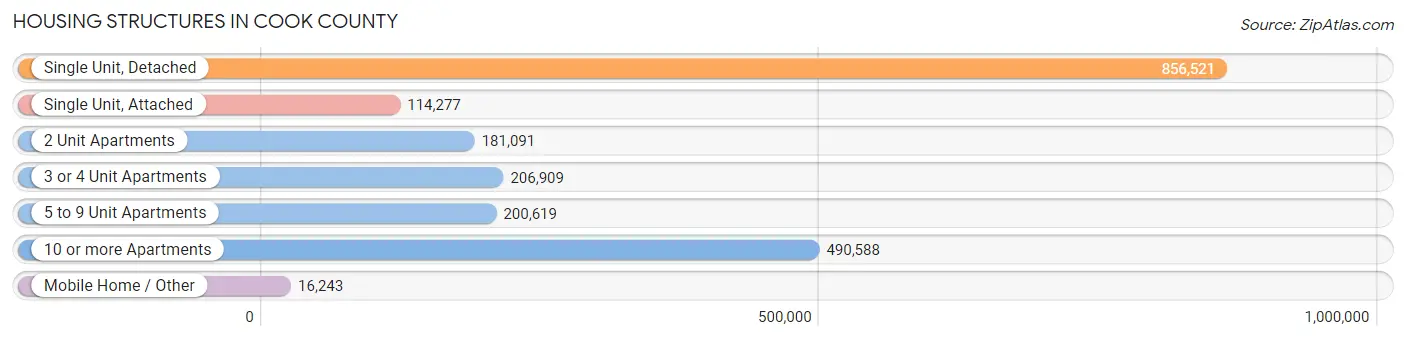
| Structure Type | # Housing Units | % Housing Units |
| Single Unit, Detached | 856,521 | 41.4% |
| Single Unit, Attached | 114,277 | 5.5% |
| 2 Unit Apartments | 181,091 | 8.8% |
| 3 or 4 Unit Apartments | 206,909 | 10.0% |
| 5 to 9 Unit Apartments | 200,619 | 9.7% |
| 10 or more Apartments | 490,588 | 23.7% |
| Mobile Home / Other | 16,243 | 0.8% |
| Total | 2,066,248 | 100.0% |
Housing Structures by Occupancy in Cook County
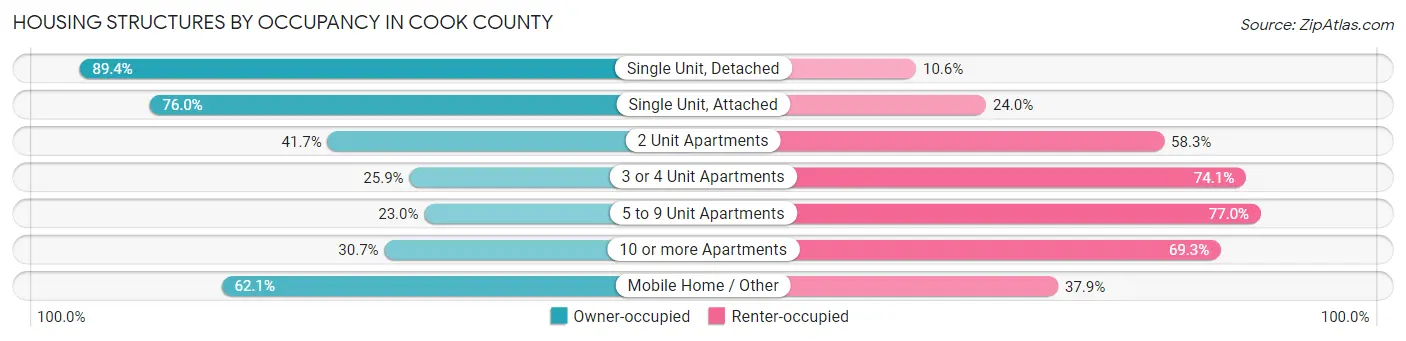
| Structure Type | Owner-occupied | Renter-occupied |
| Single Unit, Detached | 766,063 (89.4%) | 90,458 (10.6%) |
| Single Unit, Attached | 86,806 (76.0%) | 27,471 (24.0%) |
| 2 Unit Apartments | 75,436 (41.7%) | 105,655 (58.3%) |
| 3 or 4 Unit Apartments | 53,607 (25.9%) | 153,302 (74.1%) |
| 5 to 9 Unit Apartments | 46,224 (23.0%) | 154,395 (77.0%) |
| 10 or more Apartments | 150,724 (30.7%) | 339,864 (69.3%) |
| Mobile Home / Other | 10,085 (62.1%) | 6,158 (37.9%) |
| Total | 1,188,945 (57.5%) | 877,303 (42.5%) |
Housing Structures by Number of Rooms in Cook County
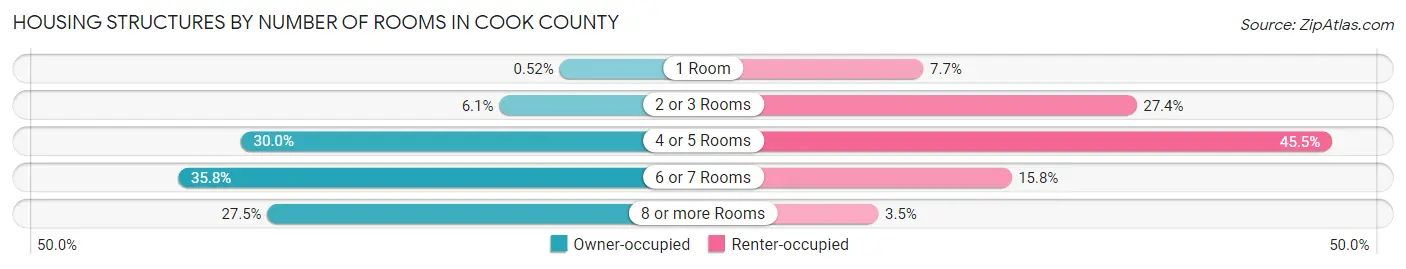
| Number of Rooms | Owner-occupied | Renter-occupied |
| 1 Room | 6,143 (0.5%) | 67,522 (7.7%) |
| 2 or 3 Rooms | 72,534 (6.1%) | 240,462 (27.4%) |
| 4 or 5 Rooms | 356,979 (30.0%) | 399,331 (45.5%) |
| 6 or 7 Rooms | 425,863 (35.8%) | 138,987 (15.8%) |
| 8 or more Rooms | 327,426 (27.5%) | 31,001 (3.5%) |
| Total | 1,188,945 (100.0%) | 877,303 (100.0%) |
Housing Structure by Heating Type in Cook County
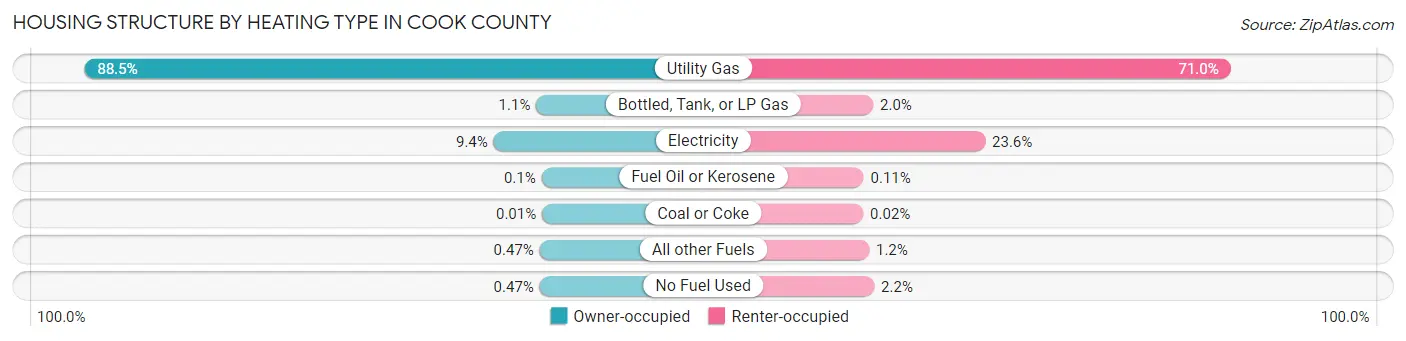
| Heating Type | Owner-occupied | Renter-occupied |
| Utility Gas | 1,051,702 (88.5%) | 622,955 (71.0%) |
| Bottled, Tank, or LP Gas | 13,379 (1.1%) | 17,127 (1.9%) |
| Electricity | 111,389 (9.4%) | 206,972 (23.6%) |
| Fuel Oil or Kerosene | 1,204 (0.1%) | 995 (0.1%) |
| Coal or Coke | 154 (0.0%) | 208 (0.0%) |
| All other Fuels | 5,586 (0.5%) | 10,166 (1.2%) |
| No Fuel Used | 5,531 (0.5%) | 18,880 (2.1%) |
| Total | 1,188,945 (100.0%) | 877,303 (100.0%) |
Household Vehicle Usage in Cook County
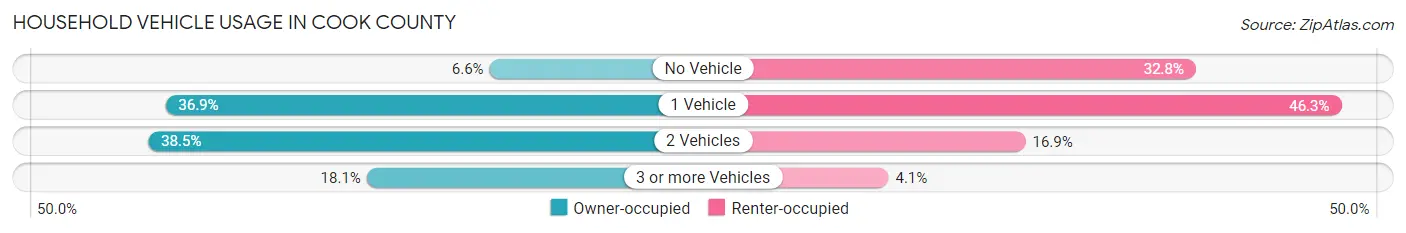
| Vehicles per Household | Owner-occupied | Renter-occupied |
| No Vehicle | 78,545 (6.6%) | 287,330 (32.8%) |
| 1 Vehicle | 438,188 (36.9%) | 406,416 (46.3%) |
| 2 Vehicles | 457,336 (38.5%) | 147,889 (16.9%) |
| 3 or more Vehicles | 214,876 (18.1%) | 35,668 (4.1%) |
| Total | 1,188,945 (100.0%) | 877,303 (100.0%) |
Real Estate & Mortgages in Cook County
Real Estate and Mortgage Overview in Cook County
| Characteristic | Without Mortgage | With Mortgage |
| Housing Units | 435,653 | 753,292 |
| Median Property Value | $271,000 | $309,100 |
| Median Household Income | $76,907 | $280,615 |
| Monthly Housing Costs | $856 | $183,144 |
| Real Estate Taxes | $5,347 | $15,183 |
Property Value by Mortgage Status in Cook County
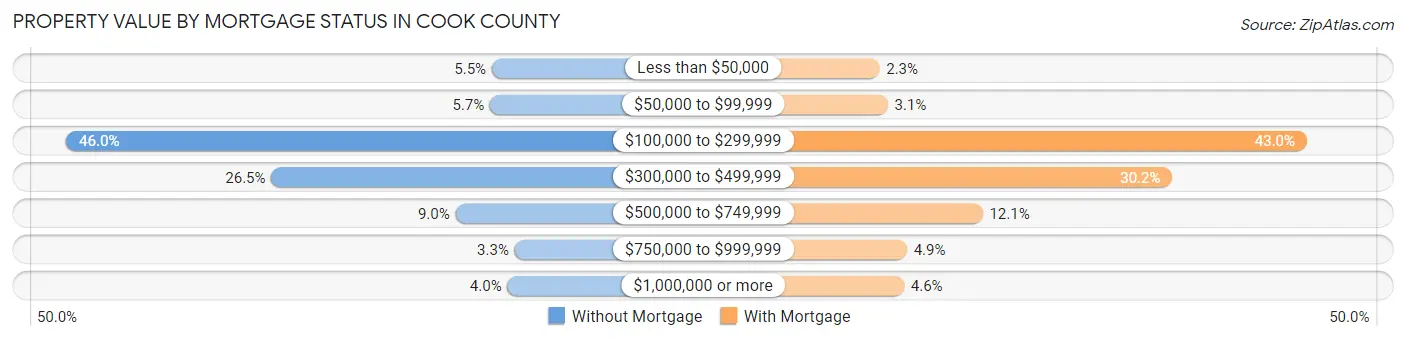
| Property Value | Without Mortgage | With Mortgage |
| Less than $50,000 | 23,939 (5.5%) | 17,026 (2.3%) |
| $50,000 to $99,999 | 24,717 (5.7%) | 22,948 (3.0%) |
| $100,000 to $299,999 | 200,573 (46.0%) | 323,787 (43.0%) |
| $300,000 to $499,999 | 115,447 (26.5%) | 227,219 (30.2%) |
| $500,000 to $749,999 | 39,048 (9.0%) | 91,036 (12.1%) |
| $750,000 to $999,999 | 14,480 (3.3%) | 36,654 (4.9%) |
| $1,000,000 or more | 17,449 (4.0%) | 34,622 (4.6%) |
| Total | 435,653 (100.0%) | 753,292 (100.0%) |
Household Income by Mortgage Status in Cook County
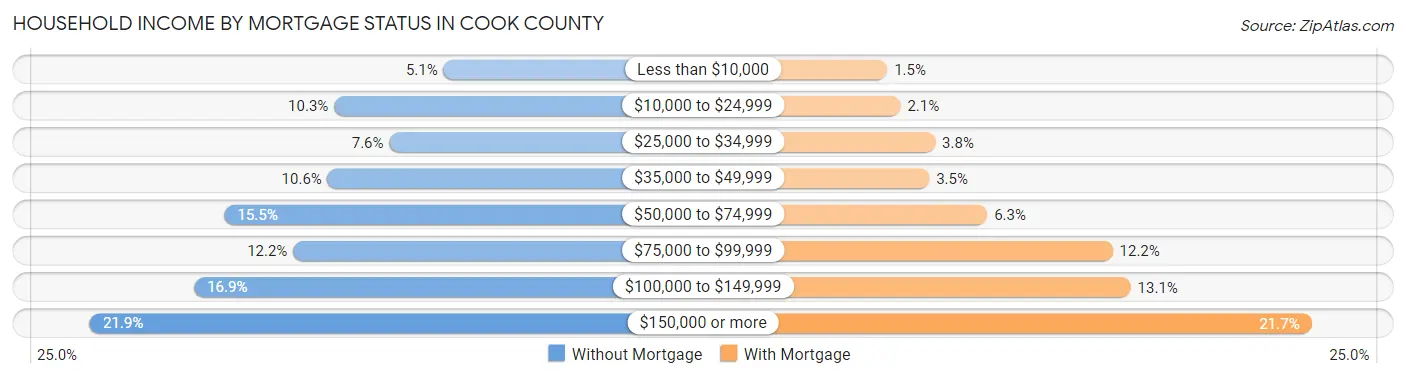
| Household Income | Without Mortgage | With Mortgage |
| Less than $10,000 | 22,004 (5.1%) | 11,360 (1.5%) |
| $10,000 to $24,999 | 44,708 (10.3%) | 16,104 (2.1%) |
| $25,000 to $34,999 | 33,234 (7.6%) | 28,528 (3.8%) |
| $35,000 to $49,999 | 46,039 (10.6%) | 26,443 (3.5%) |
| $50,000 to $74,999 | 67,426 (15.5%) | 47,226 (6.3%) |
| $75,000 to $99,999 | 53,212 (12.2%) | 92,196 (12.2%) |
| $100,000 to $149,999 | 73,728 (16.9%) | 98,665 (13.1%) |
| $150,000 or more | 95,302 (21.9%) | 163,515 (21.7%) |
| Total | 435,653 (100.0%) | 753,292 (100.0%) |
Property Value to Household Income Ratio in Cook County
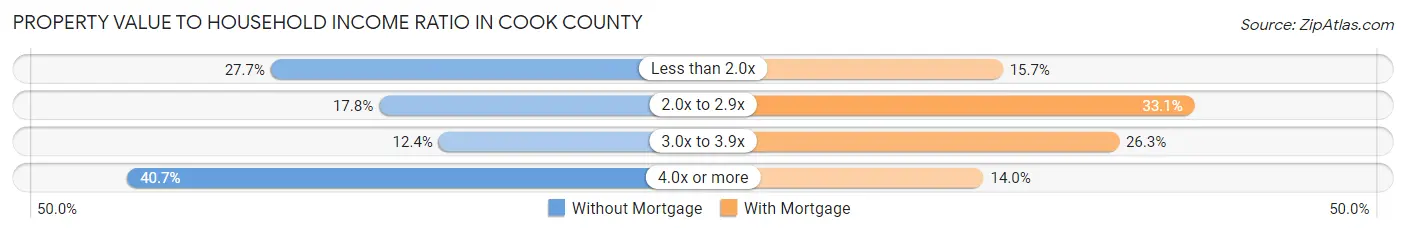
| Value-to-Income Ratio | Without Mortgage | With Mortgage |
| Less than 2.0x | 120,442 (27.7%) | 118,200 (15.7%) |
| 2.0x to 2.9x | 77,642 (17.8%) | 249,428 (33.1%) |
| 3.0x to 3.9x | 54,038 (12.4%) | 197,715 (26.3%) |
| 4.0x or more | 177,204 (40.7%) | 105,096 (14.0%) |
| Total | 435,653 (100.0%) | 753,292 (100.0%) |
Real Estate Taxes by Mortgage Status in Cook County
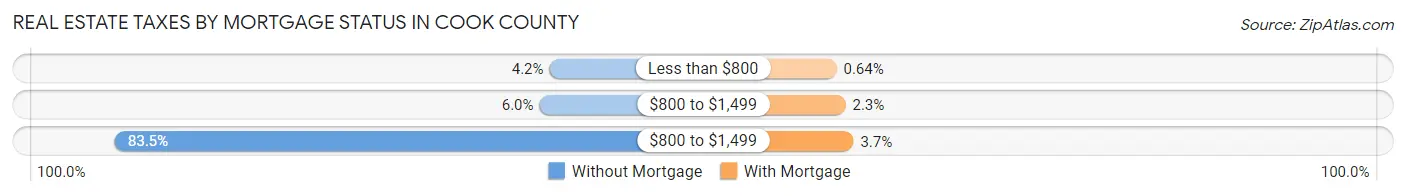
| Property Taxes | Without Mortgage | With Mortgage |
| Less than $800 | 18,062 (4.2%) | 4,850 (0.6%) |
| $800 to $1,499 | 26,031 (6.0%) | 17,164 (2.3%) |
| $800 to $1,499 | 363,804 (83.5%) | 28,116 (3.7%) |
| Total | 435,653 (100.0%) | 753,292 (100.0%) |
Health & Disability in Cook County
Health Insurance Coverage by Age in Cook County
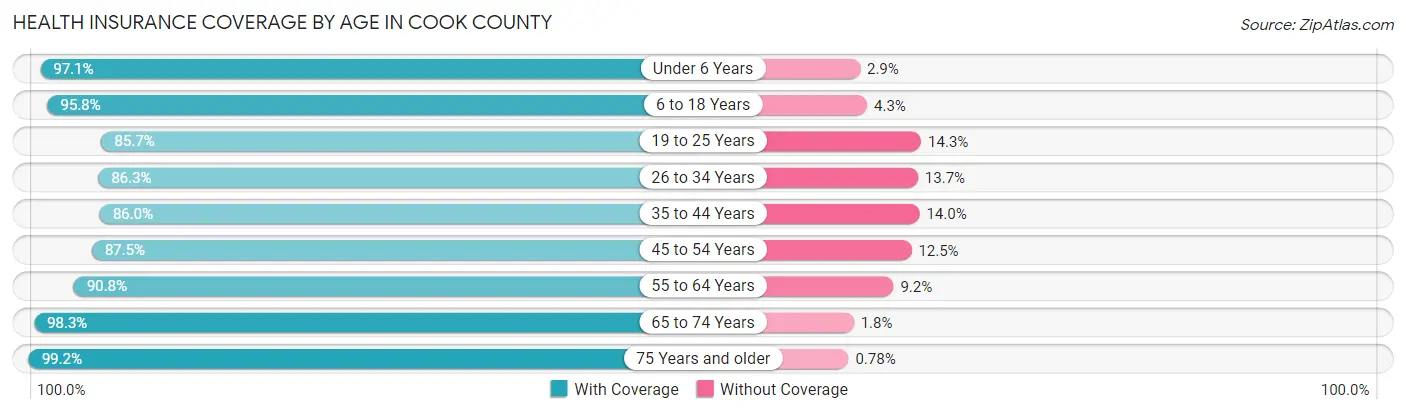
| Age Bracket | With Coverage | Without Coverage |
| Under 6 Years | 347,462 (97.1%) | 10,472 (2.9%) |
| 6 to 18 Years | 793,616 (95.8%) | 35,183 (4.3%) |
| 19 to 25 Years | 408,736 (85.7%) | 68,360 (14.3%) |
| 26 to 34 Years | 642,928 (86.3%) | 102,356 (13.7%) |
| 35 to 44 Years | 617,128 (86.0%) | 100,597 (14.0%) |
| 45 to 54 Years | 565,415 (87.5%) | 80,890 (12.5%) |
| 55 to 64 Years | 576,849 (90.8%) | 58,218 (9.2%) |
| 65 to 74 Years | 448,497 (98.3%) | 7,985 (1.8%) |
| 75 Years and older | 313,386 (99.2%) | 2,456 (0.8%) |
| Total | 4,714,017 (91.0%) | 466,517 (9.0%) |
Health Insurance Coverage by Citizenship Status in Cook County
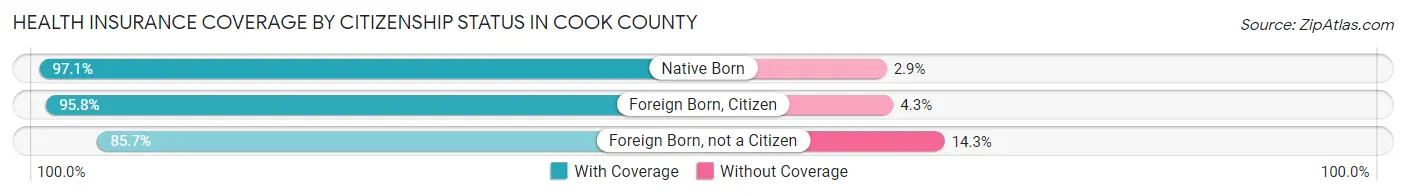
| Citizenship Status | With Coverage | Without Coverage |
| Native Born | 347,462 (97.1%) | 10,472 (2.9%) |
| Foreign Born, Citizen | 793,616 (95.8%) | 35,183 (4.3%) |
| Foreign Born, not a Citizen | 408,736 (85.7%) | 68,360 (14.3%) |
Health Insurance Coverage by Household Income in Cook County
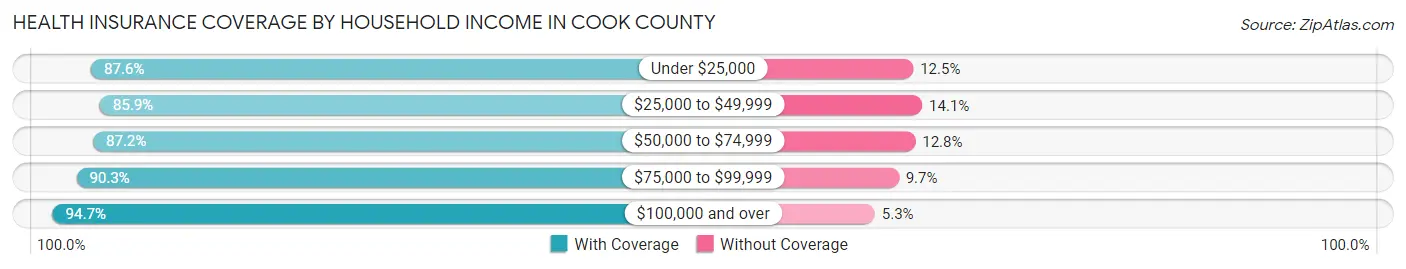
| Household Income | With Coverage | Without Coverage |
| Under $25,000 | 531,741 (87.5%) | 75,593 (12.4%) |
| $25,000 to $49,999 | 642,215 (85.9%) | 105,574 (14.1%) |
| $50,000 to $74,999 | 619,309 (87.2%) | 91,244 (12.8%) |
| $75,000 to $99,999 | 579,897 (90.3%) | 62,443 (9.7%) |
| $100,000 and over | 2,302,623 (94.7%) | 127,762 (5.3%) |
Public vs Private Health Insurance Coverage by Age in Cook County
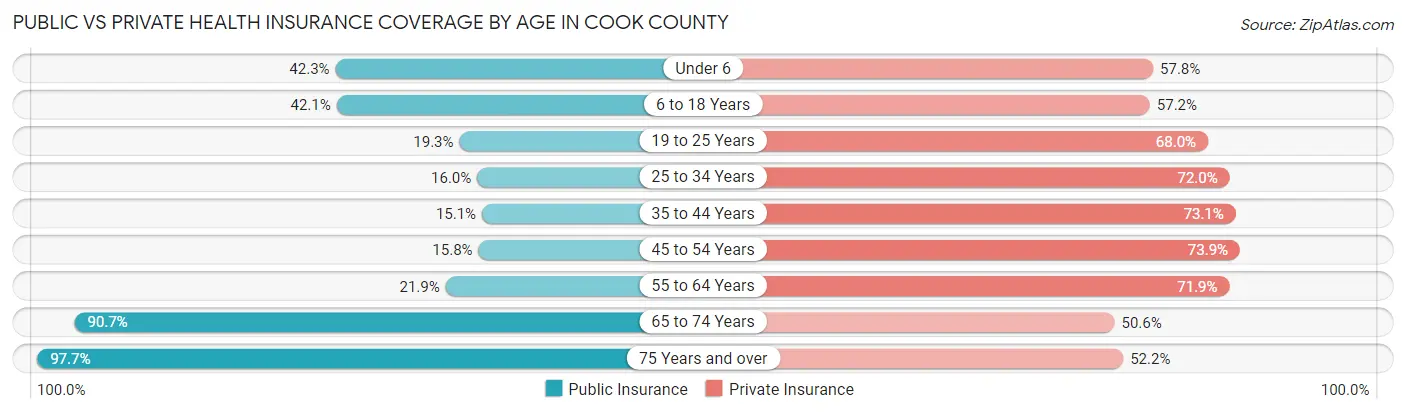
| Age Bracket | Public Insurance | Private Insurance |
| Under 6 | 151,425 (42.3%) | 206,831 (57.8%) |
| 6 to 18 Years | 348,829 (42.1%) | 473,938 (57.2%) |
| 19 to 25 Years | 92,082 (19.3%) | 324,172 (67.9%) |
| 25 to 34 Years | 119,313 (16.0%) | 536,354 (72.0%) |
| 35 to 44 Years | 108,478 (15.1%) | 524,727 (73.1%) |
| 45 to 54 Years | 101,927 (15.8%) | 477,560 (73.9%) |
| 55 to 64 Years | 138,880 (21.9%) | 456,782 (71.9%) |
| 65 to 74 Years | 414,190 (90.7%) | 231,098 (50.6%) |
| 75 Years and over | 308,424 (97.7%) | 164,984 (52.2%) |
| Total | 1,783,548 (34.4%) | 3,396,446 (65.6%) |
Disability Status by Sex by Age in Cook County
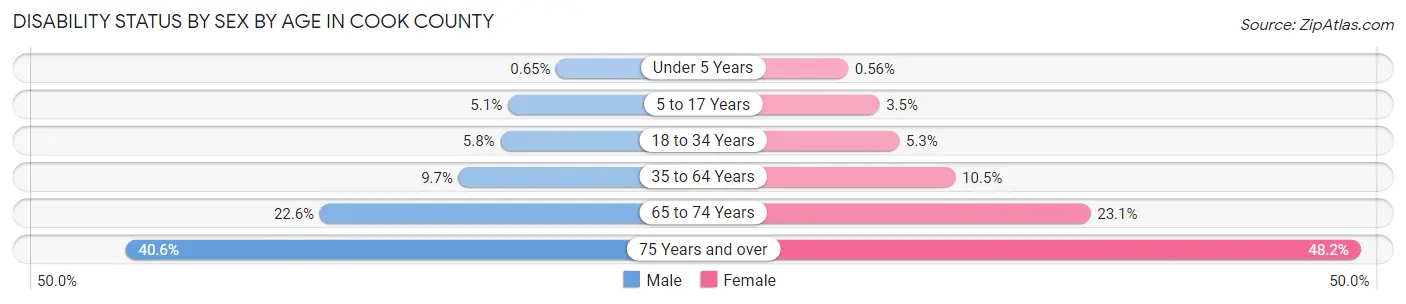
| Age Bracket | Male | Female |
| Under 5 Years | 992 (0.6%) | 827 (0.6%) |
| 5 to 17 Years | 21,521 (5.1%) | 13,984 (3.5%) |
| 18 to 34 Years | 37,355 (5.8%) | 34,392 (5.3%) |
| 35 to 64 Years | 95,677 (9.7%) | 106,557 (10.5%) |
| 65 to 74 Years | 46,976 (22.6%) | 57,305 (23.1%) |
| 75 Years and over | 49,756 (40.6%) | 93,106 (48.1%) |
Disability Class by Sex by Age in Cook County
Disability Class: Hearing Difficulty
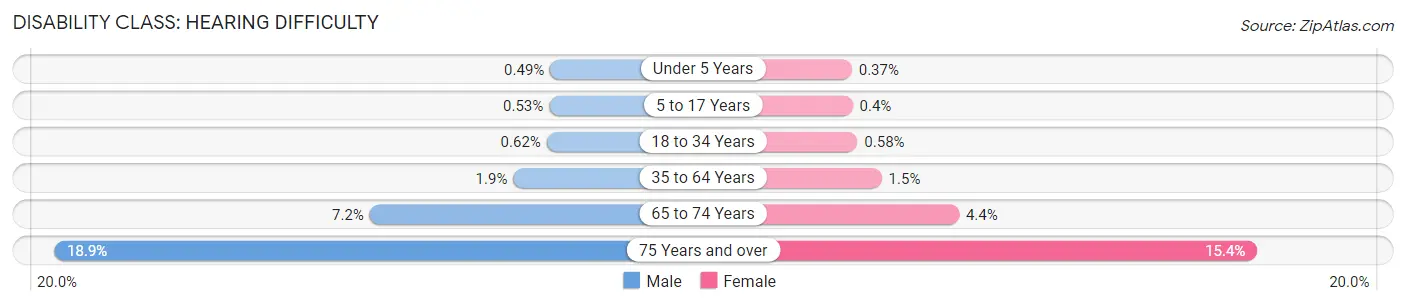
| Age Bracket | Male | Female |
| Under 5 Years | 750 (0.5%) | 545 (0.4%) |
| 5 to 17 Years | 2,231 (0.5%) | 1,603 (0.4%) |
| 18 to 34 Years | 3,980 (0.6%) | 3,775 (0.6%) |
| 35 to 64 Years | 18,387 (1.9%) | 14,984 (1.5%) |
| 65 to 74 Years | 14,954 (7.2%) | 10,802 (4.3%) |
| 75 Years and over | 23,162 (18.9%) | 29,813 (15.4%) |
Disability Class: Vision Difficulty
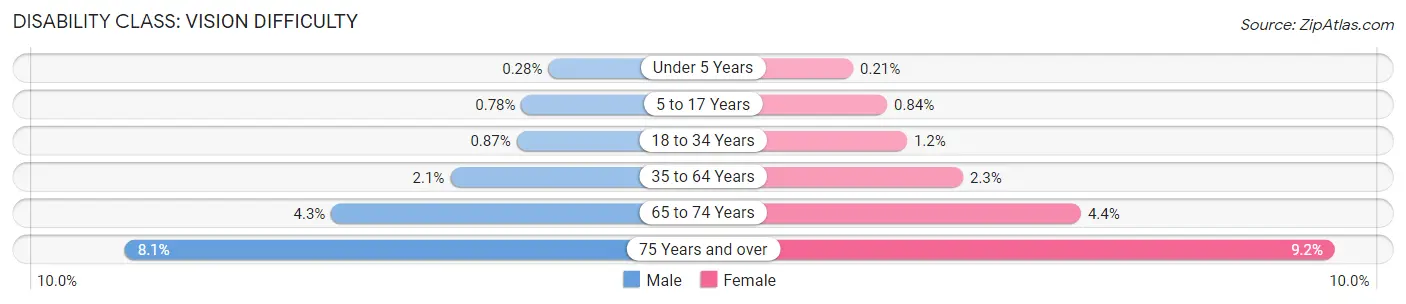
| Age Bracket | Male | Female |
| Under 5 Years | 436 (0.3%) | 307 (0.2%) |
| 5 to 17 Years | 3,248 (0.8%) | 3,393 (0.8%) |
| 18 to 34 Years | 5,585 (0.9%) | 7,818 (1.2%) |
| 35 to 64 Years | 20,715 (2.1%) | 22,816 (2.2%) |
| 65 to 74 Years | 8,958 (4.3%) | 11,036 (4.4%) |
| 75 Years and over | 9,972 (8.1%) | 17,700 (9.1%) |
Disability Class: Cognitive Difficulty
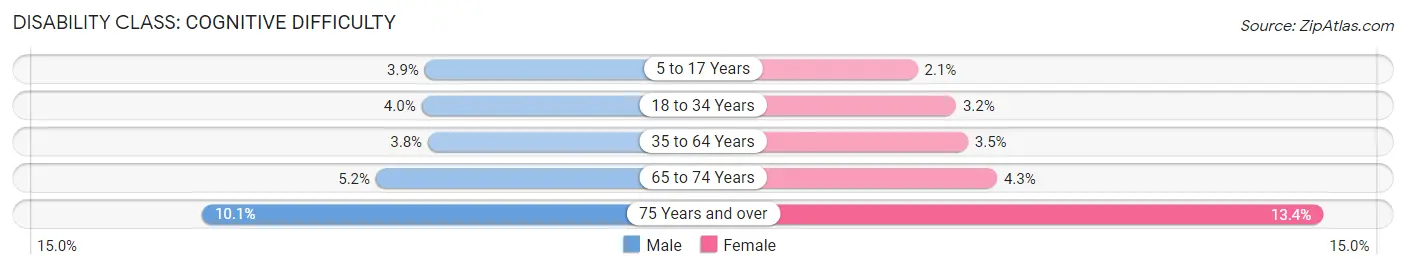
| Age Bracket | Male | Female |
| 5 to 17 Years | 16,167 (3.9%) | 8,506 (2.1%) |
| 18 to 34 Years | 25,299 (4.0%) | 20,584 (3.2%) |
| 35 to 64 Years | 37,238 (3.8%) | 35,496 (3.5%) |
| 65 to 74 Years | 10,865 (5.2%) | 10,731 (4.3%) |
| 75 Years and over | 12,323 (10.1%) | 25,918 (13.4%) |
Disability Class: Ambulatory Difficulty
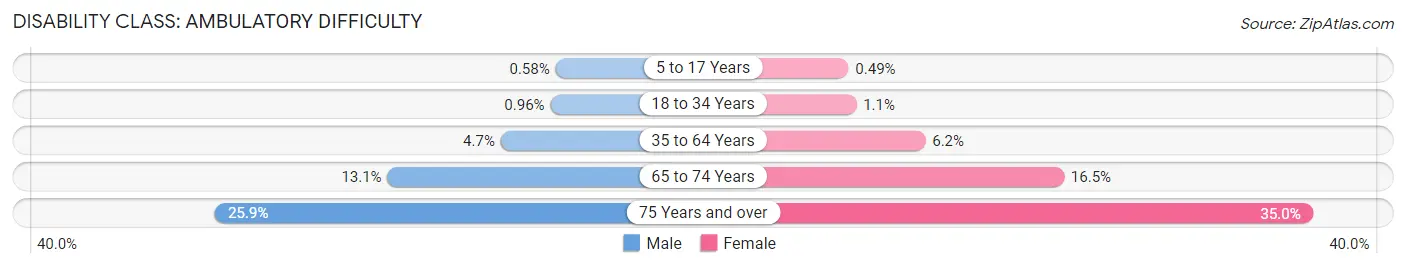
| Age Bracket | Male | Female |
| 5 to 17 Years | 2,422 (0.6%) | 1,971 (0.5%) |
| 18 to 34 Years | 6,161 (1.0%) | 6,935 (1.1%) |
| 35 to 64 Years | 45,857 (4.6%) | 62,756 (6.2%) |
| 65 to 74 Years | 27,167 (13.1%) | 40,968 (16.5%) |
| 75 Years and over | 31,670 (25.9%) | 67,594 (34.9%) |
Disability Class: Self-Care Difficulty
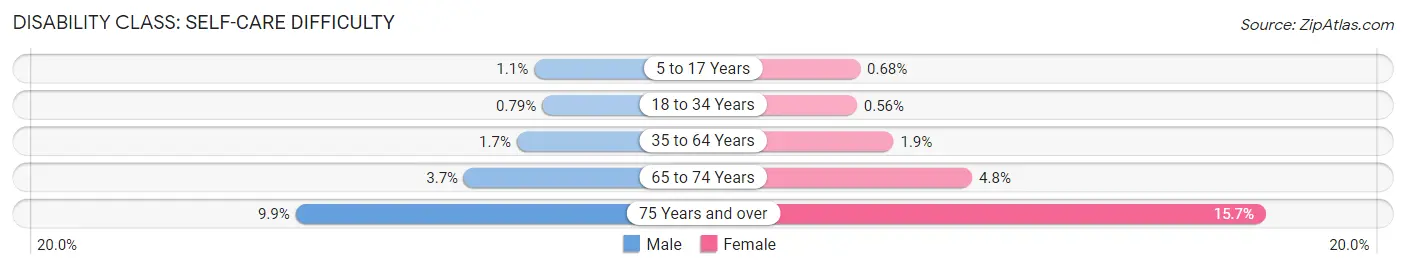
| Age Bracket | Male | Female |
| 5 to 17 Years | 4,577 (1.1%) | 2,736 (0.7%) |
| 18 to 34 Years | 5,065 (0.8%) | 3,622 (0.6%) |
| 35 to 64 Years | 17,067 (1.7%) | 19,473 (1.9%) |
| 65 to 74 Years | 7,672 (3.7%) | 12,027 (4.8%) |
| 75 Years and over | 12,174 (9.9%) | 30,429 (15.7%) |
Technology Access in Cook County
Computing Device Access in Cook County
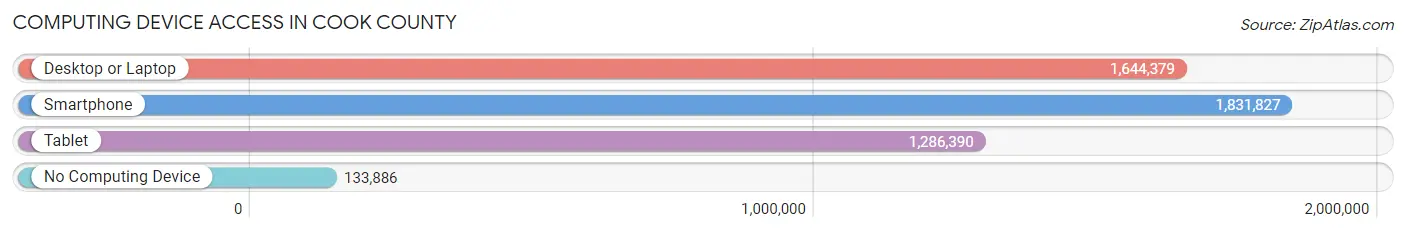
| Device Type | # Households | % Households |
| Desktop or Laptop | 1,644,379 | 79.6% |
| Smartphone | 1,831,827 | 88.6% |
| Tablet | 1,286,390 | 62.3% |
| No Computing Device | 133,886 | 6.5% |
| Total | 2,066,248 | 100.0% |
Internet Access in Cook County
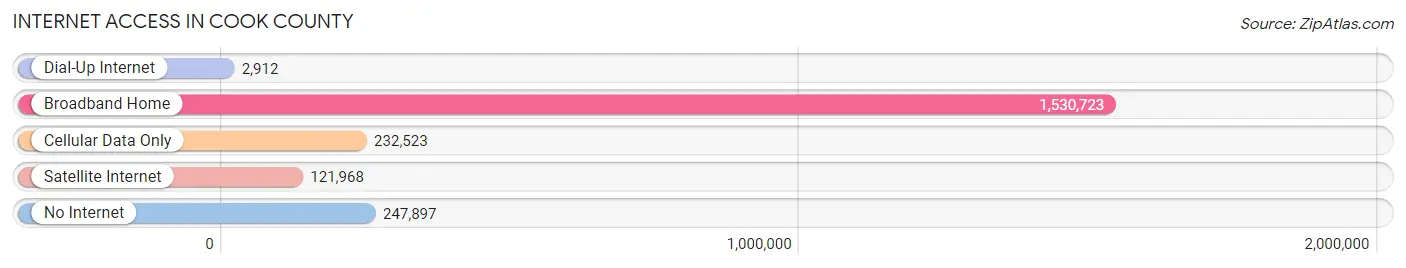
| Internet Type | # Households | % Households |
| Dial-Up Internet | 2,912 | 0.1% |
| Broadband Home | 1,530,723 | 74.1% |
| Cellular Data Only | 232,523 | 11.3% |
| Satellite Internet | 121,968 | 5.9% |
| No Internet | 247,897 | 12.0% |
| Total | 2,066,248 | 100.0% |
Cook County Summary
Cook County, Illinois is the second most populous county in the United States, with a population of 5,238,216 as of the 2010 census. It is located in the northeastern corner of the state, and is bordered by Lake Michigan to the east, Wisconsin to the north, and Indiana to the south. The county seat is Chicago, the largest city in the state and the third largest city in the United States. Cook County is home to a diverse population, with a variety of ethnicities, religions, and cultures represented.
History
Cook County was established in 1831, and was named after Daniel Pope Cook, an early Illinois politician. The county was originally part of the Northwest Territory, and was later part of the Indiana Territory before becoming part of the Illinois Territory in 1809. The county was initially divided into six townships, and the city of Chicago was incorporated in 1837.
In the mid-19th century, Cook County was a major destination for immigrants from Europe, particularly from Germany, Ireland, and Scandinavia. The population of the county grew rapidly, and by the turn of the century, it was the most populous county in the United States.
Geography
Cook County covers an area of 1,635 square miles, making it the largest county in Illinois. It is located in the northeastern corner of the state, and is bordered by Lake Michigan to the east, Wisconsin to the north, and Indiana to the south. The county is divided into five distinct regions: the North Shore, the South Shore, the West Side, the Far South Side, and the Far West Side.
The North Shore is home to affluent suburbs such as Evanston, Wilmette, and Winnetka. The South Shore is home to the city of Chicago, as well as numerous suburbs such as Oak Lawn, Orland Park, and Tinley Park. The West Side is home to the city of Chicago, as well as numerous suburbs such as Cicero, Berwyn, and Oak Park. The Far South Side is home to the city of Chicago, as well as numerous suburbs such as Calumet City, Harvey, and Dolton. The Far West Side is home to the city of Chicago, as well as numerous suburbs such as Aurora, Naperville, and Bolingbrook.
Economy
Cook County is home to a diverse economy, with a variety of industries represented. The county is home to numerous Fortune 500 companies, including Boeing, McDonald’s, and Walgreens. The county is also home to a number of major universities, including the University of Chicago, Northwestern University, and the Illinois Institute of Technology.
The county is also home to a number of major tourist attractions, including the Museum of Science and Industry, the Art Institute of Chicago, and the Shedd Aquarium. The county is also home to a number of major sports teams, including the Chicago Bears, the Chicago Bulls, and the Chicago Cubs.
Demographics
As of the 2010 census, the population of Cook County was 5,238,216. The population is racially and ethnically diverse, with a variety of ethnicities, religions, and cultures represented. The largest racial group is White, making up 54.3% of the population. African Americans make up 25.6% of the population, while Hispanics make up 15.2%. Asians make up 5.3% of the population, while Native Americans make up 0.3%.
The median household income in Cook County is $54,828, and the median family income is $66,945. The poverty rate is 13.3%, and the unemployment rate is 8.2%. The county is home to a number of major employers, including the University of Chicago, Northwestern University, and the Illinois Institute of Technology.
Common Questions
What is Per Capita Income in Cook County?
Per Capita income in Cook County is $45,646.
What is the Median Family Income in Cook County?
Median Family Income in Cook County is $97,520.
What is the Median Household income in Cook County?
Median Household Income in Cook County is $78,304.
What is Income or Wage Gap in Cook County?
Income or Wage Gap in Cook County is 22.6%.
Women in Cook County earn 77.4 cents for every dollar earned by a man.
What is Family Income Deficit in Cook County?
Family Income Deficit in Cook County is $11,452.
Families that are below poverty line in Cook County earn $11,452 less on average than the poverty threshold level.
What is Inequality or Gini Index in Cook County?
Inequality or Gini Index in Cook County is 0.50.
What is the Total Population of Cook County?
Total Population of Cook County is 5,225,367.
What is the Total Male Population of Cook County?
Total Male Population of Cook County is 2,554,641.
What is the Total Female Population of Cook County?
Total Female Population of Cook County is 2,670,726.
What is the Ratio of Males per 100 Females in Cook County?
There are 95.65 Males per 100 Females in Cook County.
What is the Ratio of Females per 100 Males in Cook County?
There are 104.54 Females per 100 Males in Cook County.
What is the Median Population Age in Cook County?
Median Population Age in Cook County is 37.5 Years.
What is the Average Family Size in Cook County
Average Family Size in Cook County is 3.3 People.
What is the Average Household Size in Cook County
Average Household Size in Cook County is 2.5 People.
How Large is the Labor Force in Cook County?
There are 2,801,266 People in the Labor Forcein in Cook County.
What is the Percentage of People in the Labor Force in Cook County?
66.2% of People are in the Labor Force in Cook County.
What is the Unemployment Rate in Cook County?
Unemployment Rate in Cook County is 7.1%.