Krum, TX Map & Demographics
Krum Map
Krum Overview
$36,874
PER CAPITA INCOME
$110,094
AVG FAMILY INCOME
$105,366
AVG HOUSEHOLD INCOME
24.0%
WAGE / INCOME GAP [ % ]
76.0¢/ $1
WAGE / INCOME GAP [ $ ]
0.34
INEQUALITY / GINI INDEX
5,627
TOTAL POPULATION
2,713
MALE POPULATION
2,914
FEMALE POPULATION
93.10
MALES / 100 FEMALES
107.41
FEMALES / 100 MALES
35.0
MEDIAN AGE
3.4
AVG FAMILY SIZE
3.0
AVG HOUSEHOLD SIZE
3,025
LABOR FORCE [ PEOPLE ]
72.6%
PERCENT IN LABOR FORCE
1.5%
UNEMPLOYMENT RATE
Krum Zip Codes
Krum Area Codes
Income in Krum
Income Overview in Krum
Per Capita Income in Krum is $36,874, while median incomes of families and households are $110,094 and $105,366 respectively.
| Characteristic | Number | Measure |
| Per Capita Income | 5,627 | $36,874 |
| Median Family Income | 1,398 | $110,094 |
| Mean Family Income | 1,398 | $115,218 |
| Median Household Income | 1,869 | $105,366 |
| Mean Household Income | 1,869 | $107,145 |
| Income Deficit | 1,398 | $0 |
| Wage / Income Gap (%) | 5,627 | 24.02% |
| Wage / Income Gap ($) | 5,627 | 75.98¢ per $1 |
| Gini / Inequality Index | 5,627 | 0.34 |
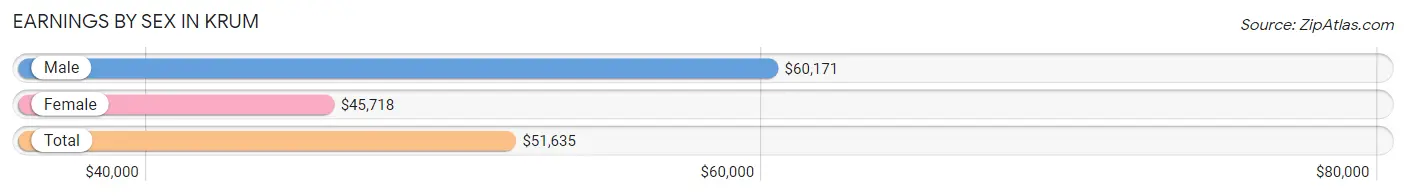
Earnings by Sex in Krum
Average Earnings in Krum are $51,635, $60,171 for men and $45,718 for women, a difference of 24.0%.
| Sex | Number | Average Earnings |
| Male | 1,700 (54.6%) | $60,171 |
| Female | 1,416 (45.4%) | $45,718 |
| Total | 3,116 (100.0%) | $51,635 |
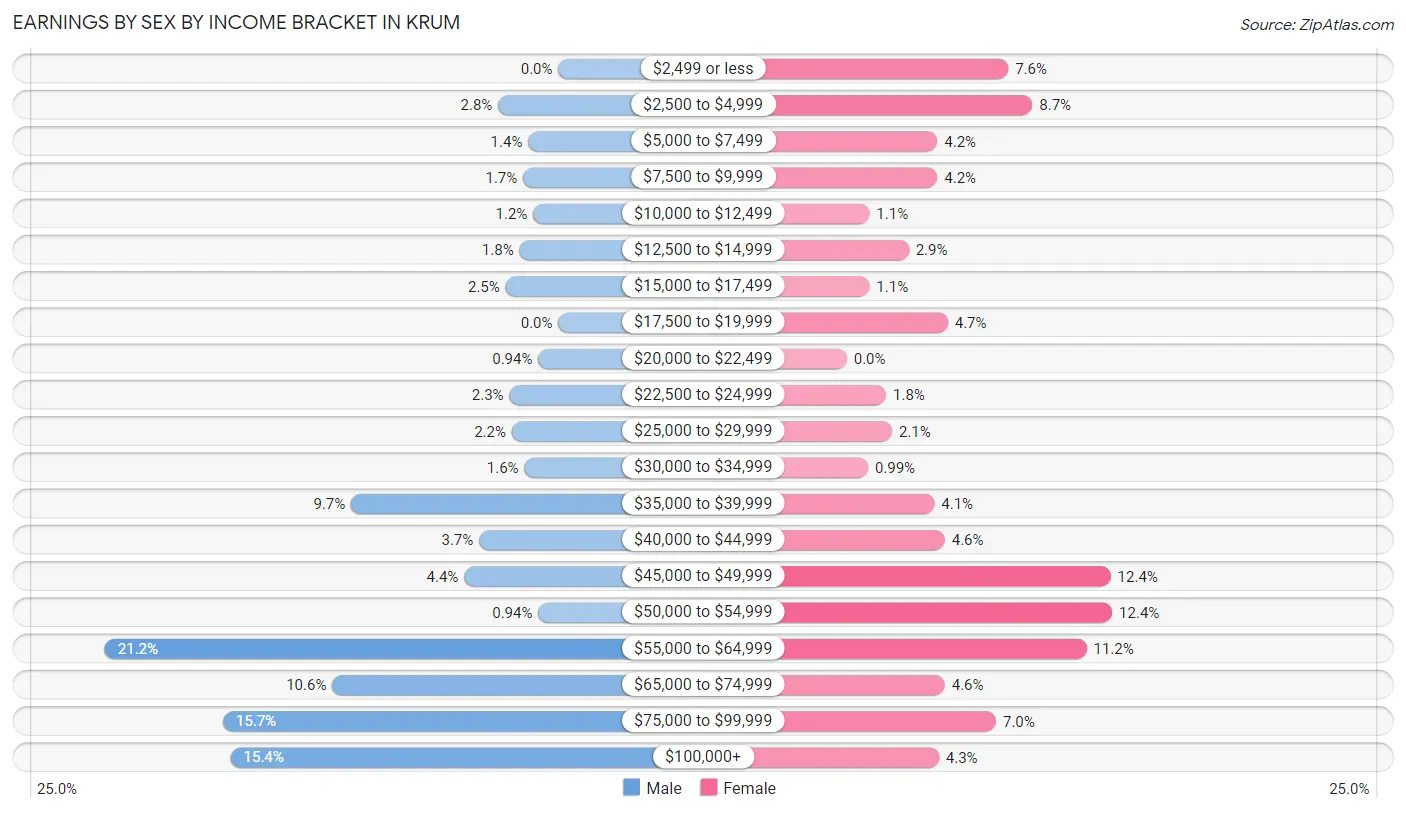
Earnings by Sex by Income Bracket in Krum
The most common earnings brackets in Krum are $55,000 to $64,999 for men (361 | 21.2%) and $50,000 to $54,999 for women (176 | 12.4%).
| Income | Male | Female |
| $2,499 or less | 0 (0.0%) | 107 (7.6%) |
| $2,500 to $4,999 | 48 (2.8%) | 123 (8.7%) |
| $5,000 to $7,499 | 24 (1.4%) | 60 (4.2%) |
| $7,500 to $9,999 | 28 (1.7%) | 60 (4.2%) |
| $10,000 to $12,499 | 20 (1.2%) | 15 (1.1%) |
| $12,500 to $14,999 | 31 (1.8%) | 41 (2.9%) |
| $15,000 to $17,499 | 42 (2.5%) | 15 (1.1%) |
| $17,500 to $19,999 | 0 (0.0%) | 67 (4.7%) |
| $20,000 to $22,499 | 16 (0.9%) | 0 (0.0%) |
| $22,500 to $24,999 | 39 (2.3%) | 26 (1.8%) |
| $25,000 to $29,999 | 37 (2.2%) | 30 (2.1%) |
| $30,000 to $34,999 | 27 (1.6%) | 14 (1.0%) |
| $35,000 to $39,999 | 165 (9.7%) | 58 (4.1%) |
| $40,000 to $44,999 | 63 (3.7%) | 65 (4.6%) |
| $45,000 to $49,999 | 75 (4.4%) | 175 (12.4%) |
| $50,000 to $54,999 | 16 (0.9%) | 176 (12.4%) |
| $55,000 to $64,999 | 361 (21.2%) | 159 (11.2%) |
| $65,000 to $74,999 | 180 (10.6%) | 65 (4.6%) |
| $75,000 to $99,999 | 267 (15.7%) | 99 (7.0%) |
| $100,000+ | 261 (15.3%) | 61 (4.3%) |
| Total | 1,700 (100.0%) | 1,416 (100.0%) |
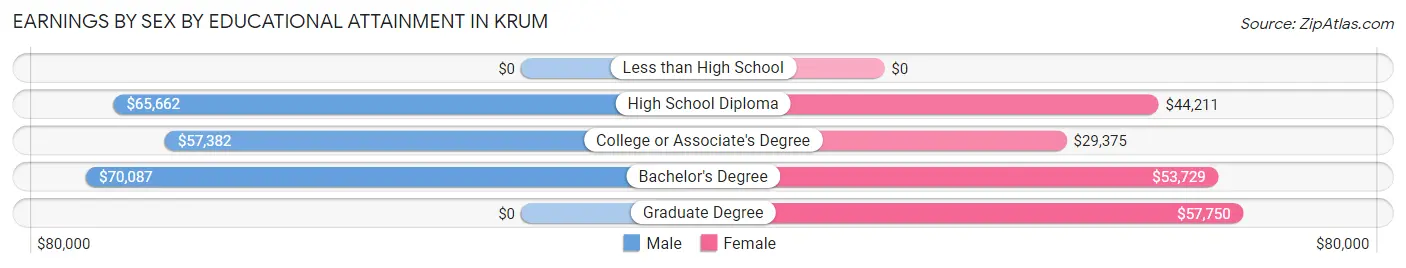
Earnings by Sex by Educational Attainment in Krum
Average earnings in Krum are $61,432 for men and $48,164 for women, a difference of 21.6%. Men with an educational attainment of bachelor's degree enjoy the highest average annual earnings of $70,087, while those with college or associate's degree education earn the least with $57,382. Women with an educational attainment of graduate degree earn the most with the average annual earnings of $57,750, while those with college or associate's degree education have the smallest earnings of $29,375.
| Educational Attainment | Male Income | Female Income |
| Less than High School | - | - |
| High School Diploma | $65,662 | $44,211 |
| College or Associate's Degree | $57,382 | $29,375 |
| Bachelor's Degree | $70,087 | $53,729 |
| Graduate Degree | - | - |
| Total | $61,432 | $48,164 |
Family Income in Krum
Family Income Brackets in Krum
According to the Krum family income data, there are 491 families falling into the $100,000 to $149,999 income range, which is the most common income bracket and makes up 35.1% of all families.
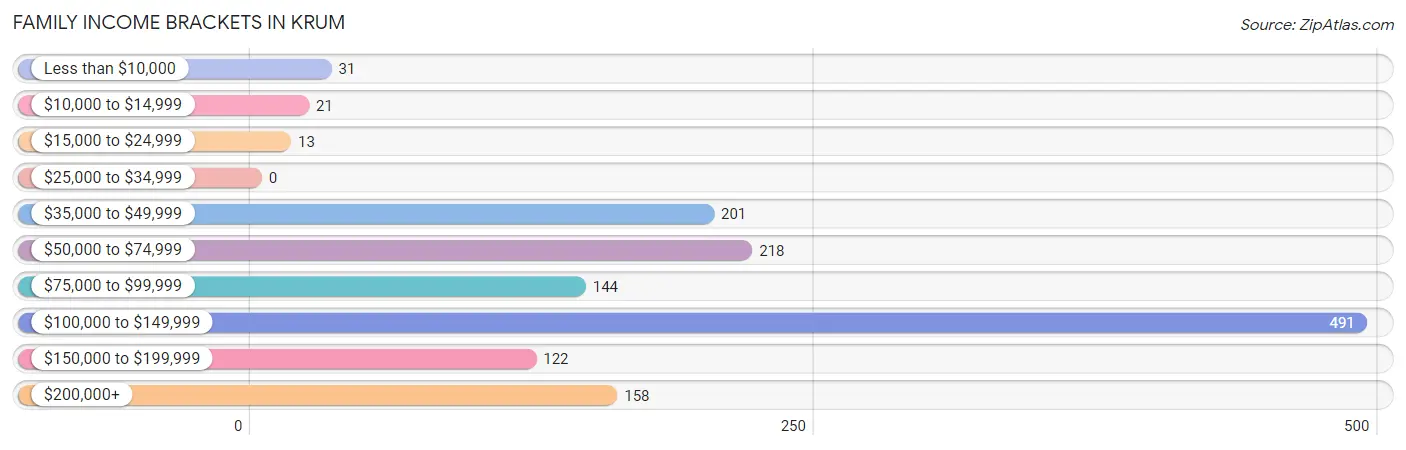
| Income Bracket | # Families | % Families |
| Less than $10,000 | 31 | 2.2% |
| $10,000 to $14,999 | 21 | 1.5% |
| $15,000 to $24,999 | 13 | 0.9% |
| $25,000 to $34,999 | 0 | 0.0% |
| $35,000 to $49,999 | 201 | 14.4% |
| $50,000 to $74,999 | 218 | 15.6% |
| $75,000 to $99,999 | 144 | 10.3% |
| $100,000 to $149,999 | 491 | 35.1% |
| $150,000 to $199,999 | 122 | 8.7% |
| $200,000+ | 158 | 11.3% |
Family Income by Famaliy Size in Krum
4-person families (216 | 15.4%) account for the highest median family income in Krum with $131,125 per family, while 2-person families (504 | 36.0%) have the highest median income of $43,140 per family member.
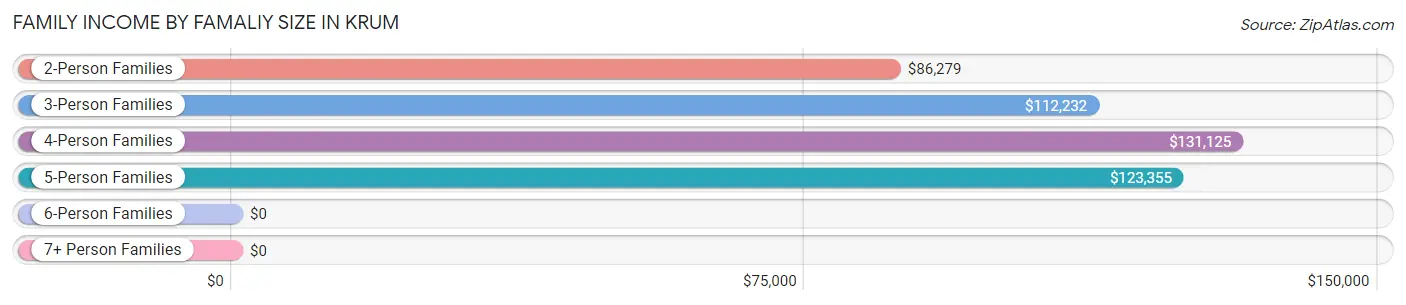
| Income Bracket | # Families | Median Income |
| 2-Person Families | 504 (36.0%) | $86,279 |
| 3-Person Families | 358 (25.6%) | $112,232 |
| 4-Person Families | 216 (15.4%) | $131,125 |
| 5-Person Families | 183 (13.1%) | $123,355 |
| 6-Person Families | 129 (9.2%) | $0 |
| 7+ Person Families | 8 (0.6%) | $0 |
| Total | 1,398 (100.0%) | $110,094 |
Family Income by Number of Earners in Krum
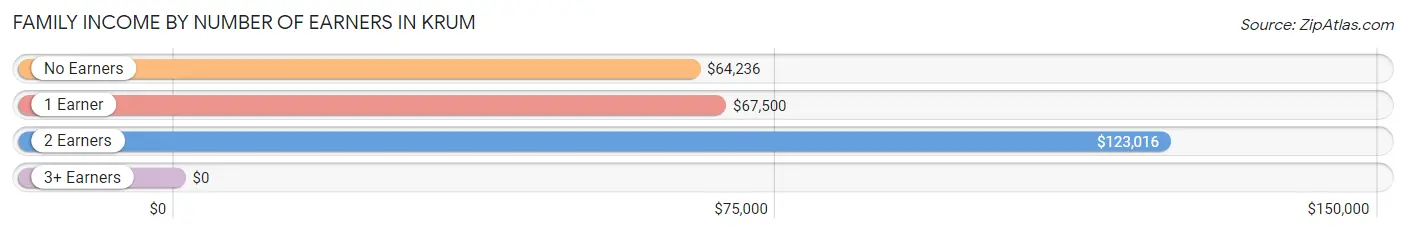
| Number of Earners | # Families | Median Income |
| No Earners | 67 (4.8%) | $64,236 |
| 1 Earner | 492 (35.2%) | $67,500 |
| 2 Earners | 619 (44.3%) | $123,016 |
| 3+ Earners | 220 (15.7%) | $0 |
| Total | 1,398 (100.0%) | $110,094 |
Household Income in Krum
Household Income Brackets in Krum
With 703 households falling in the category, the $100,000 to $149,999 income range is the most frequent in Krum, accounting for 37.6% of all households. In contrast, only 13 households (0.7%) fall into the $15,000 to $24,999 income bracket, making it the least populous group.
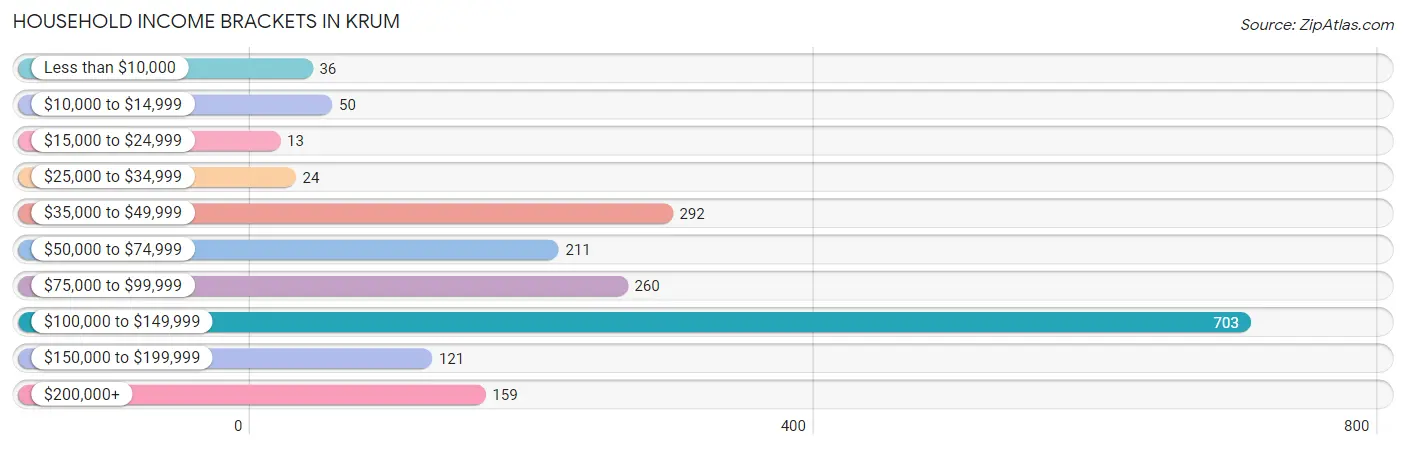
| Income Bracket | # Households | % Households |
| Less than $10,000 | 36 | 1.9% |
| $10,000 to $14,999 | 50 | 2.7% |
| $15,000 to $24,999 | 13 | 0.7% |
| $25,000 to $34,999 | 24 | 1.3% |
| $35,000 to $49,999 | 292 | 15.6% |
| $50,000 to $74,999 | 211 | 11.3% |
| $75,000 to $99,999 | 260 | 13.9% |
| $100,000 to $149,999 | 703 | 37.6% |
| $150,000 to $199,999 | 121 | 6.5% |
| $200,000+ | 159 | 8.5% |
Household Income by Householder Age in Krum
The median household income in Krum is $105,366, with the highest median household income of $116,250 found in the 45 to 64 years age bracket for the primary householder. A total of 571 households (30.5%) fall into this category. Meanwhile, the 15 to 24 years age bracket for the primary householder has the lowest median household income of $0, with 36 households (1.9%) in this group.
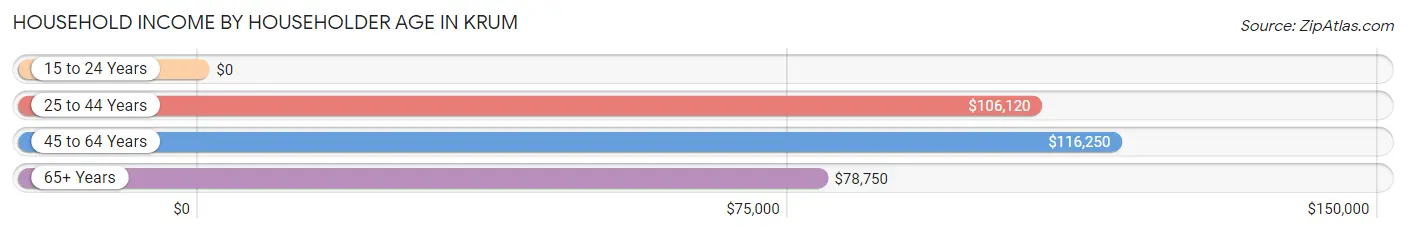
| Income Bracket | # Households | Median Income |
| 15 to 24 Years | 36 (1.9%) | $0 |
| 25 to 44 Years | 931 (49.8%) | $106,120 |
| 45 to 64 Years | 571 (30.5%) | $116,250 |
| 65+ Years | 331 (17.7%) | $78,750 |
| Total | 1,869 (100.0%) | $105,366 |
Poverty in Krum
Income Below Poverty by Sex and Age in Krum
With 6.8% poverty level for males and 7.3% for females among the residents of Krum, under 5 year old males and 5 year old females are the most vulnerable to poverty, with 85 males (32.7%) and 20 females (71.4%) in their respective age groups living below the poverty level.
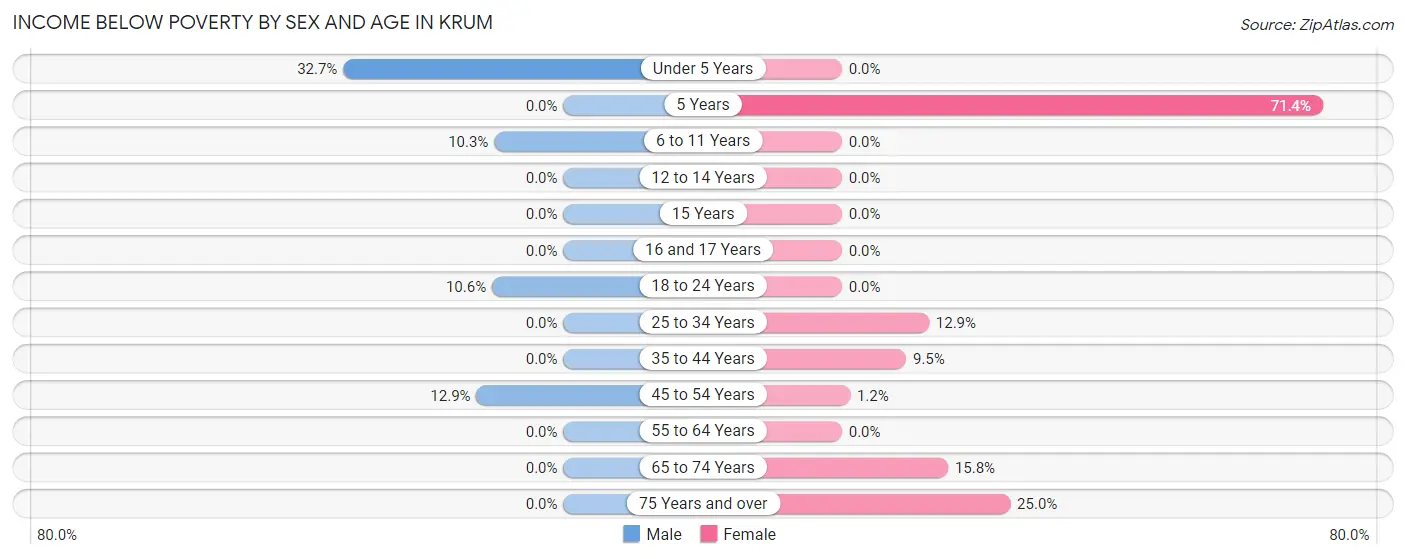
| Age Bracket | Male | Female |
| Under 5 Years | 85 (32.7%) | 0 (0.0%) |
| 5 Years | 0 (0.0%) | 20 (71.4%) |
| 6 to 11 Years | 23 (10.3%) | 0 (0.0%) |
| 12 to 14 Years | 0 (0.0%) | 0 (0.0%) |
| 15 Years | 0 (0.0%) | 0 (0.0%) |
| 16 and 17 Years | 0 (0.0%) | 0 (0.0%) |
| 18 to 24 Years | 16 (10.6%) | 0 (0.0%) |
| 25 to 34 Years | 0 (0.0%) | 53 (12.9%) |
| 35 to 44 Years | 0 (0.0%) | 56 (9.5%) |
| 45 to 54 Years | 59 (12.9%) | 3 (1.2%) |
| 55 to 64 Years | 0 (0.0%) | 0 (0.0%) |
| 65 to 74 Years | 0 (0.0%) | 32 (15.8%) |
| 75 Years and over | 0 (0.0%) | 49 (25.0%) |
| Total | 183 (6.8%) | 213 (7.3%) |
Income Above Poverty by Sex and Age in Krum
According to the poverty statistics in Krum, males aged 5 years and females aged under 5 years are the age groups that are most secure financially, with 100.0% of males and 100.0% of females in these age groups living above the poverty line.
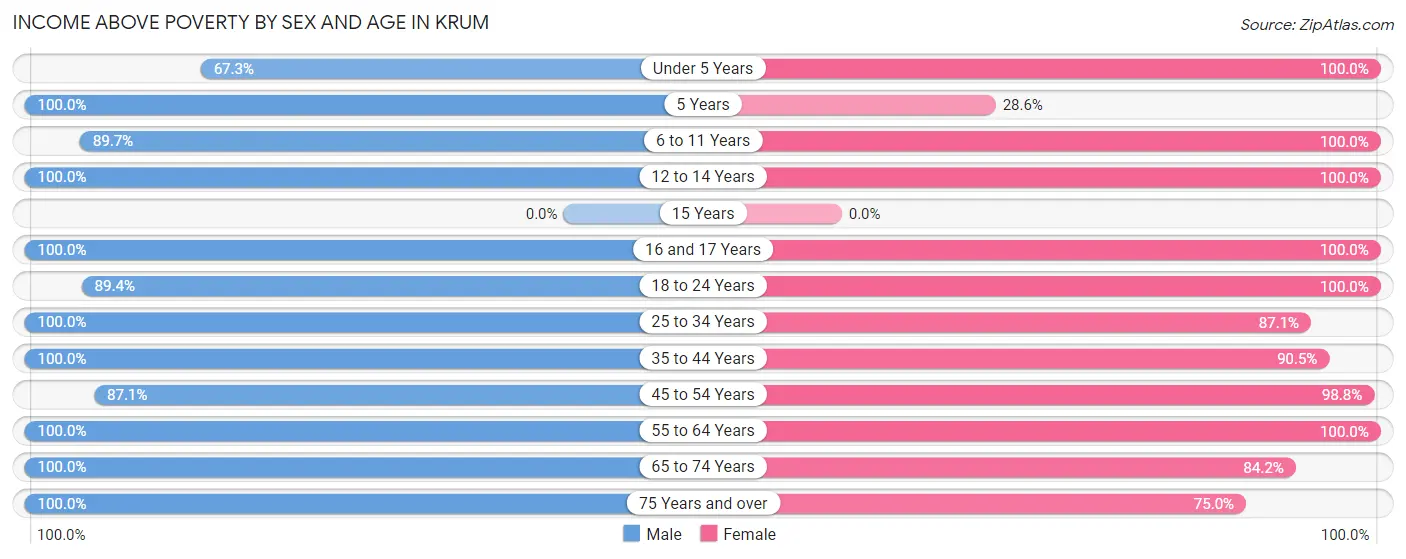
| Age Bracket | Male | Female |
| Under 5 Years | 175 (67.3%) | 177 (100.0%) |
| 5 Years | 31 (100.0%) | 8 (28.6%) |
| 6 to 11 Years | 201 (89.7%) | 393 (100.0%) |
| 12 to 14 Years | 135 (100.0%) | 213 (100.0%) |
| 15 Years | 0 (0.0%) | 0 (0.0%) |
| 16 and 17 Years | 154 (100.0%) | 52 (100.0%) |
| 18 to 24 Years | 135 (89.4%) | 186 (100.0%) |
| 25 to 34 Years | 398 (100.0%) | 357 (87.1%) |
| 35 to 44 Years | 536 (100.0%) | 531 (90.5%) |
| 45 to 54 Years | 398 (87.1%) | 245 (98.8%) |
| 55 to 64 Years | 242 (100.0%) | 221 (100.0%) |
| 65 to 74 Years | 71 (100.0%) | 171 (84.2%) |
| 75 Years and over | 54 (100.0%) | 147 (75.0%) |
| Total | 2,530 (93.2%) | 2,701 (92.7%) |
Income Below Poverty Among Married-Couple Families in Krum
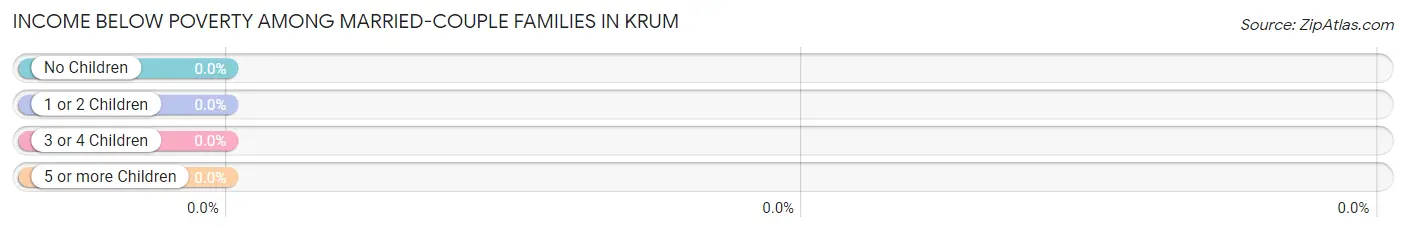
| Children | Above Poverty | Below Poverty |
| No Children | 428 (100.0%) | 0 (0.0%) |
| 1 or 2 Children | 381 (100.0%) | 0 (0.0%) |
| 3 or 4 Children | 119 (100.0%) | 0 (0.0%) |
| 5 or more Children | 0 (0.0%) | 0 (0.0%) |
| Total | 928 (100.0%) | 0 (0.0%) |
Income Below Poverty Among Single-Parent Households in Krum
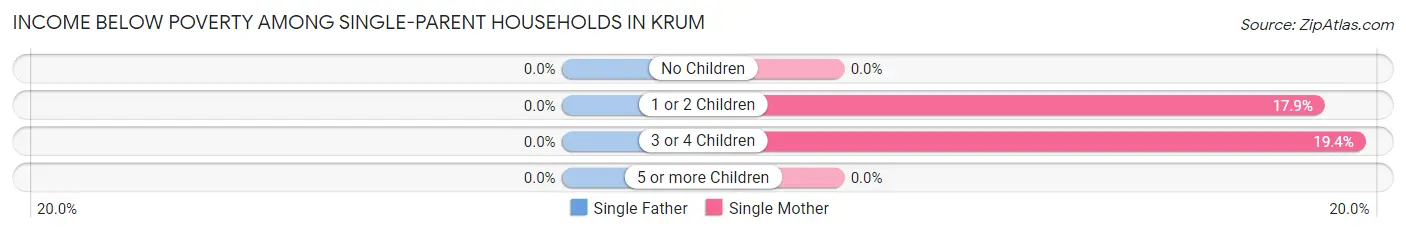
| Children | Single Father | Single Mother |
| No Children | 0 (0.0%) | 0 (0.0%) |
| 1 or 2 Children | 0 (0.0%) | 31 (17.9%) |
| 3 or 4 Children | 0 (0.0%) | 21 (19.4%) |
| 5 or more Children | 0 (0.0%) | 0 (0.0%) |
| Total | 0 (0.0%) | 52 (14.6%) |
Income Below Poverty Among Married-Couple vs Single-Parent Households in Krum
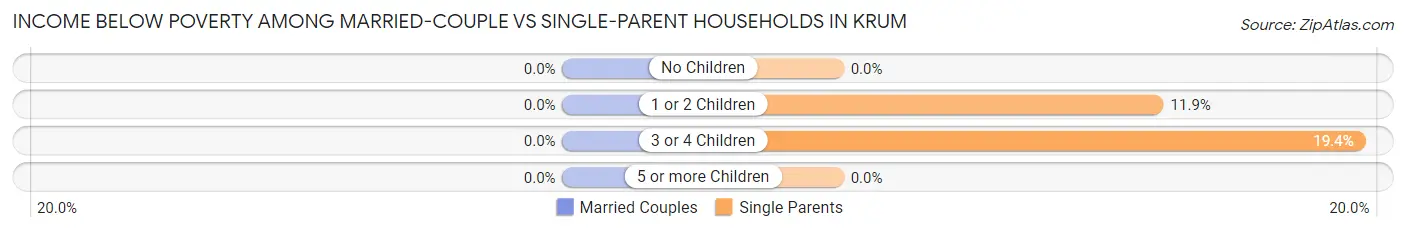
| Children | Married-Couple Families | Single-Parent Households |
| No Children | 0 (0.0%) | 0 (0.0%) |
| 1 or 2 Children | 0 (0.0%) | 31 (11.9%) |
| 3 or 4 Children | 0 (0.0%) | 21 (19.4%) |
| 5 or more Children | 0 (0.0%) | 0 (0.0%) |
| Total | 0 (0.0%) | 52 (11.1%) |
Race in Krum
The most populous races in Krum are White / Caucasian (4,853 | 86.2%), Two or more Races (421 | 7.5%), and Hispanic or Latino (266 | 4.7%).
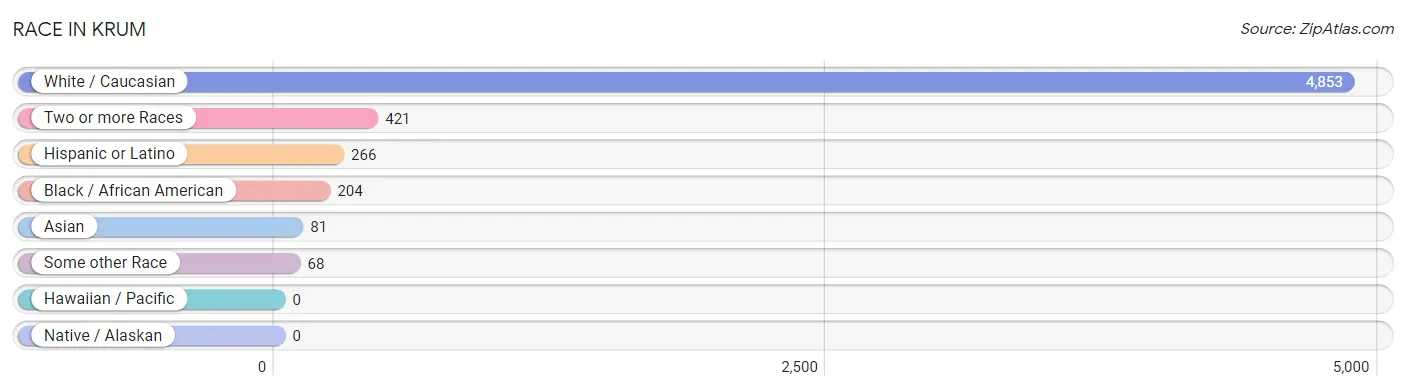
| Race | # Population | % Population |
| Asian | 81 | 1.4% |
| Black / African American | 204 | 3.6% |
| Hawaiian / Pacific | 0 | 0.0% |
| Hispanic or Latino | 266 | 4.7% |
| Native / Alaskan | 0 | 0.0% |
| White / Caucasian | 4,853 | 86.2% |
| Two or more Races | 421 | 7.5% |
| Some other Race | 68 | 1.2% |
| Total | 5,627 | 100.0% |
Ancestry in Krum
The most populous ancestries reported in Krum are German (1,177 | 20.9%), English (1,092 | 19.4%), Irish (546 | 9.7%), Scottish (261 | 4.6%), and Mexican (195 | 3.5%), together accounting for 58.1% of all Krum residents.
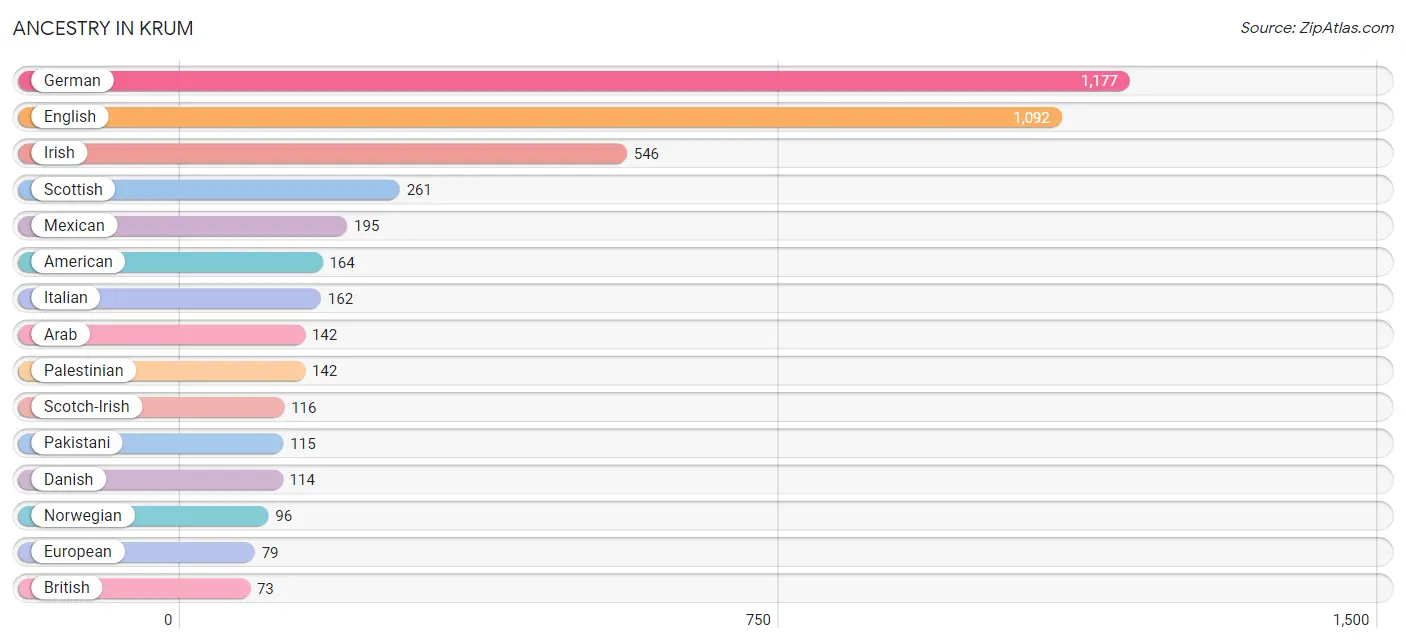
| Ancestry | # Population | % Population |
| American | 164 | 2.9% |
| Arab | 142 | 2.5% |
| Bhutanese | 1 | 0.0% |
| Blackfeet | 19 | 0.3% |
| British | 73 | 1.3% |
| Burmese | 23 | 0.4% |
| Central American | 10 | 0.2% |
| Cherokee | 45 | 0.8% |
| Choctaw | 10 | 0.2% |
| Cuban | 8 | 0.1% |
| Czech | 27 | 0.5% |
| Czechoslovakian | 13 | 0.2% |
| Danish | 114 | 2.0% |
| English | 1,092 | 19.4% |
| European | 79 | 1.4% |
| German | 1,177 | 20.9% |
| Guatemalan | 10 | 0.2% |
| Indian (Asian) | 65 | 1.2% |
| Iranian | 19 | 0.3% |
| Irish | 546 | 9.7% |
| Italian | 162 | 2.9% |
| Mexican | 195 | 3.5% |
| Mongolian | 21 | 0.4% |
| Northern European | 31 | 0.5% |
| Norwegian | 96 | 1.7% |
| Pakistani | 115 | 2.0% |
| Palestinian | 142 | 2.5% |
| Polish | 20 | 0.4% |
| Scandinavian | 20 | 0.4% |
| Scotch-Irish | 116 | 2.1% |
| Scottish | 261 | 4.6% |
| Spanish | 53 | 0.9% |
| Swedish | 23 | 0.4% |
| Welsh | 41 | 0.7% |
| Yugoslavian | 26 | 0.5% | View All 35 Rows |
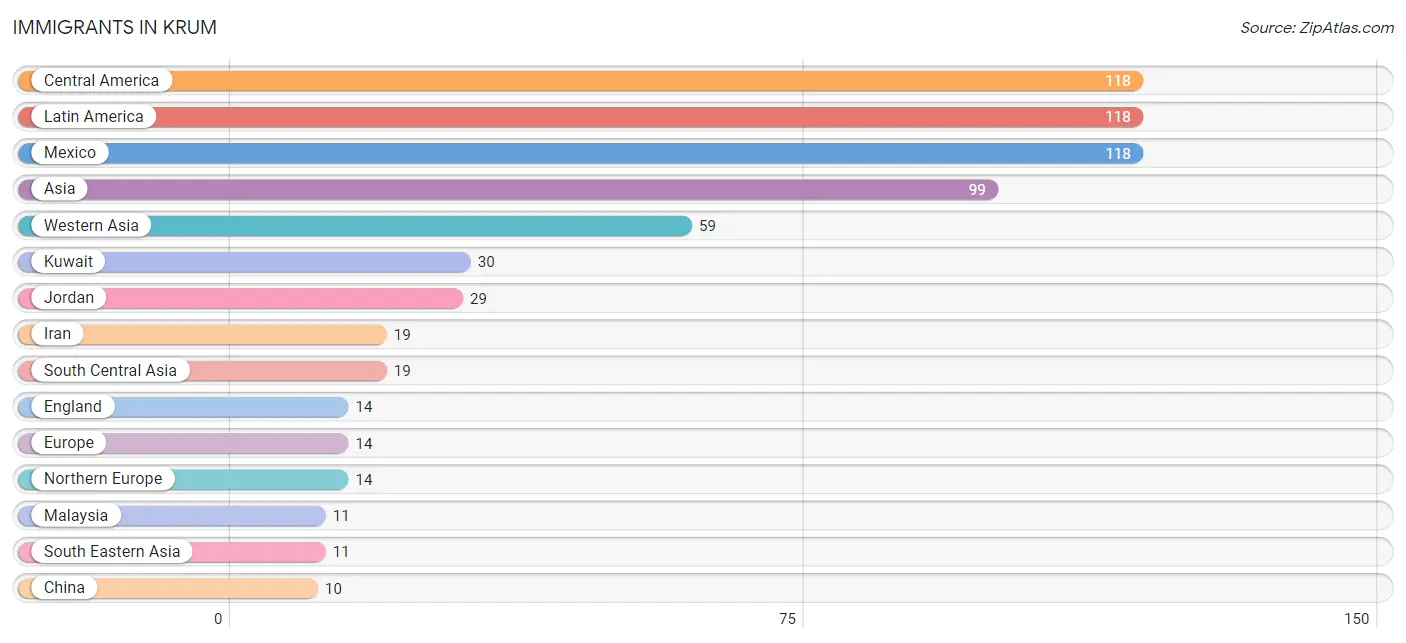
Immigrants in Krum
The most numerous immigrant groups reported in Krum came from Central America (118 | 2.1%), Latin America (118 | 2.1%), Mexico (118 | 2.1%), Asia (99 | 1.8%), and Western Asia (59 | 1.1%), together accounting for 9.1% of all Krum residents.
| Immigration Origin | # Population | % Population |
| Asia | 99 | 1.8% |
| Central America | 118 | 2.1% |
| China | 10 | 0.2% |
| Eastern Asia | 10 | 0.2% |
| England | 14 | 0.3% |
| Europe | 14 | 0.3% |
| Iran | 19 | 0.3% |
| Jordan | 29 | 0.5% |
| Kuwait | 30 | 0.5% |
| Latin America | 118 | 2.1% |
| Malaysia | 11 | 0.2% |
| Mexico | 118 | 2.1% |
| Northern Europe | 14 | 0.3% |
| South Central Asia | 19 | 0.3% |
| South Eastern Asia | 11 | 0.2% |
| Western Asia | 59 | 1.1% | View All 16 Rows |
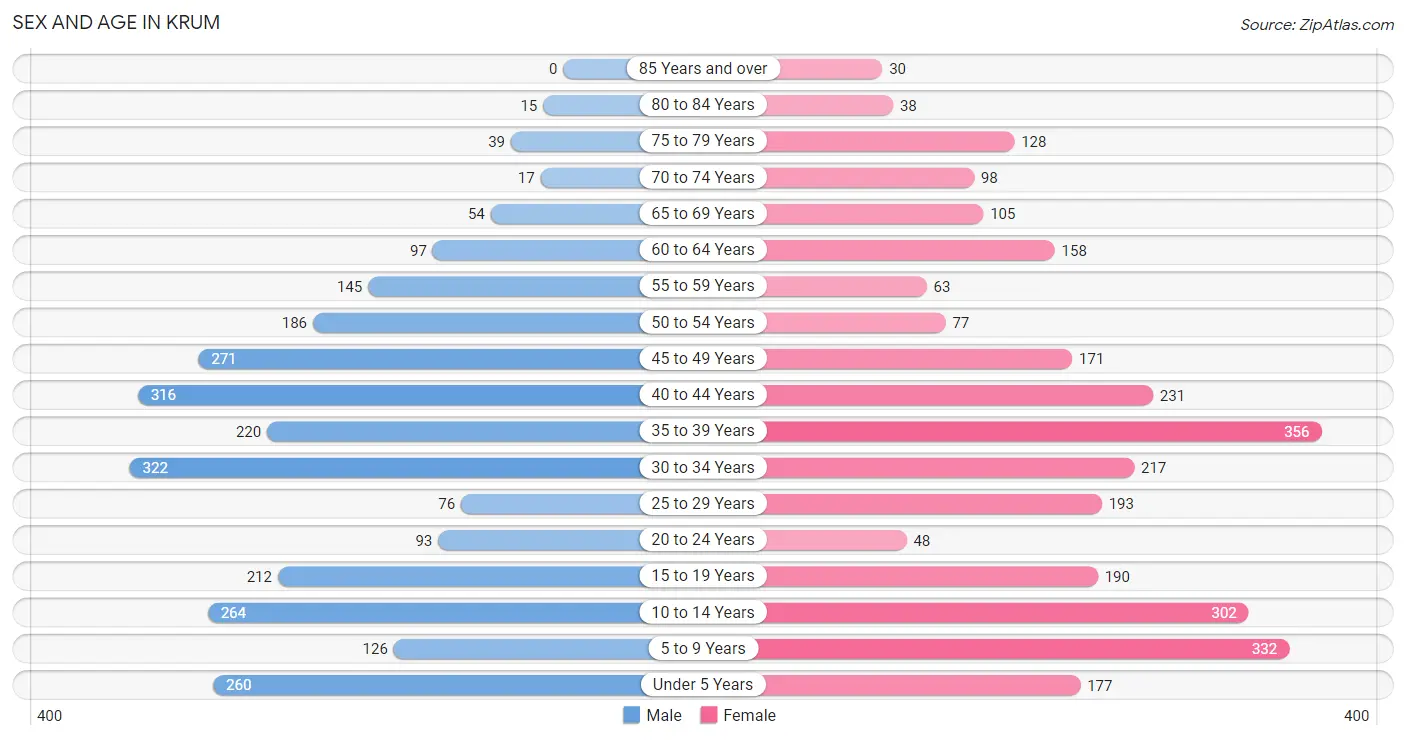
Sex and Age in Krum
Sex and Age in Krum
The most populous age groups in Krum are 30 to 34 Years (322 | 11.9%) for men and 35 to 39 Years (356 | 12.2%) for women.
| Age Bracket | Male | Female |
| Under 5 Years | 260 (9.6%) | 177 (6.1%) |
| 5 to 9 Years | 126 (4.6%) | 332 (11.4%) |
| 10 to 14 Years | 264 (9.7%) | 302 (10.4%) |
| 15 to 19 Years | 212 (7.8%) | 190 (6.5%) |
| 20 to 24 Years | 93 (3.4%) | 48 (1.7%) |
| 25 to 29 Years | 76 (2.8%) | 193 (6.6%) |
| 30 to 34 Years | 322 (11.9%) | 217 (7.4%) |
| 35 to 39 Years | 220 (8.1%) | 356 (12.2%) |
| 40 to 44 Years | 316 (11.7%) | 231 (7.9%) |
| 45 to 49 Years | 271 (10.0%) | 171 (5.9%) |
| 50 to 54 Years | 186 (6.9%) | 77 (2.6%) |
| 55 to 59 Years | 145 (5.3%) | 63 (2.2%) |
| 60 to 64 Years | 97 (3.6%) | 158 (5.4%) |
| 65 to 69 Years | 54 (2.0%) | 105 (3.6%) |
| 70 to 74 Years | 17 (0.6%) | 98 (3.4%) |
| 75 to 79 Years | 39 (1.4%) | 128 (4.4%) |
| 80 to 84 Years | 15 (0.5%) | 38 (1.3%) |
| 85 Years and over | 0 (0.0%) | 30 (1.0%) |
| Total | 2,713 (100.0%) | 2,914 (100.0%) |
Families and Households in Krum
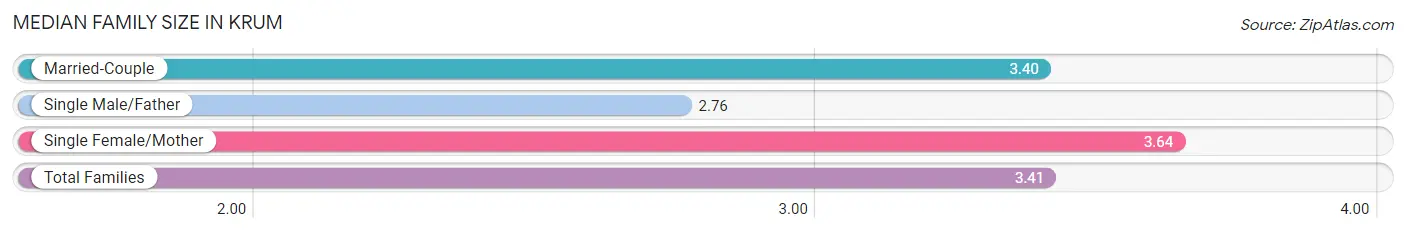
Median Family Size in Krum
The median family size in Krum is 3.41 persons per family, with single female/mother families (355 | 25.4%) accounting for the largest median family size of 3.64 persons per family. On the other hand, single male/father families (115 | 8.2%) represent the smallest median family size with 2.76 persons per family.
| Family Type | # Families | Family Size |
| Married-Couple | 928 (66.4%) | 3.40 |
| Single Male/Father | 115 (8.2%) | 2.76 |
| Single Female/Mother | 355 (25.4%) | 3.64 |
| Total Families | 1,398 (100.0%) | 3.41 |
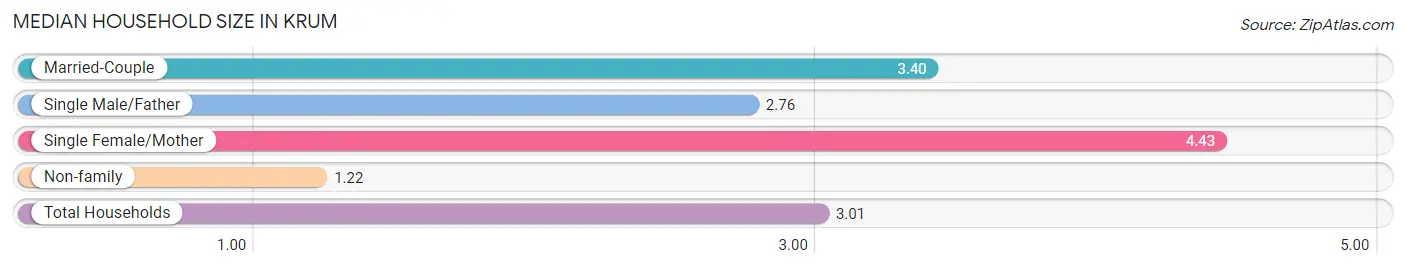
Median Household Size in Krum
The median household size in Krum is 3.01 persons per household, with single female/mother households (355 | 19.0%) accounting for the largest median household size of 4.43 persons per household. non-family households (471 | 25.2%) represent the smallest median household size with 1.22 persons per household.
| Household Type | # Households | Household Size |
| Married-Couple | 928 (49.6%) | 3.40 |
| Single Male/Father | 115 (6.1%) | 2.76 |
| Single Female/Mother | 355 (19.0%) | 4.43 |
| Non-family | 471 (25.2%) | 1.22 |
| Total Households | 1,869 (100.0%) | 3.01 |
Household Size by Marriage Status in Krum
Out of a total of 1,869 households in Krum, 1,398 (74.8%) are family households, while 471 (25.2%) are nonfamily households. The most numerous type of family households are 3-person households, comprising 428, and the most common type of nonfamily households are 1-person households, comprising 409.
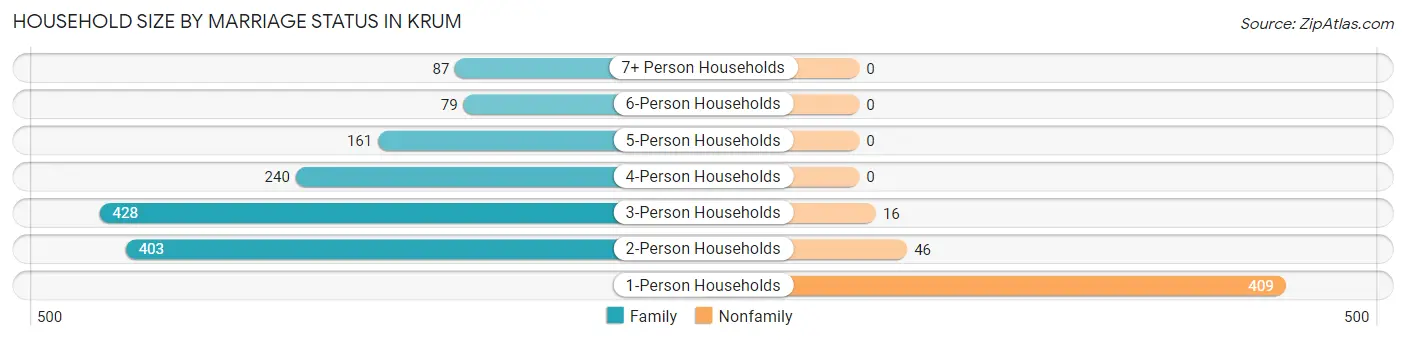
| Household Size | Family Households | Nonfamily Households |
| 1-Person Households | - | 409 (21.9%) |
| 2-Person Households | 403 (21.6%) | 46 (2.5%) |
| 3-Person Households | 428 (22.9%) | 16 (0.9%) |
| 4-Person Households | 240 (12.8%) | 0 (0.0%) |
| 5-Person Households | 161 (8.6%) | 0 (0.0%) |
| 6-Person Households | 79 (4.2%) | 0 (0.0%) |
| 7+ Person Households | 87 (4.6%) | 0 (0.0%) |
| Total | 1,398 (74.8%) | 471 (25.2%) |
Female Fertility in Krum
Fertility by Age in Krum
Average fertility rate in Krum is 11.0 births per 1,000 women. Women in the age bracket of 20 to 34 years have the highest fertility rate with 35.0 births per 1,000 women. Women in the age bracket of 20 to 34 years acount for 100.0% of all women with births.
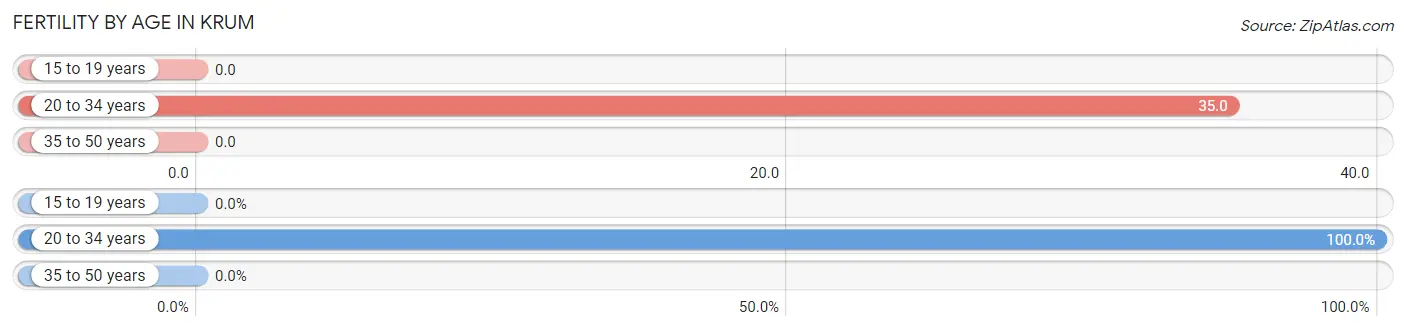
| Age Bracket | Women with Births | Births / 1,000 Women |
| 15 to 19 years | 0 (0.0%) | 0.0 |
| 20 to 34 years | 16 (100.0%) | 35.0 |
| 35 to 50 years | 0 (0.0%) | 0.0 |
| Total | 16 (100.0%) | 11.0 |
Fertility by Age by Marriage Status in Krum
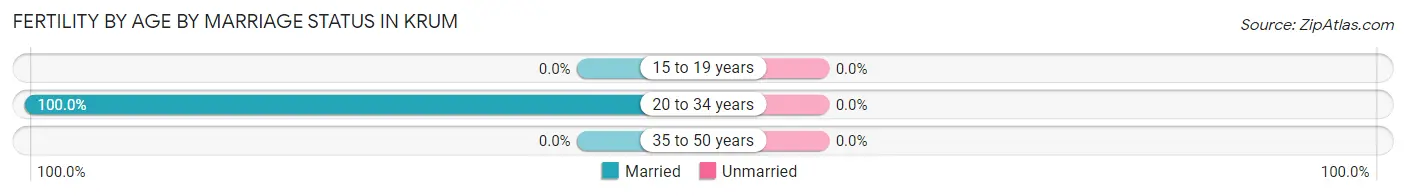
| Age Bracket | Married | Unmarried |
| 15 to 19 years | 0 (0.0%) | 0 (0.0%) |
| 20 to 34 years | 16 (100.0%) | 0 (0.0%) |
| 35 to 50 years | 0 (0.0%) | 0 (0.0%) |
| Total | 16 (100.0%) | 0 (0.0%) |
Fertility by Education in Krum
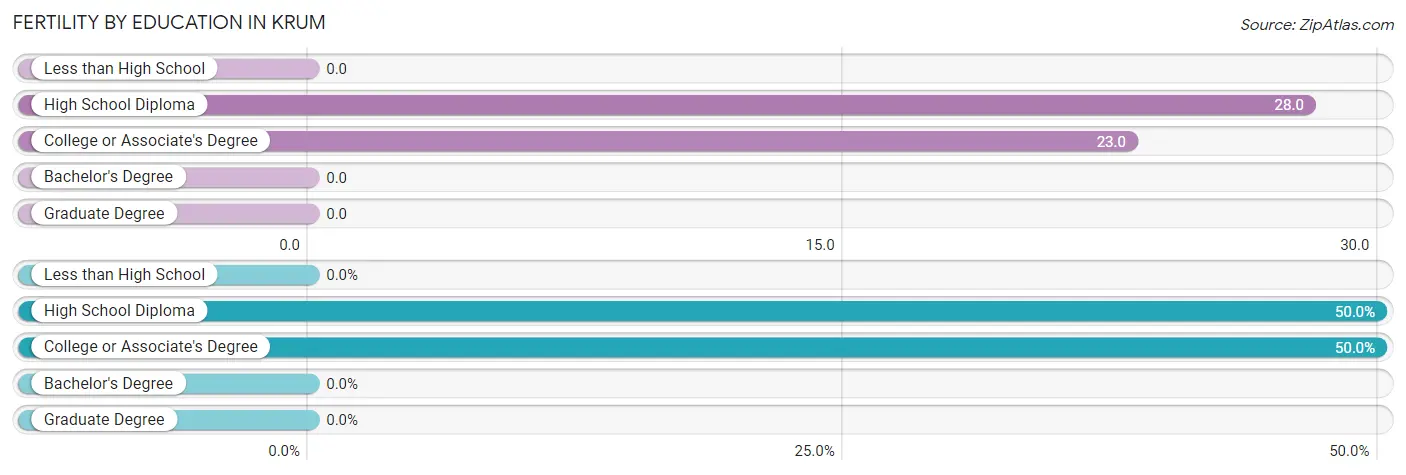
| Educational Attainment | Women with Births | Births / 1,000 Women |
| Less than High School | 0 (0.0%) | 0.0 |
| High School Diploma | 8 (50.0%) | 28.0 |
| College or Associate's Degree | 8 (50.0%) | 23.0 |
| Bachelor's Degree | 0 (0.0%) | 0.0 |
| Graduate Degree | 0 (0.0%) | 0.0 |
| Total | 16 (100.0%) | 11.0 |
Fertility by Education by Marriage Status in Krum
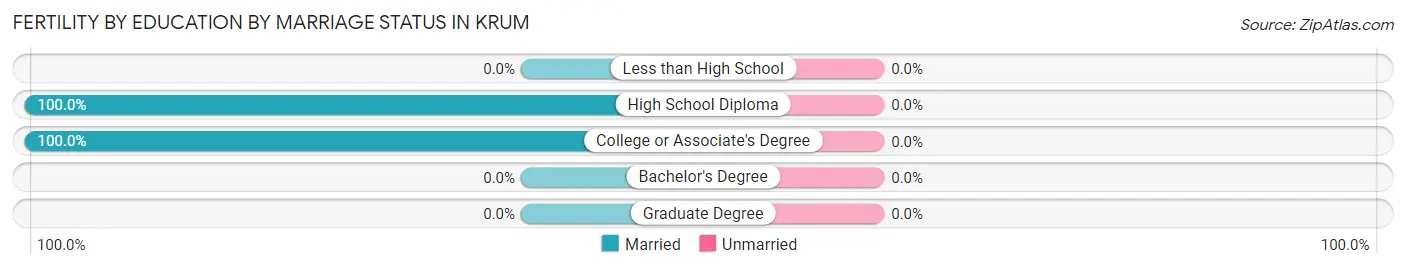
| Educational Attainment | Married | Unmarried |
| Less than High School | 0 (0.0%) | 0 (0.0%) |
| High School Diploma | 8 (100.0%) | 0 (0.0%) |
| College or Associate's Degree | 8 (100.0%) | 0 (0.0%) |
| Bachelor's Degree | 0 (0.0%) | 0 (0.0%) |
| Graduate Degree | 0 (0.0%) | 0 (0.0%) |
| Total | 16 (100.0%) | 0 (0.0%) |
Employment Characteristics in Krum
Employment by Class of Employer in Krum
Among the 2,968 employed individuals in Krum, private company employees (2,016 | 67.9%), local government employees (380 | 12.8%), and not-for-profit organizations (174 | 5.9%) make up the most common classes of employment.
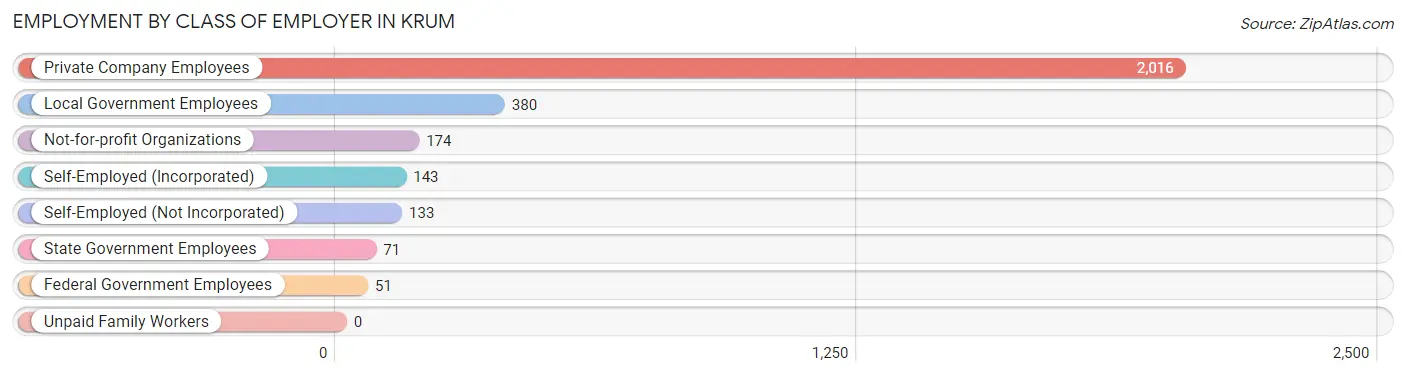
| Employer Class | # Employees | % Employees |
| Private Company Employees | 2,016 | 67.9% |
| Self-Employed (Incorporated) | 143 | 4.8% |
| Self-Employed (Not Incorporated) | 133 | 4.5% |
| Not-for-profit Organizations | 174 | 5.9% |
| Local Government Employees | 380 | 12.8% |
| State Government Employees | 71 | 2.4% |
| Federal Government Employees | 51 | 1.7% |
| Unpaid Family Workers | 0 | 0.0% |
| Total | 2,968 | 100.0% |
Employment Status by Age in Krum
According to the labor force statistics for Krum, out of the total population over 16 years of age (4,166), 72.6% or 3,025 individuals are in the labor force, with 1.5% or 45 of them unemployed. The age group with the highest labor force participation rate is 25 to 29 years, with 100.0% or 269 individuals in the labor force. Within the labor force, the 16 to 19 years age range has the highest percentage of unemployed individuals, with 8.0% or 18 of them being unemployed.
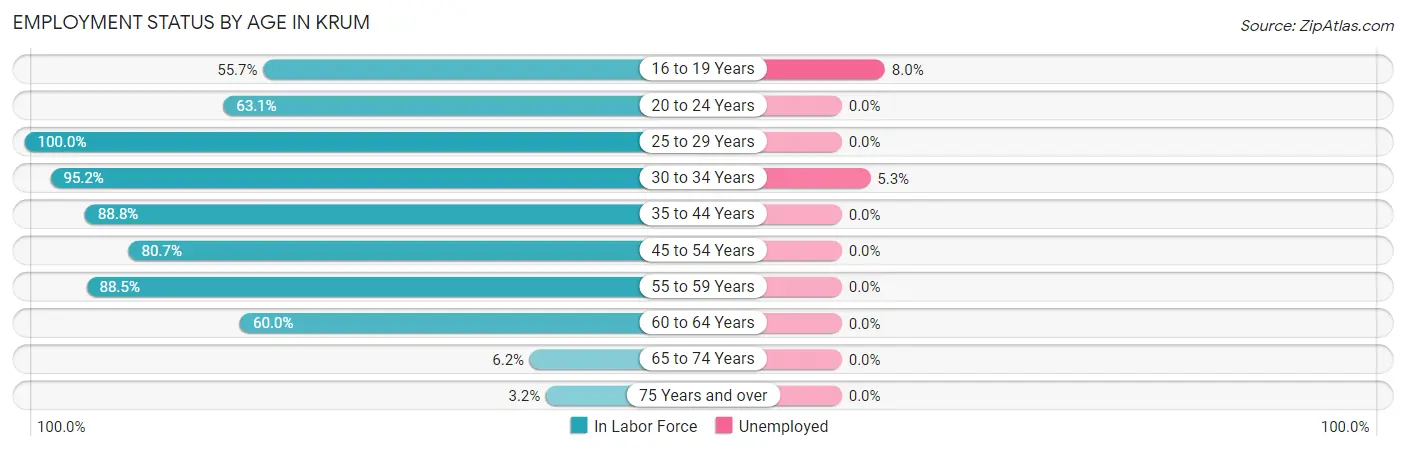
| Age Bracket | In Labor Force | Unemployed |
| 16 to 19 Years | 224 (55.7%) | 18 (8.0%) |
| 20 to 24 Years | 89 (63.1%) | 0 (0.0%) |
| 25 to 29 Years | 269 (100.0%) | 0 (0.0%) |
| 30 to 34 Years | 513 (95.2%) | 27 (5.3%) |
| 35 to 44 Years | 997 (88.8%) | 0 (0.0%) |
| 45 to 54 Years | 569 (80.7%) | 0 (0.0%) |
| 55 to 59 Years | 184 (88.5%) | 0 (0.0%) |
| 60 to 64 Years | 153 (60.0%) | 0 (0.0%) |
| 65 to 74 Years | 17 (6.2%) | 0 (0.0%) |
| 75 Years and over | 8 (3.2%) | 0 (0.0%) |
| Total | 3,025 (72.6%) | 45 (1.5%) |
Employment Status by Educational Attainment in Krum
According to labor force statistics for Krum, 86.6% of individuals (2,684) out of the total population between 25 and 64 years of age (3,099) are in the labor force, with 1.0% or 27 of them being unemployed. The group with the highest labor force participation rate are those with the educational attainment of college / associate degree, with 96.0% or 1,096 individuals in the labor force. Within the labor force, individuals with college / associate degree education have the highest percentage of unemployment, with 2.5% or 27 of them being unemployed.
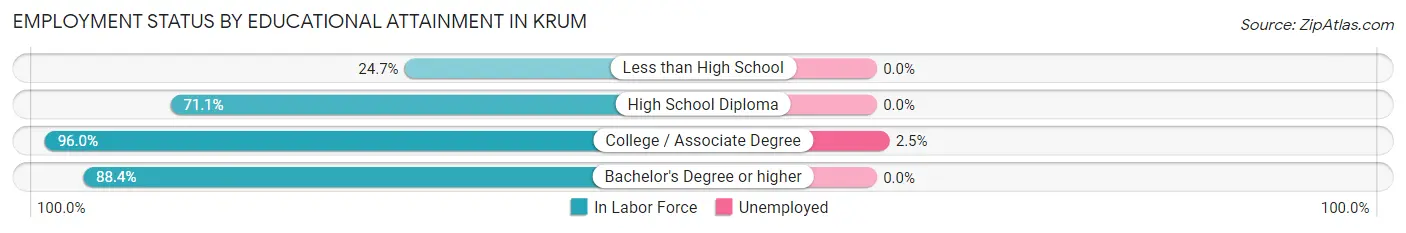
| Educational Attainment | In Labor Force | Unemployed |
| Less than High School | 19 (24.7%) | 0 (0.0%) |
| High School Diploma | 376 (71.1%) | 0 (0.0%) |
| College / Associate Degree | 1,096 (96.0%) | 29 (2.5%) |
| Bachelor's Degree or higher | 1,194 (88.4%) | 0 (0.0%) |
| Total | 2,684 (86.6%) | 31 (1.0%) |
Employment Occupations by Sex in Krum
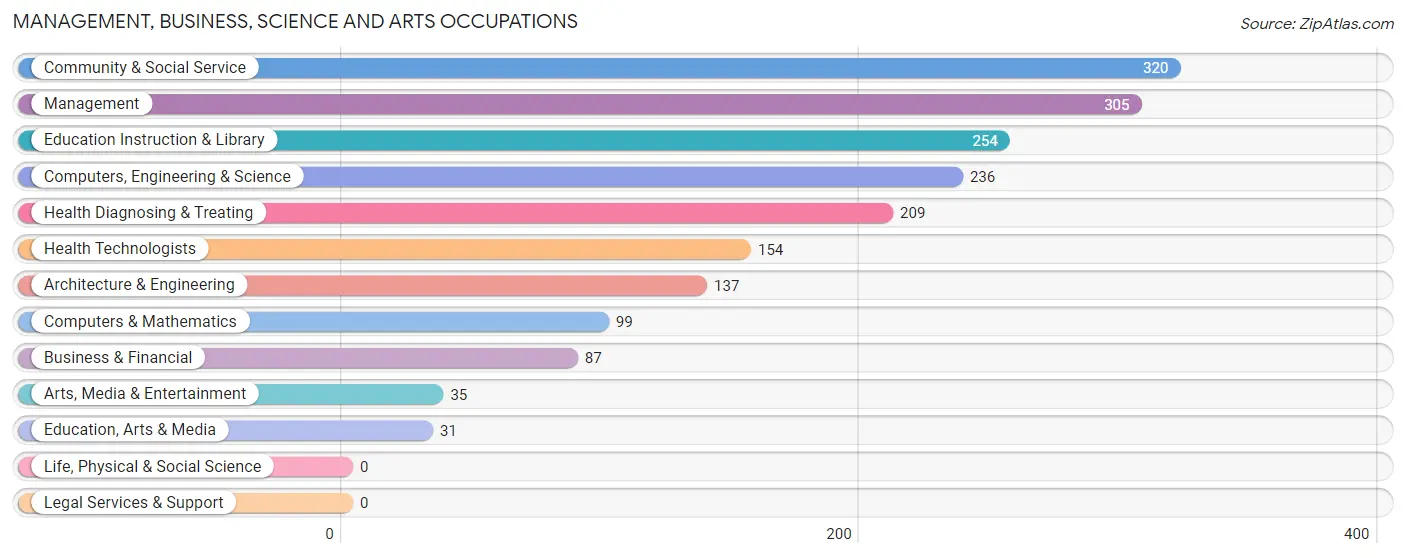
Management, Business, Science and Arts Occupations
The most common Management, Business, Science and Arts occupations in Krum are Community & Social Service (320 | 10.7%), Management (305 | 10.2%), Education Instruction & Library (254 | 8.5%), Computers, Engineering & Science (236 | 7.9%), and Health Diagnosing & Treating (209 | 7.0%).
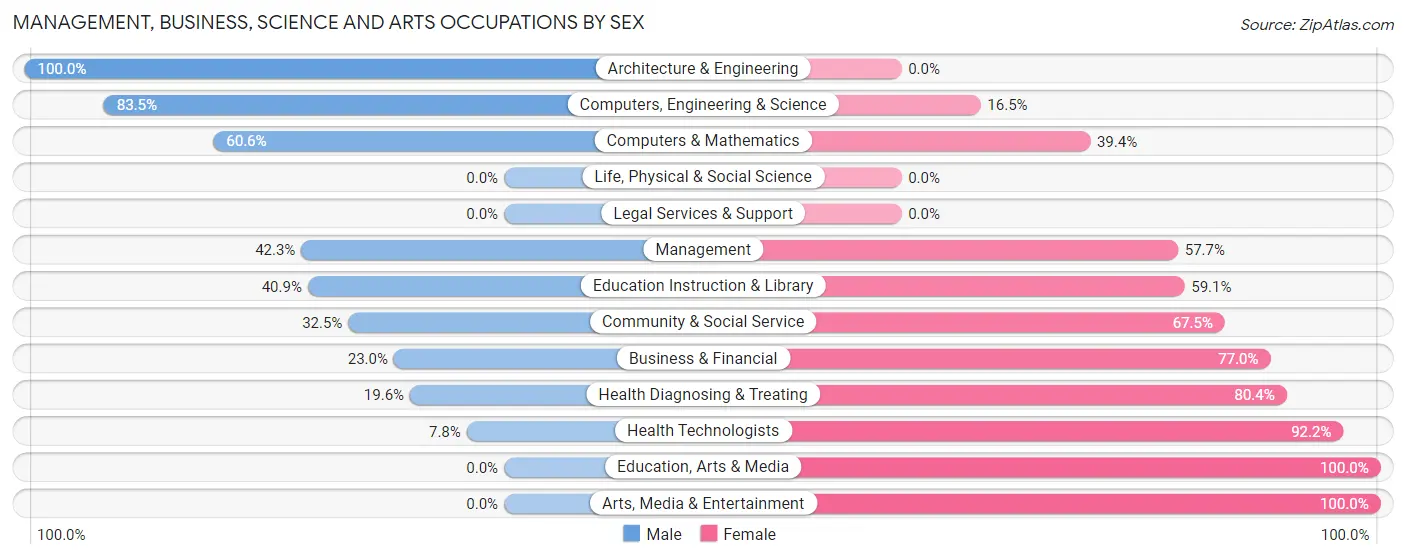
Management, Business, Science and Arts Occupations by Sex
Within the Management, Business, Science and Arts occupations in Krum, the most male-oriented occupations are Architecture & Engineering (100.0%), Computers, Engineering & Science (83.5%), and Computers & Mathematics (60.6%), while the most female-oriented occupations are Education, Arts & Media (100.0%), Arts, Media & Entertainment (100.0%), and Health Technologists (92.2%).
| Occupation | Male | Female |
| Management | 129 (42.3%) | 176 (57.7%) |
| Business & Financial | 20 (23.0%) | 67 (77.0%) |
| Computers, Engineering & Science | 197 (83.5%) | 39 (16.5%) |
| Computers & Mathematics | 60 (60.6%) | 39 (39.4%) |
| Architecture & Engineering | 137 (100.0%) | 0 (0.0%) |
| Life, Physical & Social Science | 0 (0.0%) | 0 (0.0%) |
| Community & Social Service | 104 (32.5%) | 216 (67.5%) |
| Education, Arts & Media | 0 (0.0%) | 31 (100.0%) |
| Legal Services & Support | 0 (0.0%) | 0 (0.0%) |
| Education Instruction & Library | 104 (40.9%) | 150 (59.1%) |
| Arts, Media & Entertainment | 0 (0.0%) | 35 (100.0%) |
| Health Diagnosing & Treating | 41 (19.6%) | 168 (80.4%) |
| Health Technologists | 12 (7.8%) | 142 (92.2%) |
| Total (Category) | 491 (42.4%) | 666 (57.6%) |
| Total (Overall) | 1,606 (53.9%) | 1,372 (46.1%) |
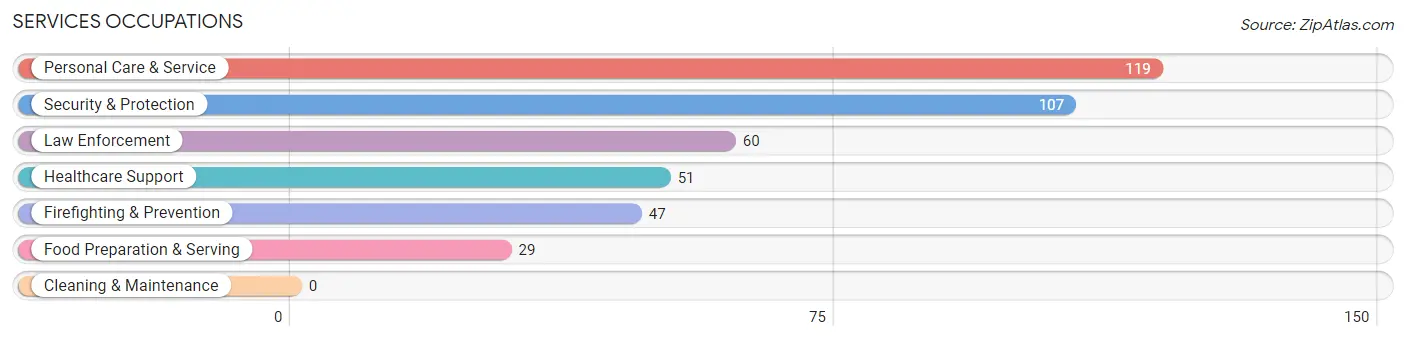
Services Occupations
The most common Services occupations in Krum are Personal Care & Service (119 | 4.0%), Security & Protection (107 | 3.6%), Law Enforcement (60 | 2.0%), Healthcare Support (51 | 1.7%), and Firefighting & Prevention (47 | 1.6%).
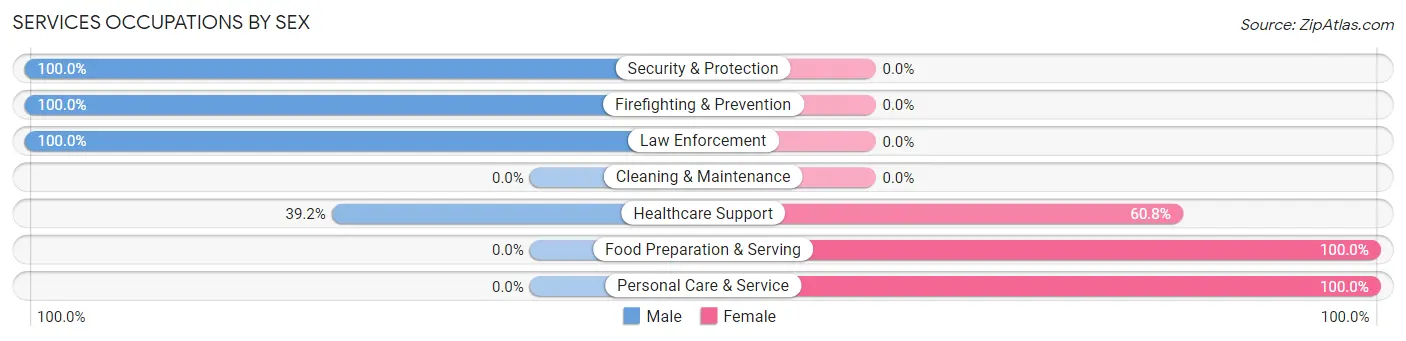
Services Occupations by Sex
Within the Services occupations in Krum, the most male-oriented occupations are Security & Protection (100.0%), Firefighting & Prevention (100.0%), and Law Enforcement (100.0%), while the most female-oriented occupations are Food Preparation & Serving (100.0%), Personal Care & Service (100.0%), and Healthcare Support (60.8%).
| Occupation | Male | Female |
| Healthcare Support | 20 (39.2%) | 31 (60.8%) |
| Security & Protection | 107 (100.0%) | 0 (0.0%) |
| Firefighting & Prevention | 47 (100.0%) | 0 (0.0%) |
| Law Enforcement | 60 (100.0%) | 0 (0.0%) |
| Food Preparation & Serving | 0 (0.0%) | 29 (100.0%) |
| Cleaning & Maintenance | 0 (0.0%) | 0 (0.0%) |
| Personal Care & Service | 0 (0.0%) | 119 (100.0%) |
| Total (Category) | 127 (41.5%) | 179 (58.5%) |
| Total (Overall) | 1,606 (53.9%) | 1,372 (46.1%) |
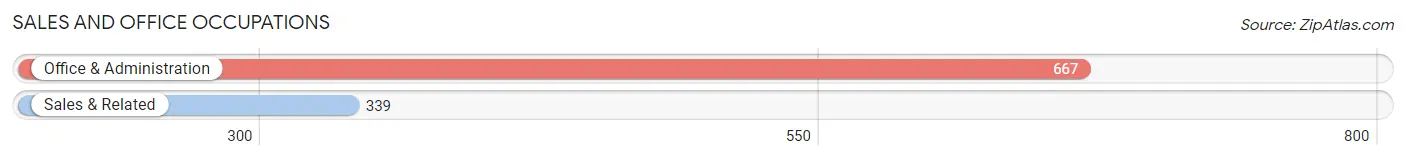
Sales and Office Occupations
The most common Sales and Office occupations in Krum are Office & Administration (667 | 22.4%), and Sales & Related (339 | 11.4%).
Sales and Office Occupations by Sex
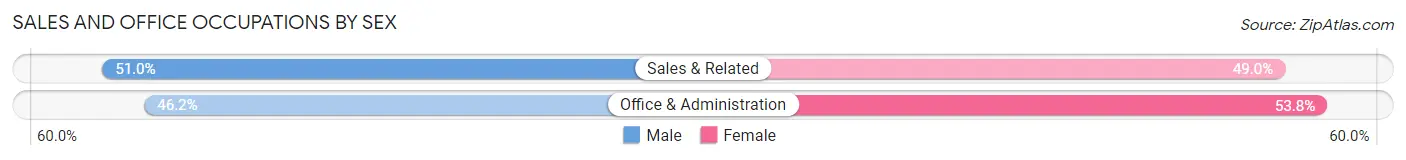
| Occupation | Male | Female |
| Sales & Related | 173 (51.0%) | 166 (49.0%) |
| Office & Administration | 308 (46.2%) | 359 (53.8%) |
| Total (Category) | 481 (47.8%) | 525 (52.2%) |
| Total (Overall) | 1,606 (53.9%) | 1,372 (46.1%) |
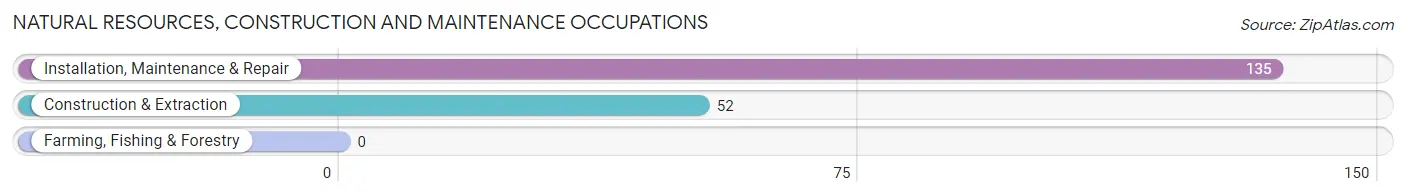
Natural Resources, Construction and Maintenance Occupations
The most common Natural Resources, Construction and Maintenance occupations in Krum are Installation, Maintenance & Repair (135 | 4.5%), and Construction & Extraction (52 | 1.8%).
Natural Resources, Construction and Maintenance Occupations by Sex
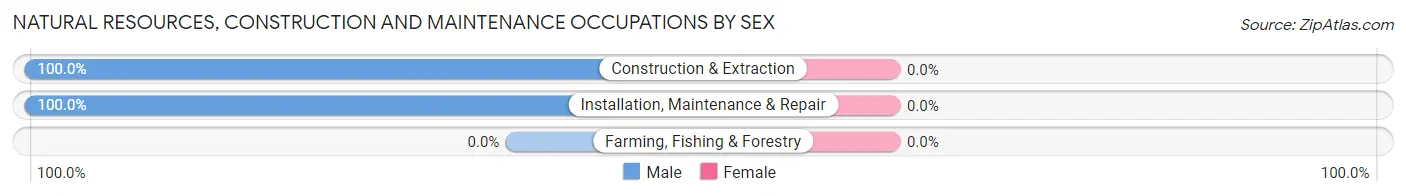
| Occupation | Male | Female |
| Farming, Fishing & Forestry | 0 (0.0%) | 0 (0.0%) |
| Construction & Extraction | 52 (100.0%) | 0 (0.0%) |
| Installation, Maintenance & Repair | 135 (100.0%) | 0 (0.0%) |
| Total (Category) | 187 (100.0%) | 0 (0.0%) |
| Total (Overall) | 1,606 (53.9%) | 1,372 (46.1%) |
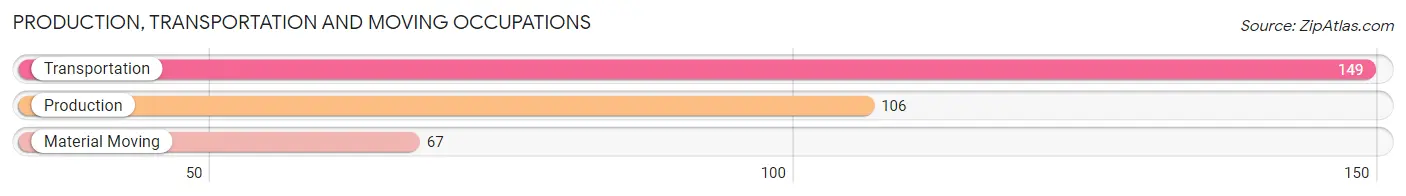
Production, Transportation and Moving Occupations
The most common Production, Transportation and Moving occupations in Krum are Transportation (149 | 5.0%), Production (106 | 3.6%), and Material Moving (67 | 2.2%).
Production, Transportation and Moving Occupations by Sex
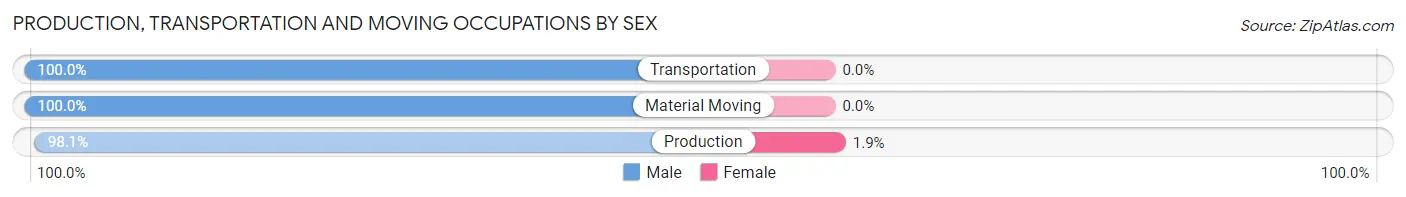
| Occupation | Male | Female |
| Production | 104 (98.1%) | 2 (1.9%) |
| Transportation | 149 (100.0%) | 0 (0.0%) |
| Material Moving | 67 (100.0%) | 0 (0.0%) |
| Total (Category) | 320 (99.4%) | 2 (0.6%) |
| Total (Overall) | 1,606 (53.9%) | 1,372 (46.1%) |
Employment Industries by Sex in Krum
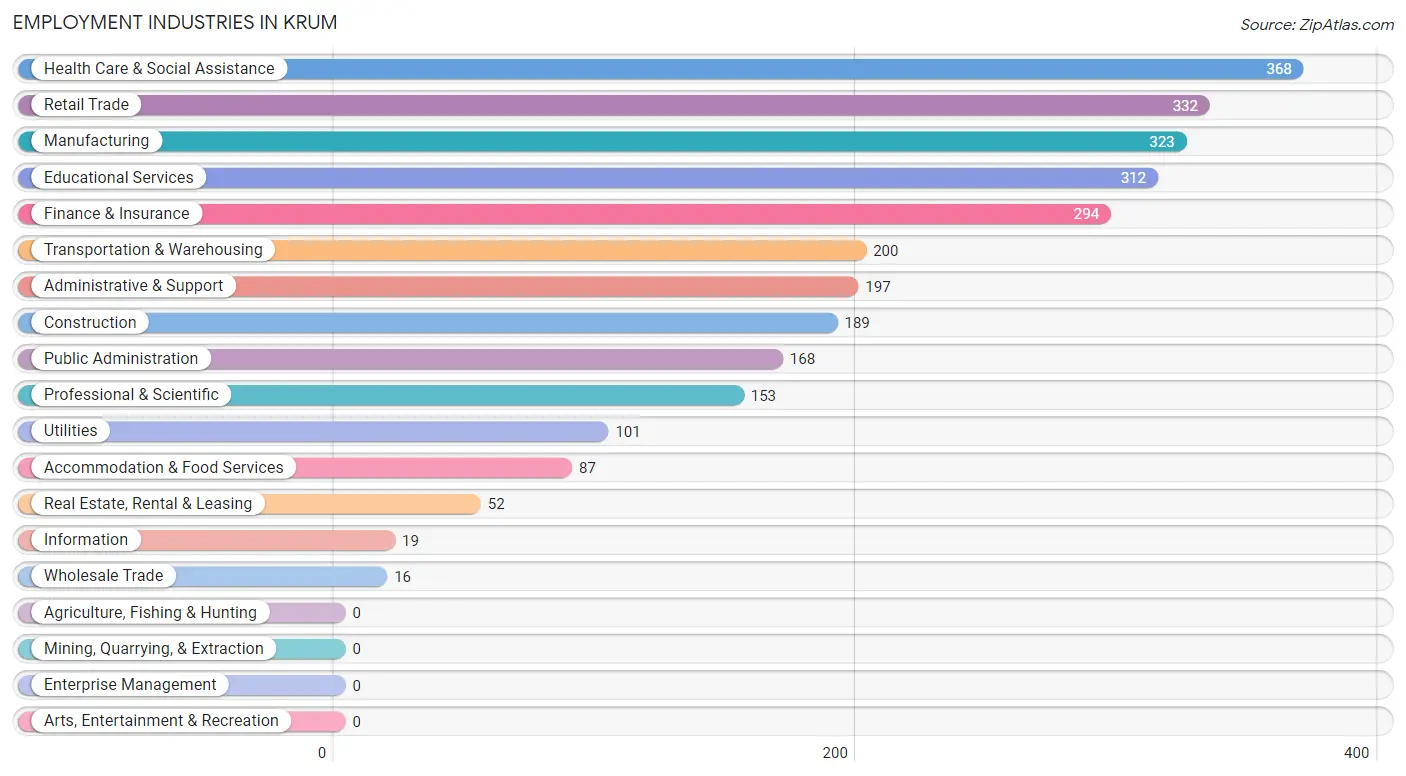
Employment Industries in Krum
The major employment industries in Krum include Health Care & Social Assistance (368 | 12.4%), Retail Trade (332 | 11.2%), Manufacturing (323 | 10.8%), Educational Services (312 | 10.5%), and Finance & Insurance (294 | 9.9%).
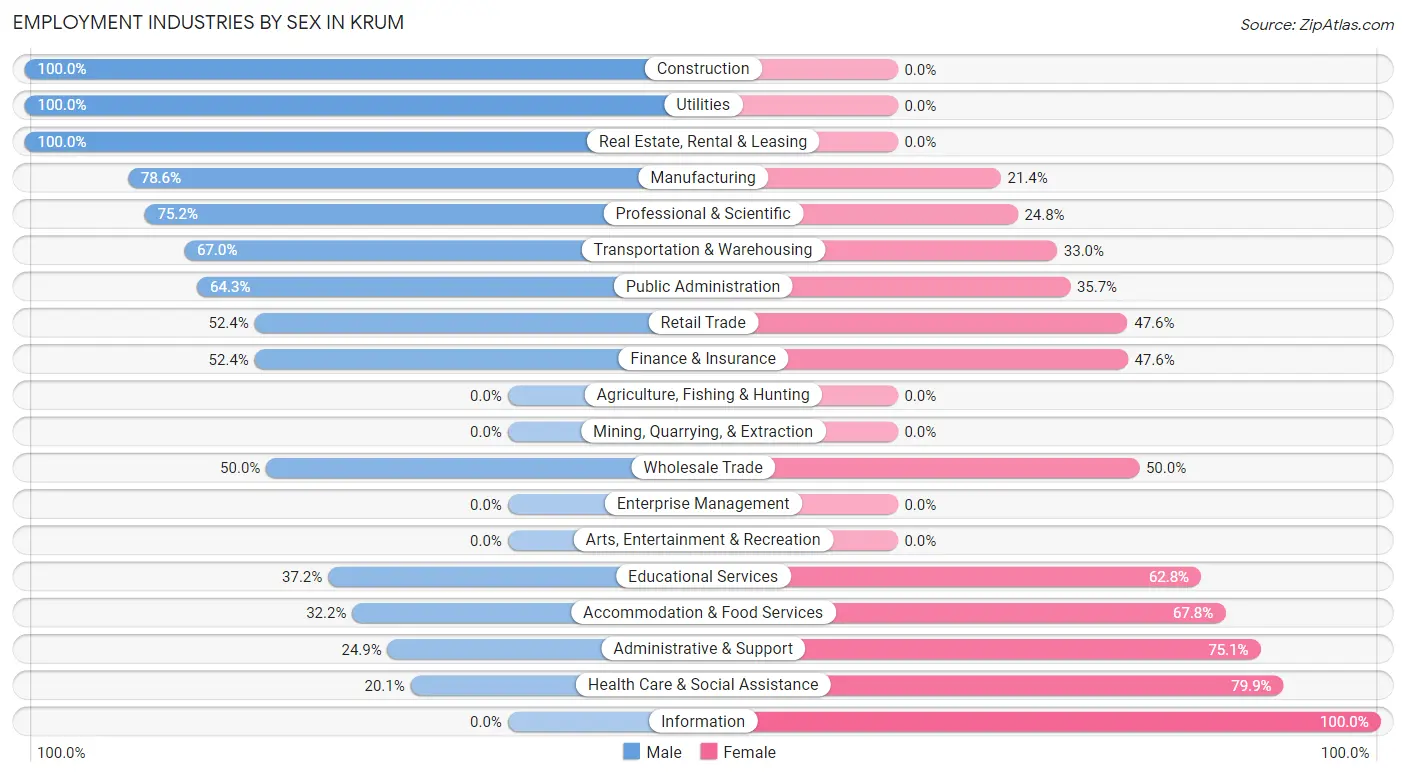
Employment Industries by Sex in Krum
The Krum industries that see more men than women are Construction (100.0%), Utilities (100.0%), and Real Estate, Rental & Leasing (100.0%), whereas the industries that tend to have a higher number of women are Information (100.0%), Health Care & Social Assistance (79.9%), and Administrative & Support (75.1%).
| Industry | Male | Female |
| Agriculture, Fishing & Hunting | 0 (0.0%) | 0 (0.0%) |
| Mining, Quarrying, & Extraction | 0 (0.0%) | 0 (0.0%) |
| Construction | 189 (100.0%) | 0 (0.0%) |
| Manufacturing | 254 (78.6%) | 69 (21.4%) |
| Wholesale Trade | 8 (50.0%) | 8 (50.0%) |
| Retail Trade | 174 (52.4%) | 158 (47.6%) |
| Transportation & Warehousing | 134 (67.0%) | 66 (33.0%) |
| Utilities | 101 (100.0%) | 0 (0.0%) |
| Information | 0 (0.0%) | 19 (100.0%) |
| Finance & Insurance | 154 (52.4%) | 140 (47.6%) |
| Real Estate, Rental & Leasing | 52 (100.0%) | 0 (0.0%) |
| Professional & Scientific | 115 (75.2%) | 38 (24.8%) |
| Enterprise Management | 0 (0.0%) | 0 (0.0%) |
| Administrative & Support | 49 (24.9%) | 148 (75.1%) |
| Educational Services | 116 (37.2%) | 196 (62.8%) |
| Health Care & Social Assistance | 74 (20.1%) | 294 (79.9%) |
| Arts, Entertainment & Recreation | 0 (0.0%) | 0 (0.0%) |
| Accommodation & Food Services | 28 (32.2%) | 59 (67.8%) |
| Public Administration | 108 (64.3%) | 60 (35.7%) |
| Total | 1,606 (53.9%) | 1,372 (46.1%) |
Education in Krum
School Enrollment in Krum
The most common levels of schooling among the 1,848 students in Krum are middle school (460 | 24.9%), elementary school (364 | 19.7%), and college / undergraduate (304 | 16.5%).
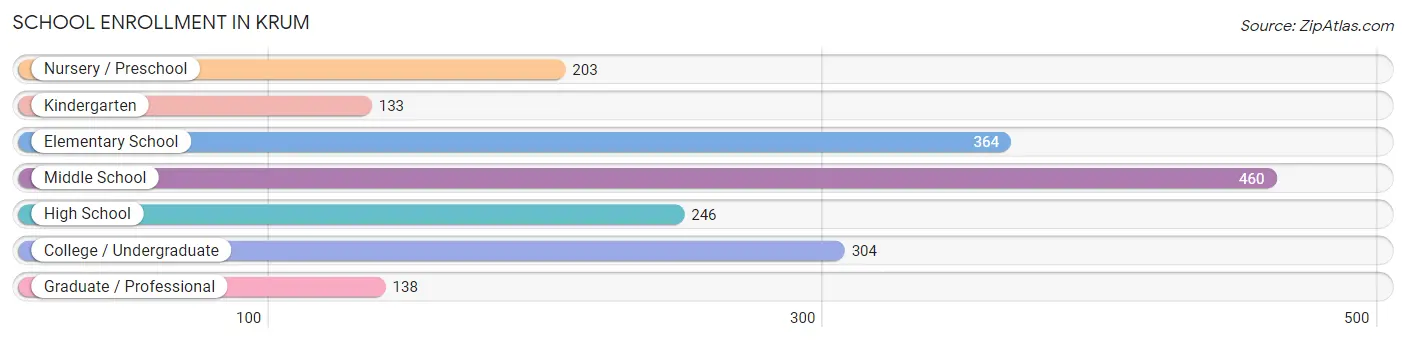
| School Level | # Students | % Students |
| Nursery / Preschool | 203 | 11.0% |
| Kindergarten | 133 | 7.2% |
| Elementary School | 364 | 19.7% |
| Middle School | 460 | 24.9% |
| High School | 246 | 13.3% |
| College / Undergraduate | 304 | 16.5% |
| Graduate / Professional | 138 | 7.5% |
| Total | 1,848 | 100.0% |
School Enrollment by Age by Funding Source in Krum
Out of a total of 1,848 students who are enrolled in schools in Krum, 379 (20.5%) attend a private institution, while the remaining 1,469 (79.5%) are enrolled in public schools. The age group of 20 to 24 year olds has the highest likelihood of being enrolled in private schools, with 44 (100.0% in the age bracket) enrolled. Conversely, the age group of 25 to 34 year olds has the lowest likelihood of being enrolled in a private school, with 215 (100.0% in the age bracket) attending a public institution.
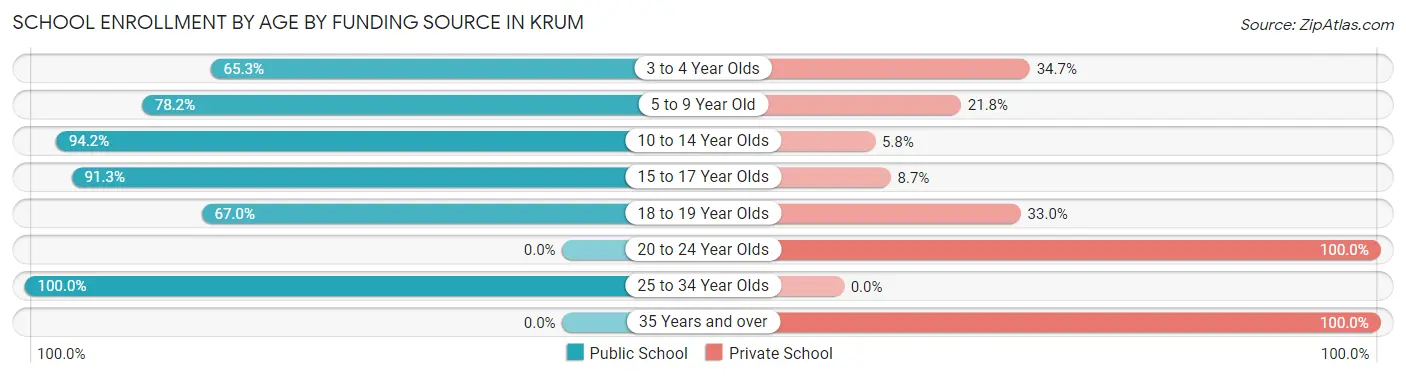
| Age Bracket | Public School | Private School |
| 3 to 4 Year Olds | 115 (65.3%) | 61 (34.7%) |
| 5 to 9 Year Old | 358 (78.2%) | 100 (21.8%) |
| 10 to 14 Year Olds | 533 (94.2%) | 33 (5.8%) |
| 15 to 17 Year Olds | 188 (91.3%) | 18 (8.7%) |
| 18 to 19 Year Olds | 61 (67.0%) | 30 (33.0%) |
| 20 to 24 Year Olds | 0 (0.0%) | 44 (100.0%) |
| 25 to 34 Year Olds | 215 (100.0%) | 0 (0.0%) |
| 35 Years and over | 0 (0.0%) | 92 (100.0%) |
| Total | 1,469 (79.5%) | 379 (20.5%) |
Educational Attainment by Field of Study in Krum
Education (350 | 20.4%), business (227 | 13.2%), literature & languages (209 | 12.2%), arts & humanities (166 | 9.7%), and liberal arts & history (139 | 8.1%) are the most common fields of study among 1,719 individuals in Krum who have obtained a bachelor's degree or higher.
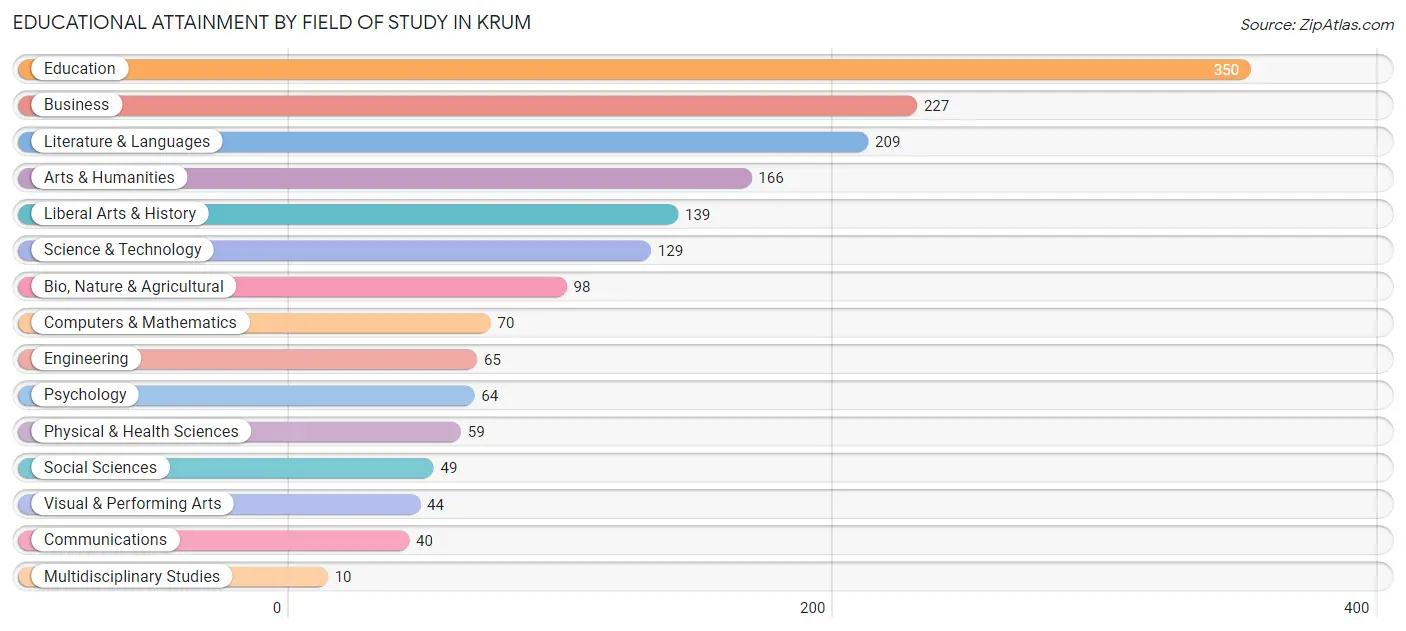
| Field of Study | # Graduates | % Graduates |
| Computers & Mathematics | 70 | 4.1% |
| Bio, Nature & Agricultural | 98 | 5.7% |
| Physical & Health Sciences | 59 | 3.4% |
| Psychology | 64 | 3.7% |
| Social Sciences | 49 | 2.9% |
| Engineering | 65 | 3.8% |
| Multidisciplinary Studies | 10 | 0.6% |
| Science & Technology | 129 | 7.5% |
| Business | 227 | 13.2% |
| Education | 350 | 20.4% |
| Literature & Languages | 209 | 12.2% |
| Liberal Arts & History | 139 | 8.1% |
| Visual & Performing Arts | 44 | 2.6% |
| Communications | 40 | 2.3% |
| Arts & Humanities | 166 | 9.7% |
| Total | 1,719 | 100.0% |
Transportation & Commute in Krum
Vehicle Availability by Sex in Krum
The most prevalent vehicle ownership categories in Krum are males with 3 vehicles (656, accounting for 40.8%) and females with 3 vehicles (364, making up 48.2%).
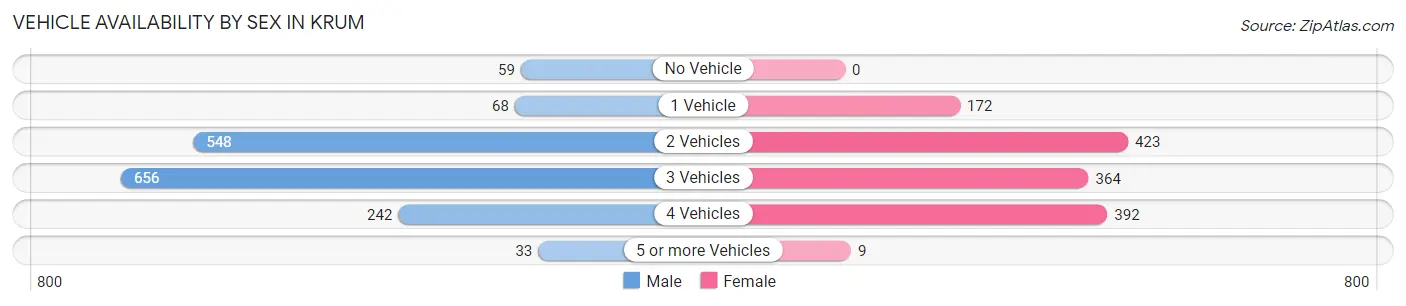
| Vehicles Available | Male | Female |
| No Vehicle | 59 (3.7%) | 0 (0.0%) |
| 1 Vehicle | 68 (4.2%) | 172 (12.7%) |
| 2 Vehicles | 548 (34.1%) | 423 (31.1%) |
| 3 Vehicles | 656 (40.8%) | 364 (26.8%) |
| 4 Vehicles | 242 (15.1%) | 392 (28.8%) |
| 5 or more Vehicles | 33 (2.1%) | 9 (0.7%) |
| Total | 1,606 (100.0%) | 1,360 (100.0%) |
Commute Time in Krum
The most frequently occuring commute durations in Krum are 45 to 59 minutes (492 commuters, 19.0%), 20 to 24 minutes (394 commuters, 15.2%), and 15 to 19 minutes (371 commuters, 14.3%).
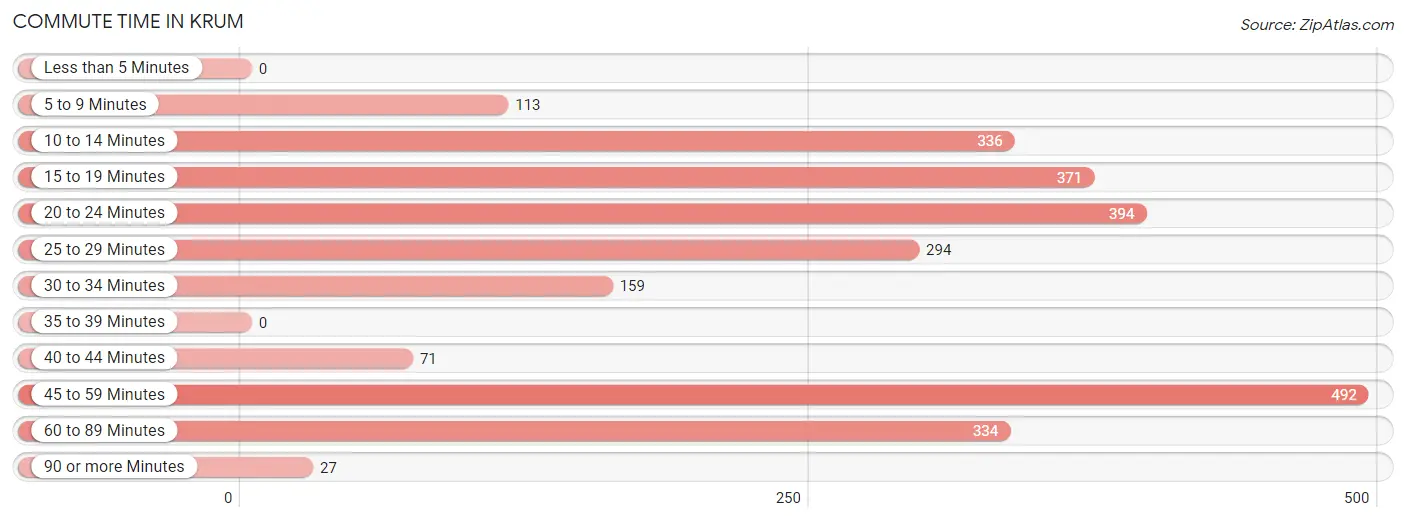
| Commute Time | # Commuters | % Commuters |
| Less than 5 Minutes | 0 | 0.0% |
| 5 to 9 Minutes | 113 | 4.4% |
| 10 to 14 Minutes | 336 | 13.0% |
| 15 to 19 Minutes | 371 | 14.3% |
| 20 to 24 Minutes | 394 | 15.2% |
| 25 to 29 Minutes | 294 | 11.4% |
| 30 to 34 Minutes | 159 | 6.1% |
| 35 to 39 Minutes | 0 | 0.0% |
| 40 to 44 Minutes | 71 | 2.7% |
| 45 to 59 Minutes | 492 | 19.0% |
| 60 to 89 Minutes | 334 | 12.9% |
| 90 or more Minutes | 27 | 1.0% |
Commute Time by Sex in Krum
The most common commute times in Krum are 20 to 24 minutes (285 commuters, 19.3%) for males and 45 to 59 minutes (225 commuters, 20.2%) for females.
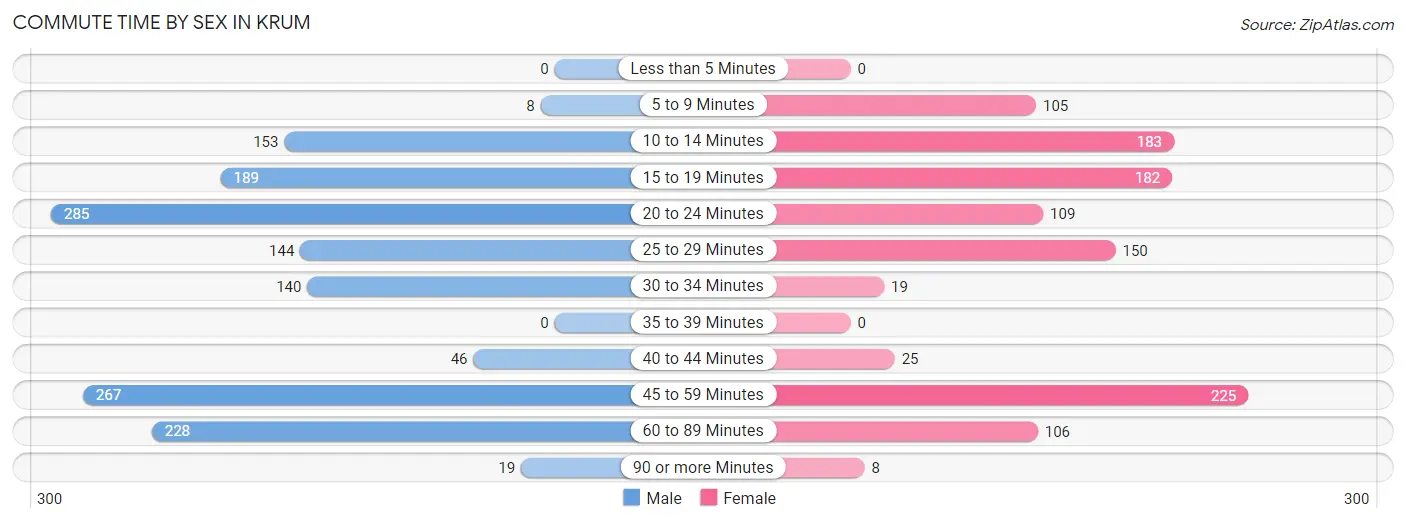
| Commute Time | Male | Female |
| Less than 5 Minutes | 0 (0.0%) | 0 (0.0%) |
| 5 to 9 Minutes | 8 (0.5%) | 105 (9.4%) |
| 10 to 14 Minutes | 153 (10.3%) | 183 (16.5%) |
| 15 to 19 Minutes | 189 (12.8%) | 182 (16.4%) |
| 20 to 24 Minutes | 285 (19.3%) | 109 (9.8%) |
| 25 to 29 Minutes | 144 (9.7%) | 150 (13.5%) |
| 30 to 34 Minutes | 140 (9.5%) | 19 (1.7%) |
| 35 to 39 Minutes | 0 (0.0%) | 0 (0.0%) |
| 40 to 44 Minutes | 46 (3.1%) | 25 (2.2%) |
| 45 to 59 Minutes | 267 (18.0%) | 225 (20.2%) |
| 60 to 89 Minutes | 228 (15.4%) | 106 (9.5%) |
| 90 or more Minutes | 19 (1.3%) | 8 (0.7%) |
Time of Departure to Work by Sex in Krum
The most frequent times of departure to work in Krum are 6:00 AM to 6:29 AM (231, 15.6%) for males and 8:30 AM to 8:59 AM (179, 16.1%) for females.
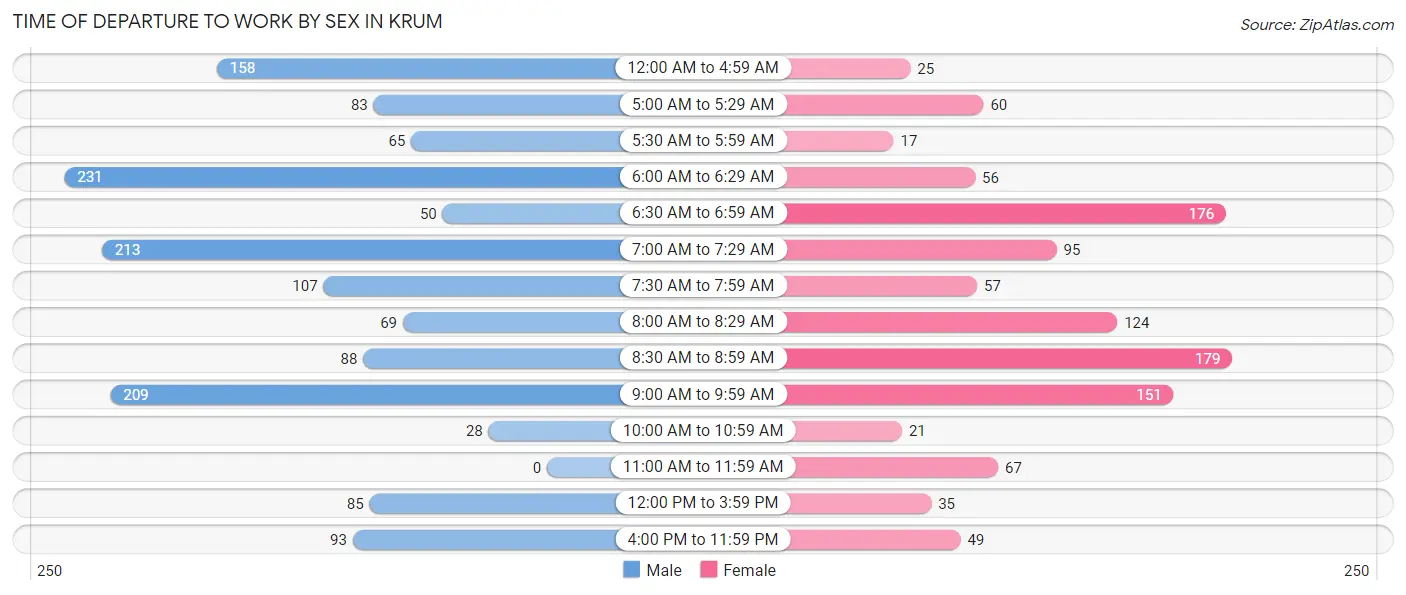
| Time of Departure | Male | Female |
| 12:00 AM to 4:59 AM | 158 (10.7%) | 25 (2.2%) |
| 5:00 AM to 5:29 AM | 83 (5.6%) | 60 (5.4%) |
| 5:30 AM to 5:59 AM | 65 (4.4%) | 17 (1.5%) |
| 6:00 AM to 6:29 AM | 231 (15.6%) | 56 (5.0%) |
| 6:30 AM to 6:59 AM | 50 (3.4%) | 176 (15.8%) |
| 7:00 AM to 7:29 AM | 213 (14.4%) | 95 (8.5%) |
| 7:30 AM to 7:59 AM | 107 (7.2%) | 57 (5.1%) |
| 8:00 AM to 8:29 AM | 69 (4.7%) | 124 (11.2%) |
| 8:30 AM to 8:59 AM | 88 (5.9%) | 179 (16.1%) |
| 9:00 AM to 9:59 AM | 209 (14.1%) | 151 (13.6%) |
| 10:00 AM to 10:59 AM | 28 (1.9%) | 21 (1.9%) |
| 11:00 AM to 11:59 AM | 0 (0.0%) | 67 (6.0%) |
| 12:00 PM to 3:59 PM | 85 (5.8%) | 35 (3.2%) |
| 4:00 PM to 11:59 PM | 93 (6.3%) | 49 (4.4%) |
| Total | 1,479 (100.0%) | 1,112 (100.0%) |
Housing Occupancy in Krum
Occupancy by Ownership in Krum
Of the total 1,869 dwellings in Krum, owner-occupied units account for 1,353 (72.4%), while renter-occupied units make up 516 (27.6%).
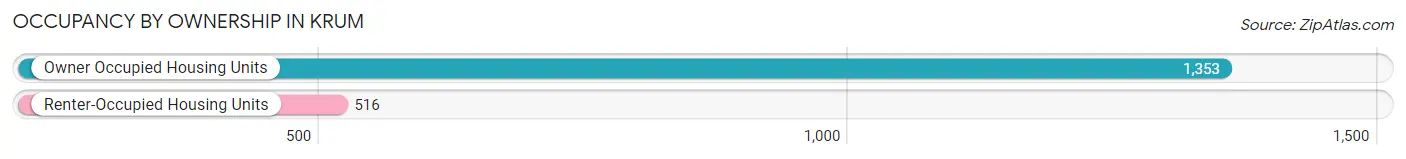
| Occupancy | # Housing Units | % Housing Units |
| Owner Occupied Housing Units | 1,353 | 72.4% |
| Renter-Occupied Housing Units | 516 | 27.6% |
| Total Occupied Housing Units | 1,869 | 100.0% |
Occupancy by Household Size in Krum
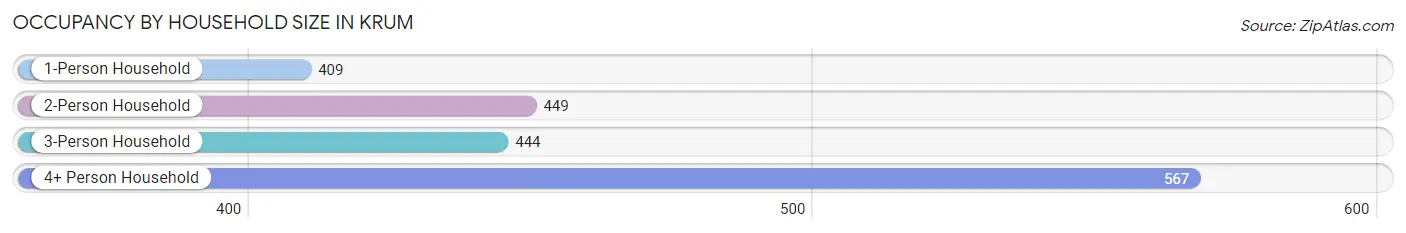
| Household Size | # Housing Units | % Housing Units |
| 1-Person Household | 409 | 21.9% |
| 2-Person Household | 449 | 24.0% |
| 3-Person Household | 444 | 23.8% |
| 4+ Person Household | 567 | 30.3% |
| Total Housing Units | 1,869 | 100.0% |
Occupancy by Ownership by Household Size in Krum
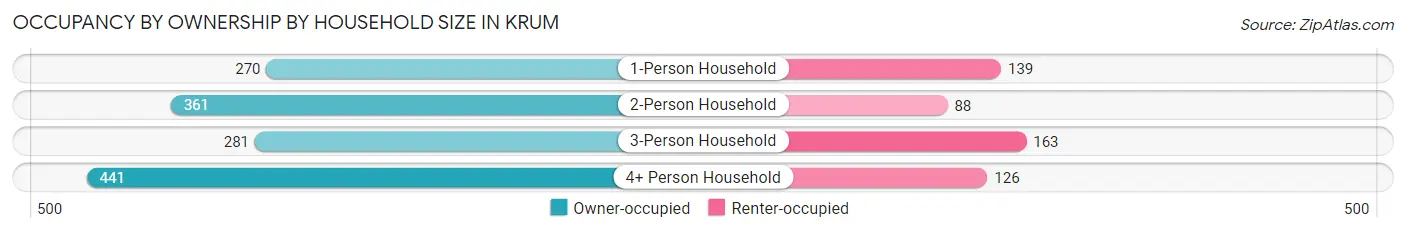
| Household Size | Owner-occupied | Renter-occupied |
| 1-Person Household | 270 (66.0%) | 139 (34.0%) |
| 2-Person Household | 361 (80.4%) | 88 (19.6%) |
| 3-Person Household | 281 (63.3%) | 163 (36.7%) |
| 4+ Person Household | 441 (77.8%) | 126 (22.2%) |
| Total Housing Units | 1,353 (72.4%) | 516 (27.6%) |
Occupancy by Educational Attainment in Krum
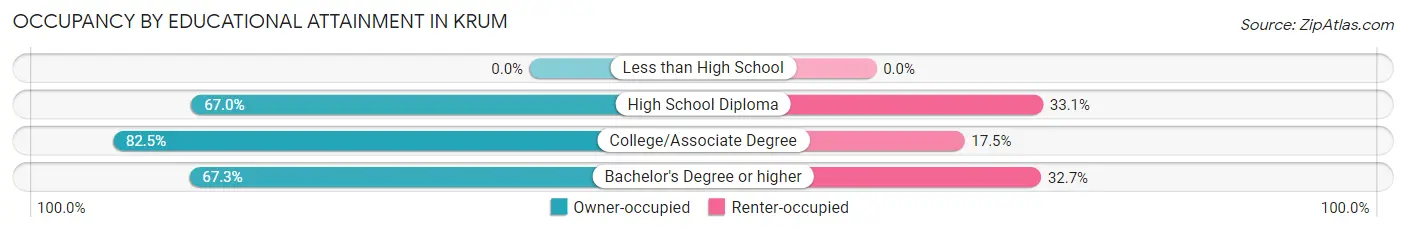
| Household Size | Owner-occupied | Renter-occupied |
| Less than High School | 0 (0.0%) | 0 (0.0%) |
| High School Diploma | 158 (66.9%) | 78 (33.1%) |
| College/Associate Degree | 519 (82.5%) | 110 (17.5%) |
| Bachelor's Degree or higher | 676 (67.3%) | 328 (32.7%) |
Occupancy by Age of Householder in Krum
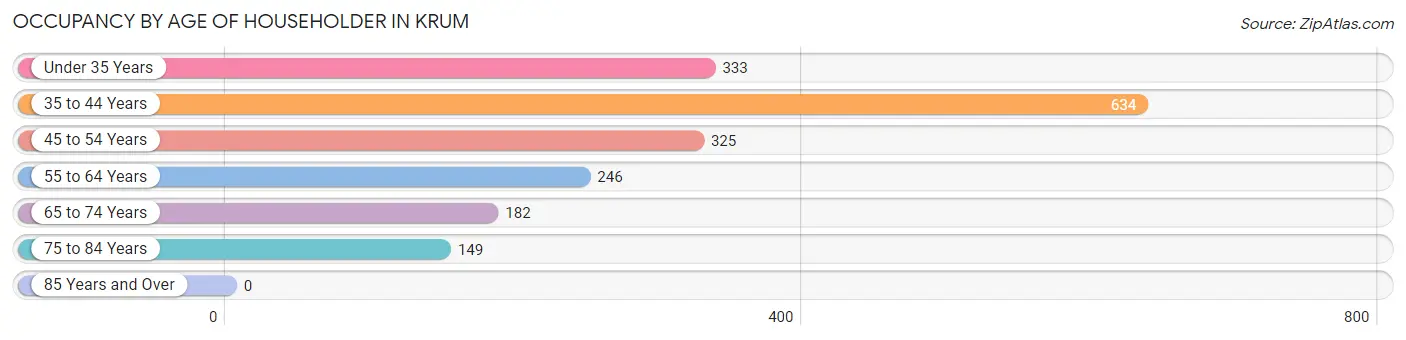
| Age Bracket | # Households | % Households |
| Under 35 Years | 333 | 17.8% |
| 35 to 44 Years | 634 | 33.9% |
| 45 to 54 Years | 325 | 17.4% |
| 55 to 64 Years | 246 | 13.2% |
| 65 to 74 Years | 182 | 9.7% |
| 75 to 84 Years | 149 | 8.0% |
| 85 Years and Over | 0 | 0.0% |
| Total | 1,869 | 100.0% |
Housing Finances in Krum
Median Income by Occupancy in Krum
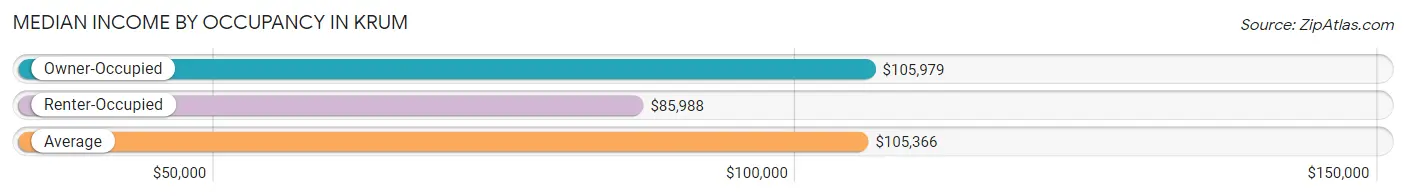
| Occupancy Type | # Households | Median Income |
| Owner-Occupied | 1,353 (72.4%) | $105,979 |
| Renter-Occupied | 516 (27.6%) | $85,988 |
| Average | 1,869 (100.0%) | $105,366 |
Occupancy by Householder Income Bracket in Krum
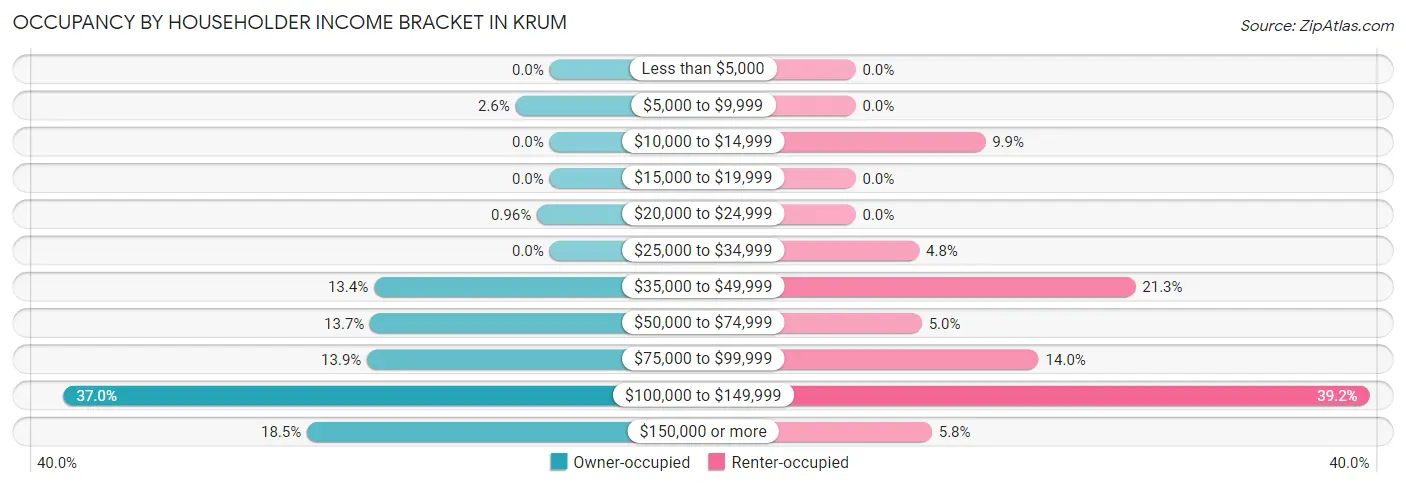
| Income Bracket | Owner-occupied | Renter-occupied |
| Less than $5,000 | 0 (0.0%) | 0 (0.0%) |
| $5,000 to $9,999 | 35 (2.6%) | 0 (0.0%) |
| $10,000 to $14,999 | 0 (0.0%) | 51 (9.9%) |
| $15,000 to $19,999 | 0 (0.0%) | 0 (0.0%) |
| $20,000 to $24,999 | 13 (1.0%) | 0 (0.0%) |
| $25,000 to $34,999 | 0 (0.0%) | 25 (4.8%) |
| $35,000 to $49,999 | 181 (13.4%) | 110 (21.3%) |
| $50,000 to $74,999 | 185 (13.7%) | 26 (5.0%) |
| $75,000 to $99,999 | 188 (13.9%) | 72 (14.0%) |
| $100,000 to $149,999 | 501 (37.0%) | 202 (39.2%) |
| $150,000 or more | 250 (18.5%) | 30 (5.8%) |
| Total | 1,353 (100.0%) | 516 (100.0%) |
Monthly Housing Cost Tiers in Krum
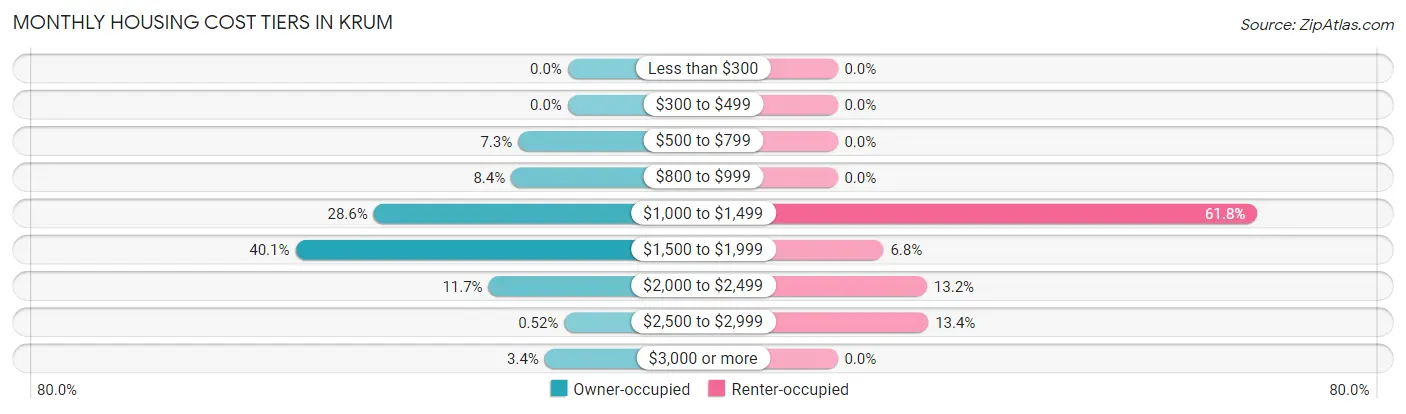
| Monthly Cost | Owner-occupied | Renter-occupied |
| Less than $300 | 0 (0.0%) | 0 (0.0%) |
| $300 to $499 | 0 (0.0%) | 0 (0.0%) |
| $500 to $799 | 99 (7.3%) | 0 (0.0%) |
| $800 to $999 | 113 (8.4%) | 0 (0.0%) |
| $1,000 to $1,499 | 387 (28.6%) | 319 (61.8%) |
| $1,500 to $1,999 | 543 (40.1%) | 35 (6.8%) |
| $2,000 to $2,499 | 158 (11.7%) | 68 (13.2%) |
| $2,500 to $2,999 | 7 (0.5%) | 69 (13.4%) |
| $3,000 or more | 46 (3.4%) | 0 (0.0%) |
| Total | 1,353 (100.0%) | 516 (100.0%) |
Physical Housing Characteristics in Krum
Housing Structures in Krum
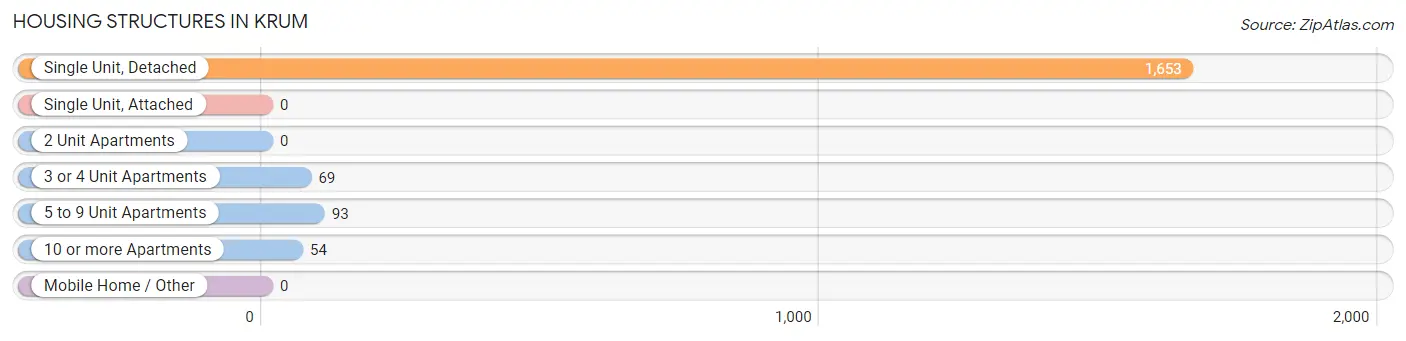
| Structure Type | # Housing Units | % Housing Units |
| Single Unit, Detached | 1,653 | 88.4% |
| Single Unit, Attached | 0 | 0.0% |
| 2 Unit Apartments | 0 | 0.0% |
| 3 or 4 Unit Apartments | 69 | 3.7% |
| 5 to 9 Unit Apartments | 93 | 5.0% |
| 10 or more Apartments | 54 | 2.9% |
| Mobile Home / Other | 0 | 0.0% |
| Total | 1,869 | 100.0% |
Housing Structures by Occupancy in Krum
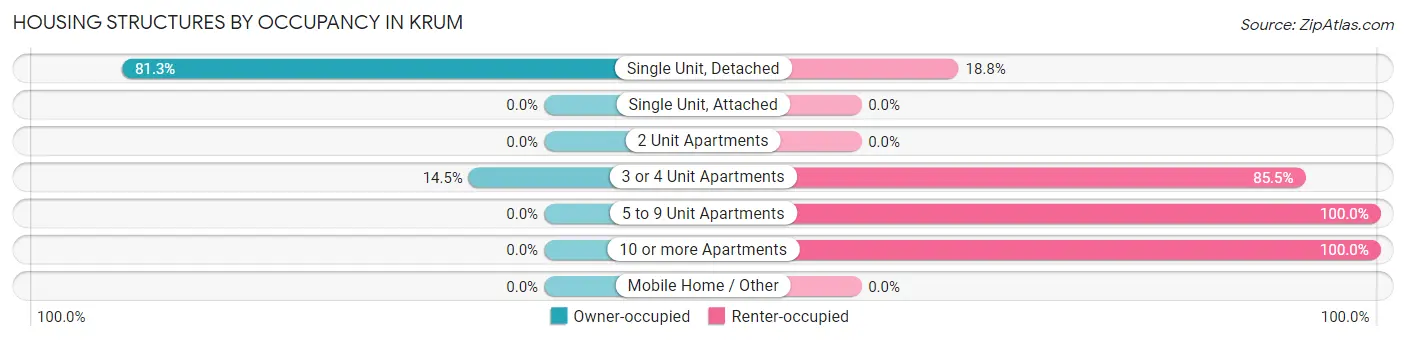
| Structure Type | Owner-occupied | Renter-occupied |
| Single Unit, Detached | 1,343 (81.2%) | 310 (18.8%) |
| Single Unit, Attached | 0 (0.0%) | 0 (0.0%) |
| 2 Unit Apartments | 0 (0.0%) | 0 (0.0%) |
| 3 or 4 Unit Apartments | 10 (14.5%) | 59 (85.5%) |
| 5 to 9 Unit Apartments | 0 (0.0%) | 93 (100.0%) |
| 10 or more Apartments | 0 (0.0%) | 54 (100.0%) |
| Mobile Home / Other | 0 (0.0%) | 0 (0.0%) |
| Total | 1,353 (72.4%) | 516 (27.6%) |
Housing Structures by Number of Rooms in Krum
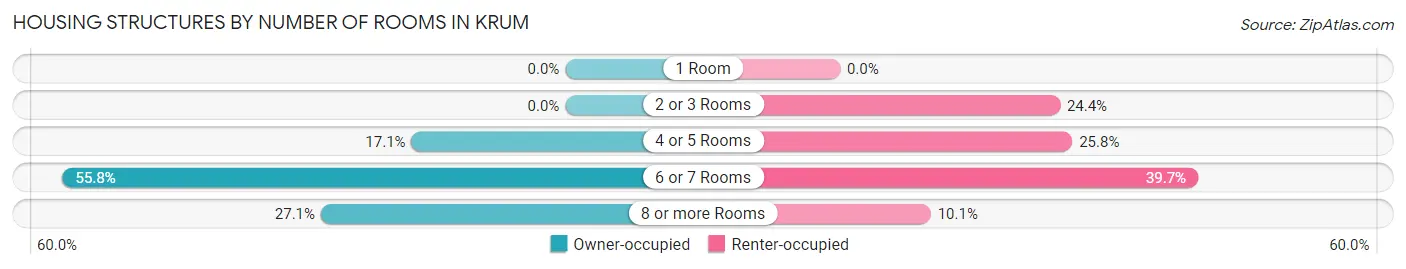
| Number of Rooms | Owner-occupied | Renter-occupied |
| 1 Room | 0 (0.0%) | 0 (0.0%) |
| 2 or 3 Rooms | 0 (0.0%) | 126 (24.4%) |
| 4 or 5 Rooms | 231 (17.1%) | 133 (25.8%) |
| 6 or 7 Rooms | 755 (55.8%) | 205 (39.7%) |
| 8 or more Rooms | 367 (27.1%) | 52 (10.1%) |
| Total | 1,353 (100.0%) | 516 (100.0%) |
Housing Structure by Heating Type in Krum
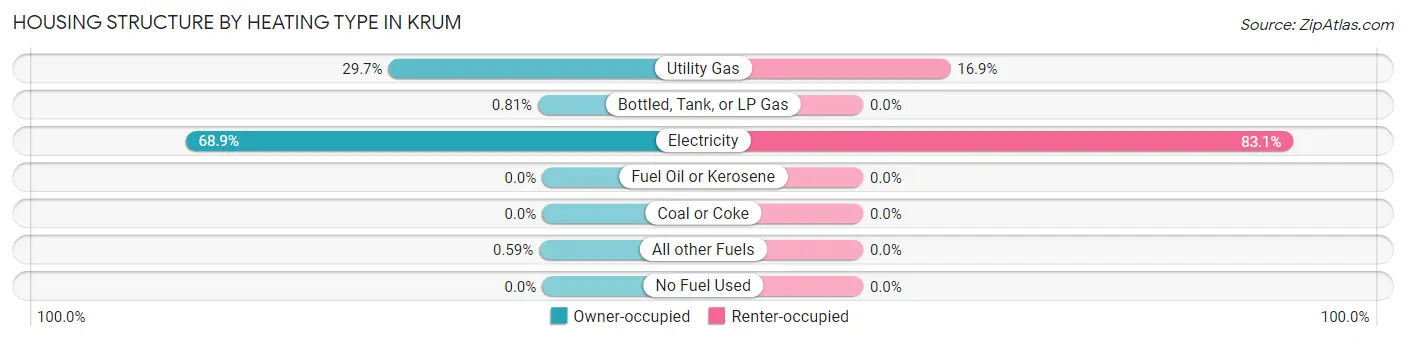
| Heating Type | Owner-occupied | Renter-occupied |
| Utility Gas | 402 (29.7%) | 87 (16.9%) |
| Bottled, Tank, or LP Gas | 11 (0.8%) | 0 (0.0%) |
| Electricity | 932 (68.9%) | 429 (83.1%) |
| Fuel Oil or Kerosene | 0 (0.0%) | 0 (0.0%) |
| Coal or Coke | 0 (0.0%) | 0 (0.0%) |
| All other Fuels | 8 (0.6%) | 0 (0.0%) |
| No Fuel Used | 0 (0.0%) | 0 (0.0%) |
| Total | 1,353 (100.0%) | 516 (100.0%) |
Household Vehicle Usage in Krum
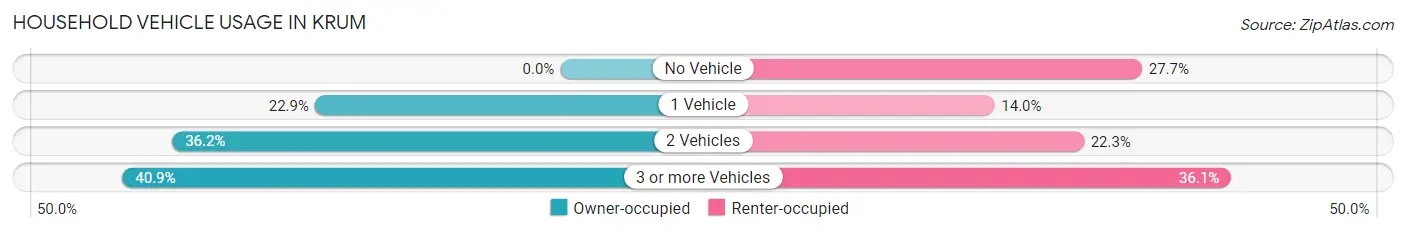
| Vehicles per Household | Owner-occupied | Renter-occupied |
| No Vehicle | 0 (0.0%) | 143 (27.7%) |
| 1 Vehicle | 310 (22.9%) | 72 (14.0%) |
| 2 Vehicles | 490 (36.2%) | 115 (22.3%) |
| 3 or more Vehicles | 553 (40.9%) | 186 (36.0%) |
| Total | 1,353 (100.0%) | 516 (100.0%) |
Real Estate & Mortgages in Krum
Real Estate and Mortgage Overview in Krum
| Characteristic | Without Mortgage | With Mortgage |
| Housing Units | 199 | 1,154 |
| Median Property Value | $261,300 | $239,500 |
| Median Household Income | $103,688 | $202 |
| Monthly Housing Costs | $801 | $46 |
| Real Estate Taxes | $4,590 | $0 |
Property Value by Mortgage Status in Krum
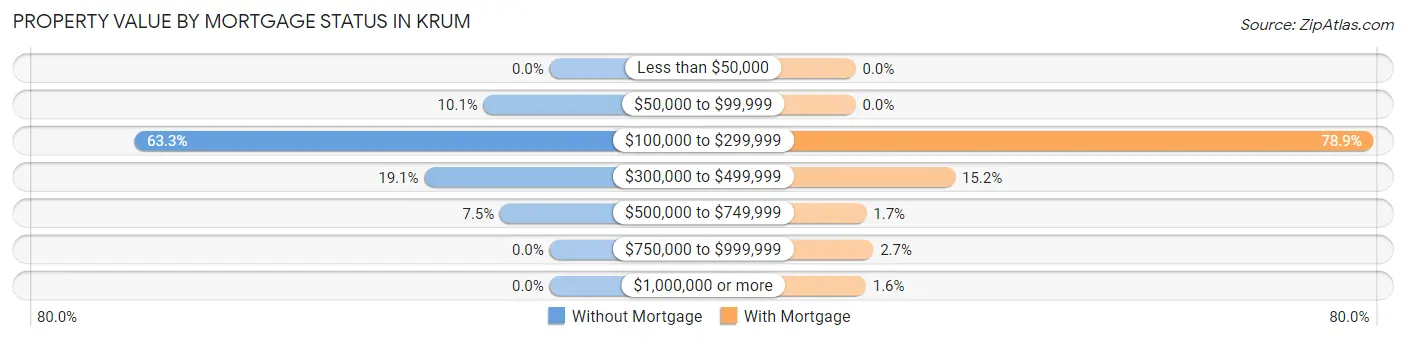
| Property Value | Without Mortgage | With Mortgage |
| Less than $50,000 | 0 (0.0%) | 0 (0.0%) |
| $50,000 to $99,999 | 20 (10.1%) | 0 (0.0%) |
| $100,000 to $299,999 | 126 (63.3%) | 911 (78.9%) |
| $300,000 to $499,999 | 38 (19.1%) | 175 (15.2%) |
| $500,000 to $749,999 | 15 (7.5%) | 19 (1.7%) |
| $750,000 to $999,999 | 0 (0.0%) | 31 (2.7%) |
| $1,000,000 or more | 0 (0.0%) | 18 (1.6%) |
| Total | 199 (100.0%) | 1,154 (100.0%) |
Household Income by Mortgage Status in Krum
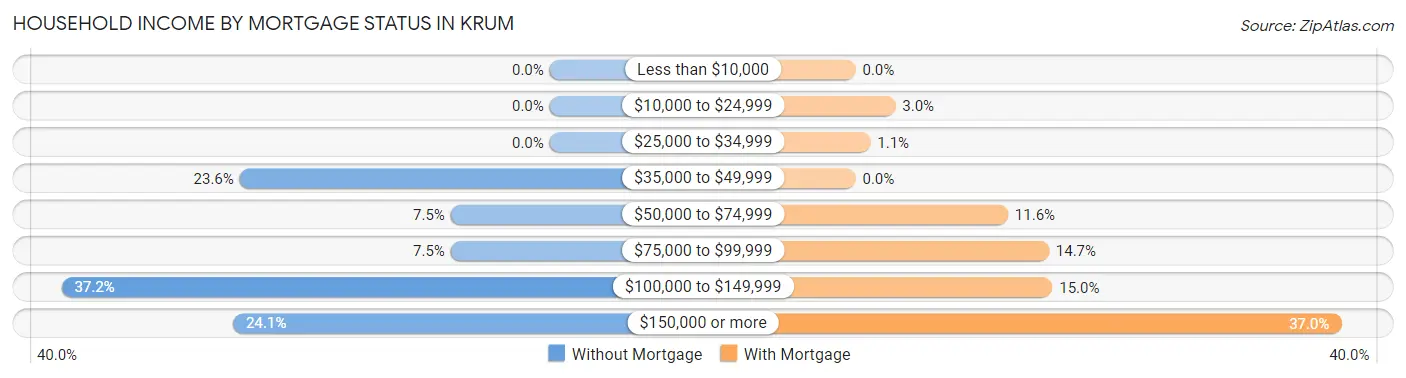
| Household Income | Without Mortgage | With Mortgage |
| Less than $10,000 | 0 (0.0%) | 0 (0.0%) |
| $10,000 to $24,999 | 0 (0.0%) | 35 (3.0%) |
| $25,000 to $34,999 | 0 (0.0%) | 13 (1.1%) |
| $35,000 to $49,999 | 47 (23.6%) | 0 (0.0%) |
| $50,000 to $74,999 | 15 (7.5%) | 134 (11.6%) |
| $75,000 to $99,999 | 15 (7.5%) | 170 (14.7%) |
| $100,000 to $149,999 | 74 (37.2%) | 173 (15.0%) |
| $150,000 or more | 48 (24.1%) | 427 (37.0%) |
| Total | 199 (100.0%) | 1,154 (100.0%) |
Property Value to Household Income Ratio in Krum
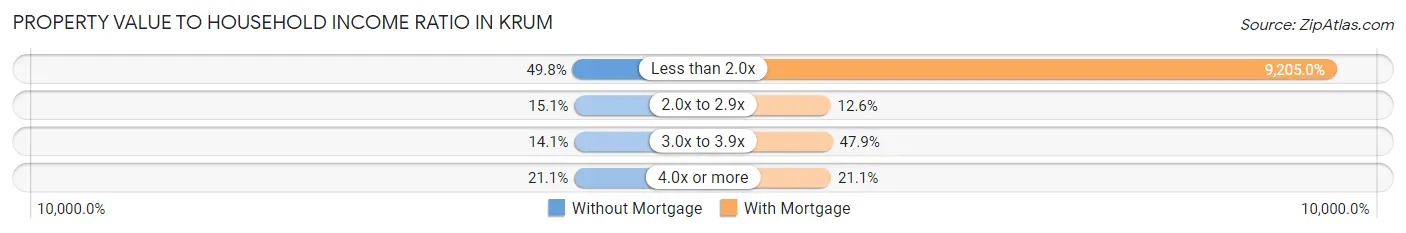
| Value-to-Income Ratio | Without Mortgage | With Mortgage |
| Less than 2.0x | 99 (49.7%) | 106,226 (9,205.0%) |
| 2.0x to 2.9x | 30 (15.1%) | 145 (12.6%) |
| 3.0x to 3.9x | 28 (14.1%) | 553 (47.9%) |
| 4.0x or more | 42 (21.1%) | 243 (21.1%) |
| Total | 199 (100.0%) | 1,154 (100.0%) |
Real Estate Taxes by Mortgage Status in Krum
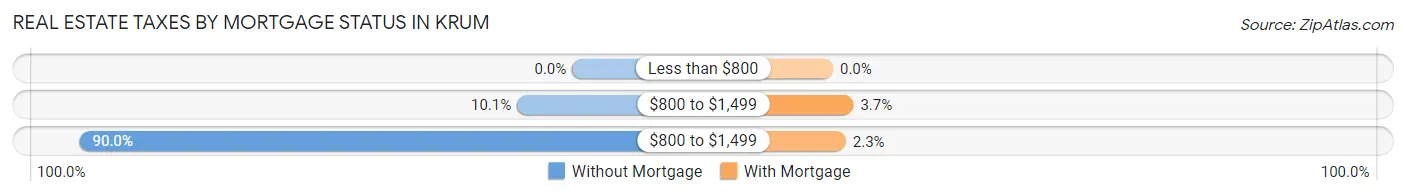
| Property Taxes | Without Mortgage | With Mortgage |
| Less than $800 | 0 (0.0%) | 0 (0.0%) |
| $800 to $1,499 | 20 (10.1%) | 43 (3.7%) |
| $800 to $1,499 | 179 (89.9%) | 27 (2.3%) |
| Total | 199 (100.0%) | 1,154 (100.0%) |
Health & Disability in Krum
Health Insurance Coverage by Age in Krum
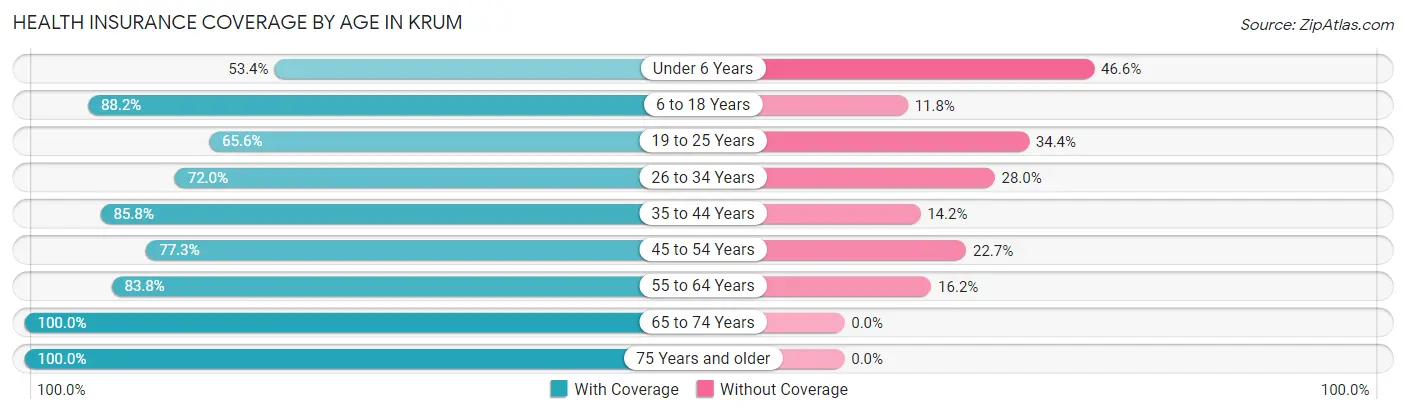
| Age Bracket | With Coverage | Without Coverage |
| Under 6 Years | 265 (53.4%) | 231 (46.6%) |
| 6 to 18 Years | 1,059 (88.2%) | 142 (11.8%) |
| 19 to 25 Years | 242 (65.6%) | 127 (34.4%) |
| 26 to 34 Years | 537 (72.0%) | 209 (28.0%) |
| 35 to 44 Years | 964 (85.8%) | 159 (14.2%) |
| 45 to 54 Years | 545 (77.3%) | 160 (22.7%) |
| 55 to 64 Years | 388 (83.8%) | 75 (16.2%) |
| 65 to 74 Years | 274 (100.0%) | 0 (0.0%) |
| 75 Years and older | 250 (100.0%) | 0 (0.0%) |
| Total | 4,524 (80.4%) | 1,103 (19.6%) |
Health Insurance Coverage by Citizenship Status in Krum
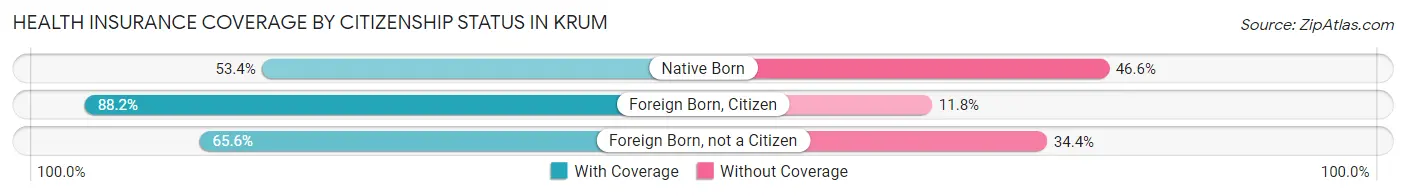
| Citizenship Status | With Coverage | Without Coverage |
| Native Born | 265 (53.4%) | 231 (46.6%) |
| Foreign Born, Citizen | 1,059 (88.2%) | 142 (11.8%) |
| Foreign Born, not a Citizen | 242 (65.6%) | 127 (34.4%) |
Health Insurance Coverage by Household Income in Krum
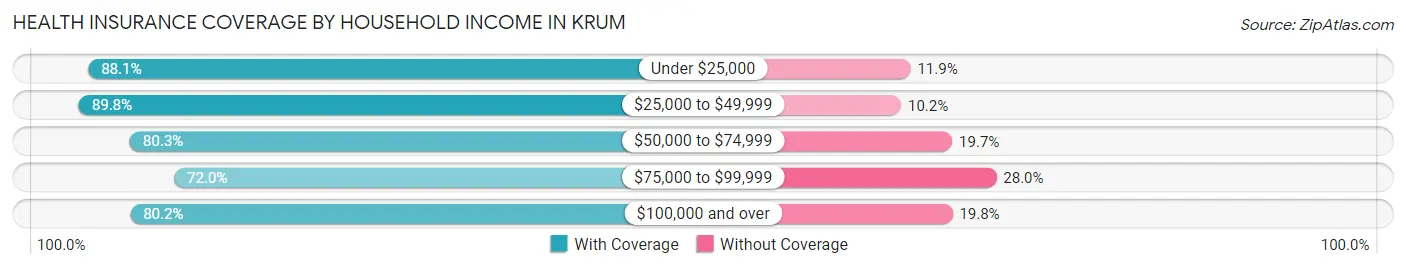
| Household Income | With Coverage | Without Coverage |
| Under $25,000 | 96 (88.1%) | 13 (11.9%) |
| $25,000 to $49,999 | 521 (89.8%) | 59 (10.2%) |
| $50,000 to $74,999 | 427 (80.3%) | 105 (19.7%) |
| $75,000 to $99,999 | 488 (72.0%) | 190 (28.0%) |
| $100,000 and over | 2,983 (80.2%) | 736 (19.8%) |
Public vs Private Health Insurance Coverage by Age in Krum
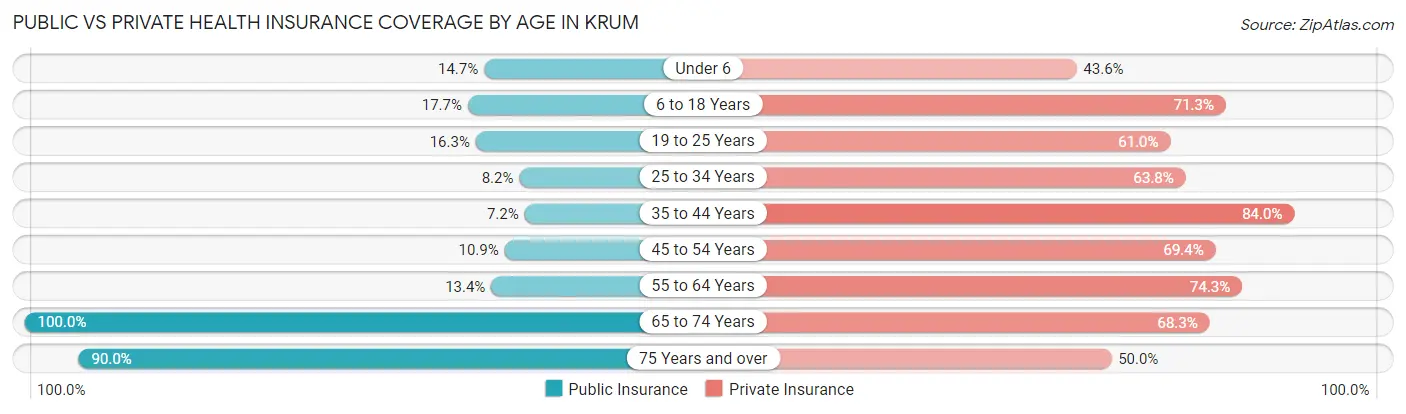
| Age Bracket | Public Insurance | Private Insurance |
| Under 6 | 73 (14.7%) | 216 (43.5%) |
| 6 to 18 Years | 213 (17.7%) | 856 (71.3%) |
| 19 to 25 Years | 60 (16.3%) | 225 (61.0%) |
| 25 to 34 Years | 61 (8.2%) | 476 (63.8%) |
| 35 to 44 Years | 81 (7.2%) | 943 (84.0%) |
| 45 to 54 Years | 77 (10.9%) | 489 (69.4%) |
| 55 to 64 Years | 62 (13.4%) | 344 (74.3%) |
| 65 to 74 Years | 274 (100.0%) | 187 (68.2%) |
| 75 Years and over | 225 (90.0%) | 125 (50.0%) |
| Total | 1,126 (20.0%) | 3,861 (68.6%) |
Disability Status by Sex by Age in Krum
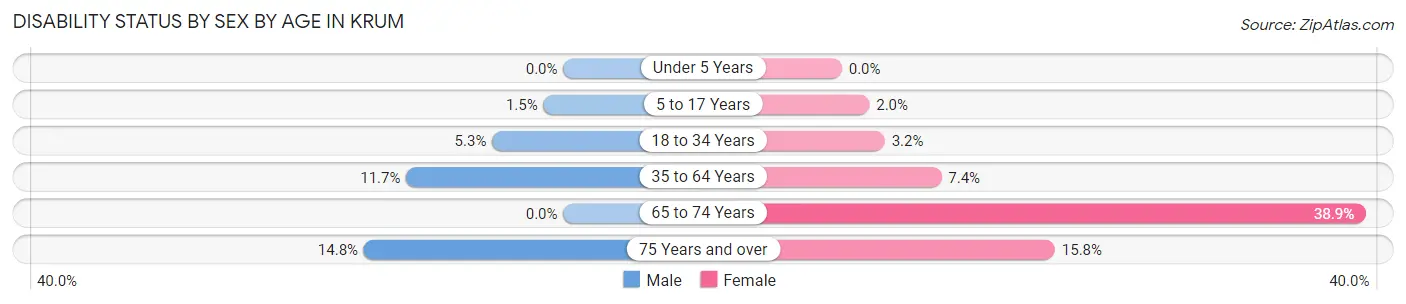
| Age Bracket | Male | Female |
| Under 5 Years | 0 (0.0%) | 0 (0.0%) |
| 5 to 17 Years | 8 (1.5%) | 14 (2.0%) |
| 18 to 34 Years | 29 (5.3%) | 19 (3.2%) |
| 35 to 64 Years | 144 (11.7%) | 78 (7.4%) |
| 65 to 74 Years | 0 (0.0%) | 79 (38.9%) |
| 75 Years and over | 8 (14.8%) | 31 (15.8%) |
Disability Class by Sex by Age in Krum
Disability Class: Hearing Difficulty
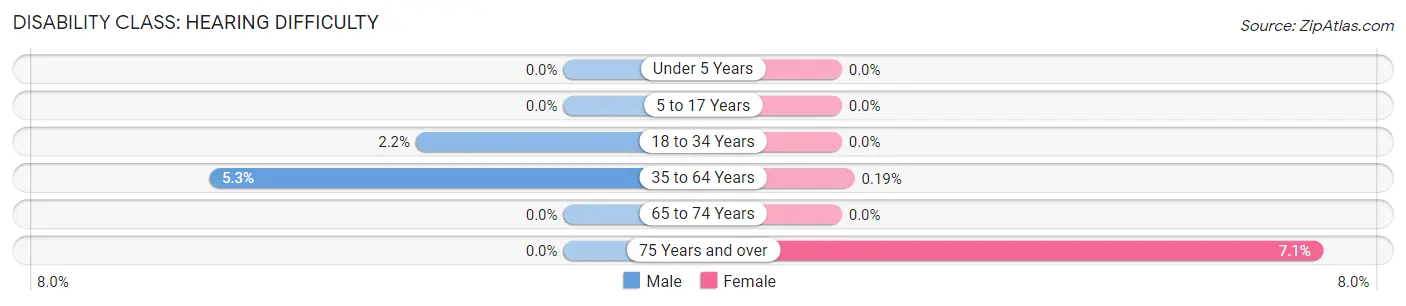
| Age Bracket | Male | Female |
| Under 5 Years | 0 (0.0%) | 0 (0.0%) |
| 5 to 17 Years | 0 (0.0%) | 0 (0.0%) |
| 18 to 34 Years | 12 (2.2%) | 0 (0.0%) |
| 35 to 64 Years | 65 (5.3%) | 2 (0.2%) |
| 65 to 74 Years | 0 (0.0%) | 0 (0.0%) |
| 75 Years and over | 0 (0.0%) | 14 (7.1%) |
Disability Class: Vision Difficulty
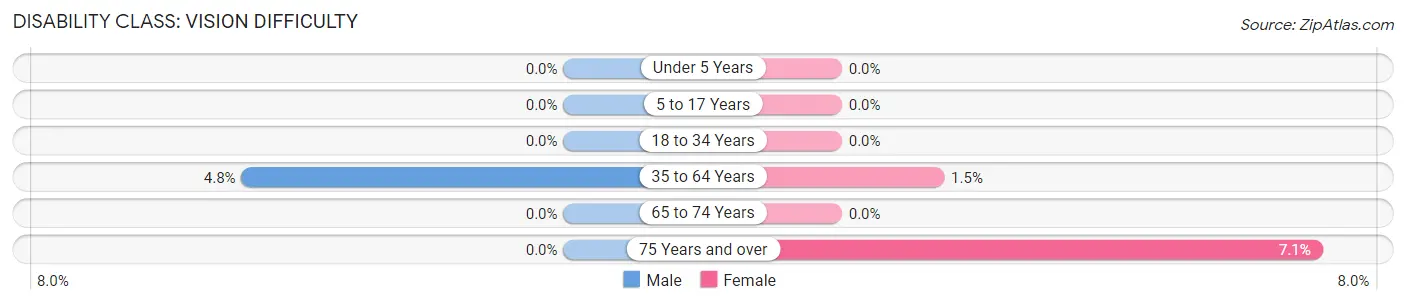
| Age Bracket | Male | Female |
| Under 5 Years | 0 (0.0%) | 0 (0.0%) |
| 5 to 17 Years | 0 (0.0%) | 0 (0.0%) |
| 18 to 34 Years | 0 (0.0%) | 0 (0.0%) |
| 35 to 64 Years | 59 (4.8%) | 16 (1.5%) |
| 65 to 74 Years | 0 (0.0%) | 0 (0.0%) |
| 75 Years and over | 0 (0.0%) | 14 (7.1%) |
Disability Class: Cognitive Difficulty
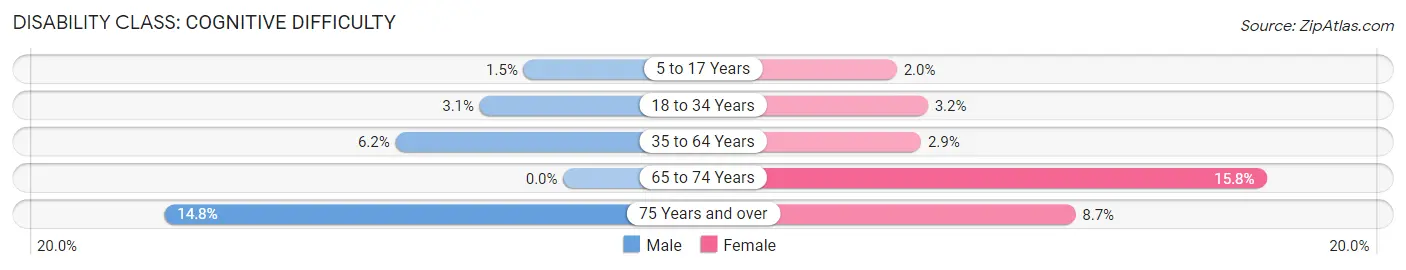
| Age Bracket | Male | Female |
| 5 to 17 Years | 8 (1.5%) | 14 (2.0%) |
| 18 to 34 Years | 17 (3.1%) | 19 (3.2%) |
| 35 to 64 Years | 77 (6.2%) | 31 (2.9%) |
| 65 to 74 Years | 0 (0.0%) | 32 (15.8%) |
| 75 Years and over | 8 (14.8%) | 17 (8.7%) |
Disability Class: Ambulatory Difficulty
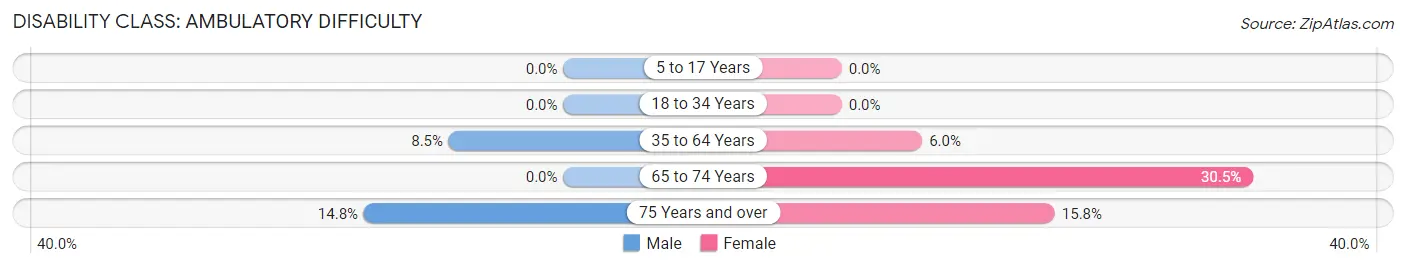
| Age Bracket | Male | Female |
| 5 to 17 Years | 0 (0.0%) | 0 (0.0%) |
| 18 to 34 Years | 0 (0.0%) | 0 (0.0%) |
| 35 to 64 Years | 105 (8.5%) | 63 (6.0%) |
| 65 to 74 Years | 0 (0.0%) | 62 (30.5%) |
| 75 Years and over | 8 (14.8%) | 31 (15.8%) |
Disability Class: Self-Care Difficulty
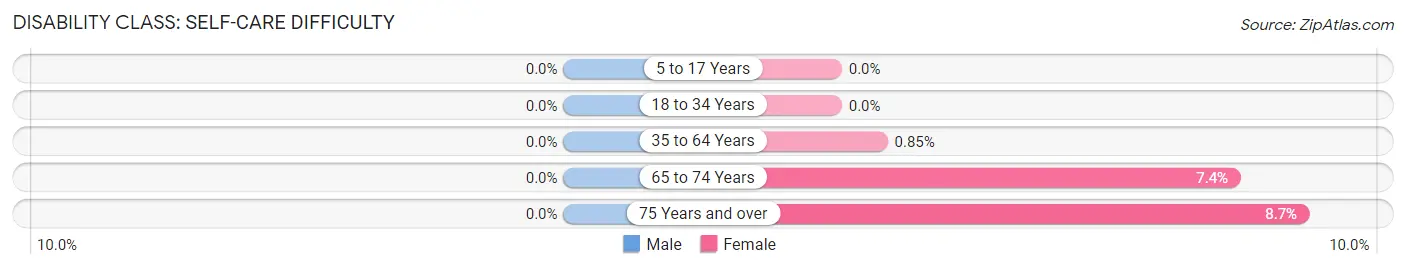
| Age Bracket | Male | Female |
| 5 to 17 Years | 0 (0.0%) | 0 (0.0%) |
| 18 to 34 Years | 0 (0.0%) | 0 (0.0%) |
| 35 to 64 Years | 0 (0.0%) | 9 (0.9%) |
| 65 to 74 Years | 0 (0.0%) | 15 (7.4%) |
| 75 Years and over | 0 (0.0%) | 17 (8.7%) |
Technology Access in Krum
Computing Device Access in Krum
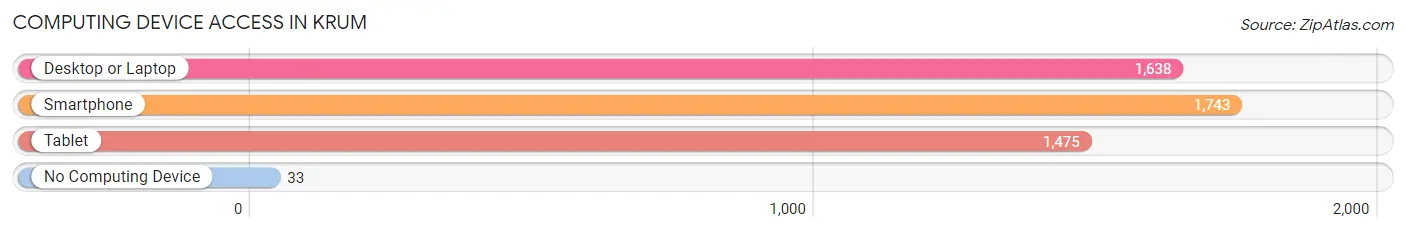
| Device Type | # Households | % Households |
| Desktop or Laptop | 1,638 | 87.6% |
| Smartphone | 1,743 | 93.3% |
| Tablet | 1,475 | 78.9% |
| No Computing Device | 33 | 1.8% |
| Total | 1,869 | 100.0% |
Internet Access in Krum
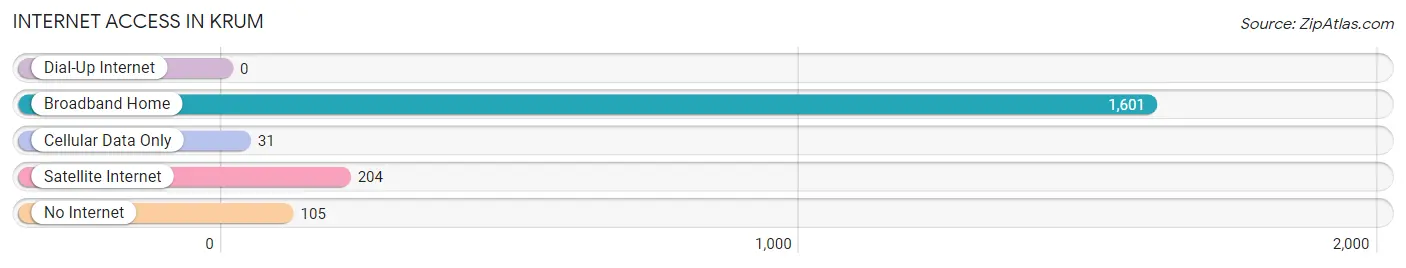
| Internet Type | # Households | % Households |
| Dial-Up Internet | 0 | 0.0% |
| Broadband Home | 1,601 | 85.7% |
| Cellular Data Only | 31 | 1.7% |
| Satellite Internet | 204 | 10.9% |
| No Internet | 105 | 5.6% |
| Total | 1,869 | 100.0% |
Krum Summary
Krum is a small town located in Denton County, Texas, United States. It is situated about 30 miles northwest of Dallas and is part of the Dallas-Fort Worth-Arlington metropolitan area. The population of Krum was estimated to be 4,157 in 2019.
History
Krum was founded in 1881 by a group of settlers from Germany. The town was named after a German immigrant, John Krum, who was one of the first settlers in the area. The town was originally a farming community, but it soon developed into a small town with a variety of businesses.
In the early 1900s, Krum was a thriving community with a variety of businesses, including a bank, a hotel, a blacksmith shop, a livery stable, a cotton gin, and a general store. The town also had a school, a post office, and a church.
In the 1920s, Krum began to experience a decline in population due to the Great Depression. The population decreased from 1,000 in 1920 to just over 500 in 1930. The population continued to decline until the 1950s when it began to slowly increase again.
Geography
Krum is located in Denton County, Texas, about 30 miles northwest of Dallas. The town is situated on the banks of the Elm Fork of the Trinity River. The town is surrounded by rolling hills and is located in the Blackland Prairie region of Texas.
The climate in Krum is hot and humid in the summer and mild in the winter. The average temperature in the summer is around 90 degrees Fahrenheit and the average temperature in the winter is around 50 degrees Fahrenheit.
Economy
Krum’s economy is largely based on agriculture and manufacturing. The town is home to several large farms that produce a variety of crops, including cotton, corn, wheat, and hay. The town also has several manufacturing plants that produce a variety of products, including furniture, clothing, and electronics.
Krum also has a thriving retail sector, with several stores and restaurants located in the town. The town also has a variety of services, including banks, medical facilities, and a post office.
Demographics
Krum’s population was estimated to be 4,157 in 2019. The town has a diverse population, with the majority of residents being of white (76.3%) and Hispanic (17.2%) descent. The median household income in Krum is $50,945, which is slightly lower than the national average.
Krum is a small town with a rich history and a diverse population. The town has a thriving economy and is home to a variety of businesses and services. Krum is a great place to live and work, and it is a great place to raise a family.
Common Questions
What is Per Capita Income in Krum?
Per Capita income in Krum is $36,874.
What is the Median Family Income in Krum?
Median Family Income in Krum is $110,094.
What is the Median Household income in Krum?
Median Household Income in Krum is $105,366.
What is Income or Wage Gap in Krum?
Income or Wage Gap in Krum is 24.0%.
Women in Krum earn 76.0 cents for every dollar earned by a man.
What is Inequality or Gini Index in Krum?
Inequality or Gini Index in Krum is 0.34.
What is the Total Population of Krum?
Total Population of Krum is 5,627.
What is the Total Male Population of Krum?
Total Male Population of Krum is 2,713.
What is the Total Female Population of Krum?
Total Female Population of Krum is 2,914.
What is the Ratio of Males per 100 Females in Krum?
There are 93.10 Males per 100 Females in Krum.
What is the Ratio of Females per 100 Males in Krum?
There are 107.41 Females per 100 Males in Krum.
What is the Median Population Age in Krum?
Median Population Age in Krum is 35.0 Years.
What is the Average Family Size in Krum
Average Family Size in Krum is 3.4 People.
What is the Average Household Size in Krum
Average Household Size in Krum is 3.0 People.
How Large is the Labor Force in Krum?
There are 3,025 People in the Labor Forcein in Krum.
What is the Percentage of People in the Labor Force in Krum?
72.6% of People are in the Labor Force in Krum.
What is the Unemployment Rate in Krum?
Unemployment Rate in Krum is 1.5%.