Harrodsburg, KY Map & Demographics
Harrodsburg Map
Harrodsburg Overview
$26,399
PER CAPITA INCOME
$66,412
AVG FAMILY INCOME
$49,293
AVG HOUSEHOLD INCOME
20.3%
WAGE / INCOME GAP [ % ]
79.7¢/ $1
WAGE / INCOME GAP [ $ ]
0.37
INEQUALITY / GINI INDEX
9,057
TOTAL POPULATION
4,717
MALE POPULATION
4,340
FEMALE POPULATION
108.69
MALES / 100 FEMALES
92.01
FEMALES / 100 MALES
38.2
MEDIAN AGE
3.2
AVG FAMILY SIZE
2.2
AVG HOUSEHOLD SIZE
4,713
LABOR FORCE [ PEOPLE ]
64.0%
PERCENT IN LABOR FORCE
3.2%
UNEMPLOYMENT RATE
Harrodsburg Zip Codes
Harrodsburg Area Codes
Income in Harrodsburg
Income Overview in Harrodsburg
Per Capita Income in Harrodsburg is $26,399, while median incomes of families and households are $66,412 and $49,293 respectively.
| Characteristic | Number | Measure |
| Per Capita Income | 9,057 | $26,399 |
| Median Family Income | 2,028 | $66,412 |
| Mean Family Income | 2,028 | $73,421 |
| Median Household Income | 4,029 | $49,293 |
| Mean Household Income | 4,029 | $57,190 |
| Income Deficit | 2,028 | $0 |
| Wage / Income Gap (%) | 9,057 | 20.26% |
| Wage / Income Gap ($) | 9,057 | 79.74¢ per $1 |
| Gini / Inequality Index | 9,057 | 0.37 |
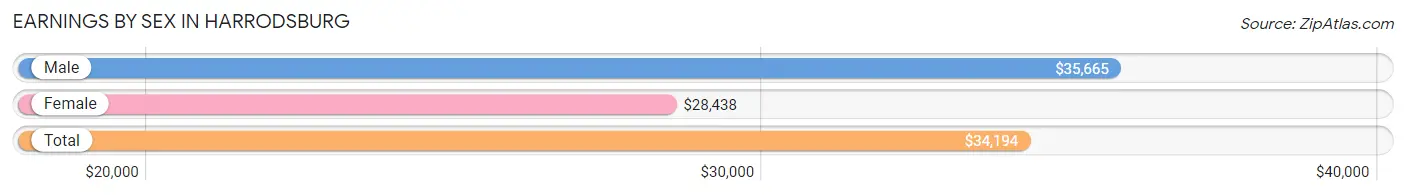
Earnings by Sex in Harrodsburg
Average Earnings in Harrodsburg are $34,194, $35,665 for men and $28,438 for women, a difference of 20.3%.
| Sex | Number | Average Earnings |
| Male | 2,669 (55.2%) | $35,665 |
| Female | 2,164 (44.8%) | $28,438 |
| Total | 4,833 (100.0%) | $34,194 |
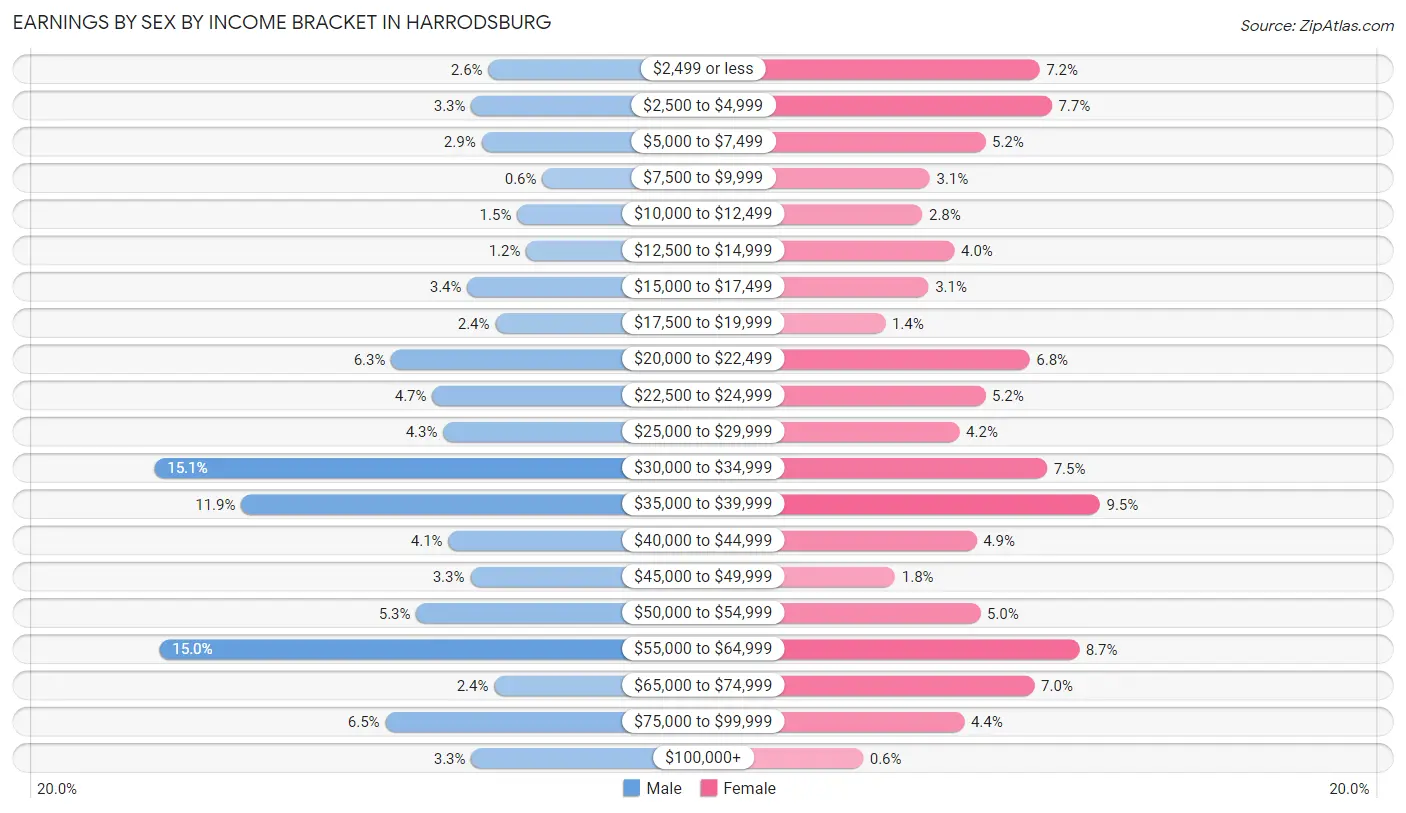
Earnings by Sex by Income Bracket in Harrodsburg
The most common earnings brackets in Harrodsburg are $30,000 to $34,999 for men (404 | 15.1%) and $35,000 to $39,999 for women (205 | 9.5%).
| Income | Male | Female |
| $2,499 or less | 70 (2.6%) | 156 (7.2%) |
| $2,500 to $4,999 | 87 (3.3%) | 166 (7.7%) |
| $5,000 to $7,499 | 77 (2.9%) | 112 (5.2%) |
| $7,500 to $9,999 | 16 (0.6%) | 67 (3.1%) |
| $10,000 to $12,499 | 41 (1.5%) | 61 (2.8%) |
| $12,500 to $14,999 | 32 (1.2%) | 87 (4.0%) |
| $15,000 to $17,499 | 91 (3.4%) | 66 (3.0%) |
| $17,500 to $19,999 | 63 (2.4%) | 31 (1.4%) |
| $20,000 to $22,499 | 167 (6.3%) | 148 (6.8%) |
| $22,500 to $24,999 | 126 (4.7%) | 112 (5.2%) |
| $25,000 to $29,999 | 115 (4.3%) | 91 (4.2%) |
| $30,000 to $34,999 | 404 (15.1%) | 162 (7.5%) |
| $35,000 to $39,999 | 317 (11.9%) | 205 (9.5%) |
| $40,000 to $44,999 | 110 (4.1%) | 105 (4.9%) |
| $45,000 to $49,999 | 88 (3.3%) | 39 (1.8%) |
| $50,000 to $54,999 | 142 (5.3%) | 108 (5.0%) |
| $55,000 to $64,999 | 399 (14.9%) | 188 (8.7%) |
| $65,000 to $74,999 | 64 (2.4%) | 152 (7.0%) |
| $75,000 to $99,999 | 173 (6.5%) | 95 (4.4%) |
| $100,000+ | 87 (3.3%) | 13 (0.6%) |
| Total | 2,669 (100.0%) | 2,164 (100.0%) |
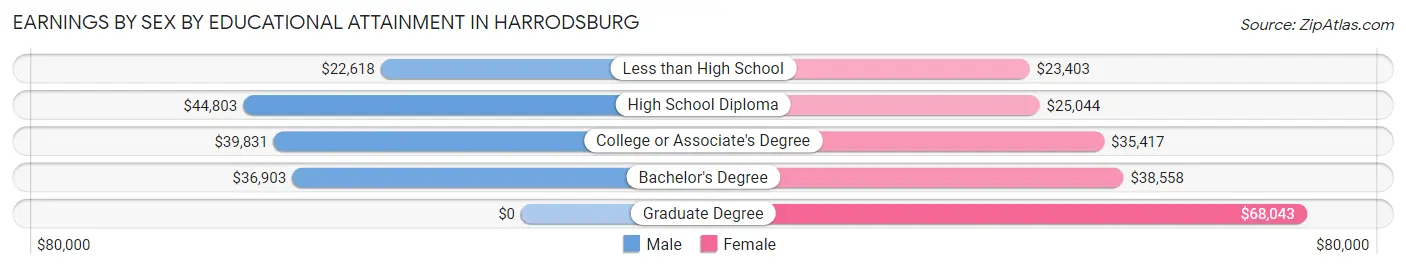
Earnings by Sex by Educational Attainment in Harrodsburg
Average earnings in Harrodsburg are $38,346 for men and $32,857 for women, a difference of 14.3%. Men with an educational attainment of high school diploma enjoy the highest average annual earnings of $44,803, while those with less than high school education earn the least with $22,618. Women with an educational attainment of graduate degree earn the most with the average annual earnings of $68,043, while those with less than high school education have the smallest earnings of $23,403.
| Educational Attainment | Male Income | Female Income |
| Less than High School | $22,618 | $23,403 |
| High School Diploma | $44,803 | $25,044 |
| College or Associate's Degree | $39,831 | $35,417 |
| Bachelor's Degree | $36,903 | $38,558 |
| Graduate Degree | - | - |
| Total | $38,346 | $32,857 |
Family Income in Harrodsburg
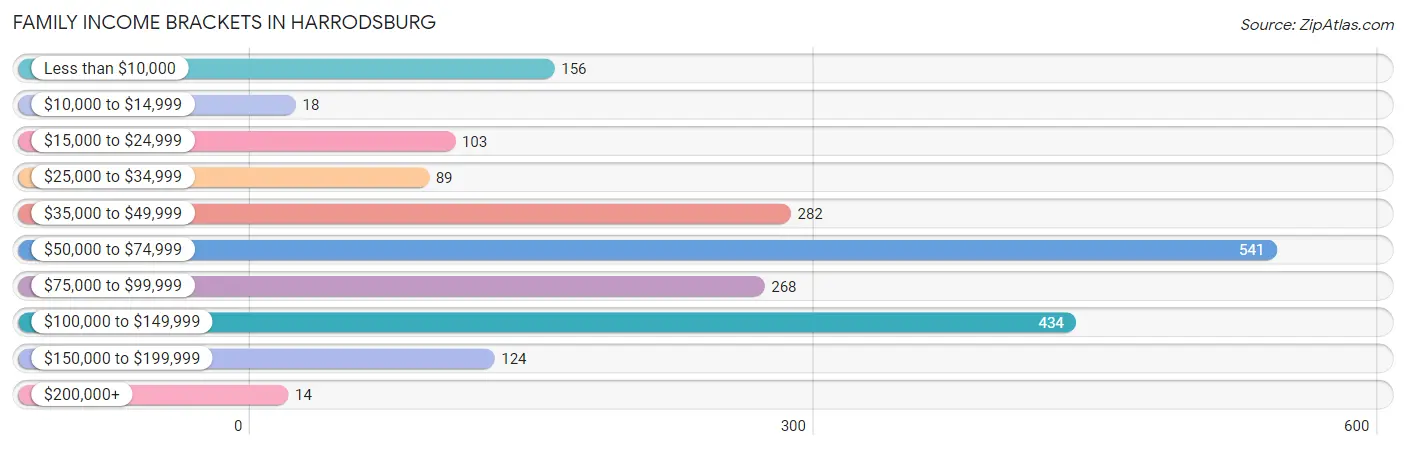
Family Income Brackets in Harrodsburg
According to the Harrodsburg family income data, there are 541 families falling into the $50,000 to $74,999 income range, which is the most common income bracket and makes up 26.7% of all families. Conversely, the $200,000+ income bracket is the least frequent group with only 14 families (0.7%) belonging to this category.
| Income Bracket | # Families | % Families |
| Less than $10,000 | 156 | 7.7% |
| $10,000 to $14,999 | 18 | 0.9% |
| $15,000 to $24,999 | 103 | 5.1% |
| $25,000 to $34,999 | 89 | 4.4% |
| $35,000 to $49,999 | 282 | 13.9% |
| $50,000 to $74,999 | 541 | 26.7% |
| $75,000 to $99,999 | 268 | 13.2% |
| $100,000 to $149,999 | 434 | 21.4% |
| $150,000 to $199,999 | 124 | 6.1% |
| $200,000+ | 14 | 0.7% |
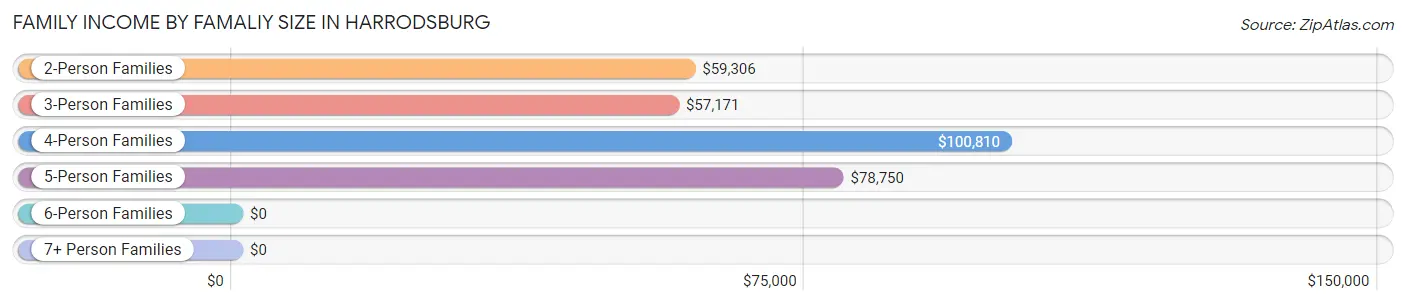
Family Income by Famaliy Size in Harrodsburg
4-person families (433 | 21.3%) account for the highest median family income in Harrodsburg with $100,810 per family, while 2-person families (969 | 47.8%) have the highest median income of $29,653 per family member.
| Income Bracket | # Families | Median Income |
| 2-Person Families | 969 (47.8%) | $59,306 |
| 3-Person Families | 466 (23.0%) | $57,171 |
| 4-Person Families | 433 (21.3%) | $100,810 |
| 5-Person Families | 126 (6.2%) | $78,750 |
| 6-Person Families | 15 (0.7%) | $0 |
| 7+ Person Families | 19 (0.9%) | $0 |
| Total | 2,028 (100.0%) | $66,412 |
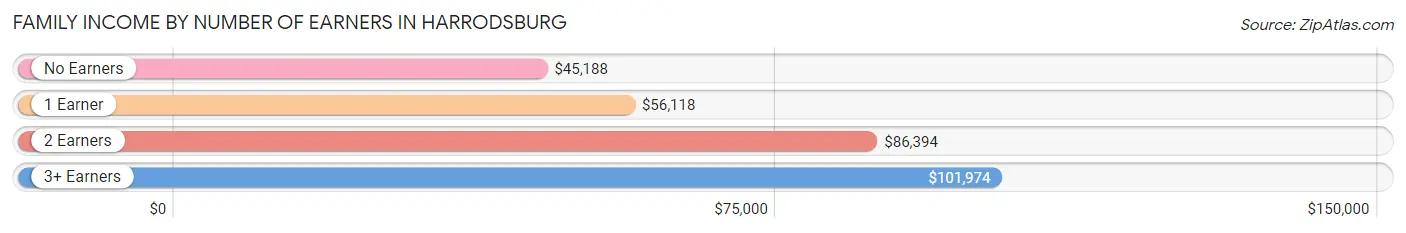
Family Income by Number of Earners in Harrodsburg
The median family income in Harrodsburg is $66,412, with families comprising 3+ earners (180) having the highest median family income of $101,974, while families with no earners (295) have the lowest median family income of $45,188, accounting for 8.9% and 14.5% of families, respectively.
| Number of Earners | # Families | Median Income |
| No Earners | 295 (14.5%) | $45,188 |
| 1 Earner | 662 (32.6%) | $56,118 |
| 2 Earners | 891 (43.9%) | $86,394 |
| 3+ Earners | 180 (8.9%) | $101,974 |
| Total | 2,028 (100.0%) | $66,412 |
Household Income in Harrodsburg
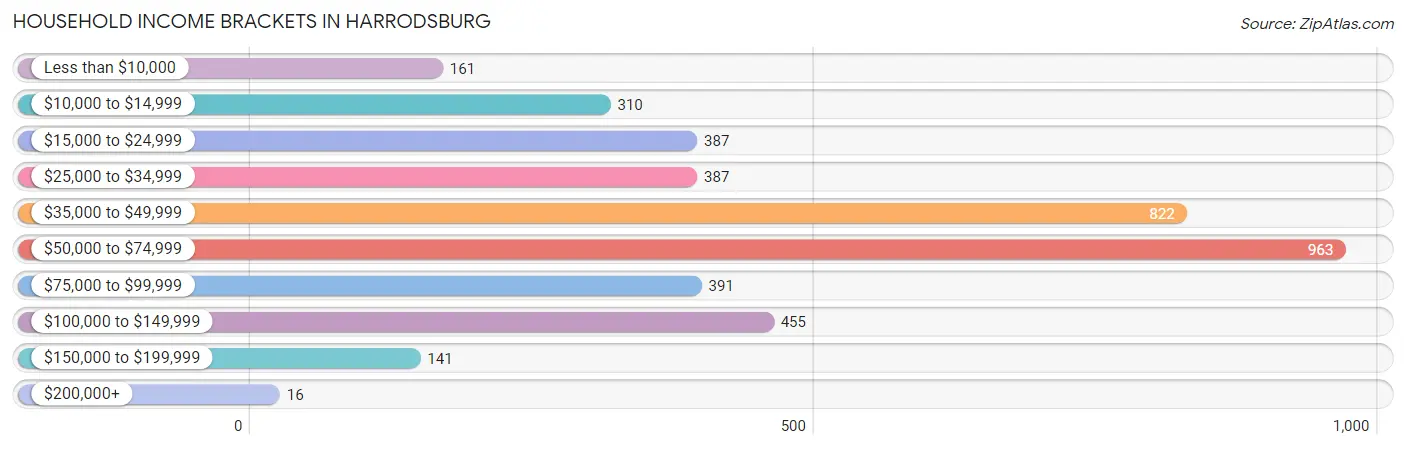
Household Income Brackets in Harrodsburg
With 963 households falling in the category, the $50,000 to $74,999 income range is the most frequent in Harrodsburg, accounting for 23.9% of all households. In contrast, only 16 households (0.4%) fall into the $200,000+ income bracket, making it the least populous group.
| Income Bracket | # Households | % Households |
| Less than $10,000 | 161 | 4.0% |
| $10,000 to $14,999 | 310 | 7.7% |
| $15,000 to $24,999 | 387 | 9.6% |
| $25,000 to $34,999 | 387 | 9.6% |
| $35,000 to $49,999 | 822 | 20.4% |
| $50,000 to $74,999 | 963 | 23.9% |
| $75,000 to $99,999 | 391 | 9.7% |
| $100,000 to $149,999 | 455 | 11.3% |
| $150,000 to $199,999 | 141 | 3.5% |
| $200,000+ | 16 | 0.4% |
Household Income by Householder Age in Harrodsburg
The median household income in Harrodsburg is $49,293, with the highest median household income of $58,942 found in the 25 to 44 years age bracket for the primary householder. A total of 1,307 households (32.4%) fall into this category. Meanwhile, the 65+ years age bracket for the primary householder has the lowest median household income of $33,534, with 1,171 households (29.1%) in this group.
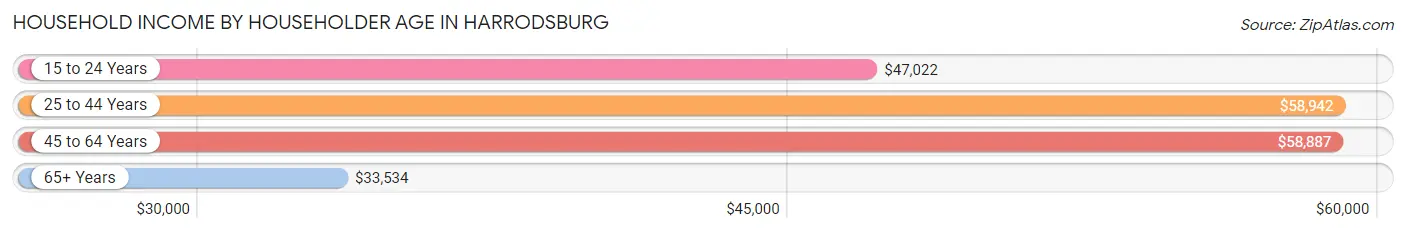
| Income Bracket | # Households | Median Income |
| 15 to 24 Years | 371 (9.2%) | $47,022 |
| 25 to 44 Years | 1,307 (32.4%) | $58,942 |
| 45 to 64 Years | 1,180 (29.3%) | $58,887 |
| 65+ Years | 1,171 (29.1%) | $33,534 |
| Total | 4,029 (100.0%) | $49,293 |
Poverty in Harrodsburg
Income Below Poverty by Sex and Age in Harrodsburg
With 12.2% poverty level for males and 17.5% for females among the residents of Harrodsburg, 5 year old males and 5 year old females are the most vulnerable to poverty, with 67 males (87.0%) and 15 females (40.5%) in their respective age groups living below the poverty level.
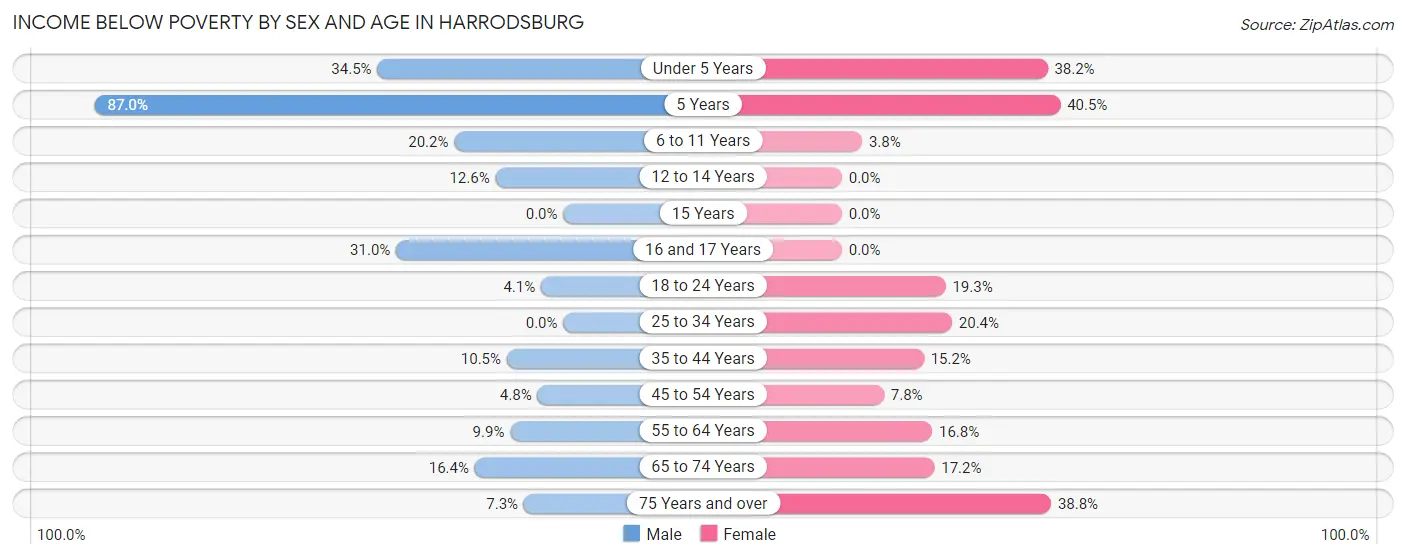
| Age Bracket | Male | Female |
| Under 5 Years | 127 (34.5%) | 92 (38.2%) |
| 5 Years | 67 (87.0%) | 15 (40.5%) |
| 6 to 11 Years | 67 (20.2%) | 12 (3.7%) |
| 12 to 14 Years | 16 (12.6%) | 0 (0.0%) |
| 15 Years | 0 (0.0%) | 0 (0.0%) |
| 16 and 17 Years | 36 (31.0%) | 0 (0.0%) |
| 18 to 24 Years | 20 (4.1%) | 82 (19.3%) |
| 25 to 34 Years | 0 (0.0%) | 141 (20.4%) |
| 35 to 44 Years | 71 (10.5%) | 62 (15.2%) |
| 45 to 54 Years | 23 (4.8%) | 47 (7.8%) |
| 55 to 64 Years | 49 (9.9%) | 69 (16.8%) |
| 65 to 74 Years | 73 (16.4%) | 102 (17.2%) |
| 75 Years and over | 12 (7.3%) | 125 (38.8%) |
| Total | 561 (12.2%) | 747 (17.5%) |
Income Above Poverty by Sex and Age in Harrodsburg
According to the poverty statistics in Harrodsburg, males aged 15 years and females aged 12 to 14 years are the age groups that are most secure financially, with 100.0% of males and 100.0% of females in these age groups living above the poverty line.
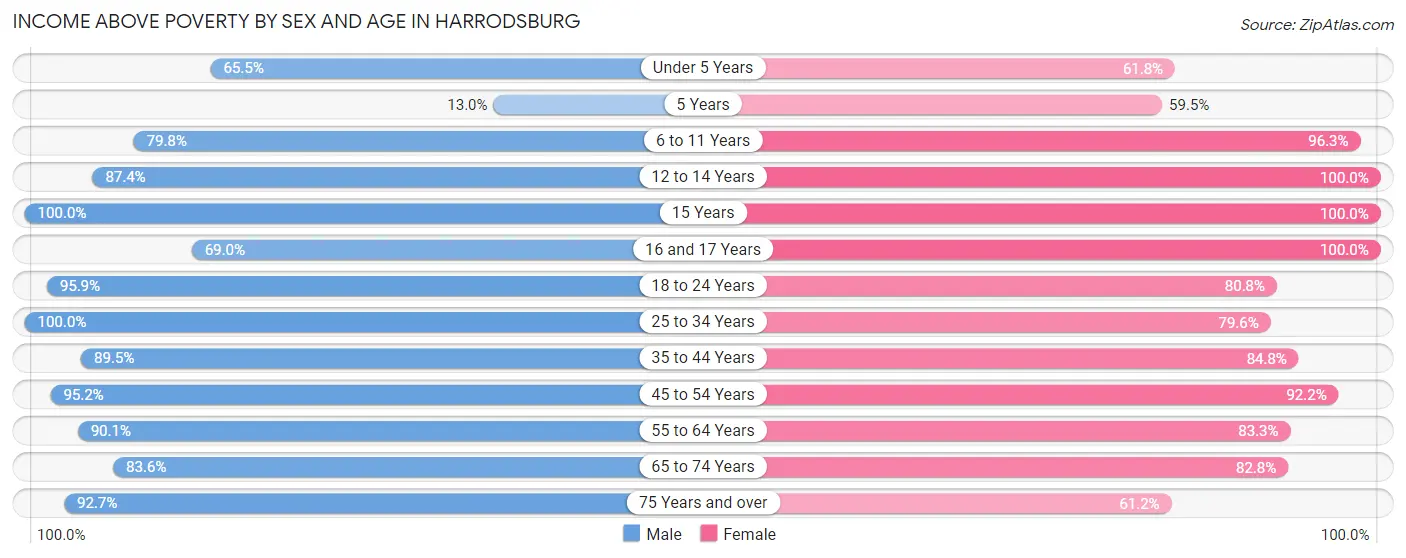
| Age Bracket | Male | Female |
| Under 5 Years | 241 (65.5%) | 149 (61.8%) |
| 5 Years | 10 (13.0%) | 22 (59.5%) |
| 6 to 11 Years | 264 (79.8%) | 308 (96.3%) |
| 12 to 14 Years | 111 (87.4%) | 66 (100.0%) |
| 15 Years | 74 (100.0%) | 20 (100.0%) |
| 16 and 17 Years | 80 (69.0%) | 132 (100.0%) |
| 18 to 24 Years | 463 (95.9%) | 344 (80.7%) |
| 25 to 34 Years | 769 (100.0%) | 549 (79.6%) |
| 35 to 44 Years | 606 (89.5%) | 346 (84.8%) |
| 45 to 54 Years | 456 (95.2%) | 555 (92.2%) |
| 55 to 64 Years | 448 (90.1%) | 343 (83.3%) |
| 65 to 74 Years | 371 (83.6%) | 492 (82.8%) |
| 75 Years and over | 152 (92.7%) | 197 (61.2%) |
| Total | 4,045 (87.8%) | 3,523 (82.5%) |
Income Below Poverty Among Married-Couple Families in Harrodsburg
The poverty statistics for married-couple families in Harrodsburg show that 5.9% or 83 of the total 1,402 families live below the poverty line. Families with 3 or 4 children have the highest poverty rate of 30.0%, comprising of 18 families. On the other hand, families with 1 or 2 children have the lowest poverty rate of 2.9%, which includes 17 families.
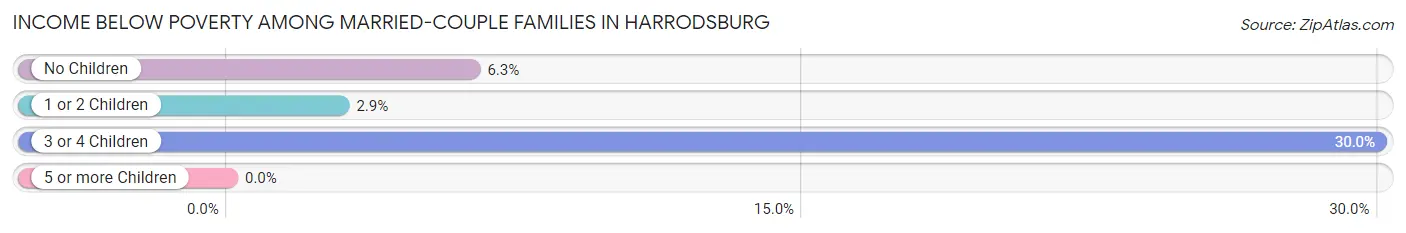
| Children | Above Poverty | Below Poverty |
| No Children | 710 (93.7%) | 48 (6.3%) |
| 1 or 2 Children | 567 (97.1%) | 17 (2.9%) |
| 3 or 4 Children | 42 (70.0%) | 18 (30.0%) |
| 5 or more Children | 0 (0.0%) | 0 (0.0%) |
| Total | 1,319 (94.1%) | 83 (5.9%) |
Income Below Poverty Among Single-Parent Households in Harrodsburg
According to the poverty data in Harrodsburg, 3.2% or 10 single-father households and 44.9% or 142 single-mother households are living below the poverty line. Among single-father households, those with no children have the highest poverty rate, with 10 households (5.3%) experiencing poverty. Likewise, among single-mother households, those with 3 or 4 children have the highest poverty rate, with 25 households (62.5%) falling below the poverty line.
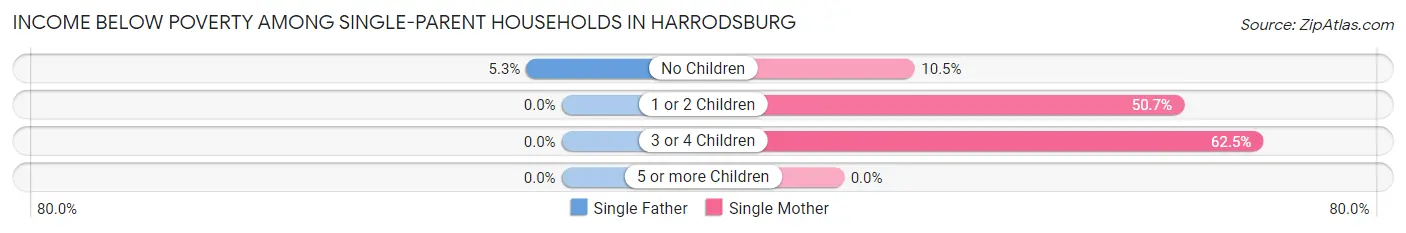
| Children | Single Father | Single Mother |
| No Children | 10 (5.3%) | 6 (10.5%) |
| 1 or 2 Children | 0 (0.0%) | 111 (50.7%) |
| 3 or 4 Children | 0 (0.0%) | 25 (62.5%) |
| 5 or more Children | 0 (0.0%) | 0 (0.0%) |
| Total | 10 (3.2%) | 142 (44.9%) |
Income Below Poverty Among Married-Couple vs Single-Parent Households in Harrodsburg
The poverty data for Harrodsburg shows that 83 of the married-couple family households (5.9%) and 152 of the single-parent households (24.3%) are living below the poverty level. Within the married-couple family households, those with 3 or 4 children have the highest poverty rate, with 18 households (30.0%) falling below the poverty line. Among the single-parent households, those with 3 or 4 children have the highest poverty rate, with 25 household (62.5%) living below poverty.
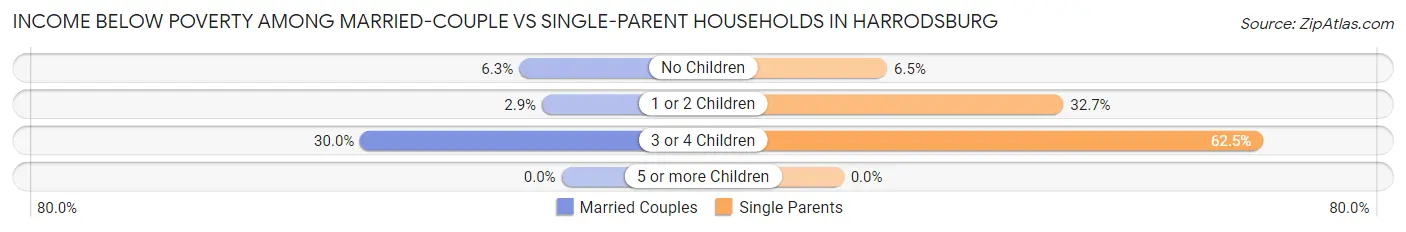
| Children | Married-Couple Families | Single-Parent Households |
| No Children | 48 (6.3%) | 16 (6.5%) |
| 1 or 2 Children | 17 (2.9%) | 111 (32.7%) |
| 3 or 4 Children | 18 (30.0%) | 25 (62.5%) |
| 5 or more Children | 0 (0.0%) | 0 (0.0%) |
| Total | 83 (5.9%) | 152 (24.3%) |
Race in Harrodsburg
The most populous races in Harrodsburg are White / Caucasian (7,756 | 85.6%), Two or more Races (626 | 6.9%), and Black / African American (563 | 6.2%).
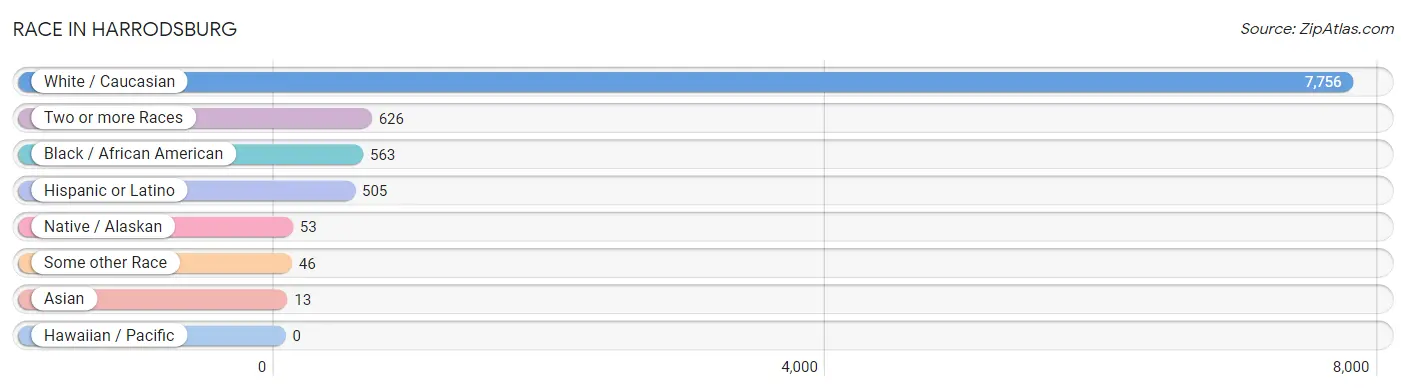
| Race | # Population | % Population |
| Asian | 13 | 0.1% |
| Black / African American | 563 | 6.2% |
| Hawaiian / Pacific | 0 | 0.0% |
| Hispanic or Latino | 505 | 5.6% |
| Native / Alaskan | 53 | 0.6% |
| White / Caucasian | 7,756 | 85.6% |
| Two or more Races | 626 | 6.9% |
| Some other Race | 46 | 0.5% |
| Total | 9,057 | 100.0% |
Ancestry in Harrodsburg
The most populous ancestries reported in Harrodsburg are American (2,182 | 24.1%), English (1,266 | 14.0%), German (657 | 7.2%), Irish (643 | 7.1%), and Mexican (484 | 5.3%), together accounting for 57.8% of all Harrodsburg residents.
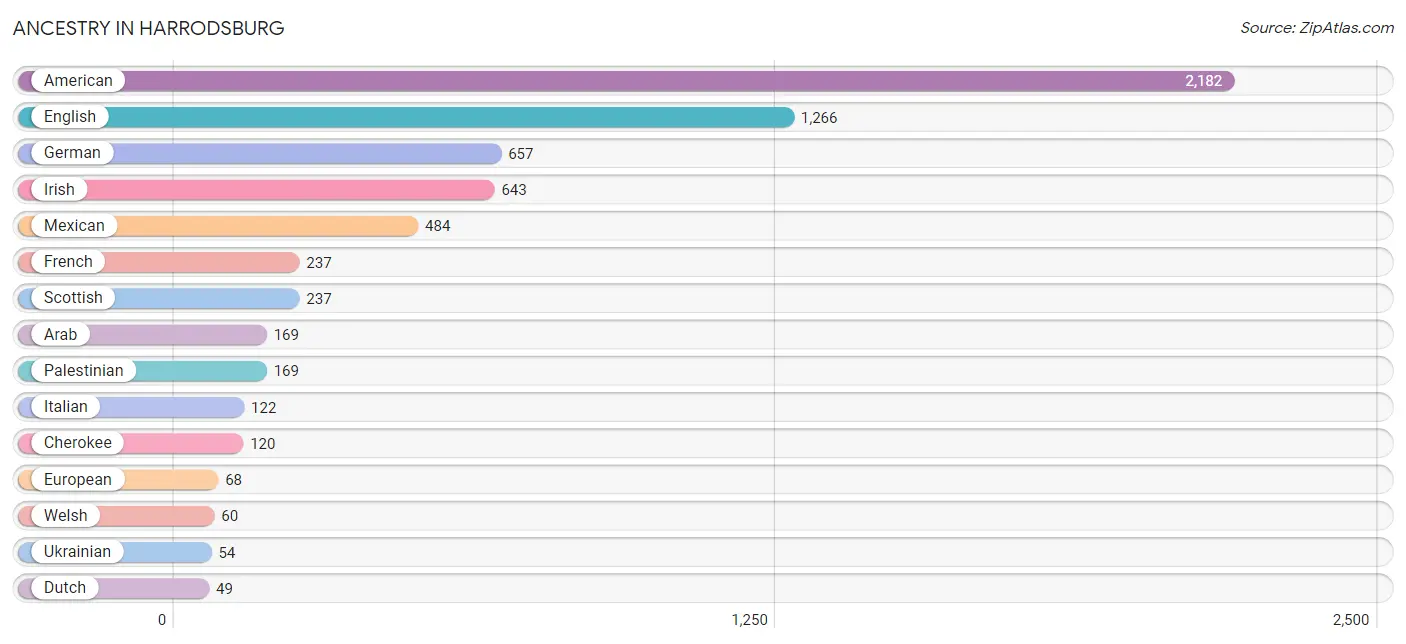
| Ancestry | # Population | % Population |
| American | 2,182 | 24.1% |
| Apache | 47 | 0.5% |
| Arab | 169 | 1.9% |
| British | 47 | 0.5% |
| Canadian | 40 | 0.4% |
| Cherokee | 120 | 1.3% |
| Dutch | 49 | 0.5% |
| English | 1,266 | 14.0% |
| European | 68 | 0.7% |
| French | 237 | 2.6% |
| German | 657 | 7.2% |
| Indian (Asian) | 13 | 0.1% |
| Irish | 643 | 7.1% |
| Italian | 122 | 1.3% |
| Mexican | 484 | 5.3% |
| Mexican American Indian | 48 | 0.5% |
| Norwegian | 24 | 0.3% |
| Palestinian | 169 | 1.9% |
| Polish | 22 | 0.2% |
| Scotch-Irish | 31 | 0.3% |
| Scottish | 237 | 2.6% |
| Ukrainian | 54 | 0.6% |
| Welsh | 60 | 0.7% | View All 23 Rows |
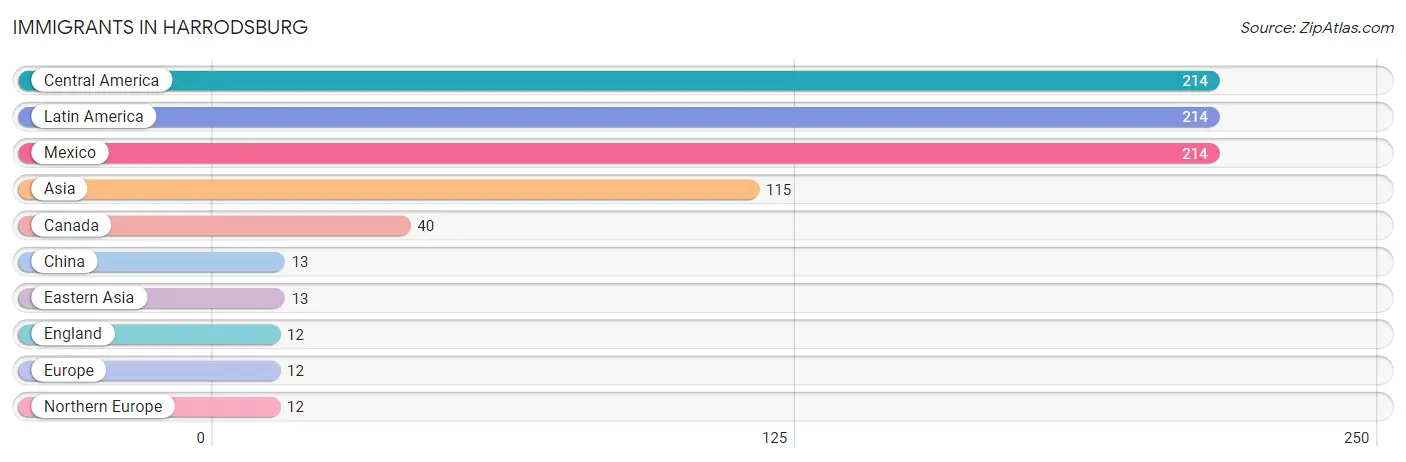
Immigrants in Harrodsburg
The most numerous immigrant groups reported in Harrodsburg came from Central America (214 | 2.4%), Latin America (214 | 2.4%), Mexico (214 | 2.4%), Asia (115 | 1.3%), and Canada (40 | 0.4%), together accounting for 8.8% of all Harrodsburg residents.
| Immigration Origin | # Population | % Population |
| Asia | 115 | 1.3% |
| Canada | 40 | 0.4% |
| Central America | 214 | 2.4% |
| China | 13 | 0.1% |
| Eastern Asia | 13 | 0.1% |
| England | 12 | 0.1% |
| Europe | 12 | 0.1% |
| Latin America | 214 | 2.4% |
| Mexico | 214 | 2.4% |
| Northern Europe | 12 | 0.1% | View All 10 Rows |
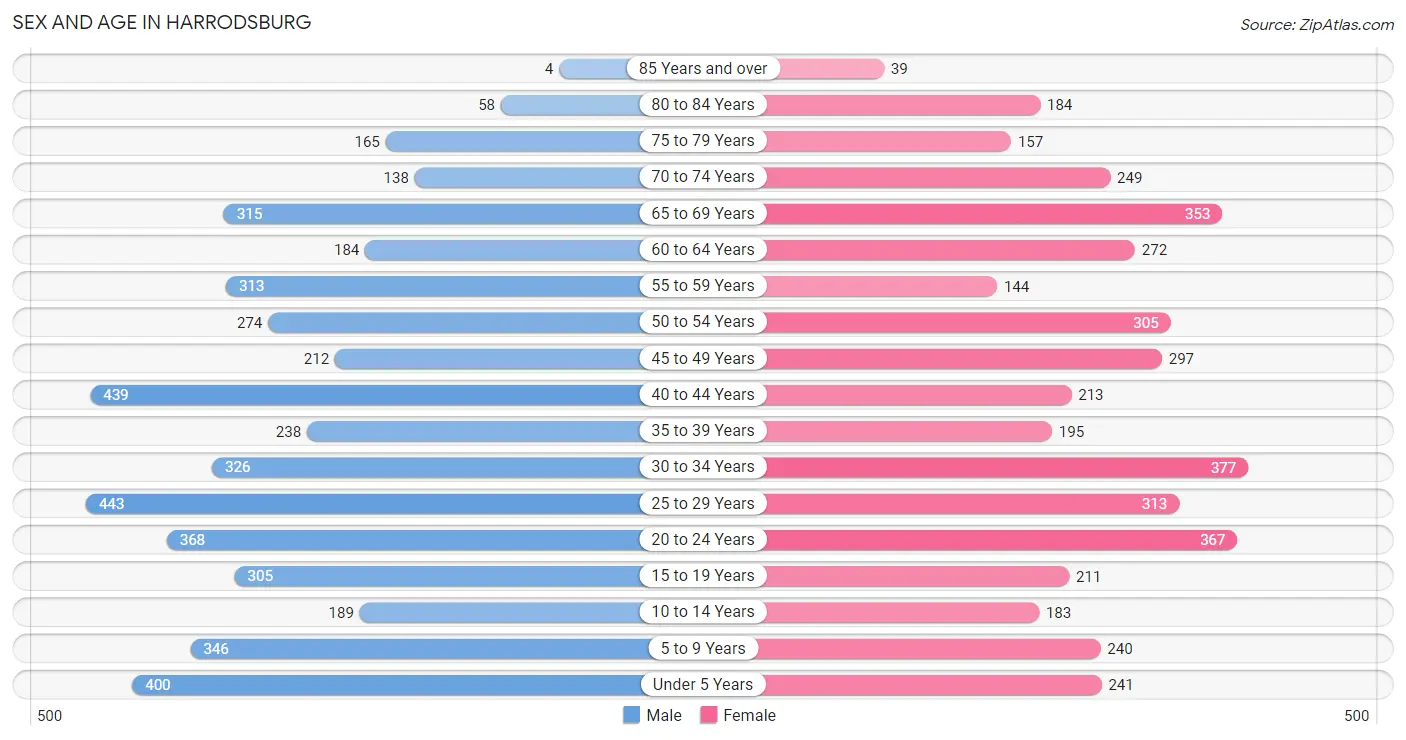
Sex and Age in Harrodsburg
Sex and Age in Harrodsburg
The most populous age groups in Harrodsburg are 25 to 29 Years (443 | 9.4%) for men and 30 to 34 Years (377 | 8.7%) for women.
| Age Bracket | Male | Female |
| Under 5 Years | 400 (8.5%) | 241 (5.6%) |
| 5 to 9 Years | 346 (7.3%) | 240 (5.5%) |
| 10 to 14 Years | 189 (4.0%) | 183 (4.2%) |
| 15 to 19 Years | 305 (6.5%) | 211 (4.9%) |
| 20 to 24 Years | 368 (7.8%) | 367 (8.5%) |
| 25 to 29 Years | 443 (9.4%) | 313 (7.2%) |
| 30 to 34 Years | 326 (6.9%) | 377 (8.7%) |
| 35 to 39 Years | 238 (5.1%) | 195 (4.5%) |
| 40 to 44 Years | 439 (9.3%) | 213 (4.9%) |
| 45 to 49 Years | 212 (4.5%) | 297 (6.8%) |
| 50 to 54 Years | 274 (5.8%) | 305 (7.0%) |
| 55 to 59 Years | 313 (6.6%) | 144 (3.3%) |
| 60 to 64 Years | 184 (3.9%) | 272 (6.3%) |
| 65 to 69 Years | 315 (6.7%) | 353 (8.1%) |
| 70 to 74 Years | 138 (2.9%) | 249 (5.7%) |
| 75 to 79 Years | 165 (3.5%) | 157 (3.6%) |
| 80 to 84 Years | 58 (1.2%) | 184 (4.2%) |
| 85 Years and over | 4 (0.1%) | 39 (0.9%) |
| Total | 4,717 (100.0%) | 4,340 (100.0%) |
Families and Households in Harrodsburg
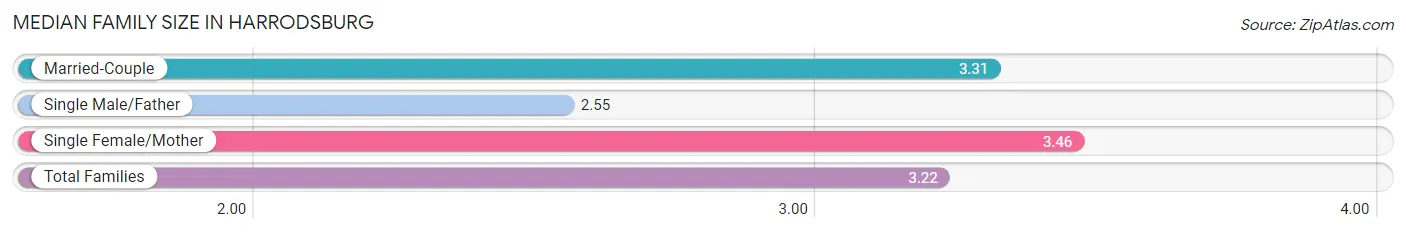
Median Family Size in Harrodsburg
The median family size in Harrodsburg is 3.22 persons per family, with single female/mother families (316 | 15.6%) accounting for the largest median family size of 3.46 persons per family. On the other hand, single male/father families (310 | 15.3%) represent the smallest median family size with 2.55 persons per family.
| Family Type | # Families | Family Size |
| Married-Couple | 1,402 (69.1%) | 3.31 |
| Single Male/Father | 310 (15.3%) | 2.55 |
| Single Female/Mother | 316 (15.6%) | 3.46 |
| Total Families | 2,028 (100.0%) | 3.22 |
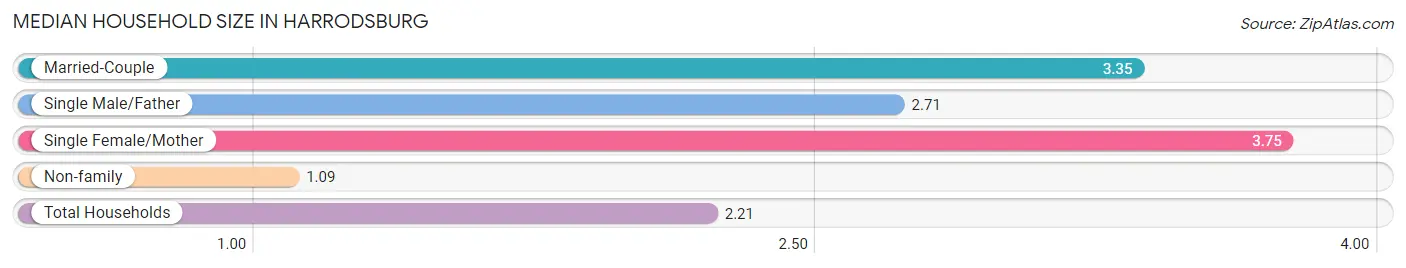
Median Household Size in Harrodsburg
The median household size in Harrodsburg is 2.21 persons per household, with single female/mother households (316 | 7.8%) accounting for the largest median household size of 3.75 persons per household. non-family households (2,001 | 49.7%) represent the smallest median household size with 1.09 persons per household.
| Household Type | # Households | Household Size |
| Married-Couple | 1,402 (34.8%) | 3.35 |
| Single Male/Father | 310 (7.7%) | 2.71 |
| Single Female/Mother | 316 (7.8%) | 3.75 |
| Non-family | 2,001 (49.7%) | 1.09 |
| Total Households | 4,029 (100.0%) | 2.21 |
Household Size by Marriage Status in Harrodsburg
Out of a total of 4,029 households in Harrodsburg, 2,028 (50.3%) are family households, while 2,001 (49.7%) are nonfamily households. The most numerous type of family households are 2-person households, comprising 937, and the most common type of nonfamily households are 1-person households, comprising 1,906.
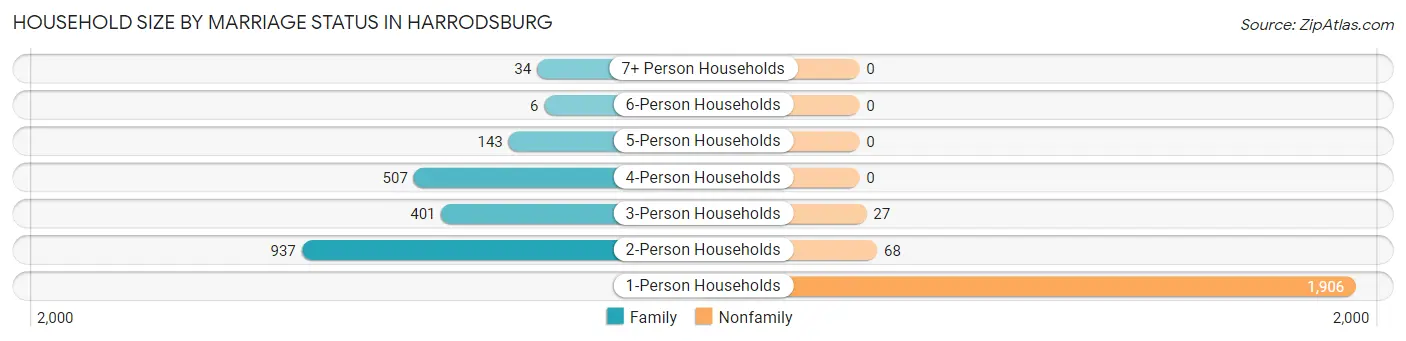
| Household Size | Family Households | Nonfamily Households |
| 1-Person Households | - | 1,906 (47.3%) |
| 2-Person Households | 937 (23.3%) | 68 (1.7%) |
| 3-Person Households | 401 (10.0%) | 27 (0.7%) |
| 4-Person Households | 507 (12.6%) | 0 (0.0%) |
| 5-Person Households | 143 (3.5%) | 0 (0.0%) |
| 6-Person Households | 6 (0.2%) | 0 (0.0%) |
| 7+ Person Households | 34 (0.8%) | 0 (0.0%) |
| Total | 2,028 (50.3%) | 2,001 (49.7%) |
Female Fertility in Harrodsburg
Fertility by Age in Harrodsburg
Average fertility rate in Harrodsburg is 93.0 births per 1,000 women. Women in the age bracket of 20 to 34 years have the highest fertility rate with 171.0 births per 1,000 women. Women in the age bracket of 20 to 34 years acount for 96.8% of all women with births.
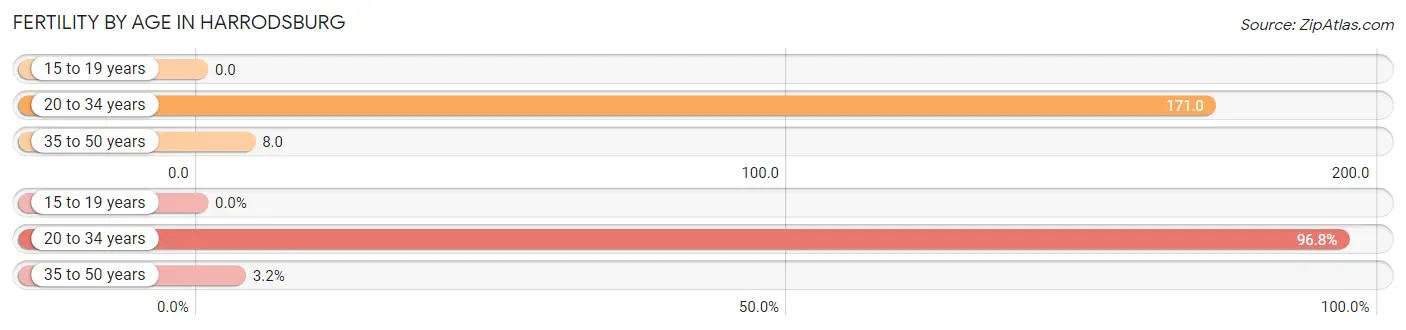
| Age Bracket | Women with Births | Births / 1,000 Women |
| 15 to 19 years | 0 (0.0%) | 0.0 |
| 20 to 34 years | 181 (96.8%) | 171.0 |
| 35 to 50 years | 6 (3.2%) | 8.0 |
| Total | 187 (100.0%) | 93.0 |
Fertility by Age by Marriage Status in Harrodsburg
42.8% of women with births (187) in Harrodsburg are married. The highest percentage of unmarried women with births falls into 20 to 34 years age bracket with 59.1% of them unmarried at the time of birth, while the lowest percentage of unmarried women with births belong to 35 to 50 years age bracket with 0.0% of them unmarried.
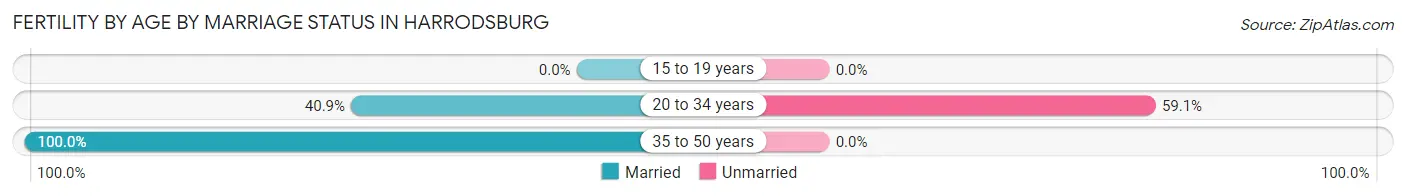
| Age Bracket | Married | Unmarried |
| 15 to 19 years | 0 (0.0%) | 0 (0.0%) |
| 20 to 34 years | 74 (40.9%) | 107 (59.1%) |
| 35 to 50 years | 6 (100.0%) | 0 (0.0%) |
| Total | 80 (42.8%) | 107 (57.2%) |
Fertility by Education in Harrodsburg
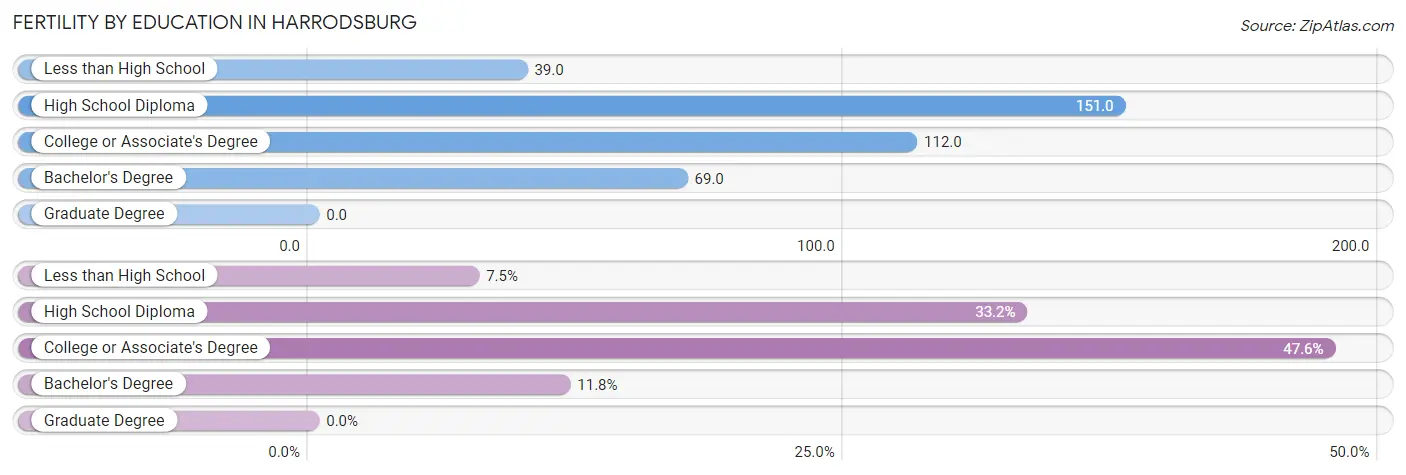
| Educational Attainment | Women with Births | Births / 1,000 Women |
| Less than High School | 14 (7.5%) | 39.0 |
| High School Diploma | 62 (33.2%) | 151.0 |
| College or Associate's Degree | 89 (47.6%) | 112.0 |
| Bachelor's Degree | 22 (11.8%) | 69.0 |
| Graduate Degree | 0 (0.0%) | 0.0 |
| Total | 187 (100.0%) | 93.0 |
Fertility by Education by Marriage Status in Harrodsburg
57.2% of women with births in Harrodsburg are unmarried. Women with the educational attainment of less than high school are most likely to be married with 100.0% of them married at childbirth, while women with the educational attainment of high school diploma are least likely to be married with 100.0% of them unmarried at childbirth.
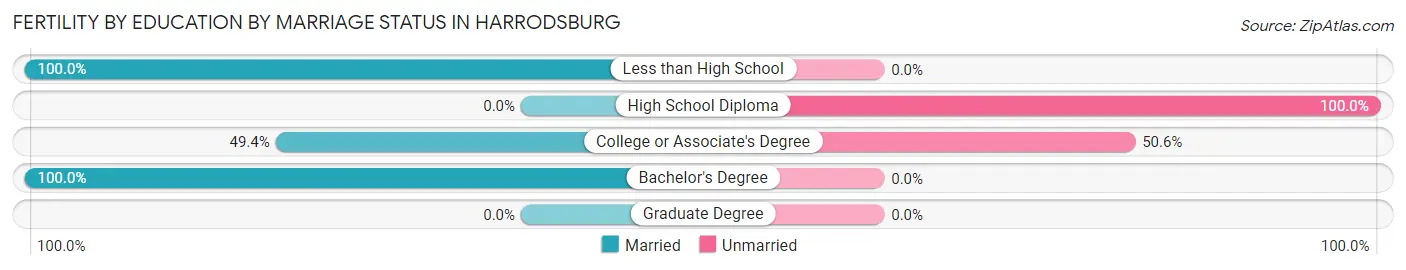
| Educational Attainment | Married | Unmarried |
| Less than High School | 14 (100.0%) | 0 (0.0%) |
| High School Diploma | 0 (0.0%) | 62 (100.0%) |
| College or Associate's Degree | 44 (49.4%) | 45 (50.6%) |
| Bachelor's Degree | 22 (100.0%) | 0 (0.0%) |
| Graduate Degree | 0 (0.0%) | 0 (0.0%) |
| Total | 80 (42.8%) | 107 (57.2%) |
Employment Characteristics in Harrodsburg
Employment by Class of Employer in Harrodsburg
Among the 4,525 employed individuals in Harrodsburg, private company employees (3,545 | 78.3%), local government employees (292 | 6.5%), and not-for-profit organizations (252 | 5.6%) make up the most common classes of employment.
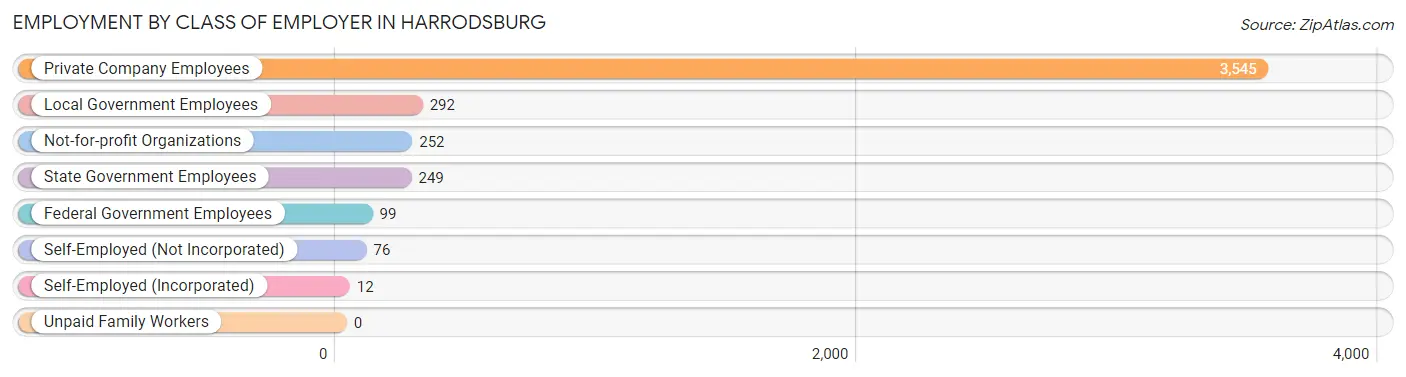
| Employer Class | # Employees | % Employees |
| Private Company Employees | 3,545 | 78.3% |
| Self-Employed (Incorporated) | 12 | 0.3% |
| Self-Employed (Not Incorporated) | 76 | 1.7% |
| Not-for-profit Organizations | 252 | 5.6% |
| Local Government Employees | 292 | 6.5% |
| State Government Employees | 249 | 5.5% |
| Federal Government Employees | 99 | 2.2% |
| Unpaid Family Workers | 0 | 0.0% |
| Total | 4,525 | 100.0% |
Employment Status by Age in Harrodsburg
According to the labor force statistics for Harrodsburg, out of the total population over 16 years of age (7,364), 64.0% or 4,713 individuals are in the labor force, with 3.2% or 151 of them unemployed. The age group with the highest labor force participation rate is 30 to 34 years, with 96.4% or 678 individuals in the labor force. Within the labor force, the 35 to 44 years age range has the highest percentage of unemployed individuals, with 7.9% or 79 of them being unemployed.
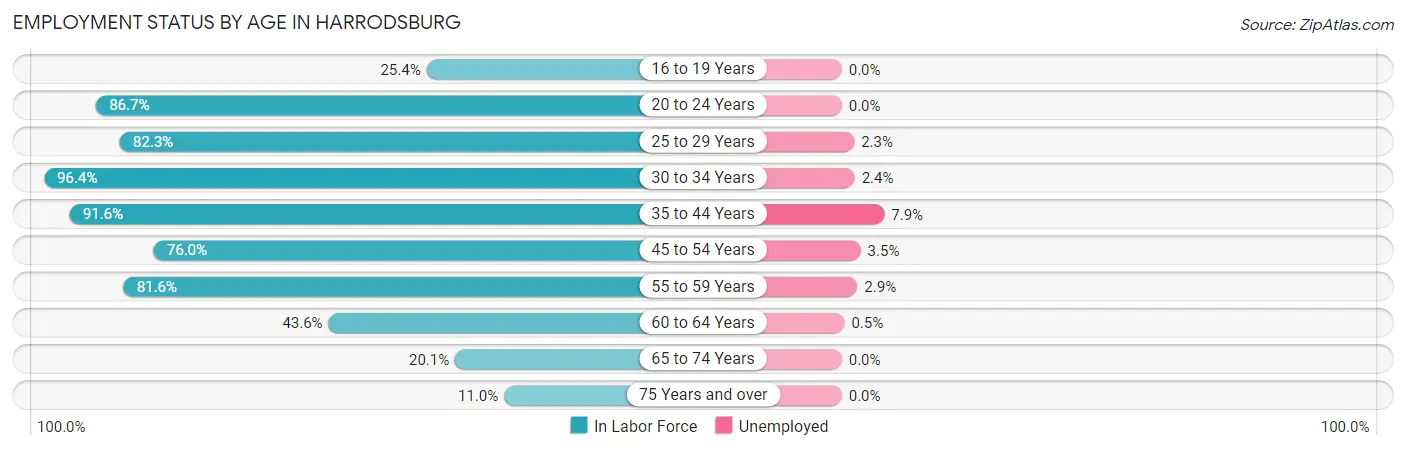
| Age Bracket | In Labor Force | Unemployed |
| 16 to 19 Years | 107 (25.4%) | 0 (0.0%) |
| 20 to 24 Years | 637 (86.7%) | 0 (0.0%) |
| 25 to 29 Years | 622 (82.3%) | 14 (2.3%) |
| 30 to 34 Years | 678 (96.4%) | 16 (2.4%) |
| 35 to 44 Years | 994 (91.6%) | 79 (7.9%) |
| 45 to 54 Years | 827 (76.0%) | 29 (3.5%) |
| 55 to 59 Years | 373 (81.6%) | 11 (2.9%) |
| 60 to 64 Years | 199 (43.6%) | 1 (0.5%) |
| 65 to 74 Years | 212 (20.1%) | 0 (0.0%) |
| 75 Years and over | 67 (11.0%) | 0 (0.0%) |
| Total | 4,713 (64.0%) | 151 (3.2%) |
Employment Status by Educational Attainment in Harrodsburg
According to labor force statistics for Harrodsburg, 81.3% of individuals (3,695) out of the total population between 25 and 64 years of age (4,545) are in the labor force, with 4.1% or 151 of them being unemployed. The group with the highest labor force participation rate are those with the educational attainment of bachelor's degree or higher, with 93.3% or 850 individuals in the labor force. Within the labor force, individuals with college / associate degree education have the highest percentage of unemployment, with 6.0% or 106 of them being unemployed.
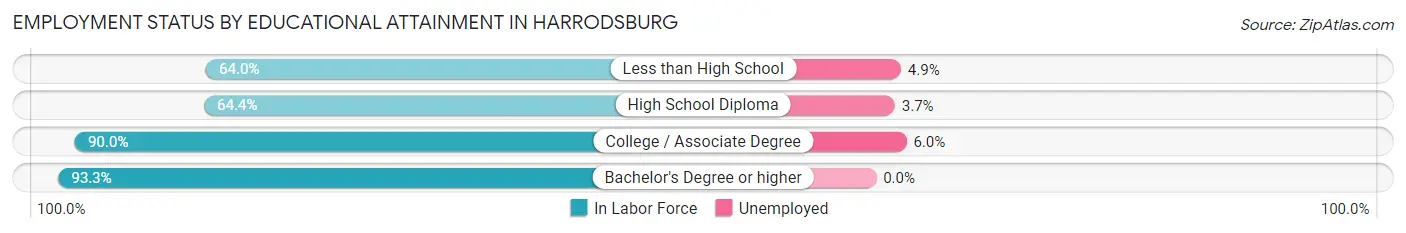
| Educational Attainment | In Labor Force | Unemployed |
| Less than High School | 286 (64.0%) | 22 (4.9%) |
| High School Diploma | 785 (64.4%) | 45 (3.7%) |
| College / Associate Degree | 1,771 (90.0%) | 118 (6.0%) |
| Bachelor's Degree or higher | 850 (93.3%) | 0 (0.0%) |
| Total | 3,695 (81.3%) | 186 (4.1%) |
Employment Occupations by Sex in Harrodsburg
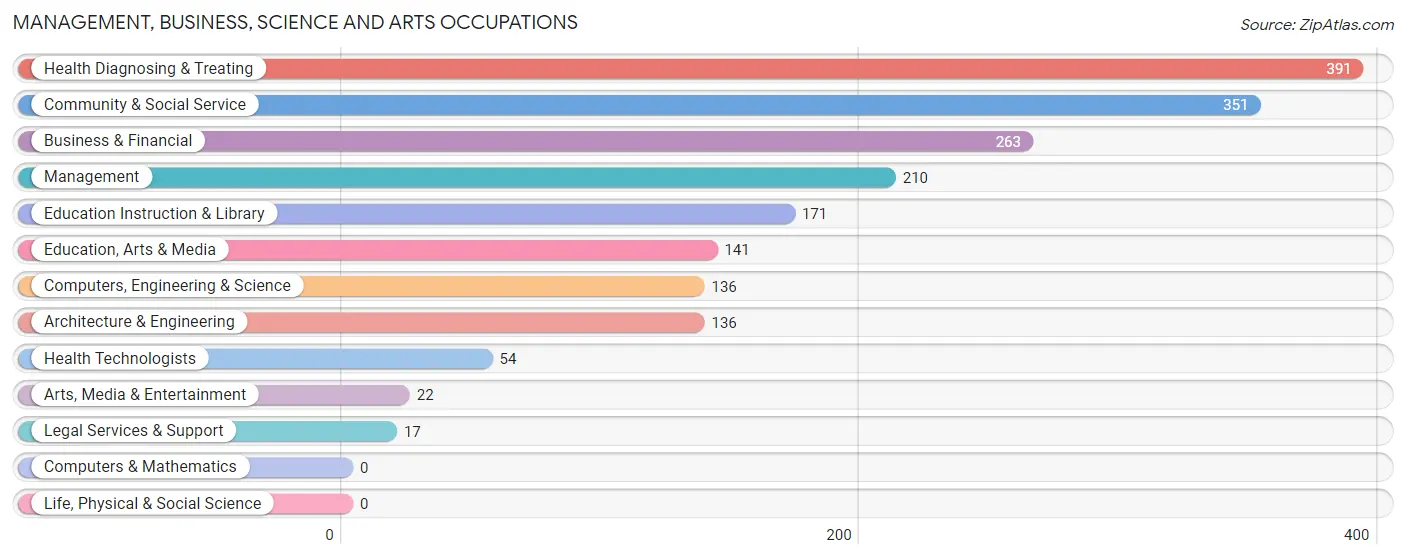
Management, Business, Science and Arts Occupations
The most common Management, Business, Science and Arts occupations in Harrodsburg are Health Diagnosing & Treating (391 | 8.6%), Community & Social Service (351 | 7.8%), Business & Financial (263 | 5.8%), Management (210 | 4.6%), and Education Instruction & Library (171 | 3.8%).
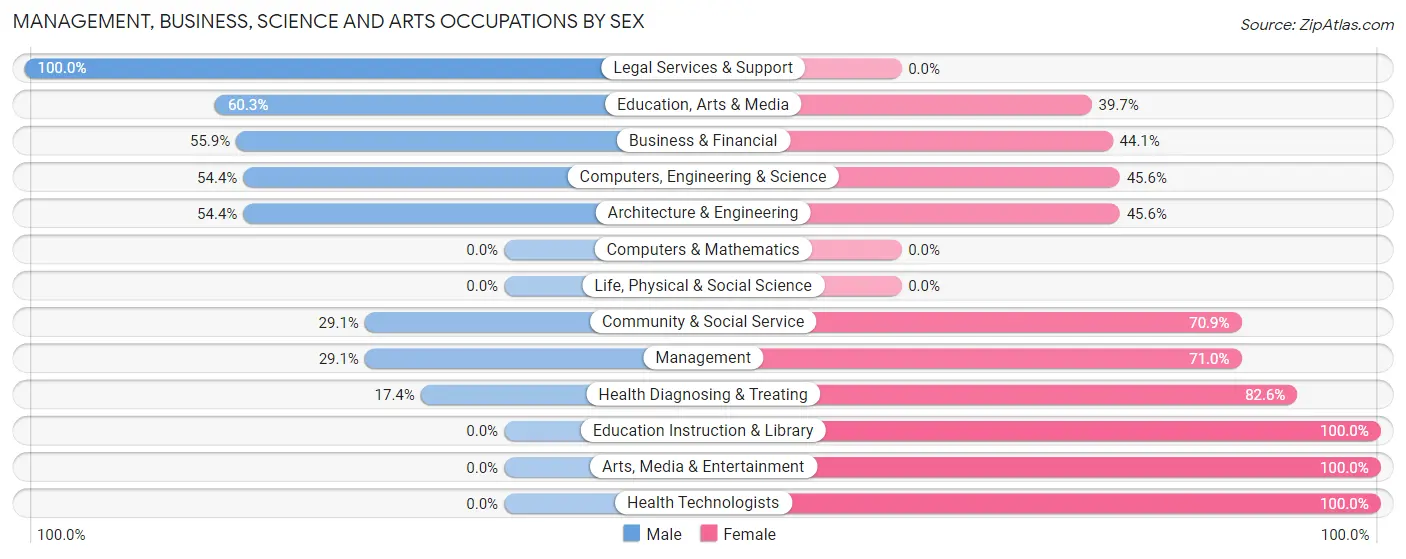
Management, Business, Science and Arts Occupations by Sex
Within the Management, Business, Science and Arts occupations in Harrodsburg, the most male-oriented occupations are Legal Services & Support (100.0%), Education, Arts & Media (60.3%), and Business & Financial (55.9%), while the most female-oriented occupations are Education Instruction & Library (100.0%), Arts, Media & Entertainment (100.0%), and Health Technologists (100.0%).
| Occupation | Male | Female |
| Management | 61 (29.0%) | 149 (71.0%) |
| Business & Financial | 147 (55.9%) | 116 (44.1%) |
| Computers, Engineering & Science | 74 (54.4%) | 62 (45.6%) |
| Computers & Mathematics | 0 (0.0%) | 0 (0.0%) |
| Architecture & Engineering | 74 (54.4%) | 62 (45.6%) |
| Life, Physical & Social Science | 0 (0.0%) | 0 (0.0%) |
| Community & Social Service | 102 (29.1%) | 249 (70.9%) |
| Education, Arts & Media | 85 (60.3%) | 56 (39.7%) |
| Legal Services & Support | 17 (100.0%) | 0 (0.0%) |
| Education Instruction & Library | 0 (0.0%) | 171 (100.0%) |
| Arts, Media & Entertainment | 0 (0.0%) | 22 (100.0%) |
| Health Diagnosing & Treating | 68 (17.4%) | 323 (82.6%) |
| Health Technologists | 0 (0.0%) | 54 (100.0%) |
| Total (Category) | 452 (33.5%) | 899 (66.5%) |
| Total (Overall) | 2,492 (55.1%) | 2,027 (44.9%) |
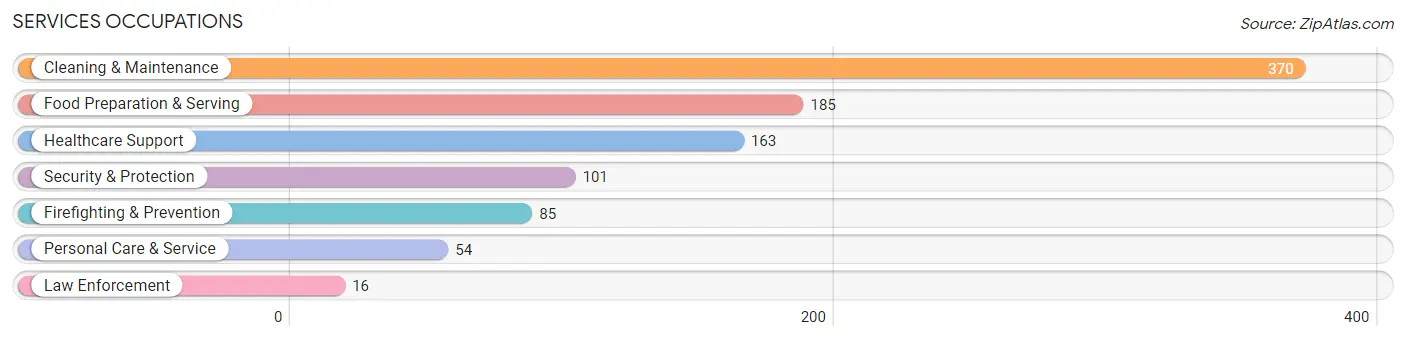
Services Occupations
The most common Services occupations in Harrodsburg are Cleaning & Maintenance (370 | 8.2%), Food Preparation & Serving (185 | 4.1%), Healthcare Support (163 | 3.6%), Security & Protection (101 | 2.2%), and Firefighting & Prevention (85 | 1.9%).
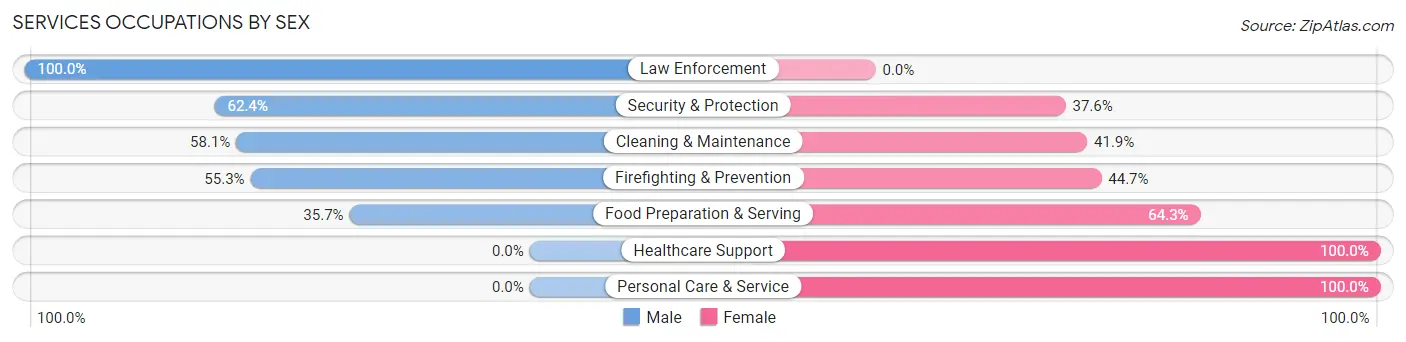
Services Occupations by Sex
Within the Services occupations in Harrodsburg, the most male-oriented occupations are Law Enforcement (100.0%), Security & Protection (62.4%), and Cleaning & Maintenance (58.1%), while the most female-oriented occupations are Healthcare Support (100.0%), Personal Care & Service (100.0%), and Food Preparation & Serving (64.3%).
| Occupation | Male | Female |
| Healthcare Support | 0 (0.0%) | 163 (100.0%) |
| Security & Protection | 63 (62.4%) | 38 (37.6%) |
| Firefighting & Prevention | 47 (55.3%) | 38 (44.7%) |
| Law Enforcement | 16 (100.0%) | 0 (0.0%) |
| Food Preparation & Serving | 66 (35.7%) | 119 (64.3%) |
| Cleaning & Maintenance | 215 (58.1%) | 155 (41.9%) |
| Personal Care & Service | 0 (0.0%) | 54 (100.0%) |
| Total (Category) | 344 (39.4%) | 529 (60.6%) |
| Total (Overall) | 2,492 (55.1%) | 2,027 (44.9%) |
Sales and Office Occupations
The most common Sales and Office occupations in Harrodsburg are Office & Administration (591 | 13.1%), and Sales & Related (234 | 5.2%).
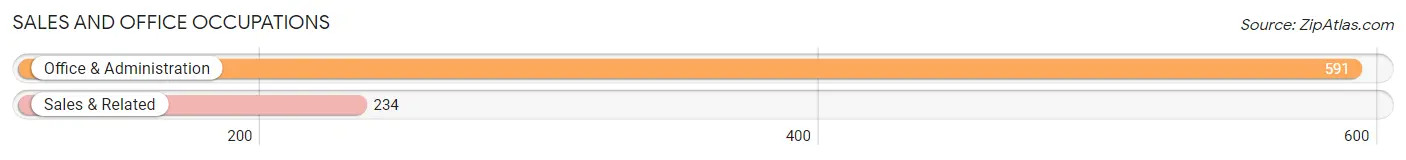
Sales and Office Occupations by Sex
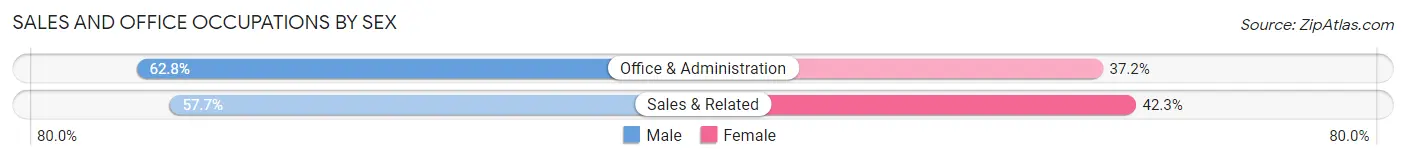
| Occupation | Male | Female |
| Sales & Related | 135 (57.7%) | 99 (42.3%) |
| Office & Administration | 371 (62.8%) | 220 (37.2%) |
| Total (Category) | 506 (61.3%) | 319 (38.7%) |
| Total (Overall) | 2,492 (55.1%) | 2,027 (44.9%) |
Natural Resources, Construction and Maintenance Occupations
The most common Natural Resources, Construction and Maintenance occupations in Harrodsburg are Farming, Fishing & Forestry (100 | 2.2%), Construction & Extraction (83 | 1.8%), and Installation, Maintenance & Repair (64 | 1.4%).
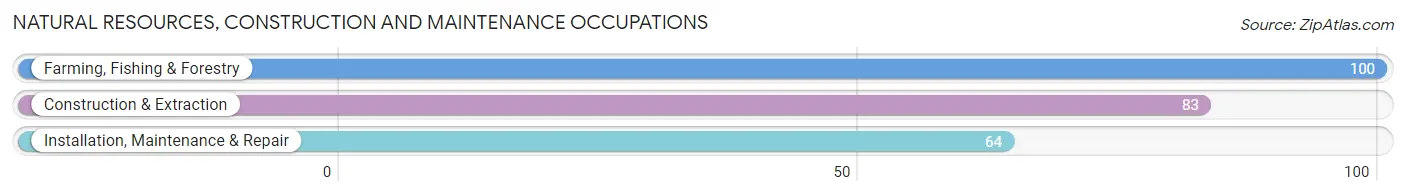
Natural Resources, Construction and Maintenance Occupations by Sex
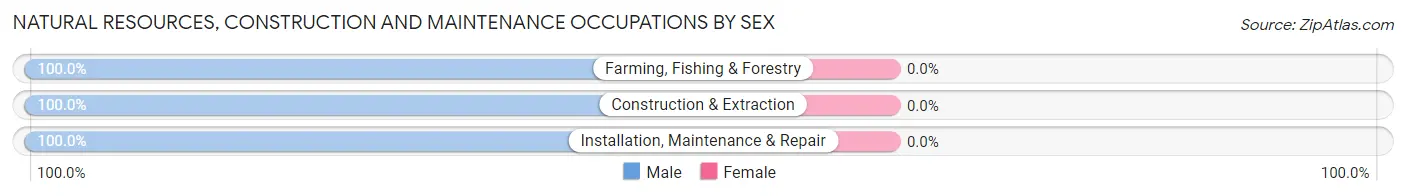
| Occupation | Male | Female |
| Farming, Fishing & Forestry | 100 (100.0%) | 0 (0.0%) |
| Construction & Extraction | 83 (100.0%) | 0 (0.0%) |
| Installation, Maintenance & Repair | 64 (100.0%) | 0 (0.0%) |
| Total (Category) | 247 (100.0%) | 0 (0.0%) |
| Total (Overall) | 2,492 (55.1%) | 2,027 (44.9%) |
Production, Transportation and Moving Occupations
The most common Production, Transportation and Moving occupations in Harrodsburg are Production (753 | 16.7%), Transportation (242 | 5.4%), and Material Moving (228 | 5.1%).
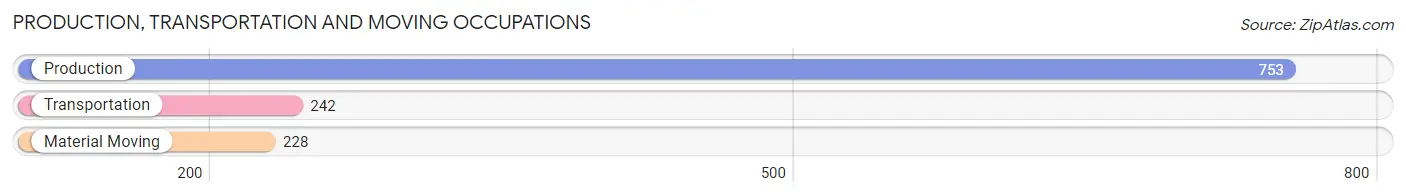
Production, Transportation and Moving Occupations by Sex
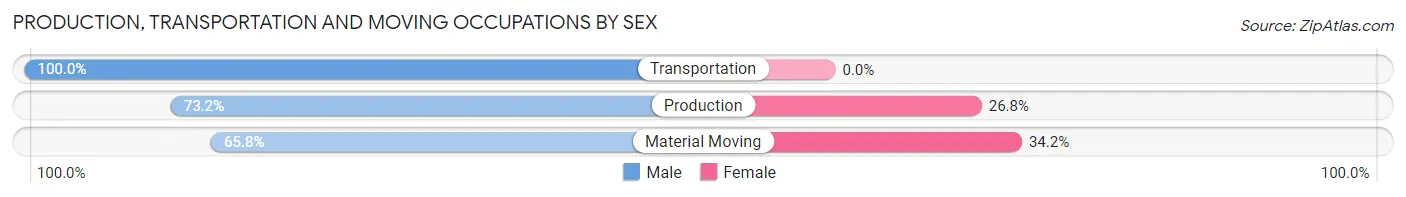
| Occupation | Male | Female |
| Production | 551 (73.2%) | 202 (26.8%) |
| Transportation | 242 (100.0%) | 0 (0.0%) |
| Material Moving | 150 (65.8%) | 78 (34.2%) |
| Total (Category) | 943 (77.1%) | 280 (22.9%) |
| Total (Overall) | 2,492 (55.1%) | 2,027 (44.9%) |
Employment Industries by Sex in Harrodsburg
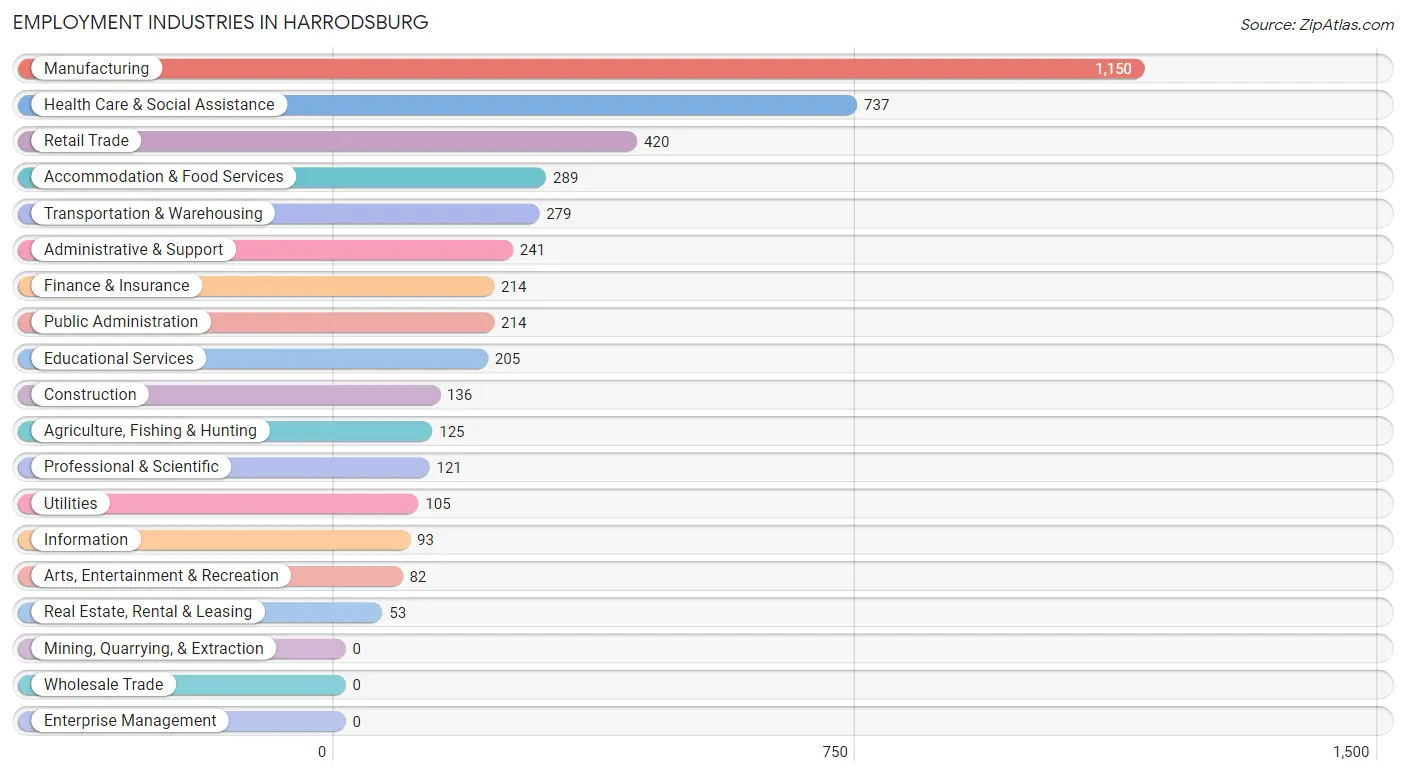
Employment Industries in Harrodsburg
The major employment industries in Harrodsburg include Manufacturing (1,150 | 25.5%), Health Care & Social Assistance (737 | 16.3%), Retail Trade (420 | 9.3%), Accommodation & Food Services (289 | 6.4%), and Transportation & Warehousing (279 | 6.2%).
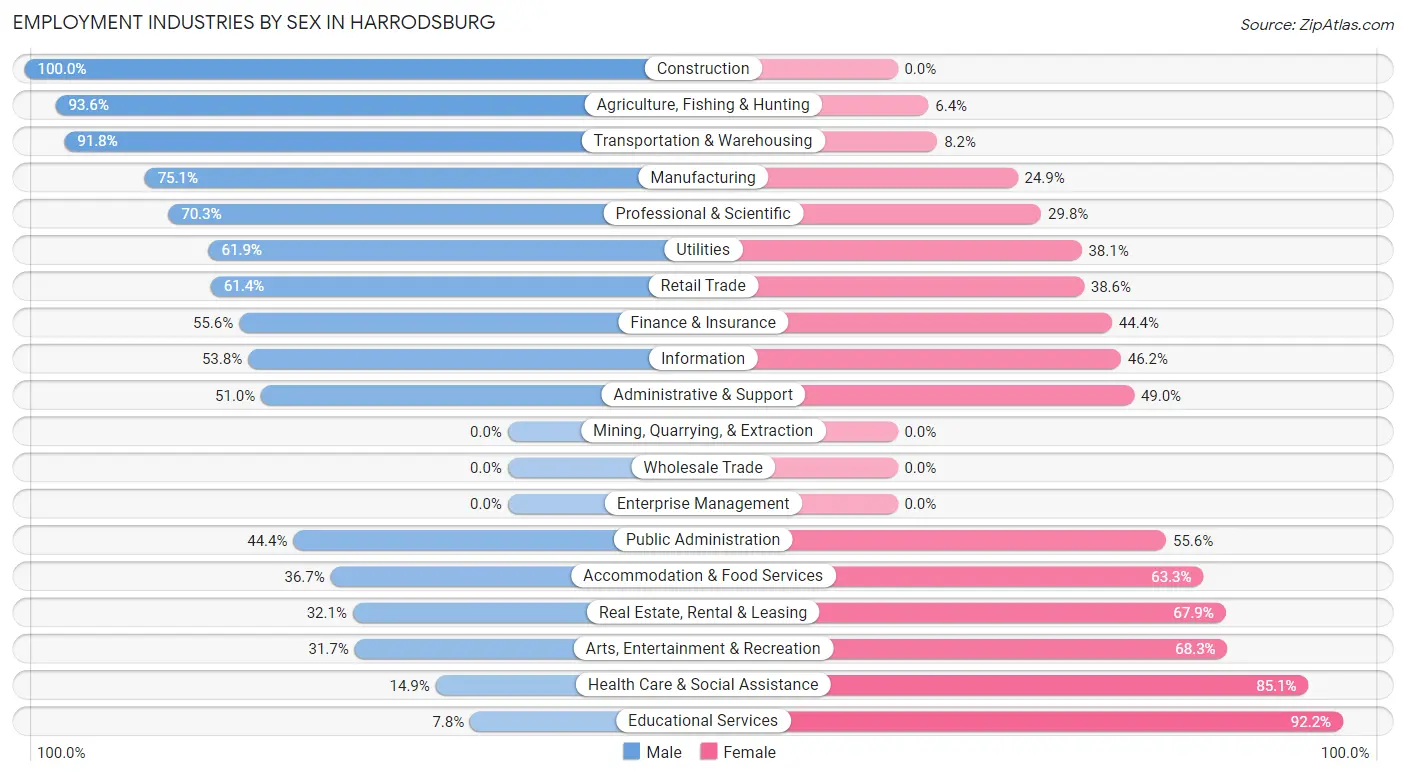
Employment Industries by Sex in Harrodsburg
The Harrodsburg industries that see more men than women are Construction (100.0%), Agriculture, Fishing & Hunting (93.6%), and Transportation & Warehousing (91.8%), whereas the industries that tend to have a higher number of women are Educational Services (92.2%), Health Care & Social Assistance (85.1%), and Arts, Entertainment & Recreation (68.3%).
| Industry | Male | Female |
| Agriculture, Fishing & Hunting | 117 (93.6%) | 8 (6.4%) |
| Mining, Quarrying, & Extraction | 0 (0.0%) | 0 (0.0%) |
| Construction | 136 (100.0%) | 0 (0.0%) |
| Manufacturing | 864 (75.1%) | 286 (24.9%) |
| Wholesale Trade | 0 (0.0%) | 0 (0.0%) |
| Retail Trade | 258 (61.4%) | 162 (38.6%) |
| Transportation & Warehousing | 256 (91.8%) | 23 (8.2%) |
| Utilities | 65 (61.9%) | 40 (38.1%) |
| Information | 50 (53.8%) | 43 (46.2%) |
| Finance & Insurance | 119 (55.6%) | 95 (44.4%) |
| Real Estate, Rental & Leasing | 17 (32.1%) | 36 (67.9%) |
| Professional & Scientific | 85 (70.3%) | 36 (29.7%) |
| Enterprise Management | 0 (0.0%) | 0 (0.0%) |
| Administrative & Support | 123 (51.0%) | 118 (49.0%) |
| Educational Services | 16 (7.8%) | 189 (92.2%) |
| Health Care & Social Assistance | 110 (14.9%) | 627 (85.1%) |
| Arts, Entertainment & Recreation | 26 (31.7%) | 56 (68.3%) |
| Accommodation & Food Services | 106 (36.7%) | 183 (63.3%) |
| Public Administration | 95 (44.4%) | 119 (55.6%) |
| Total | 2,492 (55.1%) | 2,027 (44.9%) |
Education in Harrodsburg
School Enrollment in Harrodsburg
The most common levels of schooling among the 1,949 students in Harrodsburg are high school (511 | 26.2%), elementary school (411 | 21.1%), and middle school (409 | 21.0%).
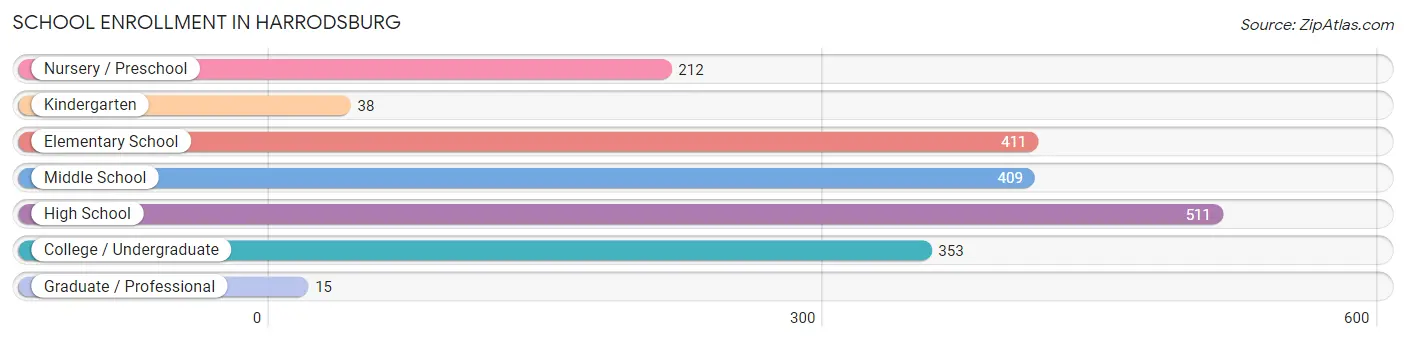
| School Level | # Students | % Students |
| Nursery / Preschool | 212 | 10.9% |
| Kindergarten | 38 | 1.9% |
| Elementary School | 411 | 21.1% |
| Middle School | 409 | 21.0% |
| High School | 511 | 26.2% |
| College / Undergraduate | 353 | 18.1% |
| Graduate / Professional | 15 | 0.8% |
| Total | 1,949 | 100.0% |
School Enrollment by Age by Funding Source in Harrodsburg
Out of a total of 1,949 students who are enrolled in schools in Harrodsburg, 308 (15.8%) attend a private institution, while the remaining 1,641 (84.2%) are enrolled in public schools. The age group of 35 years and over has the highest likelihood of being enrolled in private schools, with 36 (61.0% in the age bracket) enrolled. Conversely, the age group of 5 to 9 year old has the lowest likelihood of being enrolled in a private school, with 533 (93.3% in the age bracket) attending a public institution.
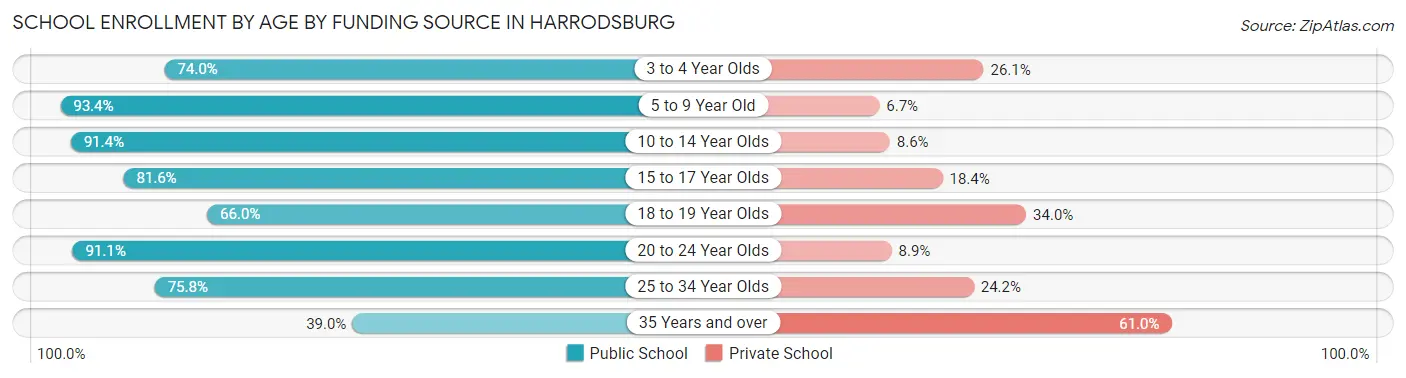
| Age Bracket | Public School | Private School |
| 3 to 4 Year Olds | 88 (74.0%) | 31 (26.1%) |
| 5 to 9 Year Old | 533 (93.3%) | 38 (6.7%) |
| 10 to 14 Year Olds | 340 (91.4%) | 32 (8.6%) |
| 15 to 17 Year Olds | 279 (81.6%) | 63 (18.4%) |
| 18 to 19 Year Olds | 101 (66.0%) | 52 (34.0%) |
| 20 to 24 Year Olds | 153 (91.1%) | 15 (8.9%) |
| 25 to 34 Year Olds | 125 (75.8%) | 40 (24.2%) |
| 35 Years and over | 23 (39.0%) | 36 (61.0%) |
| Total | 1,641 (84.2%) | 308 (15.8%) |
Educational Attainment by Field of Study in Harrodsburg
Education (291 | 22.3%), business (270 | 20.7%), engineering (224 | 17.1%), arts & humanities (149 | 11.4%), and psychology (121 | 9.3%) are the most common fields of study among 1,307 individuals in Harrodsburg who have obtained a bachelor's degree or higher.
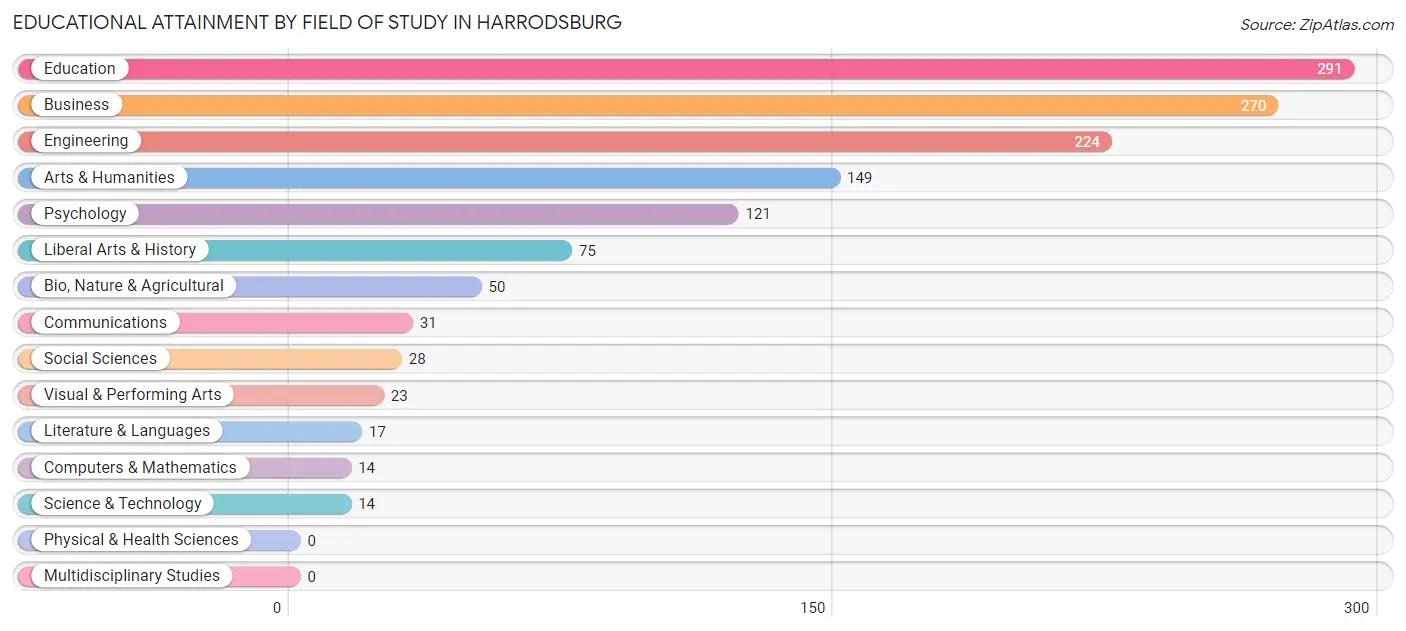
| Field of Study | # Graduates | % Graduates |
| Computers & Mathematics | 14 | 1.1% |
| Bio, Nature & Agricultural | 50 | 3.8% |
| Physical & Health Sciences | 0 | 0.0% |
| Psychology | 121 | 9.3% |
| Social Sciences | 28 | 2.1% |
| Engineering | 224 | 17.1% |
| Multidisciplinary Studies | 0 | 0.0% |
| Science & Technology | 14 | 1.1% |
| Business | 270 | 20.7% |
| Education | 291 | 22.3% |
| Literature & Languages | 17 | 1.3% |
| Liberal Arts & History | 75 | 5.7% |
| Visual & Performing Arts | 23 | 1.8% |
| Communications | 31 | 2.4% |
| Arts & Humanities | 149 | 11.4% |
| Total | 1,307 | 100.0% |
Transportation & Commute in Harrodsburg
Vehicle Availability by Sex in Harrodsburg
The most prevalent vehicle ownership categories in Harrodsburg are males with 1 vehicle (862, accounting for 34.3%) and females with 1 vehicle (496, making up 42.8%).
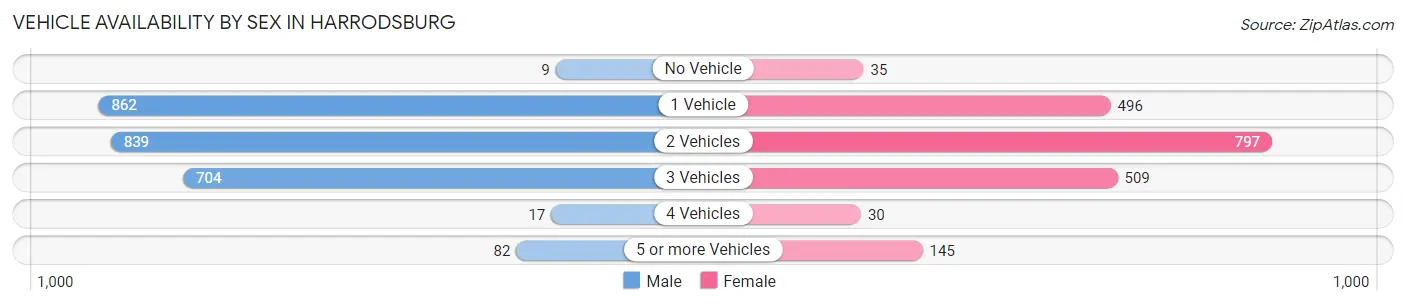
| Vehicles Available | Male | Female |
| No Vehicle | 9 (0.4%) | 35 (1.7%) |
| 1 Vehicle | 862 (34.3%) | 496 (24.6%) |
| 2 Vehicles | 839 (33.4%) | 797 (39.6%) |
| 3 Vehicles | 704 (28.0%) | 509 (25.3%) |
| 4 Vehicles | 17 (0.7%) | 30 (1.5%) |
| 5 or more Vehicles | 82 (3.3%) | 145 (7.2%) |
| Total | 2,513 (100.0%) | 2,012 (100.0%) |
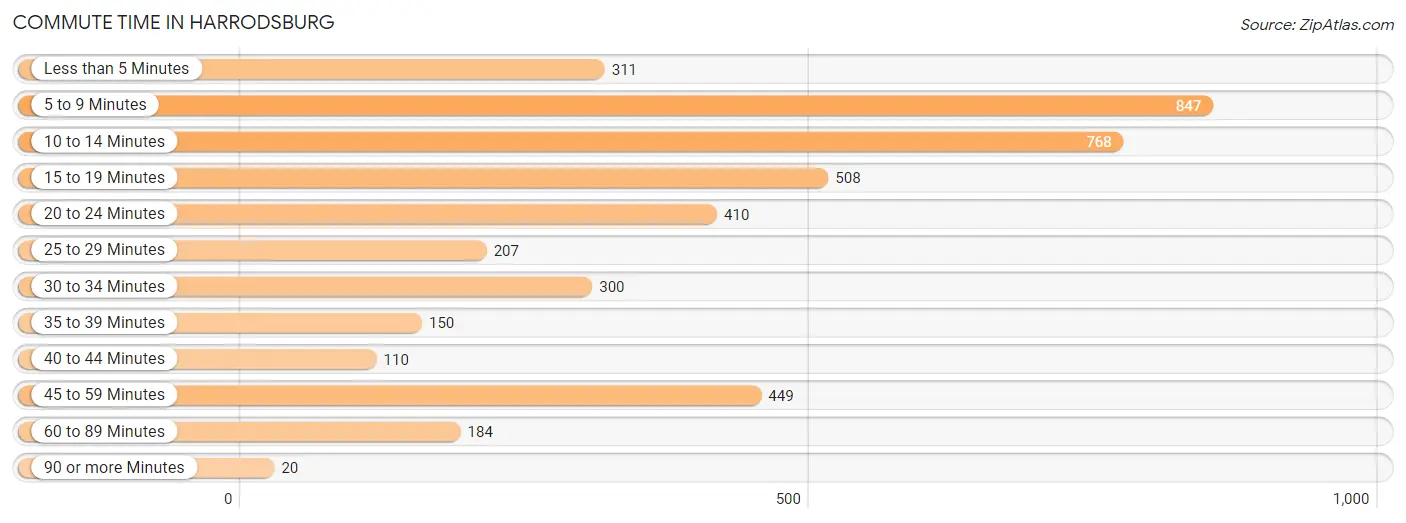
Commute Time in Harrodsburg
The most frequently occuring commute durations in Harrodsburg are 5 to 9 minutes (847 commuters, 19.9%), 10 to 14 minutes (768 commuters, 18.0%), and 15 to 19 minutes (508 commuters, 11.9%).
| Commute Time | # Commuters | % Commuters |
| Less than 5 Minutes | 311 | 7.3% |
| 5 to 9 Minutes | 847 | 19.9% |
| 10 to 14 Minutes | 768 | 18.0% |
| 15 to 19 Minutes | 508 | 11.9% |
| 20 to 24 Minutes | 410 | 9.6% |
| 25 to 29 Minutes | 207 | 4.9% |
| 30 to 34 Minutes | 300 | 7.0% |
| 35 to 39 Minutes | 150 | 3.5% |
| 40 to 44 Minutes | 110 | 2.6% |
| 45 to 59 Minutes | 449 | 10.5% |
| 60 to 89 Minutes | 184 | 4.3% |
| 90 or more Minutes | 20 | 0.5% |
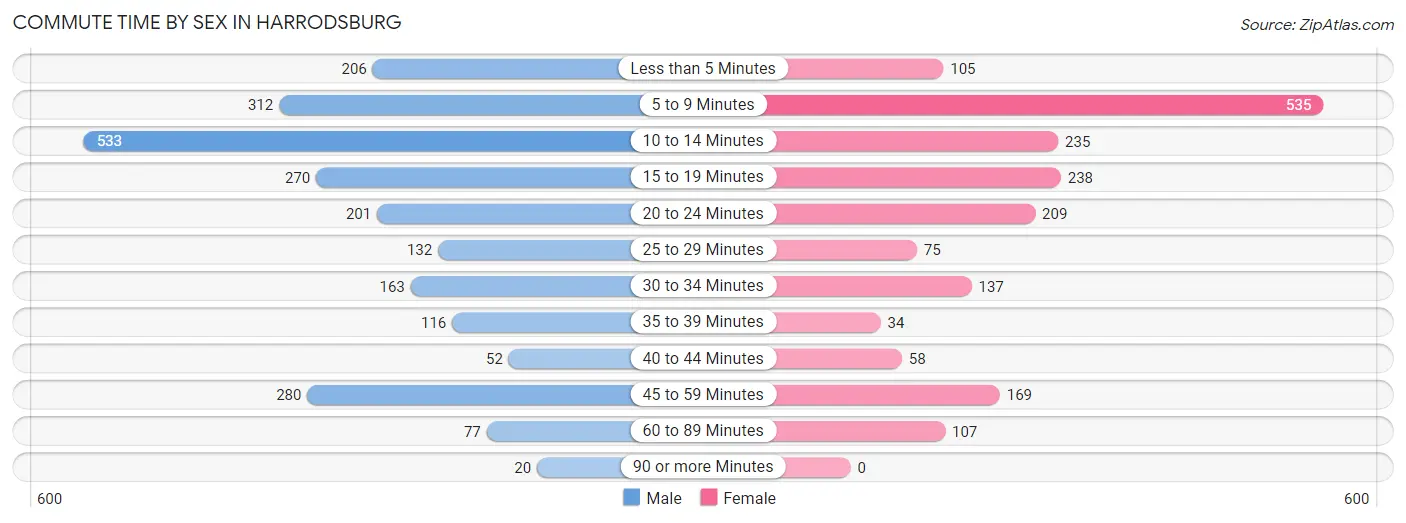
Commute Time by Sex in Harrodsburg
The most common commute times in Harrodsburg are 10 to 14 minutes (533 commuters, 22.6%) for males and 5 to 9 minutes (535 commuters, 28.1%) for females.
| Commute Time | Male | Female |
| Less than 5 Minutes | 206 (8.7%) | 105 (5.5%) |
| 5 to 9 Minutes | 312 (13.2%) | 535 (28.1%) |
| 10 to 14 Minutes | 533 (22.6%) | 235 (12.4%) |
| 15 to 19 Minutes | 270 (11.4%) | 238 (12.5%) |
| 20 to 24 Minutes | 201 (8.5%) | 209 (11.0%) |
| 25 to 29 Minutes | 132 (5.6%) | 75 (3.9%) |
| 30 to 34 Minutes | 163 (6.9%) | 137 (7.2%) |
| 35 to 39 Minutes | 116 (4.9%) | 34 (1.8%) |
| 40 to 44 Minutes | 52 (2.2%) | 58 (3.0%) |
| 45 to 59 Minutes | 280 (11.8%) | 169 (8.9%) |
| 60 to 89 Minutes | 77 (3.3%) | 107 (5.6%) |
| 90 or more Minutes | 20 (0.9%) | 0 (0.0%) |
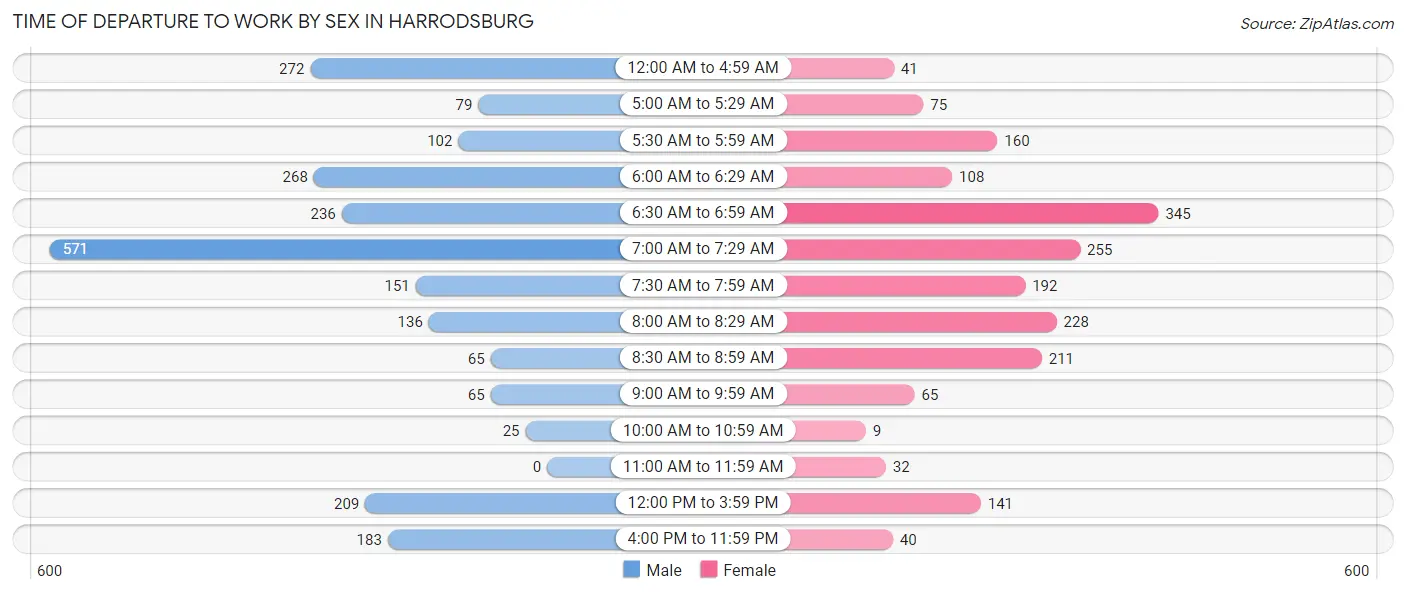
Time of Departure to Work by Sex in Harrodsburg
The most frequent times of departure to work in Harrodsburg are 7:00 AM to 7:29 AM (571, 24.2%) for males and 6:30 AM to 6:59 AM (345, 18.1%) for females.
| Time of Departure | Male | Female |
| 12:00 AM to 4:59 AM | 272 (11.5%) | 41 (2.2%) |
| 5:00 AM to 5:29 AM | 79 (3.3%) | 75 (3.9%) |
| 5:30 AM to 5:59 AM | 102 (4.3%) | 160 (8.4%) |
| 6:00 AM to 6:29 AM | 268 (11.4%) | 108 (5.7%) |
| 6:30 AM to 6:59 AM | 236 (10.0%) | 345 (18.1%) |
| 7:00 AM to 7:29 AM | 571 (24.2%) | 255 (13.4%) |
| 7:30 AM to 7:59 AM | 151 (6.4%) | 192 (10.1%) |
| 8:00 AM to 8:29 AM | 136 (5.8%) | 228 (12.0%) |
| 8:30 AM to 8:59 AM | 65 (2.8%) | 211 (11.1%) |
| 9:00 AM to 9:59 AM | 65 (2.8%) | 65 (3.4%) |
| 10:00 AM to 10:59 AM | 25 (1.1%) | 9 (0.5%) |
| 11:00 AM to 11:59 AM | 0 (0.0%) | 32 (1.7%) |
| 12:00 PM to 3:59 PM | 209 (8.8%) | 141 (7.4%) |
| 4:00 PM to 11:59 PM | 183 (7.7%) | 40 (2.1%) |
| Total | 2,362 (100.0%) | 1,902 (100.0%) |
Housing Occupancy in Harrodsburg
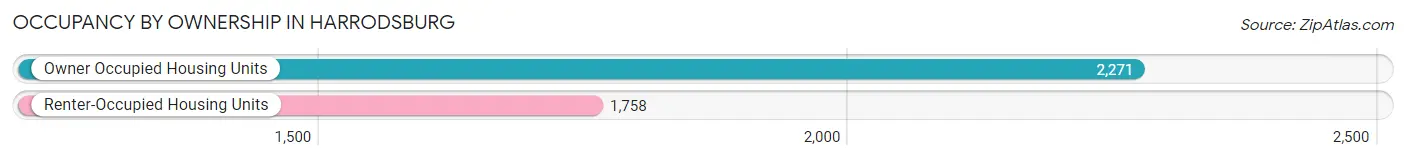
Occupancy by Ownership in Harrodsburg
Of the total 4,029 dwellings in Harrodsburg, owner-occupied units account for 2,271 (56.4%), while renter-occupied units make up 1,758 (43.6%).
| Occupancy | # Housing Units | % Housing Units |
| Owner Occupied Housing Units | 2,271 | 56.4% |
| Renter-Occupied Housing Units | 1,758 | 43.6% |
| Total Occupied Housing Units | 4,029 | 100.0% |
Occupancy by Household Size in Harrodsburg
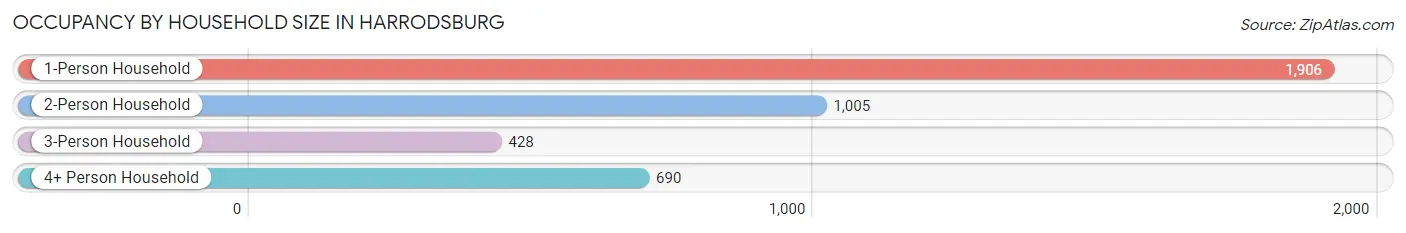
| Household Size | # Housing Units | % Housing Units |
| 1-Person Household | 1,906 | 47.3% |
| 2-Person Household | 1,005 | 24.9% |
| 3-Person Household | 428 | 10.6% |
| 4+ Person Household | 690 | 17.1% |
| Total Housing Units | 4,029 | 100.0% |
Occupancy by Ownership by Household Size in Harrodsburg
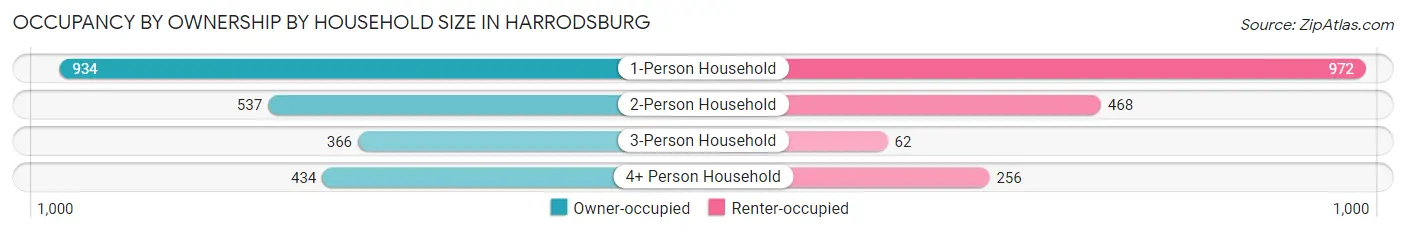
| Household Size | Owner-occupied | Renter-occupied |
| 1-Person Household | 934 (49.0%) | 972 (51.0%) |
| 2-Person Household | 537 (53.4%) | 468 (46.6%) |
| 3-Person Household | 366 (85.5%) | 62 (14.5%) |
| 4+ Person Household | 434 (62.9%) | 256 (37.1%) |
| Total Housing Units | 2,271 (56.4%) | 1,758 (43.6%) |
Occupancy by Educational Attainment in Harrodsburg
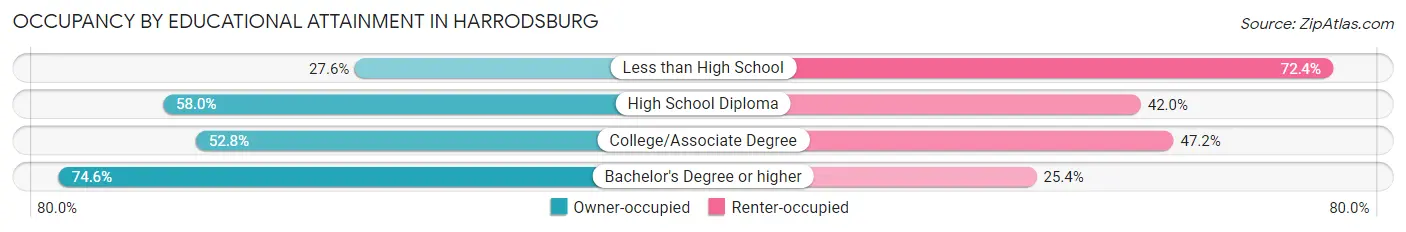
| Household Size | Owner-occupied | Renter-occupied |
| Less than High School | 102 (27.6%) | 268 (72.4%) |
| High School Diploma | 697 (58.0%) | 504 (42.0%) |
| College/Associate Degree | 877 (52.8%) | 783 (47.2%) |
| Bachelor's Degree or higher | 595 (74.6%) | 203 (25.4%) |
Occupancy by Age of Householder in Harrodsburg
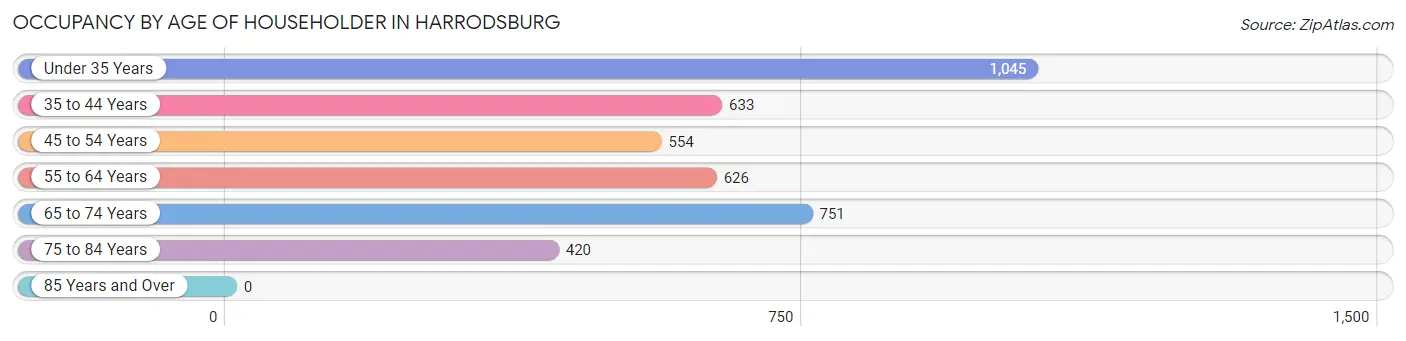
| Age Bracket | # Households | % Households |
| Under 35 Years | 1,045 | 25.9% |
| 35 to 44 Years | 633 | 15.7% |
| 45 to 54 Years | 554 | 13.8% |
| 55 to 64 Years | 626 | 15.5% |
| 65 to 74 Years | 751 | 18.6% |
| 75 to 84 Years | 420 | 10.4% |
| 85 Years and Over | 0 | 0.0% |
| Total | 4,029 | 100.0% |
Housing Finances in Harrodsburg
Median Income by Occupancy in Harrodsburg
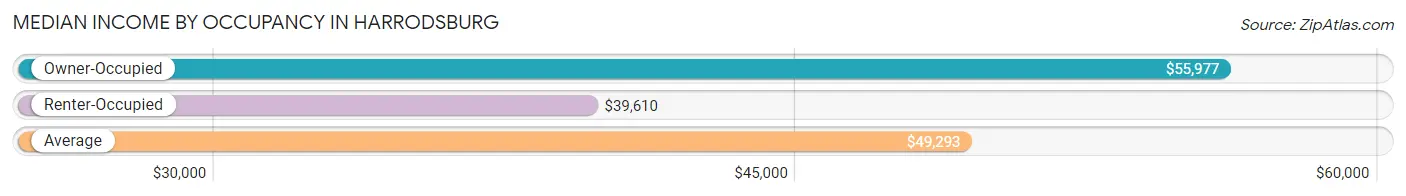
| Occupancy Type | # Households | Median Income |
| Owner-Occupied | 2,271 (56.4%) | $55,977 |
| Renter-Occupied | 1,758 (43.6%) | $39,610 |
| Average | 4,029 (100.0%) | $49,293 |
Occupancy by Householder Income Bracket in Harrodsburg
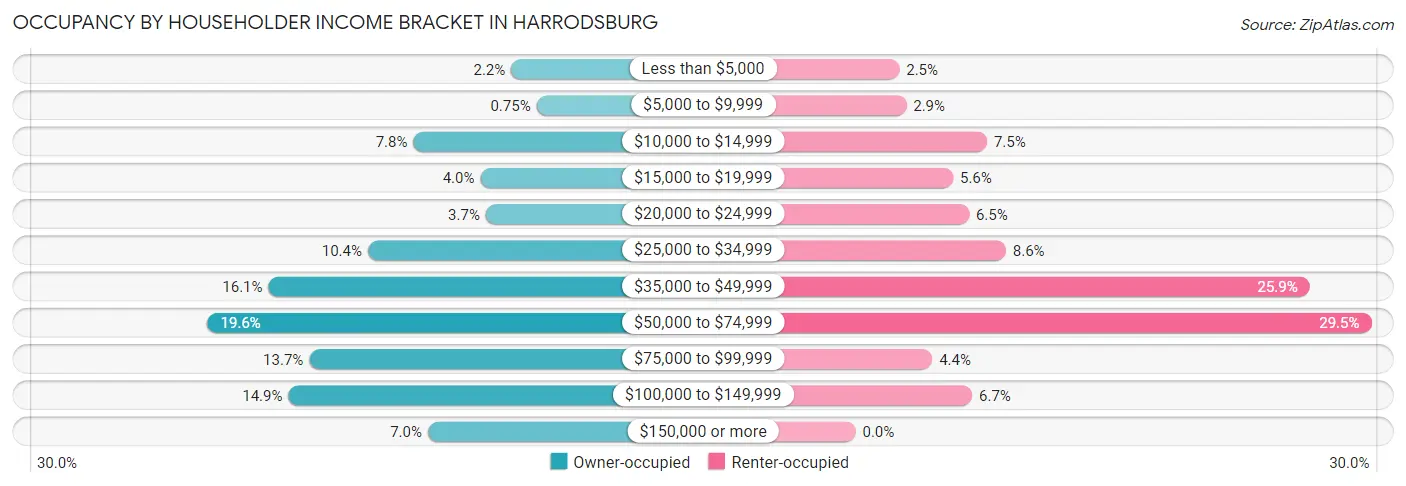
| Income Bracket | Owner-occupied | Renter-occupied |
| Less than $5,000 | 50 (2.2%) | 44 (2.5%) |
| $5,000 to $9,999 | 17 (0.7%) | 51 (2.9%) |
| $10,000 to $14,999 | 177 (7.8%) | 132 (7.5%) |
| $15,000 to $19,999 | 90 (4.0%) | 98 (5.6%) |
| $20,000 to $24,999 | 83 (3.6%) | 114 (6.5%) |
| $25,000 to $34,999 | 236 (10.4%) | 151 (8.6%) |
| $35,000 to $49,999 | 365 (16.1%) | 456 (25.9%) |
| $50,000 to $74,999 | 444 (19.6%) | 518 (29.5%) |
| $75,000 to $99,999 | 312 (13.7%) | 77 (4.4%) |
| $100,000 to $149,999 | 339 (14.9%) | 117 (6.7%) |
| $150,000 or more | 158 (7.0%) | 0 (0.0%) |
| Total | 2,271 (100.0%) | 1,758 (100.0%) |
Monthly Housing Cost Tiers in Harrodsburg
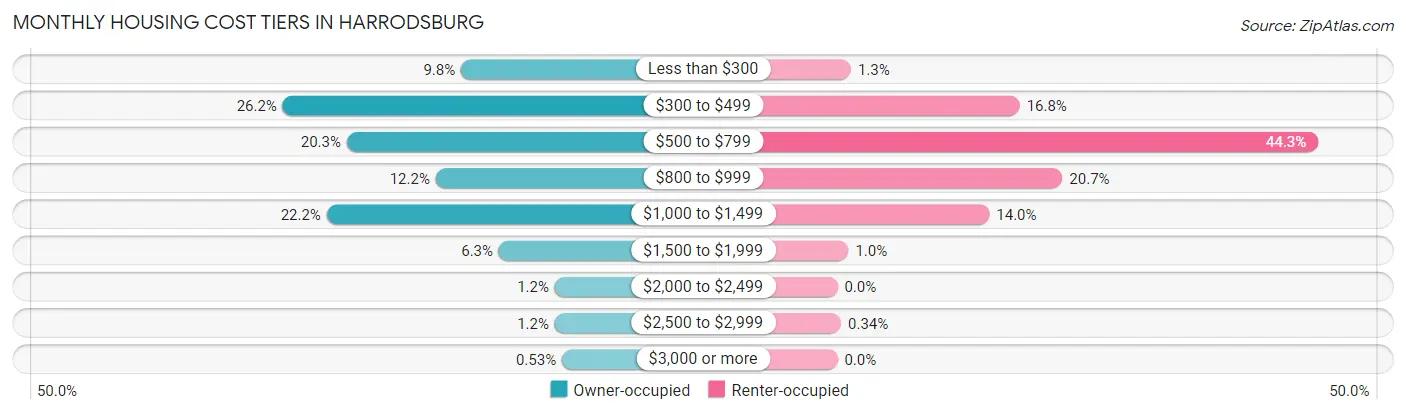
| Monthly Cost | Owner-occupied | Renter-occupied |
| Less than $300 | 223 (9.8%) | 22 (1.3%) |
| $300 to $499 | 596 (26.2%) | 295 (16.8%) |
| $500 to $799 | 462 (20.3%) | 778 (44.3%) |
| $800 to $999 | 276 (12.1%) | 364 (20.7%) |
| $1,000 to $1,499 | 504 (22.2%) | 246 (14.0%) |
| $1,500 to $1,999 | 144 (6.3%) | 18 (1.0%) |
| $2,000 to $2,499 | 27 (1.2%) | 0 (0.0%) |
| $2,500 to $2,999 | 27 (1.2%) | 6 (0.3%) |
| $3,000 or more | 12 (0.5%) | 0 (0.0%) |
| Total | 2,271 (100.0%) | 1,758 (100.0%) |
Physical Housing Characteristics in Harrodsburg
Housing Structures in Harrodsburg
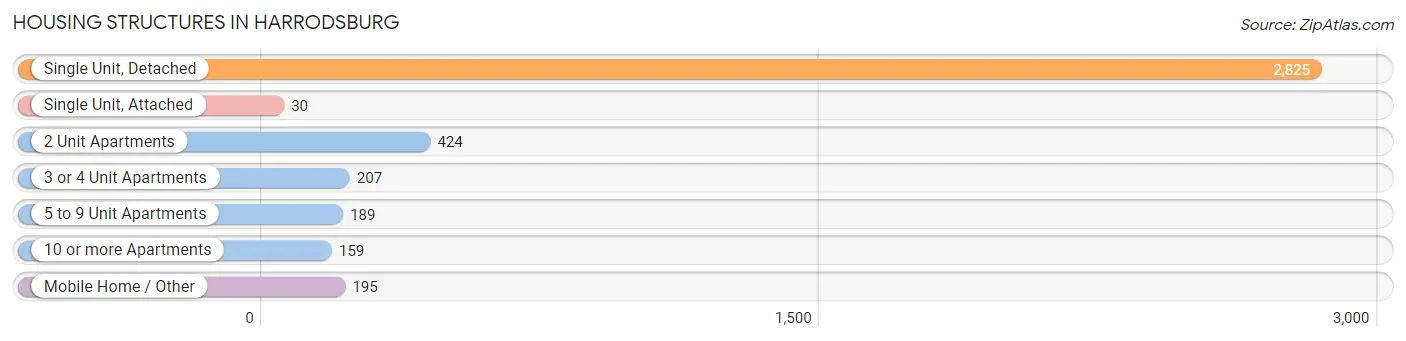
| Structure Type | # Housing Units | % Housing Units |
| Single Unit, Detached | 2,825 | 70.1% |
| Single Unit, Attached | 30 | 0.7% |
| 2 Unit Apartments | 424 | 10.5% |
| 3 or 4 Unit Apartments | 207 | 5.1% |
| 5 to 9 Unit Apartments | 189 | 4.7% |
| 10 or more Apartments | 159 | 4.0% |
| Mobile Home / Other | 195 | 4.8% |
| Total | 4,029 | 100.0% |
Housing Structures by Occupancy in Harrodsburg
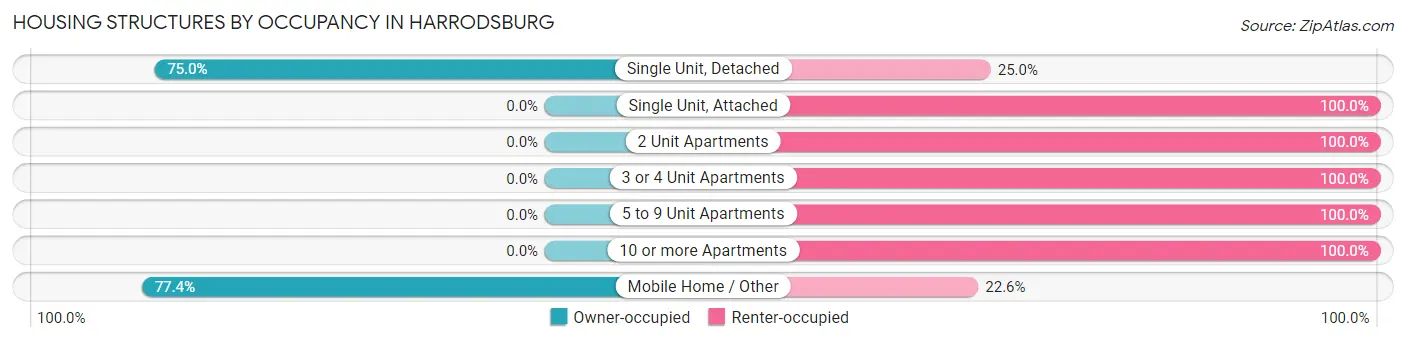
| Structure Type | Owner-occupied | Renter-occupied |
| Single Unit, Detached | 2,120 (75.0%) | 705 (25.0%) |
| Single Unit, Attached | 0 (0.0%) | 30 (100.0%) |
| 2 Unit Apartments | 0 (0.0%) | 424 (100.0%) |
| 3 or 4 Unit Apartments | 0 (0.0%) | 207 (100.0%) |
| 5 to 9 Unit Apartments | 0 (0.0%) | 189 (100.0%) |
| 10 or more Apartments | 0 (0.0%) | 159 (100.0%) |
| Mobile Home / Other | 151 (77.4%) | 44 (22.6%) |
| Total | 2,271 (56.4%) | 1,758 (43.6%) |
Housing Structures by Number of Rooms in Harrodsburg
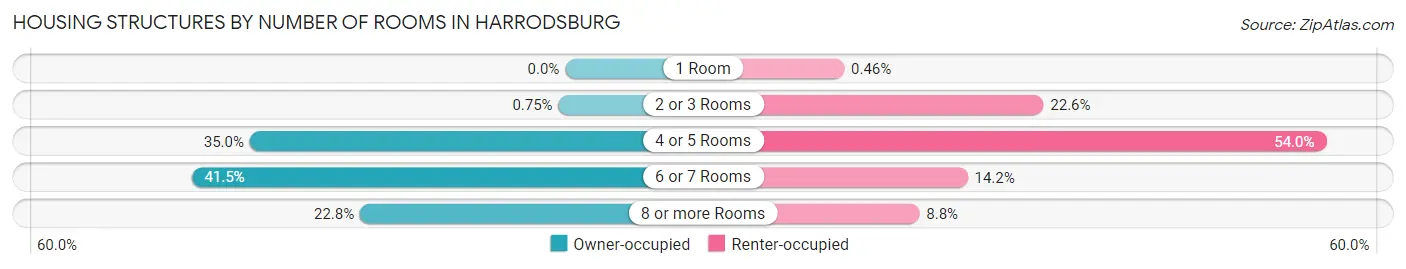
| Number of Rooms | Owner-occupied | Renter-occupied |
| 1 Room | 0 (0.0%) | 8 (0.5%) |
| 2 or 3 Rooms | 17 (0.7%) | 397 (22.6%) |
| 4 or 5 Rooms | 795 (35.0%) | 949 (54.0%) |
| 6 or 7 Rooms | 942 (41.5%) | 249 (14.2%) |
| 8 or more Rooms | 517 (22.8%) | 155 (8.8%) |
| Total | 2,271 (100.0%) | 1,758 (100.0%) |
Housing Structure by Heating Type in Harrodsburg
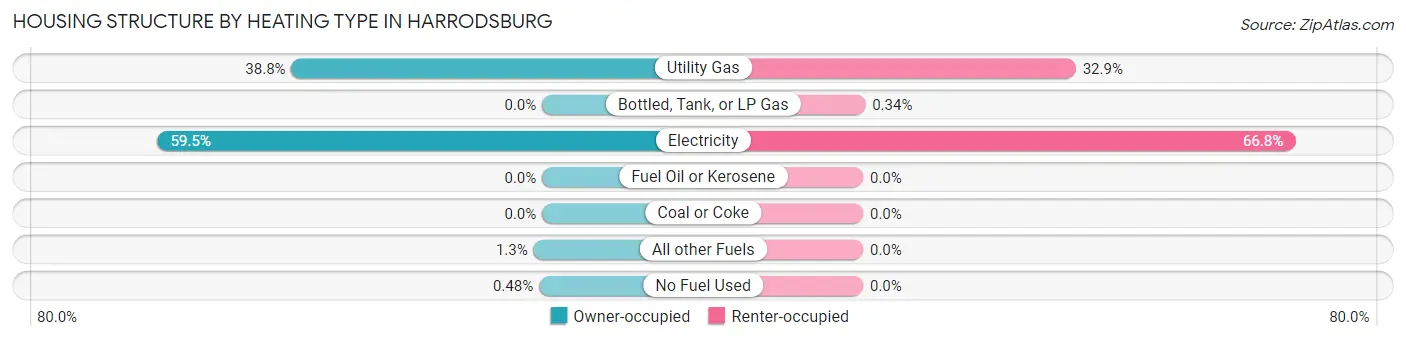
| Heating Type | Owner-occupied | Renter-occupied |
| Utility Gas | 880 (38.8%) | 578 (32.9%) |
| Bottled, Tank, or LP Gas | 0 (0.0%) | 6 (0.3%) |
| Electricity | 1,350 (59.5%) | 1,174 (66.8%) |
| Fuel Oil or Kerosene | 0 (0.0%) | 0 (0.0%) |
| Coal or Coke | 0 (0.0%) | 0 (0.0%) |
| All other Fuels | 30 (1.3%) | 0 (0.0%) |
| No Fuel Used | 11 (0.5%) | 0 (0.0%) |
| Total | 2,271 (100.0%) | 1,758 (100.0%) |
Household Vehicle Usage in Harrodsburg
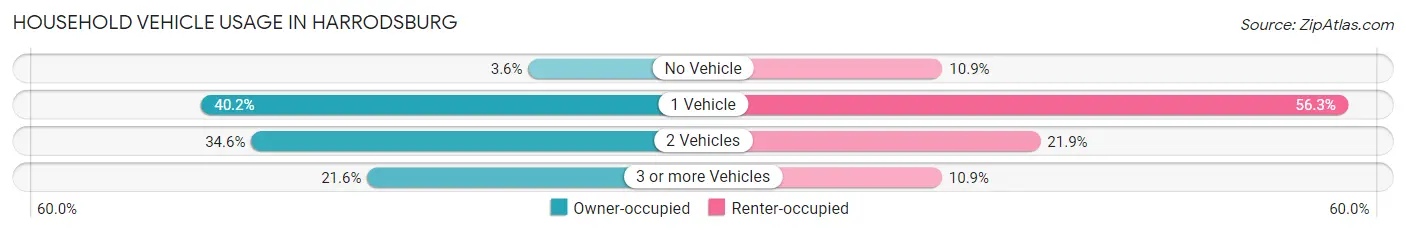
| Vehicles per Household | Owner-occupied | Renter-occupied |
| No Vehicle | 81 (3.6%) | 192 (10.9%) |
| 1 Vehicle | 913 (40.2%) | 990 (56.3%) |
| 2 Vehicles | 786 (34.6%) | 385 (21.9%) |
| 3 or more Vehicles | 491 (21.6%) | 191 (10.9%) |
| Total | 2,271 (100.0%) | 1,758 (100.0%) |
Real Estate & Mortgages in Harrodsburg
Real Estate and Mortgage Overview in Harrodsburg
| Characteristic | Without Mortgage | With Mortgage |
| Housing Units | 1,034 | 1,237 |
| Median Property Value | $120,800 | $165,000 |
| Median Household Income | $48,693 | $89 |
| Monthly Housing Costs | $401 | $12 |
| Real Estate Taxes | $1,280 | $131 |
Property Value by Mortgage Status in Harrodsburg
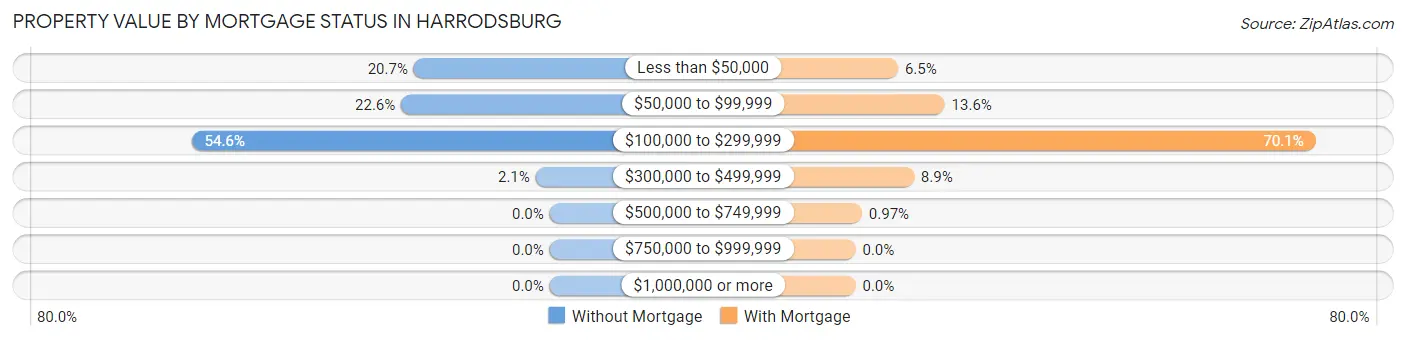
| Property Value | Without Mortgage | With Mortgage |
| Less than $50,000 | 214 (20.7%) | 80 (6.5%) |
| $50,000 to $99,999 | 234 (22.6%) | 168 (13.6%) |
| $100,000 to $299,999 | 564 (54.5%) | 867 (70.1%) |
| $300,000 to $499,999 | 22 (2.1%) | 110 (8.9%) |
| $500,000 to $749,999 | 0 (0.0%) | 12 (1.0%) |
| $750,000 to $999,999 | 0 (0.0%) | 0 (0.0%) |
| $1,000,000 or more | 0 (0.0%) | 0 (0.0%) |
| Total | 1,034 (100.0%) | 1,237 (100.0%) |
Household Income by Mortgage Status in Harrodsburg
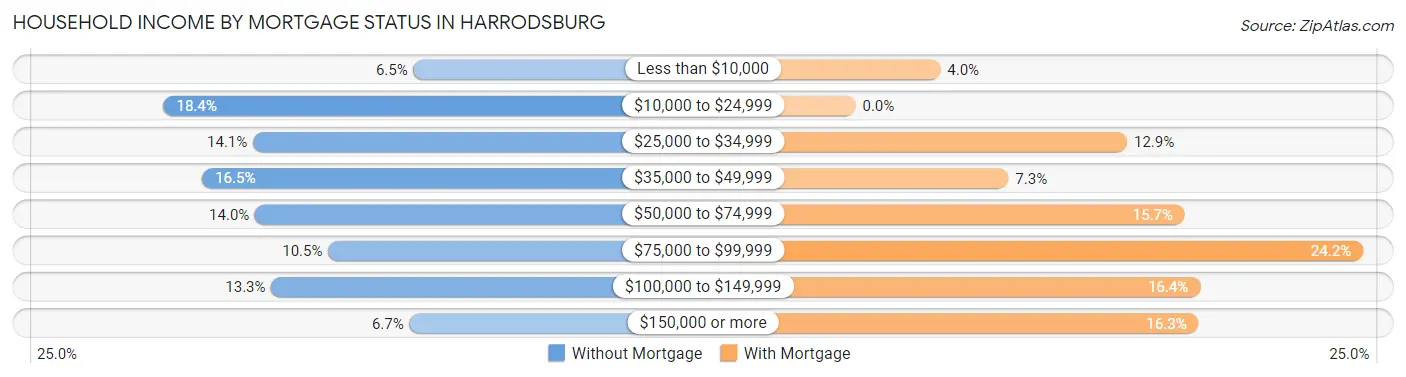
| Household Income | Without Mortgage | With Mortgage |
| Less than $10,000 | 67 (6.5%) | 50 (4.0%) |
| $10,000 to $24,999 | 190 (18.4%) | 0 (0.0%) |
| $25,000 to $34,999 | 146 (14.1%) | 160 (12.9%) |
| $35,000 to $49,999 | 171 (16.5%) | 90 (7.3%) |
| $50,000 to $74,999 | 145 (14.0%) | 194 (15.7%) |
| $75,000 to $99,999 | 109 (10.5%) | 299 (24.2%) |
| $100,000 to $149,999 | 137 (13.3%) | 203 (16.4%) |
| $150,000 or more | 69 (6.7%) | 202 (16.3%) |
| Total | 1,034 (100.0%) | 1,237 (100.0%) |
Property Value to Household Income Ratio in Harrodsburg
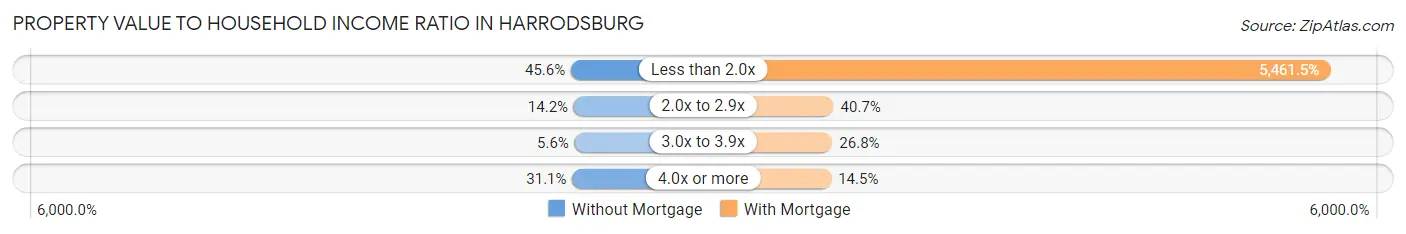
| Value-to-Income Ratio | Without Mortgage | With Mortgage |
| Less than 2.0x | 471 (45.6%) | 67,559 (5,461.5%) |
| 2.0x to 2.9x | 147 (14.2%) | 503 (40.7%) |
| 3.0x to 3.9x | 58 (5.6%) | 332 (26.8%) |
| 4.0x or more | 322 (31.1%) | 179 (14.5%) |
| Total | 1,034 (100.0%) | 1,237 (100.0%) |
Real Estate Taxes by Mortgage Status in Harrodsburg
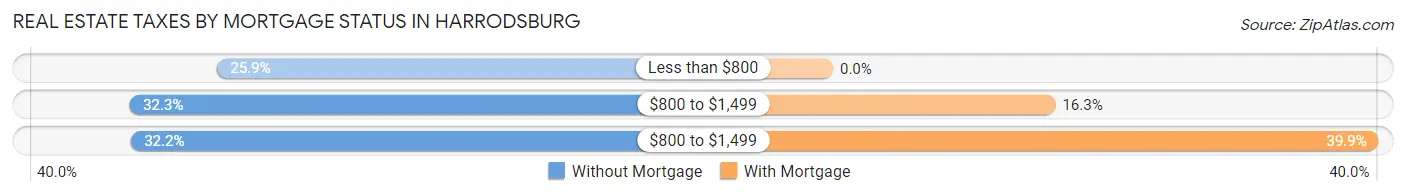
| Property Taxes | Without Mortgage | With Mortgage |
| Less than $800 | 268 (25.9%) | 0 (0.0%) |
| $800 to $1,499 | 334 (32.3%) | 201 (16.3%) |
| $800 to $1,499 | 333 (32.2%) | 493 (39.9%) |
| Total | 1,034 (100.0%) | 1,237 (100.0%) |
Health & Disability in Harrodsburg
Health Insurance Coverage by Age in Harrodsburg
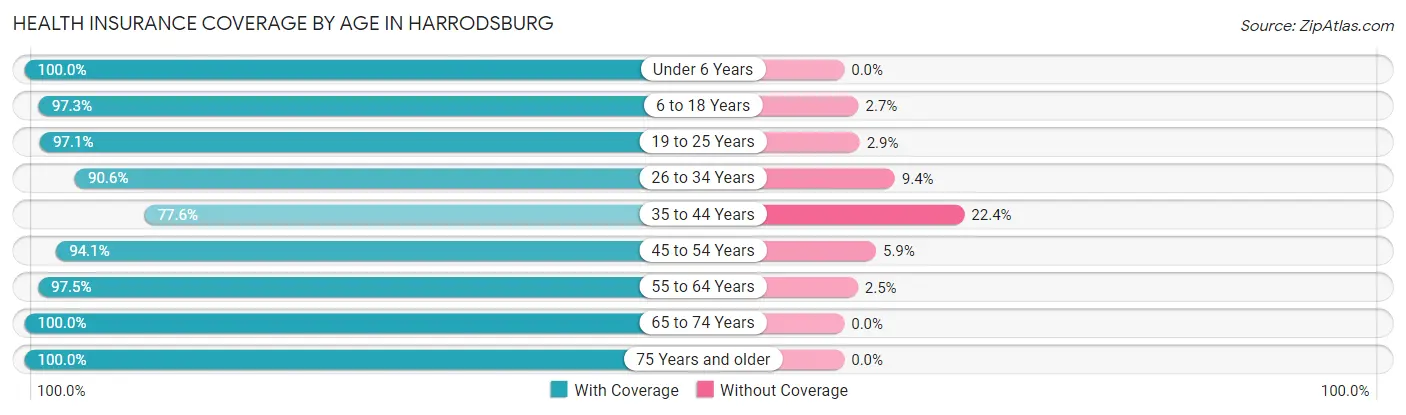
| Age Bracket | With Coverage | Without Coverage |
| Under 6 Years | 755 (100.0%) | 0 (0.0%) |
| 6 to 18 Years | 1,243 (97.3%) | 34 (2.7%) |
| 19 to 25 Years | 877 (97.1%) | 26 (2.9%) |
| 26 to 34 Years | 1,202 (90.6%) | 125 (9.4%) |
| 35 to 44 Years | 842 (77.6%) | 243 (22.4%) |
| 45 to 54 Years | 1,017 (94.1%) | 64 (5.9%) |
| 55 to 64 Years | 886 (97.5%) | 23 (2.5%) |
| 65 to 74 Years | 1,038 (100.0%) | 0 (0.0%) |
| 75 Years and older | 486 (100.0%) | 0 (0.0%) |
| Total | 8,346 (94.2%) | 515 (5.8%) |
Health Insurance Coverage by Citizenship Status in Harrodsburg
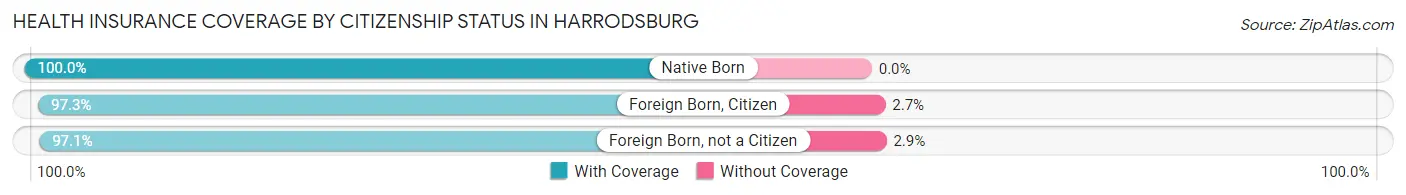
| Citizenship Status | With Coverage | Without Coverage |
| Native Born | 755 (100.0%) | 0 (0.0%) |
| Foreign Born, Citizen | 1,243 (97.3%) | 34 (2.7%) |
| Foreign Born, not a Citizen | 877 (97.1%) | 26 (2.9%) |
Health Insurance Coverage by Household Income in Harrodsburg
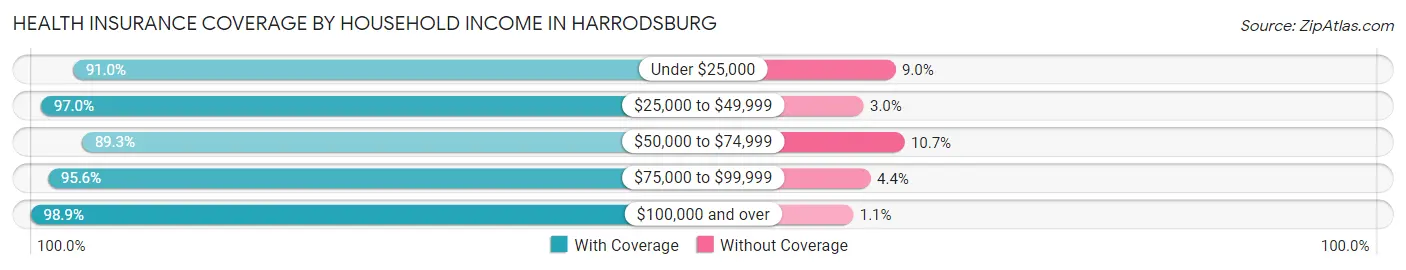
| Household Income | With Coverage | Without Coverage |
| Under $25,000 | 1,200 (91.0%) | 119 (9.0%) |
| $25,000 to $49,999 | 1,821 (97.0%) | 57 (3.0%) |
| $50,000 to $74,999 | 2,225 (89.3%) | 267 (10.7%) |
| $75,000 to $99,999 | 1,075 (95.6%) | 49 (4.4%) |
| $100,000 and over | 2,025 (98.9%) | 23 (1.1%) |
Public vs Private Health Insurance Coverage by Age in Harrodsburg
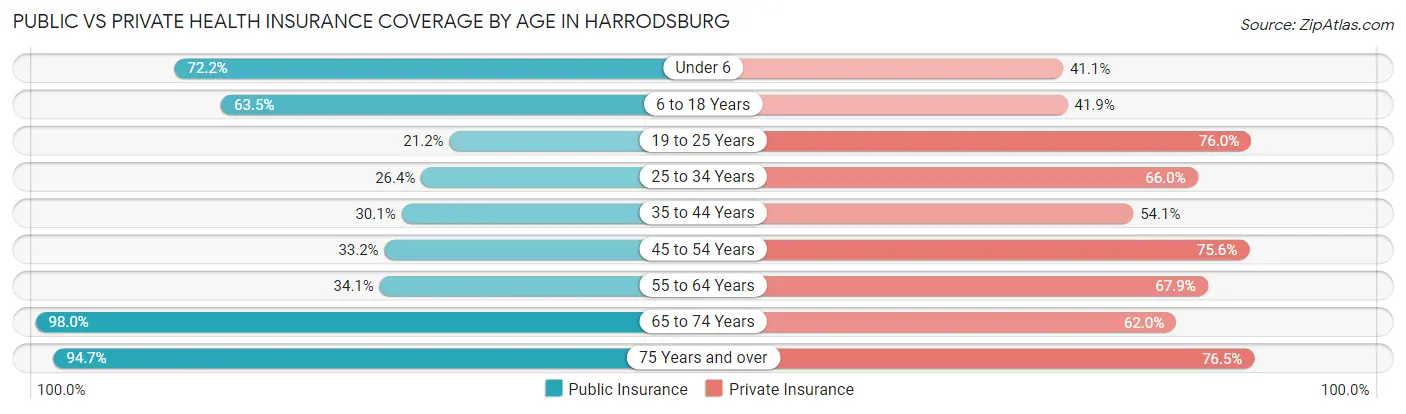
| Age Bracket | Public Insurance | Private Insurance |
| Under 6 | 545 (72.2%) | 310 (41.1%) |
| 6 to 18 Years | 811 (63.5%) | 535 (41.9%) |
| 19 to 25 Years | 191 (21.1%) | 686 (76.0%) |
| 25 to 34 Years | 350 (26.4%) | 876 (66.0%) |
| 35 to 44 Years | 326 (30.0%) | 587 (54.1%) |
| 45 to 54 Years | 359 (33.2%) | 817 (75.6%) |
| 55 to 64 Years | 310 (34.1%) | 617 (67.9%) |
| 65 to 74 Years | 1,017 (98.0%) | 644 (62.0%) |
| 75 Years and over | 460 (94.7%) | 372 (76.5%) |
| Total | 4,369 (49.3%) | 5,444 (61.4%) |
Disability Status by Sex by Age in Harrodsburg
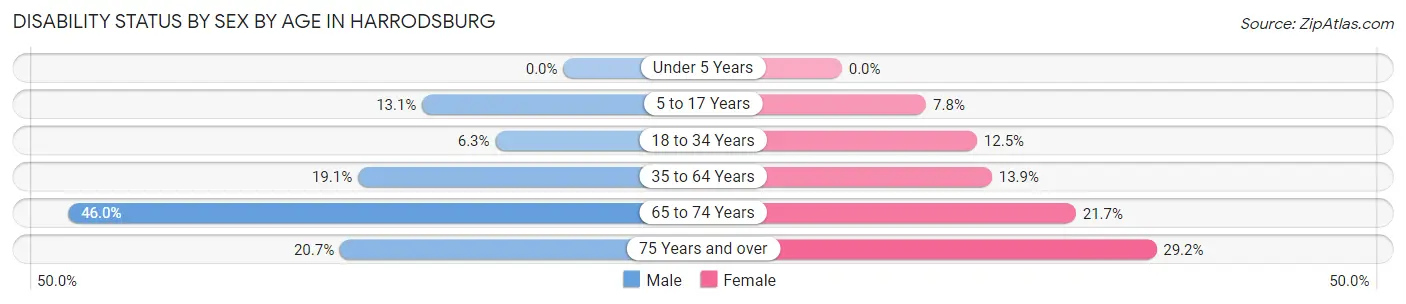
| Age Bracket | Male | Female |
| Under 5 Years | 0 (0.0%) | 0 (0.0%) |
| 5 to 17 Years | 95 (13.1%) | 45 (7.8%) |
| 18 to 34 Years | 76 (6.3%) | 140 (12.5%) |
| 35 to 64 Years | 315 (19.1%) | 198 (13.9%) |
| 65 to 74 Years | 204 (46.0%) | 129 (21.7%) |
| 75 Years and over | 34 (20.7%) | 94 (29.2%) |
Disability Class by Sex by Age in Harrodsburg
Disability Class: Hearing Difficulty
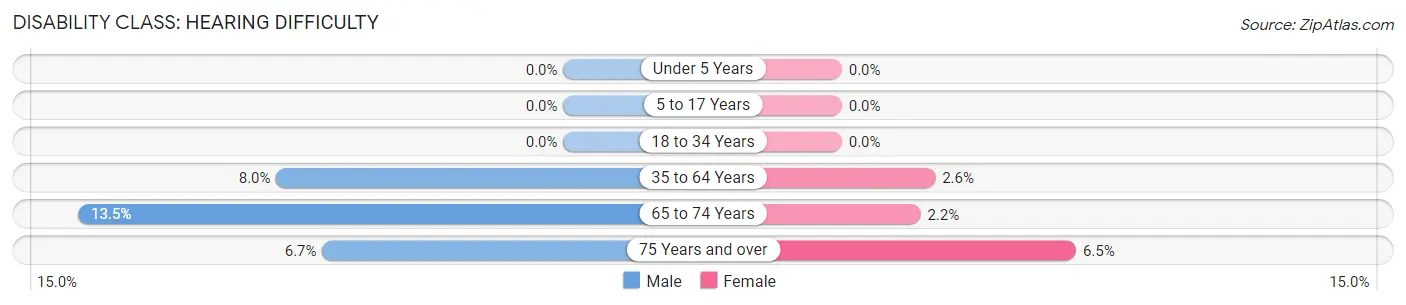
| Age Bracket | Male | Female |
| Under 5 Years | 0 (0.0%) | 0 (0.0%) |
| 5 to 17 Years | 0 (0.0%) | 0 (0.0%) |
| 18 to 34 Years | 0 (0.0%) | 0 (0.0%) |
| 35 to 64 Years | 132 (8.0%) | 37 (2.6%) |
| 65 to 74 Years | 60 (13.5%) | 13 (2.2%) |
| 75 Years and over | 11 (6.7%) | 21 (6.5%) |
Disability Class: Vision Difficulty
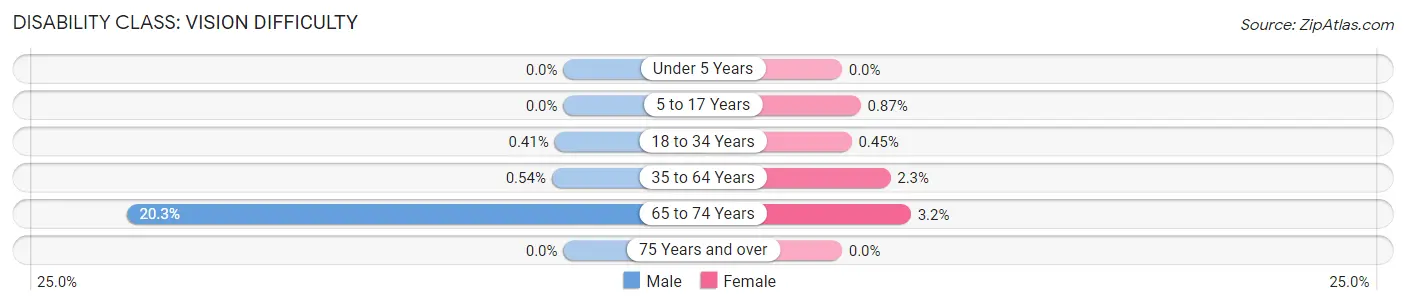
| Age Bracket | Male | Female |
| Under 5 Years | 0 (0.0%) | 0 (0.0%) |
| 5 to 17 Years | 0 (0.0%) | 5 (0.9%) |
| 18 to 34 Years | 5 (0.4%) | 5 (0.4%) |
| 35 to 64 Years | 9 (0.5%) | 32 (2.2%) |
| 65 to 74 Years | 90 (20.3%) | 19 (3.2%) |
| 75 Years and over | 0 (0.0%) | 0 (0.0%) |
Disability Class: Cognitive Difficulty
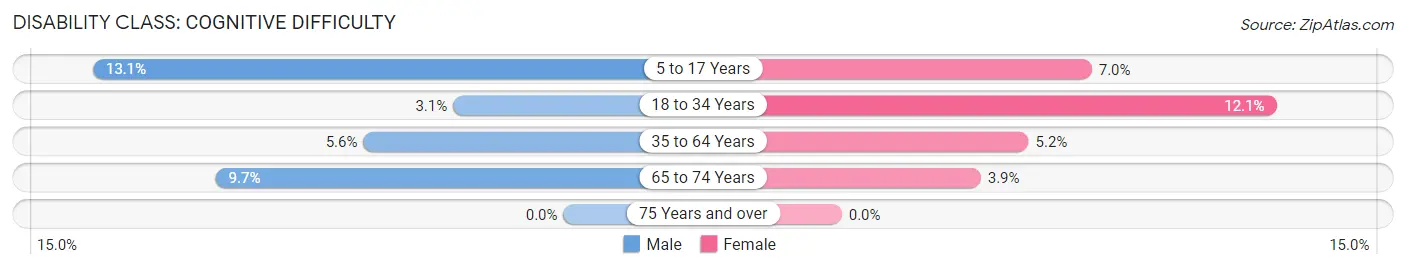
| Age Bracket | Male | Female |
| 5 to 17 Years | 95 (13.1%) | 40 (7.0%) |
| 18 to 34 Years | 37 (3.1%) | 135 (12.1%) |
| 35 to 64 Years | 92 (5.6%) | 74 (5.2%) |
| 65 to 74 Years | 43 (9.7%) | 23 (3.9%) |
| 75 Years and over | 0 (0.0%) | 0 (0.0%) |
Disability Class: Ambulatory Difficulty
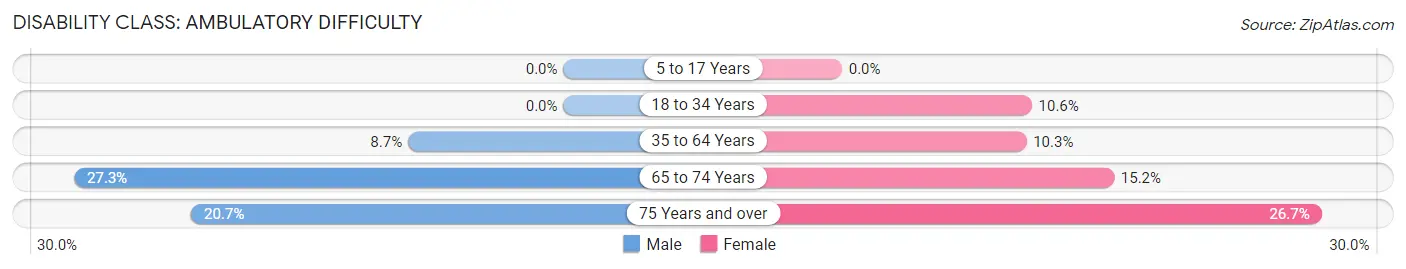
| Age Bracket | Male | Female |
| 5 to 17 Years | 0 (0.0%) | 0 (0.0%) |
| 18 to 34 Years | 0 (0.0%) | 118 (10.6%) |
| 35 to 64 Years | 143 (8.6%) | 146 (10.3%) |
| 65 to 74 Years | 121 (27.3%) | 90 (15.1%) |
| 75 Years and over | 34 (20.7%) | 86 (26.7%) |
Disability Class: Self-Care Difficulty
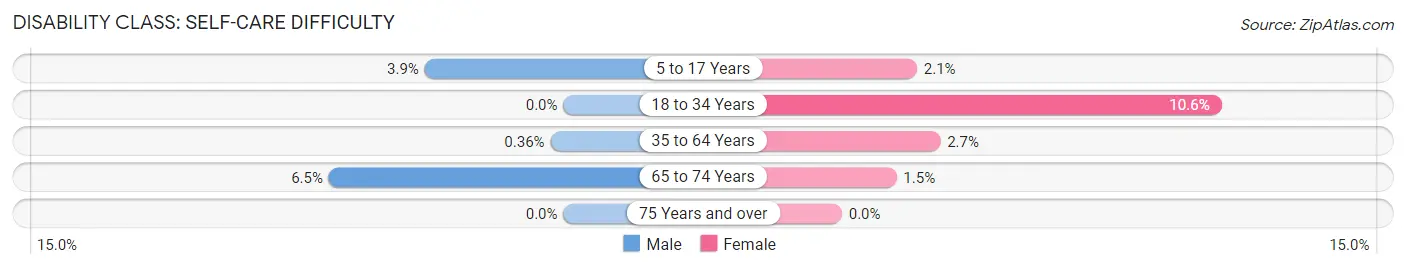
| Age Bracket | Male | Female |
| 5 to 17 Years | 28 (3.9%) | 12 (2.1%) |
| 18 to 34 Years | 0 (0.0%) | 118 (10.6%) |
| 35 to 64 Years | 6 (0.4%) | 39 (2.7%) |
| 65 to 74 Years | 29 (6.5%) | 9 (1.5%) |
| 75 Years and over | 0 (0.0%) | 0 (0.0%) |
Technology Access in Harrodsburg
Computing Device Access in Harrodsburg
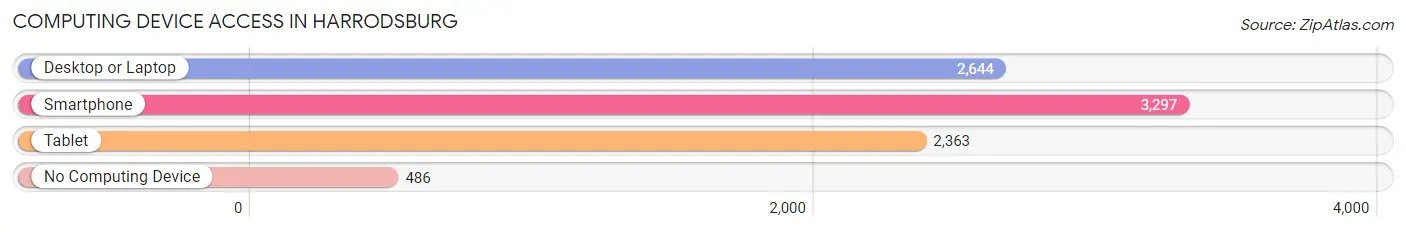
| Device Type | # Households | % Households |
| Desktop or Laptop | 2,644 | 65.6% |
| Smartphone | 3,297 | 81.8% |
| Tablet | 2,363 | 58.7% |
| No Computing Device | 486 | 12.1% |
| Total | 4,029 | 100.0% |
Internet Access in Harrodsburg
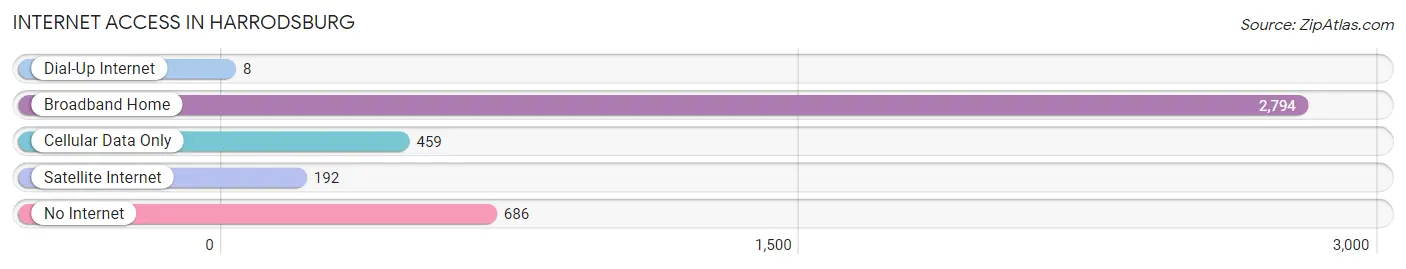
| Internet Type | # Households | % Households |
| Dial-Up Internet | 8 | 0.2% |
| Broadband Home | 2,794 | 69.4% |
| Cellular Data Only | 459 | 11.4% |
| Satellite Internet | 192 | 4.8% |
| No Internet | 686 | 17.0% |
| Total | 4,029 | 100.0% |
Harrodsburg Summary
Harrodsburg, Kentucky is a small city located in Mercer County, Kentucky. It is the county seat of Mercer County and is located in the heart of the Bluegrass Region. The city is situated on the banks of the Kentucky River and is home to a population of 8,340 people as of the 2010 census.
History
Harrodsburg was founded in 1774 by James Harrod, a veteran of the French and Indian War. Harrod and a group of settlers from Pennsylvania and Virginia established the first permanent settlement in Kentucky. The settlement was named Harrodstown in honor of its founder. The settlement quickly grew and in 1785, the town was officially incorporated as Harrodsburg.
In the early 19th century, Harrodsburg was a major center of commerce and industry. The city was home to several mills, distilleries, and other businesses. The city was also a major stop on the Louisville and Nashville Railroad, which connected the city to other major cities in the region.
Geography
Harrodsburg is located in the heart of the Bluegrass Region of Kentucky. The city is situated on the banks of the Kentucky River and is surrounded by rolling hills and farmland. The city has a total area of 4.2 square miles, all of which is land.
Economy
Harrodsburg’s economy is largely based on agriculture and manufacturing. The city is home to several large manufacturing plants, including a General Electric plant and a Toyota plant. The city is also home to several small businesses, including restaurants, retail stores, and other services.
Demographics
As of the 2010 census, Harrodsburg had a population of 8,340 people. The racial makeup of the city was 90.2% White, 6.2% African American, 0.4% Native American, 0.7% Asian, 0.1% Pacific Islander, and 2.4% from other races. The median household income was $35,945 and the median family income was $45,945.
Conclusion
Harrodsburg, Kentucky is a small city located in Mercer County, Kentucky. It is the county seat of Mercer County and is located in the heart of the Bluegrass Region. The city is situated on the banks of the Kentucky River and is home to a population of 8,340 people as of the 2010 census. Harrodsburg’s economy is largely based on agriculture and manufacturing. The city is home to several large manufacturing plants, including a General Electric plant and a Toyota plant. The city is also home to several small businesses, including restaurants, retail stores, and other services. As of the 2010 census, Harrodsburg had a population of 8,340 people. The racial makeup of the city was 90.2% White, 6.2% African American, 0.4% Native American, 0.7% Asian, 0.1% Pacific Islander, and 2.4% from other races. The median household income was $35,945 and the median family income was $45,945.
Common Questions
What is Per Capita Income in Harrodsburg?
Per Capita income in Harrodsburg is $26,399.
What is the Median Family Income in Harrodsburg?
Median Family Income in Harrodsburg is $66,412.
What is the Median Household income in Harrodsburg?
Median Household Income in Harrodsburg is $49,293.
What is Income or Wage Gap in Harrodsburg?
Income or Wage Gap in Harrodsburg is 20.3%.
Women in Harrodsburg earn 79.7 cents for every dollar earned by a man.
What is Inequality or Gini Index in Harrodsburg?
Inequality or Gini Index in Harrodsburg is 0.37.
What is the Total Population of Harrodsburg?
Total Population of Harrodsburg is 9,057.
What is the Total Male Population of Harrodsburg?
Total Male Population of Harrodsburg is 4,717.
What is the Total Female Population of Harrodsburg?
Total Female Population of Harrodsburg is 4,340.
What is the Ratio of Males per 100 Females in Harrodsburg?
There are 108.69 Males per 100 Females in Harrodsburg.
What is the Ratio of Females per 100 Males in Harrodsburg?
There are 92.01 Females per 100 Males in Harrodsburg.
What is the Median Population Age in Harrodsburg?
Median Population Age in Harrodsburg is 38.2 Years.
What is the Average Family Size in Harrodsburg
Average Family Size in Harrodsburg is 3.2 People.
What is the Average Household Size in Harrodsburg
Average Household Size in Harrodsburg is 2.2 People.
How Large is the Labor Force in Harrodsburg?
There are 4,713 People in the Labor Forcein in Harrodsburg.
What is the Percentage of People in the Labor Force in Harrodsburg?
64.0% of People are in the Labor Force in Harrodsburg.
What is the Unemployment Rate in Harrodsburg?
Unemployment Rate in Harrodsburg is 3.2%.