Josephine, TX Map & Demographics
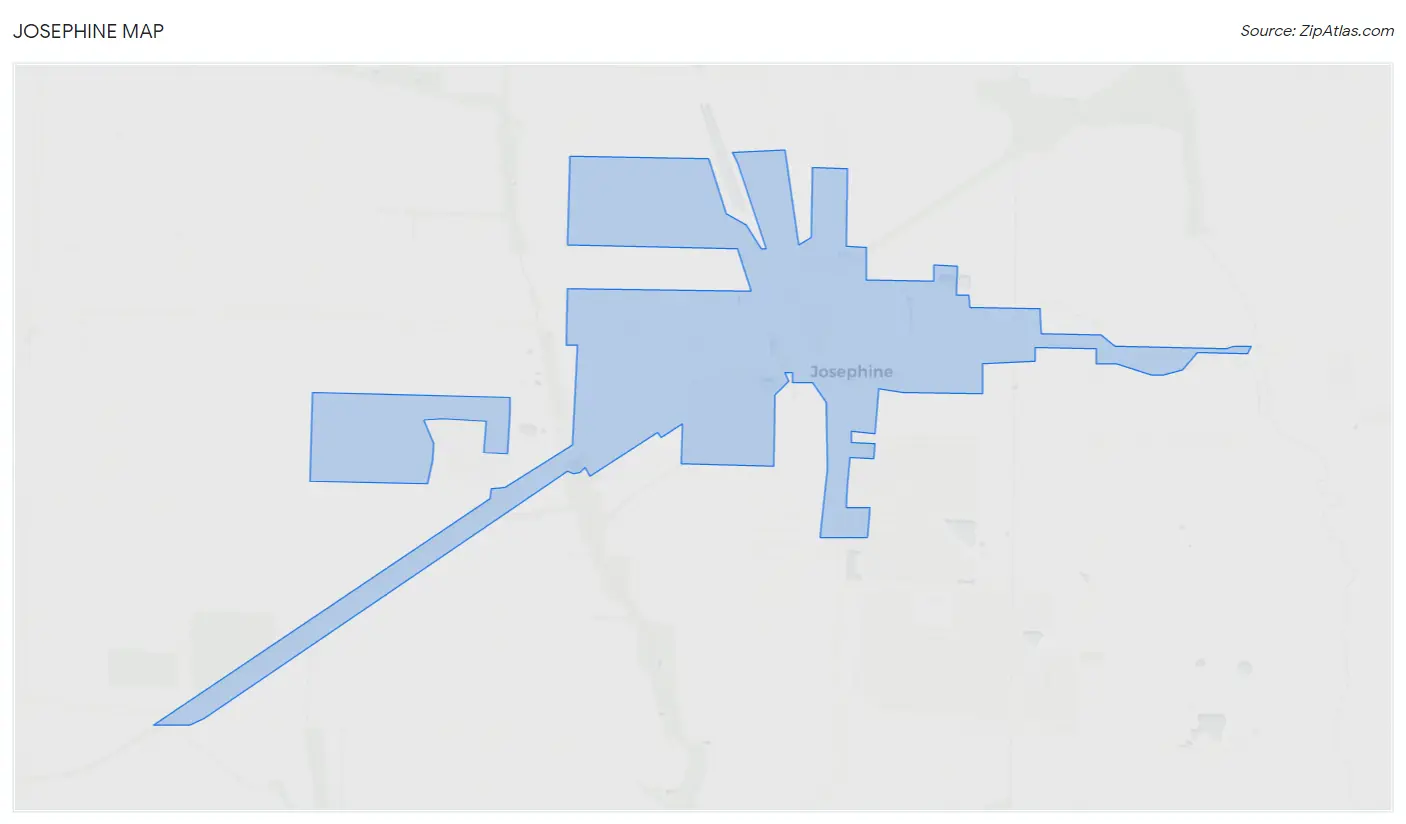
Josephine Map
Josephine Overview
$34,995
PER CAPITA INCOME
$92,794
AVG FAMILY INCOME
$80,648
AVG HOUSEHOLD INCOME
51.5%
WAGE / INCOME GAP [ % ]
48.5¢/ $1
WAGE / INCOME GAP [ $ ]
0.37
INEQUALITY / GINI INDEX
3,497
TOTAL POPULATION
1,714
MALE POPULATION
1,783
FEMALE POPULATION
96.13
MALES / 100 FEMALES
104.03
FEMALES / 100 MALES
33.2
MEDIAN AGE
3.4
AVG FAMILY SIZE
3.1
AVG HOUSEHOLD SIZE
1,806
LABOR FORCE [ PEOPLE ]
69.4%
PERCENT IN LABOR FORCE
4.0%
UNEMPLOYMENT RATE
Josephine Zip Codes
Income in Josephine
Income Overview in Josephine
Per Capita Income in Josephine is $34,995, while median incomes of families and households are $92,794 and $80,648 respectively.
| Characteristic | Number | Measure |
| Per Capita Income | 3,497 | $34,995 |
| Median Family Income | 924 | $92,794 |
| Mean Family Income | 924 | $112,428 |
| Median Household Income | 1,138 | $80,648 |
| Mean Household Income | 1,138 | $104,491 |
| Income Deficit | 924 | $0 |
| Wage / Income Gap (%) | 3,497 | 51.48% |
| Wage / Income Gap ($) | 3,497 | 48.52¢ per $1 |
| Gini / Inequality Index | 3,497 | 0.37 |
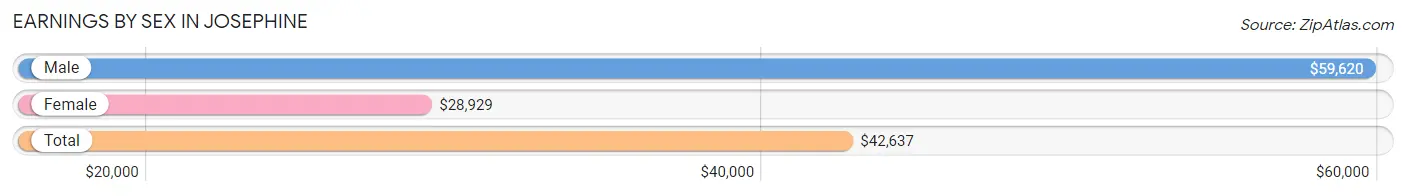
Earnings by Sex in Josephine
Average Earnings in Josephine are $42,637, $59,620 for men and $28,929 for women, a difference of 51.5%.
| Sex | Number | Average Earnings |
| Male | 970 (53.2%) | $59,620 |
| Female | 854 (46.8%) | $28,929 |
| Total | 1,824 (100.0%) | $42,637 |
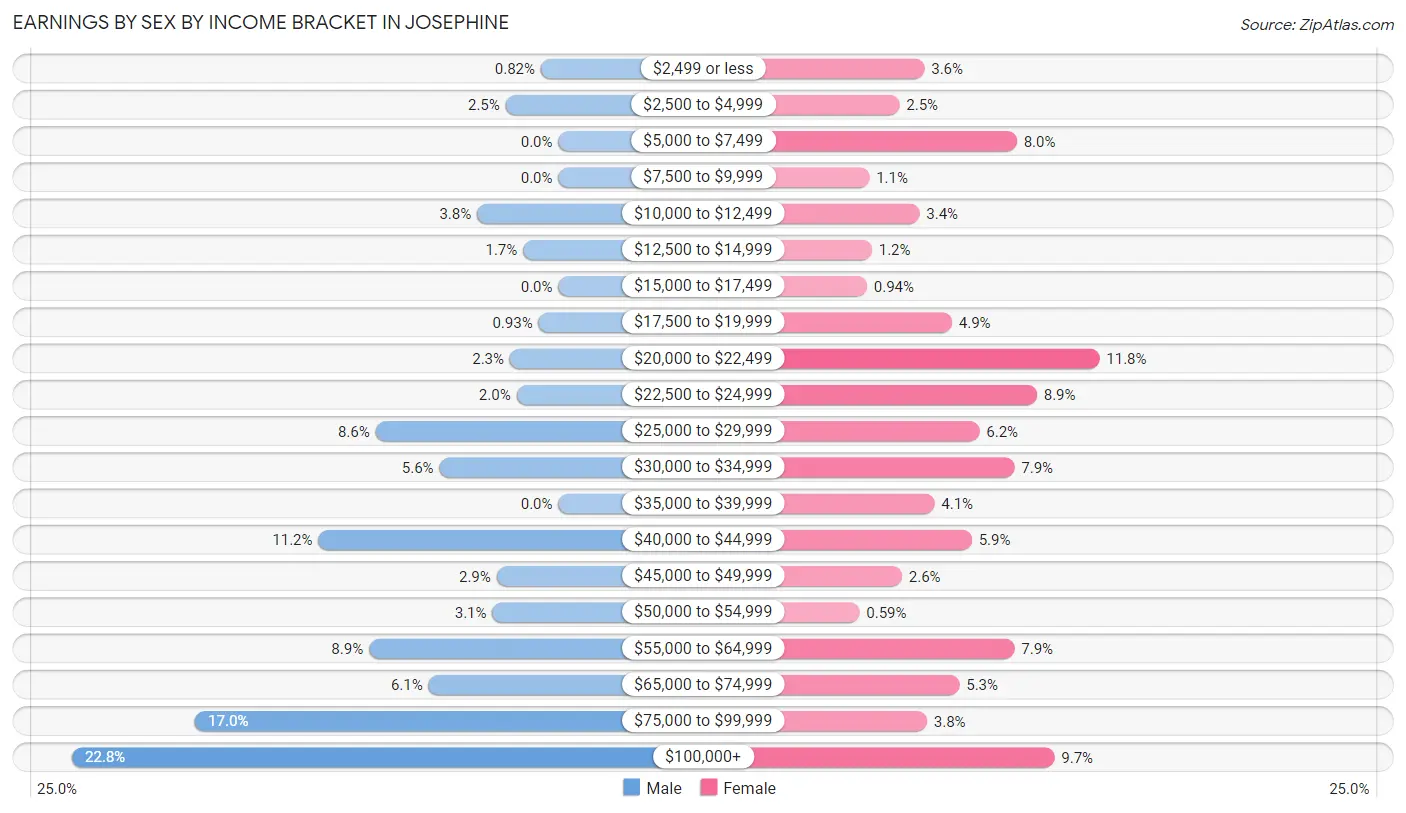
Earnings by Sex by Income Bracket in Josephine
The most common earnings brackets in Josephine are $100,000+ for men (221 | 22.8%) and $20,000 to $22,499 for women (101 | 11.8%).
| Income | Male | Female |
| $2,499 or less | 8 (0.8%) | 31 (3.6%) |
| $2,500 to $4,999 | 24 (2.5%) | 21 (2.5%) |
| $5,000 to $7,499 | 0 (0.0%) | 68 (8.0%) |
| $7,500 to $9,999 | 0 (0.0%) | 9 (1.1%) |
| $10,000 to $12,499 | 37 (3.8%) | 29 (3.4%) |
| $12,500 to $14,999 | 16 (1.7%) | 10 (1.2%) |
| $15,000 to $17,499 | 0 (0.0%) | 8 (0.9%) |
| $17,500 to $19,999 | 9 (0.9%) | 42 (4.9%) |
| $20,000 to $22,499 | 22 (2.3%) | 101 (11.8%) |
| $22,500 to $24,999 | 19 (2.0%) | 76 (8.9%) |
| $25,000 to $29,999 | 83 (8.6%) | 53 (6.2%) |
| $30,000 to $34,999 | 54 (5.6%) | 67 (7.9%) |
| $35,000 to $39,999 | 0 (0.0%) | 35 (4.1%) |
| $40,000 to $44,999 | 109 (11.2%) | 50 (5.9%) |
| $45,000 to $49,999 | 28 (2.9%) | 22 (2.6%) |
| $50,000 to $54,999 | 30 (3.1%) | 5 (0.6%) |
| $55,000 to $64,999 | 86 (8.9%) | 67 (7.9%) |
| $65,000 to $74,999 | 59 (6.1%) | 45 (5.3%) |
| $75,000 to $99,999 | 165 (17.0%) | 32 (3.7%) |
| $100,000+ | 221 (22.8%) | 83 (9.7%) |
| Total | 970 (100.0%) | 854 (100.0%) |
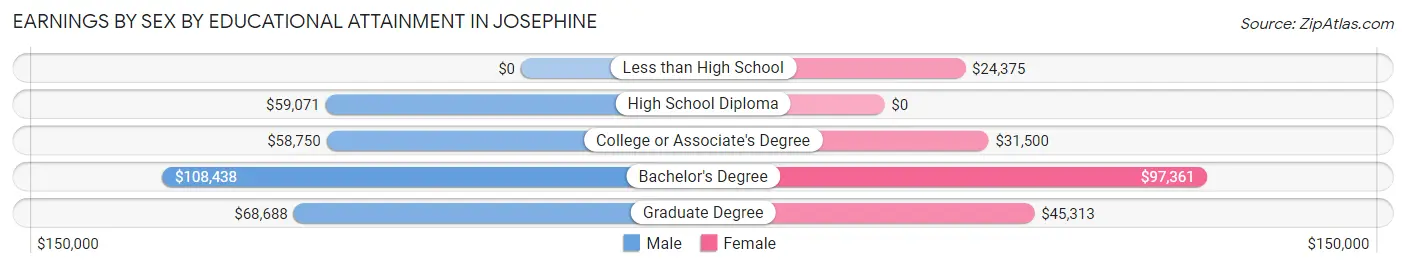
Earnings by Sex by Educational Attainment in Josephine
Average earnings in Josephine are $65,469 for men and $34,091 for women, a difference of 47.9%. Men with an educational attainment of bachelor's degree enjoy the highest average annual earnings of $108,438, while those with college or associate's degree education earn the least with $58,750. Women with an educational attainment of bachelor's degree earn the most with the average annual earnings of $97,361, while those with less than high school education have the smallest earnings of $24,375.
| Educational Attainment | Male Income | Female Income |
| Less than High School | - | - |
| High School Diploma | $59,071 | $0 |
| College or Associate's Degree | $58,750 | $31,500 |
| Bachelor's Degree | $108,438 | $97,361 |
| Graduate Degree | $68,688 | $45,313 |
| Total | $65,469 | $34,091 |
Family Income in Josephine
Family Income Brackets in Josephine
According to the Josephine family income data, there are 224 families falling into the $100,000 to $149,999 income range, which is the most common income bracket and makes up 24.2% of all families.
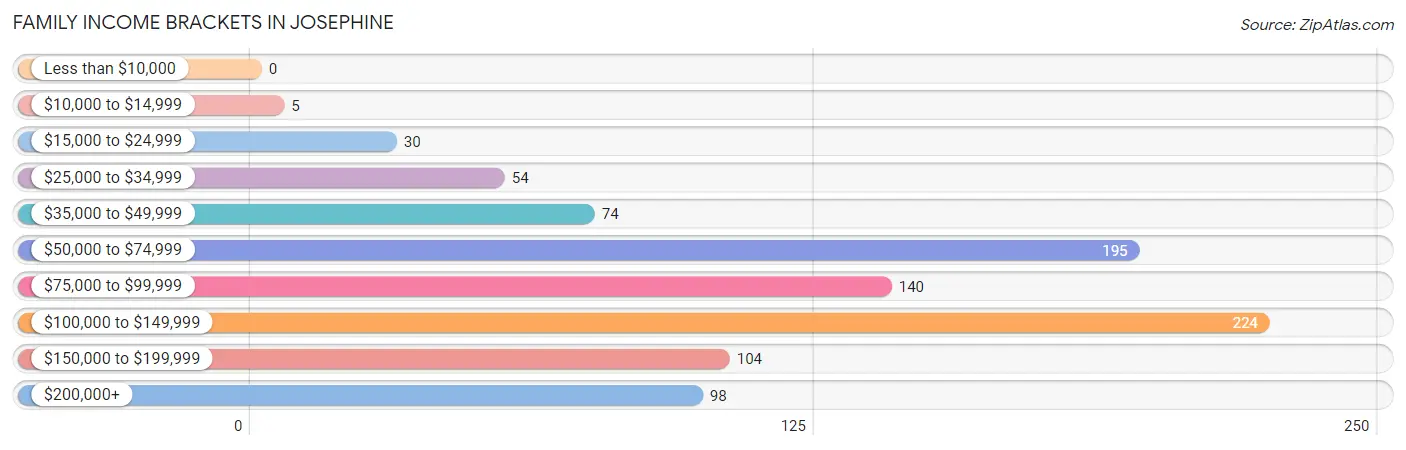
| Income Bracket | # Families | % Families |
| Less than $10,000 | 0 | 0.0% |
| $10,000 to $14,999 | 5 | 0.5% |
| $15,000 to $24,999 | 30 | 3.2% |
| $25,000 to $34,999 | 54 | 5.8% |
| $35,000 to $49,999 | 74 | 8.0% |
| $50,000 to $74,999 | 195 | 21.1% |
| $75,000 to $99,999 | 140 | 15.2% |
| $100,000 to $149,999 | 224 | 24.2% |
| $150,000 to $199,999 | 104 | 11.3% |
| $200,000+ | 98 | 10.6% |
Family Income by Famaliy Size in Josephine
4-person families (185 | 20.0%) account for the highest median family income in Josephine with $112,404 per family, while 2-person families (385 | 41.7%) have the highest median income of $46,287 per family member.
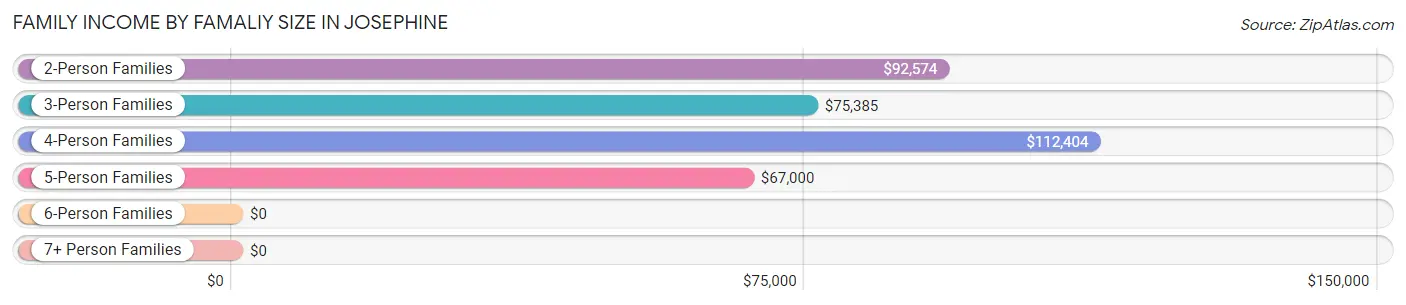
| Income Bracket | # Families | Median Income |
| 2-Person Families | 385 (41.7%) | $92,574 |
| 3-Person Families | 178 (19.3%) | $75,385 |
| 4-Person Families | 185 (20.0%) | $112,404 |
| 5-Person Families | 116 (12.6%) | $67,000 |
| 6-Person Families | 22 (2.4%) | $0 |
| 7+ Person Families | 38 (4.1%) | $0 |
| Total | 924 (100.0%) | $92,794 |
Family Income by Number of Earners in Josephine
The median family income in Josephine is $92,794, with families comprising 3+ earners (77) having the highest median family income of $125,089, while families with no earners (80) have the lowest median family income of $50,536, accounting for 8.3% and 8.7% of families, respectively.
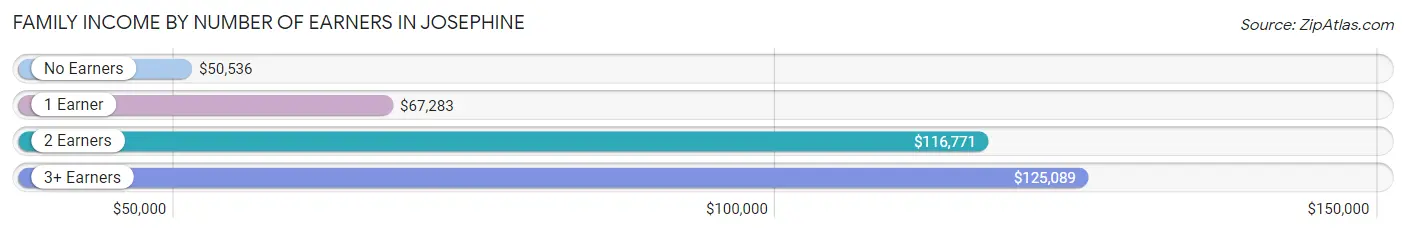
| Number of Earners | # Families | Median Income |
| No Earners | 80 (8.7%) | $50,536 |
| 1 Earner | 266 (28.8%) | $67,283 |
| 2 Earners | 501 (54.2%) | $116,771 |
| 3+ Earners | 77 (8.3%) | $125,089 |
| Total | 924 (100.0%) | $92,794 |
Household Income in Josephine
Household Income Brackets in Josephine
With 258 households falling in the category, the $50,000 to $74,999 income range is the most frequent in Josephine, accounting for 22.7% of all households.
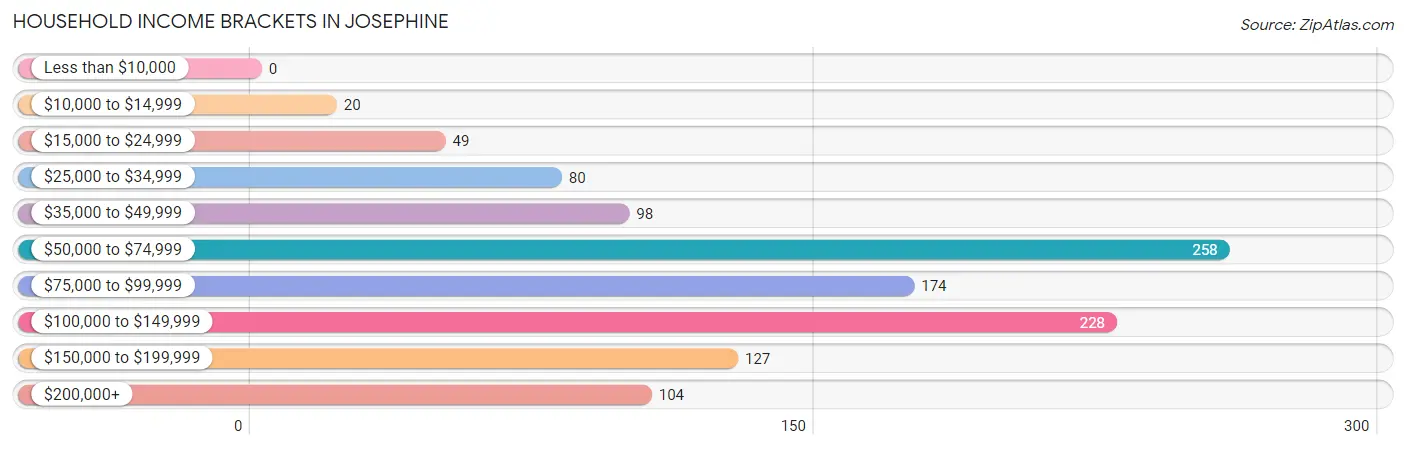
| Income Bracket | # Households | % Households |
| Less than $10,000 | 0 | 0.0% |
| $10,000 to $14,999 | 20 | 1.8% |
| $15,000 to $24,999 | 49 | 4.3% |
| $25,000 to $34,999 | 80 | 7.0% |
| $35,000 to $49,999 | 98 | 8.6% |
| $50,000 to $74,999 | 258 | 22.7% |
| $75,000 to $99,999 | 174 | 15.3% |
| $100,000 to $149,999 | 228 | 20.0% |
| $150,000 to $199,999 | 127 | 11.2% |
| $200,000+ | 104 | 9.1% |
Household Income by Householder Age in Josephine
The median household income in Josephine is $80,648, with the highest median household income of $109,250 found in the 25 to 44 years age bracket for the primary householder. A total of 514 households (45.2%) fall into this category. Meanwhile, the 15 to 24 years age bracket for the primary householder has the lowest median household income of $0, with 7 households (0.6%) in this group.
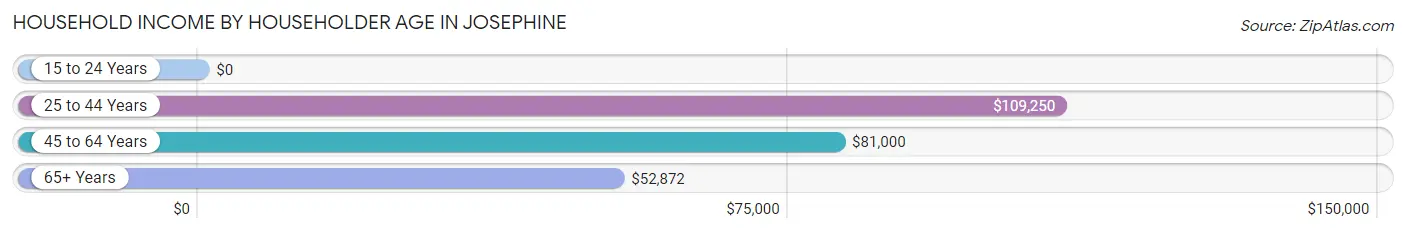
| Income Bracket | # Households | Median Income |
| 15 to 24 Years | 7 (0.6%) | $0 |
| 25 to 44 Years | 514 (45.2%) | $109,250 |
| 45 to 64 Years | 400 (35.1%) | $81,000 |
| 65+ Years | 217 (19.1%) | $52,872 |
| Total | 1,138 (100.0%) | $80,648 |
Poverty in Josephine
Income Below Poverty by Sex and Age in Josephine
With 10.0% poverty level for males and 11.1% for females among the residents of Josephine, 18 to 24 year old males and 75 year old and over females are the most vulnerable to poverty, with 42 males (50.0%) and 18 females (39.1%) in their respective age groups living below the poverty level.
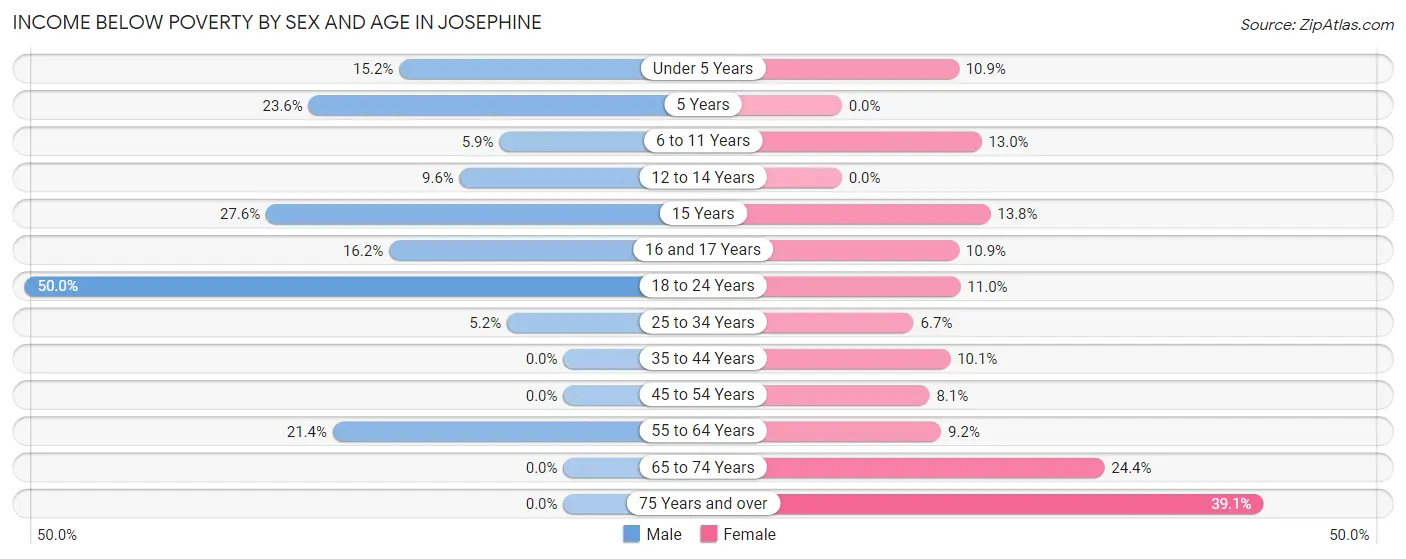
| Age Bracket | Male | Female |
| Under 5 Years | 16 (15.2%) | 14 (10.8%) |
| 5 Years | 13 (23.6%) | 0 (0.0%) |
| 6 to 11 Years | 12 (5.9%) | 28 (13.0%) |
| 12 to 14 Years | 5 (9.6%) | 0 (0.0%) |
| 15 Years | 8 (27.6%) | 4 (13.8%) |
| 16 and 17 Years | 11 (16.2%) | 5 (10.9%) |
| 18 to 24 Years | 42 (50.0%) | 24 (11.0%) |
| 25 to 34 Years | 15 (5.2%) | 18 (6.7%) |
| 35 to 44 Years | 0 (0.0%) | 17 (10.1%) |
| 45 to 54 Years | 0 (0.0%) | 21 (8.1%) |
| 55 to 64 Years | 49 (21.4%) | 19 (9.2%) |
| 65 to 74 Years | 0 (0.0%) | 29 (24.4%) |
| 75 Years and over | 0 (0.0%) | 18 (39.1%) |
| Total | 171 (10.0%) | 197 (11.1%) |
Income Above Poverty by Sex and Age in Josephine
According to the poverty statistics in Josephine, males aged 35 to 44 years and females aged 5 years are the age groups that are most secure financially, with 100.0% of males and 100.0% of females in these age groups living above the poverty line.
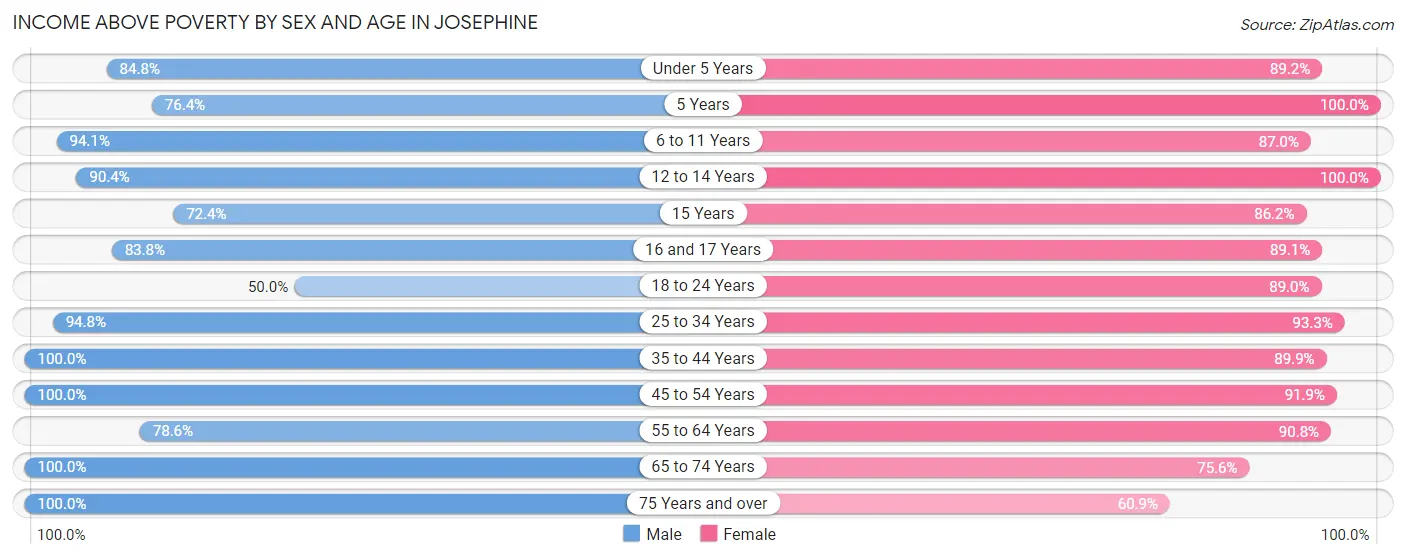
| Age Bracket | Male | Female |
| Under 5 Years | 89 (84.8%) | 115 (89.1%) |
| 5 Years | 42 (76.4%) | 9 (100.0%) |
| 6 to 11 Years | 190 (94.1%) | 188 (87.0%) |
| 12 to 14 Years | 47 (90.4%) | 68 (100.0%) |
| 15 Years | 21 (72.4%) | 25 (86.2%) |
| 16 and 17 Years | 57 (83.8%) | 41 (89.1%) |
| 18 to 24 Years | 42 (50.0%) | 194 (89.0%) |
| 25 to 34 Years | 272 (94.8%) | 252 (93.3%) |
| 35 to 44 Years | 241 (100.0%) | 152 (89.9%) |
| 45 to 54 Years | 188 (100.0%) | 237 (91.9%) |
| 55 to 64 Years | 180 (78.6%) | 187 (90.8%) |
| 65 to 74 Years | 130 (100.0%) | 90 (75.6%) |
| 75 Years and over | 44 (100.0%) | 28 (60.9%) |
| Total | 1,543 (90.0%) | 1,586 (88.9%) |
Income Below Poverty Among Married-Couple Families in Josephine
The poverty statistics for married-couple families in Josephine show that 3.3% or 26 of the total 781 families live below the poverty line. Families with 3 or 4 children have the highest poverty rate of 14.6%, comprising of 13 families. On the other hand, families with no children have the lowest poverty rate of 0.0%, which includes 0 families.
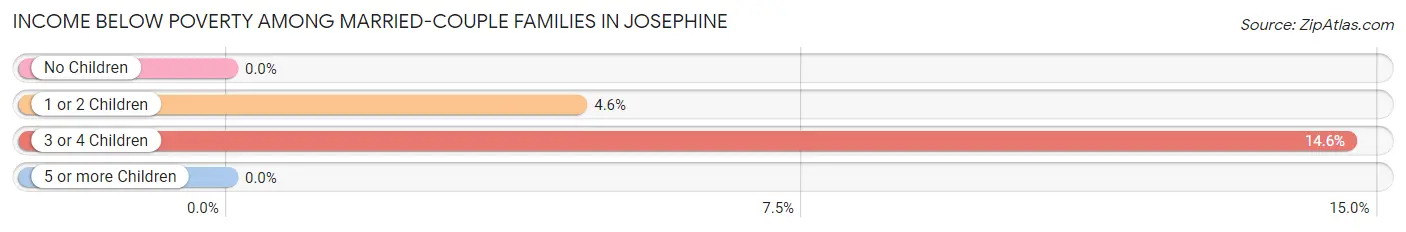
| Children | Above Poverty | Below Poverty |
| No Children | 375 (100.0%) | 0 (0.0%) |
| 1 or 2 Children | 272 (95.4%) | 13 (4.6%) |
| 3 or 4 Children | 76 (85.4%) | 13 (14.6%) |
| 5 or more Children | 32 (100.0%) | 0 (0.0%) |
| Total | 755 (96.7%) | 26 (3.3%) |
Income Below Poverty Among Single-Parent Households in Josephine
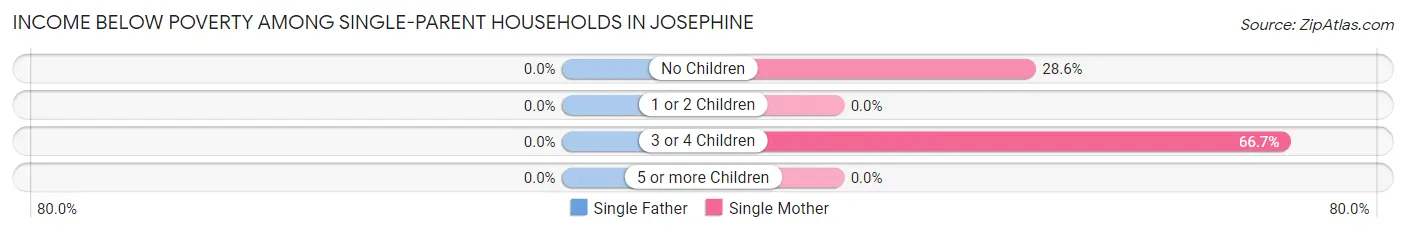
| Children | Single Father | Single Mother |
| No Children | 0 (0.0%) | 12 (28.6%) |
| 1 or 2 Children | 0 (0.0%) | 0 (0.0%) |
| 3 or 4 Children | 0 (0.0%) | 10 (66.7%) |
| 5 or more Children | 0 (0.0%) | 0 (0.0%) |
| Total | 0 (0.0%) | 22 (25.9%) |
Income Below Poverty Among Married-Couple vs Single-Parent Households in Josephine
The poverty data for Josephine shows that 26 of the married-couple family households (3.3%) and 22 of the single-parent households (15.4%) are living below the poverty level. Within the married-couple family households, those with 3 or 4 children have the highest poverty rate, with 13 households (14.6%) falling below the poverty line. Among the single-parent households, those with 3 or 4 children have the highest poverty rate, with 10 household (66.7%) living below poverty.
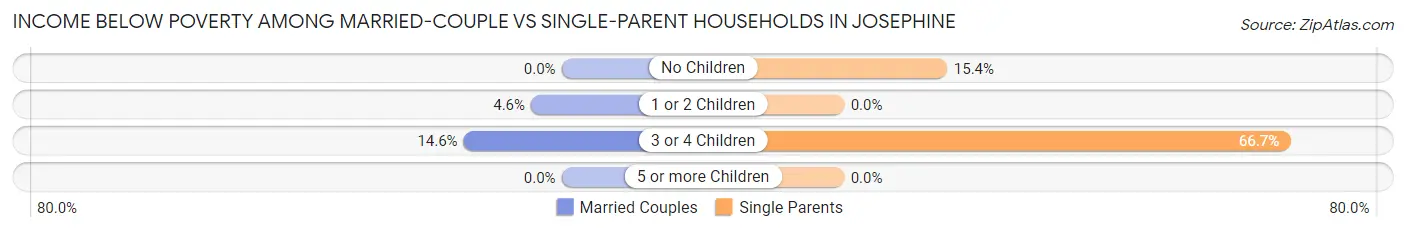
| Children | Married-Couple Families | Single-Parent Households |
| No Children | 0 (0.0%) | 12 (15.4%) |
| 1 or 2 Children | 13 (4.6%) | 0 (0.0%) |
| 3 or 4 Children | 13 (14.6%) | 10 (66.7%) |
| 5 or more Children | 0 (0.0%) | 0 (0.0%) |
| Total | 26 (3.3%) | 22 (15.4%) |
Race in Josephine
The most populous races in Josephine are White / Caucasian (2,647 | 75.7%), Hispanic or Latino (502 | 14.4%), and Some other Race (306 | 8.7%).
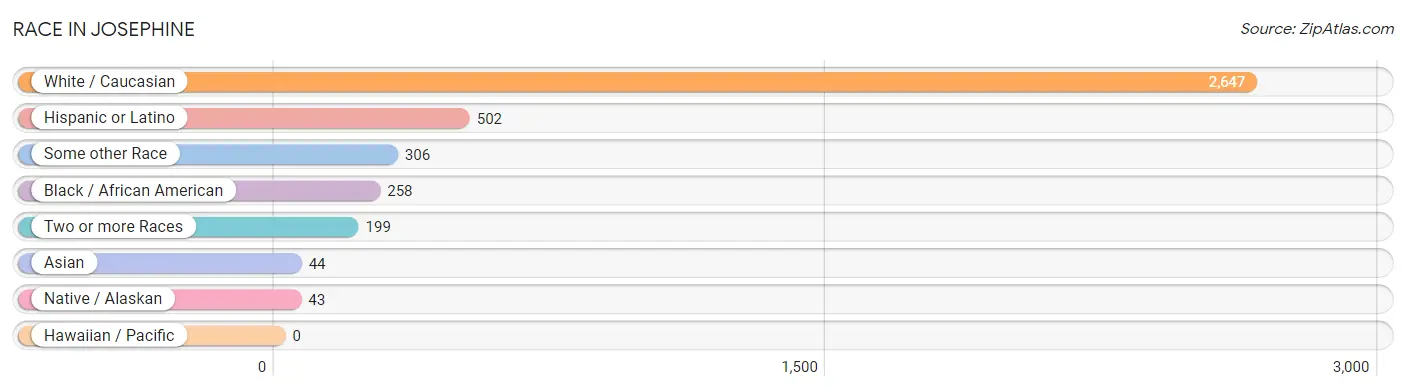
| Race | # Population | % Population |
| Asian | 44 | 1.3% |
| Black / African American | 258 | 7.4% |
| Hawaiian / Pacific | 0 | 0.0% |
| Hispanic or Latino | 502 | 14.4% |
| Native / Alaskan | 43 | 1.2% |
| White / Caucasian | 2,647 | 75.7% |
| Two or more Races | 199 | 5.7% |
| Some other Race | 306 | 8.7% |
| Total | 3,497 | 100.0% |
Ancestry in Josephine
The most populous ancestries reported in Josephine are American (505 | 14.4%), Mexican (432 | 12.3%), German (377 | 10.8%), English (352 | 10.1%), and Irish (344 | 9.8%), together accounting for 57.5% of all Josephine residents.
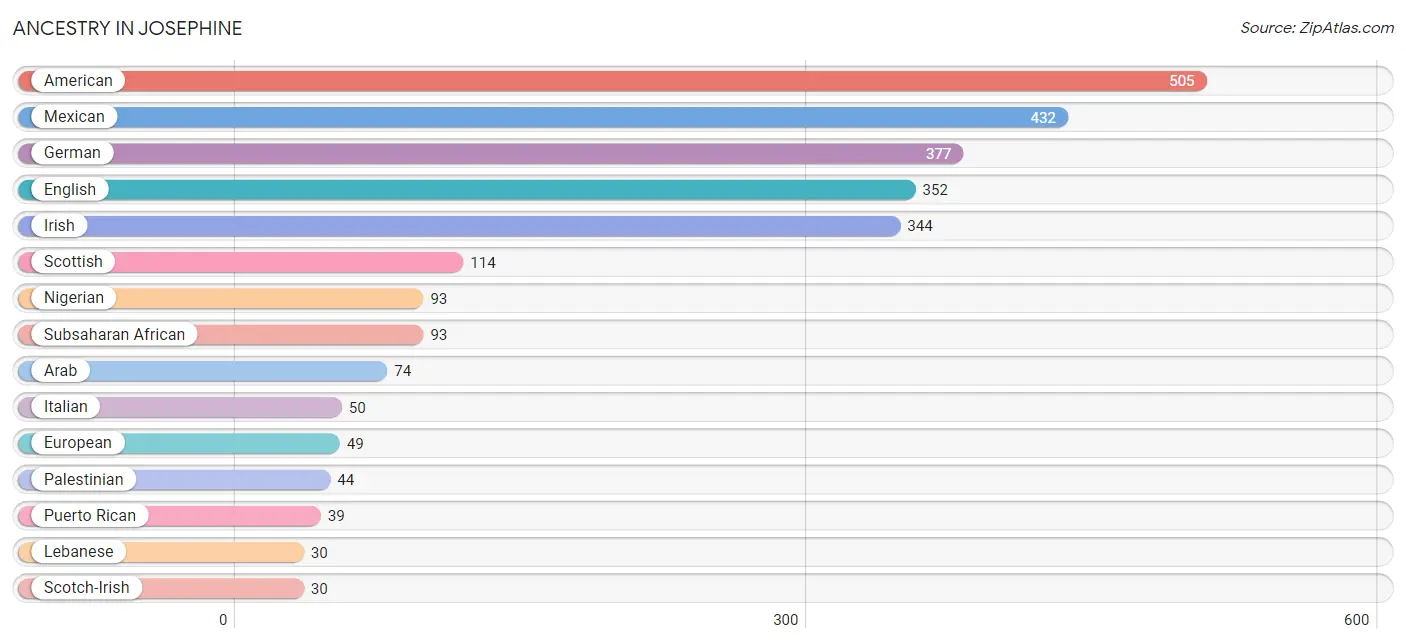
| Ancestry | # Population | % Population |
| American | 505 | 14.4% |
| Arab | 74 | 2.1% |
| British | 22 | 0.6% |
| Cherokee | 18 | 0.5% |
| Chinese | 5 | 0.1% |
| Croatian | 28 | 0.8% |
| Czech | 24 | 0.7% |
| Dutch | 5 | 0.1% |
| English | 352 | 10.1% |
| European | 49 | 1.4% |
| French | 12 | 0.3% |
| German | 377 | 10.8% |
| Irish | 344 | 9.8% |
| Italian | 50 | 1.4% |
| Korean | 27 | 0.8% |
| Lebanese | 30 | 0.9% |
| Mexican | 432 | 12.3% |
| Nigerian | 93 | 2.7% |
| Norwegian | 9 | 0.3% |
| Palestinian | 44 | 1.3% |
| Peruvian | 11 | 0.3% |
| Polish | 5 | 0.1% |
| Puerto Rican | 39 | 1.1% |
| Scotch-Irish | 30 | 0.9% |
| Scottish | 114 | 3.3% |
| Serbian | 28 | 0.8% |
| South American | 11 | 0.3% |
| Spaniard | 15 | 0.4% |
| Subsaharan African | 93 | 2.7% |
| Thai | 17 | 0.5% |
| Welsh | 18 | 0.5% | View All 31 Rows |
Immigrants in Josephine
The most numerous immigrant groups reported in Josephine came from Latin America (115 | 3.3%), Central America (102 | 2.9%), Mexico (102 | 2.9%), Africa (93 | 2.7%), and Nigeria (93 | 2.7%), together accounting for 14.5% of all Josephine residents.
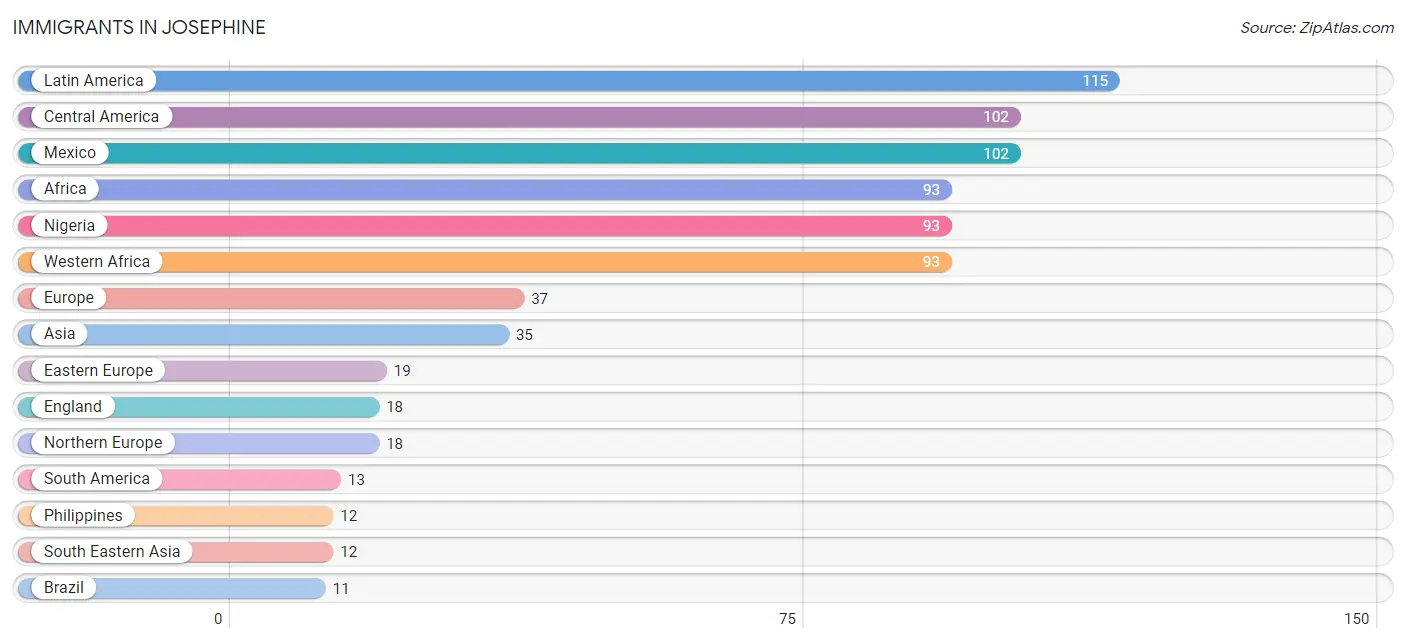
| Immigration Origin | # Population | % Population |
| Africa | 93 | 2.7% |
| Asia | 35 | 1.0% |
| Bosnia and Herzegovina | 7 | 0.2% |
| Brazil | 11 | 0.3% |
| Central America | 102 | 2.9% |
| Eastern Europe | 19 | 0.5% |
| England | 18 | 0.5% |
| Europe | 37 | 1.1% |
| India | 6 | 0.2% |
| Jordan | 8 | 0.2% |
| Latin America | 115 | 3.3% |
| Mexico | 102 | 2.9% |
| Nigeria | 93 | 2.7% |
| Northern Europe | 18 | 0.5% |
| Peru | 2 | 0.1% |
| Philippines | 12 | 0.3% |
| Poland | 5 | 0.1% |
| Serbia | 7 | 0.2% |
| South America | 13 | 0.4% |
| South Central Asia | 6 | 0.2% |
| South Eastern Asia | 12 | 0.3% |
| Western Africa | 93 | 2.7% |
| Western Asia | 8 | 0.2% | View All 23 Rows |
Sex and Age in Josephine
Sex and Age in Josephine
The most populous age groups in Josephine are 5 to 9 Years (213 | 12.4%) for men and 5 to 9 Years (210 | 11.8%) for women.
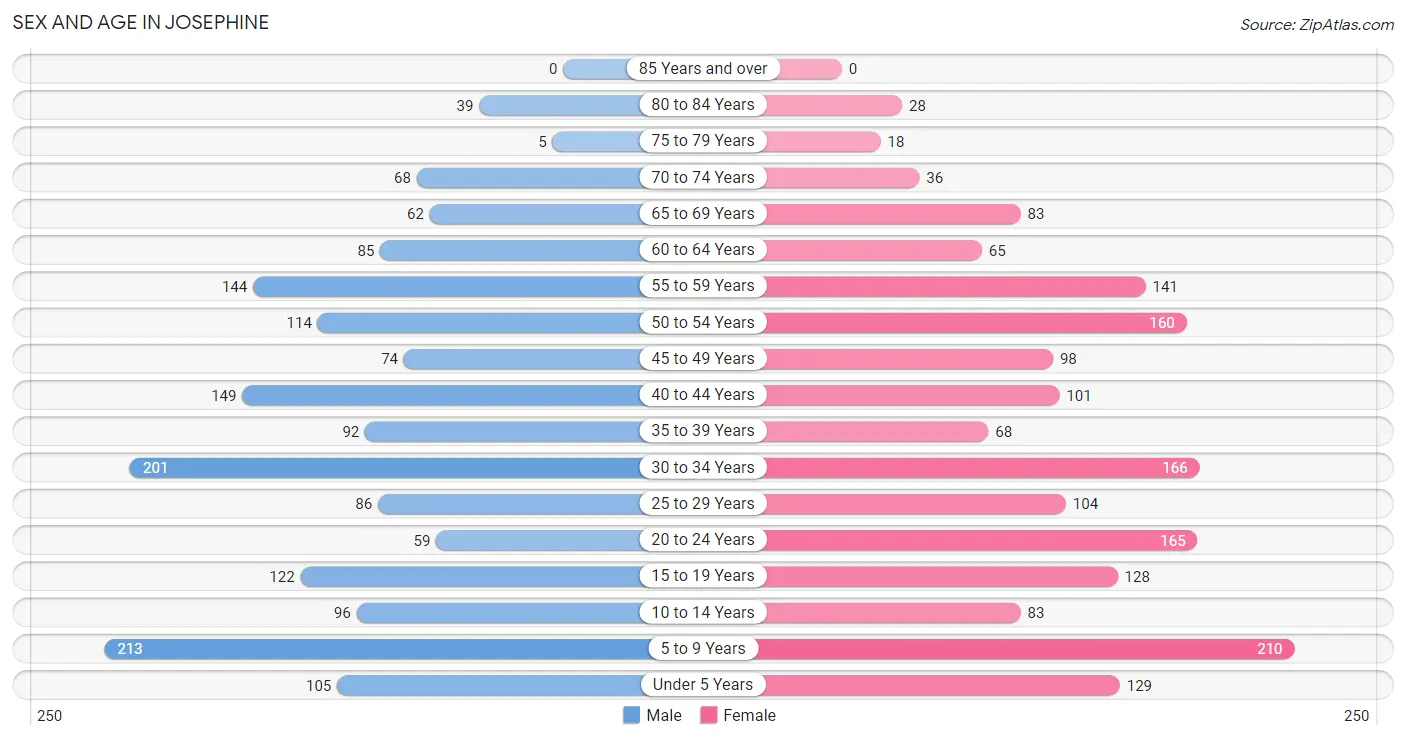
| Age Bracket | Male | Female |
| Under 5 Years | 105 (6.1%) | 129 (7.2%) |
| 5 to 9 Years | 213 (12.4%) | 210 (11.8%) |
| 10 to 14 Years | 96 (5.6%) | 83 (4.7%) |
| 15 to 19 Years | 122 (7.1%) | 128 (7.2%) |
| 20 to 24 Years | 59 (3.4%) | 165 (9.2%) |
| 25 to 29 Years | 86 (5.0%) | 104 (5.8%) |
| 30 to 34 Years | 201 (11.7%) | 166 (9.3%) |
| 35 to 39 Years | 92 (5.4%) | 68 (3.8%) |
| 40 to 44 Years | 149 (8.7%) | 101 (5.7%) |
| 45 to 49 Years | 74 (4.3%) | 98 (5.5%) |
| 50 to 54 Years | 114 (6.7%) | 160 (9.0%) |
| 55 to 59 Years | 144 (8.4%) | 141 (7.9%) |
| 60 to 64 Years | 85 (5.0%) | 65 (3.6%) |
| 65 to 69 Years | 62 (3.6%) | 83 (4.7%) |
| 70 to 74 Years | 68 (4.0%) | 36 (2.0%) |
| 75 to 79 Years | 5 (0.3%) | 18 (1.0%) |
| 80 to 84 Years | 39 (2.3%) | 28 (1.6%) |
| 85 Years and over | 0 (0.0%) | 0 (0.0%) |
| Total | 1,714 (100.0%) | 1,783 (100.0%) |
Families and Households in Josephine
Median Family Size in Josephine
The median family size in Josephine is 3.40 persons per family, with married-couple families (781 | 84.5%) accounting for the largest median family size of 3.44 persons per family. On the other hand, single female/mother families (85 | 9.2%) represent the smallest median family size with 3.16 persons per family.
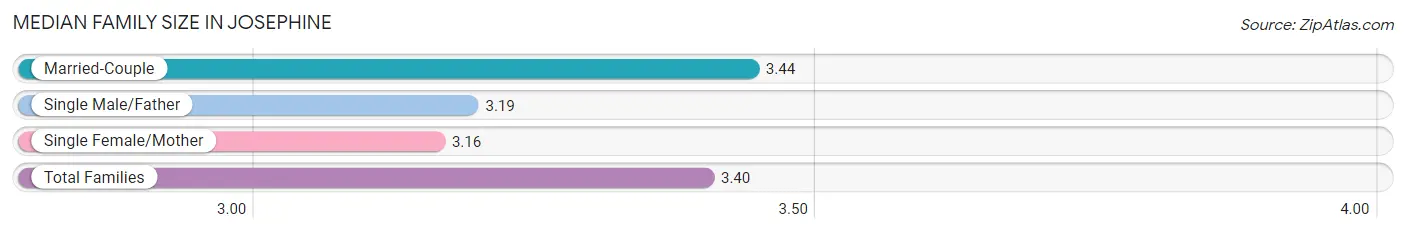
| Family Type | # Families | Family Size |
| Married-Couple | 781 (84.5%) | 3.44 |
| Single Male/Father | 58 (6.3%) | 3.19 |
| Single Female/Mother | 85 (9.2%) | 3.16 |
| Total Families | 924 (100.0%) | 3.40 |
Median Household Size in Josephine
The median household size in Josephine is 3.07 persons per household, with married-couple households (781 | 68.6%) accounting for the largest median household size of 3.44 persons per household. non-family households (214 | 18.8%) represent the smallest median household size with 1.55 persons per household.
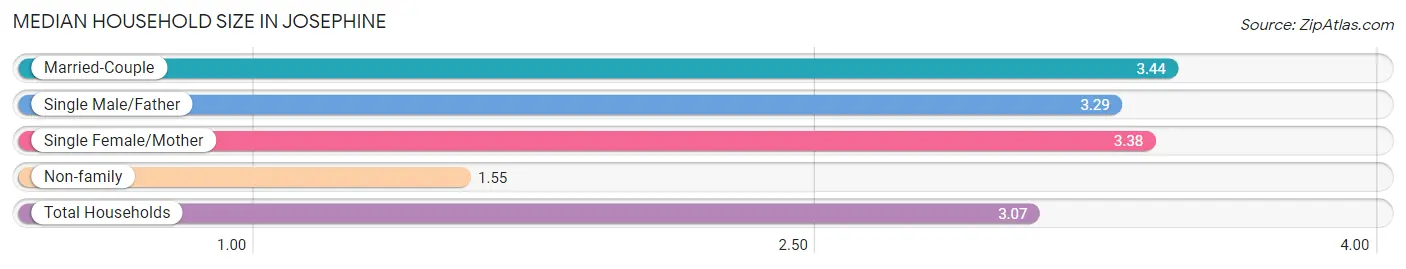
| Household Type | # Households | Household Size |
| Married-Couple | 781 (68.6%) | 3.44 |
| Single Male/Father | 58 (5.1%) | 3.29 |
| Single Female/Mother | 85 (7.5%) | 3.38 |
| Non-family | 214 (18.8%) | 1.55 |
| Total Households | 1,138 (100.0%) | 3.07 |
Household Size by Marriage Status in Josephine
Out of a total of 1,138 households in Josephine, 924 (81.2%) are family households, while 214 (18.8%) are nonfamily households. The most numerous type of family households are 2-person households, comprising 373, and the most common type of nonfamily households are 1-person households, comprising 131.
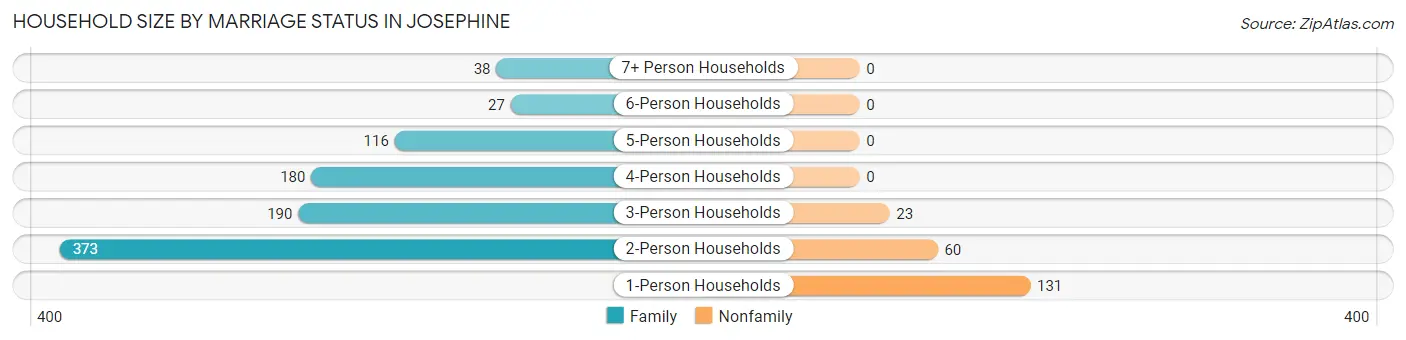
| Household Size | Family Households | Nonfamily Households |
| 1-Person Households | - | 131 (11.5%) |
| 2-Person Households | 373 (32.8%) | 60 (5.3%) |
| 3-Person Households | 190 (16.7%) | 23 (2.0%) |
| 4-Person Households | 180 (15.8%) | 0 (0.0%) |
| 5-Person Households | 116 (10.2%) | 0 (0.0%) |
| 6-Person Households | 27 (2.4%) | 0 (0.0%) |
| 7+ Person Households | 38 (3.3%) | 0 (0.0%) |
| Total | 924 (81.2%) | 214 (18.8%) |
Female Fertility in Josephine
Fertility by Age in Josephine
Average fertility rate in Josephine is 25.0 births per 1,000 women. Women in the age bracket of 20 to 34 years have the highest fertility rate with 48.0 births per 1,000 women. Women in the age bracket of 20 to 34 years acount for 100.0% of all women with births.
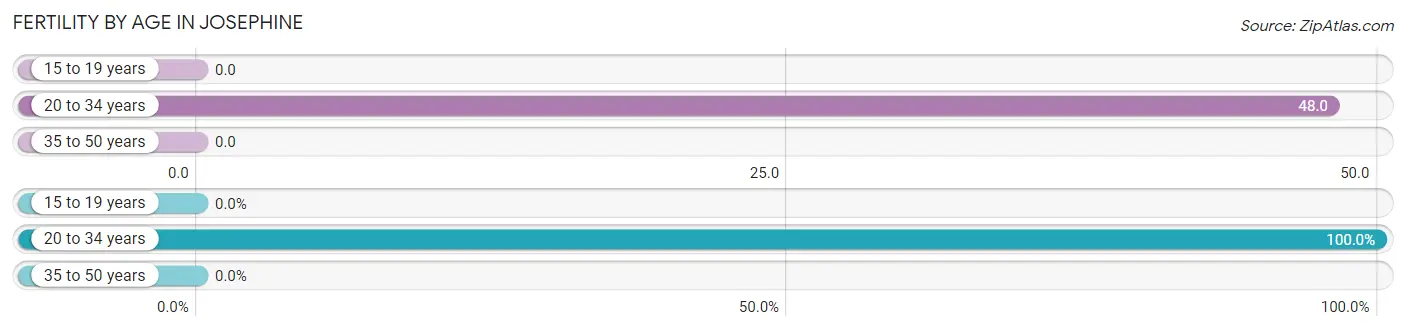
| Age Bracket | Women with Births | Births / 1,000 Women |
| 15 to 19 years | 0 (0.0%) | 0.0 |
| 20 to 34 years | 21 (100.0%) | 48.0 |
| 35 to 50 years | 0 (0.0%) | 0.0 |
| Total | 21 (100.0%) | 25.0 |
Fertility by Age by Marriage Status in Josephine
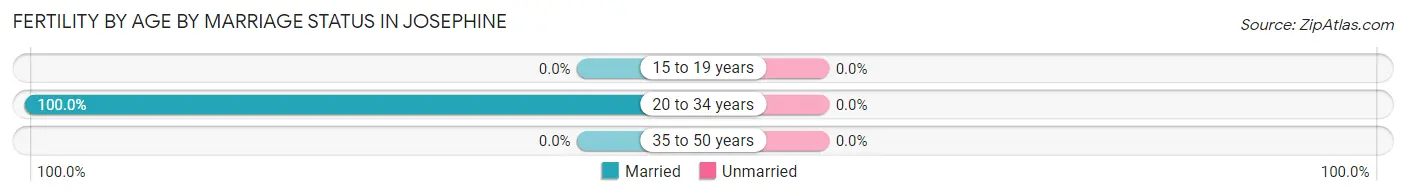
| Age Bracket | Married | Unmarried |
| 15 to 19 years | 0 (0.0%) | 0 (0.0%) |
| 20 to 34 years | 21 (100.0%) | 0 (0.0%) |
| 35 to 50 years | 0 (0.0%) | 0 (0.0%) |
| Total | 21 (100.0%) | 0 (0.0%) |
Fertility by Education in Josephine
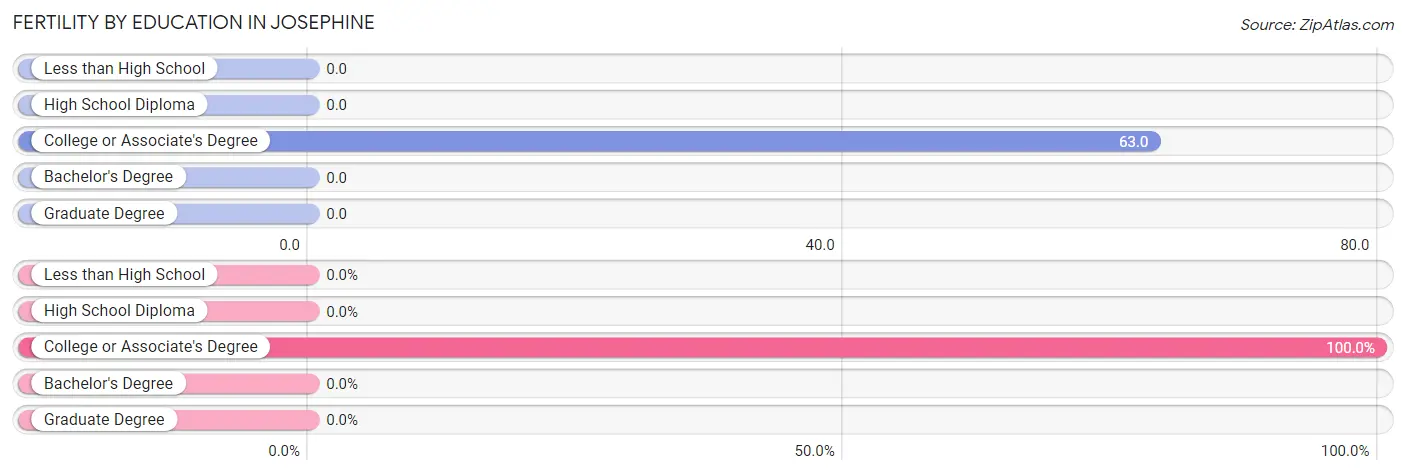
| Educational Attainment | Women with Births | Births / 1,000 Women |
| Less than High School | 0 (0.0%) | 0.0 |
| High School Diploma | 0 (0.0%) | 0.0 |
| College or Associate's Degree | 21 (100.0%) | 63.0 |
| Bachelor's Degree | 0 (0.0%) | 0.0 |
| Graduate Degree | 0 (0.0%) | 0.0 |
| Total | 21 (100.0%) | 25.0 |
Fertility by Education by Marriage Status in Josephine
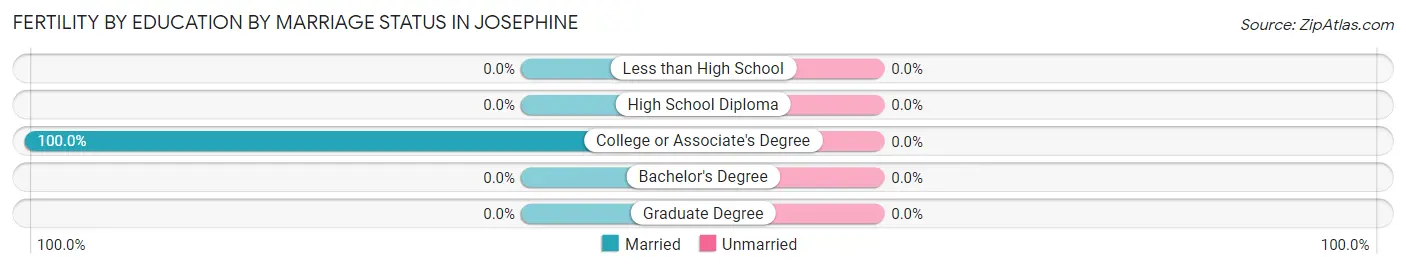
| Educational Attainment | Married | Unmarried |
| Less than High School | 0 (0.0%) | 0 (0.0%) |
| High School Diploma | 0 (0.0%) | 0 (0.0%) |
| College or Associate's Degree | 21 (100.0%) | 0 (0.0%) |
| Bachelor's Degree | 0 (0.0%) | 0 (0.0%) |
| Graduate Degree | 0 (0.0%) | 0 (0.0%) |
| Total | 21 (100.0%) | 0 (0.0%) |
Employment Characteristics in Josephine
Employment by Class of Employer in Josephine
Among the 1,729 employed individuals in Josephine, private company employees (1,115 | 64.5%), local government employees (253 | 14.6%), and self-employed (not incorporated) (130 | 7.5%) make up the most common classes of employment.
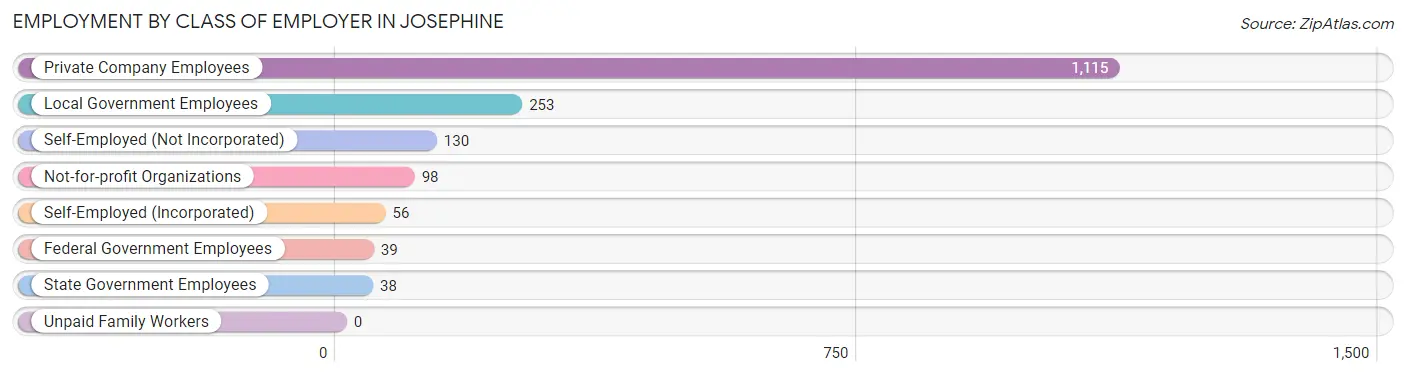
| Employer Class | # Employees | % Employees |
| Private Company Employees | 1,115 | 64.5% |
| Self-Employed (Incorporated) | 56 | 3.2% |
| Self-Employed (Not Incorporated) | 130 | 7.5% |
| Not-for-profit Organizations | 98 | 5.7% |
| Local Government Employees | 253 | 14.6% |
| State Government Employees | 38 | 2.2% |
| Federal Government Employees | 39 | 2.3% |
| Unpaid Family Workers | 0 | 0.0% |
| Total | 1,729 | 100.0% |
Employment Status by Age in Josephine
According to the labor force statistics for Josephine, out of the total population over 16 years of age (2,603), 69.4% or 1,806 individuals are in the labor force, with 4.0% or 72 of them unemployed. The age group with the highest labor force participation rate is 35 to 44 years, with 98.3% or 403 individuals in the labor force. Within the labor force, the 16 to 19 years age range has the highest percentage of unemployed individuals, with 61.4% or 51 of them being unemployed.
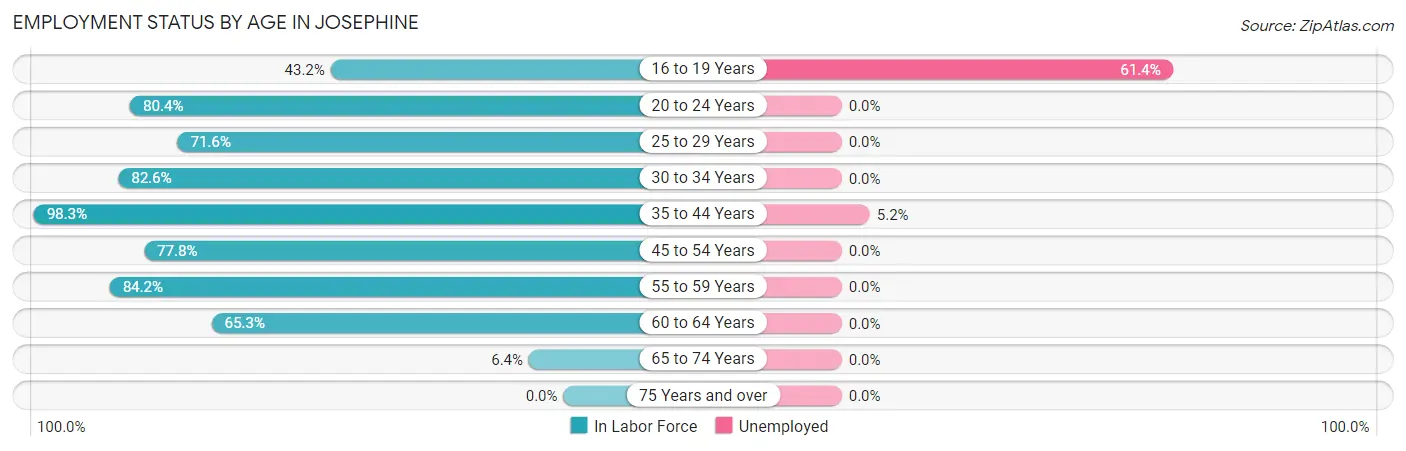
| Age Bracket | In Labor Force | Unemployed |
| 16 to 19 Years | 83 (43.2%) | 51 (61.4%) |
| 20 to 24 Years | 180 (80.4%) | 0 (0.0%) |
| 25 to 29 Years | 136 (71.6%) | 0 (0.0%) |
| 30 to 34 Years | 303 (82.6%) | 0 (0.0%) |
| 35 to 44 Years | 403 (98.3%) | 21 (5.2%) |
| 45 to 54 Years | 347 (77.8%) | 0 (0.0%) |
| 55 to 59 Years | 240 (84.2%) | 0 (0.0%) |
| 60 to 64 Years | 98 (65.3%) | 0 (0.0%) |
| 65 to 74 Years | 16 (6.4%) | 0 (0.0%) |
| 75 Years and over | 0 (0.0%) | 0 (0.0%) |
| Total | 1,806 (69.4%) | 72 (4.0%) |
Employment Status by Educational Attainment in Josephine
According to labor force statistics for Josephine, 82.6% of individuals (1,526) out of the total population between 25 and 64 years of age (1,848) are in the labor force, with 1.4% or 21 of them being unemployed. The group with the highest labor force participation rate are those with the educational attainment of bachelor's degree or higher, with 98.5% or 324 individuals in the labor force. Within the labor force, individuals with high school diploma education have the highest percentage of unemployment, with 3.6% or 21 of them being unemployed.
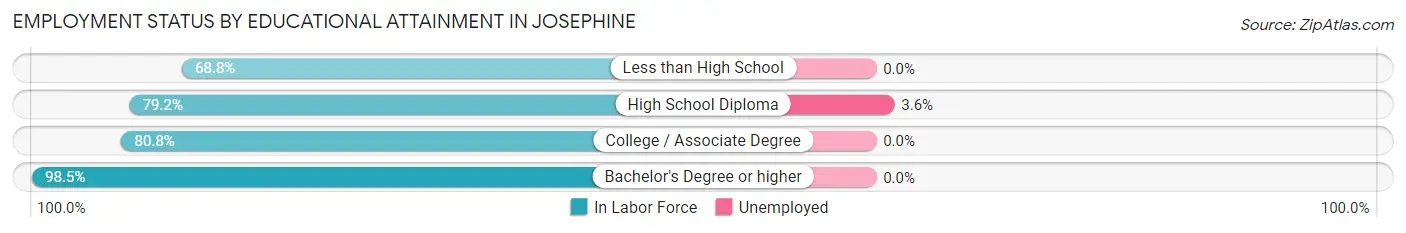
| Educational Attainment | In Labor Force | Unemployed |
| Less than High School | 75 (68.8%) | 0 (0.0%) |
| High School Diploma | 584 (79.2%) | 27 (3.6%) |
| College / Associate Degree | 544 (80.8%) | 0 (0.0%) |
| Bachelor's Degree or higher | 324 (98.5%) | 0 (0.0%) |
| Total | 1,526 (82.6%) | 26 (1.4%) |
Employment Occupations by Sex in Josephine
Management, Business, Science and Arts Occupations
The most common Management, Business, Science and Arts occupations in Josephine are Management (191 | 11.0%), Health Diagnosing & Treating (173 | 10.0%), Community & Social Service (145 | 8.4%), Computers, Engineering & Science (125 | 7.2%), and Health Technologists (100 | 5.8%).
Management, Business, Science and Arts Occupations by Sex
Within the Management, Business, Science and Arts occupations in Josephine, the most male-oriented occupations are Architecture & Engineering (100.0%), Computers, Engineering & Science (86.4%), and Computers & Mathematics (78.2%), while the most female-oriented occupations are Legal Services & Support (100.0%), Education Instruction & Library (100.0%), and Community & Social Service (86.2%).
| Occupation | Male | Female |
| Management | 116 (60.7%) | 75 (39.3%) |
| Business & Financial | 40 (44.0%) | 51 (56.0%) |
| Computers, Engineering & Science | 108 (86.4%) | 17 (13.6%) |
| Computers & Mathematics | 61 (78.2%) | 17 (21.8%) |
| Architecture & Engineering | 47 (100.0%) | 0 (0.0%) |
| Life, Physical & Social Science | 0 (0.0%) | 0 (0.0%) |
| Community & Social Service | 20 (13.8%) | 125 (86.2%) |
| Education, Arts & Media | 13 (26.0%) | 37 (74.0%) |
| Legal Services & Support | 0 (0.0%) | 18 (100.0%) |
| Education Instruction & Library | 0 (0.0%) | 33 (100.0%) |
| Arts, Media & Entertainment | 7 (15.9%) | 37 (84.1%) |
| Health Diagnosing & Treating | 36 (20.8%) | 137 (79.2%) |
| Health Technologists | 36 (36.0%) | 64 (64.0%) |
| Total (Category) | 320 (44.1%) | 405 (55.9%) |
| Total (Overall) | 931 (53.7%) | 803 (46.3%) |
Services Occupations
The most common Services occupations in Josephine are Healthcare Support (119 | 6.9%), Security & Protection (95 | 5.5%), Law Enforcement (61 | 3.5%), Food Preparation & Serving (52 | 3.0%), and Cleaning & Maintenance (38 | 2.2%).
Services Occupations by Sex
Within the Services occupations in Josephine, the most male-oriented occupations are Firefighting & Prevention (100.0%), Security & Protection (66.3%), and Law Enforcement (47.5%), while the most female-oriented occupations are Cleaning & Maintenance (68.4%), Food Preparation & Serving (55.8%), and Healthcare Support (54.6%).
| Occupation | Male | Female |
| Healthcare Support | 54 (45.4%) | 65 (54.6%) |
| Security & Protection | 63 (66.3%) | 32 (33.7%) |
| Firefighting & Prevention | 34 (100.0%) | 0 (0.0%) |
| Law Enforcement | 29 (47.5%) | 32 (52.5%) |
| Food Preparation & Serving | 23 (44.2%) | 29 (55.8%) |
| Cleaning & Maintenance | 12 (31.6%) | 26 (68.4%) |
| Personal Care & Service | 0 (0.0%) | 0 (0.0%) |
| Total (Category) | 152 (50.0%) | 152 (50.0%) |
| Total (Overall) | 931 (53.7%) | 803 (46.3%) |
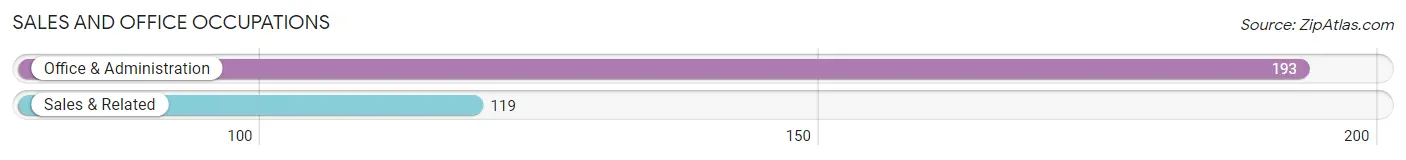
Sales and Office Occupations
The most common Sales and Office occupations in Josephine are Office & Administration (193 | 11.1%), and Sales & Related (119 | 6.9%).
Sales and Office Occupations by Sex
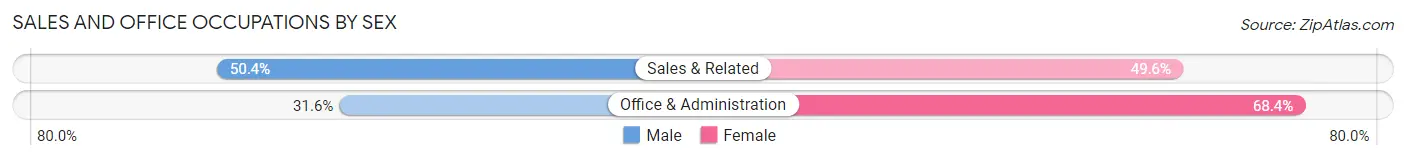
| Occupation | Male | Female |
| Sales & Related | 60 (50.4%) | 59 (49.6%) |
| Office & Administration | 61 (31.6%) | 132 (68.4%) |
| Total (Category) | 121 (38.8%) | 191 (61.2%) |
| Total (Overall) | 931 (53.7%) | 803 (46.3%) |
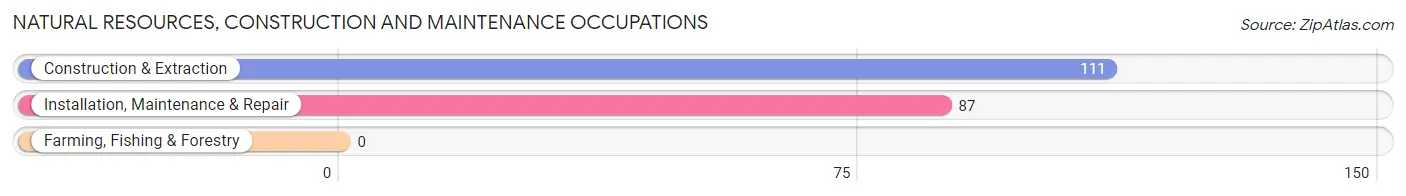
Natural Resources, Construction and Maintenance Occupations
The most common Natural Resources, Construction and Maintenance occupations in Josephine are Construction & Extraction (111 | 6.4%), and Installation, Maintenance & Repair (87 | 5.0%).
Natural Resources, Construction and Maintenance Occupations by Sex
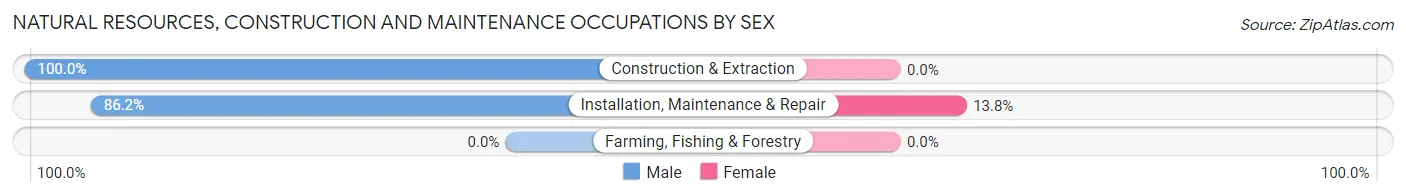
| Occupation | Male | Female |
| Farming, Fishing & Forestry | 0 (0.0%) | 0 (0.0%) |
| Construction & Extraction | 111 (100.0%) | 0 (0.0%) |
| Installation, Maintenance & Repair | 75 (86.2%) | 12 (13.8%) |
| Total (Category) | 186 (93.9%) | 12 (6.1%) |
| Total (Overall) | 931 (53.7%) | 803 (46.3%) |
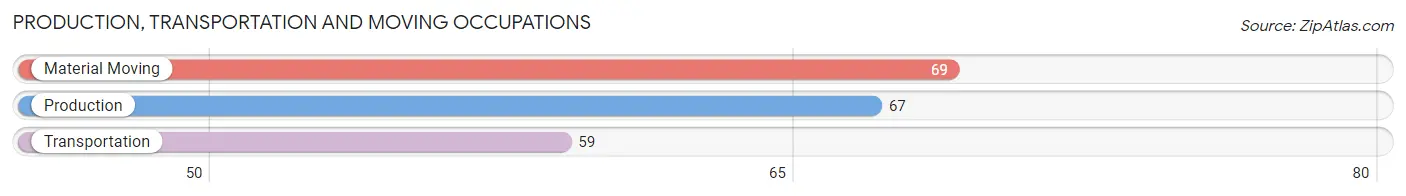
Production, Transportation and Moving Occupations
The most common Production, Transportation and Moving occupations in Josephine are Material Moving (69 | 4.0%), Production (67 | 3.9%), and Transportation (59 | 3.4%).
Production, Transportation and Moving Occupations by Sex
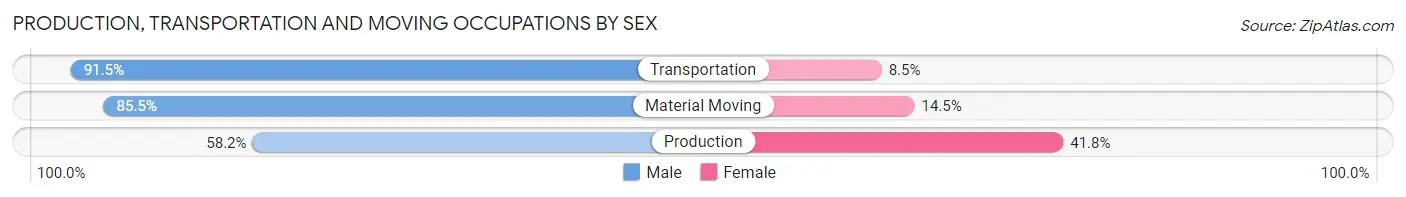
| Occupation | Male | Female |
| Production | 39 (58.2%) | 28 (41.8%) |
| Transportation | 54 (91.5%) | 5 (8.5%) |
| Material Moving | 59 (85.5%) | 10 (14.5%) |
| Total (Category) | 152 (77.9%) | 43 (22.1%) |
| Total (Overall) | 931 (53.7%) | 803 (46.3%) |
Employment Industries by Sex in Josephine
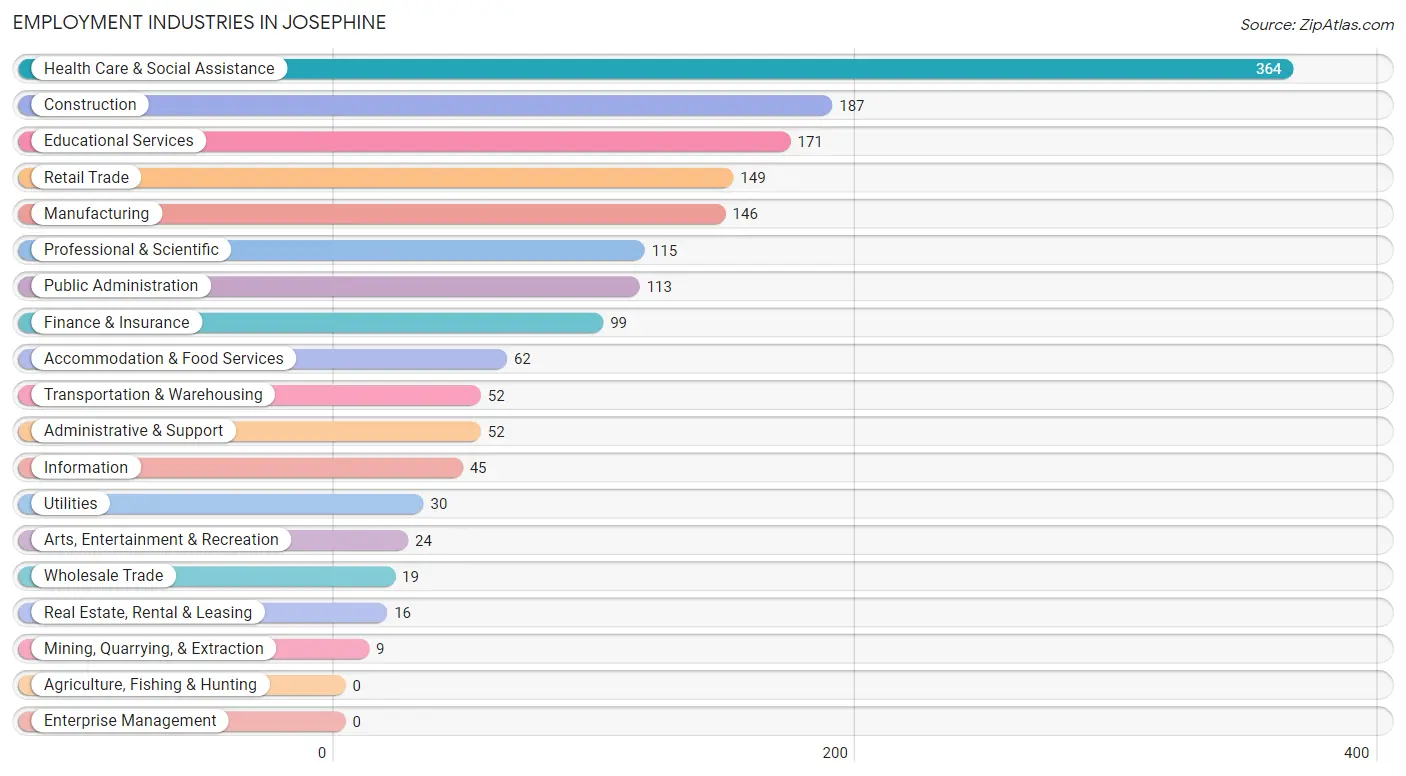
Employment Industries in Josephine
The major employment industries in Josephine include Health Care & Social Assistance (364 | 21.0%), Construction (187 | 10.8%), Educational Services (171 | 9.9%), Retail Trade (149 | 8.6%), and Manufacturing (146 | 8.4%).
Employment Industries by Sex in Josephine
The Josephine industries that see more men than women are Mining, Quarrying, & Extraction (100.0%), Construction (100.0%), and Transportation & Warehousing (90.4%), whereas the industries that tend to have a higher number of women are Arts, Entertainment & Recreation (100.0%), Finance & Insurance (80.8%), and Health Care & Social Assistance (70.6%).
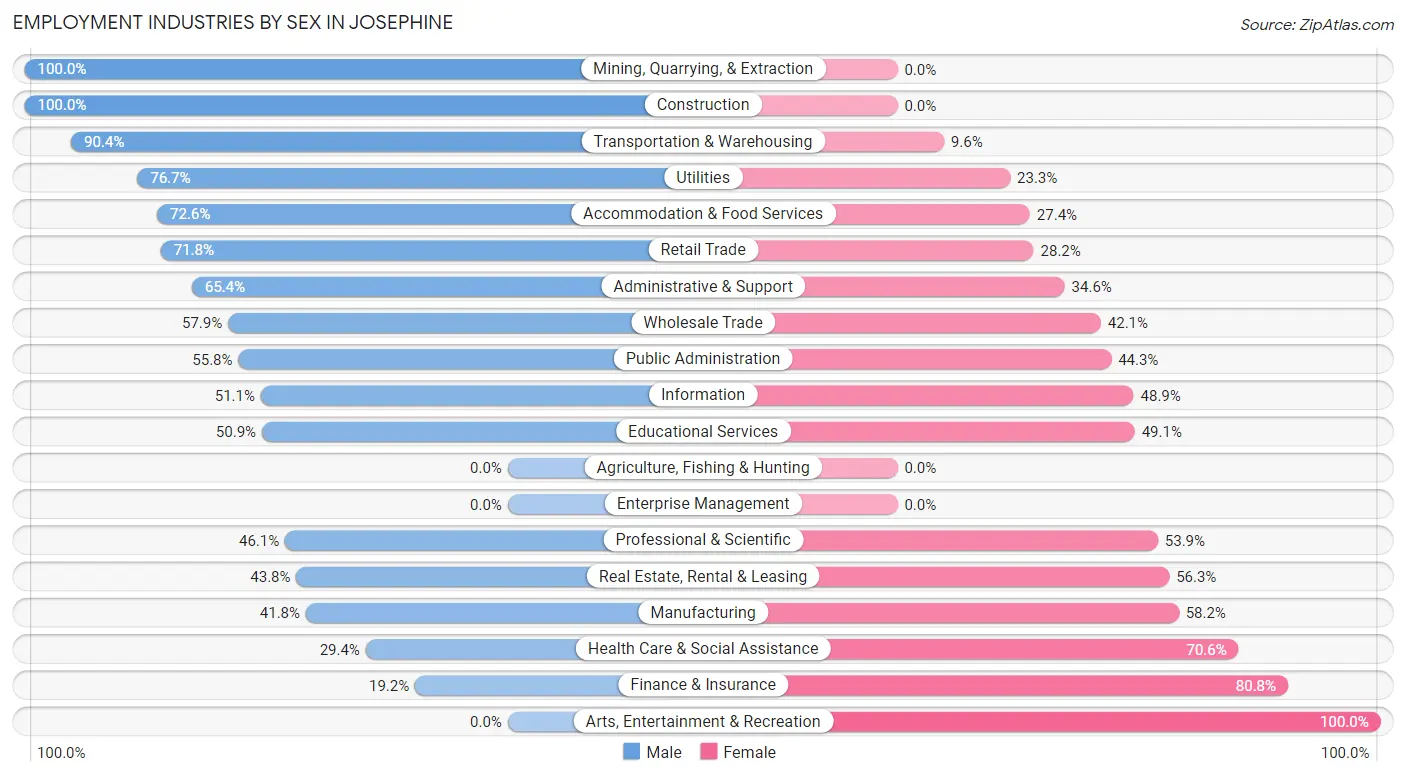
| Industry | Male | Female |
| Agriculture, Fishing & Hunting | 0 (0.0%) | 0 (0.0%) |
| Mining, Quarrying, & Extraction | 9 (100.0%) | 0 (0.0%) |
| Construction | 187 (100.0%) | 0 (0.0%) |
| Manufacturing | 61 (41.8%) | 85 (58.2%) |
| Wholesale Trade | 11 (57.9%) | 8 (42.1%) |
| Retail Trade | 107 (71.8%) | 42 (28.2%) |
| Transportation & Warehousing | 47 (90.4%) | 5 (9.6%) |
| Utilities | 23 (76.7%) | 7 (23.3%) |
| Information | 23 (51.1%) | 22 (48.9%) |
| Finance & Insurance | 19 (19.2%) | 80 (80.8%) |
| Real Estate, Rental & Leasing | 7 (43.8%) | 9 (56.2%) |
| Professional & Scientific | 53 (46.1%) | 62 (53.9%) |
| Enterprise Management | 0 (0.0%) | 0 (0.0%) |
| Administrative & Support | 34 (65.4%) | 18 (34.6%) |
| Educational Services | 87 (50.9%) | 84 (49.1%) |
| Health Care & Social Assistance | 107 (29.4%) | 257 (70.6%) |
| Arts, Entertainment & Recreation | 0 (0.0%) | 24 (100.0%) |
| Accommodation & Food Services | 45 (72.6%) | 17 (27.4%) |
| Public Administration | 63 (55.7%) | 50 (44.3%) |
| Total | 931 (53.7%) | 803 (46.3%) |
Education in Josephine
School Enrollment in Josephine
The most common levels of schooling among the 1,005 students in Josephine are elementary school (302 | 30.0%), high school (217 | 21.6%), and college / undergraduate (171 | 17.0%).
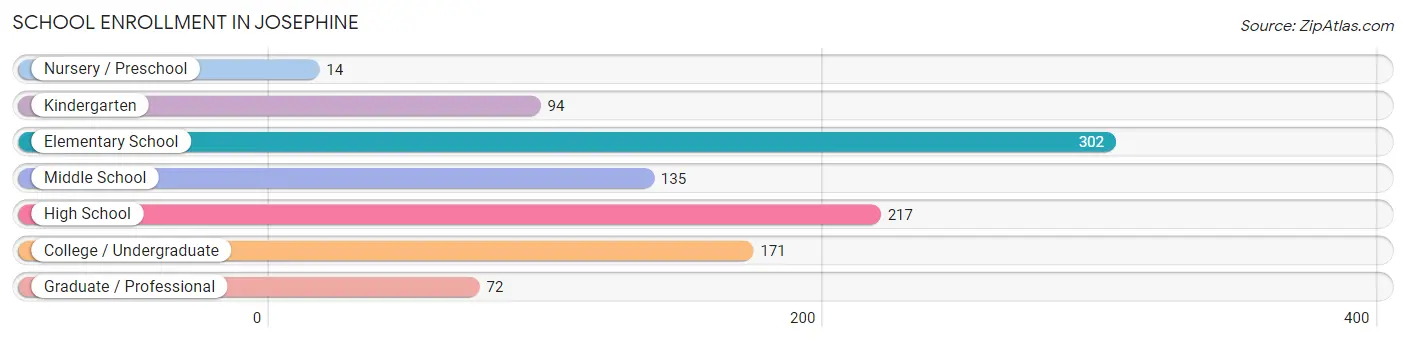
| School Level | # Students | % Students |
| Nursery / Preschool | 14 | 1.4% |
| Kindergarten | 94 | 9.3% |
| Elementary School | 302 | 30.0% |
| Middle School | 135 | 13.4% |
| High School | 217 | 21.6% |
| College / Undergraduate | 171 | 17.0% |
| Graduate / Professional | 72 | 7.2% |
| Total | 1,005 | 100.0% |
School Enrollment by Age by Funding Source in Josephine
Out of a total of 1,005 students who are enrolled in schools in Josephine, 30 (3.0%) attend a private institution, while the remaining 975 (97.0%) are enrolled in public schools. The age group of 3 to 4 year olds has the highest likelihood of being enrolled in private schools, with 6 (100.0% in the age bracket) enrolled. Conversely, the age group of 10 to 14 year olds has the lowest likelihood of being enrolled in a private school, with 164 (100.0% in the age bracket) attending a public institution.
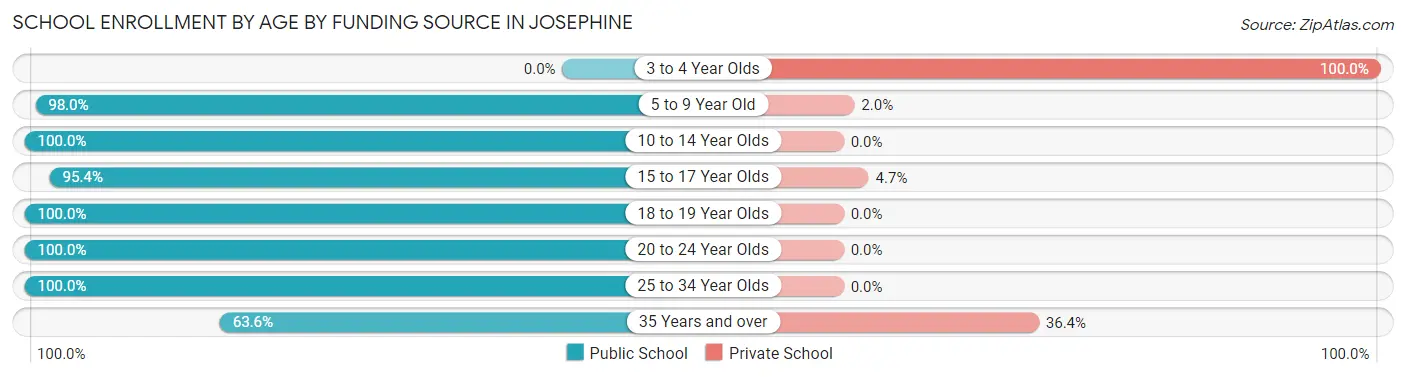
| Age Bracket | Public School | Private School |
| 3 to 4 Year Olds | 0 (0.0%) | 6 (100.0%) |
| 5 to 9 Year Old | 393 (98.0%) | 8 (2.0%) |
| 10 to 14 Year Olds | 164 (100.0%) | 0 (0.0%) |
| 15 to 17 Year Olds | 164 (95.4%) | 8 (4.6%) |
| 18 to 19 Year Olds | 53 (100.0%) | 0 (0.0%) |
| 20 to 24 Year Olds | 88 (100.0%) | 0 (0.0%) |
| 25 to 34 Year Olds | 99 (100.0%) | 0 (0.0%) |
| 35 Years and over | 14 (63.6%) | 8 (36.4%) |
| Total | 975 (97.0%) | 30 (3.0%) |
Educational Attainment by Field of Study in Josephine
Business (78 | 20.5%), science & technology (65 | 17.1%), psychology (60 | 15.8%), computers & mathematics (53 | 13.9%), and education (49 | 12.9%) are the most common fields of study among 381 individuals in Josephine who have obtained a bachelor's degree or higher.
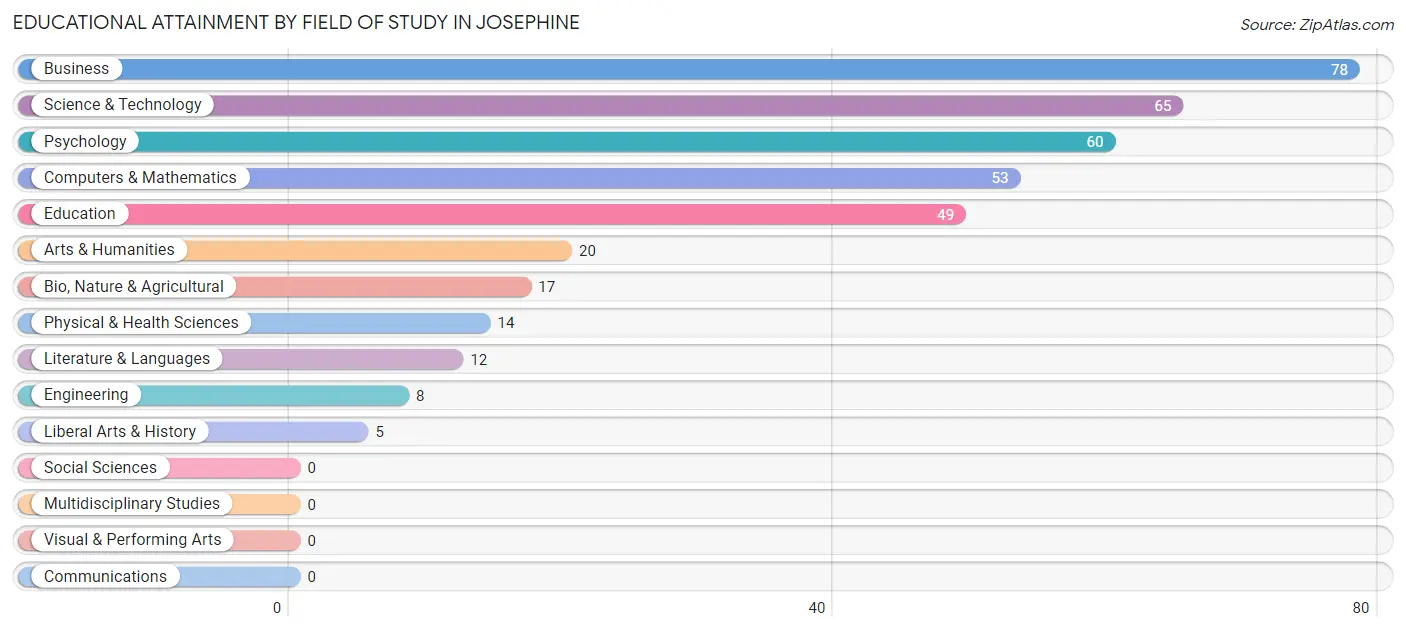
| Field of Study | # Graduates | % Graduates |
| Computers & Mathematics | 53 | 13.9% |
| Bio, Nature & Agricultural | 17 | 4.5% |
| Physical & Health Sciences | 14 | 3.7% |
| Psychology | 60 | 15.8% |
| Social Sciences | 0 | 0.0% |
| Engineering | 8 | 2.1% |
| Multidisciplinary Studies | 0 | 0.0% |
| Science & Technology | 65 | 17.1% |
| Business | 78 | 20.5% |
| Education | 49 | 12.9% |
| Literature & Languages | 12 | 3.2% |
| Liberal Arts & History | 5 | 1.3% |
| Visual & Performing Arts | 0 | 0.0% |
| Communications | 0 | 0.0% |
| Arts & Humanities | 20 | 5.2% |
| Total | 381 | 100.0% |
Transportation & Commute in Josephine
Vehicle Availability by Sex in Josephine
The most prevalent vehicle ownership categories in Josephine are males with 2 vehicles (485, accounting for 52.1%) and females with 2 vehicles (339, making up 60.8%).
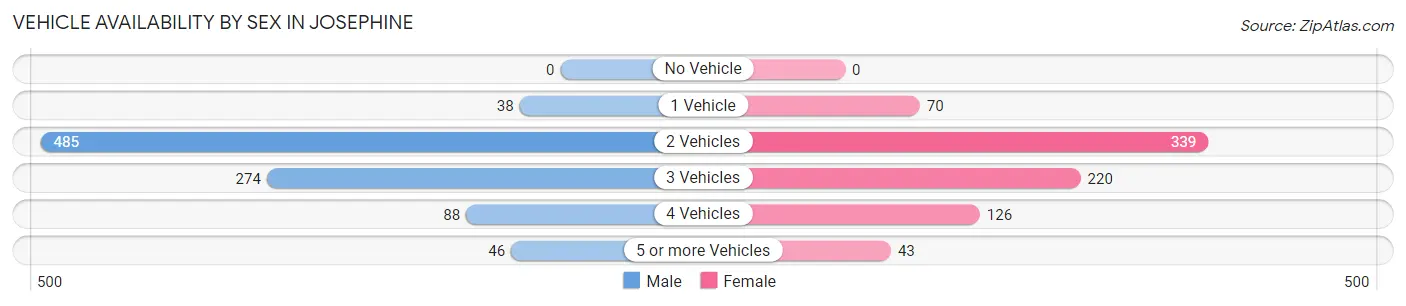
| Vehicles Available | Male | Female |
| No Vehicle | 0 (0.0%) | 0 (0.0%) |
| 1 Vehicle | 38 (4.1%) | 70 (8.8%) |
| 2 Vehicles | 485 (52.1%) | 339 (42.5%) |
| 3 Vehicles | 274 (29.4%) | 220 (27.6%) |
| 4 Vehicles | 88 (9.5%) | 126 (15.8%) |
| 5 or more Vehicles | 46 (4.9%) | 43 (5.4%) |
| Total | 931 (100.0%) | 798 (100.0%) |
Commute Time in Josephine
The most frequently occuring commute durations in Josephine are 45 to 59 minutes (358 commuters, 24.4%), 60 to 89 minutes (308 commuters, 21.0%), and 30 to 34 minutes (163 commuters, 11.1%).
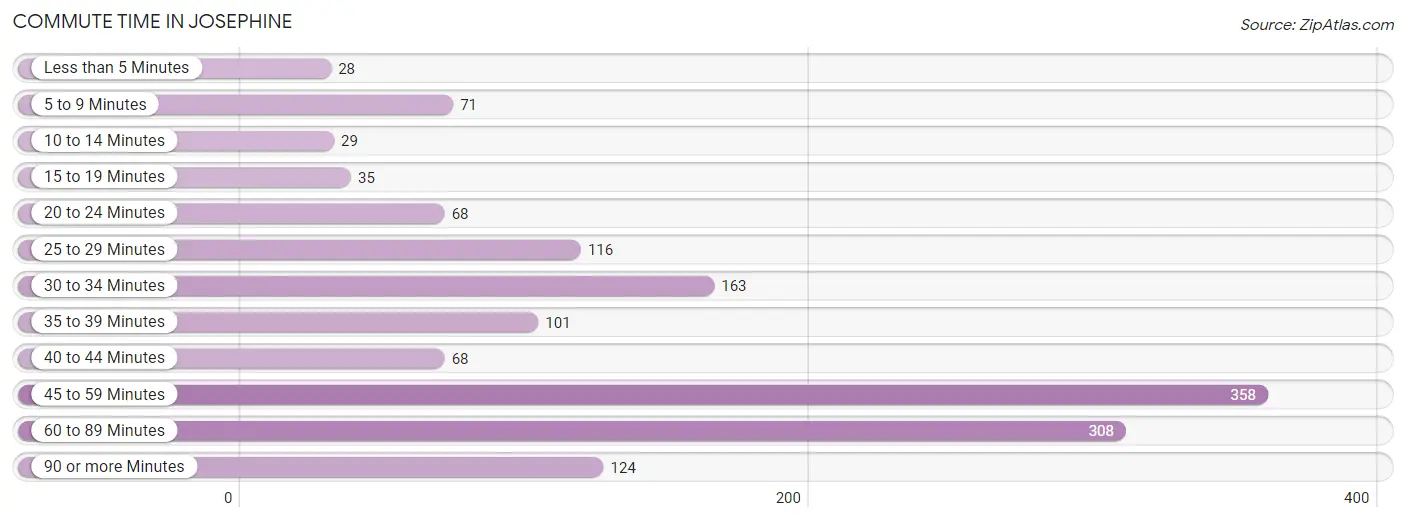
| Commute Time | # Commuters | % Commuters |
| Less than 5 Minutes | 28 | 1.9% |
| 5 to 9 Minutes | 71 | 4.8% |
| 10 to 14 Minutes | 29 | 2.0% |
| 15 to 19 Minutes | 35 | 2.4% |
| 20 to 24 Minutes | 68 | 4.6% |
| 25 to 29 Minutes | 116 | 7.9% |
| 30 to 34 Minutes | 163 | 11.1% |
| 35 to 39 Minutes | 101 | 6.9% |
| 40 to 44 Minutes | 68 | 4.6% |
| 45 to 59 Minutes | 358 | 24.4% |
| 60 to 89 Minutes | 308 | 21.0% |
| 90 or more Minutes | 124 | 8.4% |
Commute Time by Sex in Josephine
The most common commute times in Josephine are 60 to 89 minutes (230 commuters, 27.6%) for males and 45 to 59 minutes (182 commuters, 28.7%) for females.
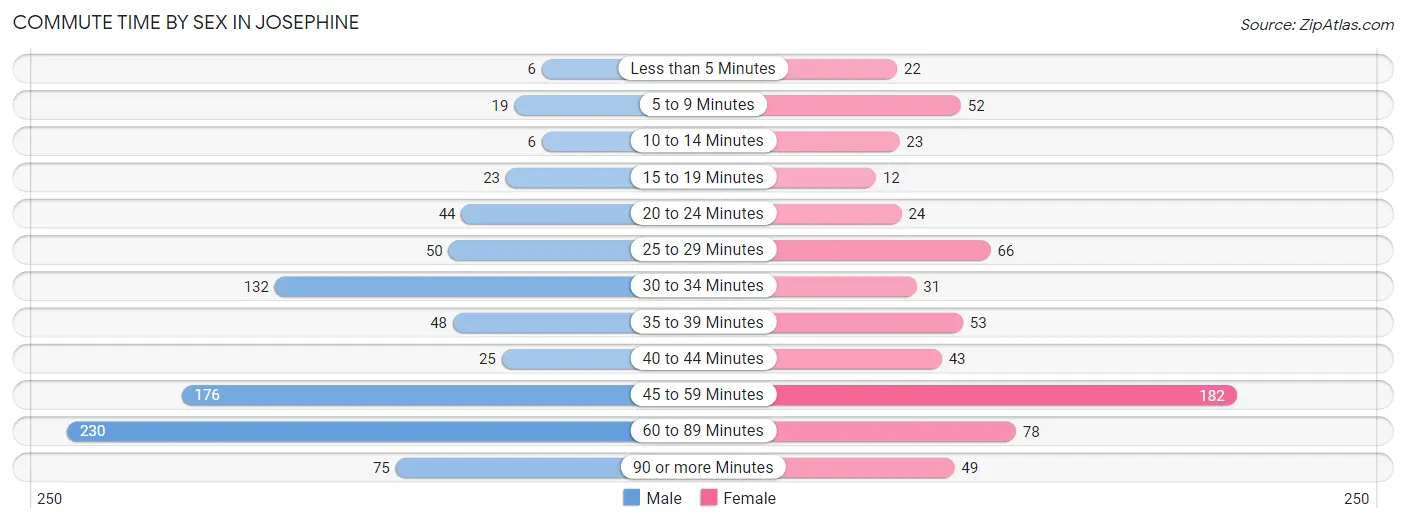
| Commute Time | Male | Female |
| Less than 5 Minutes | 6 (0.7%) | 22 (3.5%) |
| 5 to 9 Minutes | 19 (2.3%) | 52 (8.2%) |
| 10 to 14 Minutes | 6 (0.7%) | 23 (3.6%) |
| 15 to 19 Minutes | 23 (2.8%) | 12 (1.9%) |
| 20 to 24 Minutes | 44 (5.3%) | 24 (3.8%) |
| 25 to 29 Minutes | 50 (6.0%) | 66 (10.4%) |
| 30 to 34 Minutes | 132 (15.8%) | 31 (4.9%) |
| 35 to 39 Minutes | 48 (5.8%) | 53 (8.4%) |
| 40 to 44 Minutes | 25 (3.0%) | 43 (6.8%) |
| 45 to 59 Minutes | 176 (21.1%) | 182 (28.7%) |
| 60 to 89 Minutes | 230 (27.6%) | 78 (12.3%) |
| 90 or more Minutes | 75 (9.0%) | 49 (7.7%) |
Time of Departure to Work by Sex in Josephine
The most frequent times of departure to work in Josephine are 6:30 AM to 6:59 AM (137, 16.4%) for males and 6:00 AM to 6:29 AM (159, 25.0%) for females.
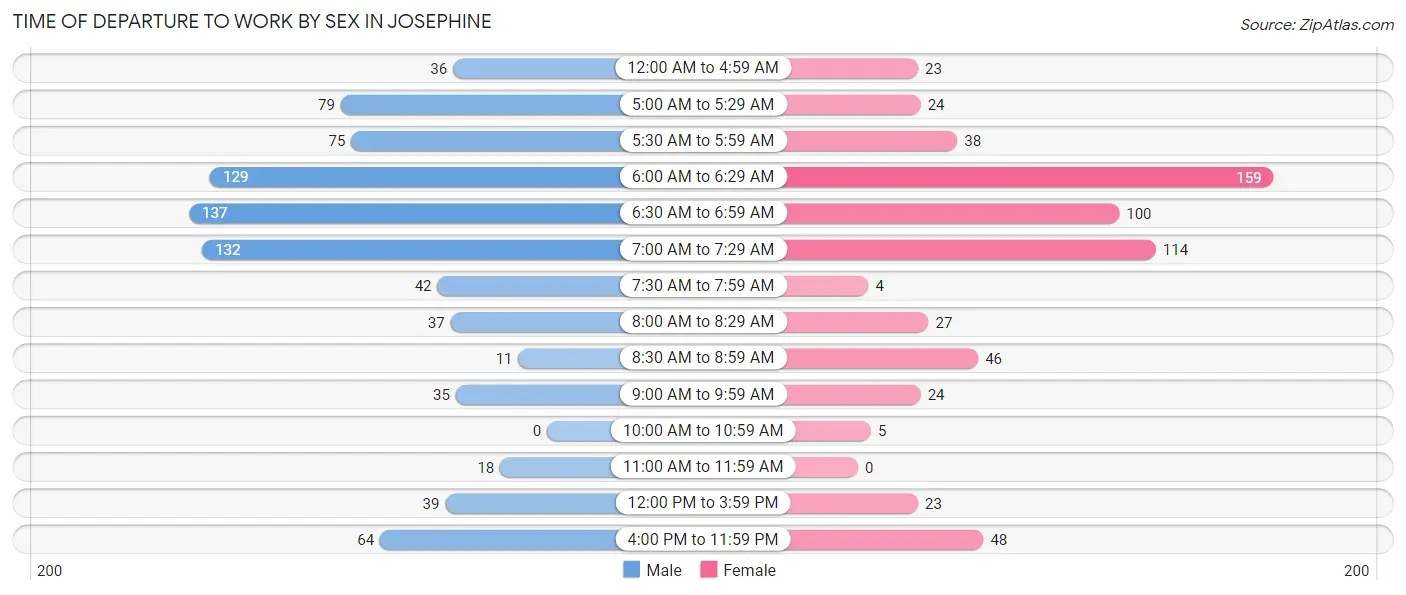
| Time of Departure | Male | Female |
| 12:00 AM to 4:59 AM | 36 (4.3%) | 23 (3.6%) |
| 5:00 AM to 5:29 AM | 79 (9.5%) | 24 (3.8%) |
| 5:30 AM to 5:59 AM | 75 (9.0%) | 38 (6.0%) |
| 6:00 AM to 6:29 AM | 129 (15.5%) | 159 (25.0%) |
| 6:30 AM to 6:59 AM | 137 (16.4%) | 100 (15.8%) |
| 7:00 AM to 7:29 AM | 132 (15.8%) | 114 (17.9%) |
| 7:30 AM to 7:59 AM | 42 (5.0%) | 4 (0.6%) |
| 8:00 AM to 8:29 AM | 37 (4.4%) | 27 (4.3%) |
| 8:30 AM to 8:59 AM | 11 (1.3%) | 46 (7.2%) |
| 9:00 AM to 9:59 AM | 35 (4.2%) | 24 (3.8%) |
| 10:00 AM to 10:59 AM | 0 (0.0%) | 5 (0.8%) |
| 11:00 AM to 11:59 AM | 18 (2.2%) | 0 (0.0%) |
| 12:00 PM to 3:59 PM | 39 (4.7%) | 23 (3.6%) |
| 4:00 PM to 11:59 PM | 64 (7.7%) | 48 (7.6%) |
| Total | 834 (100.0%) | 635 (100.0%) |
Housing Occupancy in Josephine
Occupancy by Ownership in Josephine
Of the total 1,138 dwellings in Josephine, owner-occupied units account for 1,050 (92.3%), while renter-occupied units make up 88 (7.7%).
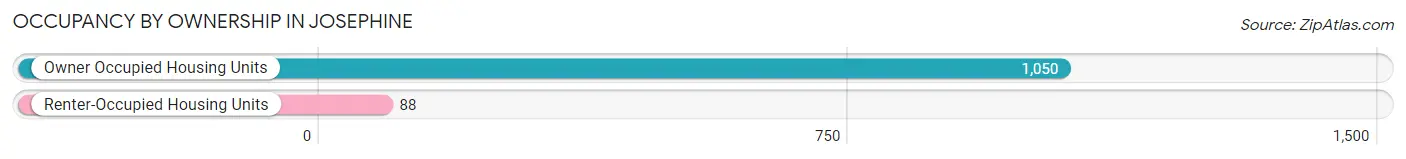
| Occupancy | # Housing Units | % Housing Units |
| Owner Occupied Housing Units | 1,050 | 92.3% |
| Renter-Occupied Housing Units | 88 | 7.7% |
| Total Occupied Housing Units | 1,138 | 100.0% |
Occupancy by Household Size in Josephine
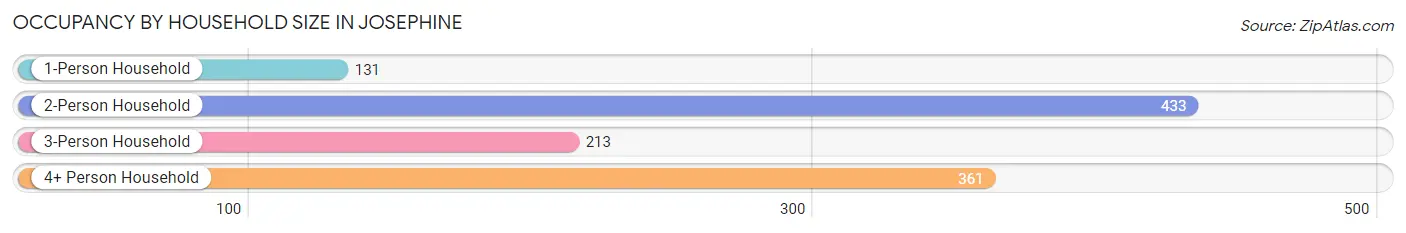
| Household Size | # Housing Units | % Housing Units |
| 1-Person Household | 131 | 11.5% |
| 2-Person Household | 433 | 38.1% |
| 3-Person Household | 213 | 18.7% |
| 4+ Person Household | 361 | 31.7% |
| Total Housing Units | 1,138 | 100.0% |
Occupancy by Ownership by Household Size in Josephine
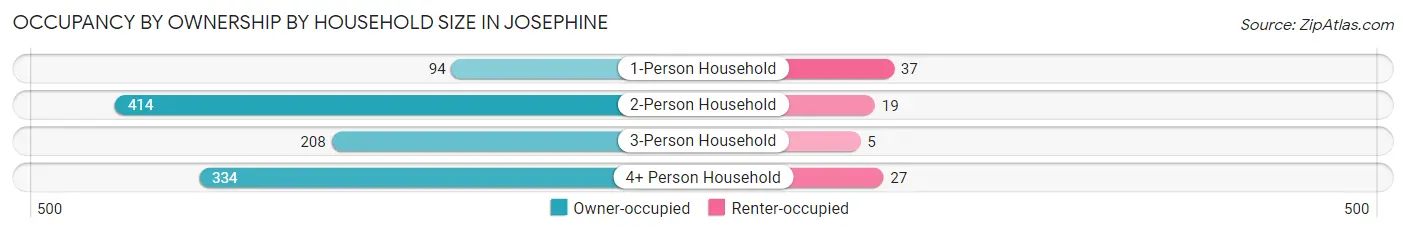
| Household Size | Owner-occupied | Renter-occupied |
| 1-Person Household | 94 (71.8%) | 37 (28.2%) |
| 2-Person Household | 414 (95.6%) | 19 (4.4%) |
| 3-Person Household | 208 (97.7%) | 5 (2.4%) |
| 4+ Person Household | 334 (92.5%) | 27 (7.5%) |
| Total Housing Units | 1,050 (92.3%) | 88 (7.7%) |
Occupancy by Educational Attainment in Josephine
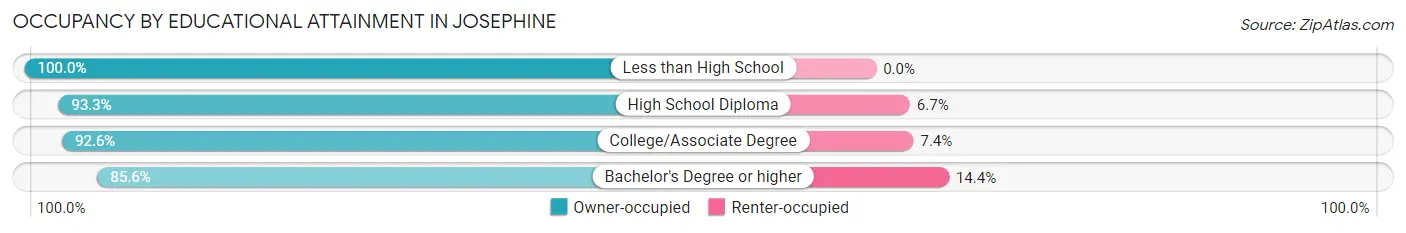
| Household Size | Owner-occupied | Renter-occupied |
| Less than High School | 80 (100.0%) | 0 (0.0%) |
| High School Diploma | 460 (93.3%) | 33 (6.7%) |
| College/Associate Degree | 350 (92.6%) | 28 (7.4%) |
| Bachelor's Degree or higher | 160 (85.6%) | 27 (14.4%) |
Occupancy by Age of Householder in Josephine
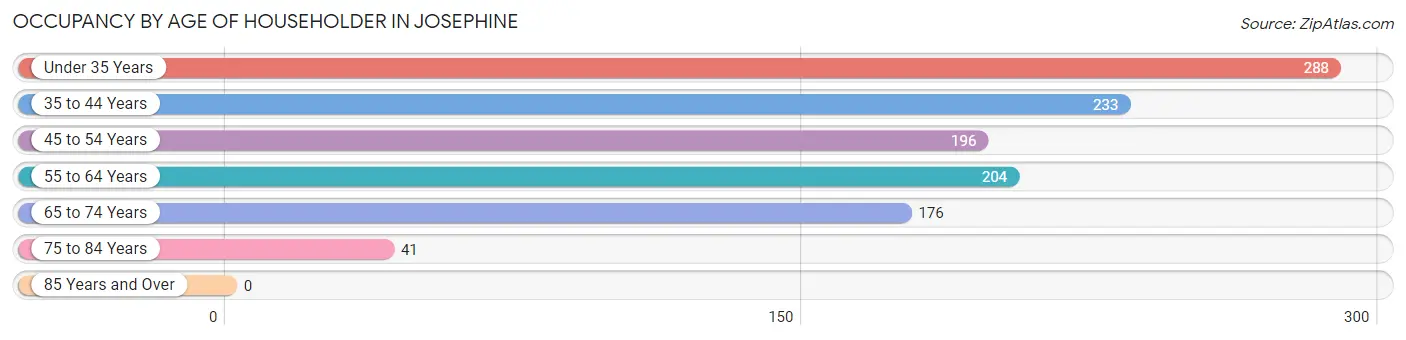
| Age Bracket | # Households | % Households |
| Under 35 Years | 288 | 25.3% |
| 35 to 44 Years | 233 | 20.5% |
| 45 to 54 Years | 196 | 17.2% |
| 55 to 64 Years | 204 | 17.9% |
| 65 to 74 Years | 176 | 15.5% |
| 75 to 84 Years | 41 | 3.6% |
| 85 Years and Over | 0 | 0.0% |
| Total | 1,138 | 100.0% |
Housing Finances in Josephine
Median Income by Occupancy in Josephine
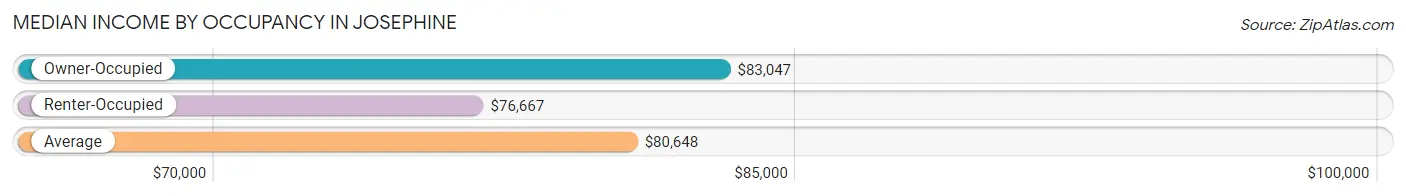
| Occupancy Type | # Households | Median Income |
| Owner-Occupied | 1,050 (92.3%) | $83,047 |
| Renter-Occupied | 88 (7.7%) | $76,667 |
| Average | 1,138 (100.0%) | $80,648 |
Occupancy by Householder Income Bracket in Josephine
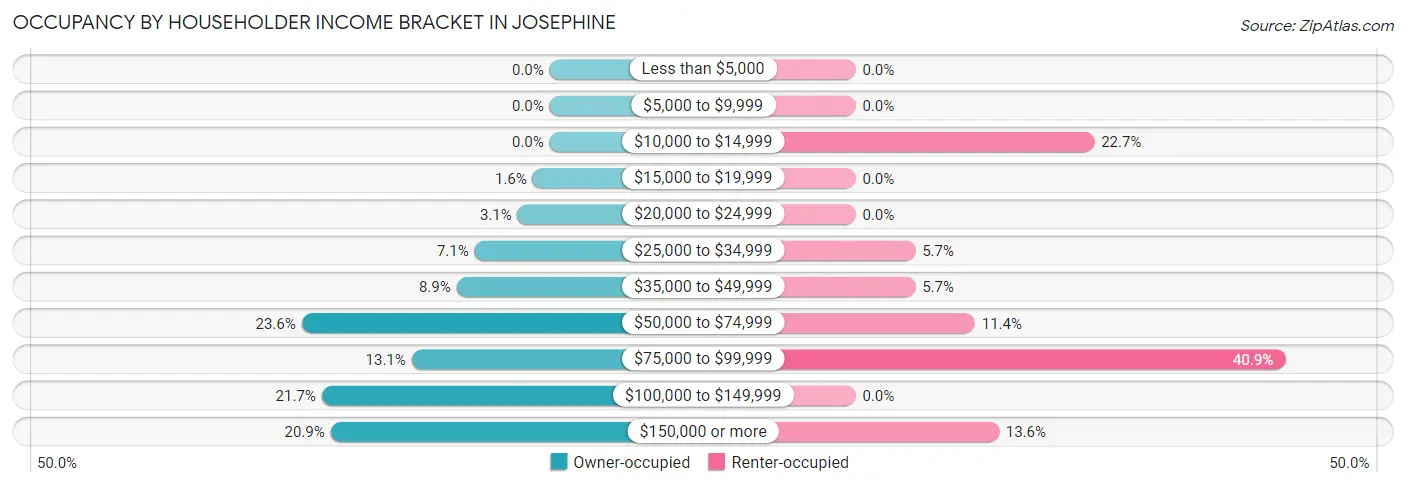
| Income Bracket | Owner-occupied | Renter-occupied |
| Less than $5,000 | 0 (0.0%) | 0 (0.0%) |
| $5,000 to $9,999 | 0 (0.0%) | 0 (0.0%) |
| $10,000 to $14,999 | 0 (0.0%) | 20 (22.7%) |
| $15,000 to $19,999 | 17 (1.6%) | 0 (0.0%) |
| $20,000 to $24,999 | 32 (3.0%) | 0 (0.0%) |
| $25,000 to $34,999 | 75 (7.1%) | 5 (5.7%) |
| $35,000 to $49,999 | 93 (8.9%) | 5 (5.7%) |
| $50,000 to $74,999 | 248 (23.6%) | 10 (11.4%) |
| $75,000 to $99,999 | 138 (13.1%) | 36 (40.9%) |
| $100,000 to $149,999 | 228 (21.7%) | 0 (0.0%) |
| $150,000 or more | 219 (20.9%) | 12 (13.6%) |
| Total | 1,050 (100.0%) | 88 (100.0%) |
Monthly Housing Cost Tiers in Josephine
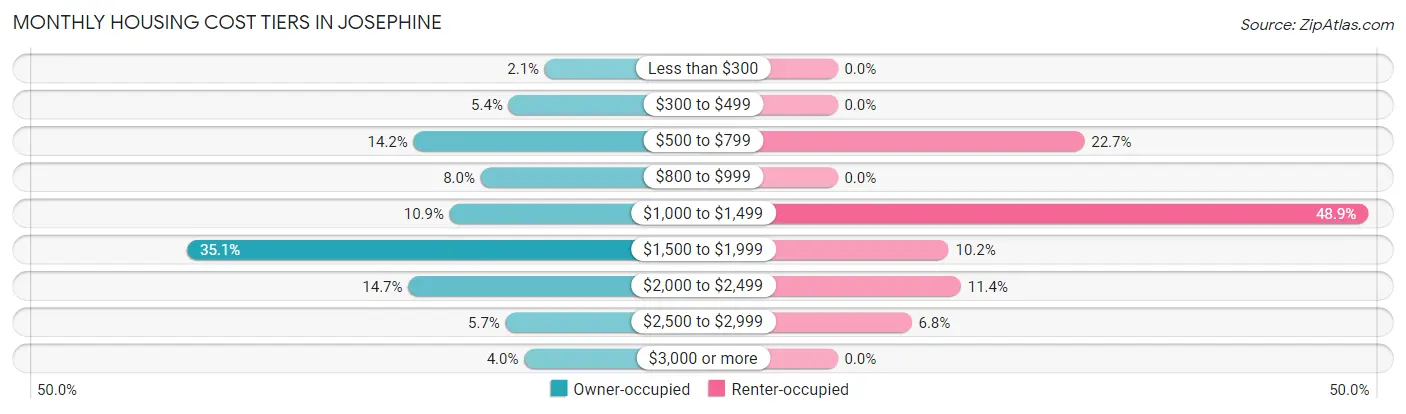
| Monthly Cost | Owner-occupied | Renter-occupied |
| Less than $300 | 22 (2.1%) | 0 (0.0%) |
| $300 to $499 | 57 (5.4%) | 0 (0.0%) |
| $500 to $799 | 149 (14.2%) | 20 (22.7%) |
| $800 to $999 | 84 (8.0%) | 0 (0.0%) |
| $1,000 to $1,499 | 114 (10.9%) | 43 (48.9%) |
| $1,500 to $1,999 | 368 (35.0%) | 9 (10.2%) |
| $2,000 to $2,499 | 154 (14.7%) | 10 (11.4%) |
| $2,500 to $2,999 | 60 (5.7%) | 6 (6.8%) |
| $3,000 or more | 42 (4.0%) | 0 (0.0%) |
| Total | 1,050 (100.0%) | 88 (100.0%) |
Physical Housing Characteristics in Josephine
Housing Structures in Josephine
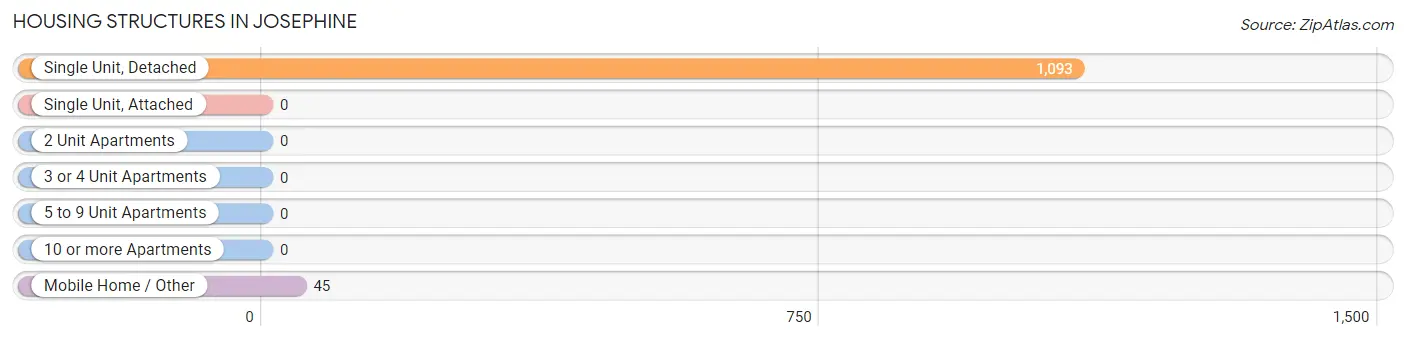
| Structure Type | # Housing Units | % Housing Units |
| Single Unit, Detached | 1,093 | 96.1% |
| Single Unit, Attached | 0 | 0.0% |
| 2 Unit Apartments | 0 | 0.0% |
| 3 or 4 Unit Apartments | 0 | 0.0% |
| 5 to 9 Unit Apartments | 0 | 0.0% |
| 10 or more Apartments | 0 | 0.0% |
| Mobile Home / Other | 45 | 4.0% |
| Total | 1,138 | 100.0% |
Housing Structures by Occupancy in Josephine
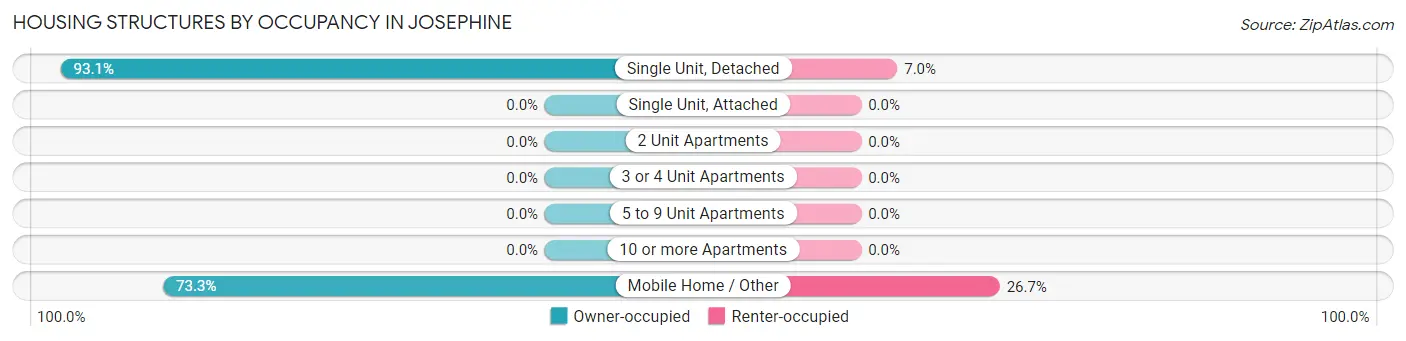
| Structure Type | Owner-occupied | Renter-occupied |
| Single Unit, Detached | 1,017 (93.0%) | 76 (7.0%) |
| Single Unit, Attached | 0 (0.0%) | 0 (0.0%) |
| 2 Unit Apartments | 0 (0.0%) | 0 (0.0%) |
| 3 or 4 Unit Apartments | 0 (0.0%) | 0 (0.0%) |
| 5 to 9 Unit Apartments | 0 (0.0%) | 0 (0.0%) |
| 10 or more Apartments | 0 (0.0%) | 0 (0.0%) |
| Mobile Home / Other | 33 (73.3%) | 12 (26.7%) |
| Total | 1,050 (92.3%) | 88 (7.7%) |
Housing Structures by Number of Rooms in Josephine
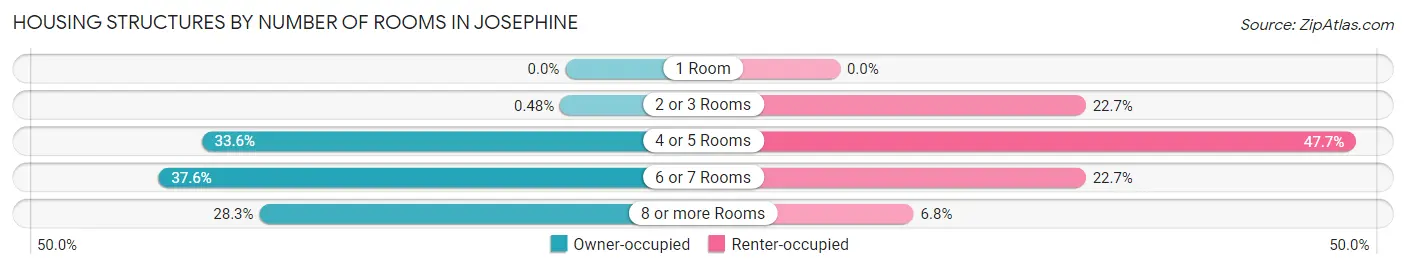
| Number of Rooms | Owner-occupied | Renter-occupied |
| 1 Room | 0 (0.0%) | 0 (0.0%) |
| 2 or 3 Rooms | 5 (0.5%) | 20 (22.7%) |
| 4 or 5 Rooms | 353 (33.6%) | 42 (47.7%) |
| 6 or 7 Rooms | 395 (37.6%) | 20 (22.7%) |
| 8 or more Rooms | 297 (28.3%) | 6 (6.8%) |
| Total | 1,050 (100.0%) | 88 (100.0%) |
Housing Structure by Heating Type in Josephine
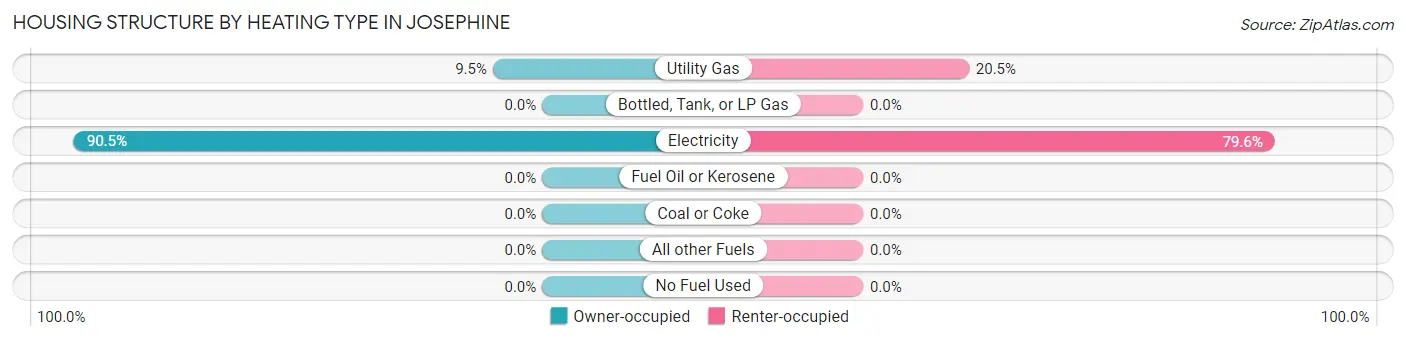
| Heating Type | Owner-occupied | Renter-occupied |
| Utility Gas | 100 (9.5%) | 18 (20.4%) |
| Bottled, Tank, or LP Gas | 0 (0.0%) | 0 (0.0%) |
| Electricity | 950 (90.5%) | 70 (79.5%) |
| Fuel Oil or Kerosene | 0 (0.0%) | 0 (0.0%) |
| Coal or Coke | 0 (0.0%) | 0 (0.0%) |
| All other Fuels | 0 (0.0%) | 0 (0.0%) |
| No Fuel Used | 0 (0.0%) | 0 (0.0%) |
| Total | 1,050 (100.0%) | 88 (100.0%) |
Household Vehicle Usage in Josephine
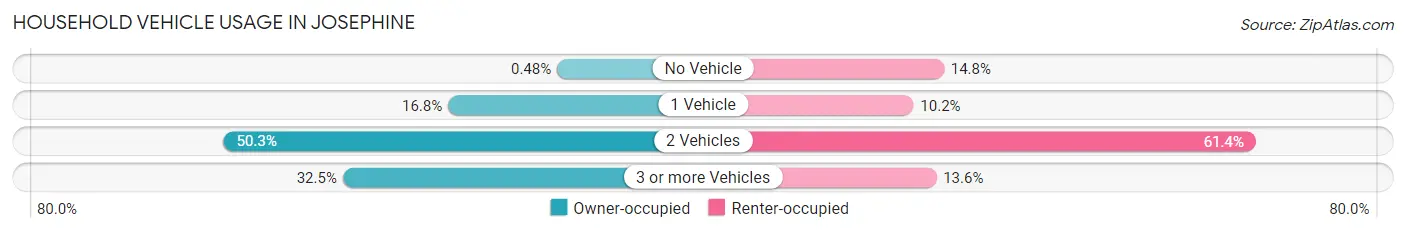
| Vehicles per Household | Owner-occupied | Renter-occupied |
| No Vehicle | 5 (0.5%) | 13 (14.8%) |
| 1 Vehicle | 176 (16.8%) | 9 (10.2%) |
| 2 Vehicles | 528 (50.3%) | 54 (61.4%) |
| 3 or more Vehicles | 341 (32.5%) | 12 (13.6%) |
| Total | 1,050 (100.0%) | 88 (100.0%) |
Real Estate & Mortgages in Josephine
Real Estate and Mortgage Overview in Josephine
| Characteristic | Without Mortgage | With Mortgage |
| Housing Units | 250 | 800 |
| Median Property Value | $219,600 | $239,600 |
| Median Household Income | $58,889 | $179 |
| Monthly Housing Costs | $594 | $42 |
| Real Estate Taxes | $2,259 | $29 |
Property Value by Mortgage Status in Josephine
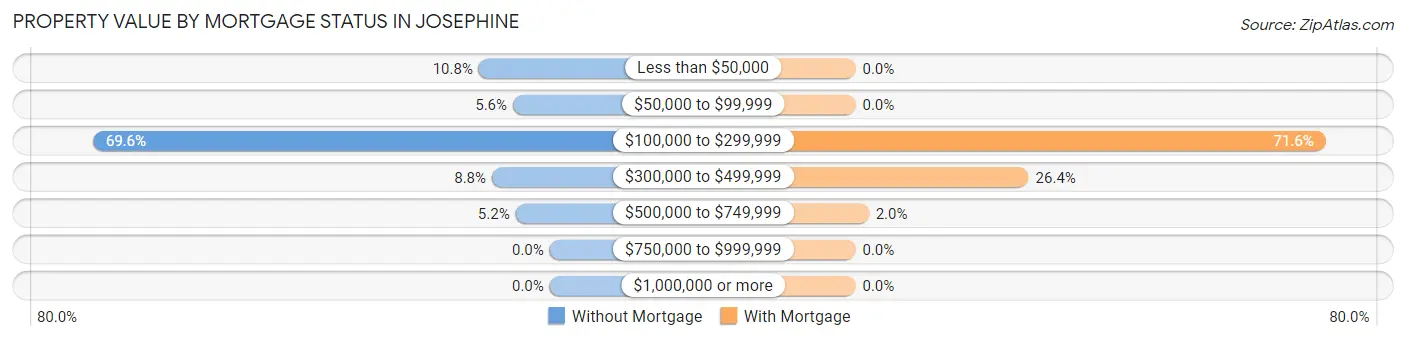
| Property Value | Without Mortgage | With Mortgage |
| Less than $50,000 | 27 (10.8%) | 0 (0.0%) |
| $50,000 to $99,999 | 14 (5.6%) | 0 (0.0%) |
| $100,000 to $299,999 | 174 (69.6%) | 573 (71.6%) |
| $300,000 to $499,999 | 22 (8.8%) | 211 (26.4%) |
| $500,000 to $749,999 | 13 (5.2%) | 16 (2.0%) |
| $750,000 to $999,999 | 0 (0.0%) | 0 (0.0%) |
| $1,000,000 or more | 0 (0.0%) | 0 (0.0%) |
| Total | 250 (100.0%) | 800 (100.0%) |
Household Income by Mortgage Status in Josephine
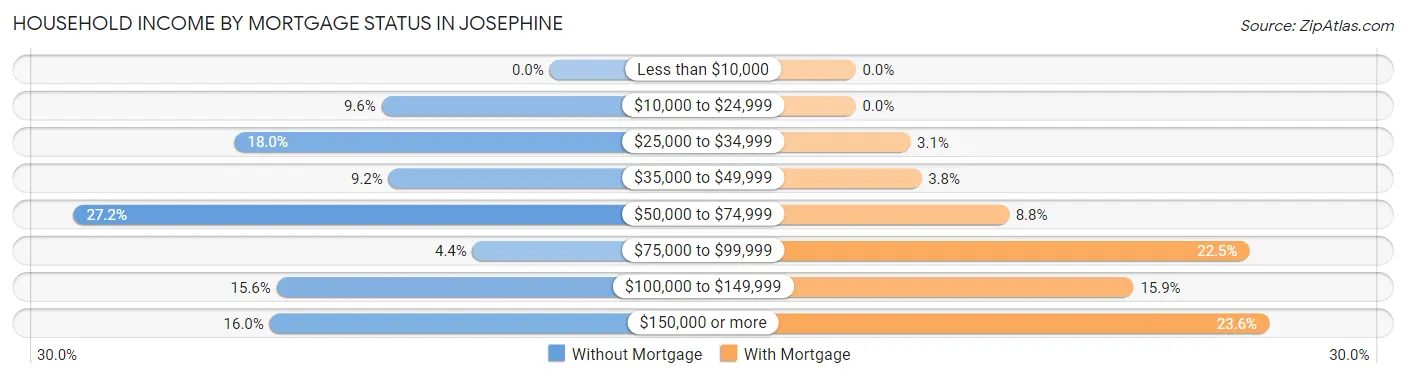
| Household Income | Without Mortgage | With Mortgage |
| Less than $10,000 | 0 (0.0%) | 0 (0.0%) |
| $10,000 to $24,999 | 24 (9.6%) | 0 (0.0%) |
| $25,000 to $34,999 | 45 (18.0%) | 25 (3.1%) |
| $35,000 to $49,999 | 23 (9.2%) | 30 (3.7%) |
| $50,000 to $74,999 | 68 (27.2%) | 70 (8.7%) |
| $75,000 to $99,999 | 11 (4.4%) | 180 (22.5%) |
| $100,000 to $149,999 | 39 (15.6%) | 127 (15.9%) |
| $150,000 or more | 40 (16.0%) | 189 (23.6%) |
| Total | 250 (100.0%) | 800 (100.0%) |
Property Value to Household Income Ratio in Josephine
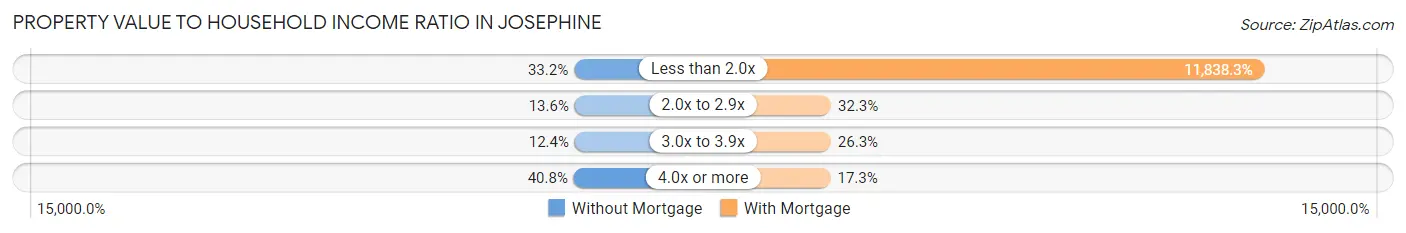
| Value-to-Income Ratio | Without Mortgage | With Mortgage |
| Less than 2.0x | 83 (33.2%) | 94,706 (11,838.2%) |
| 2.0x to 2.9x | 34 (13.6%) | 258 (32.3%) |
| 3.0x to 3.9x | 31 (12.4%) | 210 (26.3%) |
| 4.0x or more | 102 (40.8%) | 138 (17.2%) |
| Total | 250 (100.0%) | 800 (100.0%) |
Real Estate Taxes by Mortgage Status in Josephine
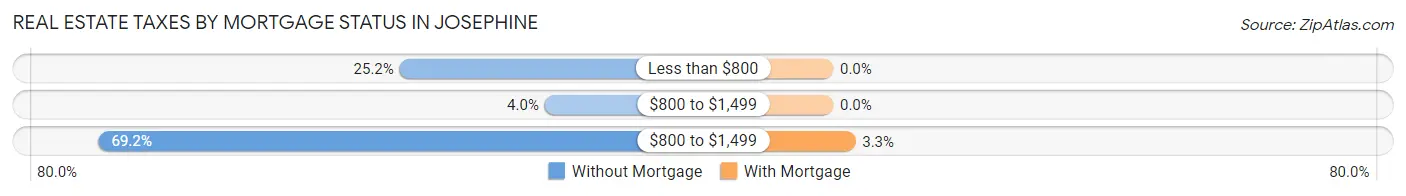
| Property Taxes | Without Mortgage | With Mortgage |
| Less than $800 | 63 (25.2%) | 0 (0.0%) |
| $800 to $1,499 | 10 (4.0%) | 0 (0.0%) |
| $800 to $1,499 | 173 (69.2%) | 26 (3.3%) |
| Total | 250 (100.0%) | 800 (100.0%) |
Health & Disability in Josephine
Health Insurance Coverage by Age in Josephine
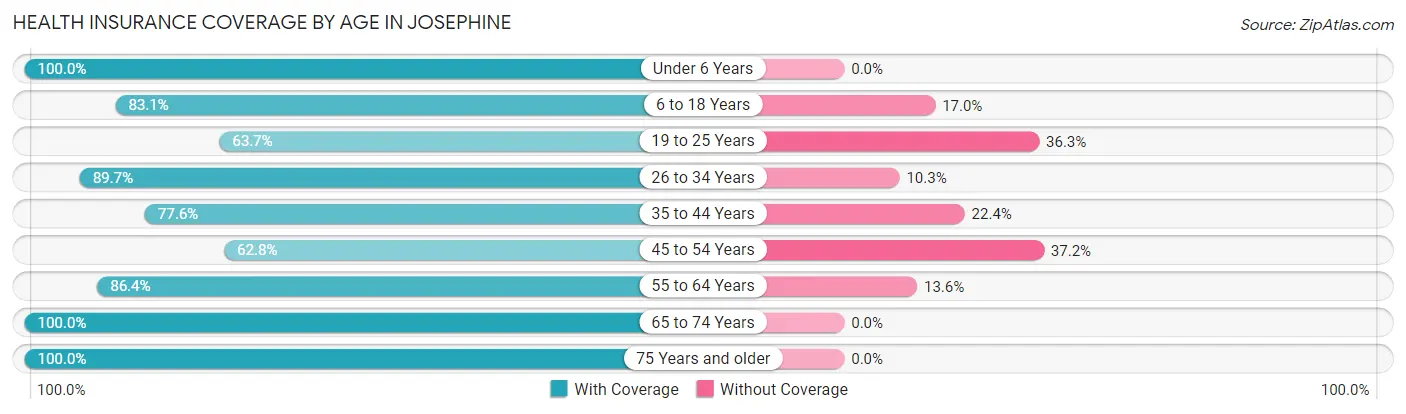
| Age Bracket | With Coverage | Without Coverage |
| Under 6 Years | 298 (100.0%) | 0 (0.0%) |
| 6 to 18 Years | 627 (83.1%) | 128 (17.0%) |
| 19 to 25 Years | 184 (63.7%) | 105 (36.3%) |
| 26 to 34 Years | 471 (89.7%) | 54 (10.3%) |
| 35 to 44 Years | 318 (77.6%) | 92 (22.4%) |
| 45 to 54 Years | 280 (62.8%) | 166 (37.2%) |
| 55 to 64 Years | 376 (86.4%) | 59 (13.6%) |
| 65 to 74 Years | 249 (100.0%) | 0 (0.0%) |
| 75 Years and older | 90 (100.0%) | 0 (0.0%) |
| Total | 2,893 (82.7%) | 604 (17.3%) |
Health Insurance Coverage by Citizenship Status in Josephine
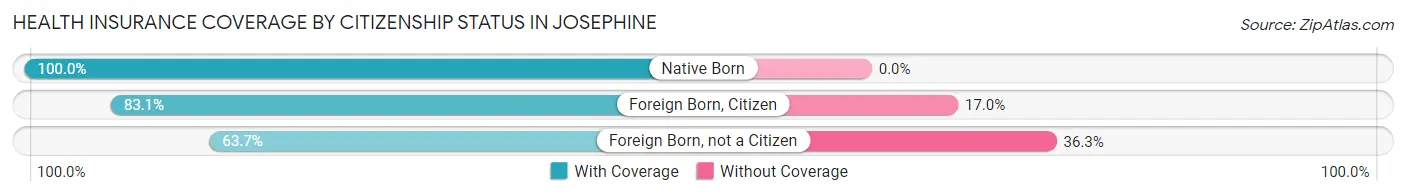
| Citizenship Status | With Coverage | Without Coverage |
| Native Born | 298 (100.0%) | 0 (0.0%) |
| Foreign Born, Citizen | 627 (83.1%) | 128 (17.0%) |
| Foreign Born, not a Citizen | 184 (63.7%) | 105 (36.3%) |
Health Insurance Coverage by Household Income in Josephine
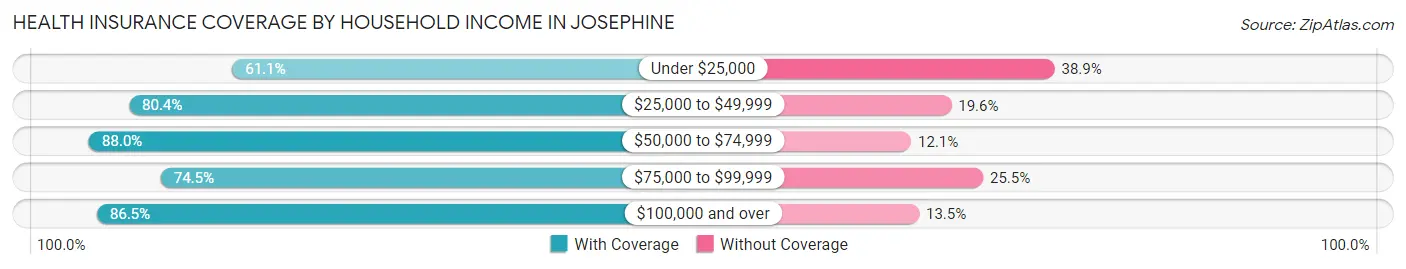
| Household Income | With Coverage | Without Coverage |
| Under $25,000 | 113 (61.1%) | 72 (38.9%) |
| $25,000 to $49,999 | 423 (80.4%) | 103 (19.6%) |
| $50,000 to $74,999 | 657 (87.9%) | 90 (12.0%) |
| $75,000 to $99,999 | 391 (74.5%) | 134 (25.5%) |
| $100,000 and over | 1,309 (86.5%) | 205 (13.5%) |
Public vs Private Health Insurance Coverage by Age in Josephine
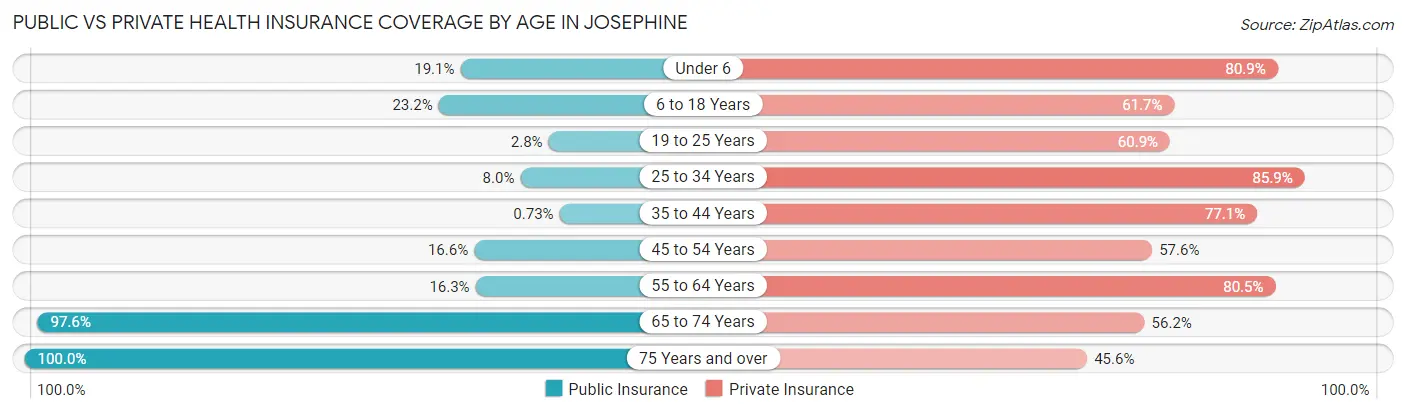
| Age Bracket | Public Insurance | Private Insurance |
| Under 6 | 57 (19.1%) | 241 (80.9%) |
| 6 to 18 Years | 175 (23.2%) | 466 (61.7%) |
| 19 to 25 Years | 8 (2.8%) | 176 (60.9%) |
| 25 to 34 Years | 42 (8.0%) | 451 (85.9%) |
| 35 to 44 Years | 3 (0.7%) | 316 (77.1%) |
| 45 to 54 Years | 74 (16.6%) | 257 (57.6%) |
| 55 to 64 Years | 71 (16.3%) | 350 (80.5%) |
| 65 to 74 Years | 243 (97.6%) | 140 (56.2%) |
| 75 Years and over | 90 (100.0%) | 41 (45.6%) |
| Total | 763 (21.8%) | 2,438 (69.7%) |
Disability Status by Sex by Age in Josephine
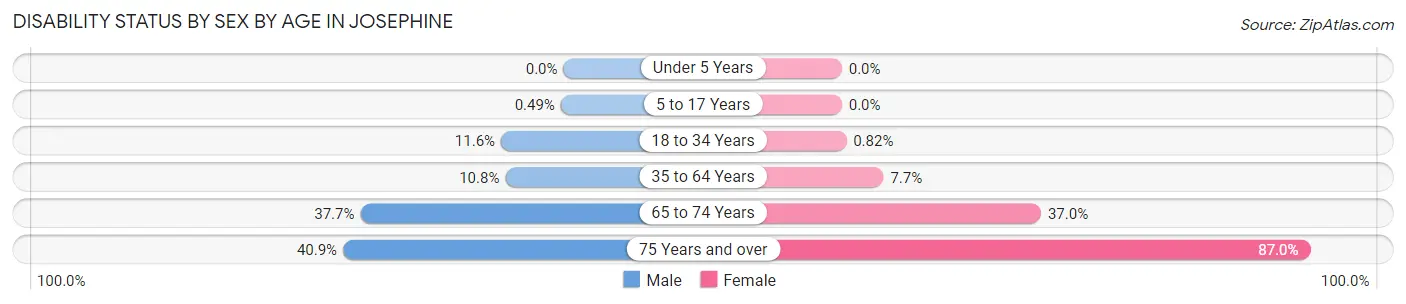
| Age Bracket | Male | Female |
| Under 5 Years | 0 (0.0%) | 0 (0.0%) |
| 5 to 17 Years | 2 (0.5%) | 0 (0.0%) |
| 18 to 34 Years | 43 (11.6%) | 4 (0.8%) |
| 35 to 64 Years | 71 (10.8%) | 49 (7.7%) |
| 65 to 74 Years | 49 (37.7%) | 44 (37.0%) |
| 75 Years and over | 18 (40.9%) | 40 (87.0%) |
Disability Class by Sex by Age in Josephine
Disability Class: Hearing Difficulty
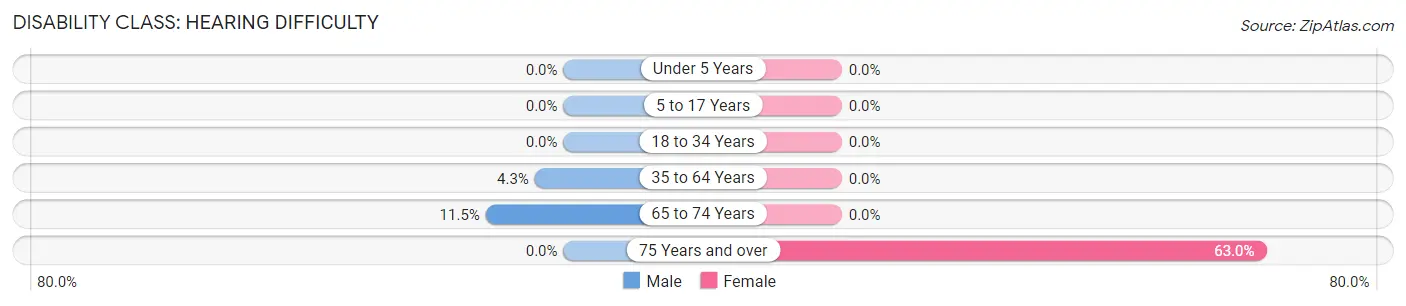
| Age Bracket | Male | Female |
| Under 5 Years | 0 (0.0%) | 0 (0.0%) |
| 5 to 17 Years | 0 (0.0%) | 0 (0.0%) |
| 18 to 34 Years | 0 (0.0%) | 0 (0.0%) |
| 35 to 64 Years | 28 (4.3%) | 0 (0.0%) |
| 65 to 74 Years | 15 (11.5%) | 0 (0.0%) |
| 75 Years and over | 0 (0.0%) | 29 (63.0%) |
Disability Class: Vision Difficulty
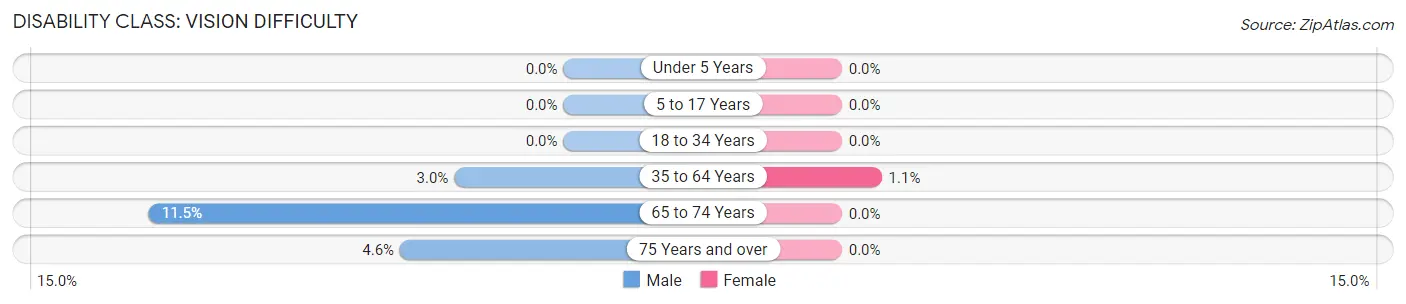
| Age Bracket | Male | Female |
| Under 5 Years | 0 (0.0%) | 0 (0.0%) |
| 5 to 17 Years | 0 (0.0%) | 0 (0.0%) |
| 18 to 34 Years | 0 (0.0%) | 0 (0.0%) |
| 35 to 64 Years | 20 (3.0%) | 7 (1.1%) |
| 65 to 74 Years | 15 (11.5%) | 0 (0.0%) |
| 75 Years and over | 2 (4.5%) | 0 (0.0%) |
Disability Class: Cognitive Difficulty
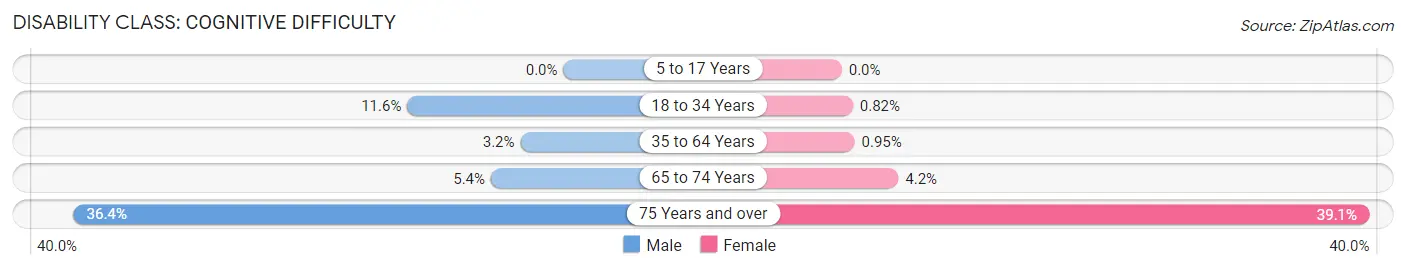
| Age Bracket | Male | Female |
| 5 to 17 Years | 0 (0.0%) | 0 (0.0%) |
| 18 to 34 Years | 43 (11.6%) | 4 (0.8%) |
| 35 to 64 Years | 21 (3.2%) | 6 (0.9%) |
| 65 to 74 Years | 7 (5.4%) | 5 (4.2%) |
| 75 Years and over | 16 (36.4%) | 18 (39.1%) |
Disability Class: Ambulatory Difficulty
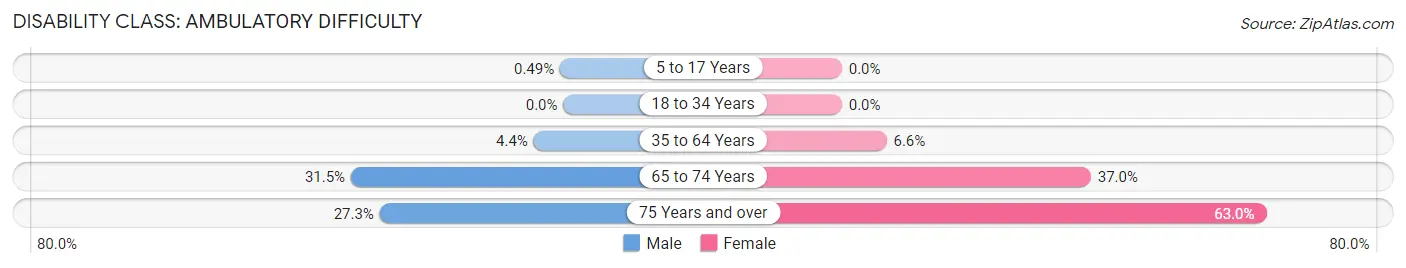
| Age Bracket | Male | Female |
| 5 to 17 Years | 2 (0.5%) | 0 (0.0%) |
| 18 to 34 Years | 0 (0.0%) | 0 (0.0%) |
| 35 to 64 Years | 29 (4.4%) | 42 (6.6%) |
| 65 to 74 Years | 41 (31.5%) | 44 (37.0%) |
| 75 Years and over | 12 (27.3%) | 29 (63.0%) |
Disability Class: Self-Care Difficulty
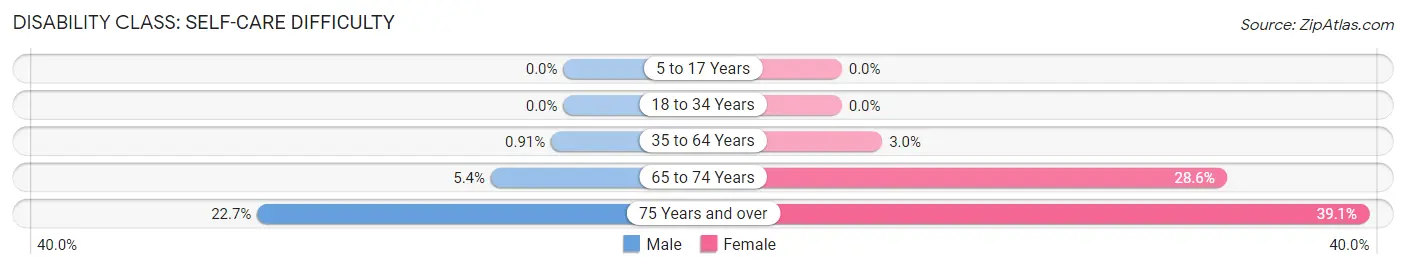
| Age Bracket | Male | Female |
| 5 to 17 Years | 0 (0.0%) | 0 (0.0%) |
| 18 to 34 Years | 0 (0.0%) | 0 (0.0%) |
| 35 to 64 Years | 6 (0.9%) | 19 (3.0%) |
| 65 to 74 Years | 7 (5.4%) | 34 (28.6%) |
| 75 Years and over | 10 (22.7%) | 18 (39.1%) |
Technology Access in Josephine
Computing Device Access in Josephine
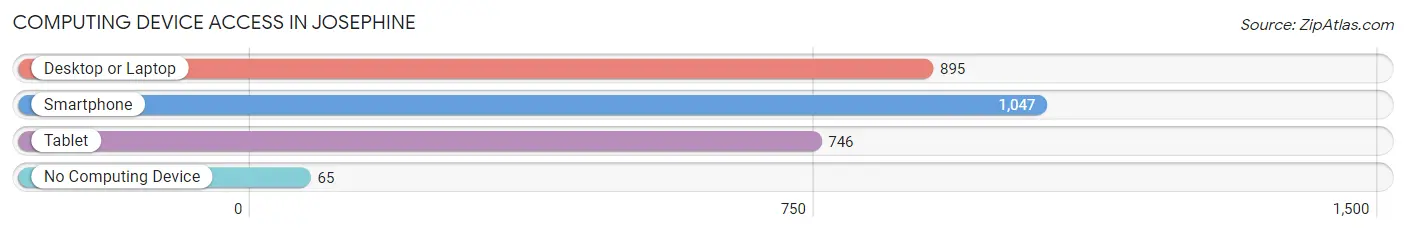
| Device Type | # Households | % Households |
| Desktop or Laptop | 895 | 78.6% |
| Smartphone | 1,047 | 92.0% |
| Tablet | 746 | 65.5% |
| No Computing Device | 65 | 5.7% |
| Total | 1,138 | 100.0% |
Internet Access in Josephine
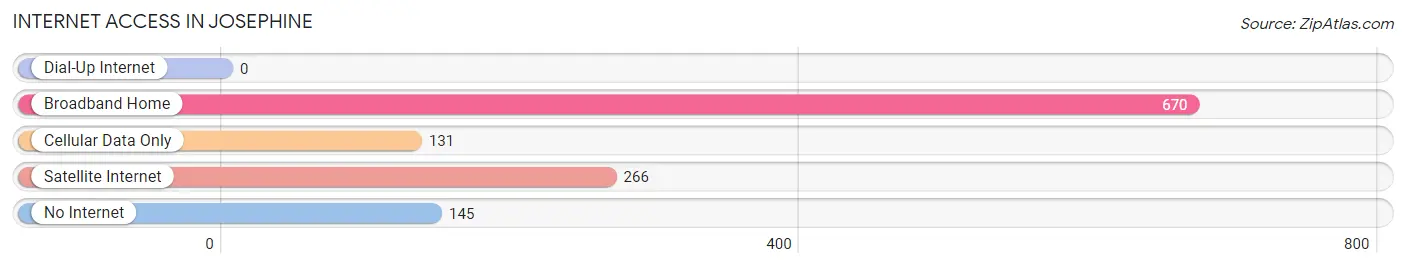
| Internet Type | # Households | % Households |
| Dial-Up Internet | 0 | 0.0% |
| Broadband Home | 670 | 58.9% |
| Cellular Data Only | 131 | 11.5% |
| Satellite Internet | 266 | 23.4% |
| No Internet | 145 | 12.7% |
| Total | 1,138 | 100.0% |
Josephine Summary
Josephine, Texas is a small town located in Collin County, Texas. It is situated about 30 miles northeast of Dallas and is part of the Dallas-Fort Worth metropolitan area. The town was founded in 1848 and was named after the daughter of one of the original settlers. The population of Josephine was 1,845 as of the 2010 census.
Geography
Josephine is located at 33°14'25"N 96°30'45"W (33.240278, -96.5125). It is situated in the northeast corner of Collin County, Texas, and is part of the Dallas-Fort Worth metropolitan area. The town is located on the banks of the East Fork of the Trinity River. The terrain is mostly flat with some rolling hills. The average elevation is approximately 500 feet above sea level.
Climate
Josephine has a humid subtropical climate, with hot summers and mild winters. The average annual temperature is 68°F, with an average high of 91°F in the summer and an average low of 44°F in the winter. The average annual precipitation is 37.5 inches, with an average of 4.5 inches of snowfall per year.
Demographics
As of the 2010 census, the population of Josephine was 1,845. The racial makeup of the town was 79.2% White, 11.2% African American, 0.3% Native American, 0.7% Asian, 0.1% Pacific Islander, 6.2% from other races, and 2.3% from two or more races. Hispanic or Latino of any race were 13.2% of the population.
Economy
Josephine is a small, rural town with a primarily agricultural economy. The town is home to several farms and ranches, as well as a few small businesses. The town is also home to a few manufacturing companies, including a plastics factory and a metal fabrication plant.
Education
Josephine is served by the Josephine Independent School District. The district has one elementary school, one middle school, and one high school. The town is also home to a branch of Collin College, which offers a variety of associate degree and certificate programs.
Transportation
Josephine is served by State Highway 78, which runs through the town. The town is also served by the Dallas Area Rapid Transit (DART) bus system, which provides service to the nearby cities of Plano and McKinney.
Conclusion
Josephine, Texas is a small town located in Collin County, Texas. It is situated about 30 miles northeast of Dallas and is part of the Dallas-Fort Worth metropolitan area. The town was founded in 1848 and was named after the daughter of one of the original settlers. The population of Josephine was 1,845 as of the 2010 census. The town has a humid subtropical climate, with hot summers and mild winters. The economy of Josephine is primarily agricultural, with a few small businesses and manufacturing companies. The town is served by the Josephine Independent School District and a branch of Collin College. Josephine is also served by State Highway 78 and the Dallas Area Rapid Transit (DART) bus system.
Common Questions
What is Per Capita Income in Josephine?
Per Capita income in Josephine is $34,995.
What is the Median Family Income in Josephine?
Median Family Income in Josephine is $92,794.
What is the Median Household income in Josephine?
Median Household Income in Josephine is $80,648.
What is Income or Wage Gap in Josephine?
Income or Wage Gap in Josephine is 51.5%.
Women in Josephine earn 48.5 cents for every dollar earned by a man.
What is Inequality or Gini Index in Josephine?
Inequality or Gini Index in Josephine is 0.37.
What is the Total Population of Josephine?
Total Population of Josephine is 3,497.
What is the Total Male Population of Josephine?
Total Male Population of Josephine is 1,714.
What is the Total Female Population of Josephine?
Total Female Population of Josephine is 1,783.
What is the Ratio of Males per 100 Females in Josephine?
There are 96.13 Males per 100 Females in Josephine.
What is the Ratio of Females per 100 Males in Josephine?
There are 104.03 Females per 100 Males in Josephine.
What is the Median Population Age in Josephine?
Median Population Age in Josephine is 33.2 Years.
What is the Average Family Size in Josephine
Average Family Size in Josephine is 3.4 People.
What is the Average Household Size in Josephine
Average Household Size in Josephine is 3.1 People.
How Large is the Labor Force in Josephine?
There are 1,806 People in the Labor Forcein in Josephine.
What is the Percentage of People in the Labor Force in Josephine?
69.4% of People are in the Labor Force in Josephine.
What is the Unemployment Rate in Josephine?
Unemployment Rate in Josephine is 4.0%.