Chalmette, LA Map & Demographics
Chalmette Map
Chalmette Overview
$28,480
PER CAPITA INCOME
$62,292
AVG FAMILY INCOME
$55,655
AVG HOUSEHOLD INCOME
35.7%
WAGE / INCOME GAP [ % ]
64.3¢/ $1
WAGE / INCOME GAP [ $ ]
$10,443
FAMILY INCOME DEFICIT
0.49
INEQUALITY / GINI INDEX
22,192
TOTAL POPULATION
10,947
MALE POPULATION
11,245
FEMALE POPULATION
97.35
MALES / 100 FEMALES
102.72
FEMALES / 100 MALES
34.6
MEDIAN AGE
3.4
AVG FAMILY SIZE
2.8
AVG HOUSEHOLD SIZE
10,275
LABOR FORCE [ PEOPLE ]
60.3%
PERCENT IN LABOR FORCE
9.5%
UNEMPLOYMENT RATE
Chalmette Zip Codes
Chalmette Area Codes
Income in Chalmette
Income Overview in Chalmette
Per Capita Income in Chalmette is $28,480, while median incomes of families and households are $62,292 and $55,655 respectively.
| Characteristic | Number | Measure |
| Per Capita Income | 22,192 | $28,480 |
| Median Family Income | 5,345 | $62,292 |
| Mean Family Income | 5,345 | $80,663 |
| Median Household Income | 7,902 | $55,655 |
| Mean Household Income | 7,902 | $74,093 |
| Income Deficit | 5,345 | $10,443 |
| Wage / Income Gap (%) | 22,192 | 35.67% |
| Wage / Income Gap ($) | 22,192 | 64.33¢ per $1 |
| Gini / Inequality Index | 22,192 | 0.49 |
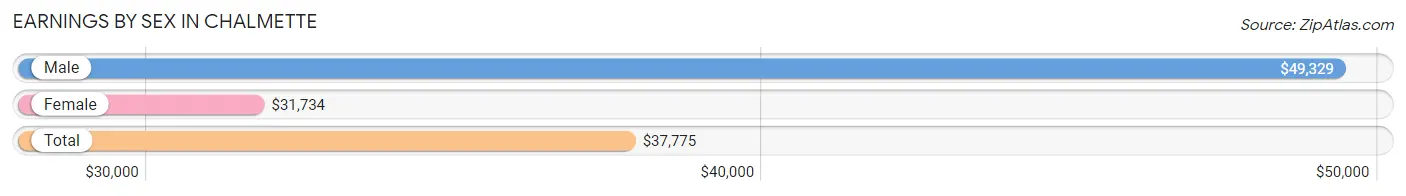
Earnings by Sex in Chalmette
Average Earnings in Chalmette are $37,775, $49,329 for men and $31,734 for women, a difference of 35.7%.
| Sex | Number | Average Earnings |
| Male | 5,239 (49.9%) | $49,329 |
| Female | 5,260 (50.1%) | $31,734 |
| Total | 10,499 (100.0%) | $37,775 |
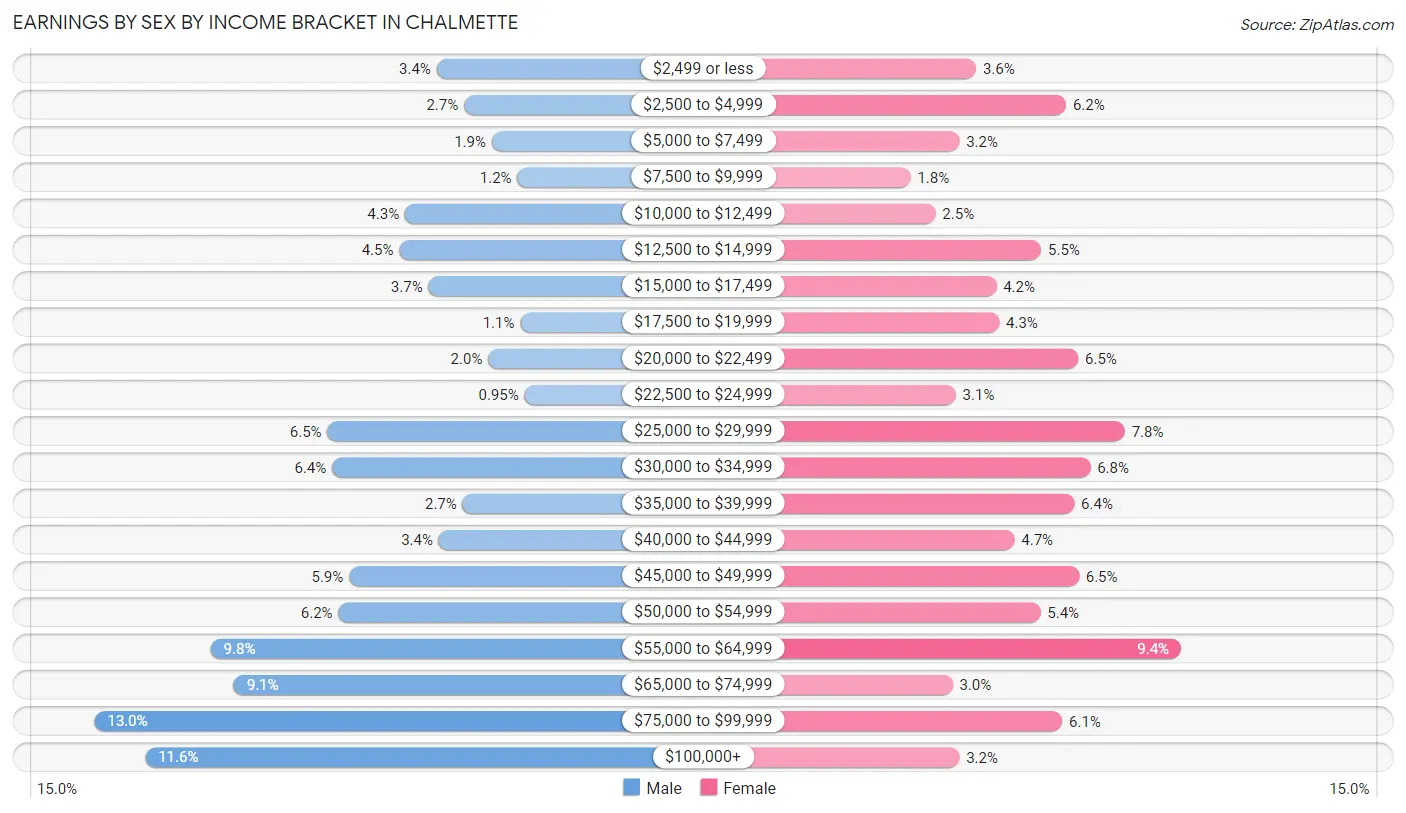
Earnings by Sex by Income Bracket in Chalmette
The most common earnings brackets in Chalmette are $75,000 to $99,999 for men (683 | 13.0%) and $55,000 to $64,999 for women (494 | 9.4%).
| Income | Male | Female |
| $2,499 or less | 179 (3.4%) | 191 (3.6%) |
| $2,500 to $4,999 | 139 (2.6%) | 324 (6.2%) |
| $5,000 to $7,499 | 98 (1.9%) | 166 (3.2%) |
| $7,500 to $9,999 | 60 (1.1%) | 94 (1.8%) |
| $10,000 to $12,499 | 226 (4.3%) | 131 (2.5%) |
| $12,500 to $14,999 | 234 (4.5%) | 287 (5.5%) |
| $15,000 to $17,499 | 191 (3.6%) | 221 (4.2%) |
| $17,500 to $19,999 | 56 (1.1%) | 225 (4.3%) |
| $20,000 to $22,499 | 103 (2.0%) | 342 (6.5%) |
| $22,500 to $24,999 | 50 (0.9%) | 161 (3.1%) |
| $25,000 to $29,999 | 340 (6.5%) | 411 (7.8%) |
| $30,000 to $34,999 | 333 (6.4%) | 360 (6.8%) |
| $35,000 to $39,999 | 141 (2.7%) | 336 (6.4%) |
| $40,000 to $44,999 | 176 (3.4%) | 248 (4.7%) |
| $45,000 to $49,999 | 308 (5.9%) | 343 (6.5%) |
| $50,000 to $54,999 | 324 (6.2%) | 286 (5.4%) |
| $55,000 to $64,999 | 512 (9.8%) | 494 (9.4%) |
| $65,000 to $74,999 | 478 (9.1%) | 156 (3.0%) |
| $75,000 to $99,999 | 683 (13.0%) | 318 (6.0%) |
| $100,000+ | 608 (11.6%) | 166 (3.2%) |
| Total | 5,239 (100.0%) | 5,260 (100.0%) |
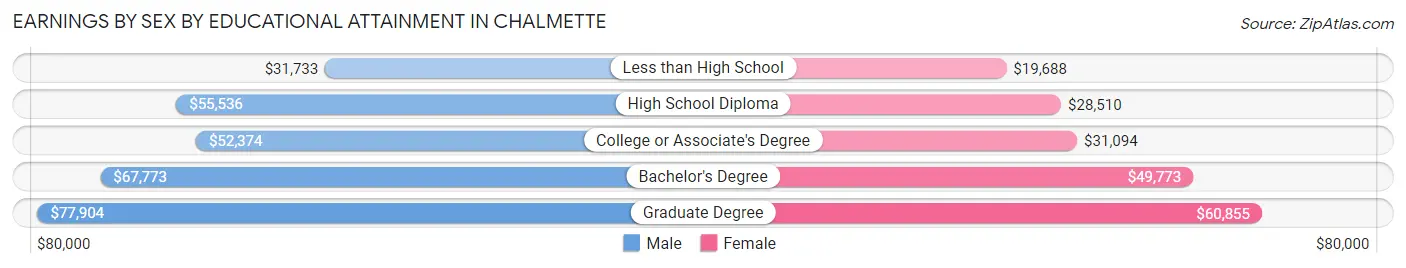
Earnings by Sex by Educational Attainment in Chalmette
Average earnings in Chalmette are $53,304 for men and $33,499 for women, a difference of 37.1%. Men with an educational attainment of graduate degree enjoy the highest average annual earnings of $77,904, while those with less than high school education earn the least with $31,733. Women with an educational attainment of graduate degree earn the most with the average annual earnings of $60,855, while those with less than high school education have the smallest earnings of $19,688.
| Educational Attainment | Male Income | Female Income |
| Less than High School | $31,733 | $19,688 |
| High School Diploma | $55,536 | $28,510 |
| College or Associate's Degree | $52,374 | $31,094 |
| Bachelor's Degree | $67,773 | $49,773 |
| Graduate Degree | $77,904 | $60,855 |
| Total | $53,304 | $33,499 |
Family Income in Chalmette
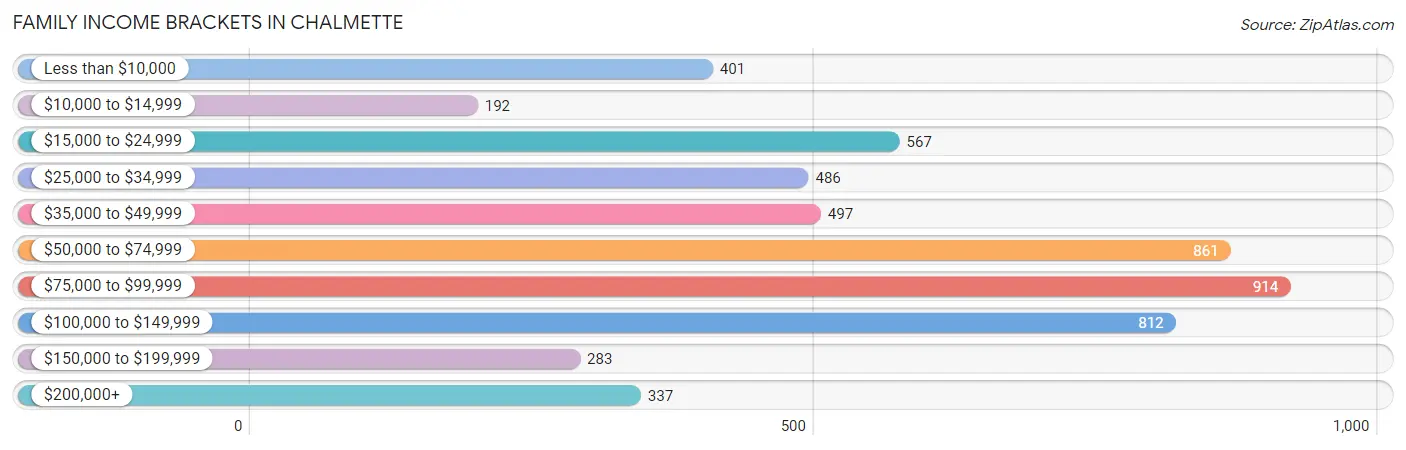
Family Income Brackets in Chalmette
According to the Chalmette family income data, there are 914 families falling into the $75,000 to $99,999 income range, which is the most common income bracket and makes up 17.1% of all families. Conversely, the $10,000 to $14,999 income bracket is the least frequent group with only 192 families (3.6%) belonging to this category.
| Income Bracket | # Families | % Families |
| Less than $10,000 | 401 | 7.5% |
| $10,000 to $14,999 | 192 | 3.6% |
| $15,000 to $24,999 | 567 | 10.6% |
| $25,000 to $34,999 | 486 | 9.1% |
| $35,000 to $49,999 | 497 | 9.3% |
| $50,000 to $74,999 | 861 | 16.1% |
| $75,000 to $99,999 | 914 | 17.1% |
| $100,000 to $149,999 | 812 | 15.2% |
| $150,000 to $199,999 | 283 | 5.3% |
| $200,000+ | 337 | 6.3% |
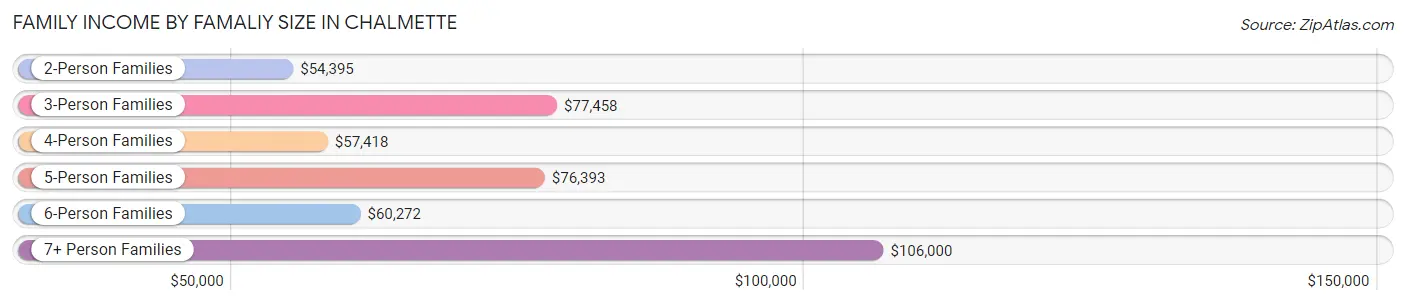
Family Income by Famaliy Size in Chalmette
7+ person families (56 | 1.1%) account for the highest median family income in Chalmette with $106,000 per family, while 2-person families (2,384 | 44.6%) have the highest median income of $27,198 per family member.
| Income Bracket | # Families | Median Income |
| 2-Person Families | 2,384 (44.6%) | $54,395 |
| 3-Person Families | 1,218 (22.8%) | $77,458 |
| 4-Person Families | 971 (18.2%) | $57,418 |
| 5-Person Families | 373 (7.0%) | $76,393 |
| 6-Person Families | 343 (6.4%) | $60,272 |
| 7+ Person Families | 56 (1.1%) | $106,000 |
| Total | 5,345 (100.0%) | $62,292 |
Family Income by Number of Earners in Chalmette
The median family income in Chalmette is $62,292, with families comprising 3+ earners (420) having the highest median family income of $120,132, while families with no earners (817) have the lowest median family income of $18,125, accounting for 7.9% and 15.3% of families, respectively.

| Number of Earners | # Families | Median Income |
| No Earners | 817 (15.3%) | $18,125 |
| 1 Earner | 2,220 (41.5%) | $45,762 |
| 2 Earners | 1,888 (35.3%) | $91,202 |
| 3+ Earners | 420 (7.9%) | $120,132 |
| Total | 5,345 (100.0%) | $62,292 |
Household Income in Chalmette
Household Income Brackets in Chalmette
With 1,241 households falling in the category, the $50,000 to $74,999 income range is the most frequent in Chalmette, accounting for 15.7% of all households. In contrast, only 348 households (4.4%) fall into the $150,000 to $199,999 income bracket, making it the least populous group.

| Income Bracket | # Households | % Households |
| Less than $10,000 | 766 | 9.7% |
| $10,000 to $14,999 | 435 | 5.5% |
| $15,000 to $24,999 | 901 | 11.4% |
| $25,000 to $34,999 | 814 | 10.3% |
| $35,000 to $49,999 | 798 | 10.1% |
| $50,000 to $74,999 | 1,241 | 15.7% |
| $75,000 to $99,999 | 1,098 | 13.9% |
| $100,000 to $149,999 | 1,067 | 13.5% |
| $150,000 to $199,999 | 348 | 4.4% |
| $200,000+ | 443 | 5.6% |
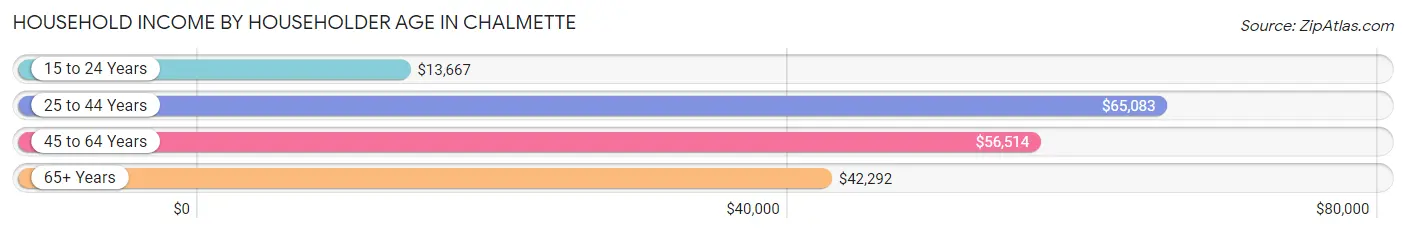
Household Income by Householder Age in Chalmette
The median household income in Chalmette is $55,655, with the highest median household income of $65,083 found in the 25 to 44 years age bracket for the primary householder. A total of 3,357 households (42.5%) fall into this category. Meanwhile, the 15 to 24 years age bracket for the primary householder has the lowest median household income of $13,667, with 104 households (1.3%) in this group.
| Income Bracket | # Households | Median Income |
| 15 to 24 Years | 104 (1.3%) | $13,667 |
| 25 to 44 Years | 3,357 (42.5%) | $65,083 |
| 45 to 64 Years | 2,919 (36.9%) | $56,514 |
| 65+ Years | 1,522 (19.3%) | $42,292 |
| Total | 7,902 (100.0%) | $55,655 |
Poverty in Chalmette
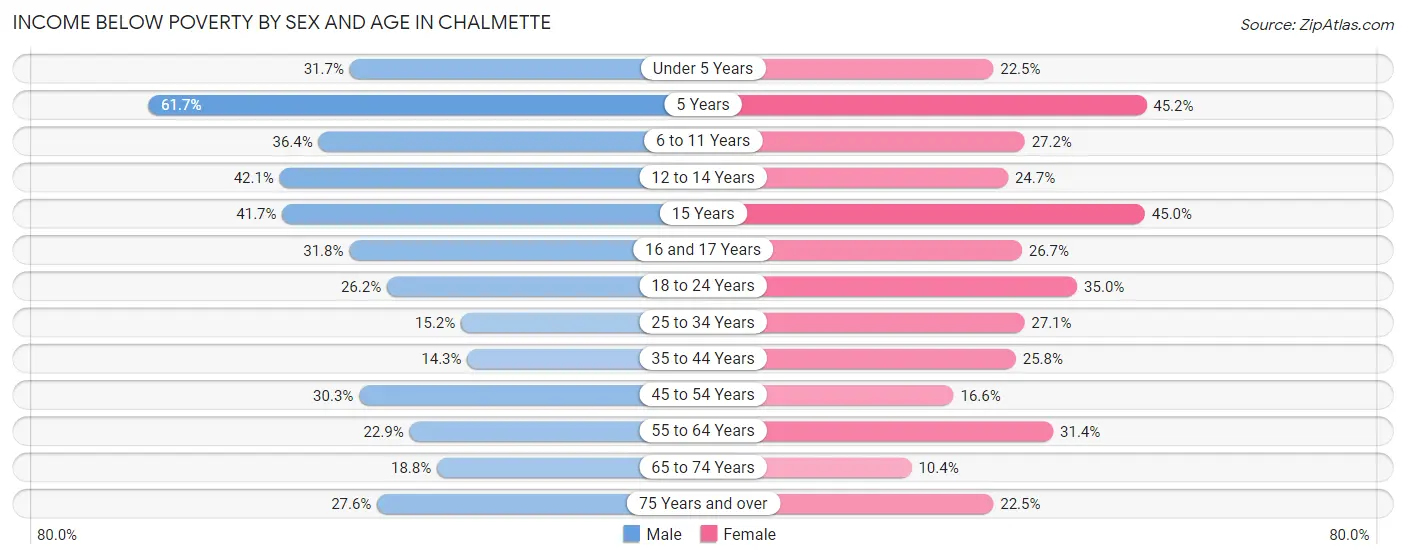
Income Below Poverty by Sex and Age in Chalmette
With 25.4% poverty level for males and 25.9% for females among the residents of Chalmette, 5 year old males and 5 year old females are the most vulnerable to poverty, with 74 males (61.7%) and 137 females (45.2%) in their respective age groups living below the poverty level.
| Age Bracket | Male | Female |
| Under 5 Years | 203 (31.7%) | 189 (22.5%) |
| 5 Years | 74 (61.7%) | 137 (45.2%) |
| 6 to 11 Years | 422 (36.3%) | 252 (27.2%) |
| 12 to 14 Years | 187 (42.1%) | 76 (24.7%) |
| 15 Years | 68 (41.7%) | 54 (45.0%) |
| 16 and 17 Years | 110 (31.8%) | 81 (26.7%) |
| 18 to 24 Years | 258 (26.2%) | 303 (34.9%) |
| 25 to 34 Years | 236 (15.2%) | 552 (27.1%) |
| 35 to 44 Years | 224 (14.2%) | 440 (25.8%) |
| 45 to 54 Years | 386 (30.3%) | 179 (16.6%) |
| 55 to 64 Years | 282 (22.9%) | 428 (31.4%) |
| 65 to 74 Years | 142 (18.8%) | 85 (10.3%) |
| 75 Years and over | 123 (27.6%) | 117 (22.5%) |
| Total | 2,715 (25.4%) | 2,893 (25.9%) |
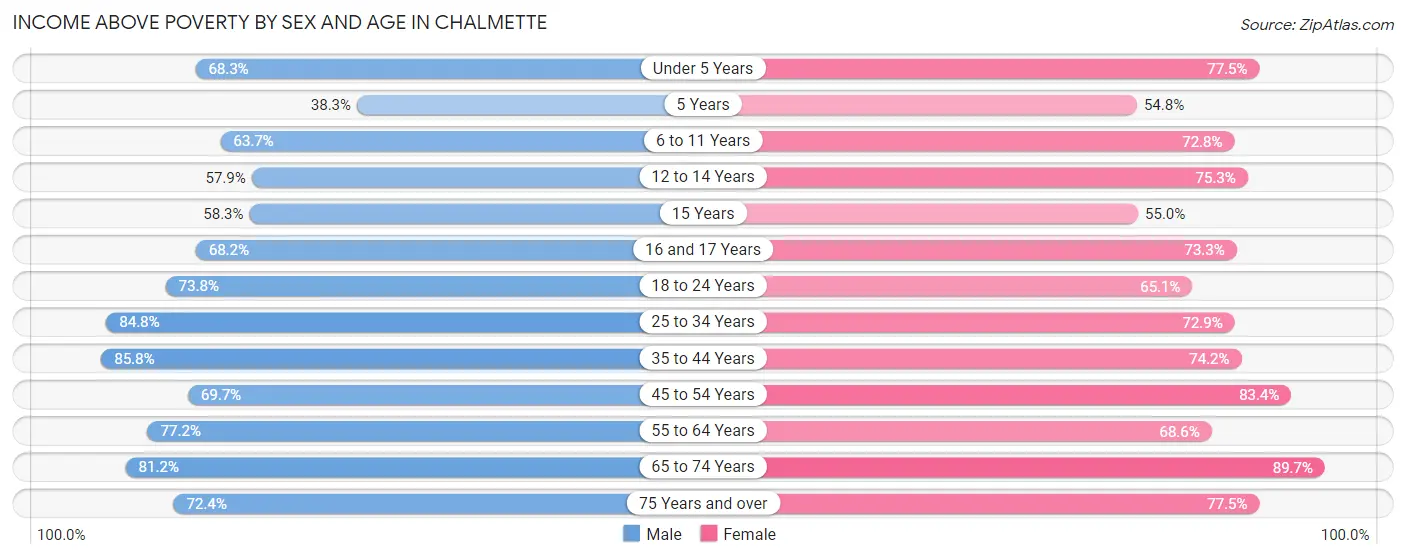
Income Above Poverty by Sex and Age in Chalmette
According to the poverty statistics in Chalmette, males aged 35 to 44 years and females aged 65 to 74 years are the age groups that are most secure financially, with 85.8% of males and 89.6% of females in these age groups living above the poverty line.
| Age Bracket | Male | Female |
| Under 5 Years | 437 (68.3%) | 651 (77.5%) |
| 5 Years | 46 (38.3%) | 166 (54.8%) |
| 6 to 11 Years | 739 (63.6%) | 676 (72.8%) |
| 12 to 14 Years | 257 (57.9%) | 232 (75.3%) |
| 15 Years | 95 (58.3%) | 66 (55.0%) |
| 16 and 17 Years | 236 (68.2%) | 222 (73.3%) |
| 18 to 24 Years | 727 (73.8%) | 564 (65.0%) |
| 25 to 34 Years | 1,319 (84.8%) | 1,484 (72.9%) |
| 35 to 44 Years | 1,348 (85.8%) | 1,263 (74.2%) |
| 45 to 54 Years | 887 (69.7%) | 900 (83.4%) |
| 55 to 64 Years | 952 (77.1%) | 936 (68.6%) |
| 65 to 74 Years | 615 (81.2%) | 736 (89.6%) |
| 75 Years and over | 322 (72.4%) | 403 (77.5%) |
| Total | 7,980 (74.6%) | 8,299 (74.2%) |
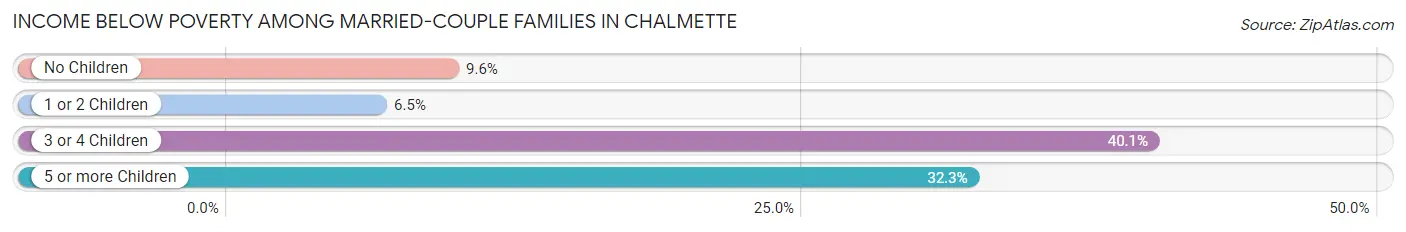
Income Below Poverty Among Married-Couple Families in Chalmette
The poverty statistics for married-couple families in Chalmette show that 12.3% or 367 of the total 2,974 families live below the poverty line. Families with 3 or 4 children have the highest poverty rate of 40.1%, comprising of 136 families. On the other hand, families with 1 or 2 children have the lowest poverty rate of 6.5%, which includes 61 families.
| Children | Above Poverty | Below Poverty |
| No Children | 1,504 (90.4%) | 160 (9.6%) |
| 1 or 2 Children | 879 (93.5%) | 61 (6.5%) |
| 3 or 4 Children | 203 (59.9%) | 136 (40.1%) |
| 5 or more Children | 21 (67.7%) | 10 (32.3%) |
| Total | 2,607 (87.7%) | 367 (12.3%) |
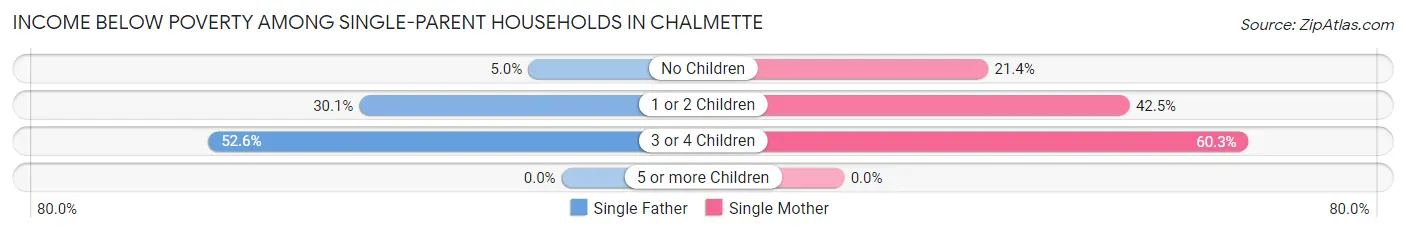
Income Below Poverty Among Single-Parent Households in Chalmette
According to the poverty data in Chalmette, 25.6% or 164 single-father households and 39.4% or 682 single-mother households are living below the poverty line. Among single-father households, those with 3 or 4 children have the highest poverty rate, with 50 households (52.6%) experiencing poverty. Likewise, among single-mother households, those with 3 or 4 children have the highest poverty rate, with 155 households (60.3%) falling below the poverty line.
| Children | Single Father | Single Mother |
| No Children | 10 (5.0%) | 101 (21.4%) |
| 1 or 2 Children | 104 (30.1%) | 426 (42.5%) |
| 3 or 4 Children | 50 (52.6%) | 155 (60.3%) |
| 5 or more Children | 0 (0.0%) | 0 (0.0%) |
| Total | 164 (25.6%) | 682 (39.4%) |
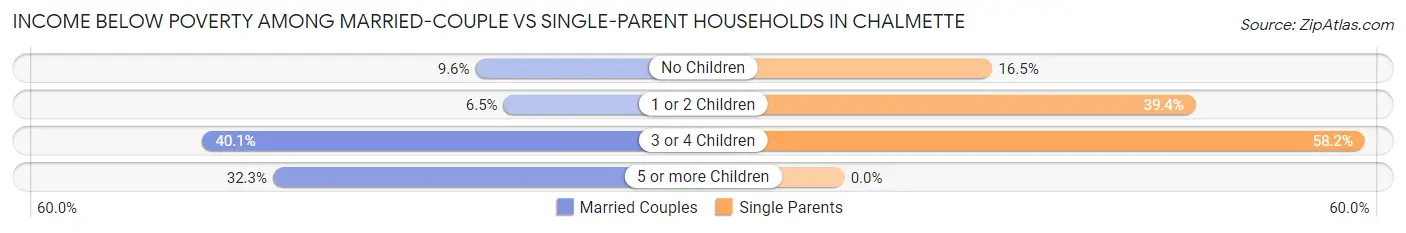
Income Below Poverty Among Married-Couple vs Single-Parent Households in Chalmette
The poverty data for Chalmette shows that 367 of the married-couple family households (12.3%) and 846 of the single-parent households (35.7%) are living below the poverty level. Within the married-couple family households, those with 3 or 4 children have the highest poverty rate, with 136 households (40.1%) falling below the poverty line. Among the single-parent households, those with 3 or 4 children have the highest poverty rate, with 205 household (58.2%) living below poverty.
| Children | Married-Couple Families | Single-Parent Households |
| No Children | 160 (9.6%) | 111 (16.5%) |
| 1 or 2 Children | 61 (6.5%) | 530 (39.4%) |
| 3 or 4 Children | 136 (40.1%) | 205 (58.2%) |
| 5 or more Children | 10 (32.3%) | 0 (0.0%) |
| Total | 367 (12.3%) | 846 (35.7%) |
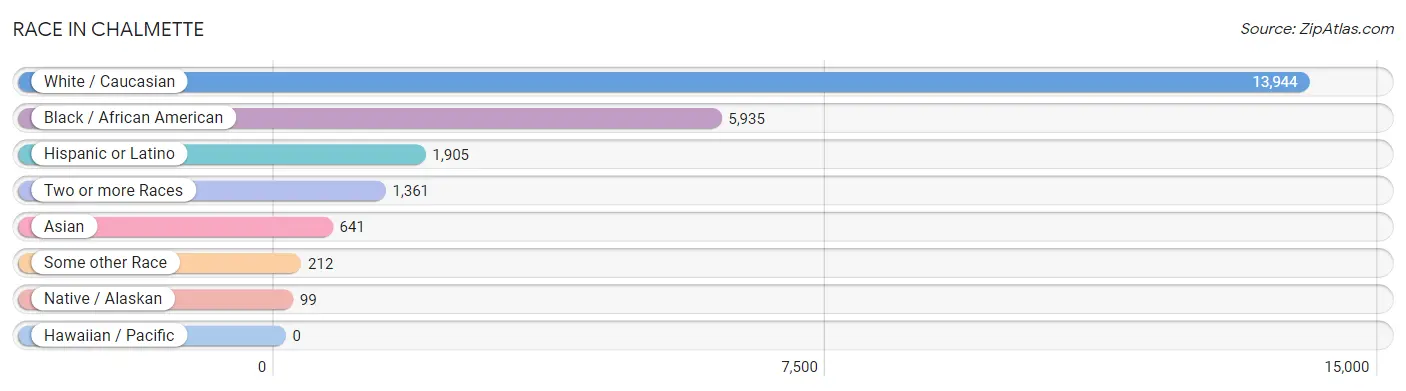
Race in Chalmette
The most populous races in Chalmette are White / Caucasian (13,944 | 62.8%), Black / African American (5,935 | 26.7%), and Hispanic or Latino (1,905 | 8.6%).
| Race | # Population | % Population |
| Asian | 641 | 2.9% |
| Black / African American | 5,935 | 26.7% |
| Hawaiian / Pacific | 0 | 0.0% |
| Hispanic or Latino | 1,905 | 8.6% |
| Native / Alaskan | 99 | 0.4% |
| White / Caucasian | 13,944 | 62.8% |
| Two or more Races | 1,361 | 6.1% |
| Some other Race | 212 | 1.0% |
| Total | 22,192 | 100.0% |
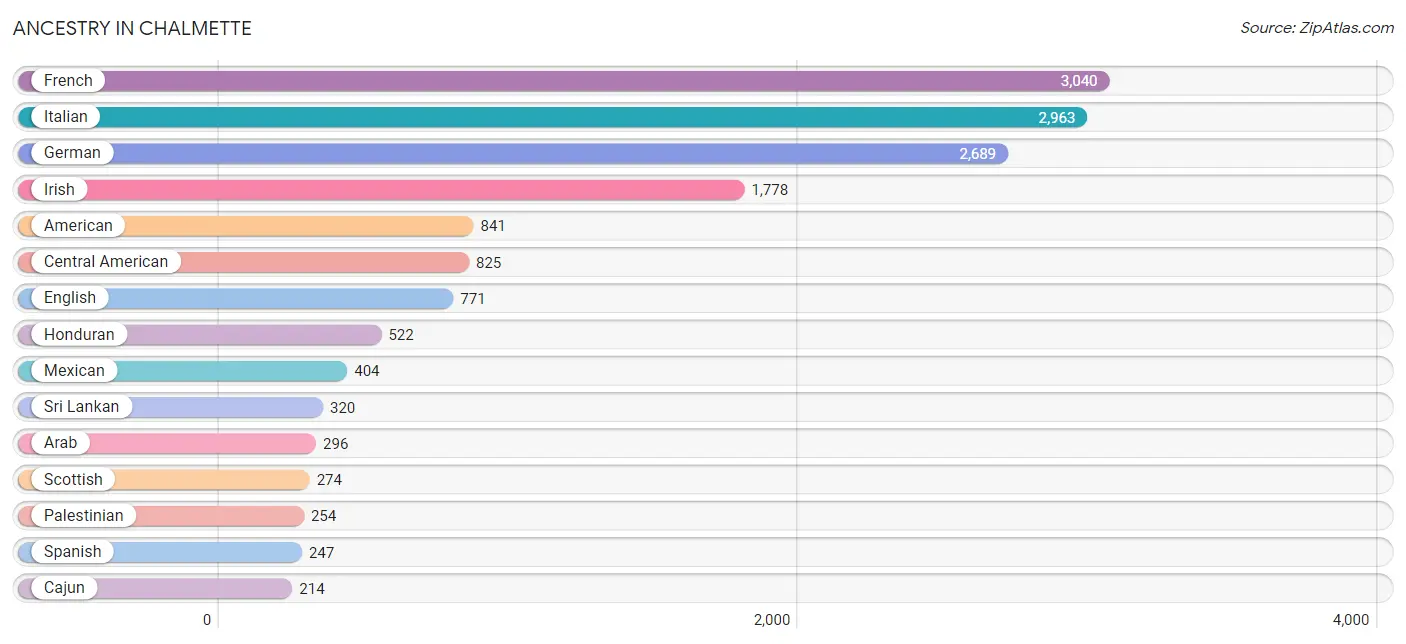
Ancestry in Chalmette
The most populous ancestries reported in Chalmette are French (3,040 | 13.7%), Italian (2,963 | 13.4%), German (2,689 | 12.1%), Irish (1,778 | 8.0%), and American (841 | 3.8%), together accounting for 51.0% of all Chalmette residents.
| Ancestry | # Population | % Population |
| African | 63 | 0.3% |
| American | 841 | 3.8% |
| Apache | 7 | 0.0% |
| Arab | 296 | 1.3% |
| Austrian | 73 | 0.3% |
| Belizean | 17 | 0.1% |
| Brazilian | 18 | 0.1% |
| British | 198 | 0.9% |
| Cajun | 214 | 1.0% |
| Central American | 825 | 3.7% |
| Cherokee | 45 | 0.2% |
| Colombian | 13 | 0.1% |
| Comanche | 13 | 0.1% |
| Costa Rican | 4 | 0.0% |
| Creek | 3 | 0.0% |
| Croatian | 3 | 0.0% |
| Cuban | 154 | 0.7% |
| Czech | 24 | 0.1% |
| Czechoslovakian | 10 | 0.1% |
| Danish | 10 | 0.1% |
| Dominican | 16 | 0.1% |
| Dutch | 66 | 0.3% |
| Ecuadorian | 24 | 0.1% |
| Egyptian | 16 | 0.1% |
| English | 771 | 3.5% |
| European | 40 | 0.2% |
| French | 3,040 | 13.7% |
| French American Indian | 27 | 0.1% |
| French Canadian | 81 | 0.4% |
| German | 2,689 | 12.1% |
| Greek | 19 | 0.1% |
| Guatemalan | 51 | 0.2% |
| Honduran | 522 | 2.4% |
| Houma | 11 | 0.1% |
| Hungarian | 6 | 0.0% |
| Icelander | 9 | 0.0% |
| Indian (Asian) | 213 | 1.0% |
| Irish | 1,778 | 8.0% |
| Italian | 2,963 | 13.4% |
| Jamaican | 19 | 0.1% |
| Japanese | 49 | 0.2% |
| Korean | 152 | 0.7% |
| Laotian | 2 | 0.0% |
| Lebanese | 26 | 0.1% |
| Malaysian | 10 | 0.1% |
| Mexican | 404 | 1.8% |
| Nicaraguan | 88 | 0.4% |
| Palestinian | 254 | 1.1% |
| Polish | 8 | 0.0% |
| Portuguese | 7 | 0.0% |
| Pueblo | 48 | 0.2% |
| Puerto Rican | 23 | 0.1% |
| Russian | 73 | 0.3% |
| Salvadoran | 160 | 0.7% |
| Scotch-Irish | 83 | 0.4% |
| Scottish | 274 | 1.2% |
| South American | 37 | 0.2% |
| Spaniard | 57 | 0.3% |
| Spanish | 247 | 1.1% |
| Sri Lankan | 320 | 1.4% |
| Subsaharan African | 87 | 0.4% |
| Swedish | 27 | 0.1% |
| Swiss | 39 | 0.2% |
| Thai | 87 | 0.4% |
| Welsh | 37 | 0.2% |
| Zimbabwean | 11 | 0.1% | View All 66 Rows |
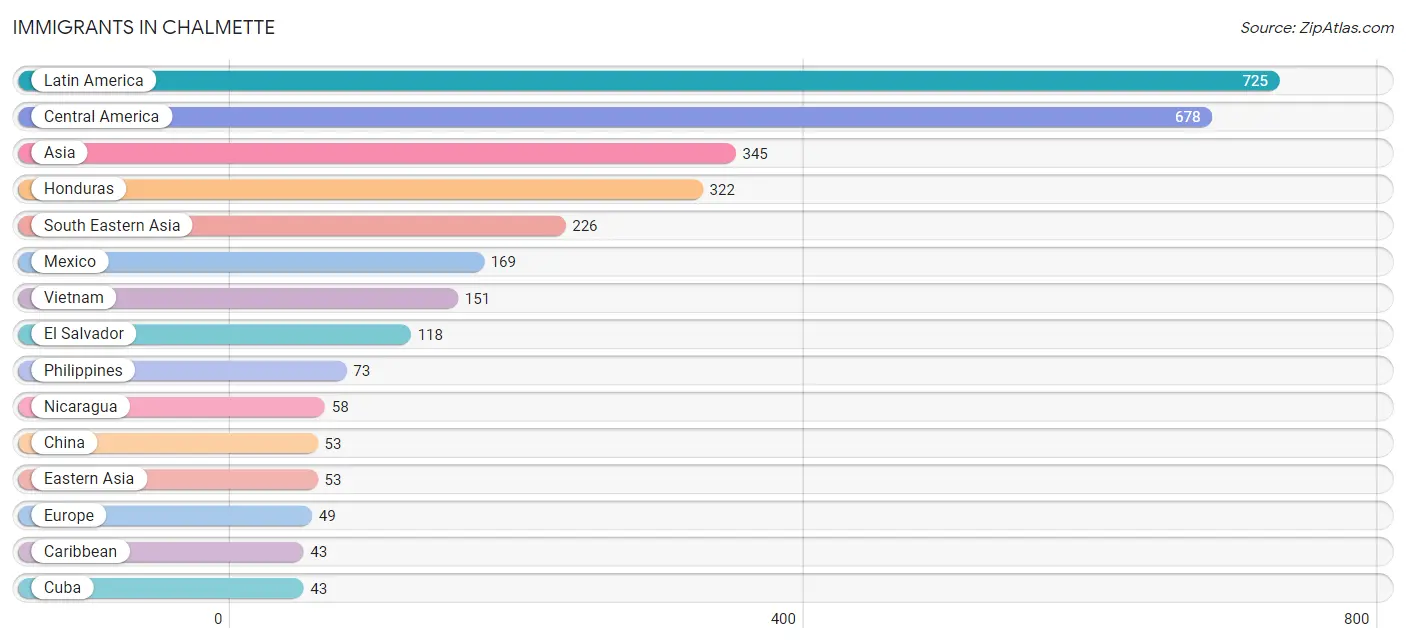
Immigrants in Chalmette
The most numerous immigrant groups reported in Chalmette came from Latin America (725 | 3.3%), Central America (678 | 3.1%), Asia (345 | 1.5%), Honduras (322 | 1.5%), and South Eastern Asia (226 | 1.0%), together accounting for 10.3% of all Chalmette residents.
| Immigration Origin | # Population | % Population |
| Africa | 23 | 0.1% |
| Asia | 345 | 1.5% |
| Canada | 8 | 0.0% |
| Caribbean | 43 | 0.2% |
| Central America | 678 | 3.1% |
| China | 53 | 0.2% |
| Colombia | 4 | 0.0% |
| Cuba | 43 | 0.2% |
| Eastern Africa | 11 | 0.1% |
| Eastern Asia | 53 | 0.2% |
| Egypt | 7 | 0.0% |
| El Salvador | 118 | 0.5% |
| Europe | 49 | 0.2% |
| France | 8 | 0.0% |
| Germany | 14 | 0.1% |
| Guatemala | 11 | 0.1% |
| Honduras | 322 | 1.5% |
| India | 10 | 0.1% |
| Indonesia | 2 | 0.0% |
| Israel | 12 | 0.1% |
| Italy | 17 | 0.1% |
| Jordan | 15 | 0.1% |
| Latin America | 725 | 3.3% |
| Mexico | 169 | 0.8% |
| Nicaragua | 58 | 0.3% |
| Northern Africa | 7 | 0.0% |
| Pakistan | 23 | 0.1% |
| Philippines | 73 | 0.3% |
| South America | 4 | 0.0% |
| South Central Asia | 33 | 0.2% |
| South Eastern Asia | 226 | 1.0% |
| Southern Europe | 17 | 0.1% |
| Vietnam | 151 | 0.7% |
| Western Africa | 5 | 0.0% |
| Western Asia | 27 | 0.1% |
| Western Europe | 22 | 0.1% |
| Zimbabwe | 11 | 0.1% | View All 37 Rows |
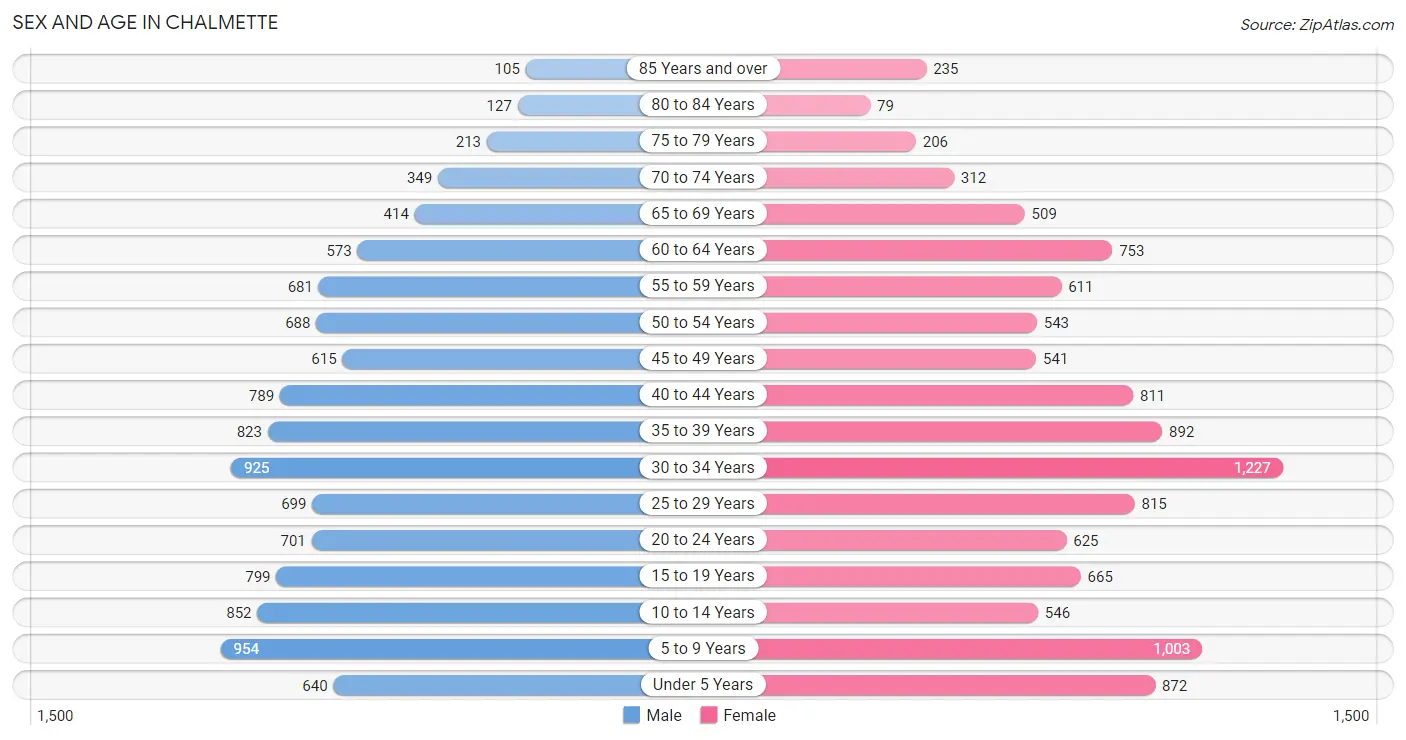
Sex and Age in Chalmette
Sex and Age in Chalmette
The most populous age groups in Chalmette are 5 to 9 Years (954 | 8.7%) for men and 30 to 34 Years (1,227 | 10.9%) for women.
| Age Bracket | Male | Female |
| Under 5 Years | 640 (5.9%) | 872 (7.7%) |
| 5 to 9 Years | 954 (8.7%) | 1,003 (8.9%) |
| 10 to 14 Years | 852 (7.8%) | 546 (4.9%) |
| 15 to 19 Years | 799 (7.3%) | 665 (5.9%) |
| 20 to 24 Years | 701 (6.4%) | 625 (5.6%) |
| 25 to 29 Years | 699 (6.4%) | 815 (7.2%) |
| 30 to 34 Years | 925 (8.5%) | 1,227 (10.9%) |
| 35 to 39 Years | 823 (7.5%) | 892 (7.9%) |
| 40 to 44 Years | 789 (7.2%) | 811 (7.2%) |
| 45 to 49 Years | 615 (5.6%) | 541 (4.8%) |
| 50 to 54 Years | 688 (6.3%) | 543 (4.8%) |
| 55 to 59 Years | 681 (6.2%) | 611 (5.4%) |
| 60 to 64 Years | 573 (5.2%) | 753 (6.7%) |
| 65 to 69 Years | 414 (3.8%) | 509 (4.5%) |
| 70 to 74 Years | 349 (3.2%) | 312 (2.8%) |
| 75 to 79 Years | 213 (1.9%) | 206 (1.8%) |
| 80 to 84 Years | 127 (1.2%) | 79 (0.7%) |
| 85 Years and over | 105 (1.0%) | 235 (2.1%) |
| Total | 10,947 (100.0%) | 11,245 (100.0%) |
Families and Households in Chalmette
Median Family Size in Chalmette
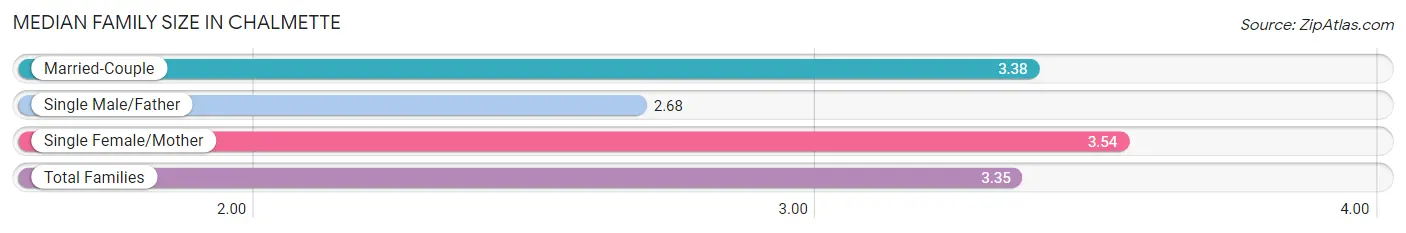
The median family size in Chalmette is 3.35 persons per family, with single female/mother families (1,730 | 32.4%) accounting for the largest median family size of 3.54 persons per family. On the other hand, single male/father families (641 | 12.0%) represent the smallest median family size with 2.68 persons per family.
| Family Type | # Families | Family Size |
| Married-Couple | 2,974 (55.6%) | 3.38 |
| Single Male/Father | 641 (12.0%) | 2.68 |
| Single Female/Mother | 1,730 (32.4%) | 3.54 |
| Total Families | 5,345 (100.0%) | 3.35 |
Median Household Size in Chalmette
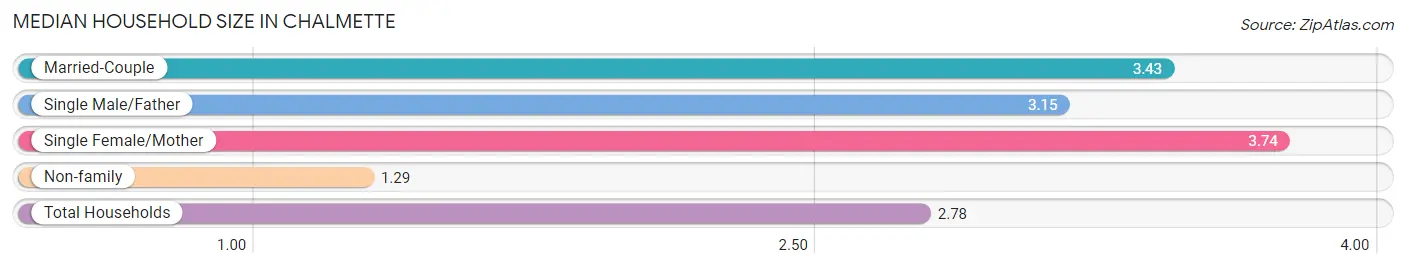
The median household size in Chalmette is 2.78 persons per household, with single female/mother households (1,730 | 21.9%) accounting for the largest median household size of 3.74 persons per household. non-family households (2,557 | 32.4%) represent the smallest median household size with 1.29 persons per household.
| Household Type | # Households | Household Size |
| Married-Couple | 2,974 (37.6%) | 3.43 |
| Single Male/Father | 641 (8.1%) | 3.15 |
| Single Female/Mother | 1,730 (21.9%) | 3.74 |
| Non-family | 2,557 (32.4%) | 1.29 |
| Total Households | 7,902 (100.0%) | 2.78 |
Household Size by Marriage Status in Chalmette
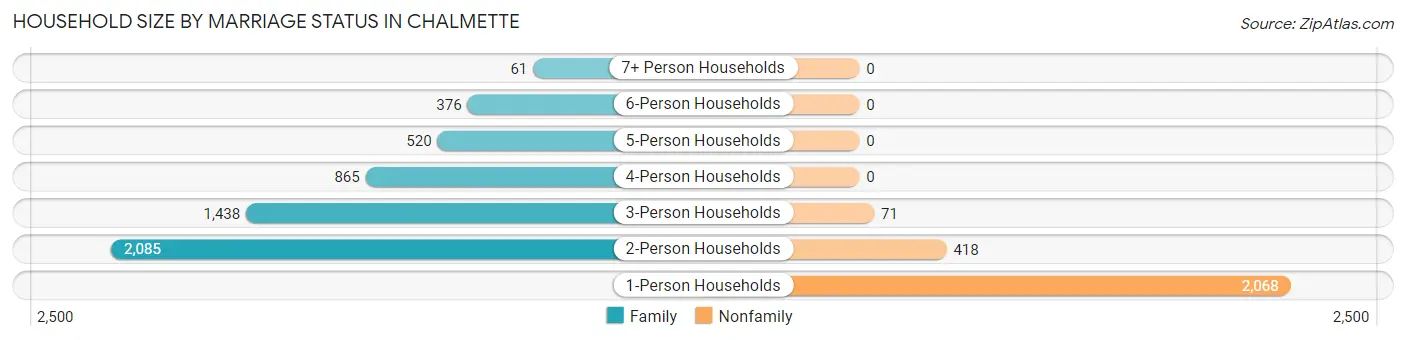
Out of a total of 7,902 households in Chalmette, 5,345 (67.6%) are family households, while 2,557 (32.4%) are nonfamily households. The most numerous type of family households are 2-person households, comprising 2,085, and the most common type of nonfamily households are 1-person households, comprising 2,068.
| Household Size | Family Households | Nonfamily Households |
| 1-Person Households | - | 2,068 (26.2%) |
| 2-Person Households | 2,085 (26.4%) | 418 (5.3%) |
| 3-Person Households | 1,438 (18.2%) | 71 (0.9%) |
| 4-Person Households | 865 (11.0%) | 0 (0.0%) |
| 5-Person Households | 520 (6.6%) | 0 (0.0%) |
| 6-Person Households | 376 (4.8%) | 0 (0.0%) |
| 7+ Person Households | 61 (0.8%) | 0 (0.0%) |
| Total | 5,345 (67.6%) | 2,557 (32.4%) |
Female Fertility in Chalmette
Fertility by Age in Chalmette
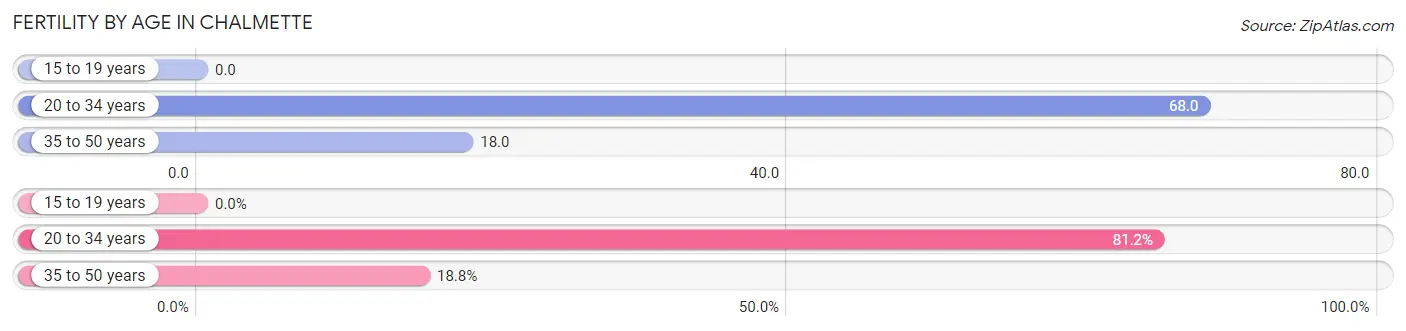
Average fertility rate in Chalmette is 39.0 births per 1,000 women. Women in the age bracket of 20 to 34 years have the highest fertility rate with 68.0 births per 1,000 women. Women in the age bracket of 20 to 34 years acount for 81.2% of all women with births.
| Age Bracket | Women with Births | Births / 1,000 Women |
| 15 to 19 years | 0 (0.0%) | 0.0 |
| 20 to 34 years | 181 (81.2%) | 68.0 |
| 35 to 50 years | 42 (18.8%) | 18.0 |
| Total | 223 (100.0%) | 39.0 |
Fertility by Age by Marriage Status in Chalmette
60.5% of women with births (223) in Chalmette are married. The highest percentage of unmarried women with births falls into 20 to 34 years age bracket with 42.0% of them unmarried at the time of birth, while the lowest percentage of unmarried women with births belong to 35 to 50 years age bracket with 28.6% of them unmarried.
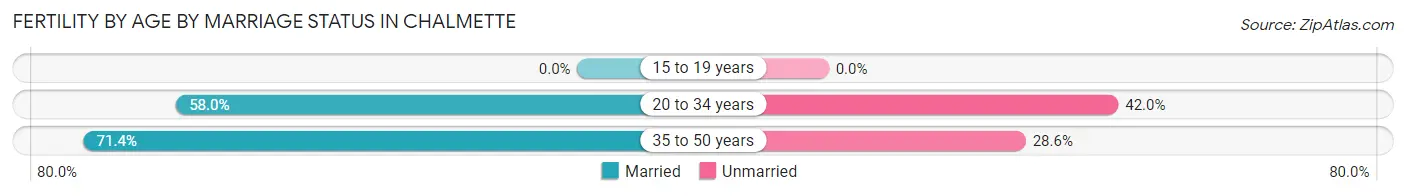
| Age Bracket | Married | Unmarried |
| 15 to 19 years | 0 (0.0%) | 0 (0.0%) |
| 20 to 34 years | 105 (58.0%) | 76 (42.0%) |
| 35 to 50 years | 30 (71.4%) | 12 (28.6%) |
| Total | 135 (60.5%) | 88 (39.5%) |
Fertility by Education in Chalmette
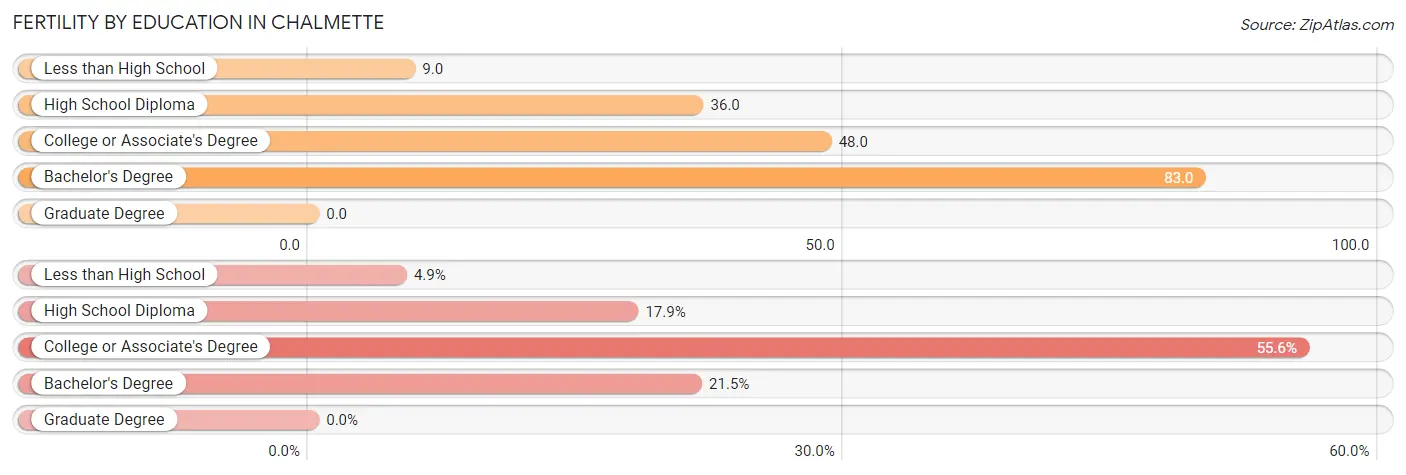
| Educational Attainment | Women with Births | Births / 1,000 Women |
| Less than High School | 11 (4.9%) | 9.0 |
| High School Diploma | 40 (17.9%) | 36.0 |
| College or Associate's Degree | 124 (55.6%) | 48.0 |
| Bachelor's Degree | 48 (21.5%) | 83.0 |
| Graduate Degree | 0 (0.0%) | 0.0 |
| Total | 223 (100.0%) | 39.0 |
Fertility by Education by Marriage Status in Chalmette
39.5% of women with births in Chalmette are unmarried. Women with the educational attainment of less than high school are most likely to be married with 100.0% of them married at childbirth, while women with the educational attainment of college or associate's degree are least likely to be married with 54.0% of them unmarried at childbirth.
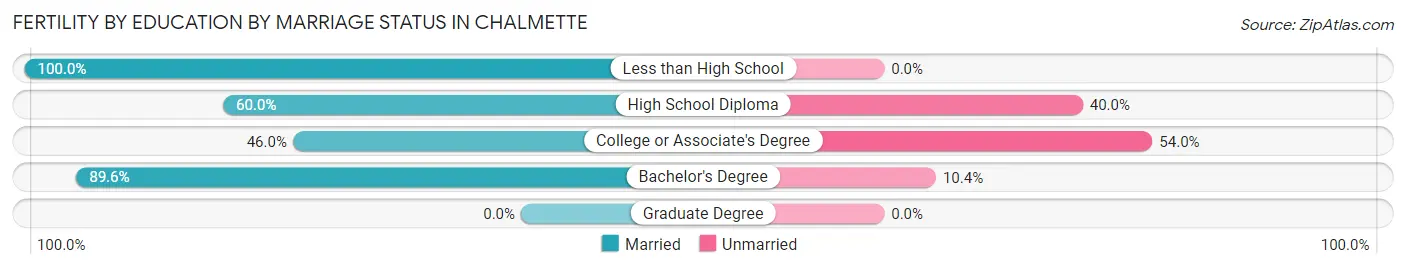
| Educational Attainment | Married | Unmarried |
| Less than High School | 11 (100.0%) | 0 (0.0%) |
| High School Diploma | 24 (60.0%) | 16 (40.0%) |
| College or Associate's Degree | 57 (46.0%) | 67 (54.0%) |
| Bachelor's Degree | 43 (89.6%) | 5 (10.4%) |
| Graduate Degree | 0 (0.0%) | 0 (0.0%) |
| Total | 135 (60.5%) | 88 (39.5%) |
Employment Characteristics in Chalmette
Employment by Class of Employer in Chalmette
Among the 9,067 employed individuals in Chalmette, private company employees (6,364 | 70.2%), local government employees (820 | 9.0%), and self-employed (not incorporated) (550 | 6.1%) make up the most common classes of employment.
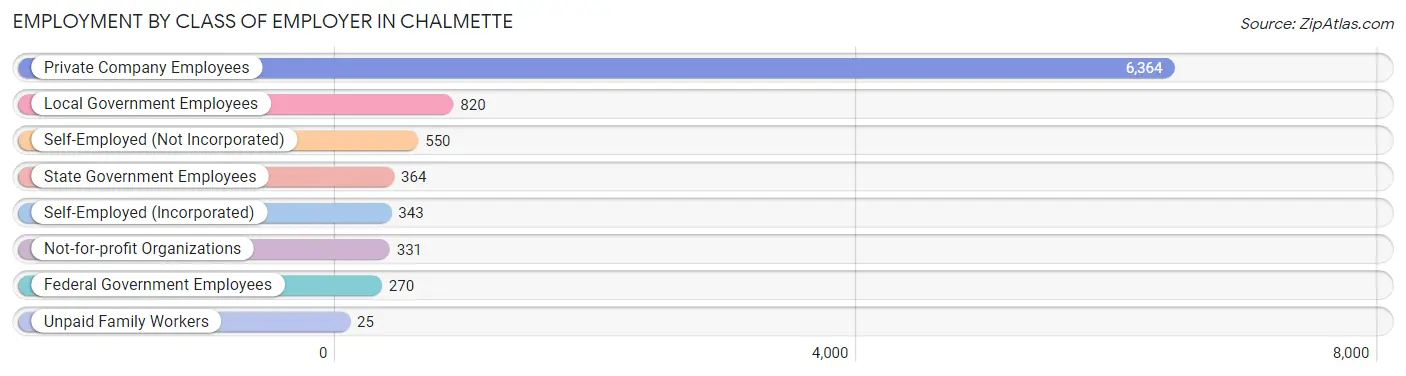
| Employer Class | # Employees | % Employees |
| Private Company Employees | 6,364 | 70.2% |
| Self-Employed (Incorporated) | 343 | 3.8% |
| Self-Employed (Not Incorporated) | 550 | 6.1% |
| Not-for-profit Organizations | 331 | 3.6% |
| Local Government Employees | 820 | 9.0% |
| State Government Employees | 364 | 4.0% |
| Federal Government Employees | 270 | 3.0% |
| Unpaid Family Workers | 25 | 0.3% |
| Total | 9,067 | 100.0% |
Employment Status by Age in Chalmette
According to the labor force statistics for Chalmette, out of the total population over 16 years of age (17,040), 60.3% or 10,275 individuals are in the labor force, with 9.5% or 976 of them unemployed. The age group with the highest labor force participation rate is 25 to 29 years, with 85.6% or 1,296 individuals in the labor force. Within the labor force, the 16 to 19 years age range has the highest percentage of unemployed individuals, with 31.8% or 102 of them being unemployed.
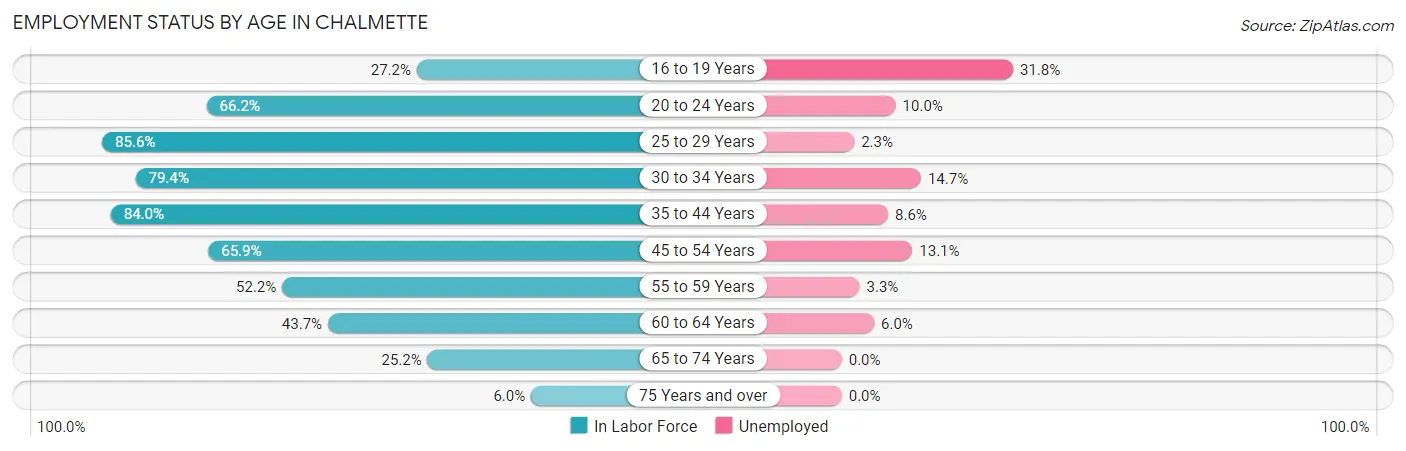
| Age Bracket | In Labor Force | Unemployed |
| 16 to 19 Years | 321 (27.2%) | 102 (31.8%) |
| 20 to 24 Years | 878 (66.2%) | 88 (10.0%) |
| 25 to 29 Years | 1,296 (85.6%) | 30 (2.3%) |
| 30 to 34 Years | 1,709 (79.4%) | 251 (14.7%) |
| 35 to 44 Years | 2,785 (84.0%) | 240 (8.6%) |
| 45 to 54 Years | 1,573 (65.9%) | 206 (13.1%) |
| 55 to 59 Years | 674 (52.2%) | 22 (3.3%) |
| 60 to 64 Years | 579 (43.7%) | 35 (6.0%) |
| 65 to 74 Years | 399 (25.2%) | 0 (0.0%) |
| 75 Years and over | 58 (6.0%) | 0 (0.0%) |
| Total | 10,275 (60.3%) | 976 (9.5%) |
Employment Status by Educational Attainment in Chalmette
According to labor force statistics for Chalmette, 71.9% of individuals (8,618) out of the total population between 25 and 64 years of age (11,986) are in the labor force, with 9.1% or 784 of them being unemployed. The group with the highest labor force participation rate are those with the educational attainment of bachelor's degree or higher, with 87.7% or 1,675 individuals in the labor force. Within the labor force, individuals with less than high school education have the highest percentage of unemployment, with 18.1% or 178 of them being unemployed.
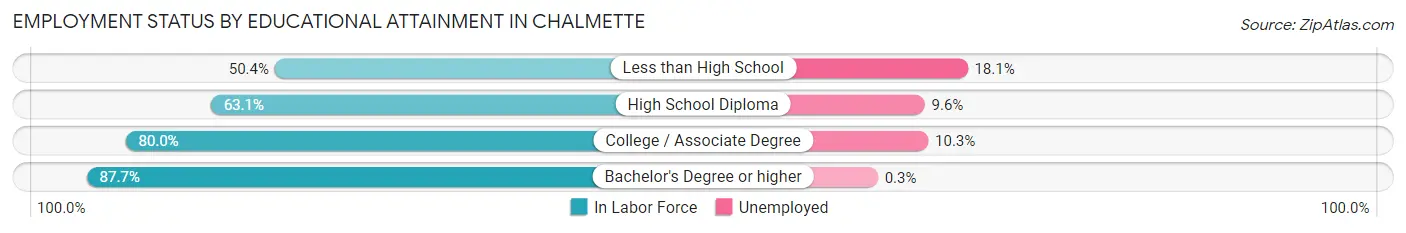
| Educational Attainment | In Labor Force | Unemployed |
| Less than High School | 984 (50.4%) | 353 (18.1%) |
| High School Diploma | 2,019 (63.1%) | 307 (9.6%) |
| College / Associate Degree | 3,938 (80.0%) | 507 (10.3%) |
| Bachelor's Degree or higher | 1,675 (87.7%) | 6 (0.3%) |
| Total | 8,618 (71.9%) | 1,091 (9.1%) |
Employment Occupations by Sex in Chalmette
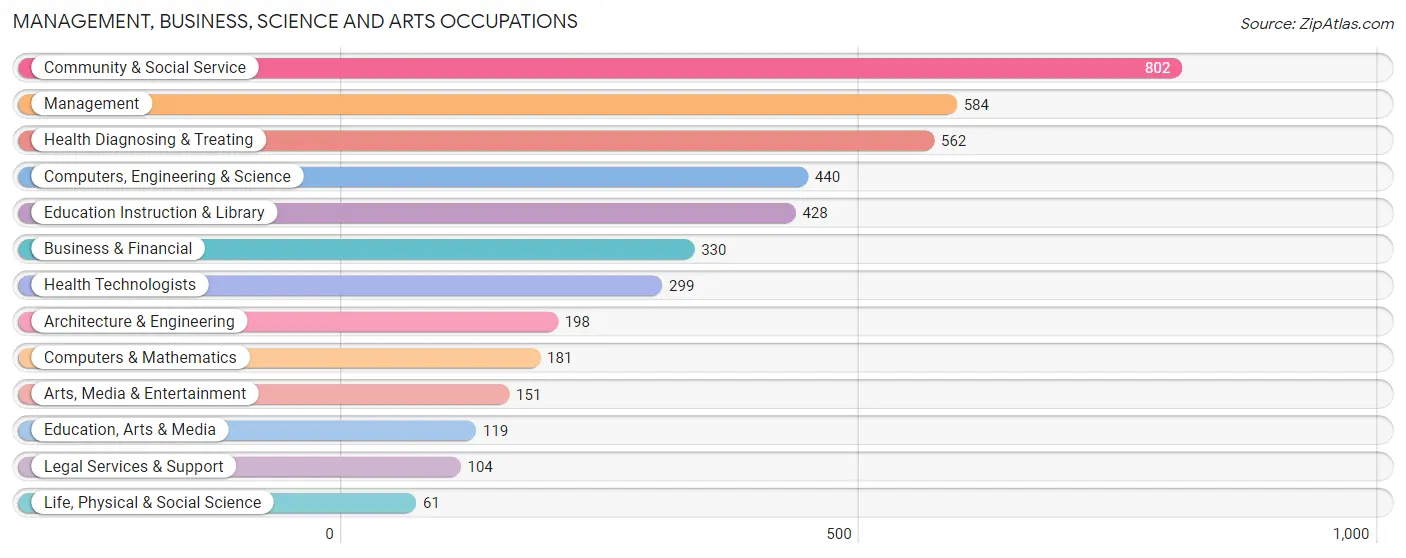
Management, Business, Science and Arts Occupations
The most common Management, Business, Science and Arts occupations in Chalmette are Community & Social Service (802 | 8.7%), Management (584 | 6.3%), Health Diagnosing & Treating (562 | 6.1%), Computers, Engineering & Science (440 | 4.8%), and Education Instruction & Library (428 | 4.6%).
Management, Business, Science and Arts Occupations by Sex
Within the Management, Business, Science and Arts occupations in Chalmette, the most male-oriented occupations are Life, Physical & Social Science (80.3%), Architecture & Engineering (70.2%), and Business & Financial (67.0%), while the most female-oriented occupations are Legal Services & Support (100.0%), Health Diagnosing & Treating (91.3%), and Education Instruction & Library (90.2%).
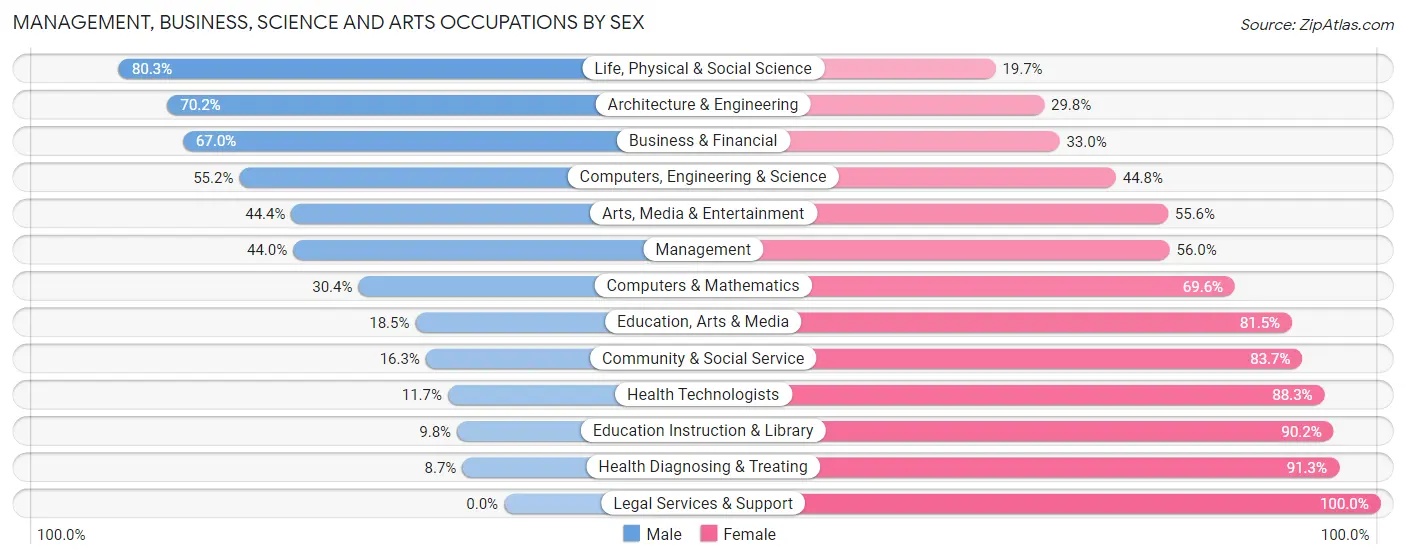
| Occupation | Male | Female |
| Management | 257 (44.0%) | 327 (56.0%) |
| Business & Financial | 221 (67.0%) | 109 (33.0%) |
| Computers, Engineering & Science | 243 (55.2%) | 197 (44.8%) |
| Computers & Mathematics | 55 (30.4%) | 126 (69.6%) |
| Architecture & Engineering | 139 (70.2%) | 59 (29.8%) |
| Life, Physical & Social Science | 49 (80.3%) | 12 (19.7%) |
| Community & Social Service | 131 (16.3%) | 671 (83.7%) |
| Education, Arts & Media | 22 (18.5%) | 97 (81.5%) |
| Legal Services & Support | 0 (0.0%) | 104 (100.0%) |
| Education Instruction & Library | 42 (9.8%) | 386 (90.2%) |
| Arts, Media & Entertainment | 67 (44.4%) | 84 (55.6%) |
| Health Diagnosing & Treating | 49 (8.7%) | 513 (91.3%) |
| Health Technologists | 35 (11.7%) | 264 (88.3%) |
| Total (Category) | 901 (33.2%) | 1,817 (66.8%) |
| Total (Overall) | 4,485 (48.4%) | 4,775 (51.6%) |
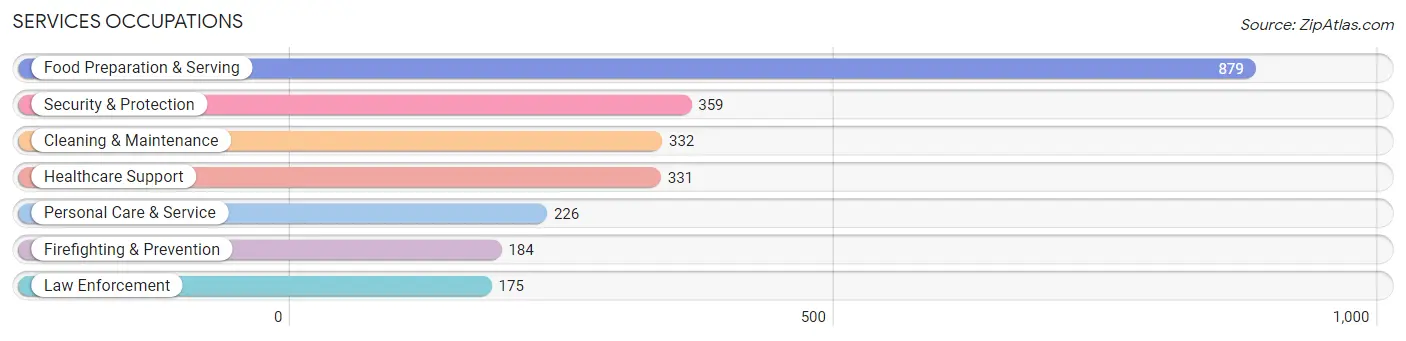
Services Occupations
The most common Services occupations in Chalmette are Food Preparation & Serving (879 | 9.5%), Security & Protection (359 | 3.9%), Cleaning & Maintenance (332 | 3.6%), Healthcare Support (331 | 3.6%), and Personal Care & Service (226 | 2.4%).
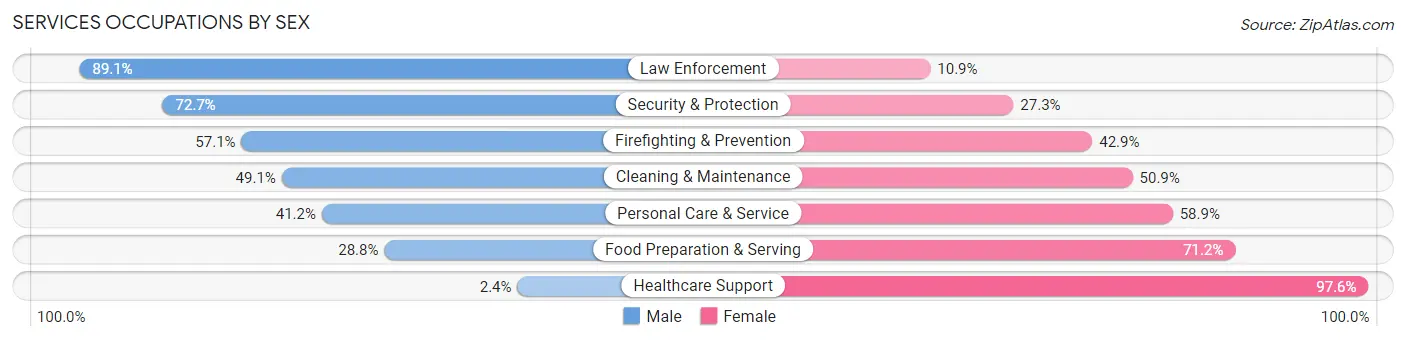
Services Occupations by Sex
Within the Services occupations in Chalmette, the most male-oriented occupations are Law Enforcement (89.1%), Security & Protection (72.7%), and Firefighting & Prevention (57.1%), while the most female-oriented occupations are Healthcare Support (97.6%), Food Preparation & Serving (71.2%), and Personal Care & Service (58.9%).
| Occupation | Male | Female |
| Healthcare Support | 8 (2.4%) | 323 (97.6%) |
| Security & Protection | 261 (72.7%) | 98 (27.3%) |
| Firefighting & Prevention | 105 (57.1%) | 79 (42.9%) |
| Law Enforcement | 156 (89.1%) | 19 (10.9%) |
| Food Preparation & Serving | 253 (28.8%) | 626 (71.2%) |
| Cleaning & Maintenance | 163 (49.1%) | 169 (50.9%) |
| Personal Care & Service | 93 (41.1%) | 133 (58.9%) |
| Total (Category) | 778 (36.6%) | 1,349 (63.4%) |
| Total (Overall) | 4,485 (48.4%) | 4,775 (51.6%) |
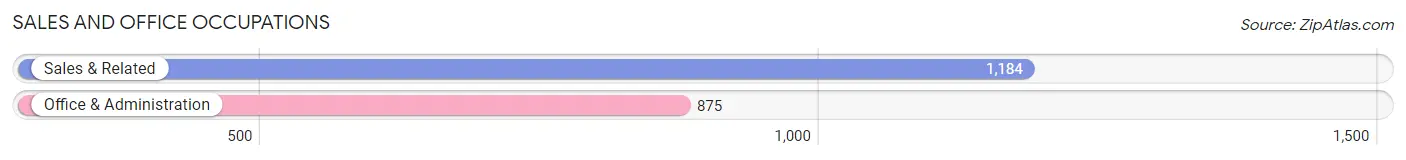
Sales and Office Occupations
The most common Sales and Office occupations in Chalmette are Sales & Related (1,184 | 12.8%), and Office & Administration (875 | 9.5%).
Sales and Office Occupations by Sex
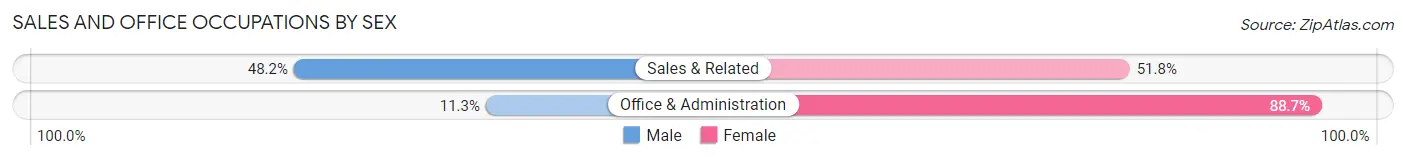
| Occupation | Male | Female |
| Sales & Related | 571 (48.2%) | 613 (51.8%) |
| Office & Administration | 99 (11.3%) | 776 (88.7%) |
| Total (Category) | 670 (32.5%) | 1,389 (67.5%) |
| Total (Overall) | 4,485 (48.4%) | 4,775 (51.6%) |
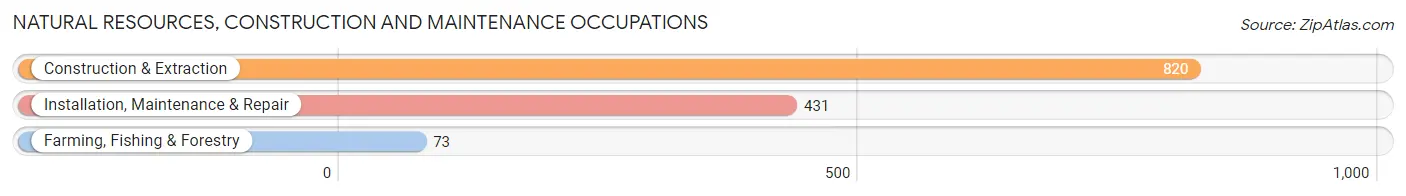
Natural Resources, Construction and Maintenance Occupations
The most common Natural Resources, Construction and Maintenance occupations in Chalmette are Construction & Extraction (820 | 8.9%), Installation, Maintenance & Repair (431 | 4.6%), and Farming, Fishing & Forestry (73 | 0.8%).
Natural Resources, Construction and Maintenance Occupations by Sex
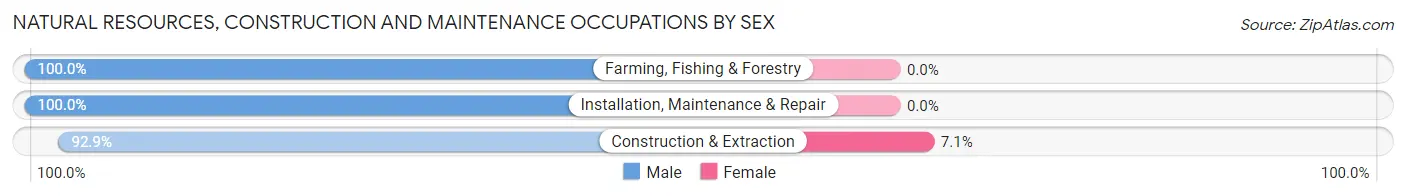
| Occupation | Male | Female |
| Farming, Fishing & Forestry | 73 (100.0%) | 0 (0.0%) |
| Construction & Extraction | 762 (92.9%) | 58 (7.1%) |
| Installation, Maintenance & Repair | 431 (100.0%) | 0 (0.0%) |
| Total (Category) | 1,266 (95.6%) | 58 (4.4%) |
| Total (Overall) | 4,485 (48.4%) | 4,775 (51.6%) |
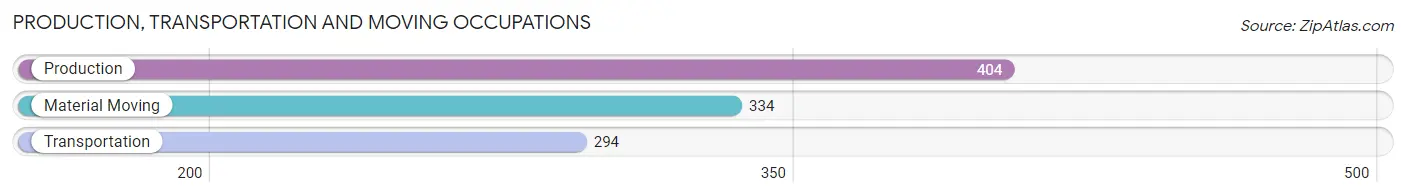
Production, Transportation and Moving Occupations
The most common Production, Transportation and Moving occupations in Chalmette are Production (404 | 4.4%), Material Moving (334 | 3.6%), and Transportation (294 | 3.2%).
Production, Transportation and Moving Occupations by Sex
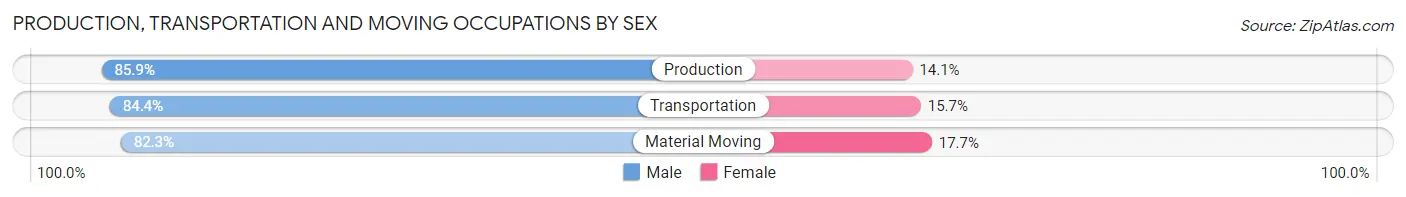
| Occupation | Male | Female |
| Production | 347 (85.9%) | 57 (14.1%) |
| Transportation | 248 (84.4%) | 46 (15.7%) |
| Material Moving | 275 (82.3%) | 59 (17.7%) |
| Total (Category) | 870 (84.3%) | 162 (15.7%) |
| Total (Overall) | 4,485 (48.4%) | 4,775 (51.6%) |
Employment Industries by Sex in Chalmette
Employment Industries in Chalmette
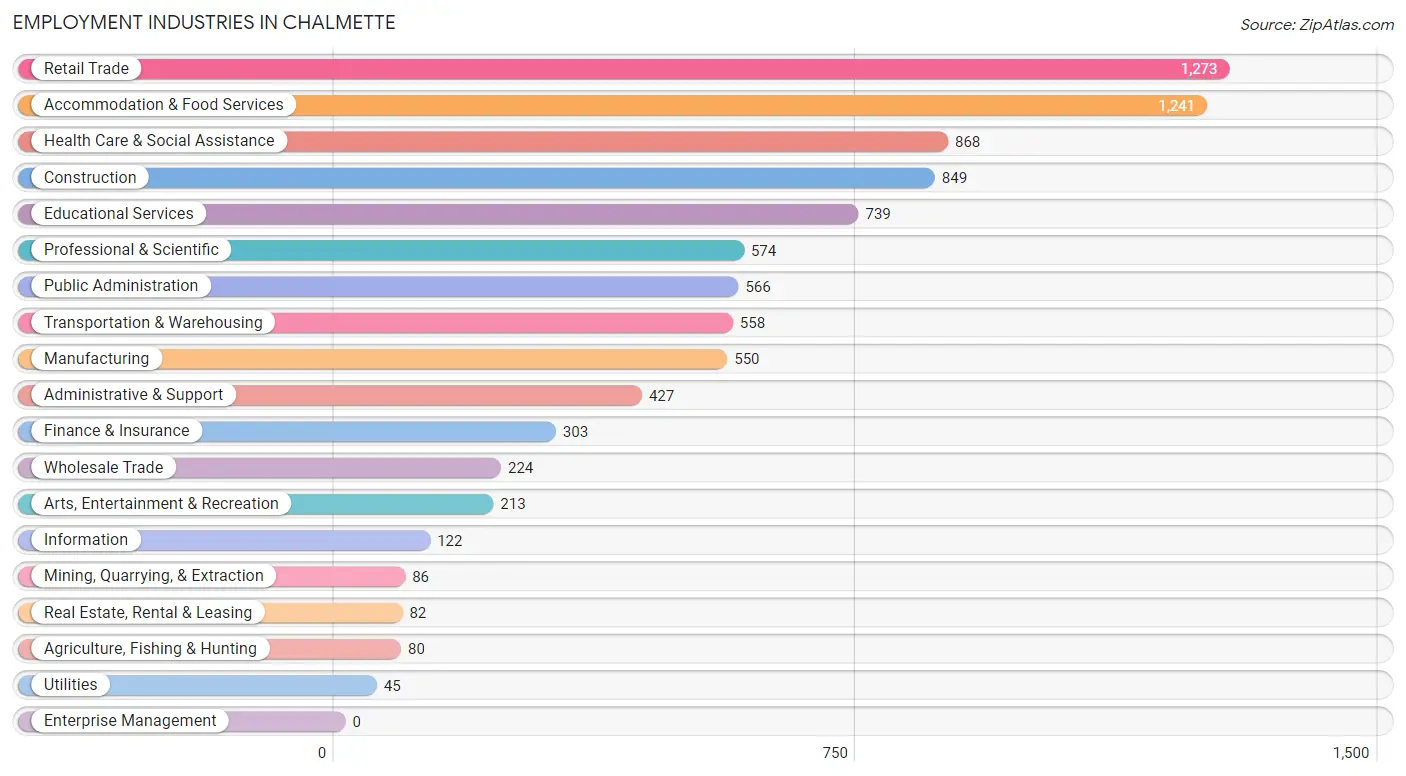
The major employment industries in Chalmette include Retail Trade (1,273 | 13.8%), Accommodation & Food Services (1,241 | 13.4%), Health Care & Social Assistance (868 | 9.4%), Construction (849 | 9.2%), and Educational Services (739 | 8.0%).
Employment Industries by Sex in Chalmette
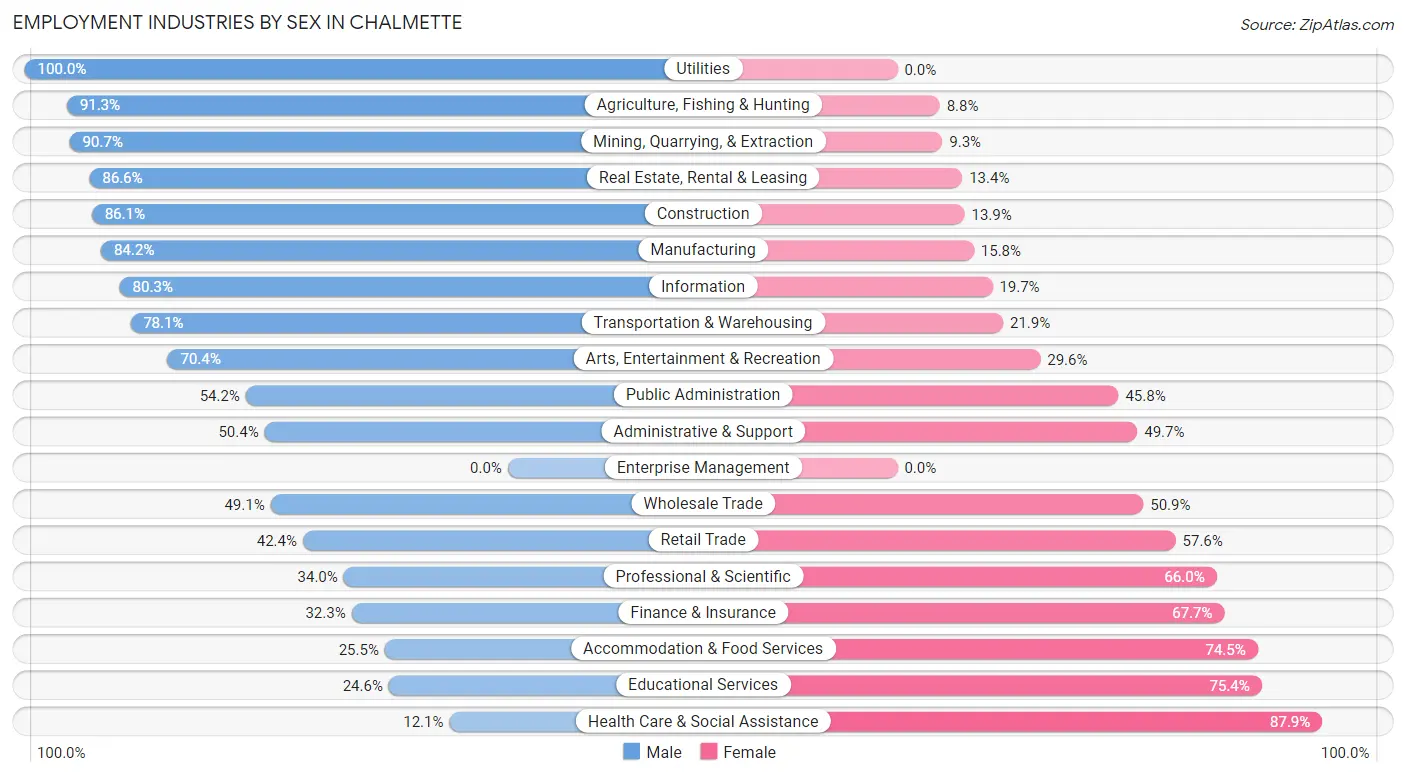
The Chalmette industries that see more men than women are Utilities (100.0%), Agriculture, Fishing & Hunting (91.2%), and Mining, Quarrying, & Extraction (90.7%), whereas the industries that tend to have a higher number of women are Health Care & Social Assistance (87.9%), Educational Services (75.4%), and Accommodation & Food Services (74.5%).
| Industry | Male | Female |
| Agriculture, Fishing & Hunting | 73 (91.2%) | 7 (8.7%) |
| Mining, Quarrying, & Extraction | 78 (90.7%) | 8 (9.3%) |
| Construction | 731 (86.1%) | 118 (13.9%) |
| Manufacturing | 463 (84.2%) | 87 (15.8%) |
| Wholesale Trade | 110 (49.1%) | 114 (50.9%) |
| Retail Trade | 540 (42.4%) | 733 (57.6%) |
| Transportation & Warehousing | 436 (78.1%) | 122 (21.9%) |
| Utilities | 45 (100.0%) | 0 (0.0%) |
| Information | 98 (80.3%) | 24 (19.7%) |
| Finance & Insurance | 98 (32.3%) | 205 (67.7%) |
| Real Estate, Rental & Leasing | 71 (86.6%) | 11 (13.4%) |
| Professional & Scientific | 195 (34.0%) | 379 (66.0%) |
| Enterprise Management | 0 (0.0%) | 0 (0.0%) |
| Administrative & Support | 215 (50.3%) | 212 (49.6%) |
| Educational Services | 182 (24.6%) | 557 (75.4%) |
| Health Care & Social Assistance | 105 (12.1%) | 763 (87.9%) |
| Arts, Entertainment & Recreation | 150 (70.4%) | 63 (29.6%) |
| Accommodation & Food Services | 316 (25.5%) | 925 (74.5%) |
| Public Administration | 307 (54.2%) | 259 (45.8%) |
| Total | 4,485 (48.4%) | 4,775 (51.6%) |
Education in Chalmette
School Enrollment in Chalmette
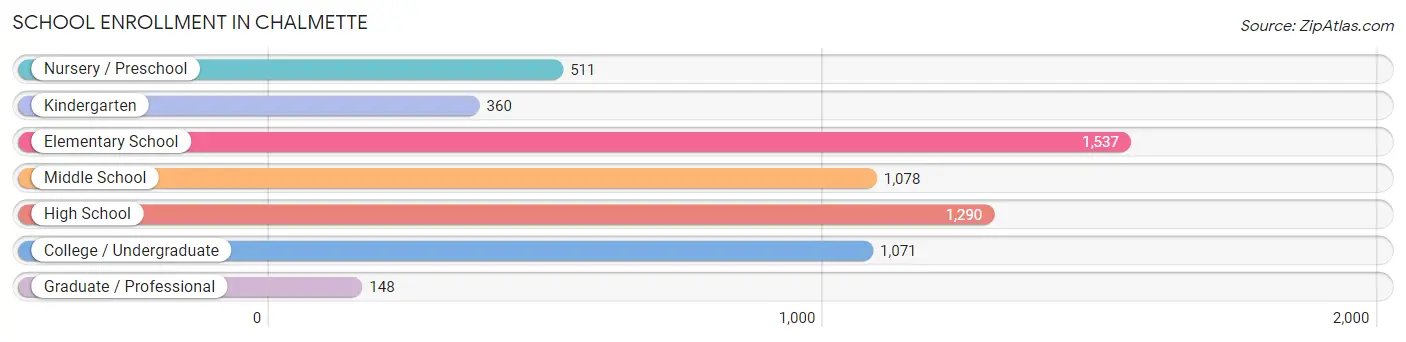
The most common levels of schooling among the 5,995 students in Chalmette are elementary school (1,537 | 25.6%), high school (1,290 | 21.5%), and middle school (1,078 | 18.0%).
| School Level | # Students | % Students |
| Nursery / Preschool | 511 | 8.5% |
| Kindergarten | 360 | 6.0% |
| Elementary School | 1,537 | 25.6% |
| Middle School | 1,078 | 18.0% |
| High School | 1,290 | 21.5% |
| College / Undergraduate | 1,071 | 17.9% |
| Graduate / Professional | 148 | 2.5% |
| Total | 5,995 | 100.0% |
School Enrollment by Age by Funding Source in Chalmette
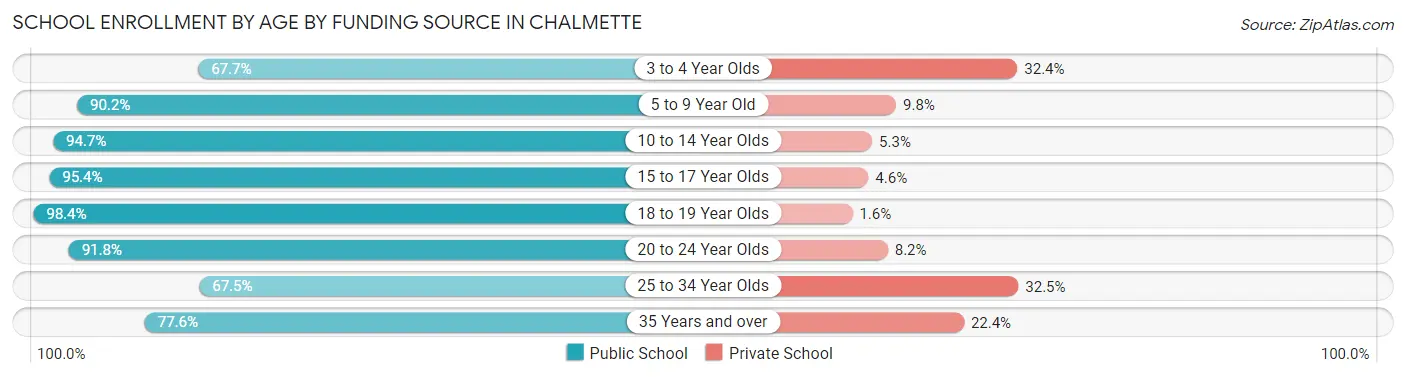
Out of a total of 5,995 students who are enrolled in schools in Chalmette, 653 (10.9%) attend a private institution, while the remaining 5,342 (89.1%) are enrolled in public schools. The age group of 25 to 34 year olds has the highest likelihood of being enrolled in private schools, with 136 (32.5% in the age bracket) enrolled. Conversely, the age group of 18 to 19 year olds has the lowest likelihood of being enrolled in a private school, with 301 (98.4% in the age bracket) attending a public institution.
| Age Bracket | Public School | Private School |
| 3 to 4 Year Olds | 230 (67.6%) | 110 (32.4%) |
| 5 to 9 Year Old | 1,681 (90.2%) | 182 (9.8%) |
| 10 to 14 Year Olds | 1,319 (94.7%) | 74 (5.3%) |
| 15 to 17 Year Olds | 889 (95.4%) | 43 (4.6%) |
| 18 to 19 Year Olds | 301 (98.4%) | 5 (1.6%) |
| 20 to 24 Year Olds | 391 (91.8%) | 35 (8.2%) |
| 25 to 34 Year Olds | 282 (67.5%) | 136 (32.5%) |
| 35 Years and over | 246 (77.6%) | 71 (22.4%) |
| Total | 5,342 (89.1%) | 653 (10.9%) |
Educational Attainment by Field of Study in Chalmette
Business (514 | 21.9%), education (424 | 18.1%), engineering (177 | 7.5%), science & technology (171 | 7.3%), and bio, nature & agricultural (154 | 6.6%) are the most common fields of study among 2,347 individuals in Chalmette who have obtained a bachelor's degree or higher.
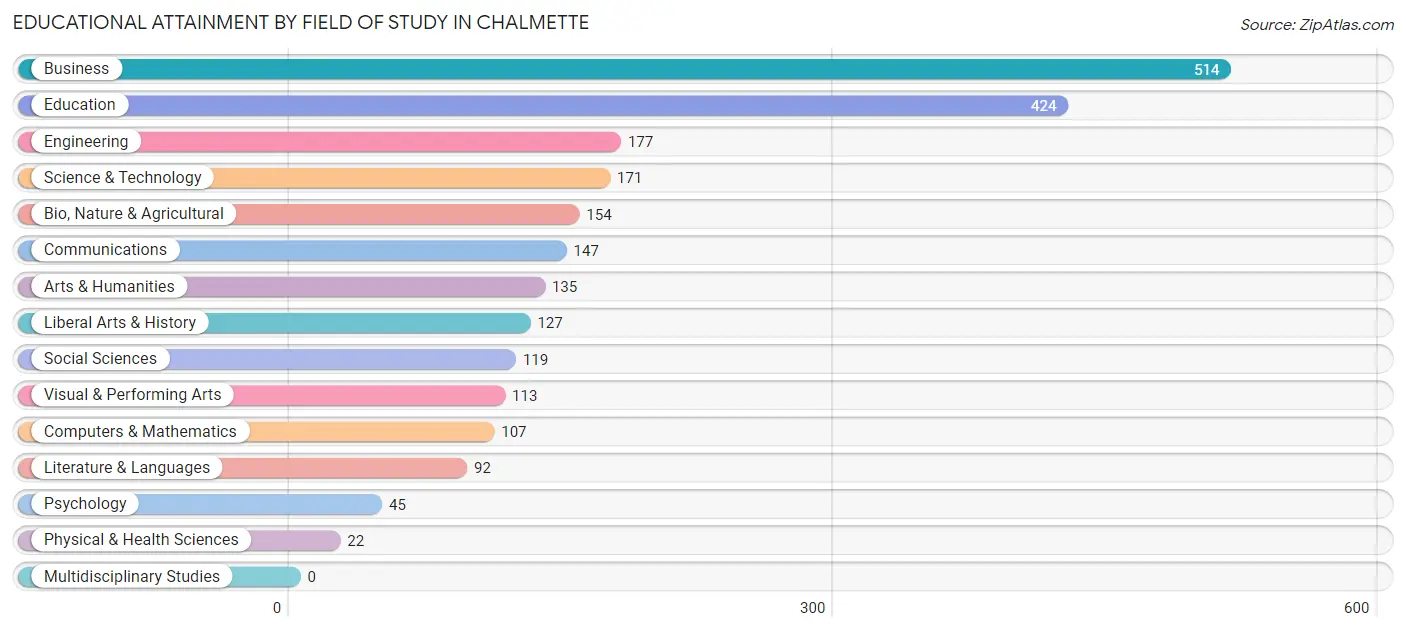
| Field of Study | # Graduates | % Graduates |
| Computers & Mathematics | 107 | 4.6% |
| Bio, Nature & Agricultural | 154 | 6.6% |
| Physical & Health Sciences | 22 | 0.9% |
| Psychology | 45 | 1.9% |
| Social Sciences | 119 | 5.1% |
| Engineering | 177 | 7.5% |
| Multidisciplinary Studies | 0 | 0.0% |
| Science & Technology | 171 | 7.3% |
| Business | 514 | 21.9% |
| Education | 424 | 18.1% |
| Literature & Languages | 92 | 3.9% |
| Liberal Arts & History | 127 | 5.4% |
| Visual & Performing Arts | 113 | 4.8% |
| Communications | 147 | 6.3% |
| Arts & Humanities | 135 | 5.8% |
| Total | 2,347 | 100.0% |
Transportation & Commute in Chalmette
Vehicle Availability by Sex in Chalmette
The most prevalent vehicle ownership categories in Chalmette are males with 2 vehicles (2,286, accounting for 51.6%) and females with 2 vehicles (2,069, making up 49.3%).
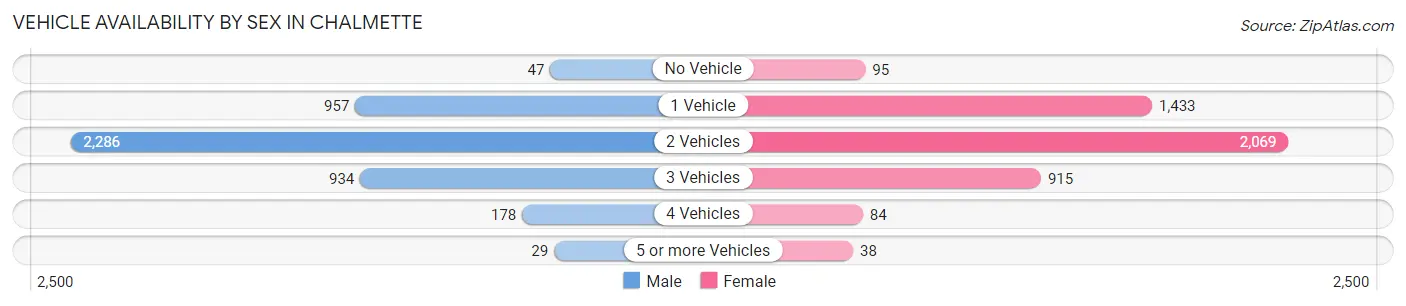
| Vehicles Available | Male | Female |
| No Vehicle | 47 (1.1%) | 95 (2.1%) |
| 1 Vehicle | 957 (21.6%) | 1,433 (30.9%) |
| 2 Vehicles | 2,286 (51.6%) | 2,069 (44.7%) |
| 3 Vehicles | 934 (21.1%) | 915 (19.8%) |
| 4 Vehicles | 178 (4.0%) | 84 (1.8%) |
| 5 or more Vehicles | 29 (0.6%) | 38 (0.8%) |
| Total | 4,431 (100.0%) | 4,634 (100.0%) |
Commute Time in Chalmette
The most frequently occuring commute durations in Chalmette are 30 to 34 minutes (1,558 commuters, 18.1%), 10 to 14 minutes (1,160 commuters, 13.5%), and 45 to 59 minutes (1,020 commuters, 11.9%).
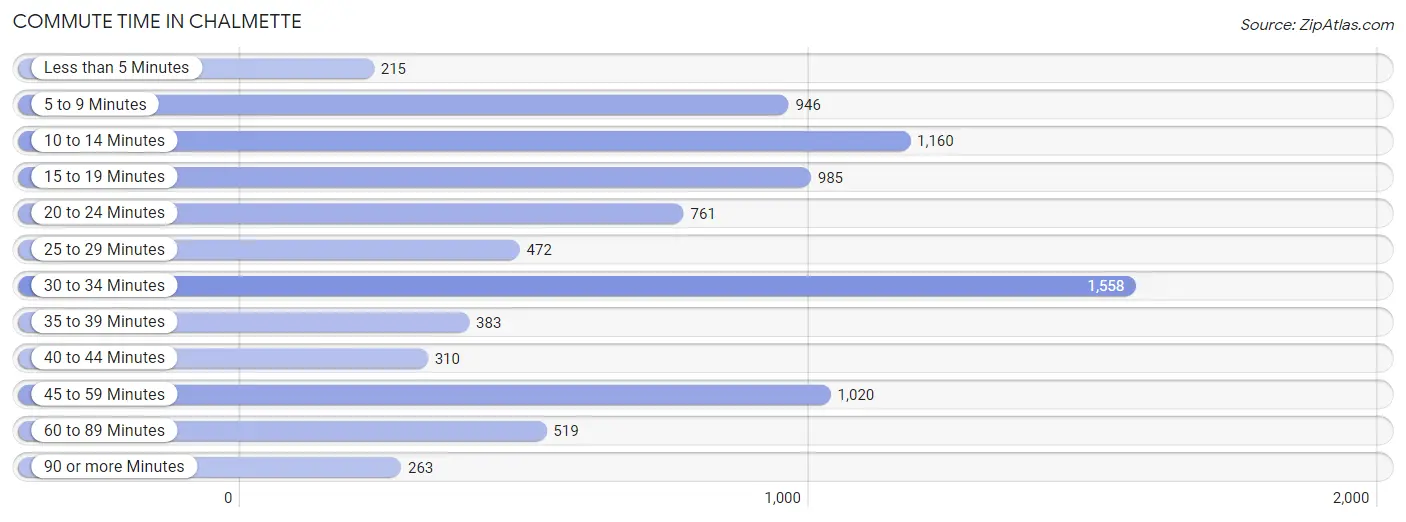
| Commute Time | # Commuters | % Commuters |
| Less than 5 Minutes | 215 | 2.5% |
| 5 to 9 Minutes | 946 | 11.0% |
| 10 to 14 Minutes | 1,160 | 13.5% |
| 15 to 19 Minutes | 985 | 11.5% |
| 20 to 24 Minutes | 761 | 8.9% |
| 25 to 29 Minutes | 472 | 5.5% |
| 30 to 34 Minutes | 1,558 | 18.1% |
| 35 to 39 Minutes | 383 | 4.5% |
| 40 to 44 Minutes | 310 | 3.6% |
| 45 to 59 Minutes | 1,020 | 11.9% |
| 60 to 89 Minutes | 519 | 6.0% |
| 90 or more Minutes | 263 | 3.1% |
Commute Time by Sex in Chalmette
The most common commute times in Chalmette are 10 to 14 minutes (660 commuters, 15.3%) for males and 30 to 34 minutes (910 commuters, 21.3%) for females.
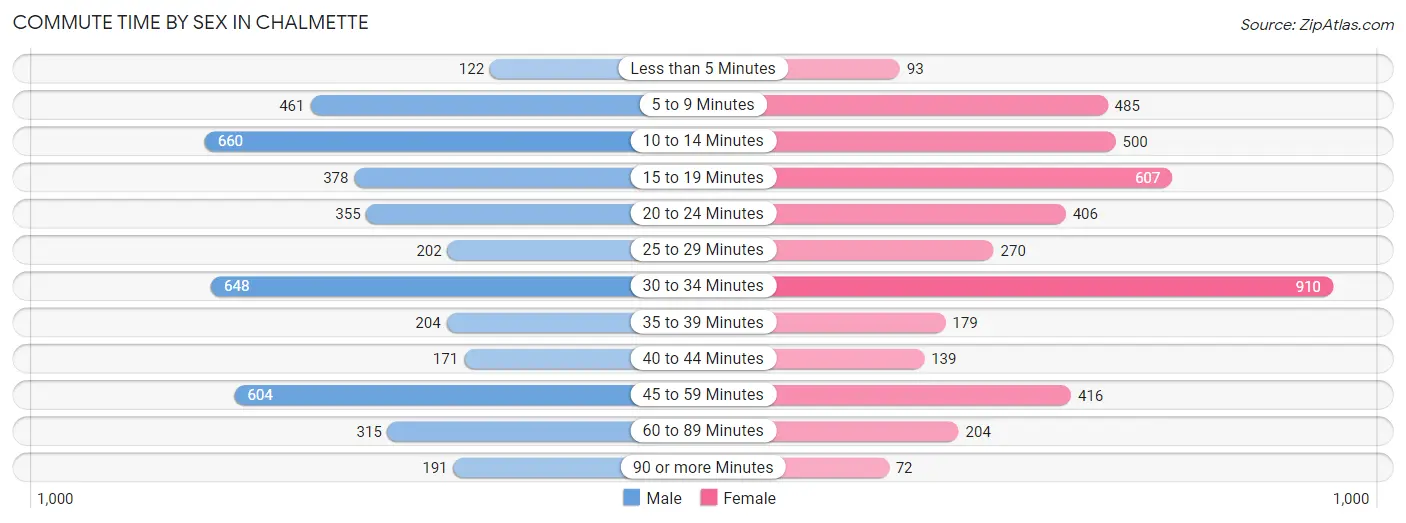
| Commute Time | Male | Female |
| Less than 5 Minutes | 122 (2.8%) | 93 (2.2%) |
| 5 to 9 Minutes | 461 (10.7%) | 485 (11.3%) |
| 10 to 14 Minutes | 660 (15.3%) | 500 (11.7%) |
| 15 to 19 Minutes | 378 (8.8%) | 607 (14.2%) |
| 20 to 24 Minutes | 355 (8.2%) | 406 (9.5%) |
| 25 to 29 Minutes | 202 (4.7%) | 270 (6.3%) |
| 30 to 34 Minutes | 648 (15.0%) | 910 (21.3%) |
| 35 to 39 Minutes | 204 (4.7%) | 179 (4.2%) |
| 40 to 44 Minutes | 171 (4.0%) | 139 (3.3%) |
| 45 to 59 Minutes | 604 (14.0%) | 416 (9.7%) |
| 60 to 89 Minutes | 315 (7.3%) | 204 (4.8%) |
| 90 or more Minutes | 191 (4.4%) | 72 (1.7%) |
Time of Departure to Work by Sex in Chalmette
The most frequent times of departure to work in Chalmette are 8:00 AM to 8:29 AM (661, 15.3%) for males and 7:00 AM to 7:29 AM (830, 19.4%) for females.
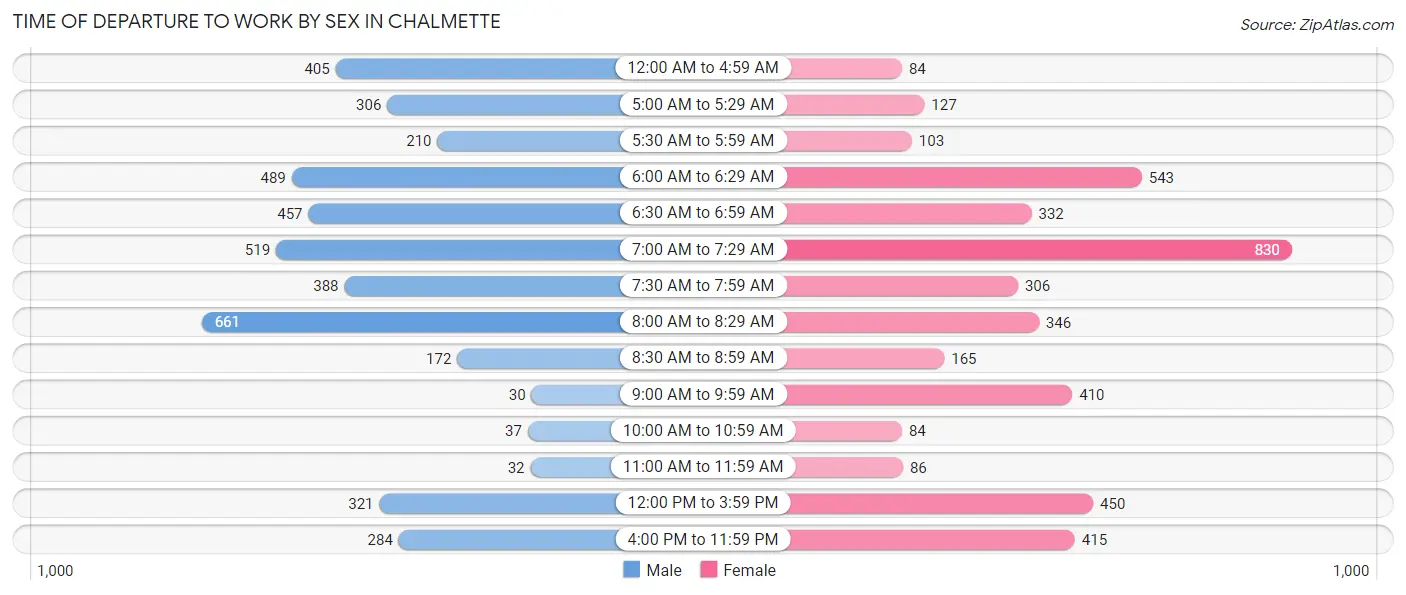
| Time of Departure | Male | Female |
| 12:00 AM to 4:59 AM | 405 (9.4%) | 84 (2.0%) |
| 5:00 AM to 5:29 AM | 306 (7.1%) | 127 (3.0%) |
| 5:30 AM to 5:59 AM | 210 (4.9%) | 103 (2.4%) |
| 6:00 AM to 6:29 AM | 489 (11.3%) | 543 (12.7%) |
| 6:30 AM to 6:59 AM | 457 (10.6%) | 332 (7.8%) |
| 7:00 AM to 7:29 AM | 519 (12.0%) | 830 (19.4%) |
| 7:30 AM to 7:59 AM | 388 (9.0%) | 306 (7.1%) |
| 8:00 AM to 8:29 AM | 661 (15.3%) | 346 (8.1%) |
| 8:30 AM to 8:59 AM | 172 (4.0%) | 165 (3.8%) |
| 9:00 AM to 9:59 AM | 30 (0.7%) | 410 (9.6%) |
| 10:00 AM to 10:59 AM | 37 (0.9%) | 84 (2.0%) |
| 11:00 AM to 11:59 AM | 32 (0.7%) | 86 (2.0%) |
| 12:00 PM to 3:59 PM | 321 (7.4%) | 450 (10.5%) |
| 4:00 PM to 11:59 PM | 284 (6.6%) | 415 (9.7%) |
| Total | 4,311 (100.0%) | 4,281 (100.0%) |
Housing Occupancy in Chalmette
Occupancy by Ownership in Chalmette
Of the total 7,902 dwellings in Chalmette, owner-occupied units account for 4,849 (61.4%), while renter-occupied units make up 3,053 (38.6%).
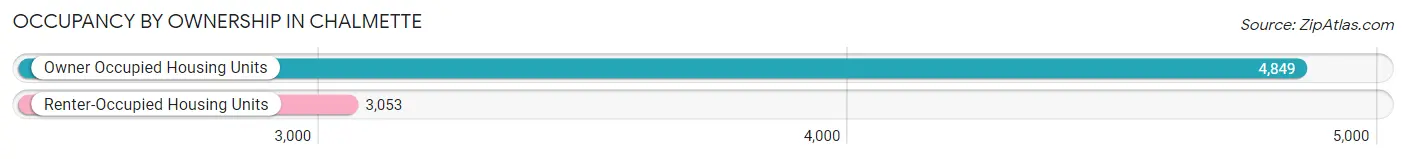
| Occupancy | # Housing Units | % Housing Units |
| Owner Occupied Housing Units | 4,849 | 61.4% |
| Renter-Occupied Housing Units | 3,053 | 38.6% |
| Total Occupied Housing Units | 7,902 | 100.0% |
Occupancy by Household Size in Chalmette
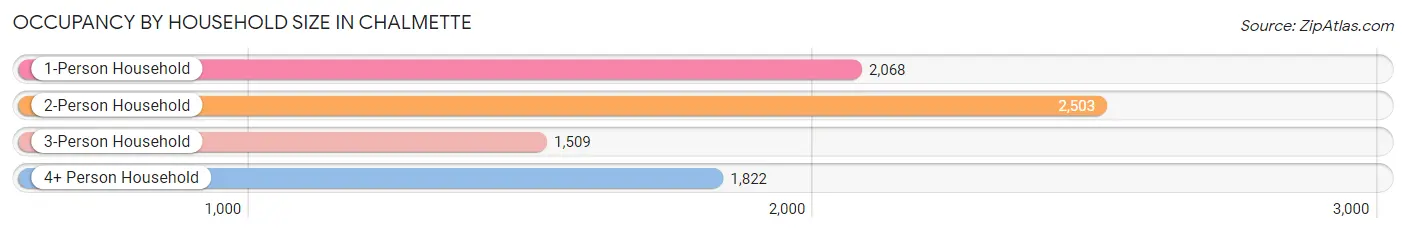
| Household Size | # Housing Units | % Housing Units |
| 1-Person Household | 2,068 | 26.2% |
| 2-Person Household | 2,503 | 31.7% |
| 3-Person Household | 1,509 | 19.1% |
| 4+ Person Household | 1,822 | 23.1% |
| Total Housing Units | 7,902 | 100.0% |
Occupancy by Ownership by Household Size in Chalmette
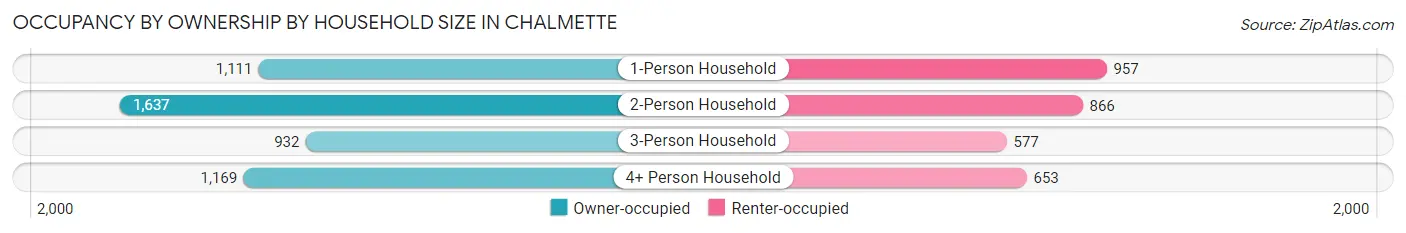
| Household Size | Owner-occupied | Renter-occupied |
| 1-Person Household | 1,111 (53.7%) | 957 (46.3%) |
| 2-Person Household | 1,637 (65.4%) | 866 (34.6%) |
| 3-Person Household | 932 (61.8%) | 577 (38.2%) |
| 4+ Person Household | 1,169 (64.2%) | 653 (35.8%) |
| Total Housing Units | 4,849 (61.4%) | 3,053 (38.6%) |
Occupancy by Educational Attainment in Chalmette
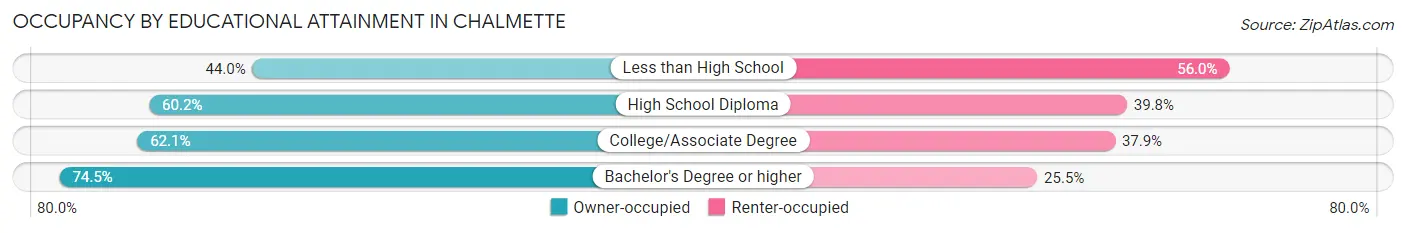
| Household Size | Owner-occupied | Renter-occupied |
| Less than High School | 473 (44.0%) | 602 (56.0%) |
| High School Diploma | 1,230 (60.2%) | 812 (39.8%) |
| College/Associate Degree | 2,102 (62.1%) | 1,281 (37.9%) |
| Bachelor's Degree or higher | 1,044 (74.5%) | 358 (25.5%) |
Occupancy by Age of Householder in Chalmette
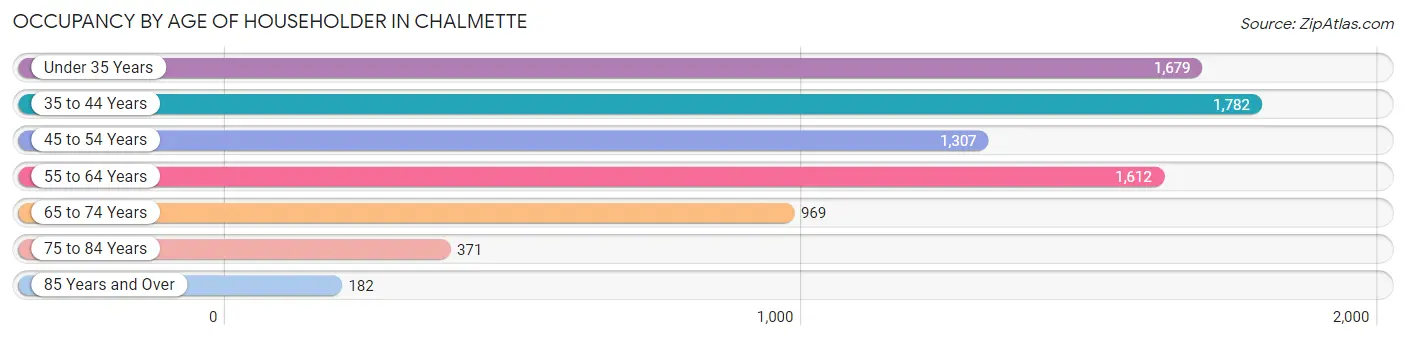
| Age Bracket | # Households | % Households |
| Under 35 Years | 1,679 | 21.2% |
| 35 to 44 Years | 1,782 | 22.6% |
| 45 to 54 Years | 1,307 | 16.5% |
| 55 to 64 Years | 1,612 | 20.4% |
| 65 to 74 Years | 969 | 12.3% |
| 75 to 84 Years | 371 | 4.7% |
| 85 Years and Over | 182 | 2.3% |
| Total | 7,902 | 100.0% |
Housing Finances in Chalmette
Median Income by Occupancy in Chalmette
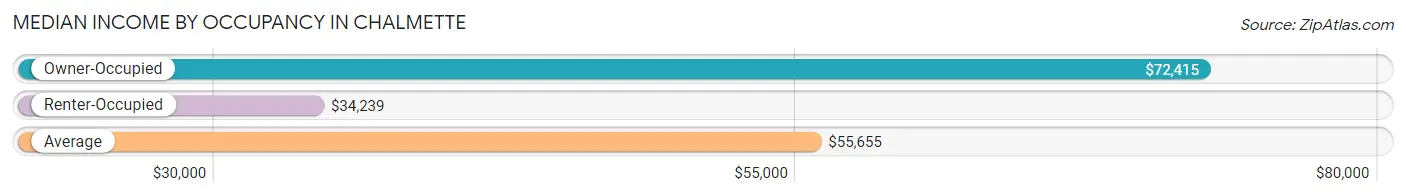
| Occupancy Type | # Households | Median Income |
| Owner-Occupied | 4,849 (61.4%) | $72,415 |
| Renter-Occupied | 3,053 (38.6%) | $34,239 |
| Average | 7,902 (100.0%) | $55,655 |
Occupancy by Householder Income Bracket in Chalmette
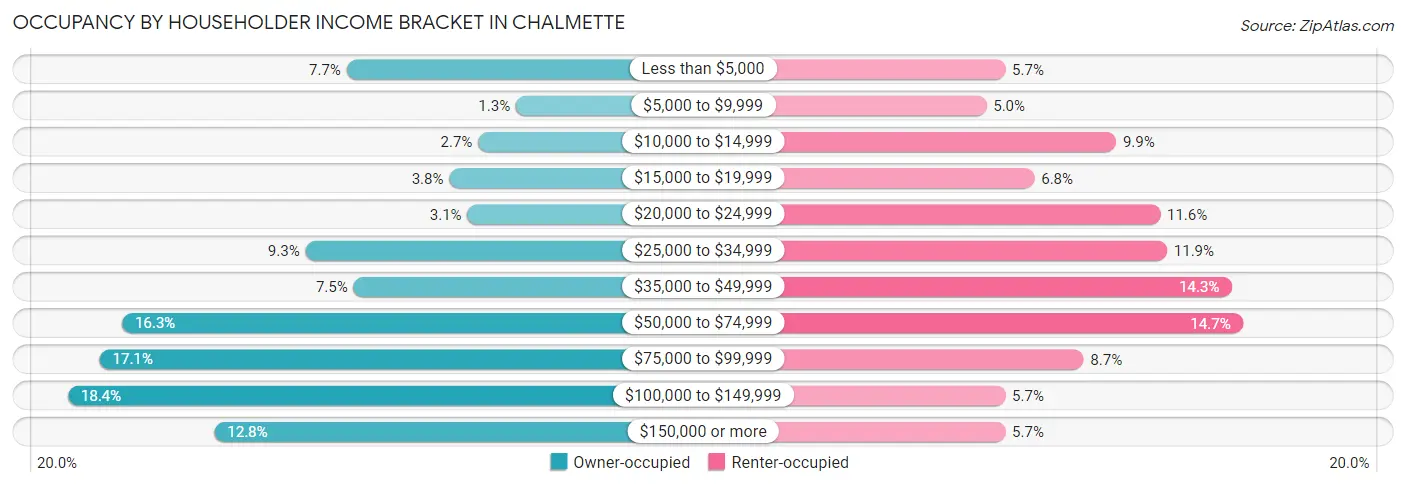
| Income Bracket | Owner-occupied | Renter-occupied |
| Less than $5,000 | 375 (7.7%) | 174 (5.7%) |
| $5,000 to $9,999 | 62 (1.3%) | 152 (5.0%) |
| $10,000 to $14,999 | 132 (2.7%) | 303 (9.9%) |
| $15,000 to $19,999 | 185 (3.8%) | 208 (6.8%) |
| $20,000 to $24,999 | 152 (3.1%) | 354 (11.6%) |
| $25,000 to $34,999 | 451 (9.3%) | 362 (11.9%) |
| $35,000 to $49,999 | 362 (7.5%) | 437 (14.3%) |
| $50,000 to $74,999 | 790 (16.3%) | 450 (14.7%) |
| $75,000 to $99,999 | 831 (17.1%) | 265 (8.7%) |
| $100,000 to $149,999 | 890 (18.3%) | 174 (5.7%) |
| $150,000 or more | 619 (12.8%) | 174 (5.7%) |
| Total | 4,849 (100.0%) | 3,053 (100.0%) |
Monthly Housing Cost Tiers in Chalmette
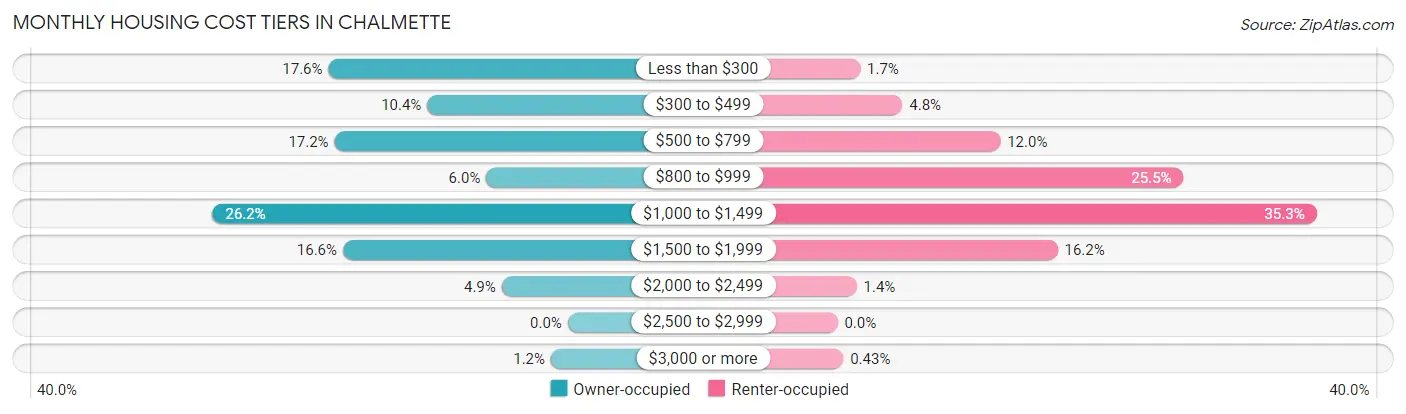
| Monthly Cost | Owner-occupied | Renter-occupied |
| Less than $300 | 855 (17.6%) | 51 (1.7%) |
| $300 to $499 | 502 (10.3%) | 146 (4.8%) |
| $500 to $799 | 833 (17.2%) | 366 (12.0%) |
| $800 to $999 | 291 (6.0%) | 778 (25.5%) |
| $1,000 to $1,499 | 1,269 (26.2%) | 1,077 (35.3%) |
| $1,500 to $1,999 | 803 (16.6%) | 495 (16.2%) |
| $2,000 to $2,499 | 236 (4.9%) | 43 (1.4%) |
| $2,500 to $2,999 | 0 (0.0%) | 0 (0.0%) |
| $3,000 or more | 60 (1.2%) | 13 (0.4%) |
| Total | 4,849 (100.0%) | 3,053 (100.0%) |
Physical Housing Characteristics in Chalmette
Housing Structures in Chalmette
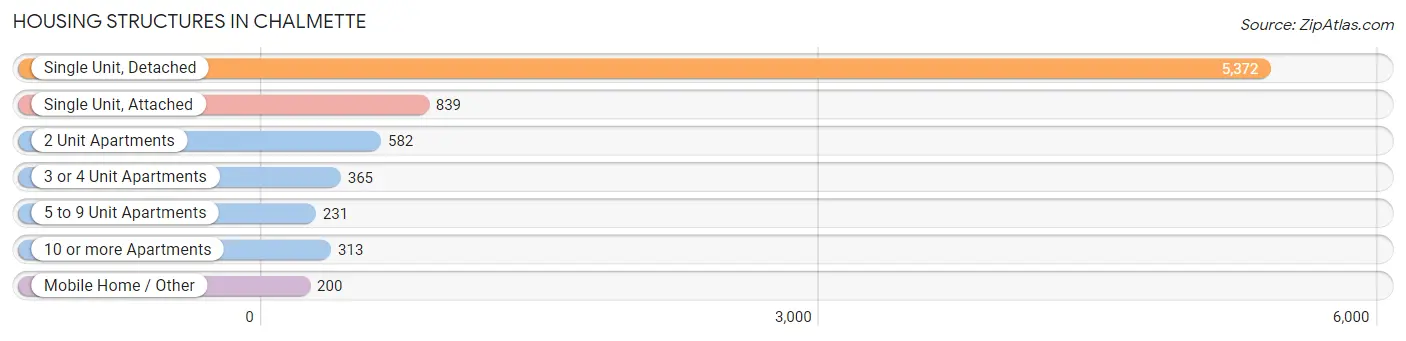
| Structure Type | # Housing Units | % Housing Units |
| Single Unit, Detached | 5,372 | 68.0% |
| Single Unit, Attached | 839 | 10.6% |
| 2 Unit Apartments | 582 | 7.4% |
| 3 or 4 Unit Apartments | 365 | 4.6% |
| 5 to 9 Unit Apartments | 231 | 2.9% |
| 10 or more Apartments | 313 | 4.0% |
| Mobile Home / Other | 200 | 2.5% |
| Total | 7,902 | 100.0% |
Housing Structures by Occupancy in Chalmette
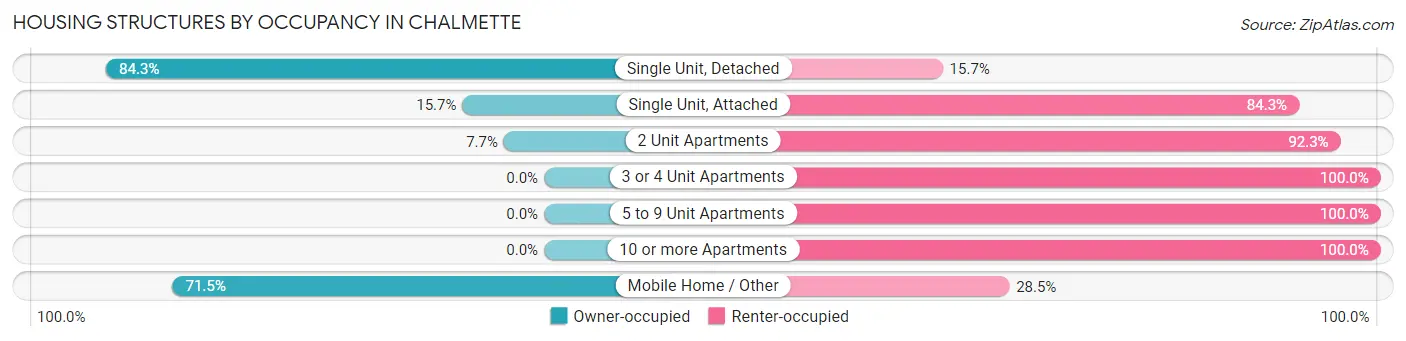
| Structure Type | Owner-occupied | Renter-occupied |
| Single Unit, Detached | 4,529 (84.3%) | 843 (15.7%) |
| Single Unit, Attached | 132 (15.7%) | 707 (84.3%) |
| 2 Unit Apartments | 45 (7.7%) | 537 (92.3%) |
| 3 or 4 Unit Apartments | 0 (0.0%) | 365 (100.0%) |
| 5 to 9 Unit Apartments | 0 (0.0%) | 231 (100.0%) |
| 10 or more Apartments | 0 (0.0%) | 313 (100.0%) |
| Mobile Home / Other | 143 (71.5%) | 57 (28.5%) |
| Total | 4,849 (61.4%) | 3,053 (38.6%) |
Housing Structures by Number of Rooms in Chalmette
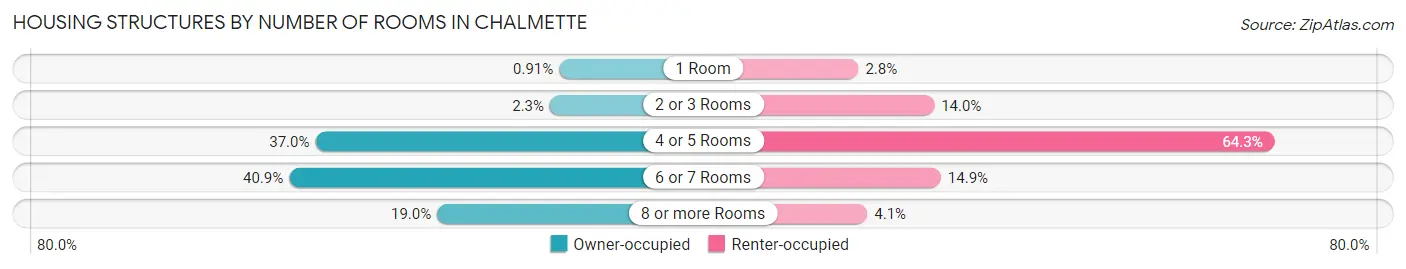
| Number of Rooms | Owner-occupied | Renter-occupied |
| 1 Room | 44 (0.9%) | 84 (2.8%) |
| 2 or 3 Rooms | 110 (2.3%) | 426 (14.0%) |
| 4 or 5 Rooms | 1,793 (37.0%) | 1,963 (64.3%) |
| 6 or 7 Rooms | 1,982 (40.9%) | 456 (14.9%) |
| 8 or more Rooms | 920 (19.0%) | 124 (4.1%) |
| Total | 4,849 (100.0%) | 3,053 (100.0%) |
Housing Structure by Heating Type in Chalmette
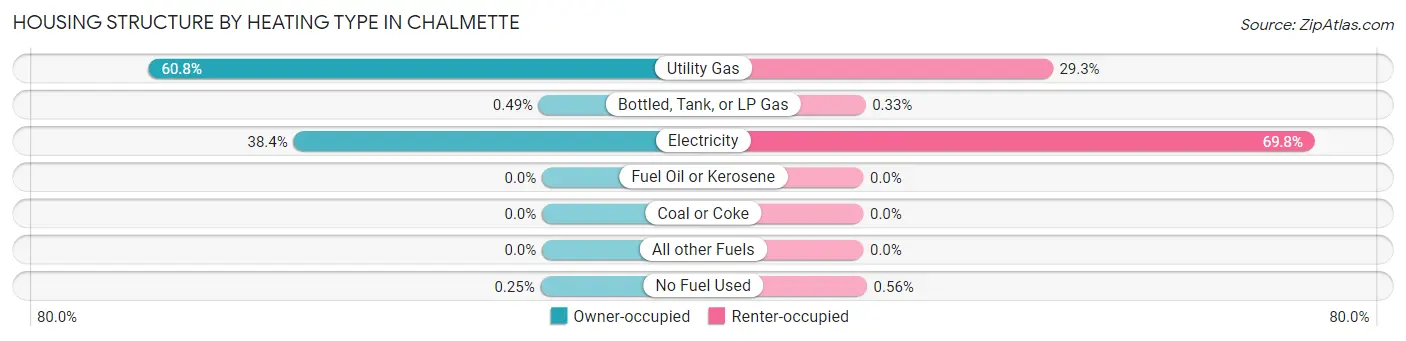
| Heating Type | Owner-occupied | Renter-occupied |
| Utility Gas | 2,950 (60.8%) | 894 (29.3%) |
| Bottled, Tank, or LP Gas | 24 (0.5%) | 10 (0.3%) |
| Electricity | 1,863 (38.4%) | 2,132 (69.8%) |
| Fuel Oil or Kerosene | 0 (0.0%) | 0 (0.0%) |
| Coal or Coke | 0 (0.0%) | 0 (0.0%) |
| All other Fuels | 0 (0.0%) | 0 (0.0%) |
| No Fuel Used | 12 (0.3%) | 17 (0.6%) |
| Total | 4,849 (100.0%) | 3,053 (100.0%) |
Household Vehicle Usage in Chalmette
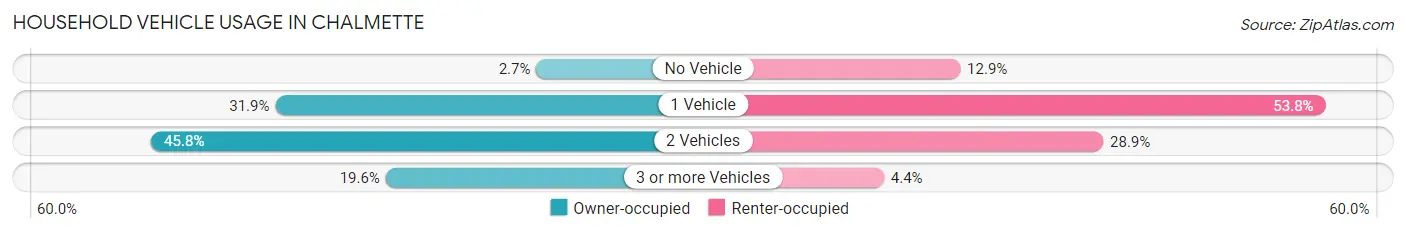
| Vehicles per Household | Owner-occupied | Renter-occupied |
| No Vehicle | 130 (2.7%) | 394 (12.9%) |
| 1 Vehicle | 1,548 (31.9%) | 1,643 (53.8%) |
| 2 Vehicles | 2,223 (45.8%) | 883 (28.9%) |
| 3 or more Vehicles | 948 (19.6%) | 133 (4.4%) |
| Total | 4,849 (100.0%) | 3,053 (100.0%) |
Real Estate & Mortgages in Chalmette
Real Estate and Mortgage Overview in Chalmette
| Characteristic | Without Mortgage | With Mortgage |
| Housing Units | 2,126 | 2,723 |
| Median Property Value | $172,400 | $205,700 |
| Median Household Income | $49,038 | $333 |
| Monthly Housing Costs | $399 | $60 |
| Real Estate Taxes | $979 | $303 |
Property Value by Mortgage Status in Chalmette
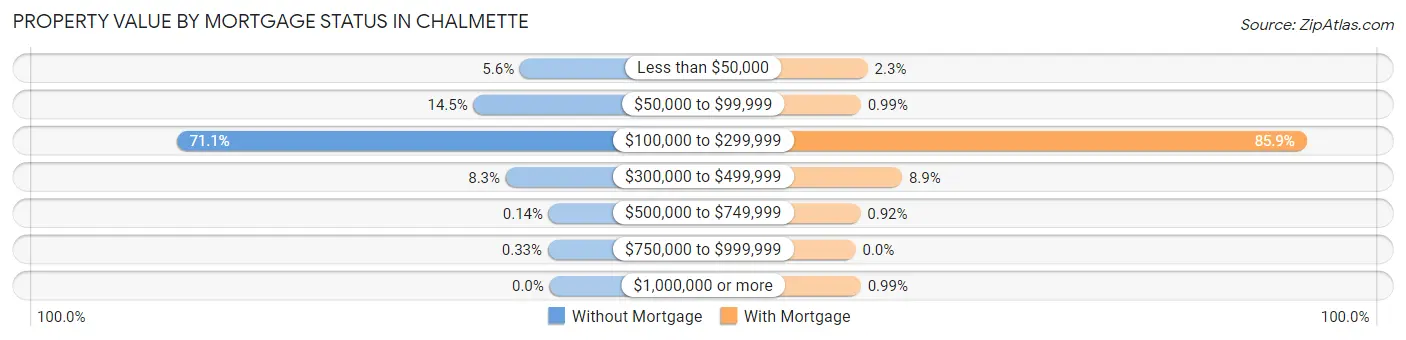
| Property Value | Without Mortgage | With Mortgage |
| Less than $50,000 | 120 (5.6%) | 63 (2.3%) |
| $50,000 to $99,999 | 308 (14.5%) | 27 (1.0%) |
| $100,000 to $299,999 | 1,511 (71.1%) | 2,340 (85.9%) |
| $300,000 to $499,999 | 177 (8.3%) | 241 (8.8%) |
| $500,000 to $749,999 | 3 (0.1%) | 25 (0.9%) |
| $750,000 to $999,999 | 7 (0.3%) | 0 (0.0%) |
| $1,000,000 or more | 0 (0.0%) | 27 (1.0%) |
| Total | 2,126 (100.0%) | 2,723 (100.0%) |
Household Income by Mortgage Status in Chalmette
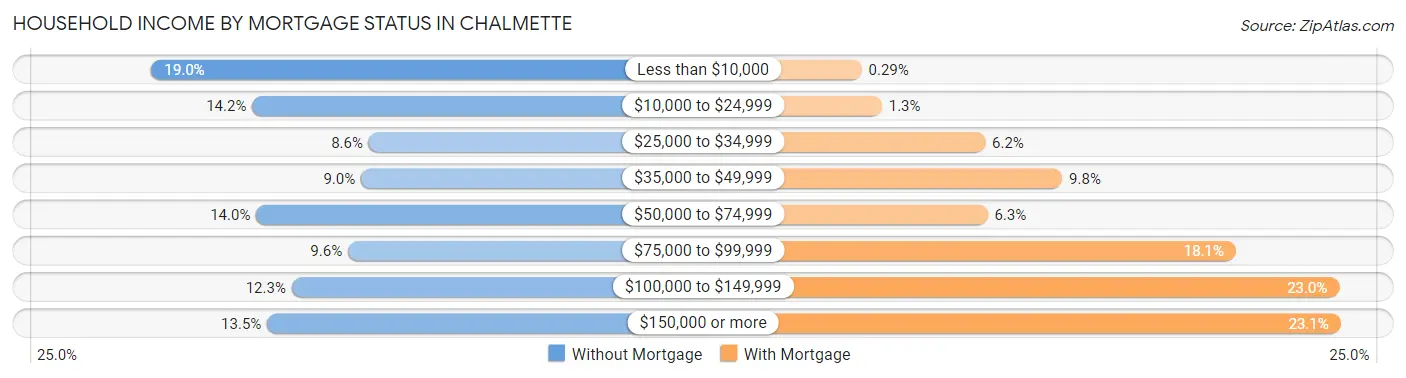
| Household Income | Without Mortgage | With Mortgage |
| Less than $10,000 | 403 (19.0%) | 8 (0.3%) |
| $10,000 to $24,999 | 301 (14.2%) | 34 (1.3%) |
| $25,000 to $34,999 | 183 (8.6%) | 168 (6.2%) |
| $35,000 to $49,999 | 191 (9.0%) | 268 (9.8%) |
| $50,000 to $74,999 | 297 (14.0%) | 171 (6.3%) |
| $75,000 to $99,999 | 204 (9.6%) | 493 (18.1%) |
| $100,000 to $149,999 | 261 (12.3%) | 627 (23.0%) |
| $150,000 or more | 286 (13.5%) | 629 (23.1%) |
| Total | 2,126 (100.0%) | 2,723 (100.0%) |
Property Value to Household Income Ratio in Chalmette
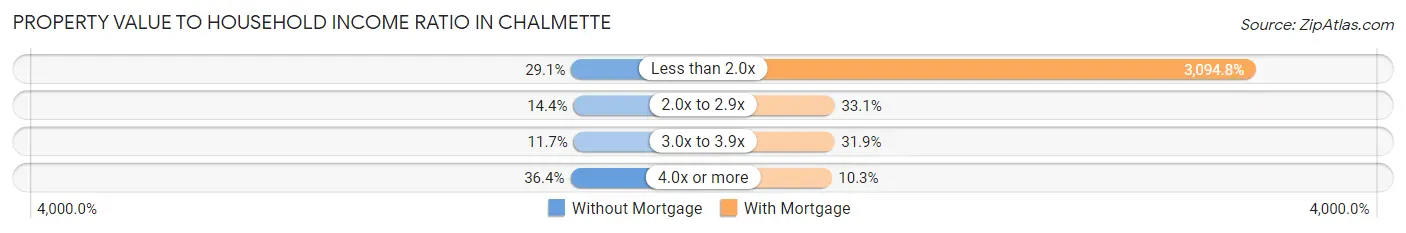
| Value-to-Income Ratio | Without Mortgage | With Mortgage |
| Less than 2.0x | 618 (29.1%) | 84,271 (3,094.8%) |
| 2.0x to 2.9x | 307 (14.4%) | 901 (33.1%) |
| 3.0x to 3.9x | 249 (11.7%) | 869 (31.9%) |
| 4.0x or more | 773 (36.4%) | 280 (10.3%) |
| Total | 2,126 (100.0%) | 2,723 (100.0%) |
Real Estate Taxes by Mortgage Status in Chalmette
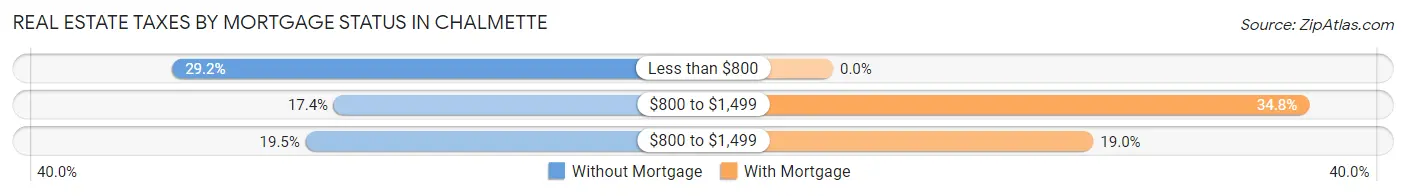
| Property Taxes | Without Mortgage | With Mortgage |
| Less than $800 | 621 (29.2%) | 0 (0.0%) |
| $800 to $1,499 | 370 (17.4%) | 947 (34.8%) |
| $800 to $1,499 | 414 (19.5%) | 518 (19.0%) |
| Total | 2,126 (100.0%) | 2,723 (100.0%) |
Health & Disability in Chalmette
Health Insurance Coverage by Age in Chalmette
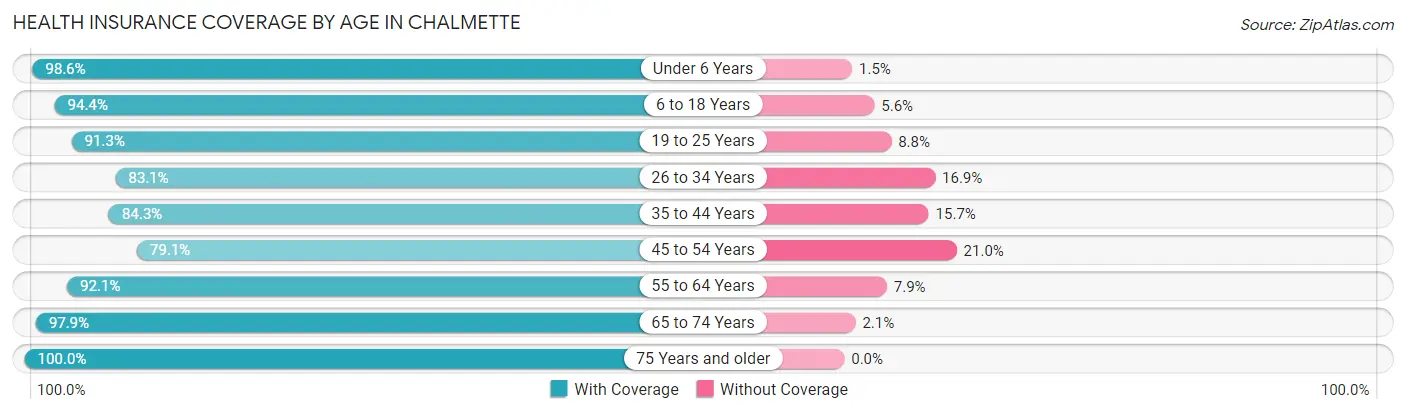
| Age Bracket | With Coverage | Without Coverage |
| Under 6 Years | 1,907 (98.6%) | 28 (1.5%) |
| 6 to 18 Years | 3,807 (94.4%) | 226 (5.6%) |
| 19 to 25 Years | 1,763 (91.2%) | 169 (8.7%) |
| 26 to 34 Years | 2,752 (83.1%) | 561 (16.9%) |
| 35 to 44 Years | 2,760 (84.3%) | 515 (15.7%) |
| 45 to 54 Years | 1,849 (79.0%) | 490 (20.9%) |
| 55 to 64 Years | 2,392 (92.1%) | 206 (7.9%) |
| 65 to 74 Years | 1,545 (97.9%) | 33 (2.1%) |
| 75 Years and older | 965 (100.0%) | 0 (0.0%) |
| Total | 19,740 (89.9%) | 2,228 (10.1%) |
Health Insurance Coverage by Citizenship Status in Chalmette
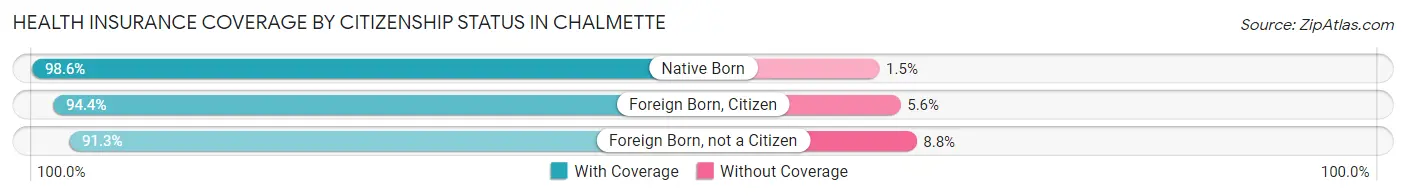
| Citizenship Status | With Coverage | Without Coverage |
| Native Born | 1,907 (98.6%) | 28 (1.5%) |
| Foreign Born, Citizen | 3,807 (94.4%) | 226 (5.6%) |
| Foreign Born, not a Citizen | 1,763 (91.2%) | 169 (8.7%) |
Health Insurance Coverage by Household Income in Chalmette
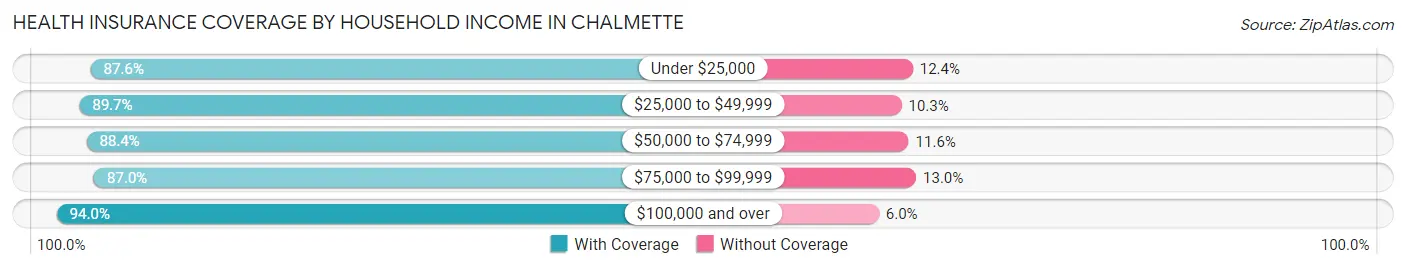
| Household Income | With Coverage | Without Coverage |
| Under $25,000 | 4,107 (87.6%) | 579 (12.4%) |
| $25,000 to $49,999 | 3,523 (89.7%) | 403 (10.3%) |
| $50,000 to $74,999 | 3,416 (88.4%) | 448 (11.6%) |
| $75,000 to $99,999 | 2,860 (87.0%) | 427 (13.0%) |
| $100,000 and over | 5,812 (94.0%) | 371 (6.0%) |
Public vs Private Health Insurance Coverage by Age in Chalmette
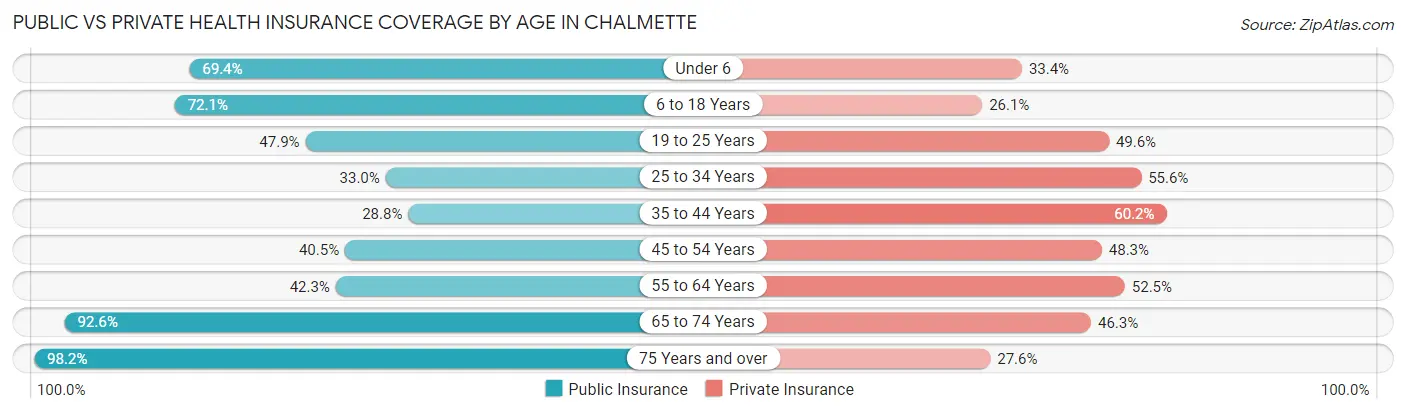
| Age Bracket | Public Insurance | Private Insurance |
| Under 6 | 1,343 (69.4%) | 647 (33.4%) |
| 6 to 18 Years | 2,909 (72.1%) | 1,051 (26.1%) |
| 19 to 25 Years | 925 (47.9%) | 958 (49.6%) |
| 25 to 34 Years | 1,093 (33.0%) | 1,841 (55.6%) |
| 35 to 44 Years | 943 (28.8%) | 1,973 (60.2%) |
| 45 to 54 Years | 948 (40.5%) | 1,129 (48.3%) |
| 55 to 64 Years | 1,098 (42.3%) | 1,365 (52.5%) |
| 65 to 74 Years | 1,461 (92.6%) | 730 (46.3%) |
| 75 Years and over | 948 (98.2%) | 266 (27.6%) |
| Total | 11,668 (53.1%) | 9,960 (45.3%) |
Disability Status by Sex by Age in Chalmette
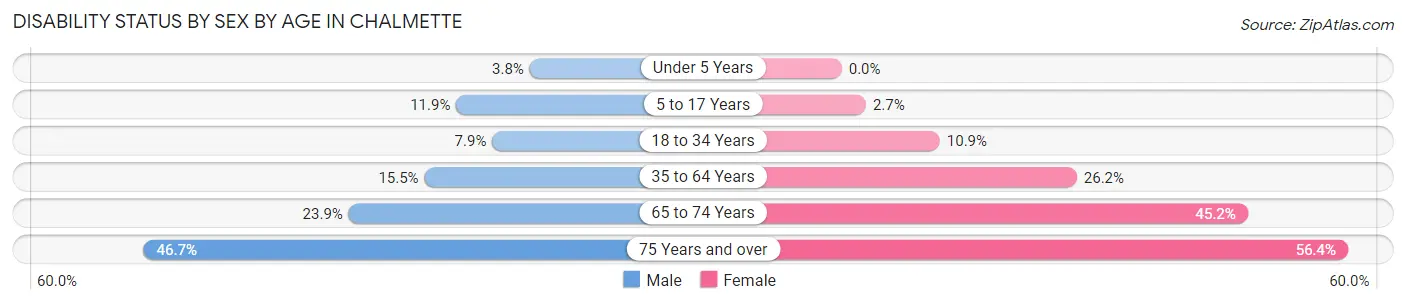
| Age Bracket | Male | Female |
| Under 5 Years | 24 (3.7%) | 0 (0.0%) |
| 5 to 17 Years | 276 (11.9%) | 53 (2.7%) |
| 18 to 34 Years | 199 (7.9%) | 317 (10.9%) |
| 35 to 64 Years | 631 (15.5%) | 1,082 (26.2%) |
| 65 to 74 Years | 181 (23.9%) | 371 (45.2%) |
| 75 Years and over | 208 (46.7%) | 293 (56.4%) |
Disability Class by Sex by Age in Chalmette
Disability Class: Hearing Difficulty
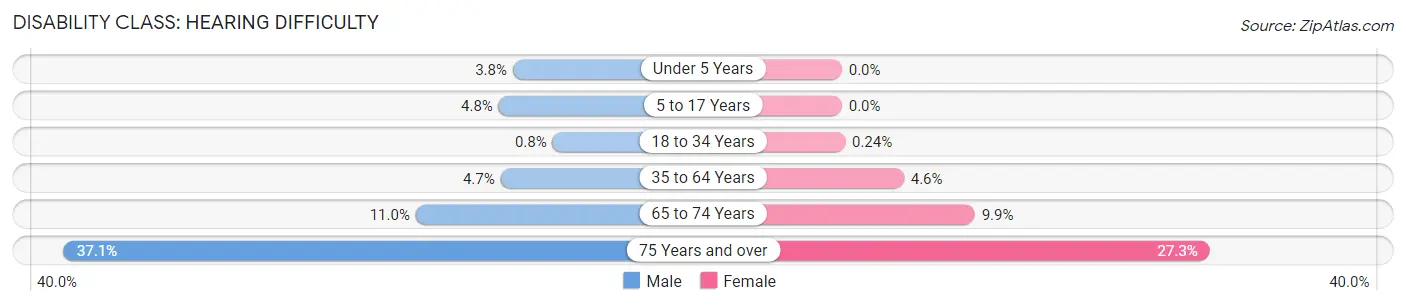
| Age Bracket | Male | Female |
| Under 5 Years | 24 (3.7%) | 0 (0.0%) |
| 5 to 17 Years | 111 (4.8%) | 0 (0.0%) |
| 18 to 34 Years | 20 (0.8%) | 7 (0.2%) |
| 35 to 64 Years | 190 (4.7%) | 190 (4.6%) |
| 65 to 74 Years | 83 (11.0%) | 81 (9.9%) |
| 75 Years and over | 165 (37.1%) | 142 (27.3%) |
Disability Class: Vision Difficulty
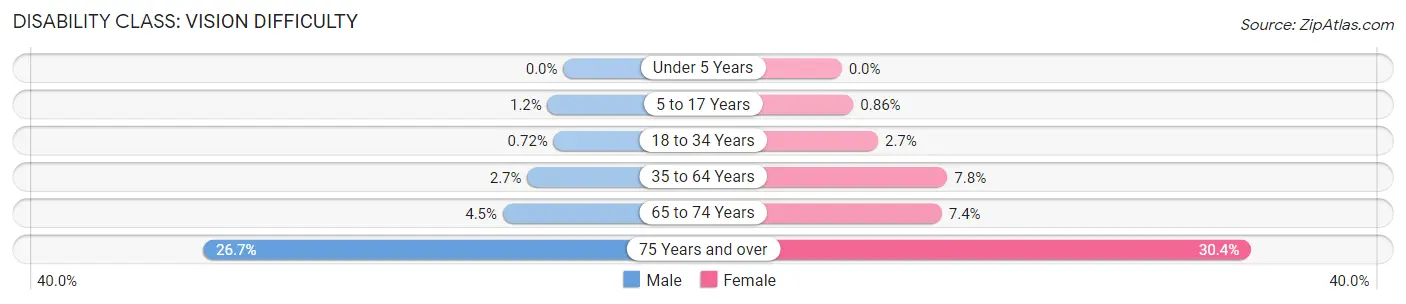
| Age Bracket | Male | Female |
| Under 5 Years | 0 (0.0%) | 0 (0.0%) |
| 5 to 17 Years | 27 (1.2%) | 17 (0.9%) |
| 18 to 34 Years | 18 (0.7%) | 78 (2.7%) |
| 35 to 64 Years | 109 (2.7%) | 324 (7.8%) |
| 65 to 74 Years | 34 (4.5%) | 61 (7.4%) |
| 75 Years and over | 119 (26.7%) | 158 (30.4%) |
Disability Class: Cognitive Difficulty
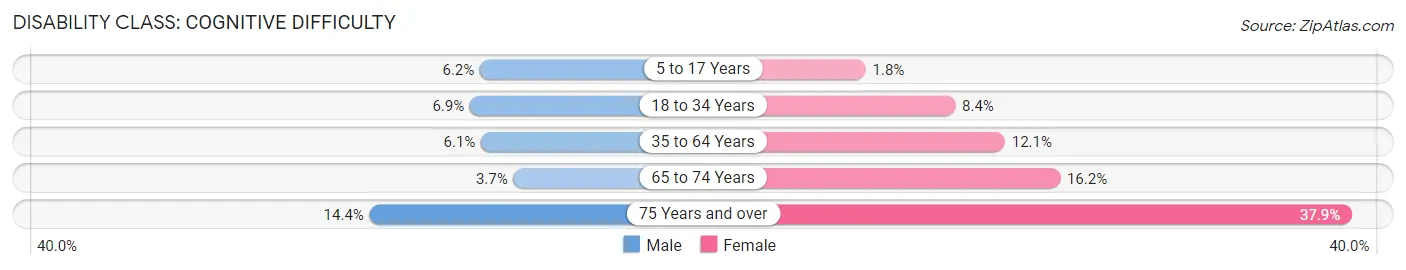
| Age Bracket | Male | Female |
| 5 to 17 Years | 143 (6.2%) | 35 (1.8%) |
| 18 to 34 Years | 174 (6.9%) | 244 (8.4%) |
| 35 to 64 Years | 249 (6.1%) | 500 (12.1%) |
| 65 to 74 Years | 28 (3.7%) | 133 (16.2%) |
| 75 Years and over | 64 (14.4%) | 197 (37.9%) |
Disability Class: Ambulatory Difficulty
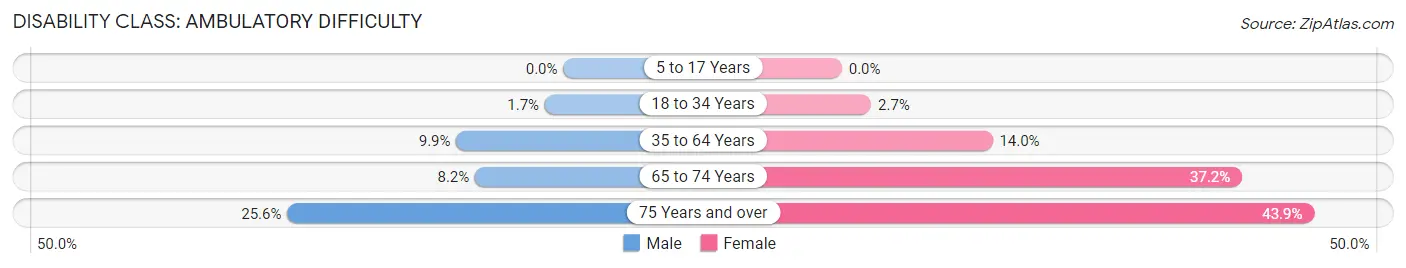
| Age Bracket | Male | Female |
| 5 to 17 Years | 0 (0.0%) | 0 (0.0%) |
| 18 to 34 Years | 43 (1.7%) | 79 (2.7%) |
| 35 to 64 Years | 405 (9.9%) | 578 (14.0%) |
| 65 to 74 Years | 62 (8.2%) | 305 (37.1%) |
| 75 Years and over | 114 (25.6%) | 228 (43.9%) |
Disability Class: Self-Care Difficulty
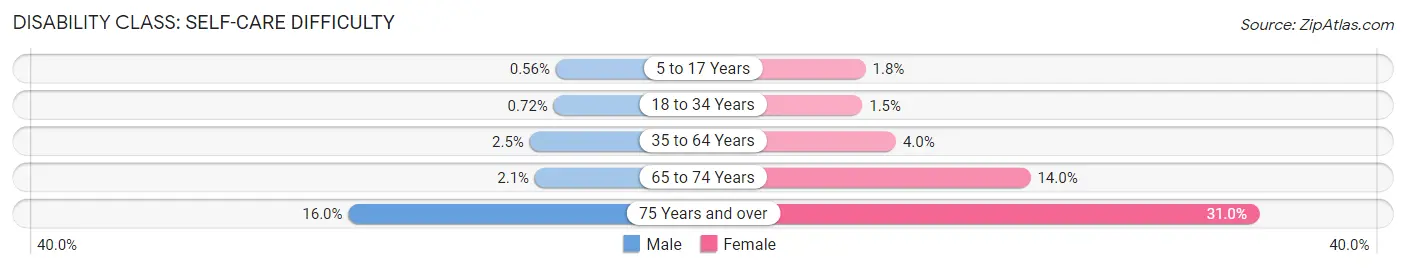
| Age Bracket | Male | Female |
| 5 to 17 Years | 13 (0.6%) | 35 (1.8%) |
| 18 to 34 Years | 18 (0.7%) | 44 (1.5%) |
| 35 to 64 Years | 102 (2.5%) | 166 (4.0%) |
| 65 to 74 Years | 16 (2.1%) | 115 (14.0%) |
| 75 Years and over | 71 (16.0%) | 161 (31.0%) |
Technology Access in Chalmette
Computing Device Access in Chalmette
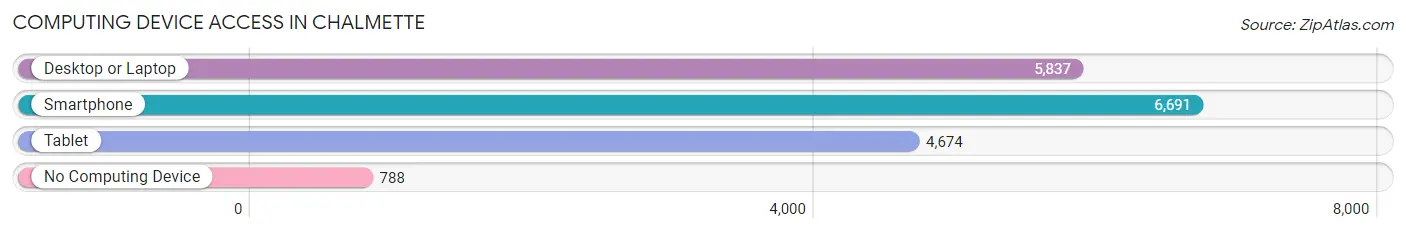
| Device Type | # Households | % Households |
| Desktop or Laptop | 5,837 | 73.9% |
| Smartphone | 6,691 | 84.7% |
| Tablet | 4,674 | 59.2% |
| No Computing Device | 788 | 10.0% |
| Total | 7,902 | 100.0% |
Internet Access in Chalmette
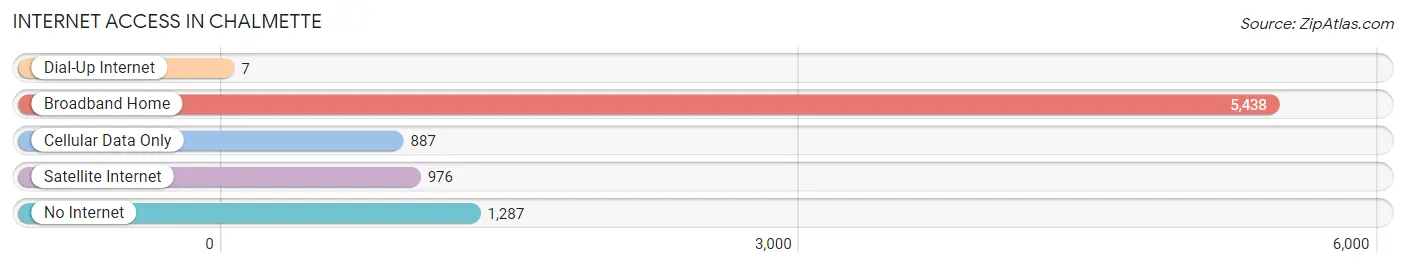
| Internet Type | # Households | % Households |
| Dial-Up Internet | 7 | 0.1% |
| Broadband Home | 5,438 | 68.8% |
| Cellular Data Only | 887 | 11.2% |
| Satellite Internet | 976 | 12.3% |
| No Internet | 1,287 | 16.3% |
| Total | 7,902 | 100.0% |
Chalmette Summary
Chalmette is a census-designated place (CDP) located in St. Bernard Parish, Louisiana. It is located just east of New Orleans and is part of the Greater New Orleans Metropolitan Area. The population of Chalmette was 32,069 at the 2010 census.
History
Chalmette was founded in 1770 by French settlers, who named it after the French word for “stony ground”. The area was originally part of the German Coast, an area of Louisiana that was settled by German immigrants in the early 1700s. The area was later annexed by the United States in 1803 as part of the Louisiana Purchase.
In 1815, the Battle of New Orleans was fought in Chalmette, which was a major victory for the United States in the War of 1812. The battlefield is now a national historic site and is open to the public.
Geography
Chalmette is located at 29°55'N 89°55'W (29.917, -89.917). It is situated on the east bank of the Mississippi River, about 8 miles (13 km) southeast of downtown New Orleans.
The total area of Chalmette is 8.3 square miles (21.5 km2), of which 8.2 square miles (21.3 km2) is land and 0.1 square miles (0.2 km2) is water.
Economy
Chalmette’s economy is largely based on the oil and gas industry, as well as tourism. The area is home to several oil refineries, including the Chalmette Refining Company, which is the largest oil refinery in the United States.
The tourism industry is also an important part of the local economy. The Chalmette Battlefield is a popular tourist destination, as is the Jean Lafitte National Historical Park and Preserve.
Demographics
As of the 2010 census, there were 32,069 people, 11,945 households, and 8,541 families residing in Chalmette. The population density was 3,890.3 people per square mile (1,502.2/km2). The racial makeup of the CDP was 79.2% White, 15.2% African American, 0.3% Native American, 0.7% Asian, 0.1% Pacific Islander, 2.2% from other races, and 2.3% from two or more races. Hispanic or Latino of any race were 6.3% of the population.
The median income for a household in Chalmette was $41,945, and the median income for a family was $50,945. Males had a median income of $37,945 versus $27,945 for females. The per capita income for the CDP was $20,945. About 11.2% of families and 13.2% of the population were below the poverty line, including 18.2% of those under age 18 and 8.2% of those age 65 or over.
Common Questions
What is Per Capita Income in Chalmette?
Per Capita income in Chalmette is $28,480.
What is the Median Family Income in Chalmette?
Median Family Income in Chalmette is $62,292.
What is the Median Household income in Chalmette?
Median Household Income in Chalmette is $55,655.
What is Income or Wage Gap in Chalmette?
Income or Wage Gap in Chalmette is 35.7%.
Women in Chalmette earn 64.3 cents for every dollar earned by a man.
What is Family Income Deficit in Chalmette?
Family Income Deficit in Chalmette is $10,443.
Families that are below poverty line in Chalmette earn $10,443 less on average than the poverty threshold level.
What is Inequality or Gini Index in Chalmette?
Inequality or Gini Index in Chalmette is 0.49.
What is the Total Population of Chalmette?
Total Population of Chalmette is 22,192.
What is the Total Male Population of Chalmette?
Total Male Population of Chalmette is 10,947.
What is the Total Female Population of Chalmette?
Total Female Population of Chalmette is 11,245.
What is the Ratio of Males per 100 Females in Chalmette?
There are 97.35 Males per 100 Females in Chalmette.
What is the Ratio of Females per 100 Males in Chalmette?
There are 102.72 Females per 100 Males in Chalmette.
What is the Median Population Age in Chalmette?
Median Population Age in Chalmette is 34.6 Years.
What is the Average Family Size in Chalmette
Average Family Size in Chalmette is 3.4 People.
What is the Average Household Size in Chalmette
Average Household Size in Chalmette is 2.8 People.
How Large is the Labor Force in Chalmette?
There are 10,275 People in the Labor Forcein in Chalmette.
What is the Percentage of People in the Labor Force in Chalmette?
60.3% of People are in the Labor Force in Chalmette.
What is the Unemployment Rate in Chalmette?
Unemployment Rate in Chalmette is 9.5%.