Thonotosassa, FL Map & Demographics
Thonotosassa Map
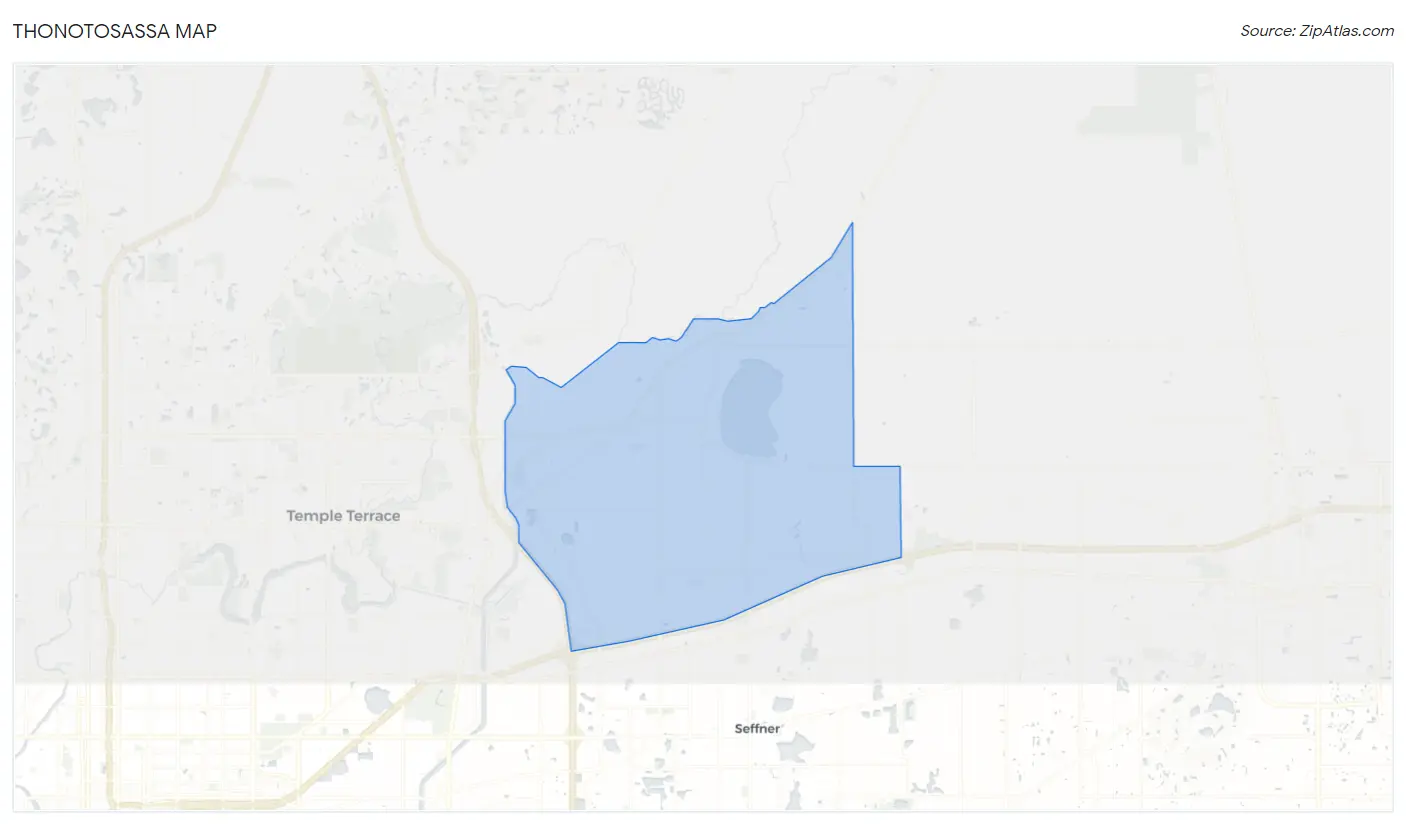
Thonotosassa Overview
$33,418
PER CAPITA INCOME
$68,912
AVG FAMILY INCOME
$56,477
AVG HOUSEHOLD INCOME
20.3%
WAGE / INCOME GAP [ % ]
79.7¢/ $1
WAGE / INCOME GAP [ $ ]
0.51
INEQUALITY / GINI INDEX
14,052
TOTAL POPULATION
7,425
MALE POPULATION
6,627
FEMALE POPULATION
112.04
MALES / 100 FEMALES
89.25
FEMALES / 100 MALES
42.1
MEDIAN AGE
3.5
AVG FAMILY SIZE
2.9
AVG HOUSEHOLD SIZE
6,472
LABOR FORCE [ PEOPLE ]
55.9%
PERCENT IN LABOR FORCE
5.7%
UNEMPLOYMENT RATE
Thonotosassa Zip Codes
Thonotosassa Area Codes
Income in Thonotosassa
Income Overview in Thonotosassa
Per Capita Income in Thonotosassa is $33,418, while median incomes of families and households are $68,912 and $56,477 respectively.
| Characteristic | Number | Measure |
| Per Capita Income | 14,052 | $33,418 |
| Median Family Income | 3,163 | $68,912 |
| Mean Family Income | 3,163 | $108,531 |
| Median Household Income | 4,849 | $56,477 |
| Mean Household Income | 4,849 | $91,597 |
| Income Deficit | 3,163 | $0 |
| Wage / Income Gap (%) | 14,052 | 20.30% |
| Wage / Income Gap ($) | 14,052 | 79.70¢ per $1 |
| Gini / Inequality Index | 14,052 | 0.51 |
Earnings by Sex in Thonotosassa
Average Earnings in Thonotosassa are $34,700, $38,731 for men and $30,867 for women, a difference of 20.3%.
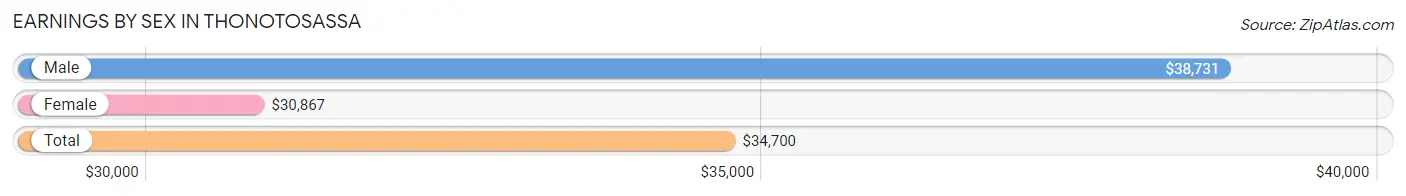
| Sex | Number | Average Earnings |
| Male | 4,144 (62.5%) | $38,731 |
| Female | 2,484 (37.5%) | $30,867 |
| Total | 6,628 (100.0%) | $34,700 |
Earnings by Sex by Income Bracket in Thonotosassa
The most common earnings brackets in Thonotosassa are $100,000+ for men (661 | 16.0%) and $30,000 to $34,999 for women (269 | 10.8%).
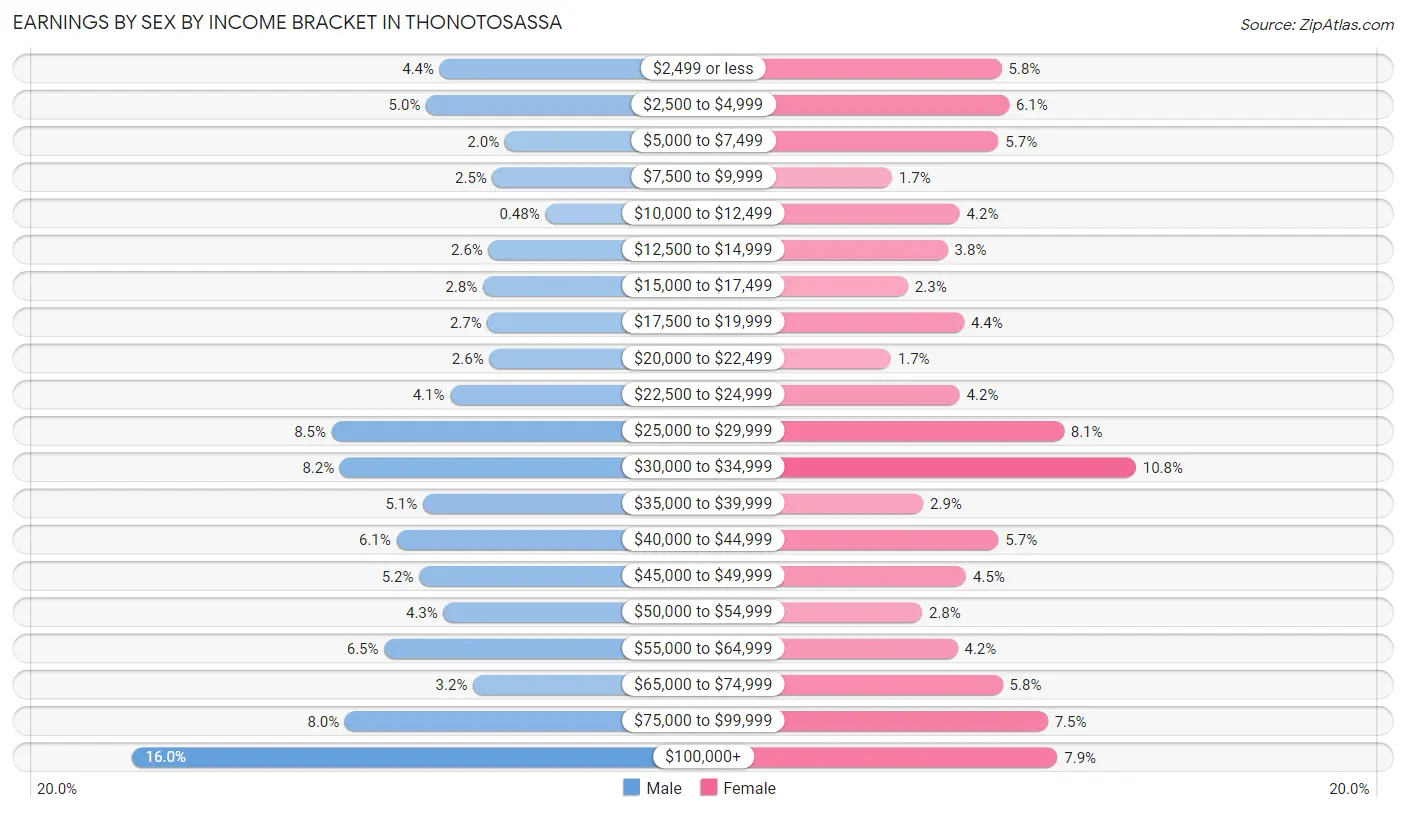
| Income | Male | Female |
| $2,499 or less | 184 (4.4%) | 144 (5.8%) |
| $2,500 to $4,999 | 205 (5.0%) | 151 (6.1%) |
| $5,000 to $7,499 | 83 (2.0%) | 141 (5.7%) |
| $7,500 to $9,999 | 102 (2.5%) | 42 (1.7%) |
| $10,000 to $12,499 | 20 (0.5%) | 105 (4.2%) |
| $12,500 to $14,999 | 108 (2.6%) | 94 (3.8%) |
| $15,000 to $17,499 | 117 (2.8%) | 57 (2.3%) |
| $17,500 to $19,999 | 110 (2.6%) | 109 (4.4%) |
| $20,000 to $22,499 | 107 (2.6%) | 41 (1.7%) |
| $22,500 to $24,999 | 168 (4.1%) | 105 (4.2%) |
| $25,000 to $29,999 | 352 (8.5%) | 202 (8.1%) |
| $30,000 to $34,999 | 339 (8.2%) | 269 (10.8%) |
| $35,000 to $39,999 | 210 (5.1%) | 71 (2.9%) |
| $40,000 to $44,999 | 251 (6.1%) | 141 (5.7%) |
| $45,000 to $49,999 | 216 (5.2%) | 111 (4.5%) |
| $50,000 to $54,999 | 178 (4.3%) | 70 (2.8%) |
| $55,000 to $64,999 | 270 (6.5%) | 103 (4.2%) |
| $65,000 to $74,999 | 132 (3.2%) | 145 (5.8%) |
| $75,000 to $99,999 | 331 (8.0%) | 187 (7.5%) |
| $100,000+ | 661 (16.0%) | 196 (7.9%) |
| Total | 4,144 (100.0%) | 2,484 (100.0%) |
Earnings by Sex by Educational Attainment in Thonotosassa
Average earnings in Thonotosassa are $45,280 for men and $32,715 for women, a difference of 27.8%. Men with an educational attainment of bachelor's degree enjoy the highest average annual earnings of $97,845, while those with less than high school education earn the least with $33,051. Women with an educational attainment of graduate degree earn the most with the average annual earnings of $64,286, while those with less than high school education have the smallest earnings of $27,188.

| Educational Attainment | Male Income | Female Income |
| Less than High School | $33,051 | $27,188 |
| High School Diploma | $36,981 | $28,839 |
| College or Associate's Degree | $44,779 | $31,447 |
| Bachelor's Degree | $97,845 | $52,045 |
| Graduate Degree | $65,268 | $64,286 |
| Total | $45,280 | $32,715 |
Family Income in Thonotosassa
Family Income Brackets in Thonotosassa
According to the Thonotosassa family income data, there are 576 families falling into the $50,000 to $74,999 income range, which is the most common income bracket and makes up 18.2% of all families. Conversely, the $10,000 to $14,999 income bracket is the least frequent group with only 25 families (0.8%) belonging to this category.
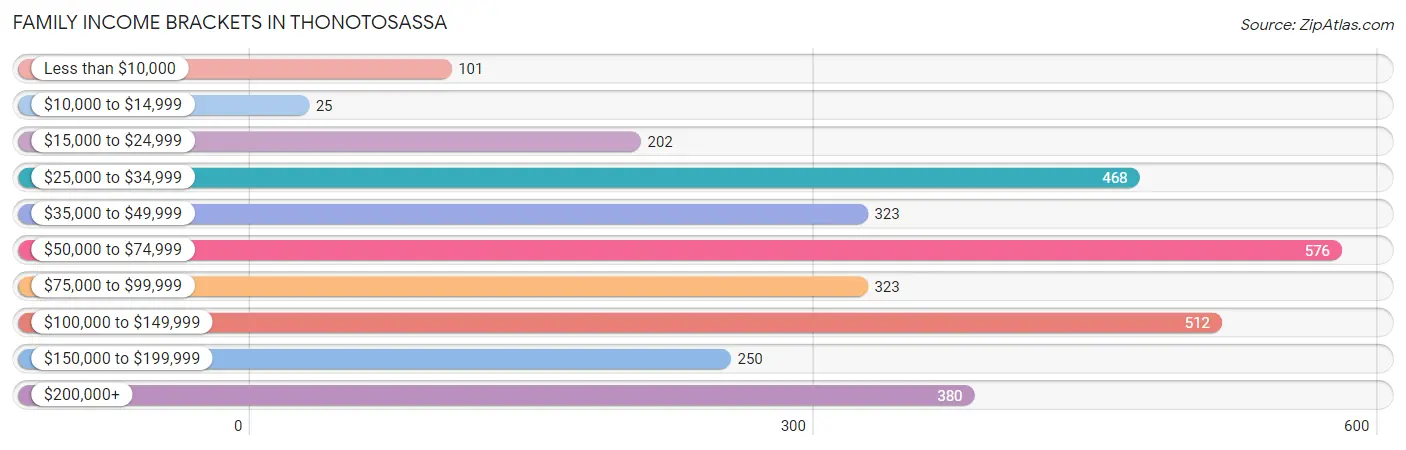
| Income Bracket | # Families | % Families |
| Less than $10,000 | 101 | 3.2% |
| $10,000 to $14,999 | 25 | 0.8% |
| $15,000 to $24,999 | 202 | 6.4% |
| $25,000 to $34,999 | 468 | 14.8% |
| $35,000 to $49,999 | 323 | 10.2% |
| $50,000 to $74,999 | 576 | 18.2% |
| $75,000 to $99,999 | 323 | 10.2% |
| $100,000 to $149,999 | 512 | 16.2% |
| $150,000 to $199,999 | 250 | 7.9% |
| $200,000+ | 380 | 12.0% |
Family Income by Famaliy Size in Thonotosassa
3-person families (851 | 26.9%) account for the highest median family income in Thonotosassa with $93,438 per family, while 3-person families (851 | 26.9%) have the highest median income of $31,146 per family member.
| Income Bracket | # Families | Median Income |
| 2-Person Families | 1,236 (39.1%) | $59,429 |
| 3-Person Families | 851 (26.9%) | $93,438 |
| 4-Person Families | 528 (16.7%) | $0 |
| 5-Person Families | 261 (8.3%) | $71,169 |
| 6-Person Families | 156 (4.9%) | $0 |
| 7+ Person Families | 131 (4.1%) | $0 |
| Total | 3,163 (100.0%) | $68,912 |
Family Income by Number of Earners in Thonotosassa
The median family income in Thonotosassa is $68,912, with families comprising 3+ earners (413) having the highest median family income of $142,434, while families with no earners (485) have the lowest median family income of $35,781, accounting for 13.1% and 15.3% of families, respectively.
| Number of Earners | # Families | Median Income |
| No Earners | 485 (15.3%) | $35,781 |
| 1 Earner | 1,218 (38.5%) | $46,713 |
| 2 Earners | 1,047 (33.1%) | $107,522 |
| 3+ Earners | 413 (13.1%) | $142,434 |
| Total | 3,163 (100.0%) | $68,912 |
Household Income in Thonotosassa
Household Income Brackets in Thonotosassa
With 844 households falling in the category, the $50,000 to $74,999 income range is the most frequent in Thonotosassa, accounting for 17.4% of all households. In contrast, only 160 households (3.3%) fall into the less than $10,000 income bracket, making it the least populous group.
| Income Bracket | # Households | % Households |
| Less than $10,000 | 160 | 3.3% |
| $10,000 to $14,999 | 209 | 4.3% |
| $15,000 to $24,999 | 519 | 10.7% |
| $25,000 to $34,999 | 718 | 14.8% |
| $35,000 to $49,999 | 538 | 11.1% |
| $50,000 to $74,999 | 844 | 17.4% |
| $75,000 to $99,999 | 475 | 9.8% |
| $100,000 to $149,999 | 621 | 12.8% |
| $150,000 to $199,999 | 320 | 6.6% |
| $200,000+ | 451 | 9.3% |
Household Income by Householder Age in Thonotosassa
The median household income in Thonotosassa is $56,477, with the highest median household income of $68,724 found in the 45 to 64 years age bracket for the primary householder. A total of 2,381 households (49.1%) fall into this category. Meanwhile, the 15 to 24 years age bracket for the primary householder has the lowest median household income of $33,056, with 120 households (2.5%) in this group.
| Income Bracket | # Households | Median Income |
| 15 to 24 Years | 120 (2.5%) | $33,056 |
| 25 to 44 Years | 1,108 (22.9%) | $54,461 |
| 45 to 64 Years | 2,381 (49.1%) | $68,724 |
| 65+ Years | 1,240 (25.6%) | $45,625 |
| Total | 4,849 (100.0%) | $56,477 |
Poverty in Thonotosassa
Income Below Poverty by Sex and Age in Thonotosassa
With 19.8% poverty level for males and 24.2% for females among the residents of Thonotosassa, 12 to 14 year old males and 16 and 17 year old females are the most vulnerable to poverty, with 90 males (66.2%) and 114 females (67.5%) in their respective age groups living below the poverty level.
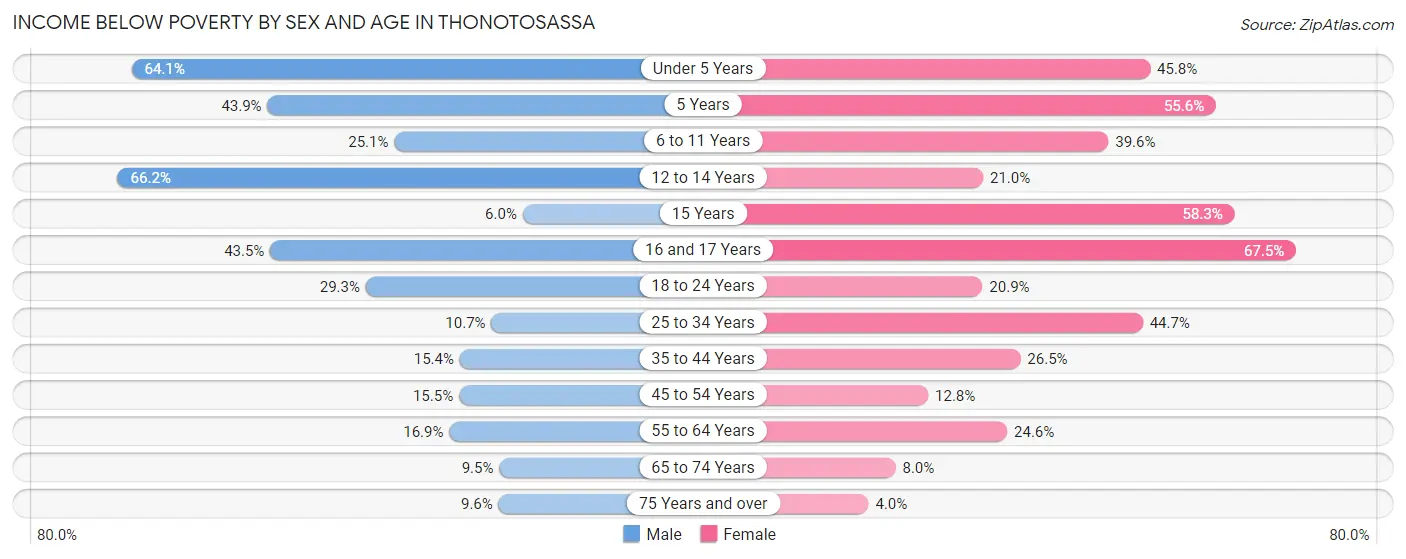
| Age Bracket | Male | Female |
| Under 5 Years | 184 (64.1%) | 114 (45.8%) |
| 5 Years | 29 (43.9%) | 25 (55.6%) |
| 6 to 11 Years | 131 (25.1%) | 165 (39.6%) |
| 12 to 14 Years | 90 (66.2%) | 94 (21.0%) |
| 15 Years | 7 (6.0%) | 42 (58.3%) |
| 16 and 17 Years | 101 (43.5%) | 114 (67.5%) |
| 18 to 24 Years | 174 (29.3%) | 104 (20.9%) |
| 25 to 34 Years | 123 (10.7%) | 269 (44.7%) |
| 35 to 44 Years | 148 (15.4%) | 244 (26.5%) |
| 45 to 54 Years | 172 (15.5%) | 110 (12.8%) |
| 55 to 64 Years | 186 (16.9%) | 231 (24.5%) |
| 65 to 74 Years | 75 (9.5%) | 59 (8.0%) |
| 75 Years and over | 22 (9.6%) | 25 (4.0%) |
| Total | 1,442 (19.8%) | 1,596 (24.2%) |
Income Above Poverty by Sex and Age in Thonotosassa
According to the poverty statistics in Thonotosassa, males aged 15 years and females aged 75 years and over are the age groups that are most secure financially, with 94.0% of males and 96.0% of females in these age groups living above the poverty line.
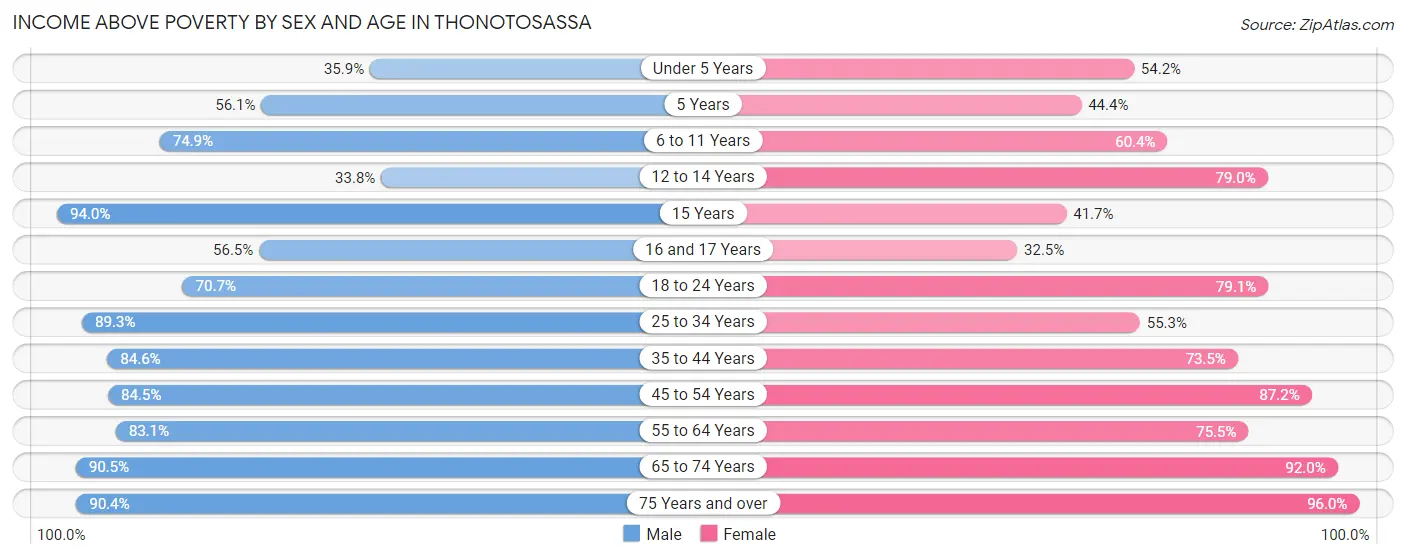
| Age Bracket | Male | Female |
| Under 5 Years | 103 (35.9%) | 135 (54.2%) |
| 5 Years | 37 (56.1%) | 20 (44.4%) |
| 6 to 11 Years | 391 (74.9%) | 252 (60.4%) |
| 12 to 14 Years | 46 (33.8%) | 354 (79.0%) |
| 15 Years | 109 (94.0%) | 30 (41.7%) |
| 16 and 17 Years | 131 (56.5%) | 55 (32.5%) |
| 18 to 24 Years | 419 (70.7%) | 394 (79.1%) |
| 25 to 34 Years | 1,029 (89.3%) | 333 (55.3%) |
| 35 to 44 Years | 814 (84.6%) | 676 (73.5%) |
| 45 to 54 Years | 938 (84.5%) | 748 (87.2%) |
| 55 to 64 Years | 912 (83.1%) | 710 (75.4%) |
| 65 to 74 Years | 714 (90.5%) | 680 (92.0%) |
| 75 Years and over | 207 (90.4%) | 604 (96.0%) |
| Total | 5,850 (80.2%) | 4,991 (75.8%) |
Income Below Poverty Among Married-Couple Families in Thonotosassa
The poverty statistics for married-couple families in Thonotosassa show that 15.2% or 327 of the total 2,151 families live below the poverty line. Families with 5 or more children have the highest poverty rate of 100.0%, comprising of 26 families. On the other hand, families with no children have the lowest poverty rate of 3.5%, which includes 43 families.
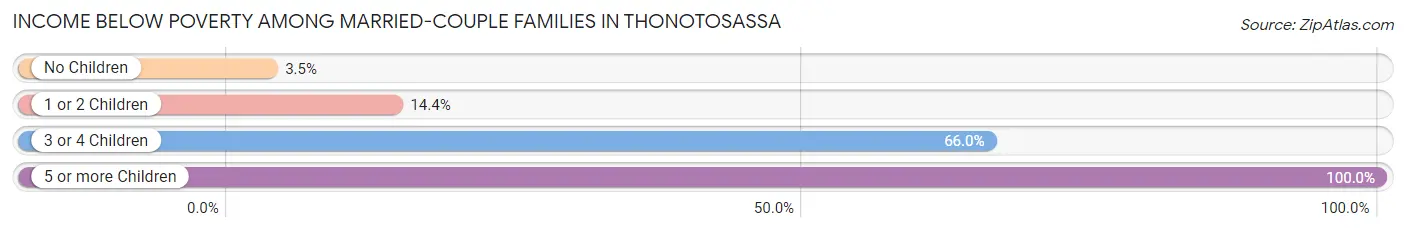
| Children | Above Poverty | Below Poverty |
| No Children | 1,186 (96.5%) | 43 (3.5%) |
| 1 or 2 Children | 553 (85.6%) | 93 (14.4%) |
| 3 or 4 Children | 85 (34.0%) | 165 (66.0%) |
| 5 or more Children | 0 (0.0%) | 26 (100.0%) |
| Total | 1,824 (84.8%) | 327 (15.2%) |
Income Below Poverty Among Single-Parent Households in Thonotosassa
According to the poverty data in Thonotosassa, 2.0% or 7 single-father households and 22.5% or 150 single-mother households are living below the poverty line. Among single-father households, those with no children have the highest poverty rate, with 7 households (4.3%) experiencing poverty. Likewise, among single-mother households, those with 3 or 4 children have the highest poverty rate, with 28 households (51.8%) falling below the poverty line.
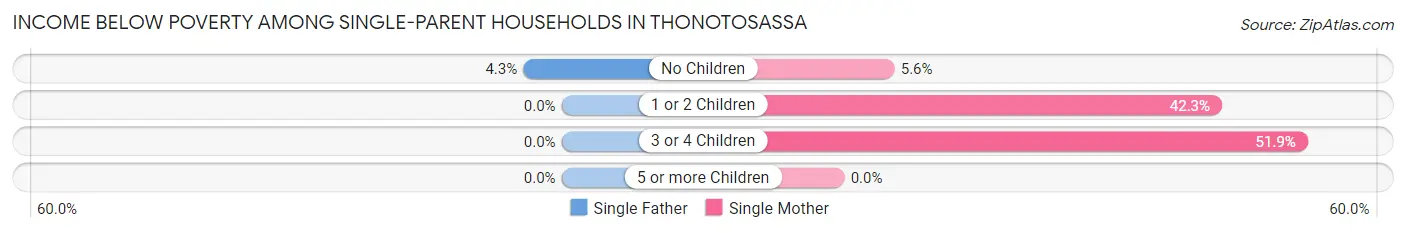
| Children | Single Father | Single Mother |
| No Children | 7 (4.3%) | 21 (5.6%) |
| 1 or 2 Children | 0 (0.0%) | 101 (42.3%) |
| 3 or 4 Children | 0 (0.0%) | 28 (51.8%) |
| 5 or more Children | 0 (0.0%) | 0 (0.0%) |
| Total | 7 (2.0%) | 150 (22.5%) |
Income Below Poverty Among Married-Couple vs Single-Parent Households in Thonotosassa
The poverty data for Thonotosassa shows that 327 of the married-couple family households (15.2%) and 157 of the single-parent households (15.5%) are living below the poverty level. Within the married-couple family households, those with 5 or more children have the highest poverty rate, with 26 households (100.0%) falling below the poverty line. Among the single-parent households, those with 3 or 4 children have the highest poverty rate, with 28 household (51.8%) living below poverty.
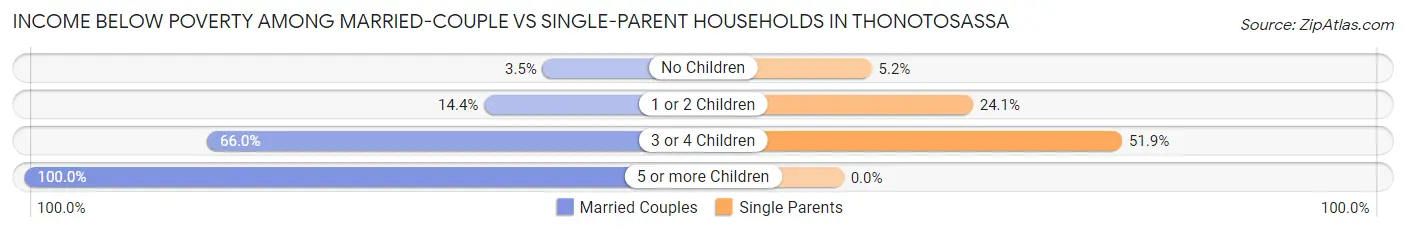
| Children | Married-Couple Families | Single-Parent Households |
| No Children | 43 (3.5%) | 28 (5.2%) |
| 1 or 2 Children | 93 (14.4%) | 101 (24.0%) |
| 3 or 4 Children | 165 (66.0%) | 28 (51.8%) |
| 5 or more Children | 26 (100.0%) | 0 (0.0%) |
| Total | 327 (15.2%) | 157 (15.5%) |
Race in Thonotosassa
The most populous races in Thonotosassa are White / Caucasian (9,447 | 67.2%), Black / African American (2,161 | 15.4%), and Hispanic or Latino (1,883 | 13.4%).
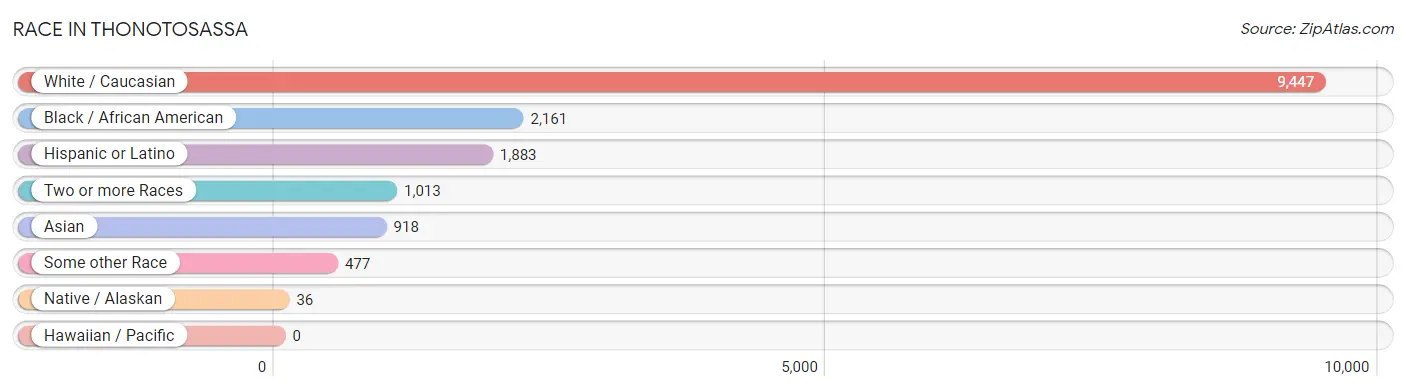
| Race | # Population | % Population |
| Asian | 918 | 6.5% |
| Black / African American | 2,161 | 15.4% |
| Hawaiian / Pacific | 0 | 0.0% |
| Hispanic or Latino | 1,883 | 13.4% |
| Native / Alaskan | 36 | 0.3% |
| White / Caucasian | 9,447 | 67.2% |
| Two or more Races | 1,013 | 7.2% |
| Some other Race | 477 | 3.4% |
| Total | 14,052 | 100.0% |
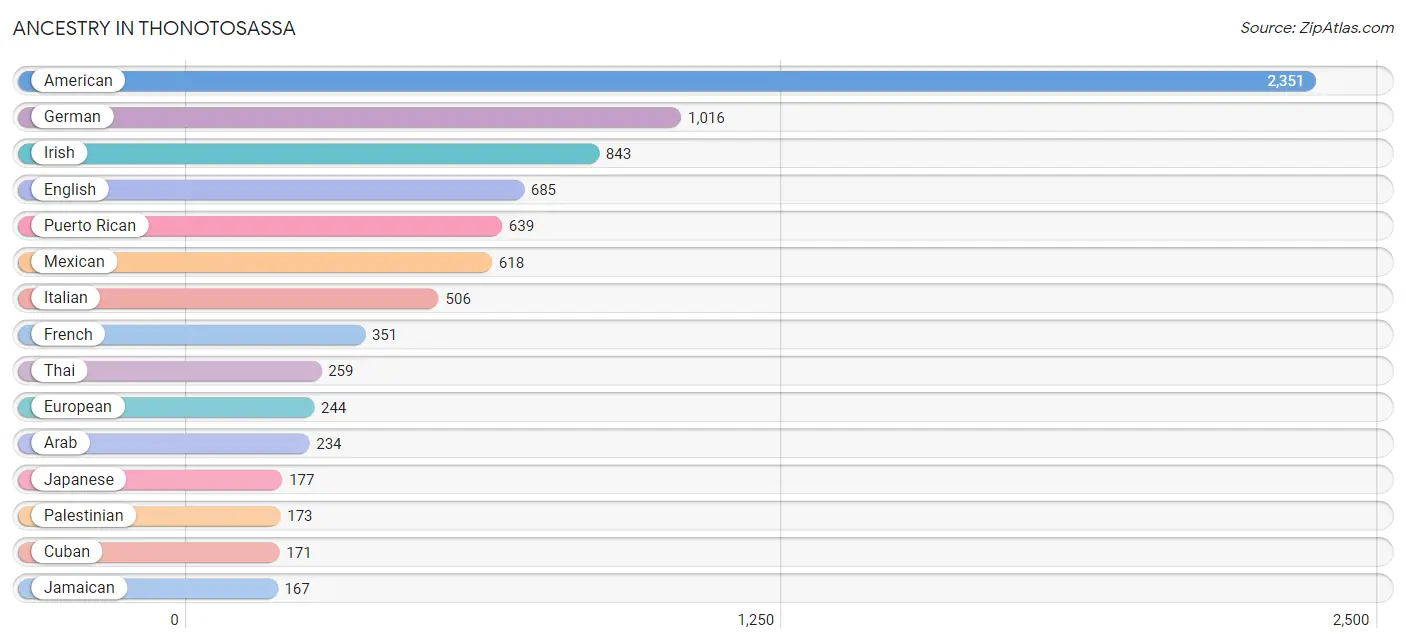
Ancestry in Thonotosassa
The most populous ancestries reported in Thonotosassa are American (2,351 | 16.7%), German (1,016 | 7.2%), Irish (843 | 6.0%), English (685 | 4.9%), and Puerto Rican (639 | 4.5%), together accounting for 39.4% of all Thonotosassa residents.
| Ancestry | # Population | % Population |
| African | 21 | 0.2% |
| American | 2,351 | 16.7% |
| Arab | 234 | 1.7% |
| Argentinean | 21 | 0.2% |
| Austrian | 5 | 0.0% |
| Bahamian | 46 | 0.3% |
| Bangladeshi | 7 | 0.1% |
| Belgian | 11 | 0.1% |
| Bhutanese | 15 | 0.1% |
| Brazilian | 8 | 0.1% |
| British | 112 | 0.8% |
| British West Indian | 17 | 0.1% |
| Cajun | 12 | 0.1% |
| Cape Verdean | 17 | 0.1% |
| Celtic | 11 | 0.1% |
| Central American | 110 | 0.8% |
| Cherokee | 30 | 0.2% |
| Choctaw | 6 | 0.0% |
| Colombian | 63 | 0.4% |
| Cuban | 171 | 1.2% |
| Czech | 36 | 0.3% |
| Danish | 8 | 0.1% |
| Dominican | 17 | 0.1% |
| Dutch | 48 | 0.3% |
| Eastern European | 19 | 0.1% |
| Egyptian | 12 | 0.1% |
| English | 685 | 4.9% |
| European | 244 | 1.7% |
| Filipino | 10 | 0.1% |
| Finnish | 158 | 1.1% |
| French | 351 | 2.5% |
| French Canadian | 4 | 0.0% |
| German | 1,016 | 7.2% |
| Greek | 5 | 0.0% |
| Guatemalan | 88 | 0.6% |
| Honduran | 16 | 0.1% |
| Hungarian | 20 | 0.1% |
| Indian (Asian) | 37 | 0.3% |
| Irish | 843 | 6.0% |
| Italian | 506 | 3.6% |
| Jamaican | 167 | 1.2% |
| Japanese | 177 | 1.3% |
| Jordanian | 74 | 0.5% |
| Lithuanian | 5 | 0.0% |
| Mexican | 618 | 4.4% |
| Nigerian | 35 | 0.3% |
| Norwegian | 58 | 0.4% |
| Palestinian | 173 | 1.2% |
| Pennsylvania German | 10 | 0.1% |
| Polish | 133 | 0.9% |
| Portuguese | 42 | 0.3% |
| Puerto Rican | 639 | 4.5% |
| Russian | 126 | 0.9% |
| Salvadoran | 6 | 0.0% |
| Scandinavian | 10 | 0.1% |
| Scotch-Irish | 35 | 0.3% |
| Scottish | 154 | 1.1% |
| Slovak | 9 | 0.1% |
| South American | 109 | 0.8% |
| Spaniard | 111 | 0.8% |
| Spanish | 38 | 0.3% |
| Sri Lankan | 21 | 0.2% |
| Subsaharan African | 82 | 0.6% |
| Swedish | 139 | 1.0% |
| Swiss | 10 | 0.1% |
| Syrian | 5 | 0.0% |
| Thai | 259 | 1.8% |
| Trinidadian and Tobagonian | 37 | 0.3% |
| Ukrainian | 119 | 0.9% |
| Venezuelan | 25 | 0.2% |
| Welsh | 51 | 0.4% | View All 71 Rows |
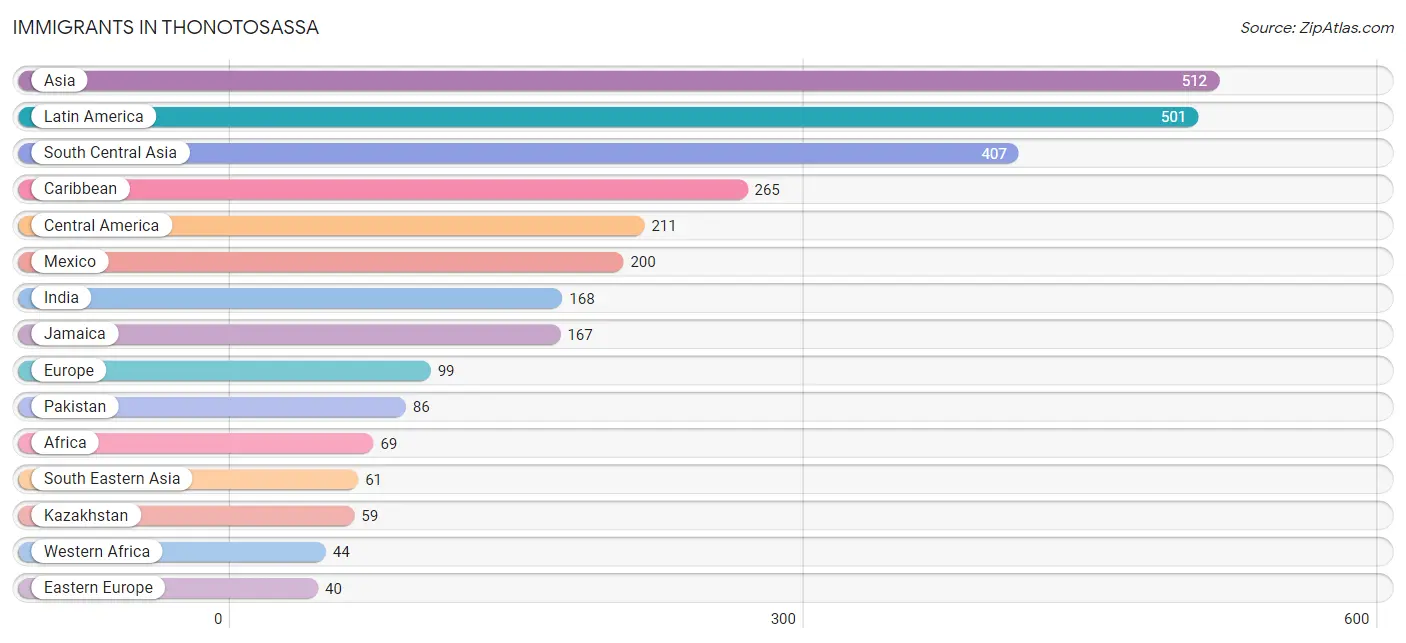
Immigrants in Thonotosassa
The most numerous immigrant groups reported in Thonotosassa came from Asia (512 | 3.6%), Latin America (501 | 3.6%), South Central Asia (407 | 2.9%), Caribbean (265 | 1.9%), and Central America (211 | 1.5%), together accounting for 13.5% of all Thonotosassa residents.
| Immigration Origin | # Population | % Population |
| Africa | 69 | 0.5% |
| Asia | 512 | 3.6% |
| Bahamas | 29 | 0.2% |
| Bangladesh | 21 | 0.2% |
| Brazil | 8 | 0.1% |
| Canada | 23 | 0.2% |
| Caribbean | 265 | 1.9% |
| Central America | 211 | 1.5% |
| Cuba | 15 | 0.1% |
| Eastern Africa | 13 | 0.1% |
| Eastern Europe | 40 | 0.3% |
| Egypt | 12 | 0.1% |
| England | 13 | 0.1% |
| Europe | 99 | 0.7% |
| France | 15 | 0.1% |
| Germany | 23 | 0.2% |
| Honduras | 11 | 0.1% |
| India | 168 | 1.2% |
| Indonesia | 25 | 0.2% |
| Jamaica | 167 | 1.2% |
| Jordan | 25 | 0.2% |
| Kazakhstan | 59 | 0.4% |
| Latin America | 501 | 3.6% |
| Mexico | 200 | 1.4% |
| Nigeria | 35 | 0.3% |
| Northern Africa | 12 | 0.1% |
| Northern Europe | 21 | 0.2% |
| Pakistan | 86 | 0.6% |
| South America | 25 | 0.2% |
| South Central Asia | 407 | 2.9% |
| South Eastern Asia | 61 | 0.4% |
| Thailand | 26 | 0.2% |
| Trinidad and Tobago | 37 | 0.3% |
| Uganda | 13 | 0.1% |
| Ukraine | 40 | 0.3% |
| Venezuela | 17 | 0.1% |
| Vietnam | 10 | 0.1% |
| Western Africa | 44 | 0.3% |
| Western Asia | 25 | 0.2% |
| Western Europe | 38 | 0.3% | View All 40 Rows |
Sex and Age in Thonotosassa
Sex and Age in Thonotosassa
The most populous age groups in Thonotosassa are 30 to 34 Years (815 | 11.0%) for men and 10 to 14 Years (598 | 9.0%) for women.
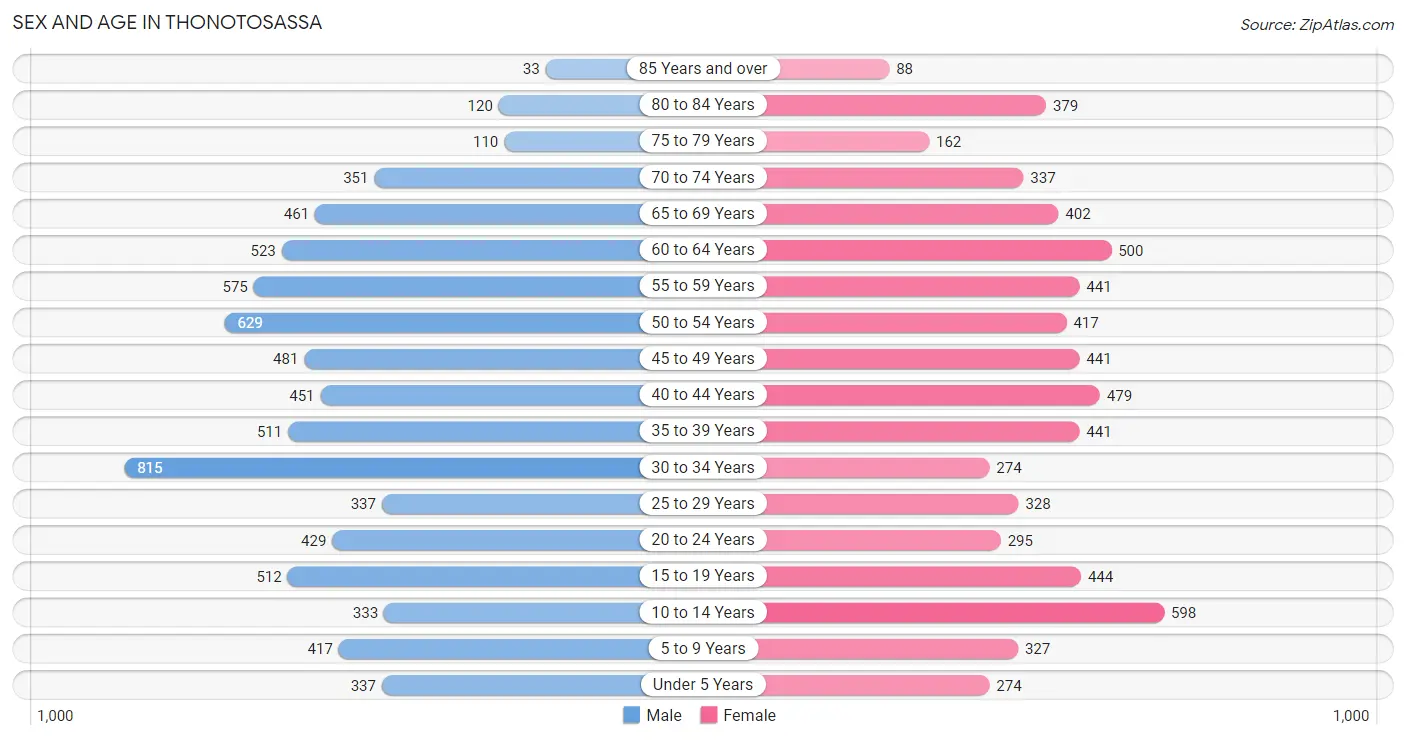
| Age Bracket | Male | Female |
| Under 5 Years | 337 (4.5%) | 274 (4.1%) |
| 5 to 9 Years | 417 (5.6%) | 327 (4.9%) |
| 10 to 14 Years | 333 (4.5%) | 598 (9.0%) |
| 15 to 19 Years | 512 (6.9%) | 444 (6.7%) |
| 20 to 24 Years | 429 (5.8%) | 295 (4.4%) |
| 25 to 29 Years | 337 (4.5%) | 328 (5.0%) |
| 30 to 34 Years | 815 (11.0%) | 274 (4.1%) |
| 35 to 39 Years | 511 (6.9%) | 441 (6.7%) |
| 40 to 44 Years | 451 (6.1%) | 479 (7.2%) |
| 45 to 49 Years | 481 (6.5%) | 441 (6.7%) |
| 50 to 54 Years | 629 (8.5%) | 417 (6.3%) |
| 55 to 59 Years | 575 (7.7%) | 441 (6.7%) |
| 60 to 64 Years | 523 (7.0%) | 500 (7.5%) |
| 65 to 69 Years | 461 (6.2%) | 402 (6.1%) |
| 70 to 74 Years | 351 (4.7%) | 337 (5.1%) |
| 75 to 79 Years | 110 (1.5%) | 162 (2.4%) |
| 80 to 84 Years | 120 (1.6%) | 379 (5.7%) |
| 85 Years and over | 33 (0.4%) | 88 (1.3%) |
| Total | 7,425 (100.0%) | 6,627 (100.0%) |
Families and Households in Thonotosassa
Median Family Size in Thonotosassa
The median family size in Thonotosassa is 3.54 persons per family, with married-couple families (2,151 | 68.0%) accounting for the largest median family size of 3.64 persons per family. On the other hand, single male/father families (344 | 10.9%) represent the smallest median family size with 3.09 persons per family.
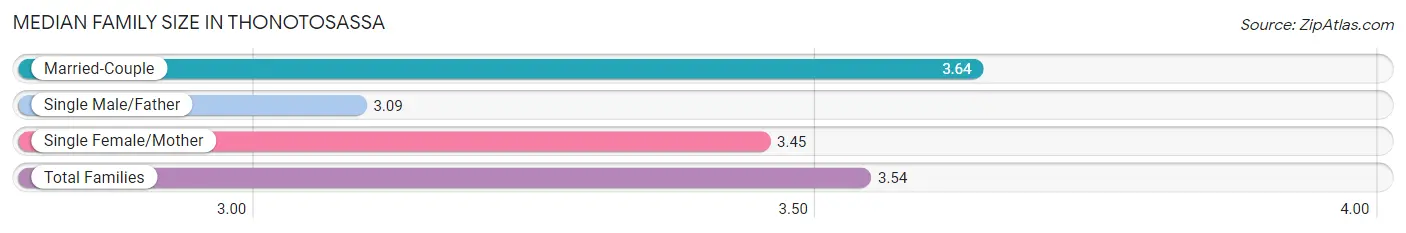
| Family Type | # Families | Family Size |
| Married-Couple | 2,151 (68.0%) | 3.64 |
| Single Male/Father | 344 (10.9%) | 3.09 |
| Single Female/Mother | 668 (21.1%) | 3.45 |
| Total Families | 3,163 (100.0%) | 3.54 |
Median Household Size in Thonotosassa
The median household size in Thonotosassa is 2.88 persons per household, with single female/mother households (668 | 13.8%) accounting for the largest median household size of 3.75 persons per household. non-family households (1,686 | 34.8%) represent the smallest median household size with 1.39 persons per household.
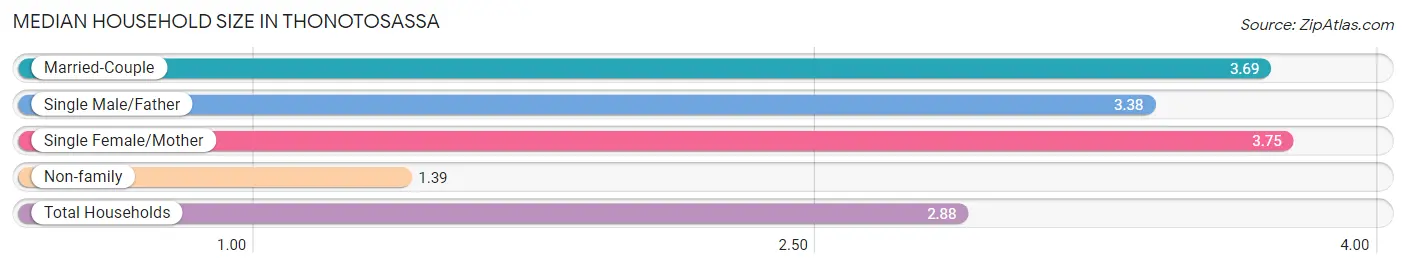
| Household Type | # Households | Household Size |
| Married-Couple | 2,151 (44.4%) | 3.69 |
| Single Male/Father | 344 (7.1%) | 3.38 |
| Single Female/Mother | 668 (13.8%) | 3.75 |
| Non-family | 1,686 (34.8%) | 1.39 |
| Total Households | 4,849 (100.0%) | 2.88 |
Household Size by Marriage Status in Thonotosassa
Out of a total of 4,849 households in Thonotosassa, 3,163 (65.2%) are family households, while 1,686 (34.8%) are nonfamily households. The most numerous type of family households are 2-person households, comprising 1,077, and the most common type of nonfamily households are 1-person households, comprising 1,223.
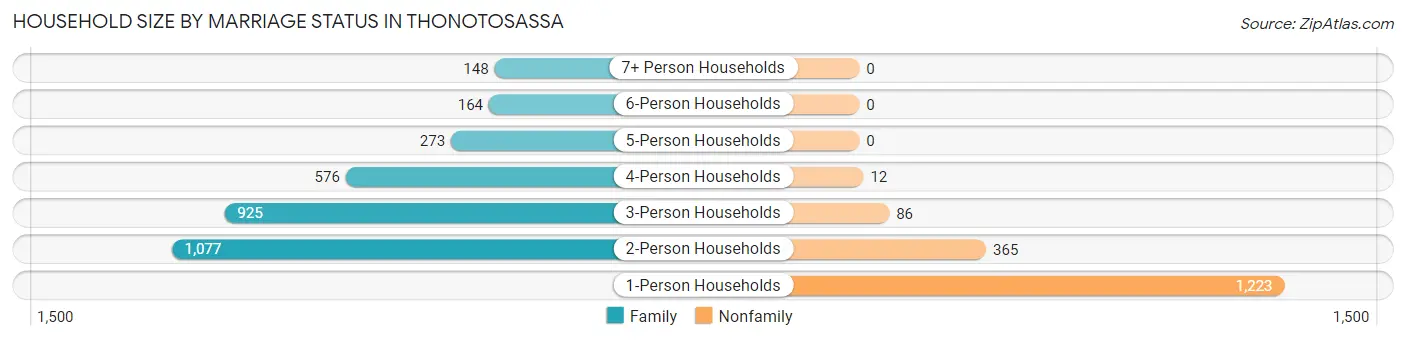
| Household Size | Family Households | Nonfamily Households |
| 1-Person Households | - | 1,223 (25.2%) |
| 2-Person Households | 1,077 (22.2%) | 365 (7.5%) |
| 3-Person Households | 925 (19.1%) | 86 (1.8%) |
| 4-Person Households | 576 (11.9%) | 12 (0.3%) |
| 5-Person Households | 273 (5.6%) | 0 (0.0%) |
| 6-Person Households | 164 (3.4%) | 0 (0.0%) |
| 7+ Person Households | 148 (3.0%) | 0 (0.0%) |
| Total | 3,163 (65.2%) | 1,686 (34.8%) |
Female Fertility in Thonotosassa
Fertility by Age in Thonotosassa
Average fertility rate in Thonotosassa is 64.0 births per 1,000 women. Women in the age bracket of 20 to 34 years have the highest fertility rate with 126.0 births per 1,000 women. Women in the age bracket of 20 to 34 years acount for 62.1% of all women with births.
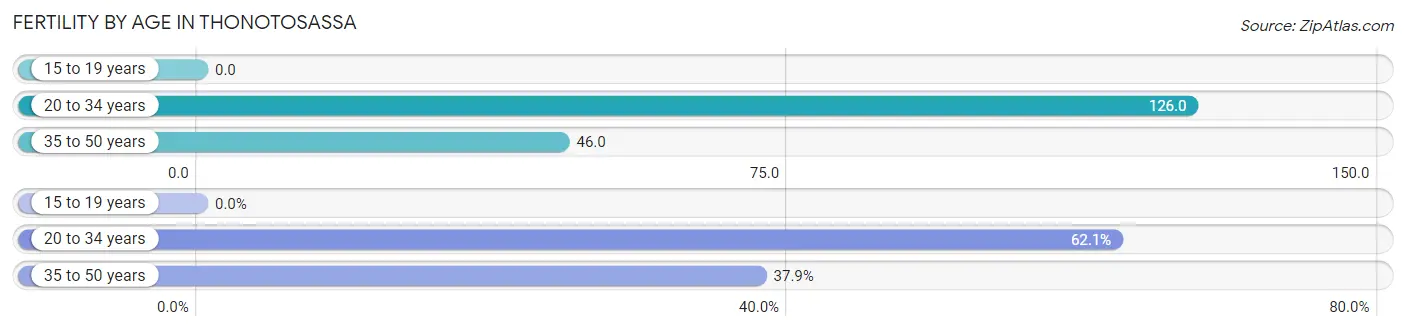
| Age Bracket | Women with Births | Births / 1,000 Women |
| 15 to 19 years | 0 (0.0%) | 0.0 |
| 20 to 34 years | 113 (62.1%) | 126.0 |
| 35 to 50 years | 69 (37.9%) | 46.0 |
| Total | 182 (100.0%) | 64.0 |
Fertility by Age by Marriage Status in Thonotosassa
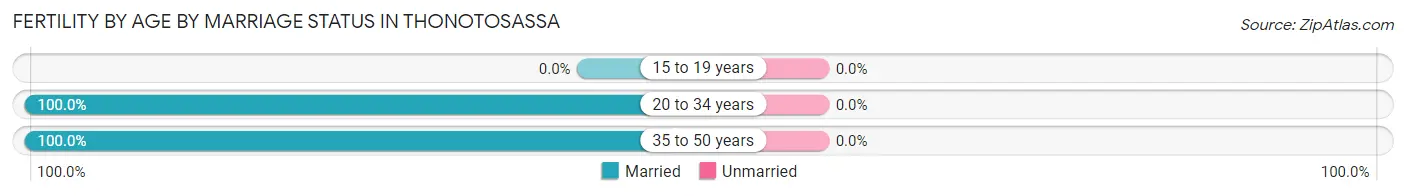
| Age Bracket | Married | Unmarried |
| 15 to 19 years | 0 (0.0%) | 0 (0.0%) |
| 20 to 34 years | 113 (100.0%) | 0 (0.0%) |
| 35 to 50 years | 69 (100.0%) | 0 (0.0%) |
| Total | 182 (100.0%) | 0 (0.0%) |
Fertility by Education in Thonotosassa
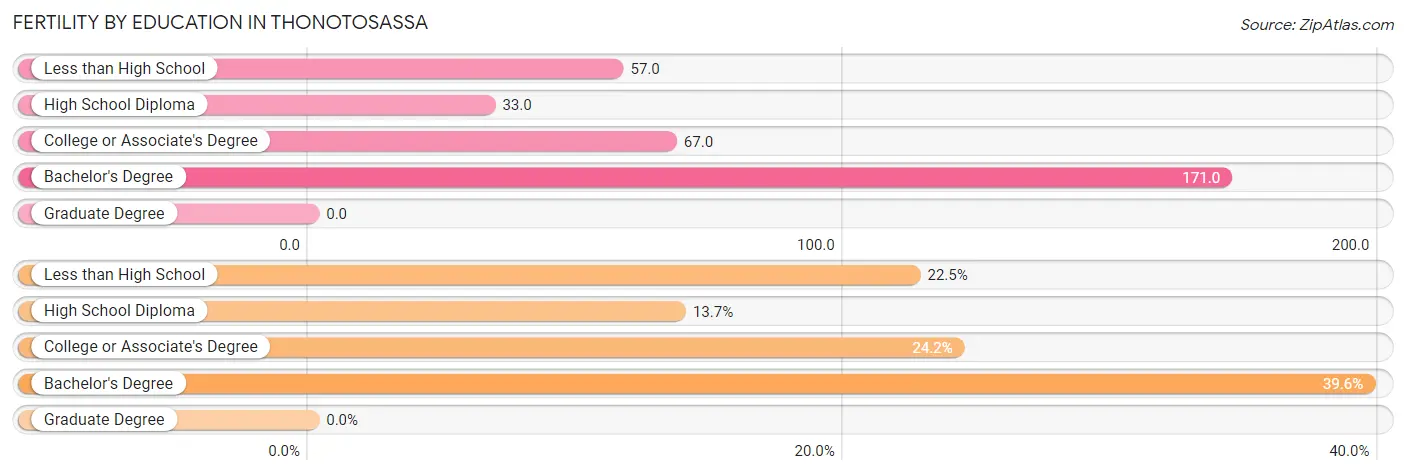
| Educational Attainment | Women with Births | Births / 1,000 Women |
| Less than High School | 41 (22.5%) | 57.0 |
| High School Diploma | 25 (13.7%) | 33.0 |
| College or Associate's Degree | 44 (24.2%) | 67.0 |
| Bachelor's Degree | 72 (39.6%) | 171.0 |
| Graduate Degree | 0 (0.0%) | 0.0 |
| Total | 182 (100.0%) | 64.0 |
Fertility by Education by Marriage Status in Thonotosassa
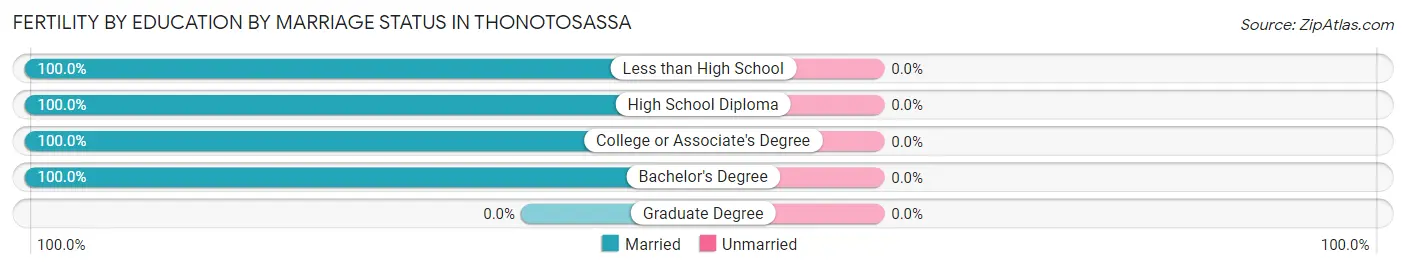
| Educational Attainment | Married | Unmarried |
| Less than High School | 41 (100.0%) | 0 (0.0%) |
| High School Diploma | 25 (100.0%) | 0 (0.0%) |
| College or Associate's Degree | 44 (100.0%) | 0 (0.0%) |
| Bachelor's Degree | 72 (100.0%) | 0 (0.0%) |
| Graduate Degree | 0 (0.0%) | 0 (0.0%) |
| Total | 182 (100.0%) | 0 (0.0%) |
Employment Characteristics in Thonotosassa
Employment by Class of Employer in Thonotosassa
Among the 5,982 employed individuals in Thonotosassa, private company employees (3,978 | 66.5%), local government employees (630 | 10.5%), and not-for-profit organizations (410 | 6.9%) make up the most common classes of employment.
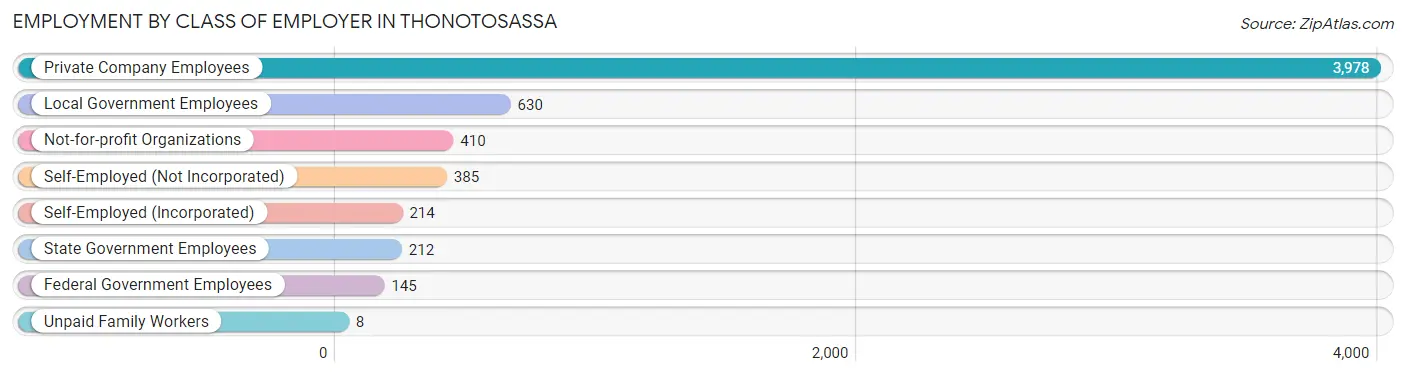
| Employer Class | # Employees | % Employees |
| Private Company Employees | 3,978 | 66.5% |
| Self-Employed (Incorporated) | 214 | 3.6% |
| Self-Employed (Not Incorporated) | 385 | 6.4% |
| Not-for-profit Organizations | 410 | 6.9% |
| Local Government Employees | 630 | 10.5% |
| State Government Employees | 212 | 3.5% |
| Federal Government Employees | 145 | 2.4% |
| Unpaid Family Workers | 8 | 0.1% |
| Total | 5,982 | 100.0% |
Employment Status by Age in Thonotosassa
According to the labor force statistics for Thonotosassa, out of the total population over 16 years of age (11,578), 55.9% or 6,472 individuals are in the labor force, with 5.7% or 369 of them unemployed. The age group with the highest labor force participation rate is 20 to 24 years, with 81.5% or 590 individuals in the labor force. Within the labor force, the 16 to 19 years age range has the highest percentage of unemployed individuals, with 46.8% or 161 of them being unemployed.
| Age Bracket | In Labor Force | Unemployed |
| 16 to 19 Years | 344 (44.8%) | 161 (46.8%) |
| 20 to 24 Years | 590 (81.5%) | 60 (10.2%) |
| 25 to 29 Years | 521 (78.3%) | 50 (9.6%) |
| 30 to 34 Years | 699 (64.2%) | 6 (0.9%) |
| 35 to 44 Years | 1,427 (75.8%) | 16 (1.1%) |
| 45 to 54 Years | 1,509 (76.7%) | 23 (1.5%) |
| 55 to 59 Years | 560 (55.1%) | 45 (8.0%) |
| 60 to 64 Years | 486 (47.5%) | 0 (0.0%) |
| 65 to 74 Years | 312 (20.1%) | 6 (1.9%) |
| 75 Years and over | 29 (3.3%) | 0 (0.0%) |
| Total | 6,472 (55.9%) | 369 (5.7%) |
Employment Status by Educational Attainment in Thonotosassa
According to labor force statistics for Thonotosassa, 68.0% of individuals (5,197) out of the total population between 25 and 64 years of age (7,643) are in the labor force, with 2.7% or 140 of them being unemployed. The group with the highest labor force participation rate are those with the educational attainment of bachelor's degree or higher, with 80.3% or 1,566 individuals in the labor force. Within the labor force, individuals with less than high school education have the highest percentage of unemployment, with 3.5% or 22 of them being unemployed.
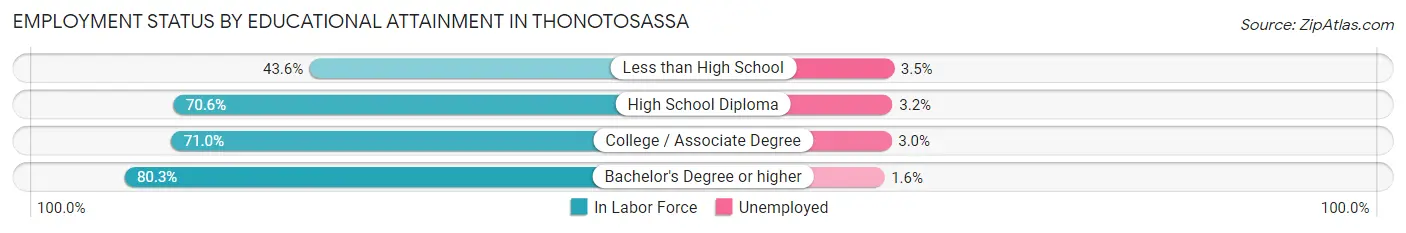
| Educational Attainment | In Labor Force | Unemployed |
| Less than High School | 630 (43.6%) | 51 (3.5%) |
| High School Diploma | 1,844 (70.6%) | 84 (3.2%) |
| College / Associate Degree | 1,161 (71.0%) | 49 (3.0%) |
| Bachelor's Degree or higher | 1,566 (80.3%) | 31 (1.6%) |
| Total | 5,197 (68.0%) | 206 (2.7%) |
Employment Occupations by Sex in Thonotosassa
Management, Business, Science and Arts Occupations
The most common Management, Business, Science and Arts occupations in Thonotosassa are Management (579 | 9.5%), Community & Social Service (536 | 8.8%), Health Diagnosing & Treating (481 | 7.9%), Business & Financial (411 | 6.7%), and Education Instruction & Library (376 | 6.2%).
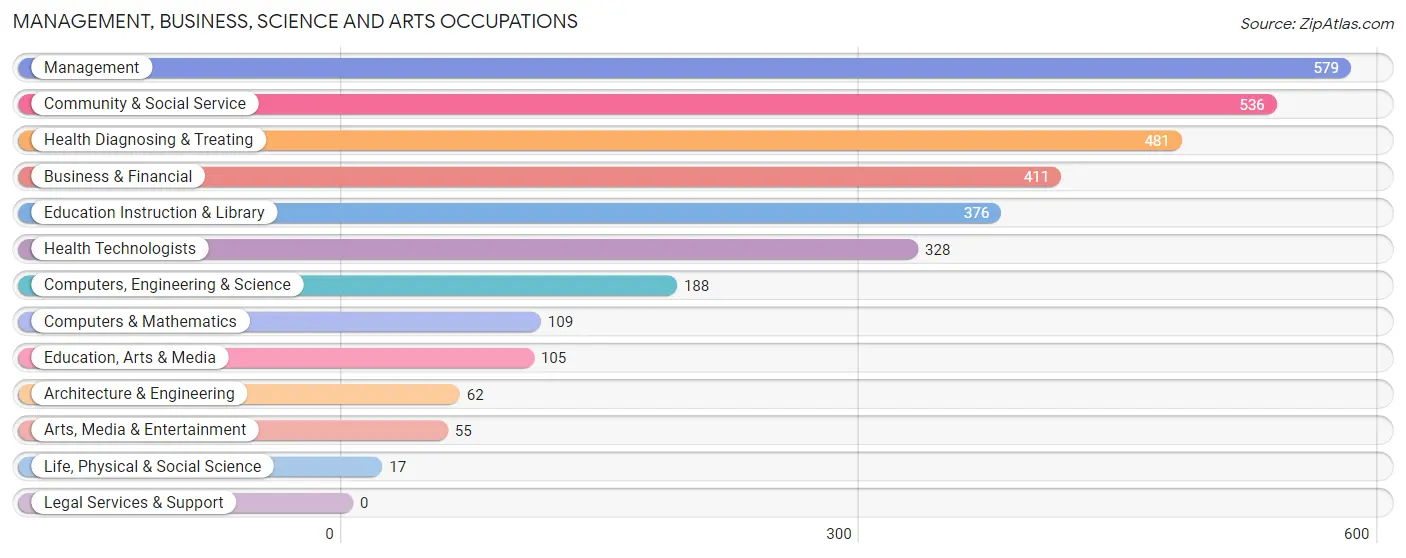
Management, Business, Science and Arts Occupations by Sex
Within the Management, Business, Science and Arts occupations in Thonotosassa, the most male-oriented occupations are Management (83.4%), Architecture & Engineering (75.8%), and Computers & Mathematics (72.5%), while the most female-oriented occupations are Life, Physical & Social Science (100.0%), Arts, Media & Entertainment (61.8%), and Education, Arts & Media (60.0%).
| Occupation | Male | Female |
| Management | 483 (83.4%) | 96 (16.6%) |
| Business & Financial | 195 (47.4%) | 216 (52.5%) |
| Computers, Engineering & Science | 126 (67.0%) | 62 (33.0%) |
| Computers & Mathematics | 79 (72.5%) | 30 (27.5%) |
| Architecture & Engineering | 47 (75.8%) | 15 (24.2%) |
| Life, Physical & Social Science | 0 (0.0%) | 17 (100.0%) |
| Community & Social Service | 261 (48.7%) | 275 (51.3%) |
| Education, Arts & Media | 42 (40.0%) | 63 (60.0%) |
| Legal Services & Support | 0 (0.0%) | 0 (0.0%) |
| Education Instruction & Library | 198 (52.7%) | 178 (47.3%) |
| Arts, Media & Entertainment | 21 (38.2%) | 34 (61.8%) |
| Health Diagnosing & Treating | 214 (44.5%) | 267 (55.5%) |
| Health Technologists | 197 (60.1%) | 131 (39.9%) |
| Total (Category) | 1,279 (58.3%) | 916 (41.7%) |
| Total (Overall) | 3,890 (63.8%) | 2,209 (36.2%) |
Services Occupations
The most common Services occupations in Thonotosassa are Cleaning & Maintenance (267 | 4.4%), Security & Protection (180 | 2.9%), Food Preparation & Serving (139 | 2.3%), Firefighting & Prevention (121 | 2.0%), and Personal Care & Service (117 | 1.9%).
Services Occupations by Sex
Within the Services occupations in Thonotosassa, the most male-oriented occupations are Cleaning & Maintenance (76.8%), Firefighting & Prevention (62.8%), and Security & Protection (48.3%), while the most female-oriented occupations are Law Enforcement (81.4%), Healthcare Support (71.3%), and Food Preparation & Serving (58.3%).
| Occupation | Male | Female |
| Healthcare Support | 27 (28.7%) | 67 (71.3%) |
| Security & Protection | 87 (48.3%) | 93 (51.7%) |
| Firefighting & Prevention | 76 (62.8%) | 45 (37.2%) |
| Law Enforcement | 11 (18.6%) | 48 (81.4%) |
| Food Preparation & Serving | 58 (41.7%) | 81 (58.3%) |
| Cleaning & Maintenance | 205 (76.8%) | 62 (23.2%) |
| Personal Care & Service | 56 (47.9%) | 61 (52.1%) |
| Total (Category) | 433 (54.3%) | 364 (45.7%) |
| Total (Overall) | 3,890 (63.8%) | 2,209 (36.2%) |
Sales and Office Occupations
The most common Sales and Office occupations in Thonotosassa are Office & Administration (672 | 11.0%), and Sales & Related (521 | 8.5%).
Sales and Office Occupations by Sex
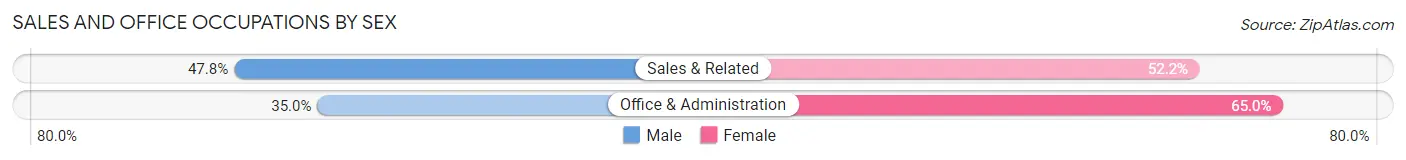
| Occupation | Male | Female |
| Sales & Related | 249 (47.8%) | 272 (52.2%) |
| Office & Administration | 235 (35.0%) | 437 (65.0%) |
| Total (Category) | 484 (40.6%) | 709 (59.4%) |
| Total (Overall) | 3,890 (63.8%) | 2,209 (36.2%) |
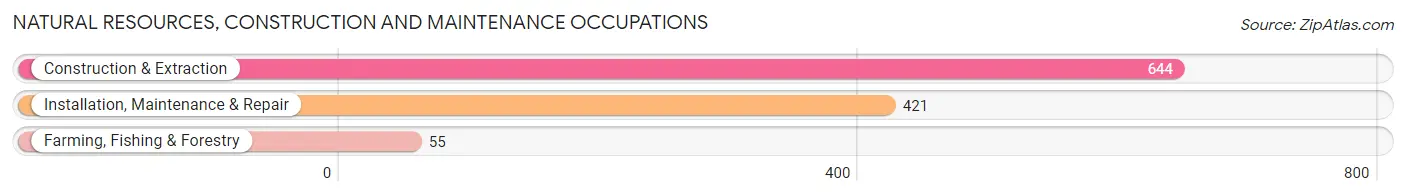
Natural Resources, Construction and Maintenance Occupations
The most common Natural Resources, Construction and Maintenance occupations in Thonotosassa are Construction & Extraction (644 | 10.6%), Installation, Maintenance & Repair (421 | 6.9%), and Farming, Fishing & Forestry (55 | 0.9%).
Natural Resources, Construction and Maintenance Occupations by Sex
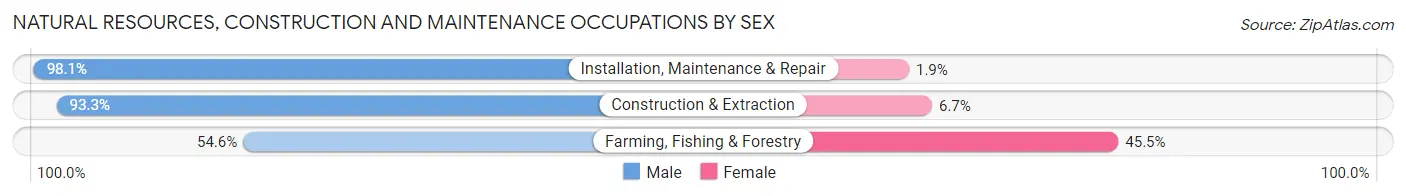
| Occupation | Male | Female |
| Farming, Fishing & Forestry | 30 (54.5%) | 25 (45.5%) |
| Construction & Extraction | 601 (93.3%) | 43 (6.7%) |
| Installation, Maintenance & Repair | 413 (98.1%) | 8 (1.9%) |
| Total (Category) | 1,044 (93.2%) | 76 (6.8%) |
| Total (Overall) | 3,890 (63.8%) | 2,209 (36.2%) |
Production, Transportation and Moving Occupations
The most common Production, Transportation and Moving occupations in Thonotosassa are Production (304 | 5.0%), Transportation (295 | 4.8%), and Material Moving (195 | 3.2%).
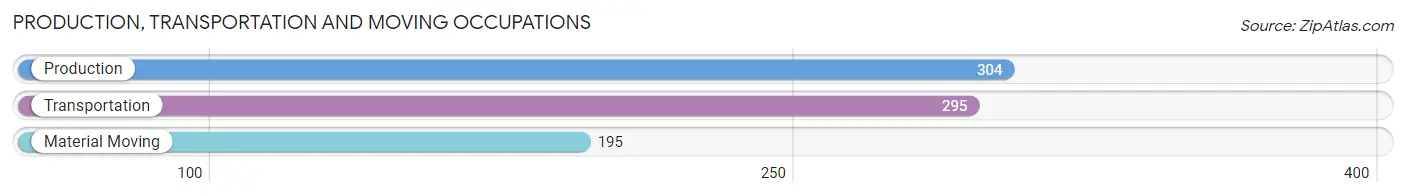
Production, Transportation and Moving Occupations by Sex
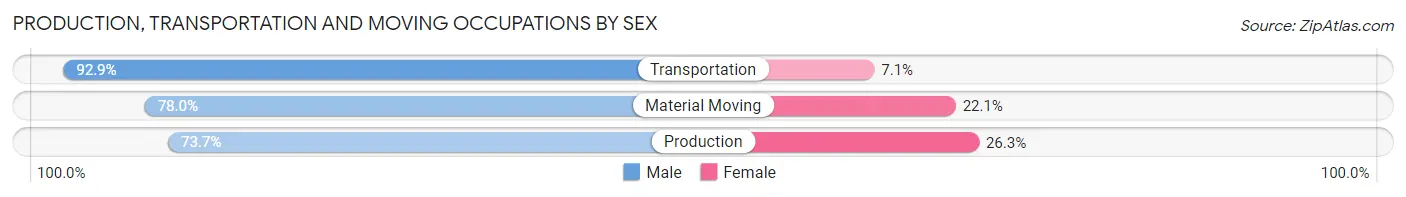
| Occupation | Male | Female |
| Production | 224 (73.7%) | 80 (26.3%) |
| Transportation | 274 (92.9%) | 21 (7.1%) |
| Material Moving | 152 (77.9%) | 43 (22.1%) |
| Total (Category) | 650 (81.9%) | 144 (18.1%) |
| Total (Overall) | 3,890 (63.8%) | 2,209 (36.2%) |
Employment Industries by Sex in Thonotosassa
Employment Industries in Thonotosassa
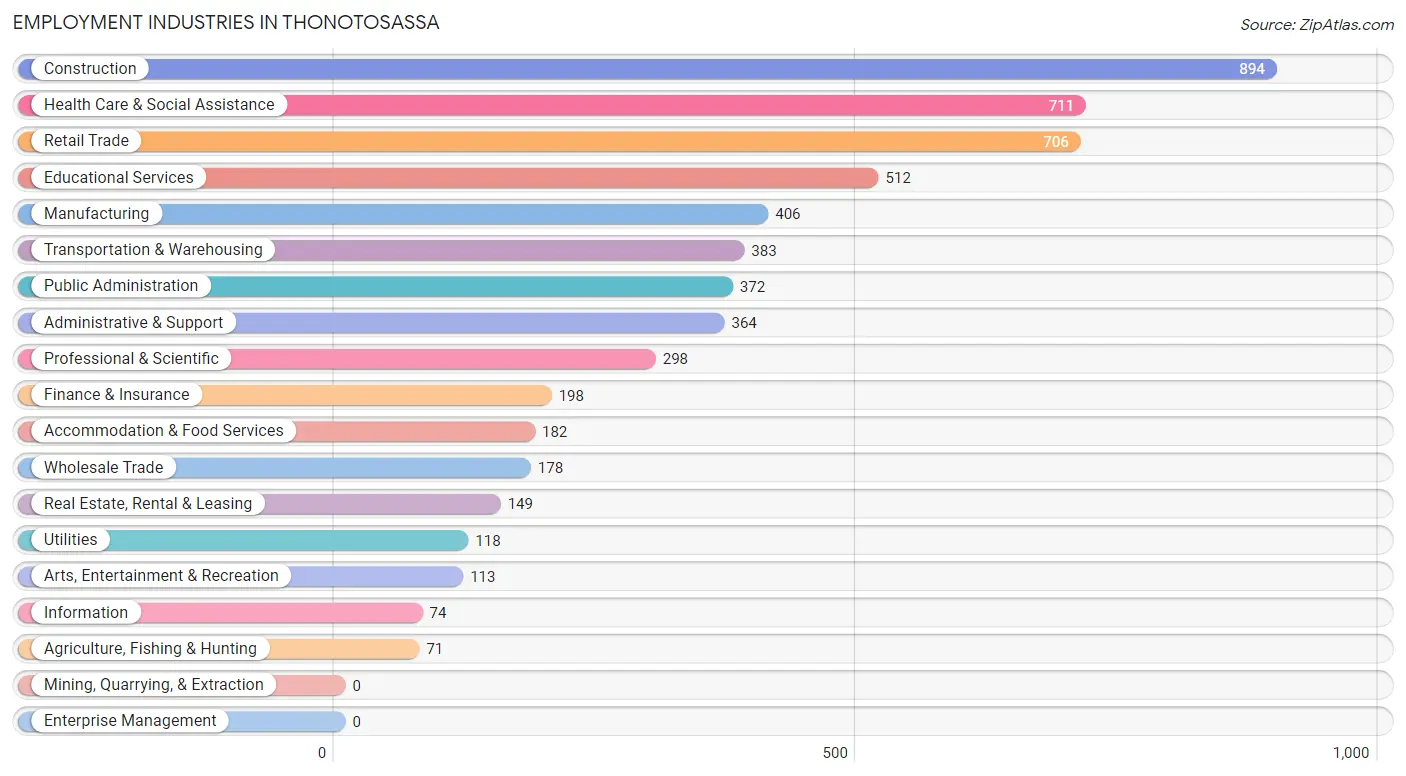
The major employment industries in Thonotosassa include Construction (894 | 14.7%), Health Care & Social Assistance (711 | 11.7%), Retail Trade (706 | 11.6%), Educational Services (512 | 8.4%), and Manufacturing (406 | 6.7%).
Employment Industries by Sex in Thonotosassa
The Thonotosassa industries that see more men than women are Utilities (95.8%), Construction (87.1%), and Transportation & Warehousing (83.3%), whereas the industries that tend to have a higher number of women are Arts, Entertainment & Recreation (69.9%), Finance & Insurance (66.7%), and Health Care & Social Assistance (60.3%).
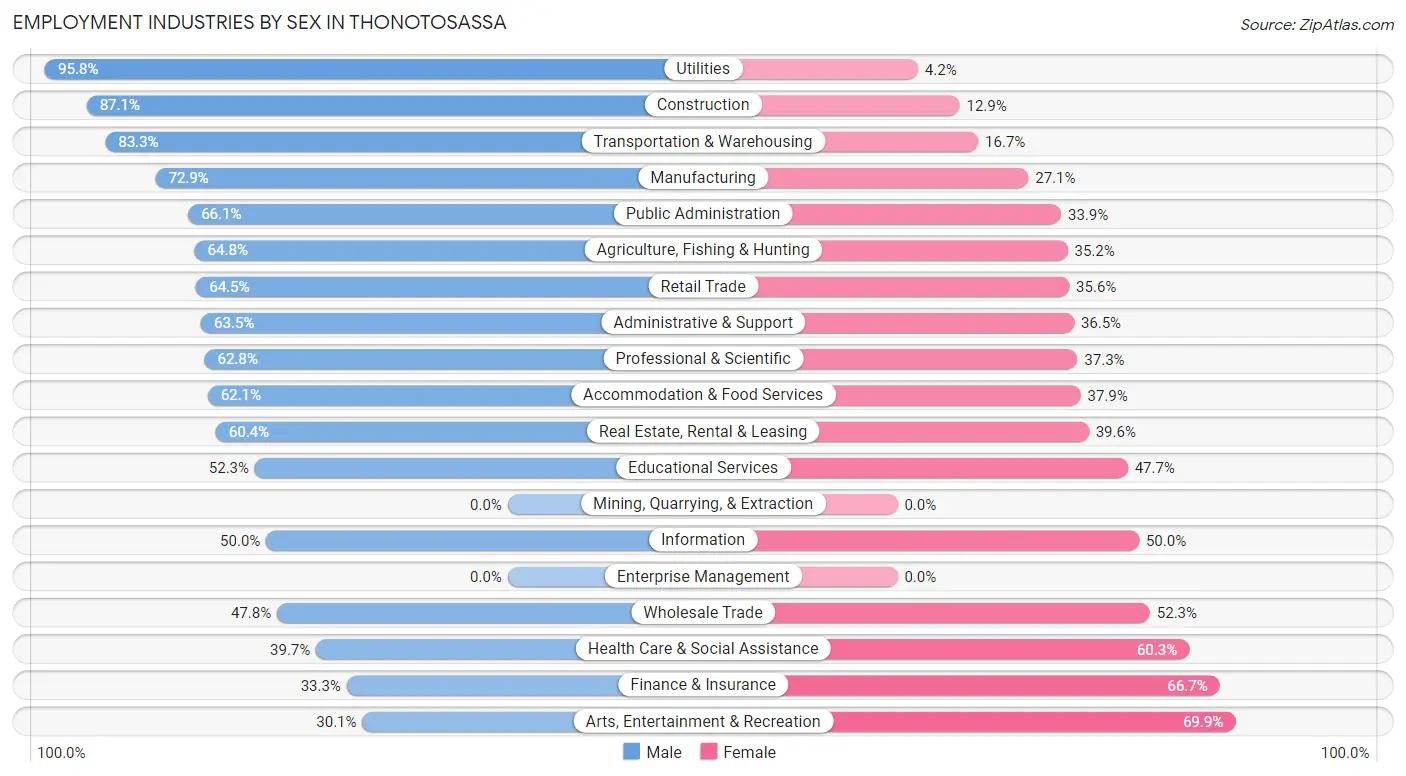
| Industry | Male | Female |
| Agriculture, Fishing & Hunting | 46 (64.8%) | 25 (35.2%) |
| Mining, Quarrying, & Extraction | 0 (0.0%) | 0 (0.0%) |
| Construction | 779 (87.1%) | 115 (12.9%) |
| Manufacturing | 296 (72.9%) | 110 (27.1%) |
| Wholesale Trade | 85 (47.7%) | 93 (52.2%) |
| Retail Trade | 455 (64.4%) | 251 (35.5%) |
| Transportation & Warehousing | 319 (83.3%) | 64 (16.7%) |
| Utilities | 113 (95.8%) | 5 (4.2%) |
| Information | 37 (50.0%) | 37 (50.0%) |
| Finance & Insurance | 66 (33.3%) | 132 (66.7%) |
| Real Estate, Rental & Leasing | 90 (60.4%) | 59 (39.6%) |
| Professional & Scientific | 187 (62.7%) | 111 (37.2%) |
| Enterprise Management | 0 (0.0%) | 0 (0.0%) |
| Administrative & Support | 231 (63.5%) | 133 (36.5%) |
| Educational Services | 268 (52.3%) | 244 (47.7%) |
| Health Care & Social Assistance | 282 (39.7%) | 429 (60.3%) |
| Arts, Entertainment & Recreation | 34 (30.1%) | 79 (69.9%) |
| Accommodation & Food Services | 113 (62.1%) | 69 (37.9%) |
| Public Administration | 246 (66.1%) | 126 (33.9%) |
| Total | 3,890 (63.8%) | 2,209 (36.2%) |
Education in Thonotosassa
School Enrollment in Thonotosassa
The most common levels of schooling among the 2,896 students in Thonotosassa are elementary school (731 | 25.2%), middle school (706 | 24.4%), and high school (693 | 23.9%).
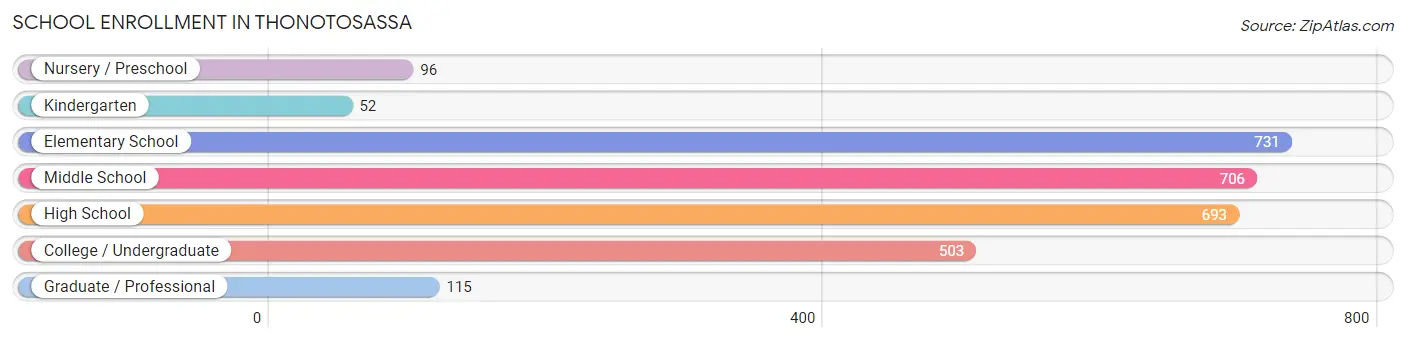
| School Level | # Students | % Students |
| Nursery / Preschool | 96 | 3.3% |
| Kindergarten | 52 | 1.8% |
| Elementary School | 731 | 25.2% |
| Middle School | 706 | 24.4% |
| High School | 693 | 23.9% |
| College / Undergraduate | 503 | 17.4% |
| Graduate / Professional | 115 | 4.0% |
| Total | 2,896 | 100.0% |
School Enrollment by Age by Funding Source in Thonotosassa
Out of a total of 2,896 students who are enrolled in schools in Thonotosassa, 979 (33.8%) attend a private institution, while the remaining 1,917 (66.2%) are enrolled in public schools. The age group of 3 to 4 year olds has the highest likelihood of being enrolled in private schools, with 50 (61.0% in the age bracket) enrolled. Conversely, the age group of 18 to 19 year olds has the lowest likelihood of being enrolled in a private school, with 187 (95.4% in the age bracket) attending a public institution.
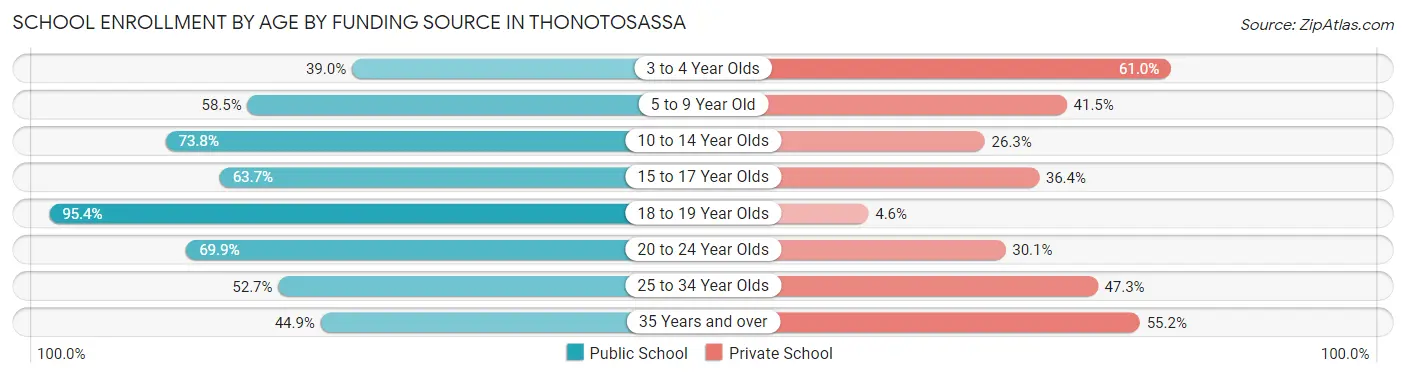
| Age Bracket | Public School | Private School |
| 3 to 4 Year Olds | 32 (39.0%) | 50 (61.0%) |
| 5 to 9 Year Old | 400 (58.5%) | 284 (41.5%) |
| 10 to 14 Year Olds | 677 (73.8%) | 241 (26.3%) |
| 15 to 17 Year Olds | 317 (63.6%) | 181 (36.3%) |
| 18 to 19 Year Olds | 187 (95.4%) | 9 (4.6%) |
| 20 to 24 Year Olds | 188 (69.9%) | 81 (30.1%) |
| 25 to 34 Year Olds | 29 (52.7%) | 26 (47.3%) |
| 35 Years and over | 87 (44.9%) | 107 (55.1%) |
| Total | 1,917 (66.2%) | 979 (33.8%) |
Educational Attainment by Field of Study in Thonotosassa
Business (797 | 30.6%), education (297 | 11.4%), science & technology (248 | 9.5%), arts & humanities (241 | 9.3%), and social sciences (210 | 8.1%) are the most common fields of study among 2,603 individuals in Thonotosassa who have obtained a bachelor's degree or higher.
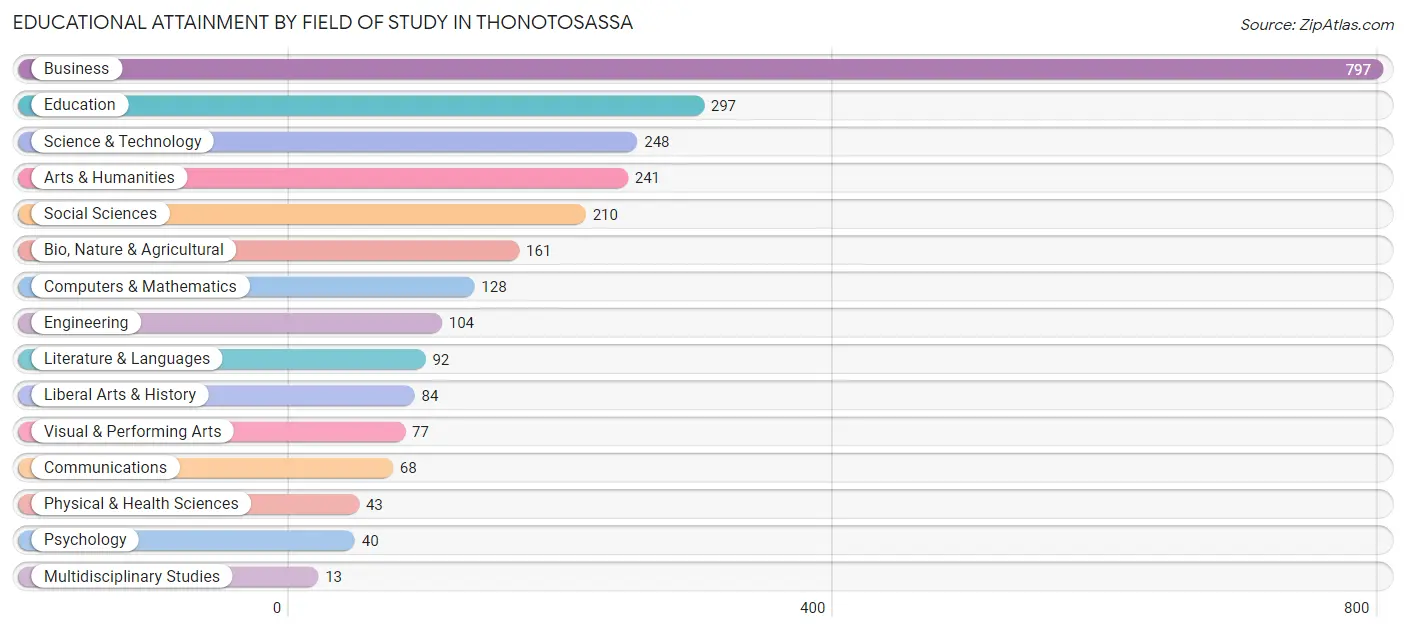
| Field of Study | # Graduates | % Graduates |
| Computers & Mathematics | 128 | 4.9% |
| Bio, Nature & Agricultural | 161 | 6.2% |
| Physical & Health Sciences | 43 | 1.7% |
| Psychology | 40 | 1.5% |
| Social Sciences | 210 | 8.1% |
| Engineering | 104 | 4.0% |
| Multidisciplinary Studies | 13 | 0.5% |
| Science & Technology | 248 | 9.5% |
| Business | 797 | 30.6% |
| Education | 297 | 11.4% |
| Literature & Languages | 92 | 3.5% |
| Liberal Arts & History | 84 | 3.2% |
| Visual & Performing Arts | 77 | 3.0% |
| Communications | 68 | 2.6% |
| Arts & Humanities | 241 | 9.3% |
| Total | 2,603 | 100.0% |
Transportation & Commute in Thonotosassa
Vehicle Availability by Sex in Thonotosassa
The most prevalent vehicle ownership categories in Thonotosassa are males with 1 vehicle (1,054, accounting for 27.2%) and females with 1 vehicle (452, making up 50.2%).
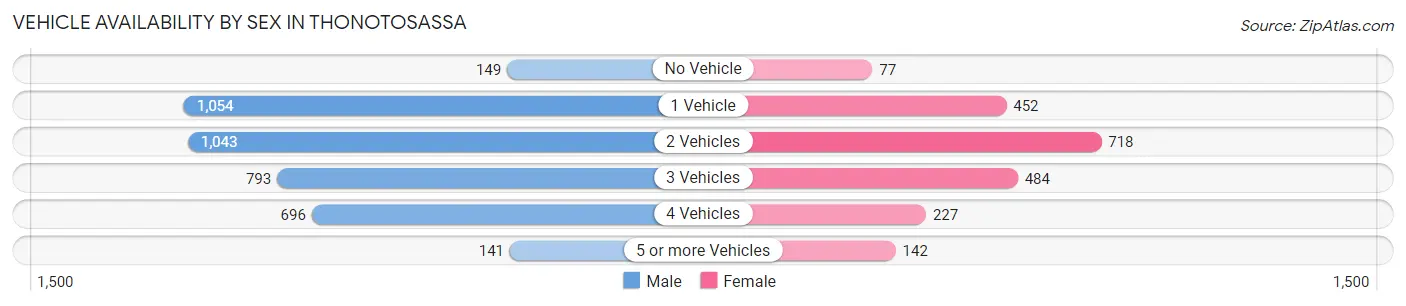
| Vehicles Available | Male | Female |
| No Vehicle | 149 (3.8%) | 77 (3.7%) |
| 1 Vehicle | 1,054 (27.2%) | 452 (21.5%) |
| 2 Vehicles | 1,043 (26.9%) | 718 (34.2%) |
| 3 Vehicles | 793 (20.5%) | 484 (23.1%) |
| 4 Vehicles | 696 (18.0%) | 227 (10.8%) |
| 5 or more Vehicles | 141 (3.6%) | 142 (6.8%) |
| Total | 3,876 (100.0%) | 2,100 (100.0%) |
Commute Time in Thonotosassa
The most frequently occuring commute durations in Thonotosassa are 30 to 34 minutes (1,316 commuters, 25.6%), 15 to 19 minutes (815 commuters, 15.9%), and 20 to 24 minutes (729 commuters, 14.2%).
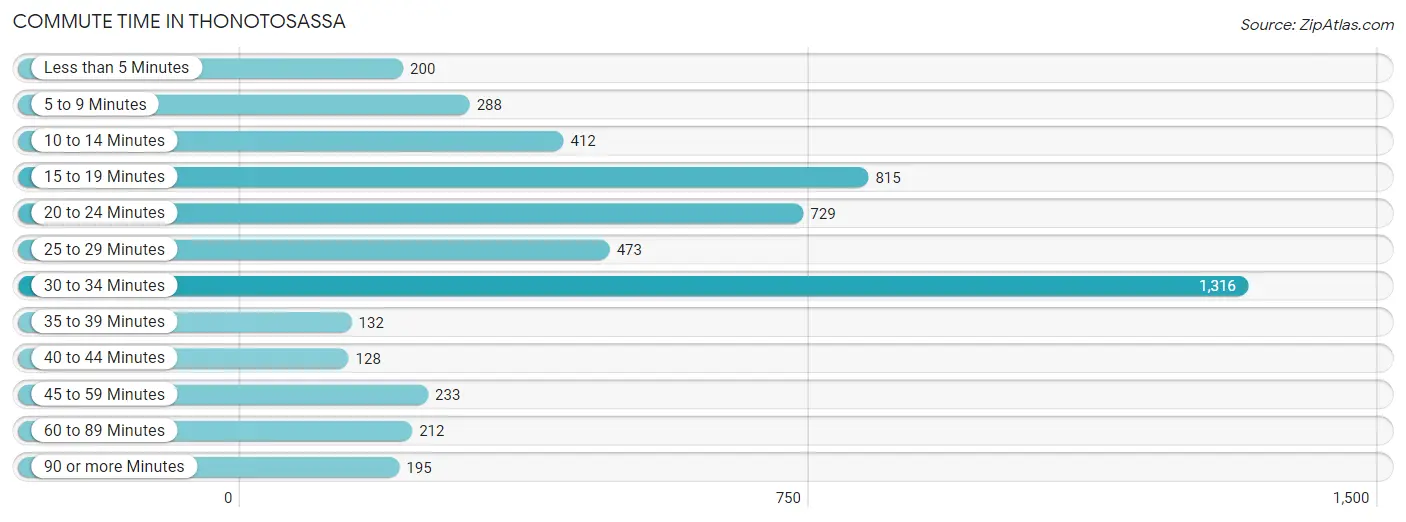
| Commute Time | # Commuters | % Commuters |
| Less than 5 Minutes | 200 | 3.9% |
| 5 to 9 Minutes | 288 | 5.6% |
| 10 to 14 Minutes | 412 | 8.0% |
| 15 to 19 Minutes | 815 | 15.9% |
| 20 to 24 Minutes | 729 | 14.2% |
| 25 to 29 Minutes | 473 | 9.2% |
| 30 to 34 Minutes | 1,316 | 25.6% |
| 35 to 39 Minutes | 132 | 2.6% |
| 40 to 44 Minutes | 128 | 2.5% |
| 45 to 59 Minutes | 233 | 4.5% |
| 60 to 89 Minutes | 212 | 4.1% |
| 90 or more Minutes | 195 | 3.8% |
Commute Time by Sex in Thonotosassa
The most common commute times in Thonotosassa are 30 to 34 minutes (944 commuters, 28.0%) for males and 30 to 34 minutes (372 commuters, 21.2%) for females.
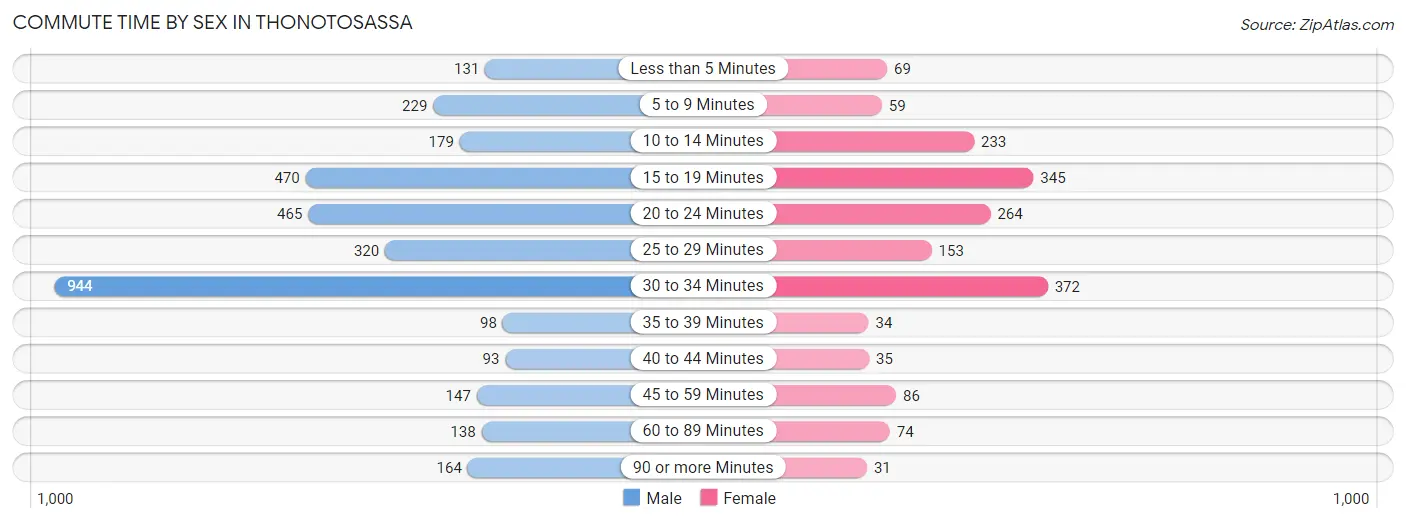
| Commute Time | Male | Female |
| Less than 5 Minutes | 131 (3.9%) | 69 (3.9%) |
| 5 to 9 Minutes | 229 (6.8%) | 59 (3.4%) |
| 10 to 14 Minutes | 179 (5.3%) | 233 (13.3%) |
| 15 to 19 Minutes | 470 (13.9%) | 345 (19.7%) |
| 20 to 24 Minutes | 465 (13.8%) | 264 (15.0%) |
| 25 to 29 Minutes | 320 (9.5%) | 153 (8.7%) |
| 30 to 34 Minutes | 944 (28.0%) | 372 (21.2%) |
| 35 to 39 Minutes | 98 (2.9%) | 34 (1.9%) |
| 40 to 44 Minutes | 93 (2.8%) | 35 (2.0%) |
| 45 to 59 Minutes | 147 (4.3%) | 86 (4.9%) |
| 60 to 89 Minutes | 138 (4.1%) | 74 (4.2%) |
| 90 or more Minutes | 164 (4.9%) | 31 (1.8%) |
Time of Departure to Work by Sex in Thonotosassa
The most frequent times of departure to work in Thonotosassa are 7:00 AM to 7:29 AM (584, 17.3%) for males and 7:00 AM to 7:29 AM (327, 18.6%) for females.
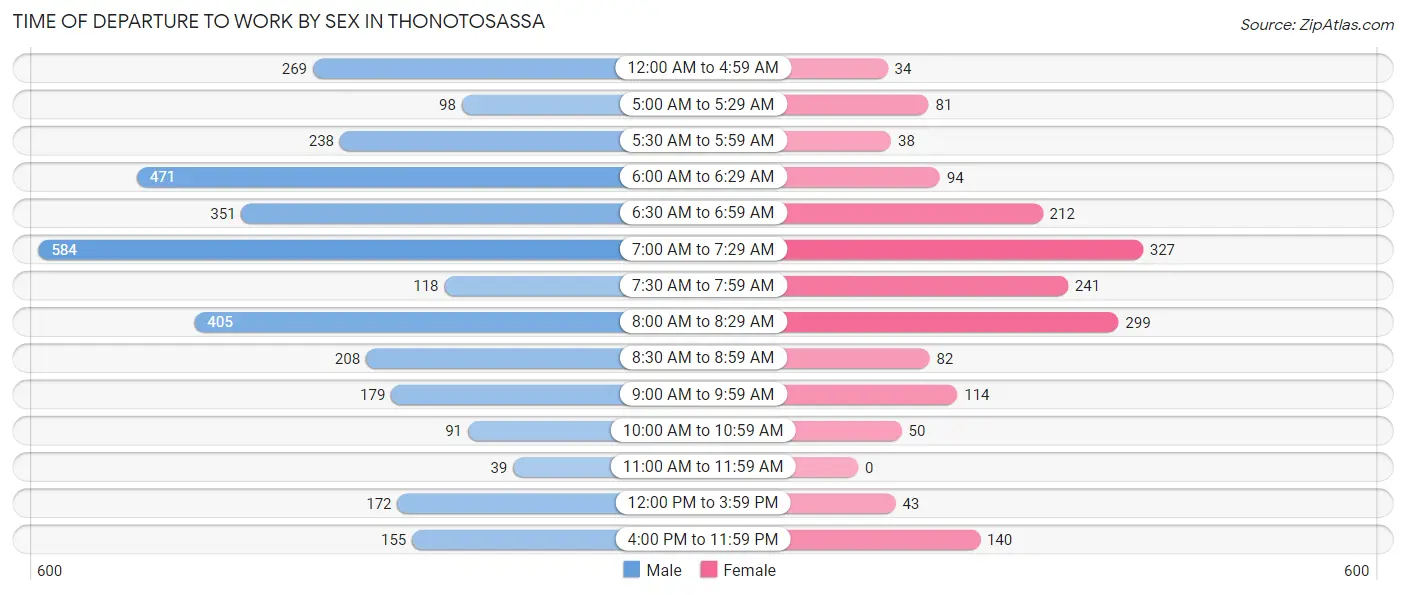
| Time of Departure | Male | Female |
| 12:00 AM to 4:59 AM | 269 (8.0%) | 34 (1.9%) |
| 5:00 AM to 5:29 AM | 98 (2.9%) | 81 (4.6%) |
| 5:30 AM to 5:59 AM | 238 (7.0%) | 38 (2.2%) |
| 6:00 AM to 6:29 AM | 471 (13.9%) | 94 (5.4%) |
| 6:30 AM to 6:59 AM | 351 (10.4%) | 212 (12.1%) |
| 7:00 AM to 7:29 AM | 584 (17.3%) | 327 (18.6%) |
| 7:30 AM to 7:59 AM | 118 (3.5%) | 241 (13.7%) |
| 8:00 AM to 8:29 AM | 405 (12.0%) | 299 (17.0%) |
| 8:30 AM to 8:59 AM | 208 (6.2%) | 82 (4.7%) |
| 9:00 AM to 9:59 AM | 179 (5.3%) | 114 (6.5%) |
| 10:00 AM to 10:59 AM | 91 (2.7%) | 50 (2.9%) |
| 11:00 AM to 11:59 AM | 39 (1.1%) | 0 (0.0%) |
| 12:00 PM to 3:59 PM | 172 (5.1%) | 43 (2.5%) |
| 4:00 PM to 11:59 PM | 155 (4.6%) | 140 (8.0%) |
| Total | 3,378 (100.0%) | 1,755 (100.0%) |
Housing Occupancy in Thonotosassa
Occupancy by Ownership in Thonotosassa
Of the total 4,849 dwellings in Thonotosassa, owner-occupied units account for 3,360 (69.3%), while renter-occupied units make up 1,489 (30.7%).
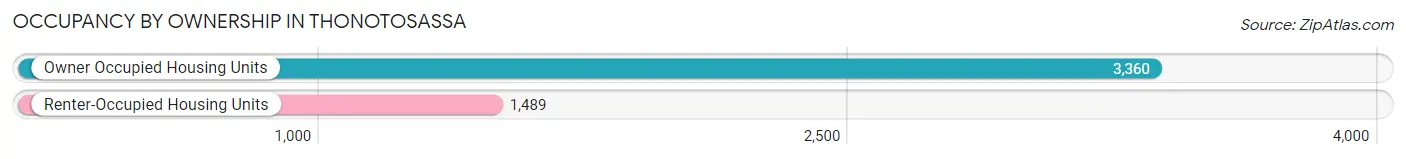
| Occupancy | # Housing Units | % Housing Units |
| Owner Occupied Housing Units | 3,360 | 69.3% |
| Renter-Occupied Housing Units | 1,489 | 30.7% |
| Total Occupied Housing Units | 4,849 | 100.0% |
Occupancy by Household Size in Thonotosassa
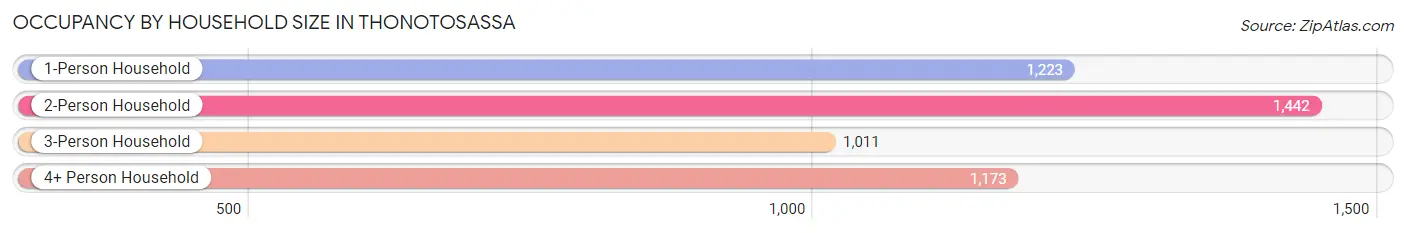
| Household Size | # Housing Units | % Housing Units |
| 1-Person Household | 1,223 | 25.2% |
| 2-Person Household | 1,442 | 29.7% |
| 3-Person Household | 1,011 | 20.8% |
| 4+ Person Household | 1,173 | 24.2% |
| Total Housing Units | 4,849 | 100.0% |
Occupancy by Ownership by Household Size in Thonotosassa
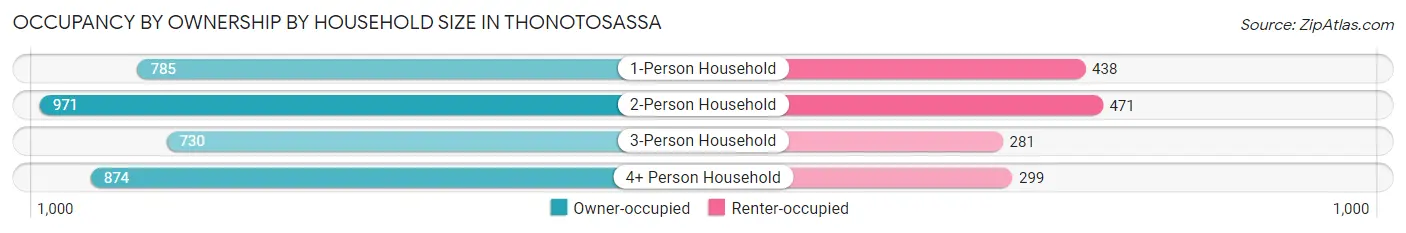
| Household Size | Owner-occupied | Renter-occupied |
| 1-Person Household | 785 (64.2%) | 438 (35.8%) |
| 2-Person Household | 971 (67.3%) | 471 (32.7%) |
| 3-Person Household | 730 (72.2%) | 281 (27.8%) |
| 4+ Person Household | 874 (74.5%) | 299 (25.5%) |
| Total Housing Units | 3,360 (69.3%) | 1,489 (30.7%) |
Occupancy by Educational Attainment in Thonotosassa
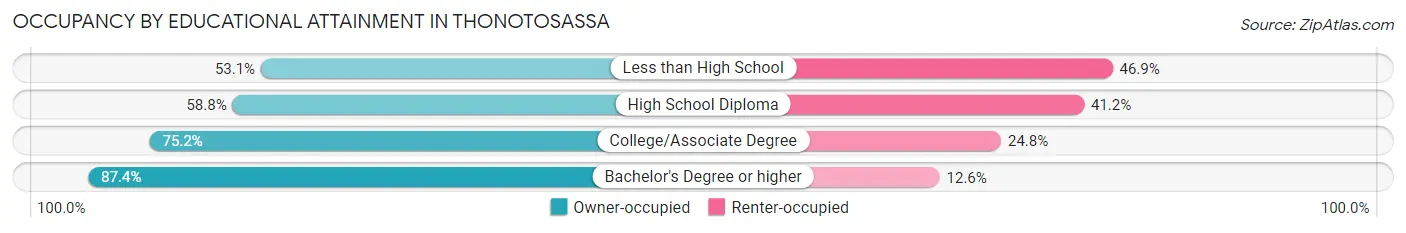
| Household Size | Owner-occupied | Renter-occupied |
| Less than High School | 448 (53.1%) | 395 (46.9%) |
| High School Diploma | 904 (58.8%) | 634 (41.2%) |
| College/Associate Degree | 924 (75.2%) | 304 (24.8%) |
| Bachelor's Degree or higher | 1,084 (87.4%) | 156 (12.6%) |
Occupancy by Age of Householder in Thonotosassa
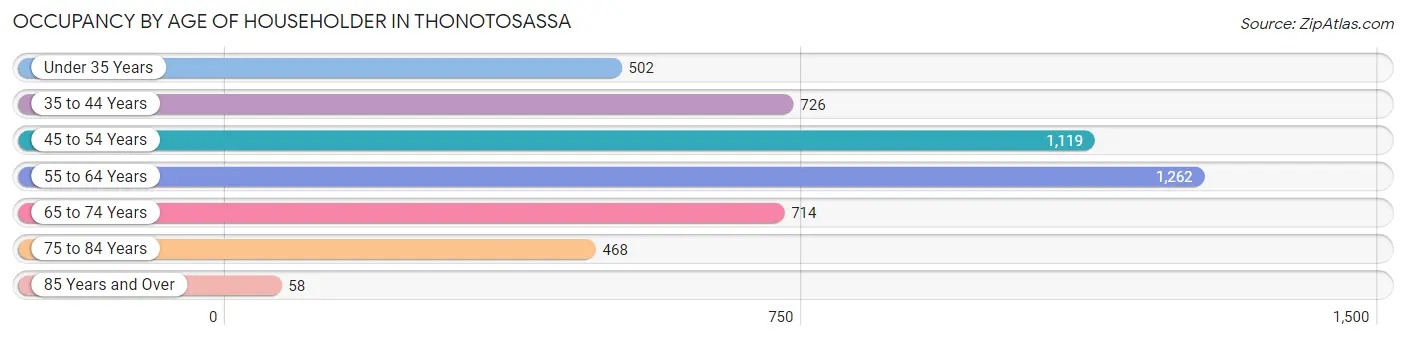
| Age Bracket | # Households | % Households |
| Under 35 Years | 502 | 10.3% |
| 35 to 44 Years | 726 | 15.0% |
| 45 to 54 Years | 1,119 | 23.1% |
| 55 to 64 Years | 1,262 | 26.0% |
| 65 to 74 Years | 714 | 14.7% |
| 75 to 84 Years | 468 | 9.7% |
| 85 Years and Over | 58 | 1.2% |
| Total | 4,849 | 100.0% |
Housing Finances in Thonotosassa
Median Income by Occupancy in Thonotosassa
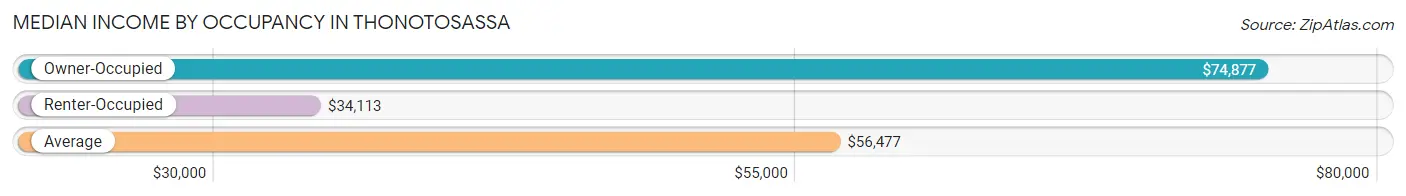
| Occupancy Type | # Households | Median Income |
| Owner-Occupied | 3,360 (69.3%) | $74,877 |
| Renter-Occupied | 1,489 (30.7%) | $34,113 |
| Average | 4,849 (100.0%) | $56,477 |
Occupancy by Householder Income Bracket in Thonotosassa
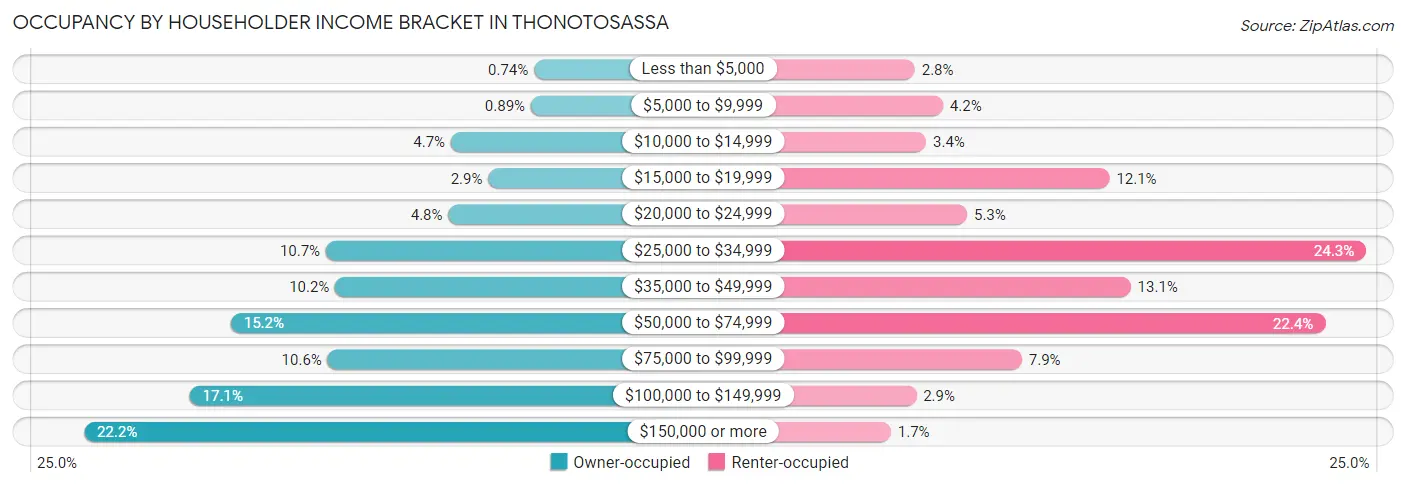
| Income Bracket | Owner-occupied | Renter-occupied |
| Less than $5,000 | 25 (0.7%) | 42 (2.8%) |
| $5,000 to $9,999 | 30 (0.9%) | 62 (4.2%) |
| $10,000 to $14,999 | 158 (4.7%) | 50 (3.4%) |
| $15,000 to $19,999 | 98 (2.9%) | 180 (12.1%) |
| $20,000 to $24,999 | 162 (4.8%) | 79 (5.3%) |
| $25,000 to $34,999 | 358 (10.6%) | 362 (24.3%) |
| $35,000 to $49,999 | 343 (10.2%) | 195 (13.1%) |
| $50,000 to $74,999 | 510 (15.2%) | 333 (22.4%) |
| $75,000 to $99,999 | 355 (10.6%) | 118 (7.9%) |
| $100,000 to $149,999 | 576 (17.1%) | 43 (2.9%) |
| $150,000 or more | 745 (22.2%) | 25 (1.7%) |
| Total | 3,360 (100.0%) | 1,489 (100.0%) |
Monthly Housing Cost Tiers in Thonotosassa
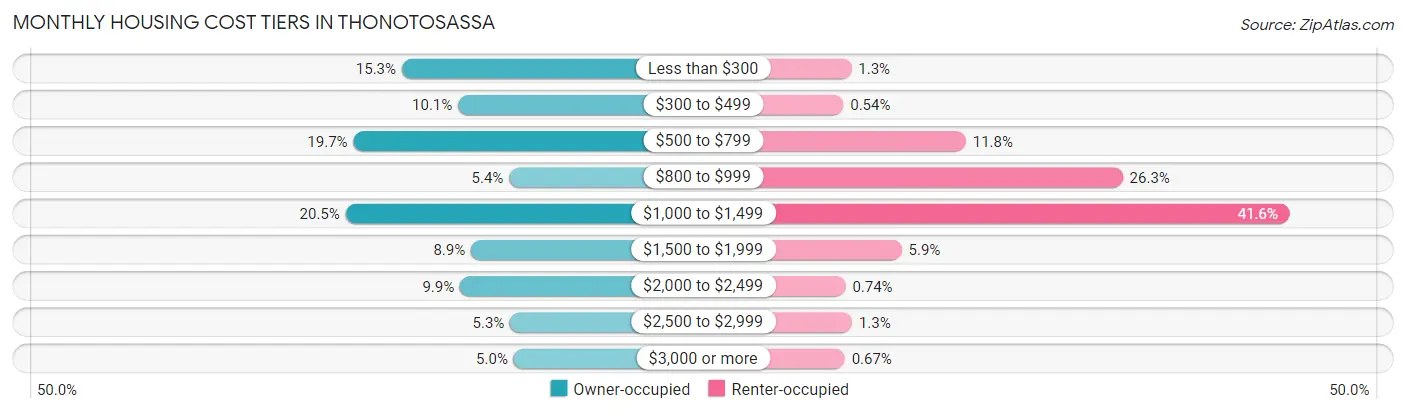
| Monthly Cost | Owner-occupied | Renter-occupied |
| Less than $300 | 513 (15.3%) | 19 (1.3%) |
| $300 to $499 | 339 (10.1%) | 8 (0.5%) |
| $500 to $799 | 663 (19.7%) | 176 (11.8%) |
| $800 to $999 | 181 (5.4%) | 391 (26.3%) |
| $1,000 to $1,499 | 687 (20.4%) | 620 (41.6%) |
| $1,500 to $1,999 | 299 (8.9%) | 88 (5.9%) |
| $2,000 to $2,499 | 333 (9.9%) | 11 (0.7%) |
| $2,500 to $2,999 | 178 (5.3%) | 20 (1.3%) |
| $3,000 or more | 167 (5.0%) | 10 (0.7%) |
| Total | 3,360 (100.0%) | 1,489 (100.0%) |
Physical Housing Characteristics in Thonotosassa
Housing Structures in Thonotosassa
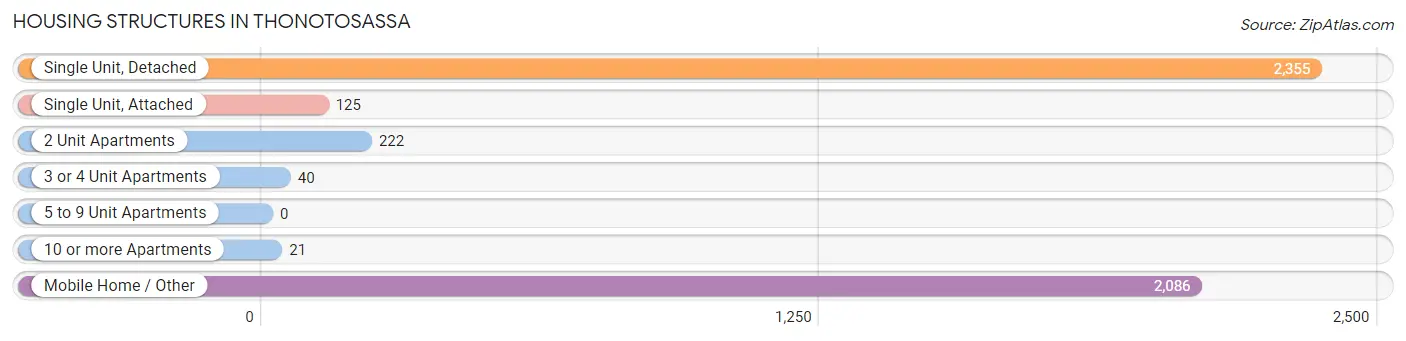
| Structure Type | # Housing Units | % Housing Units |
| Single Unit, Detached | 2,355 | 48.6% |
| Single Unit, Attached | 125 | 2.6% |
| 2 Unit Apartments | 222 | 4.6% |
| 3 or 4 Unit Apartments | 40 | 0.8% |
| 5 to 9 Unit Apartments | 0 | 0.0% |
| 10 or more Apartments | 21 | 0.4% |
| Mobile Home / Other | 2,086 | 43.0% |
| Total | 4,849 | 100.0% |
Housing Structures by Occupancy in Thonotosassa
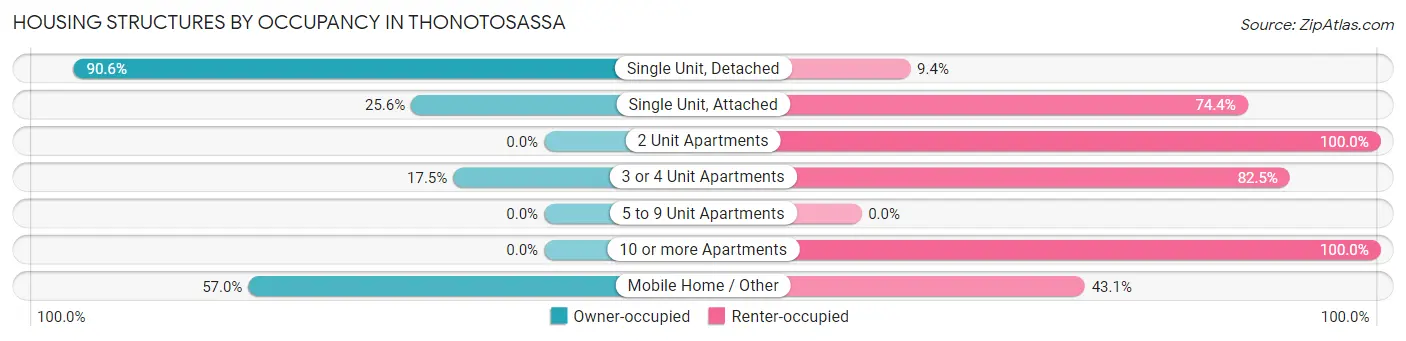
| Structure Type | Owner-occupied | Renter-occupied |
| Single Unit, Detached | 2,133 (90.6%) | 222 (9.4%) |
| Single Unit, Attached | 32 (25.6%) | 93 (74.4%) |
| 2 Unit Apartments | 0 (0.0%) | 222 (100.0%) |
| 3 or 4 Unit Apartments | 7 (17.5%) | 33 (82.5%) |
| 5 to 9 Unit Apartments | 0 (0.0%) | 0 (0.0%) |
| 10 or more Apartments | 0 (0.0%) | 21 (100.0%) |
| Mobile Home / Other | 1,188 (57.0%) | 898 (43.0%) |
| Total | 3,360 (69.3%) | 1,489 (30.7%) |
Housing Structures by Number of Rooms in Thonotosassa
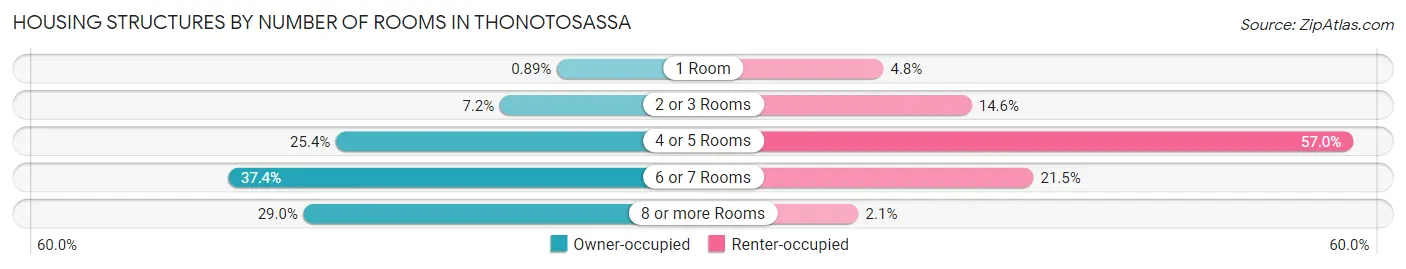
| Number of Rooms | Owner-occupied | Renter-occupied |
| 1 Room | 30 (0.9%) | 72 (4.8%) |
| 2 or 3 Rooms | 243 (7.2%) | 218 (14.6%) |
| 4 or 5 Rooms | 854 (25.4%) | 848 (57.0%) |
| 6 or 7 Rooms | 1,258 (37.4%) | 320 (21.5%) |
| 8 or more Rooms | 975 (29.0%) | 31 (2.1%) |
| Total | 3,360 (100.0%) | 1,489 (100.0%) |
Housing Structure by Heating Type in Thonotosassa
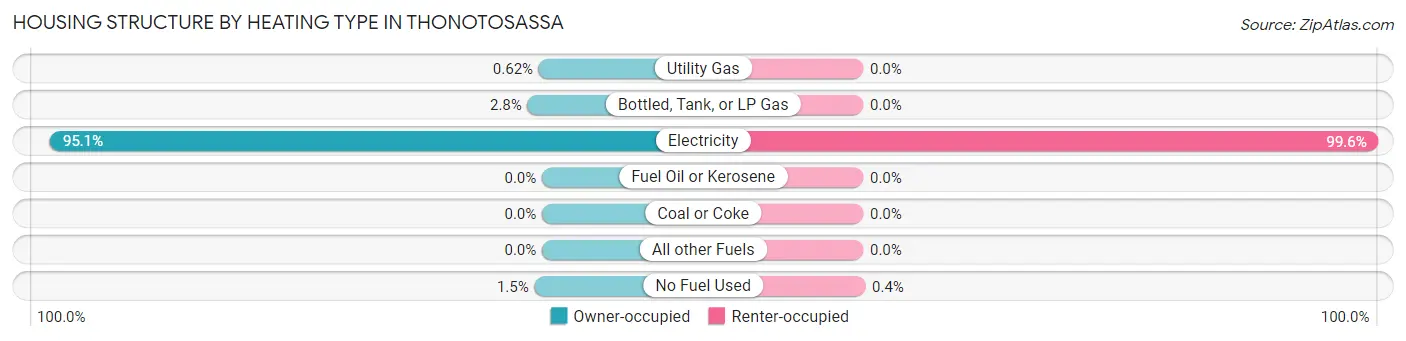
| Heating Type | Owner-occupied | Renter-occupied |
| Utility Gas | 21 (0.6%) | 0 (0.0%) |
| Bottled, Tank, or LP Gas | 94 (2.8%) | 0 (0.0%) |
| Electricity | 3,196 (95.1%) | 1,483 (99.6%) |
| Fuel Oil or Kerosene | 0 (0.0%) | 0 (0.0%) |
| Coal or Coke | 0 (0.0%) | 0 (0.0%) |
| All other Fuels | 0 (0.0%) | 0 (0.0%) |
| No Fuel Used | 49 (1.5%) | 6 (0.4%) |
| Total | 3,360 (100.0%) | 1,489 (100.0%) |
Household Vehicle Usage in Thonotosassa
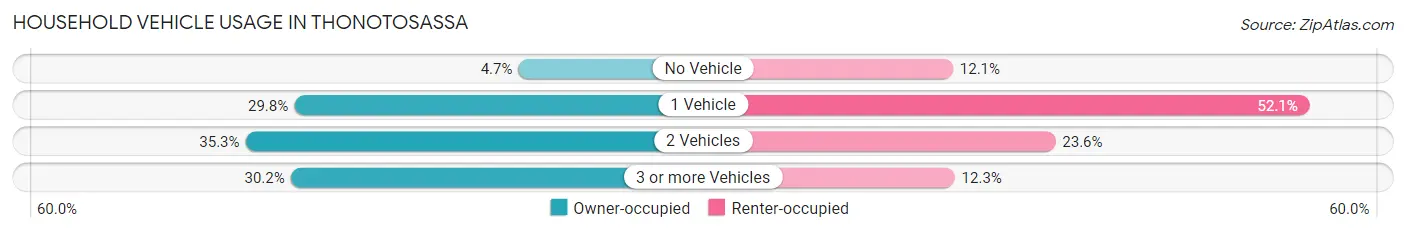
| Vehicles per Household | Owner-occupied | Renter-occupied |
| No Vehicle | 158 (4.7%) | 180 (12.1%) |
| 1 Vehicle | 1,002 (29.8%) | 775 (52.0%) |
| 2 Vehicles | 1,185 (35.3%) | 351 (23.6%) |
| 3 or more Vehicles | 1,015 (30.2%) | 183 (12.3%) |
| Total | 3,360 (100.0%) | 1,489 (100.0%) |
Real Estate & Mortgages in Thonotosassa
Real Estate and Mortgage Overview in Thonotosassa
| Characteristic | Without Mortgage | With Mortgage |
| Housing Units | 1,610 | 1,750 |
| Median Property Value | $121,600 | $291,600 |
| Median Household Income | $51,574 | $504 |
| Monthly Housing Costs | $484 | $167 |
| Real Estate Taxes | $1,831 | $69 |
Property Value by Mortgage Status in Thonotosassa
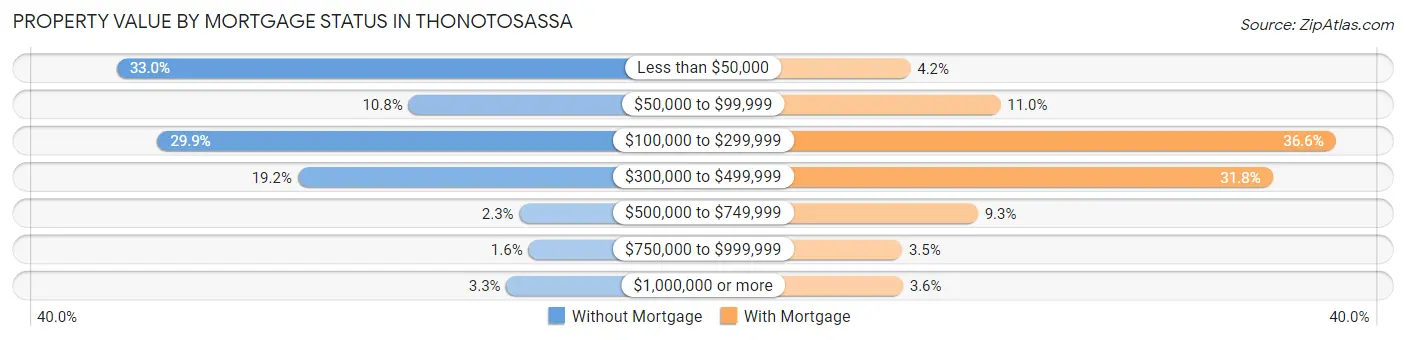
| Property Value | Without Mortgage | With Mortgage |
| Less than $50,000 | 531 (33.0%) | 73 (4.2%) |
| $50,000 to $99,999 | 173 (10.7%) | 193 (11.0%) |
| $100,000 to $299,999 | 481 (29.9%) | 640 (36.6%) |
| $300,000 to $499,999 | 309 (19.2%) | 556 (31.8%) |
| $500,000 to $749,999 | 37 (2.3%) | 163 (9.3%) |
| $750,000 to $999,999 | 26 (1.6%) | 62 (3.5%) |
| $1,000,000 or more | 53 (3.3%) | 63 (3.6%) |
| Total | 1,610 (100.0%) | 1,750 (100.0%) |
Household Income by Mortgage Status in Thonotosassa
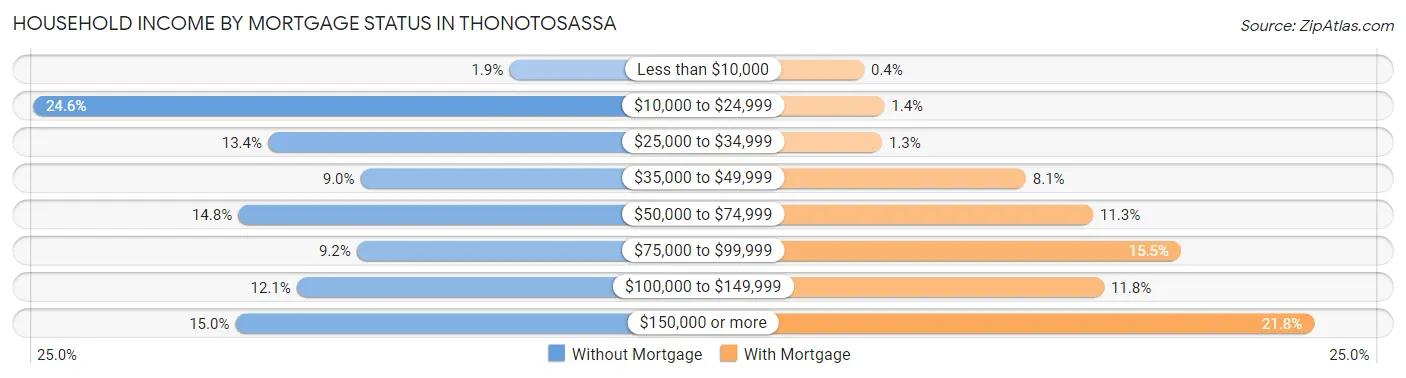
| Household Income | Without Mortgage | With Mortgage |
| Less than $10,000 | 31 (1.9%) | 7 (0.4%) |
| $10,000 to $24,999 | 396 (24.6%) | 24 (1.4%) |
| $25,000 to $34,999 | 216 (13.4%) | 22 (1.3%) |
| $35,000 to $49,999 | 145 (9.0%) | 142 (8.1%) |
| $50,000 to $74,999 | 239 (14.8%) | 198 (11.3%) |
| $75,000 to $99,999 | 148 (9.2%) | 271 (15.5%) |
| $100,000 to $149,999 | 194 (12.0%) | 207 (11.8%) |
| $150,000 or more | 241 (15.0%) | 382 (21.8%) |
| Total | 1,610 (100.0%) | 1,750 (100.0%) |
Property Value to Household Income Ratio in Thonotosassa
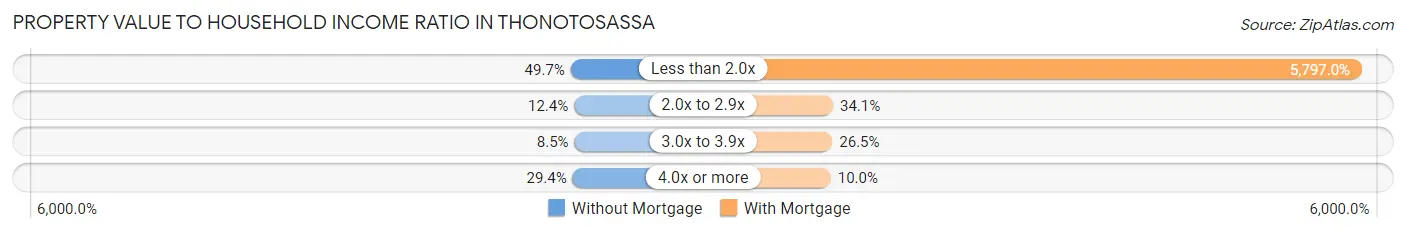
| Value-to-Income Ratio | Without Mortgage | With Mortgage |
| Less than 2.0x | 800 (49.7%) | 101,447 (5,797.0%) |
| 2.0x to 2.9x | 200 (12.4%) | 597 (34.1%) |
| 3.0x to 3.9x | 136 (8.5%) | 464 (26.5%) |
| 4.0x or more | 474 (29.4%) | 175 (10.0%) |
| Total | 1,610 (100.0%) | 1,750 (100.0%) |
Real Estate Taxes by Mortgage Status in Thonotosassa
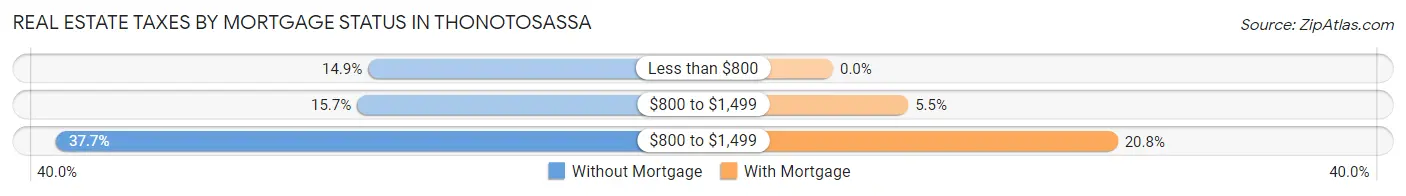
| Property Taxes | Without Mortgage | With Mortgage |
| Less than $800 | 240 (14.9%) | 0 (0.0%) |
| $800 to $1,499 | 253 (15.7%) | 96 (5.5%) |
| $800 to $1,499 | 607 (37.7%) | 364 (20.8%) |
| Total | 1,610 (100.0%) | 1,750 (100.0%) |
Health & Disability in Thonotosassa
Health Insurance Coverage by Age in Thonotosassa
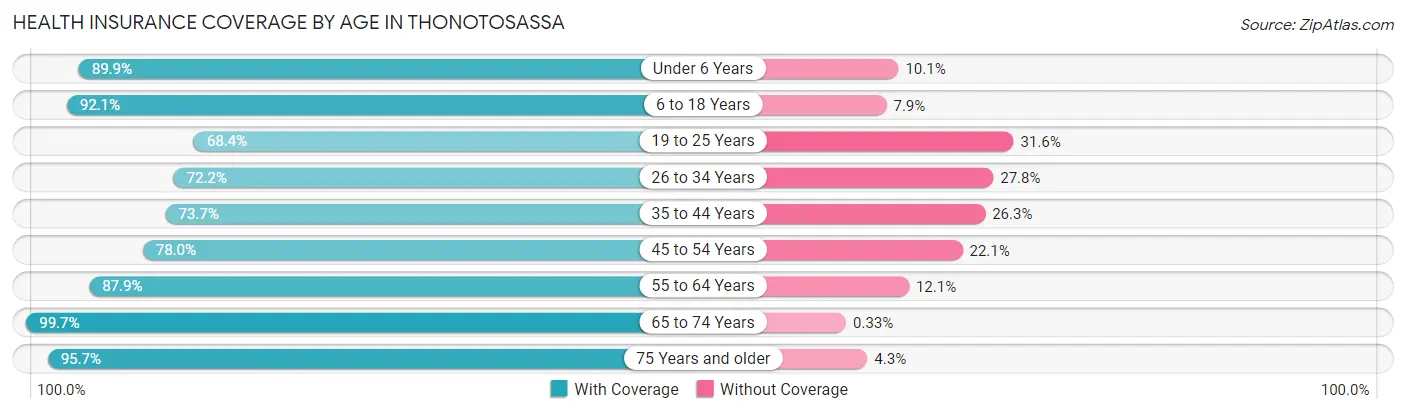
| Age Bracket | With Coverage | Without Coverage |
| Under 6 Years | 649 (89.9%) | 73 (10.1%) |
| 6 to 18 Years | 2,139 (92.1%) | 183 (7.9%) |
| 19 to 25 Years | 813 (68.4%) | 375 (31.6%) |
| 26 to 34 Years | 1,073 (72.2%) | 413 (27.8%) |
| 35 to 44 Years | 1,380 (73.7%) | 492 (26.3%) |
| 45 to 54 Years | 1,534 (77.9%) | 434 (22.1%) |
| 55 to 64 Years | 1,793 (87.9%) | 246 (12.1%) |
| 65 to 74 Years | 1,523 (99.7%) | 5 (0.3%) |
| 75 Years and older | 821 (95.7%) | 37 (4.3%) |
| Total | 11,725 (83.9%) | 2,258 (16.2%) |
Health Insurance Coverage by Citizenship Status in Thonotosassa
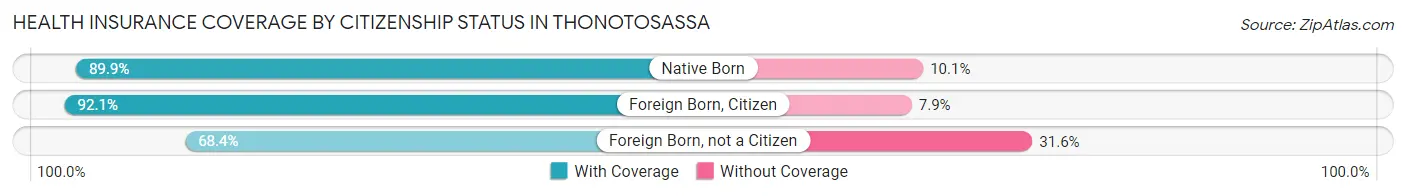
| Citizenship Status | With Coverage | Without Coverage |
| Native Born | 649 (89.9%) | 73 (10.1%) |
| Foreign Born, Citizen | 2,139 (92.1%) | 183 (7.9%) |
| Foreign Born, not a Citizen | 813 (68.4%) | 375 (31.6%) |
Health Insurance Coverage by Household Income in Thonotosassa
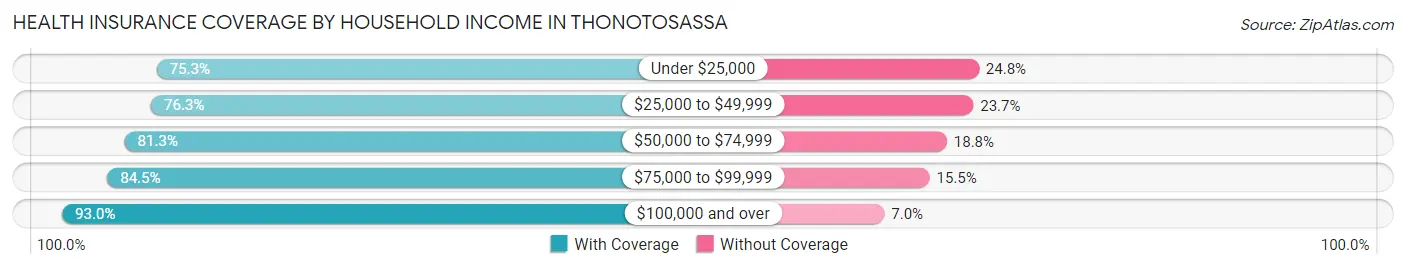
| Household Income | With Coverage | Without Coverage |
| Under $25,000 | 1,274 (75.2%) | 419 (24.7%) |
| $25,000 to $49,999 | 2,430 (76.3%) | 755 (23.7%) |
| $50,000 to $74,999 | 2,297 (81.2%) | 530 (18.8%) |
| $75,000 to $99,999 | 1,014 (84.5%) | 186 (15.5%) |
| $100,000 and over | 4,678 (93.0%) | 354 (7.0%) |
Public vs Private Health Insurance Coverage by Age in Thonotosassa
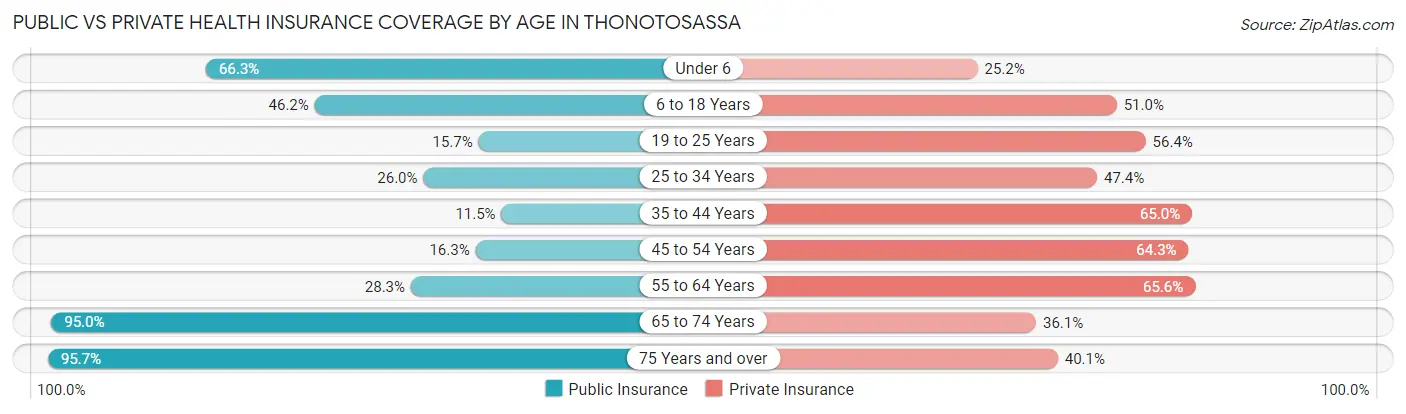
| Age Bracket | Public Insurance | Private Insurance |
| Under 6 | 479 (66.3%) | 182 (25.2%) |
| 6 to 18 Years | 1,072 (46.2%) | 1,185 (51.0%) |
| 19 to 25 Years | 187 (15.7%) | 670 (56.4%) |
| 25 to 34 Years | 386 (26.0%) | 704 (47.4%) |
| 35 to 44 Years | 215 (11.5%) | 1,217 (65.0%) |
| 45 to 54 Years | 321 (16.3%) | 1,266 (64.3%) |
| 55 to 64 Years | 577 (28.3%) | 1,337 (65.6%) |
| 65 to 74 Years | 1,452 (95.0%) | 551 (36.1%) |
| 75 Years and over | 821 (95.7%) | 344 (40.1%) |
| Total | 5,510 (39.4%) | 7,456 (53.3%) |
Disability Status by Sex by Age in Thonotosassa
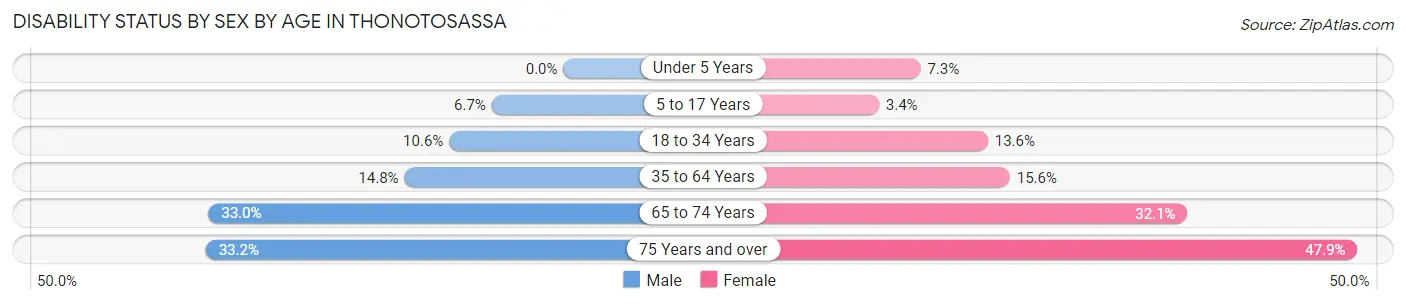
| Age Bracket | Male | Female |
| Under 5 Years | 0 (0.0%) | 20 (7.3%) |
| 5 to 17 Years | 73 (6.7%) | 40 (3.4%) |
| 18 to 34 Years | 185 (10.6%) | 149 (13.6%) |
| 35 to 64 Years | 466 (14.7%) | 424 (15.6%) |
| 65 to 74 Years | 260 (33.0%) | 237 (32.1%) |
| 75 Years and over | 76 (33.2%) | 301 (47.8%) |
Disability Class by Sex by Age in Thonotosassa
Disability Class: Hearing Difficulty
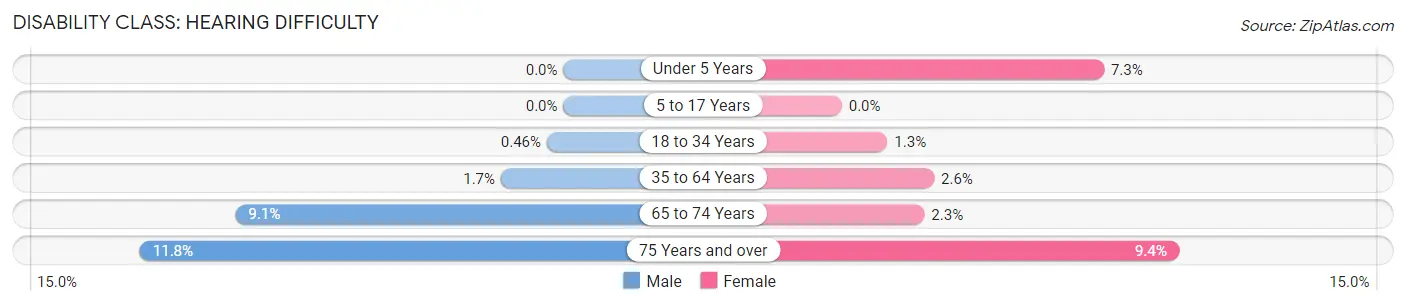
| Age Bracket | Male | Female |
| Under 5 Years | 0 (0.0%) | 20 (7.3%) |
| 5 to 17 Years | 0 (0.0%) | 0 (0.0%) |
| 18 to 34 Years | 8 (0.5%) | 14 (1.3%) |
| 35 to 64 Years | 55 (1.7%) | 70 (2.6%) |
| 65 to 74 Years | 72 (9.1%) | 17 (2.3%) |
| 75 Years and over | 27 (11.8%) | 59 (9.4%) |
Disability Class: Vision Difficulty
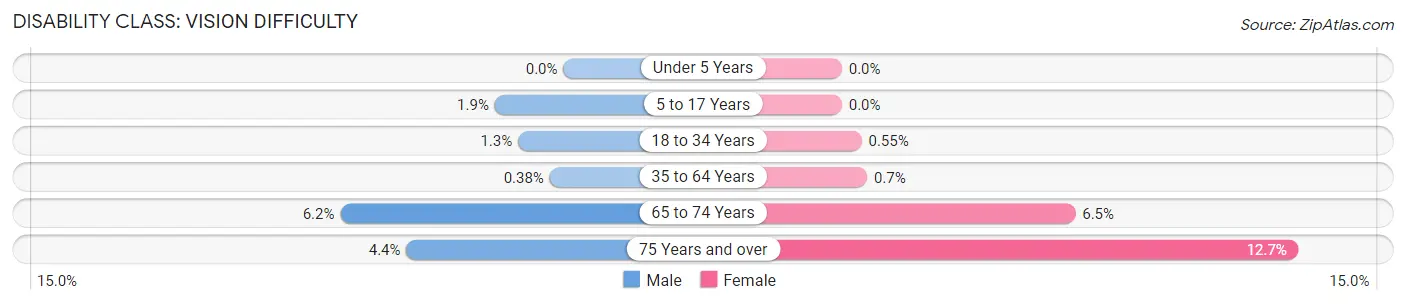
| Age Bracket | Male | Female |
| Under 5 Years | 0 (0.0%) | 0 (0.0%) |
| 5 to 17 Years | 21 (1.9%) | 0 (0.0%) |
| 18 to 34 Years | 22 (1.3%) | 6 (0.5%) |
| 35 to 64 Years | 12 (0.4%) | 19 (0.7%) |
| 65 to 74 Years | 49 (6.2%) | 48 (6.5%) |
| 75 Years and over | 10 (4.4%) | 80 (12.7%) |
Disability Class: Cognitive Difficulty
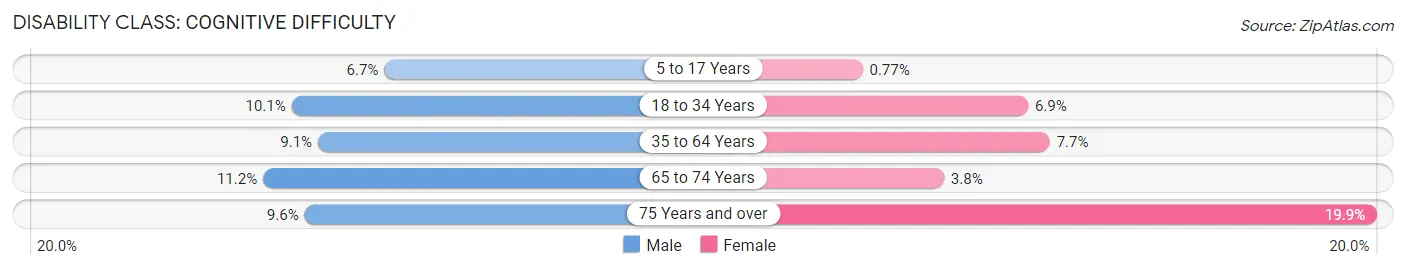
| Age Bracket | Male | Female |
| 5 to 17 Years | 73 (6.7%) | 9 (0.8%) |
| 18 to 34 Years | 176 (10.1%) | 76 (6.9%) |
| 35 to 64 Years | 288 (9.1%) | 210 (7.7%) |
| 65 to 74 Years | 88 (11.2%) | 28 (3.8%) |
| 75 Years and over | 22 (9.6%) | 125 (19.9%) |
Disability Class: Ambulatory Difficulty
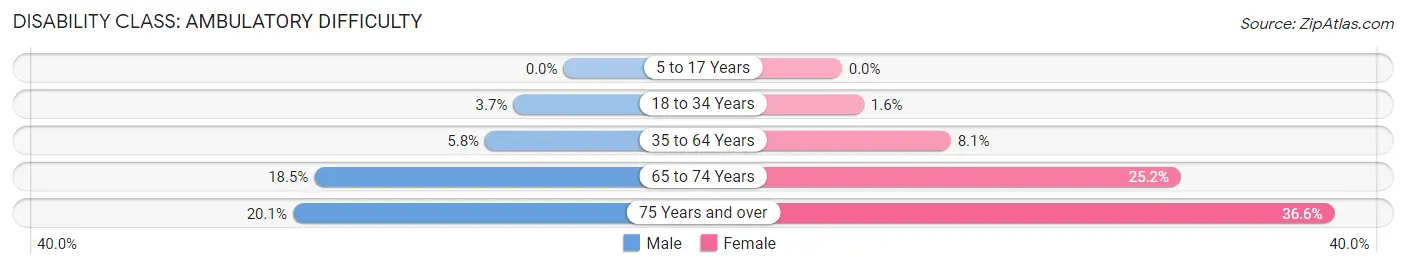
| Age Bracket | Male | Female |
| 5 to 17 Years | 0 (0.0%) | 0 (0.0%) |
| 18 to 34 Years | 65 (3.7%) | 18 (1.6%) |
| 35 to 64 Years | 184 (5.8%) | 220 (8.1%) |
| 65 to 74 Years | 146 (18.5%) | 186 (25.2%) |
| 75 Years and over | 46 (20.1%) | 230 (36.6%) |
Disability Class: Self-Care Difficulty
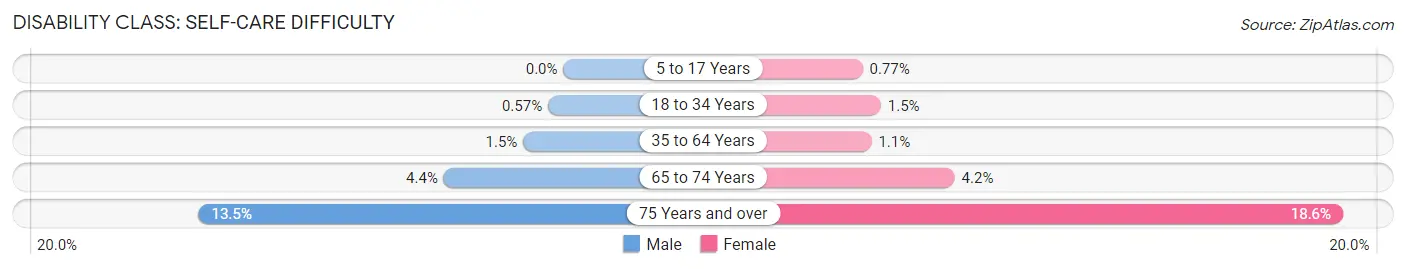
| Age Bracket | Male | Female |
| 5 to 17 Years | 0 (0.0%) | 9 (0.8%) |
| 18 to 34 Years | 10 (0.6%) | 16 (1.5%) |
| 35 to 64 Years | 47 (1.5%) | 30 (1.1%) |
| 65 to 74 Years | 35 (4.4%) | 31 (4.2%) |
| 75 Years and over | 31 (13.5%) | 117 (18.6%) |
Technology Access in Thonotosassa
Computing Device Access in Thonotosassa
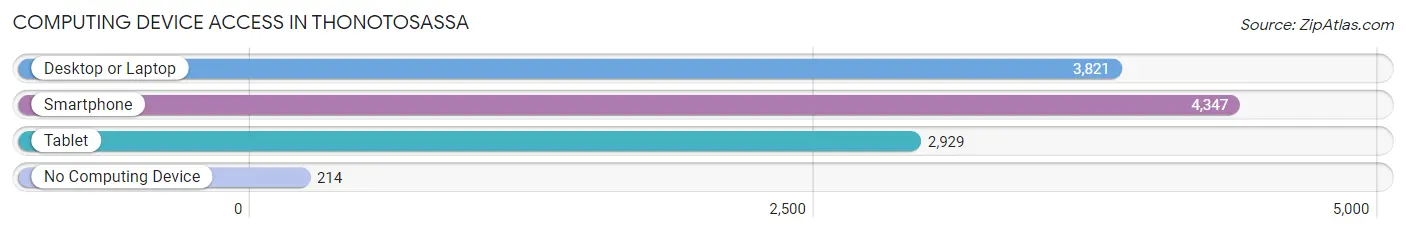
| Device Type | # Households | % Households |
| Desktop or Laptop | 3,821 | 78.8% |
| Smartphone | 4,347 | 89.6% |
| Tablet | 2,929 | 60.4% |
| No Computing Device | 214 | 4.4% |
| Total | 4,849 | 100.0% |
Internet Access in Thonotosassa
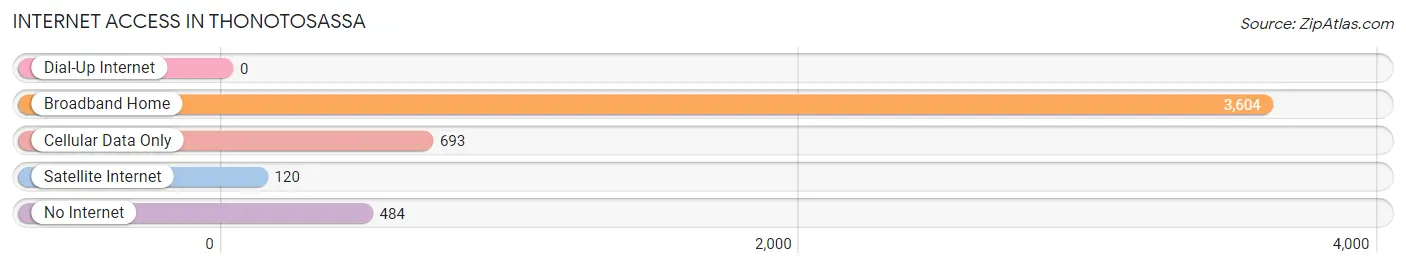
| Internet Type | # Households | % Households |
| Dial-Up Internet | 0 | 0.0% |
| Broadband Home | 3,604 | 74.3% |
| Cellular Data Only | 693 | 14.3% |
| Satellite Internet | 120 | 2.5% |
| No Internet | 484 | 10.0% |
| Total | 4,849 | 100.0% |
Thonotosassa Summary
Thonotosassa is a census-designated place (CDP) located in Hillsborough County, Florida, United States. The population was 8,409 at the 2010 census. It is part of the Tampa–St. Petersburg–Clearwater Metropolitan Statistical Area.
History
The area now known as Thonotosassa was originally inhabited by the Tocobaga people, who were part of the larger Timucua tribe. The Tocobaga were a hunter-gatherer society that lived in the area for thousands of years before the arrival of Europeans.
The first European to explore the area was Spanish explorer Hernando de Soto, who arrived in 1539. He and his men encountered the Tocobaga people, who were friendly and hospitable to the Spanish. The Tocobaga were eventually decimated by disease and warfare, and the area was largely abandoned by the mid-1700s.
In the early 1800s, the area was settled by settlers from the United States. The first permanent settlement was established in 1824 by William Thonotosassa, who gave the area its name. The settlement grew slowly, and by the late 1800s, the area had become a popular destination for tourists and hunters.
Geography
Thonotosassa is located in Hillsborough County, Florida, at 28°3'N 82°20'W (28.05, -82.33). It is bordered to the north by Mango, to the east by Seffner, to the south by Temple Terrace, and to the west by Tampa.
The total area of Thonotosassa is 8.3 square miles, of which 8.2 square miles is land and 0.1 square miles is water. The terrain is mostly flat, with some rolling hills. The highest point in Thonotosassa is just over 100 feet above sea level.
Economy
The economy of Thonotosassa is largely based on agriculture and tourism. The area is home to several farms, which produce a variety of crops, including citrus fruits, vegetables, and hay. The area is also popular with tourists, who come to enjoy the area's natural beauty and outdoor activities.
The area is also home to several businesses, including restaurants, retail stores, and service providers. The largest employer in Thonotosassa is the Hillsborough County School District, which employs over 1,000 people.
Demographics
As of the 2010 census, there were 8,409 people, 2,945 households, and 2,092 families residing in Thonotosassa. The population density was 1,019.3 people per square mile. The racial makeup of the CDP was 79.2% White, 11.2% African American, 0.4% Native American, 1.2% Asian, 0.1% Pacific Islander, 5.3% from other races, and 2.6% from two or more races. Hispanic or Latino of any race were 16.2% of the population.
The median income for a household in Thonotosassa was $45,945, and the median income for a family was $51,945. Males had a median income of $37,945 versus $30,945 for females. The per capita income for the CDP was $20,945. About 8.2% of families and 10.2% of the population were below the poverty line, including 14.2% of those under age 18 and 8.2% of those age 65 or over.
Common Questions
What is Per Capita Income in Thonotosassa?
Per Capita income in Thonotosassa is $33,418.
What is the Median Family Income in Thonotosassa?
Median Family Income in Thonotosassa is $68,912.
What is the Median Household income in Thonotosassa?
Median Household Income in Thonotosassa is $56,477.
What is Income or Wage Gap in Thonotosassa?
Income or Wage Gap in Thonotosassa is 20.3%.
Women in Thonotosassa earn 79.7 cents for every dollar earned by a man.
What is Inequality or Gini Index in Thonotosassa?
Inequality or Gini Index in Thonotosassa is 0.51.
What is the Total Population of Thonotosassa?
Total Population of Thonotosassa is 14,052.
What is the Total Male Population of Thonotosassa?
Total Male Population of Thonotosassa is 7,425.
What is the Total Female Population of Thonotosassa?
Total Female Population of Thonotosassa is 6,627.
What is the Ratio of Males per 100 Females in Thonotosassa?
There are 112.04 Males per 100 Females in Thonotosassa.
What is the Ratio of Females per 100 Males in Thonotosassa?
There are 89.25 Females per 100 Males in Thonotosassa.
What is the Median Population Age in Thonotosassa?
Median Population Age in Thonotosassa is 42.1 Years.
What is the Average Family Size in Thonotosassa
Average Family Size in Thonotosassa is 3.5 People.
What is the Average Household Size in Thonotosassa
Average Household Size in Thonotosassa is 2.9 People.
How Large is the Labor Force in Thonotosassa?
There are 6,472 People in the Labor Forcein in Thonotosassa.
What is the Percentage of People in the Labor Force in Thonotosassa?
55.9% of People are in the Labor Force in Thonotosassa.
What is the Unemployment Rate in Thonotosassa?
Unemployment Rate in Thonotosassa is 5.7%.