Sunset Valley, TX Map & Demographics
Sunset Valley Map
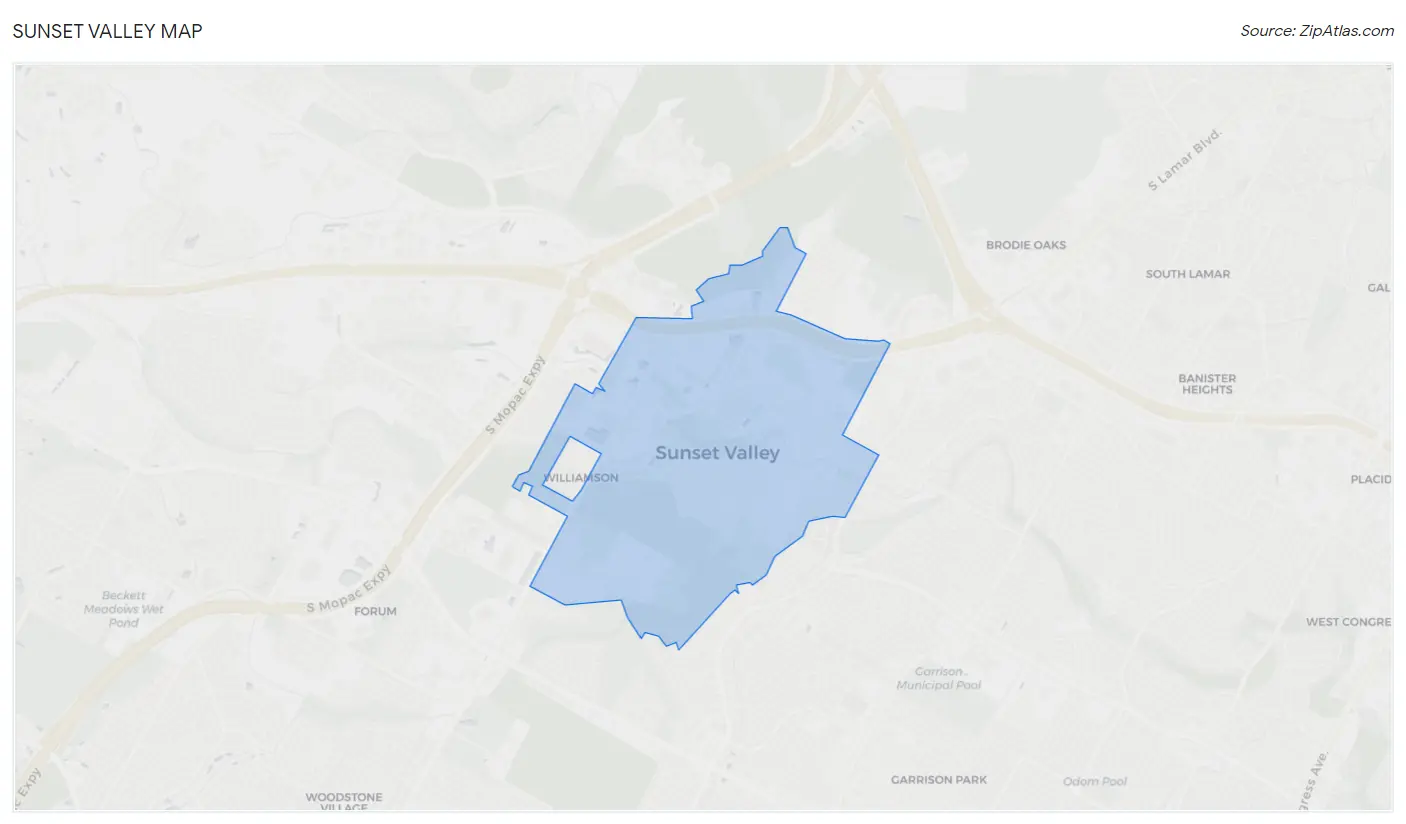
Sunset Valley Overview
$91,349
PER CAPITA INCOME
$173,125
AVG FAMILY INCOME
$141,250
AVG HOUSEHOLD INCOME
40.5%
WAGE / INCOME GAP [ % ]
59.5¢/ $1
WAGE / INCOME GAP [ $ ]
0.51
INEQUALITY / GINI INDEX
562
TOTAL POPULATION
289
MALE POPULATION
273
FEMALE POPULATION
105.86
MALES / 100 FEMALES
94.46
FEMALES / 100 MALES
55.6
MEDIAN AGE
2.7
AVG FAMILY SIZE
2.3
AVG HOUSEHOLD SIZE
255
LABOR FORCE [ PEOPLE ]
53.8%
PERCENT IN LABOR FORCE
2.0%
UNEMPLOYMENT RATE
Sunset Valley Area Codes
Income in Sunset Valley
Income Overview in Sunset Valley
Per Capita Income in Sunset Valley is $91,349, while median incomes of families and households are $173,125 and $141,250 respectively.
| Characteristic | Number | Measure |
| Per Capita Income | 562 | $91,349 |
| Median Family Income | 169 | $173,125 |
| Mean Family Income | 169 | $255,655 |
| Median Household Income | 248 | $141,250 |
| Mean Household Income | 248 | $207,512 |
| Income Deficit | 169 | $0 |
| Wage / Income Gap (%) | 562 | 40.47% |
| Wage / Income Gap ($) | 562 | 59.53¢ per $1 |
| Gini / Inequality Index | 562 | 0.51 |
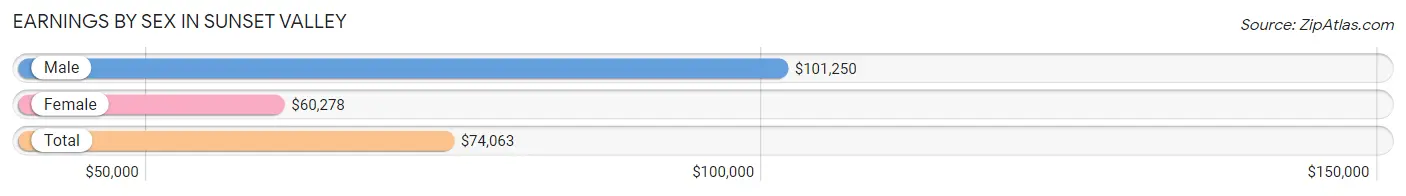
Earnings by Sex in Sunset Valley
Average Earnings in Sunset Valley are $74,063, $101,250 for men and $60,278 for women, a difference of 40.5%.
| Sex | Number | Average Earnings |
| Male | 159 (58.7%) | $101,250 |
| Female | 112 (41.3%) | $60,278 |
| Total | 271 (100.0%) | $74,063 |
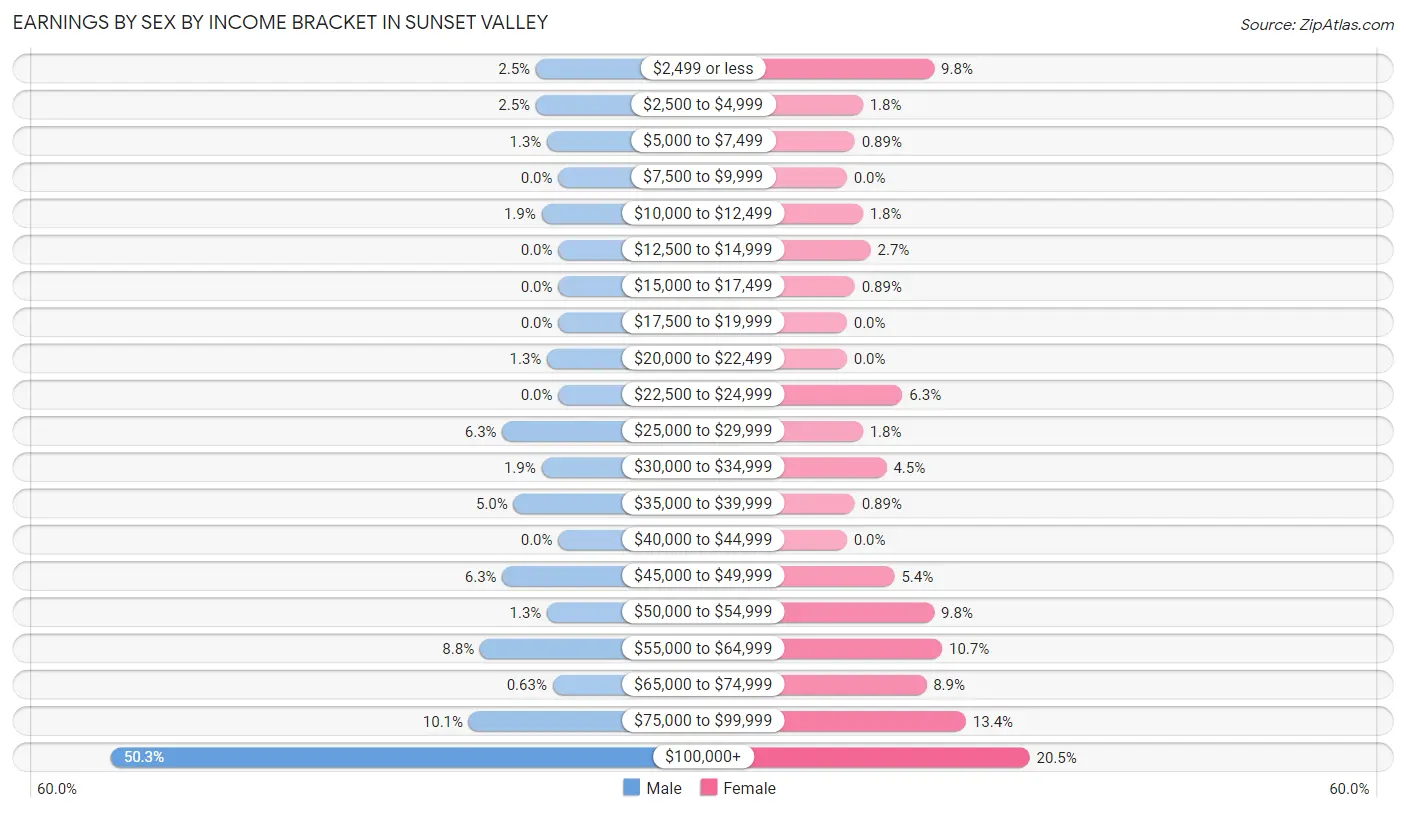
Earnings by Sex by Income Bracket in Sunset Valley
The most common earnings brackets in Sunset Valley are $100,000+ for men (80 | 50.3%) and $100,000+ for women (23 | 20.5%).
| Income | Male | Female |
| $2,499 or less | 4 (2.5%) | 11 (9.8%) |
| $2,500 to $4,999 | 4 (2.5%) | 2 (1.8%) |
| $5,000 to $7,499 | 2 (1.3%) | 1 (0.9%) |
| $7,500 to $9,999 | 0 (0.0%) | 0 (0.0%) |
| $10,000 to $12,499 | 3 (1.9%) | 2 (1.8%) |
| $12,500 to $14,999 | 0 (0.0%) | 3 (2.7%) |
| $15,000 to $17,499 | 0 (0.0%) | 1 (0.9%) |
| $17,500 to $19,999 | 0 (0.0%) | 0 (0.0%) |
| $20,000 to $22,499 | 2 (1.3%) | 0 (0.0%) |
| $22,500 to $24,999 | 0 (0.0%) | 7 (6.2%) |
| $25,000 to $29,999 | 10 (6.3%) | 2 (1.8%) |
| $30,000 to $34,999 | 3 (1.9%) | 5 (4.5%) |
| $35,000 to $39,999 | 8 (5.0%) | 1 (0.9%) |
| $40,000 to $44,999 | 0 (0.0%) | 0 (0.0%) |
| $45,000 to $49,999 | 10 (6.3%) | 6 (5.4%) |
| $50,000 to $54,999 | 2 (1.3%) | 11 (9.8%) |
| $55,000 to $64,999 | 14 (8.8%) | 12 (10.7%) |
| $65,000 to $74,999 | 1 (0.6%) | 10 (8.9%) |
| $75,000 to $99,999 | 16 (10.1%) | 15 (13.4%) |
| $100,000+ | 80 (50.3%) | 23 (20.5%) |
| Total | 159 (100.0%) | 112 (100.0%) |
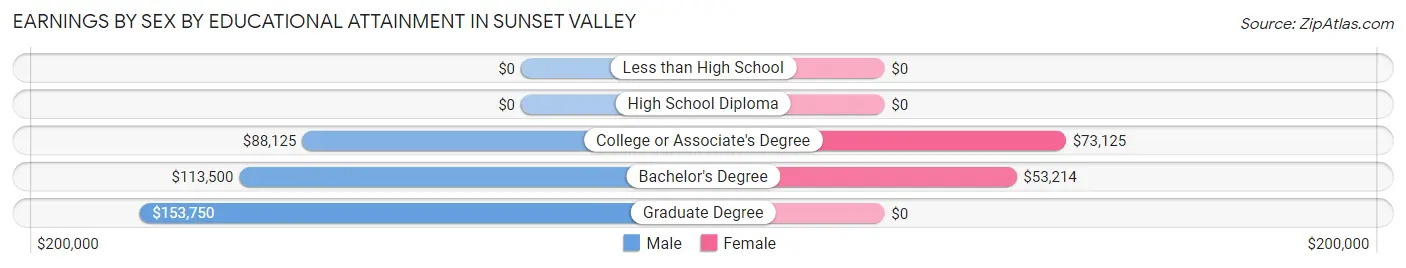
Earnings by Sex by Educational Attainment in Sunset Valley
Average earnings in Sunset Valley are $117,083 for men and $60,417 for women, a difference of 48.4%. Men with an educational attainment of graduate degree enjoy the highest average annual earnings of $153,750, while those with college or associate's degree education earn the least with $88,125. Women with an educational attainment of college or associate's degree earn the most with the average annual earnings of $73,125, while those with bachelor's degree education have the smallest earnings of $53,214.
| Educational Attainment | Male Income | Female Income |
| Less than High School | - | - |
| High School Diploma | - | - |
| College or Associate's Degree | $88,125 | $73,125 |
| Bachelor's Degree | $113,500 | $53,214 |
| Graduate Degree | $153,750 | $0 |
| Total | $117,083 | $60,417 |
Family Income in Sunset Valley
Family Income Brackets in Sunset Valley
According to the Sunset Valley family income data, there are 71 families falling into the $200,000+ income range, which is the most common income bracket and makes up 42.0% of all families.
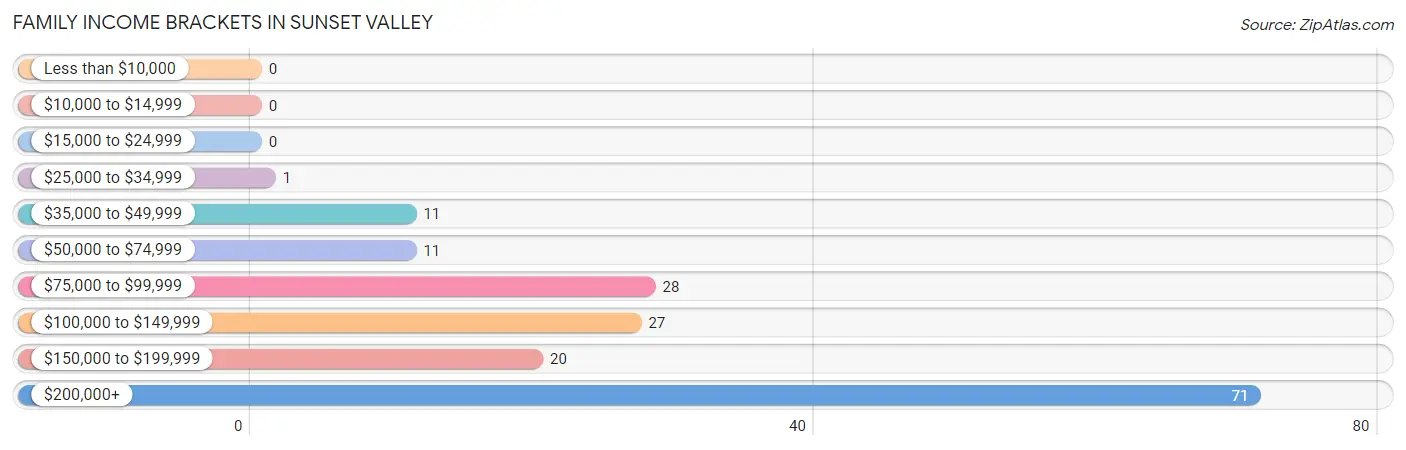
| Income Bracket | # Families | % Families |
| Less than $10,000 | 0 | 0.0% |
| $10,000 to $14,999 | 0 | 0.0% |
| $15,000 to $24,999 | 0 | 0.0% |
| $25,000 to $34,999 | 1 | 0.6% |
| $35,000 to $49,999 | 11 | 6.5% |
| $50,000 to $74,999 | 11 | 6.5% |
| $75,000 to $99,999 | 28 | 16.6% |
| $100,000 to $149,999 | 27 | 16.0% |
| $150,000 to $199,999 | 20 | 11.8% |
| $200,000+ | 71 | 42.0% |
Family Income by Famaliy Size in Sunset Valley
3-person families (30 | 17.7%) account for the highest median family income in Sunset Valley with $250,001 per family, while 3-person families (30 | 17.7%) have the highest median income of $83,334 per family member.
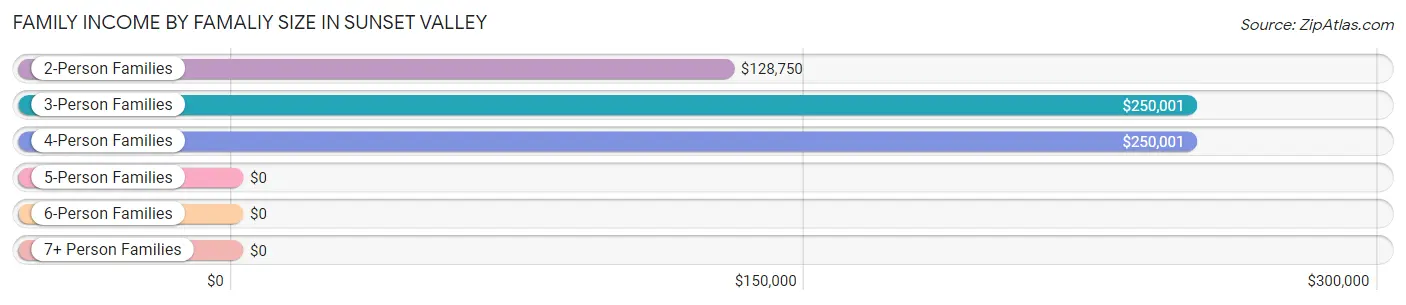
| Income Bracket | # Families | Median Income |
| 2-Person Families | 108 (63.9%) | $128,750 |
| 3-Person Families | 30 (17.7%) | $250,001 |
| 4-Person Families | 21 (12.4%) | $250,001 |
| 5-Person Families | 8 (4.7%) | $0 |
| 6-Person Families | 0 (0.0%) | $0 |
| 7+ Person Families | 2 (1.2%) | $0 |
| Total | 169 (100.0%) | $173,125 |
Family Income by Number of Earners in Sunset Valley
The median family income in Sunset Valley is $173,125, with families comprising 3+ earners (7) having the highest median family income of $250,001, while families with no earners (47) have the lowest median family income of $96,458, accounting for 4.1% and 27.8% of families, respectively.
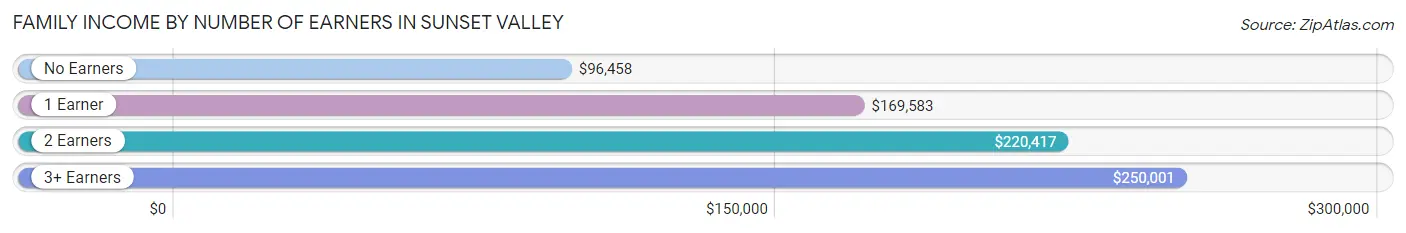
| Number of Earners | # Families | Median Income |
| No Earners | 47 (27.8%) | $96,458 |
| 1 Earner | 46 (27.2%) | $169,583 |
| 2 Earners | 69 (40.8%) | $220,417 |
| 3+ Earners | 7 (4.1%) | $250,001 |
| Total | 169 (100.0%) | $173,125 |
Household Income in Sunset Valley
Household Income Brackets in Sunset Valley
With 95 households falling in the category, the $200,000+ income range is the most frequent in Sunset Valley, accounting for 38.3% of all households.
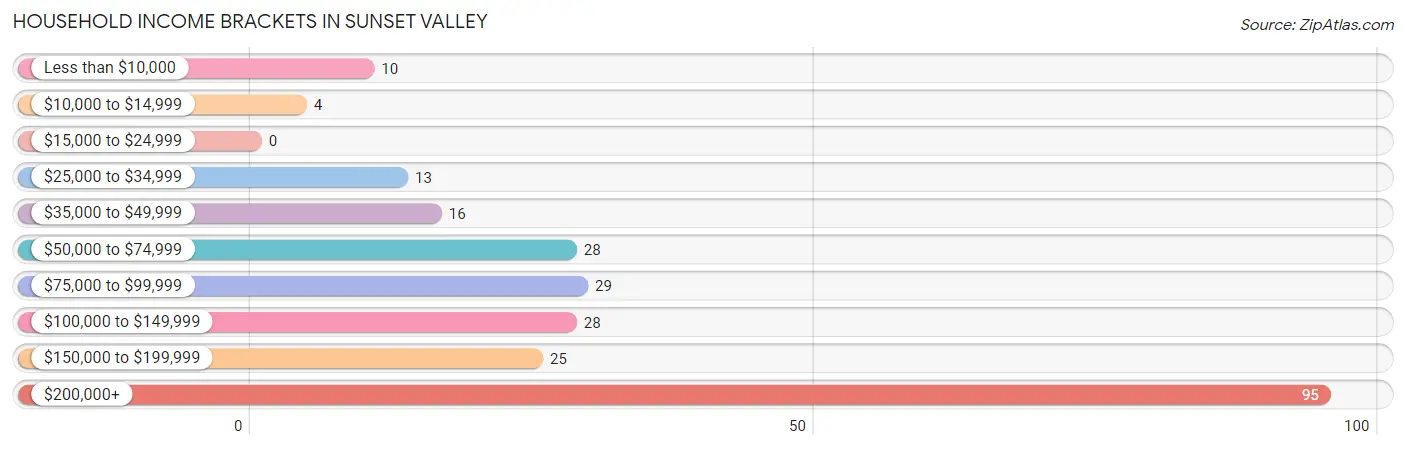
| Income Bracket | # Households | % Households |
| Less than $10,000 | 10 | 4.0% |
| $10,000 to $14,999 | 4 | 1.6% |
| $15,000 to $24,999 | 0 | 0.0% |
| $25,000 to $34,999 | 13 | 5.2% |
| $35,000 to $49,999 | 16 | 6.5% |
| $50,000 to $74,999 | 28 | 11.3% |
| $75,000 to $99,999 | 29 | 11.7% |
| $100,000 to $149,999 | 28 | 11.3% |
| $150,000 to $199,999 | 25 | 10.1% |
| $200,000+ | 95 | 38.3% |
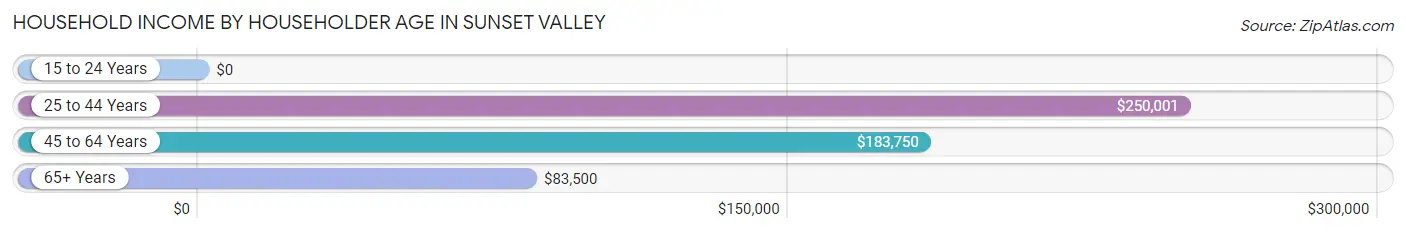
Household Income by Householder Age in Sunset Valley
The median household income in Sunset Valley is $141,250, with the highest median household income of $250,001 found in the 25 to 44 years age bracket for the primary householder. A total of 17 households (6.9%) fall into this category. Meanwhile, the 15 to 24 years age bracket for the primary householder has the lowest median household income of $0, with 5 households (2.0%) in this group.
| Income Bracket | # Households | Median Income |
| 15 to 24 Years | 5 (2.0%) | $0 |
| 25 to 44 Years | 17 (6.9%) | $250,001 |
| 45 to 64 Years | 118 (47.6%) | $183,750 |
| 65+ Years | 108 (43.5%) | $83,500 |
| Total | 248 (100.0%) | $141,250 |
Poverty in Sunset Valley
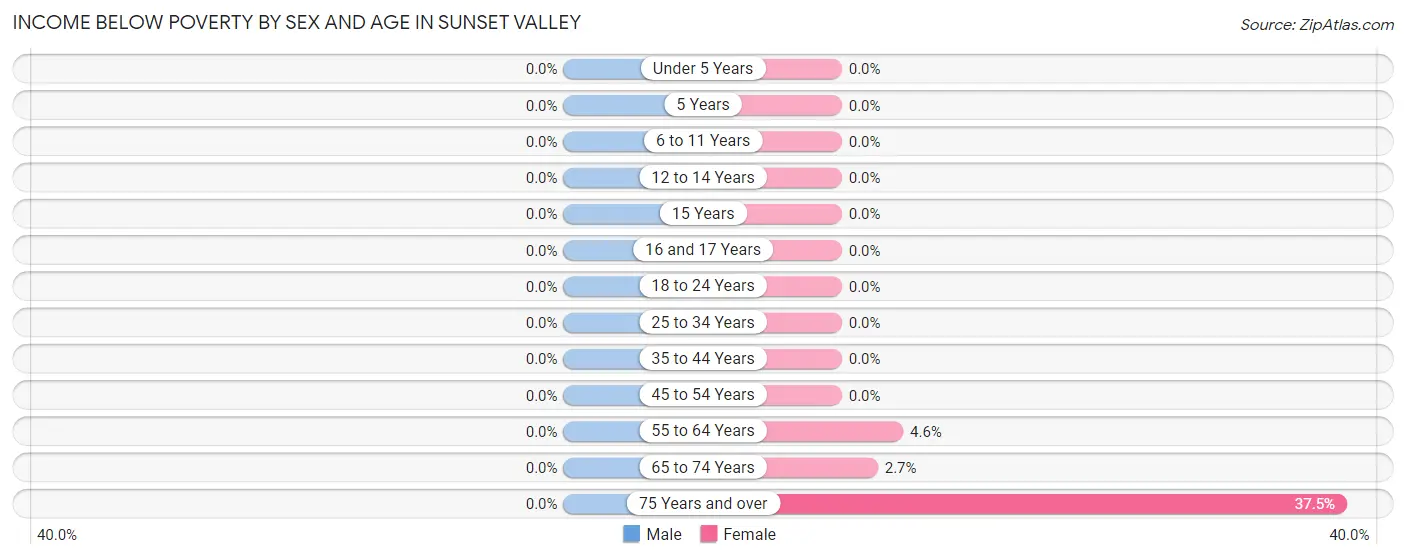
Income Below Poverty by Sex and Age in Sunset Valley
| Age Bracket | Male | Female |
| Under 5 Years | 0 (0.0%) | 0 (0.0%) |
| 5 Years | 0 (0.0%) | 0 (0.0%) |
| 6 to 11 Years | 0 (0.0%) | 0 (0.0%) |
| 12 to 14 Years | 0 (0.0%) | 0 (0.0%) |
| 15 Years | 0 (0.0%) | 0 (0.0%) |
| 16 and 17 Years | 0 (0.0%) | 0 (0.0%) |
| 18 to 24 Years | 0 (0.0%) | 0 (0.0%) |
| 25 to 34 Years | 0 (0.0%) | 0 (0.0%) |
| 35 to 44 Years | 0 (0.0%) | 0 (0.0%) |
| 45 to 54 Years | 0 (0.0%) | 0 (0.0%) |
| 55 to 64 Years | 0 (0.0%) | 2 (4.5%) |
| 65 to 74 Years | 0 (0.0%) | 2 (2.7%) |
| 75 Years and over | 0 (0.0%) | 12 (37.5%) |
| Total | 0 (0.0%) | 16 (5.9%) |
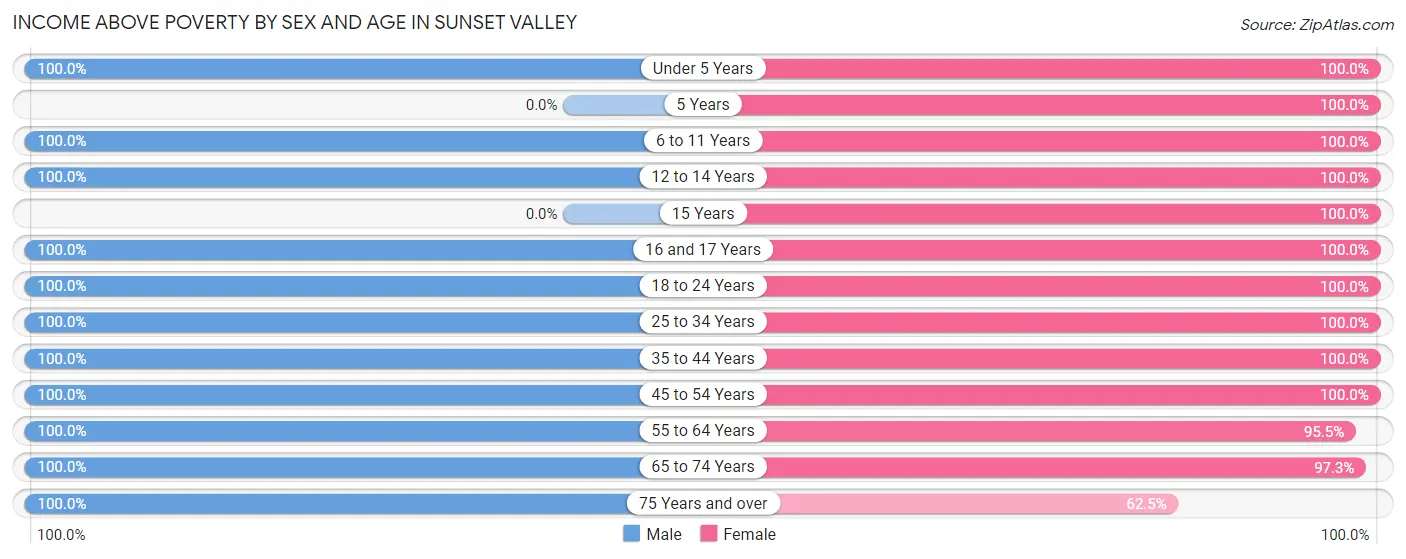
Income Above Poverty by Sex and Age in Sunset Valley
According to the poverty statistics in Sunset Valley, males aged under 5 years and females aged under 5 years are the age groups that are most secure financially, with 100.0% of males and 100.0% of females in these age groups living above the poverty line.
| Age Bracket | Male | Female |
| Under 5 Years | 13 (100.0%) | 7 (100.0%) |
| 5 Years | 0 (0.0%) | 4 (100.0%) |
| 6 to 11 Years | 24 (100.0%) | 13 (100.0%) |
| 12 to 14 Years | 20 (100.0%) | 4 (100.0%) |
| 15 Years | 0 (0.0%) | 2 (100.0%) |
| 16 and 17 Years | 4 (100.0%) | 6 (100.0%) |
| 18 to 24 Years | 21 (100.0%) | 4 (100.0%) |
| 25 to 34 Years | 14 (100.0%) | 9 (100.0%) |
| 35 to 44 Years | 24 (100.0%) | 18 (100.0%) |
| 45 to 54 Years | 32 (100.0%) | 55 (100.0%) |
| 55 to 64 Years | 46 (100.0%) | 42 (95.5%) |
| 65 to 74 Years | 63 (100.0%) | 73 (97.3%) |
| 75 Years and over | 26 (100.0%) | 20 (62.5%) |
| Total | 287 (100.0%) | 257 (94.1%) |
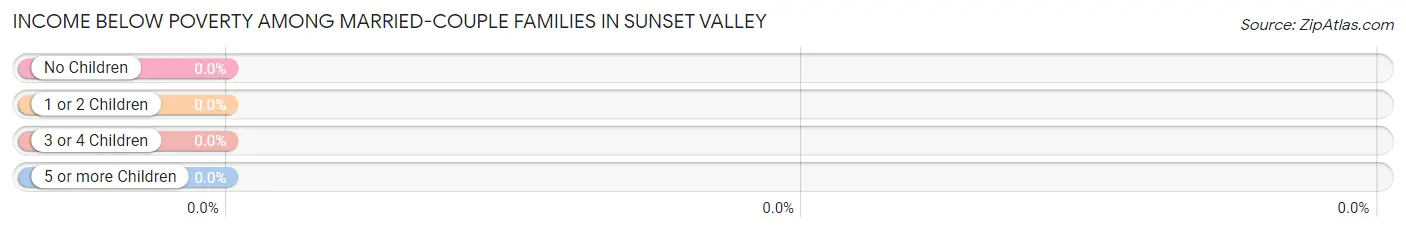
Income Below Poverty Among Married-Couple Families in Sunset Valley
| Children | Above Poverty | Below Poverty |
| No Children | 115 (100.0%) | 0 (0.0%) |
| 1 or 2 Children | 24 (100.0%) | 0 (0.0%) |
| 3 or 4 Children | 8 (100.0%) | 0 (0.0%) |
| 5 or more Children | 2 (100.0%) | 0 (0.0%) |
| Total | 149 (100.0%) | 0 (0.0%) |
Income Below Poverty Among Single-Parent Households in Sunset Valley
| Children | Single Father | Single Mother |
| No Children | 0 (0.0%) | 0 (0.0%) |
| 1 or 2 Children | 0 (0.0%) | 0 (0.0%) |
| 3 or 4 Children | 0 (0.0%) | 0 (0.0%) |
| 5 or more Children | 0 (0.0%) | 0 (0.0%) |
| Total | 0 (0.0%) | 0 (0.0%) |
Income Below Poverty Among Married-Couple vs Single-Parent Households in Sunset Valley
| Children | Married-Couple Families | Single-Parent Households |
| No Children | 0 (0.0%) | 0 (0.0%) |
| 1 or 2 Children | 0 (0.0%) | 0 (0.0%) |
| 3 or 4 Children | 0 (0.0%) | 0 (0.0%) |
| 5 or more Children | 0 (0.0%) | 0 (0.0%) |
| Total | 0 (0.0%) | 0 (0.0%) |
Race in Sunset Valley
The most populous races in Sunset Valley are White / Caucasian (448 | 79.7%), Hispanic or Latino (99 | 17.6%), and Two or more Races (73 | 13.0%).
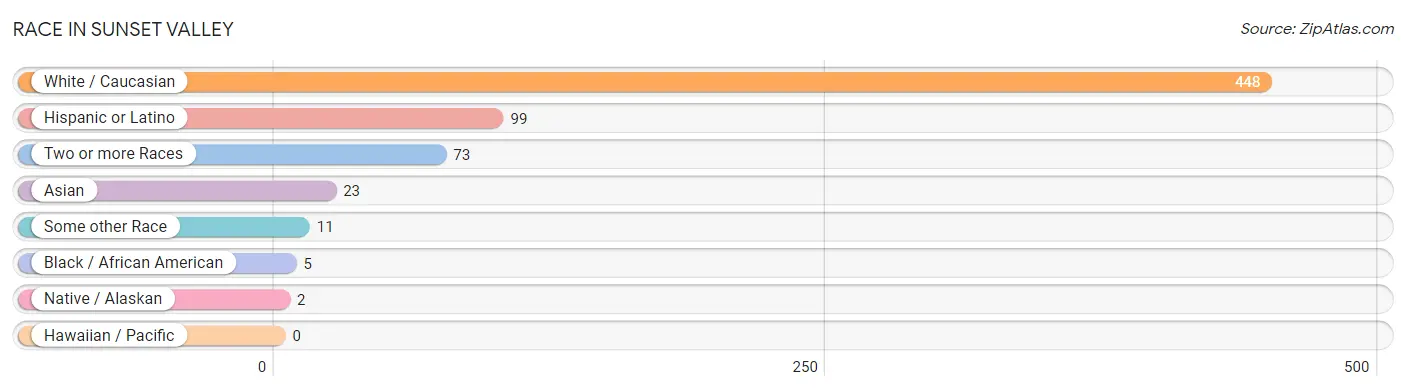
| Race | # Population | % Population |
| Asian | 23 | 4.1% |
| Black / African American | 5 | 0.9% |
| Hawaiian / Pacific | 0 | 0.0% |
| Hispanic or Latino | 99 | 17.6% |
| Native / Alaskan | 2 | 0.4% |
| White / Caucasian | 448 | 79.7% |
| Two or more Races | 73 | 13.0% |
| Some other Race | 11 | 2.0% |
| Total | 562 | 100.0% |
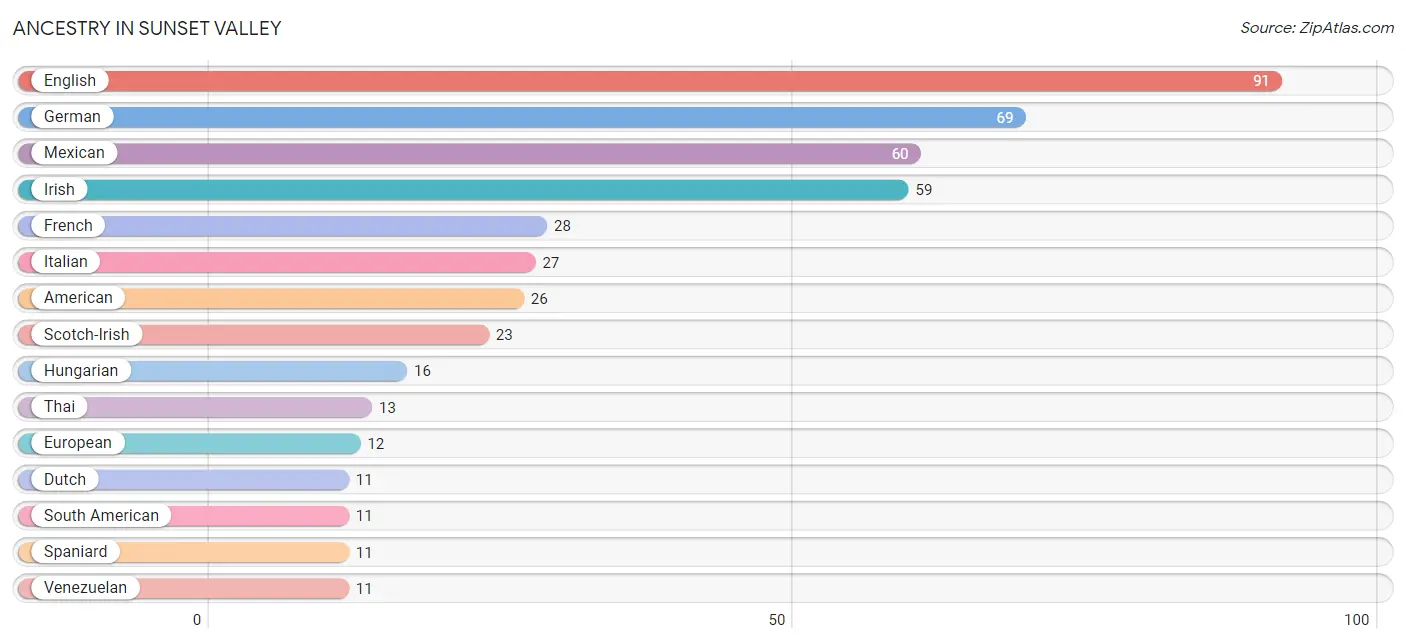
Ancestry in Sunset Valley
The most populous ancestries reported in Sunset Valley are English (91 | 16.2%), German (69 | 12.3%), Mexican (60 | 10.7%), Irish (59 | 10.5%), and French (28 | 5.0%), together accounting for 54.6% of all Sunset Valley residents.
| Ancestry | # Population | % Population |
| American | 26 | 4.6% |
| Arab | 10 | 1.8% |
| Armenian | 5 | 0.9% |
| Bhutanese | 5 | 0.9% |
| British | 2 | 0.4% |
| Central American | 5 | 0.9% |
| Cree | 2 | 0.4% |
| Czech | 9 | 1.6% |
| Danish | 4 | 0.7% |
| Dutch | 11 | 2.0% |
| English | 91 | 16.2% |
| Ethiopian | 3 | 0.5% |
| European | 12 | 2.1% |
| French | 28 | 5.0% |
| French American Indian | 2 | 0.4% |
| French Canadian | 4 | 0.7% |
| German | 69 | 12.3% |
| Hungarian | 16 | 2.9% |
| Indian (Asian) | 7 | 1.3% |
| Irish | 59 | 10.5% |
| Italian | 27 | 4.8% |
| Jamaican | 4 | 0.7% |
| Mexican | 60 | 10.7% |
| Moroccan | 2 | 0.4% |
| Nicaraguan | 5 | 0.9% |
| Norwegian | 3 | 0.5% |
| Palestinian | 8 | 1.4% |
| Polish | 8 | 1.4% |
| Puerto Rican | 3 | 0.5% |
| Romanian | 4 | 0.7% |
| Russian | 3 | 0.5% |
| Scotch-Irish | 23 | 4.1% |
| Scottish | 8 | 1.4% |
| Slovak | 1 | 0.2% |
| South American | 11 | 2.0% |
| Spaniard | 11 | 2.0% |
| Spanish | 4 | 0.7% |
| Subsaharan African | 3 | 0.5% |
| Swedish | 4 | 0.7% |
| Thai | 13 | 2.3% |
| Venezuelan | 11 | 2.0% | View All 41 Rows |
Immigrants in Sunset Valley
The most numerous immigrant groups reported in Sunset Valley came from Asia (19 | 3.4%), Latin America (16 | 2.9%), South Central Asia (11 | 2.0%), Central America (9 | 1.6%), and India (9 | 1.6%), together accounting for 11.4% of all Sunset Valley residents.
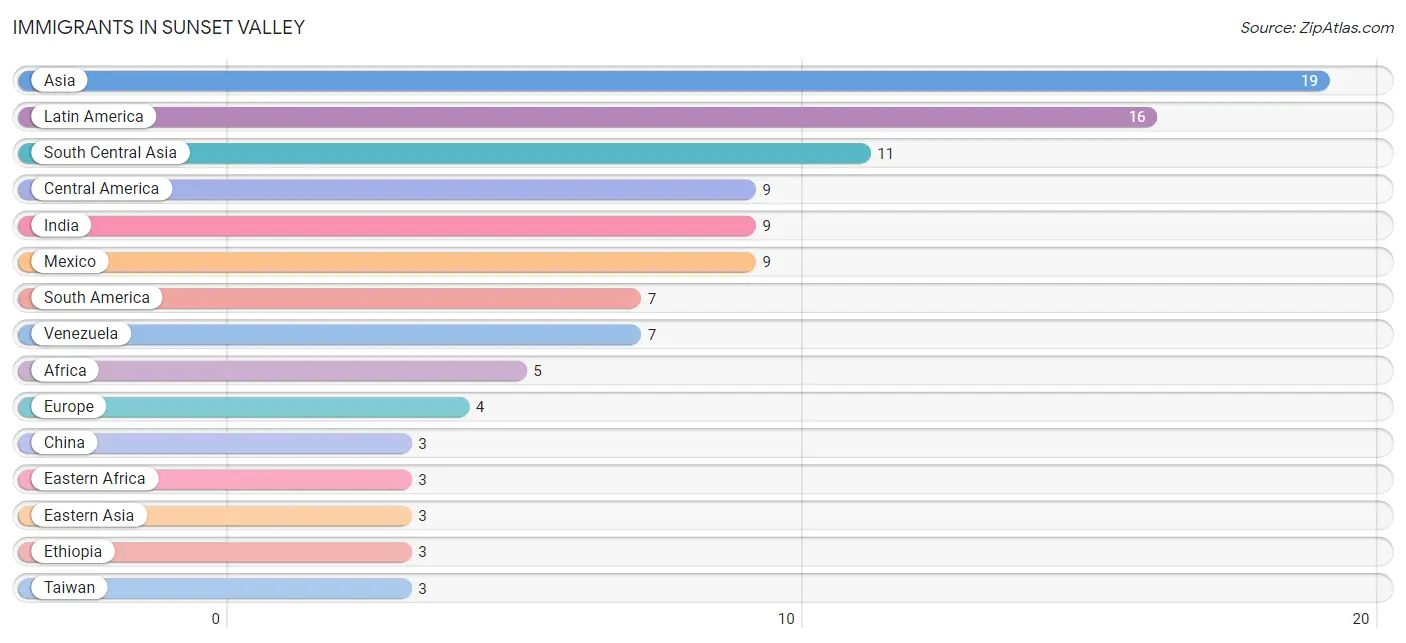
| Immigration Origin | # Population | % Population |
| Africa | 5 | 0.9% |
| Asia | 19 | 3.4% |
| Canada | 2 | 0.4% |
| Central America | 9 | 1.6% |
| China | 3 | 0.5% |
| Eastern Africa | 3 | 0.5% |
| Eastern Asia | 3 | 0.5% |
| Eastern Europe | 2 | 0.4% |
| England | 2 | 0.4% |
| Ethiopia | 3 | 0.5% |
| Europe | 4 | 0.7% |
| India | 9 | 1.6% |
| Latin America | 16 | 2.9% |
| Mexico | 9 | 1.6% |
| Morocco | 2 | 0.4% |
| Northern Africa | 2 | 0.4% |
| Northern Europe | 2 | 0.4% |
| Pakistan | 2 | 0.4% |
| Romania | 2 | 0.4% |
| South America | 7 | 1.3% |
| South Central Asia | 11 | 2.0% |
| Taiwan | 3 | 0.5% |
| Venezuela | 7 | 1.3% | View All 23 Rows |
Sex and Age in Sunset Valley
Sex and Age in Sunset Valley
The most populous age groups in Sunset Valley are 55 to 59 Years (38 | 13.2%) for men and 65 to 69 Years (58 | 21.2%) for women.
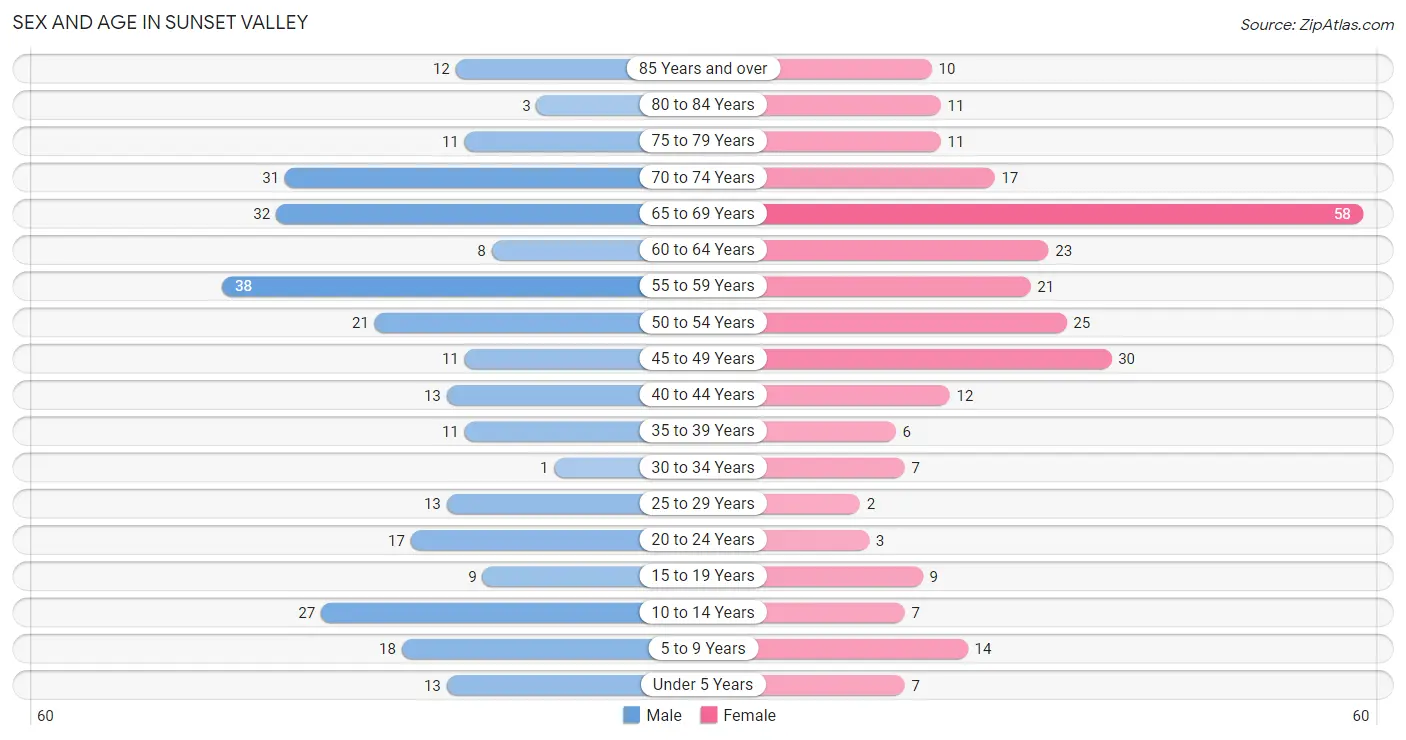
| Age Bracket | Male | Female |
| Under 5 Years | 13 (4.5%) | 7 (2.6%) |
| 5 to 9 Years | 18 (6.2%) | 14 (5.1%) |
| 10 to 14 Years | 27 (9.3%) | 7 (2.6%) |
| 15 to 19 Years | 9 (3.1%) | 9 (3.3%) |
| 20 to 24 Years | 17 (5.9%) | 3 (1.1%) |
| 25 to 29 Years | 13 (4.5%) | 2 (0.7%) |
| 30 to 34 Years | 1 (0.4%) | 7 (2.6%) |
| 35 to 39 Years | 11 (3.8%) | 6 (2.2%) |
| 40 to 44 Years | 13 (4.5%) | 12 (4.4%) |
| 45 to 49 Years | 11 (3.8%) | 30 (11.0%) |
| 50 to 54 Years | 21 (7.3%) | 25 (9.2%) |
| 55 to 59 Years | 38 (13.2%) | 21 (7.7%) |
| 60 to 64 Years | 8 (2.8%) | 23 (8.4%) |
| 65 to 69 Years | 32 (11.1%) | 58 (21.2%) |
| 70 to 74 Years | 31 (10.7%) | 17 (6.2%) |
| 75 to 79 Years | 11 (3.8%) | 11 (4.0%) |
| 80 to 84 Years | 3 (1.0%) | 11 (4.0%) |
| 85 Years and over | 12 (4.2%) | 10 (3.7%) |
| Total | 289 (100.0%) | 273 (100.0%) |
Families and Households in Sunset Valley
Median Family Size in Sunset Valley
The median family size in Sunset Valley is 2.66 persons per family, with single male/father families (5 | 3.0%) accounting for the largest median family size of 3.8 persons per family. On the other hand, single female/mother families (15 | 8.9%) represent the smallest median family size with 2.00 persons per family.
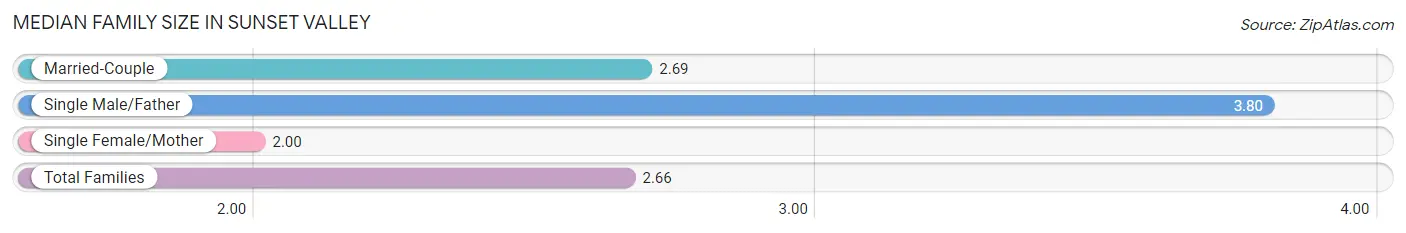
| Family Type | # Families | Family Size |
| Married-Couple | 149 (88.2%) | 2.69 |
| Single Male/Father | 5 (3.0%) | 3.80 |
| Single Female/Mother | 15 (8.9%) | 2.00 |
| Total Families | 169 (100.0%) | 2.66 |
Median Household Size in Sunset Valley
The median household size in Sunset Valley is 2.26 persons per household, with single male/father households (5 | 2.0%) accounting for the largest median household size of 3.8 persons per household. non-family households (79 | 31.9%) represent the smallest median household size with 1.34 persons per household.
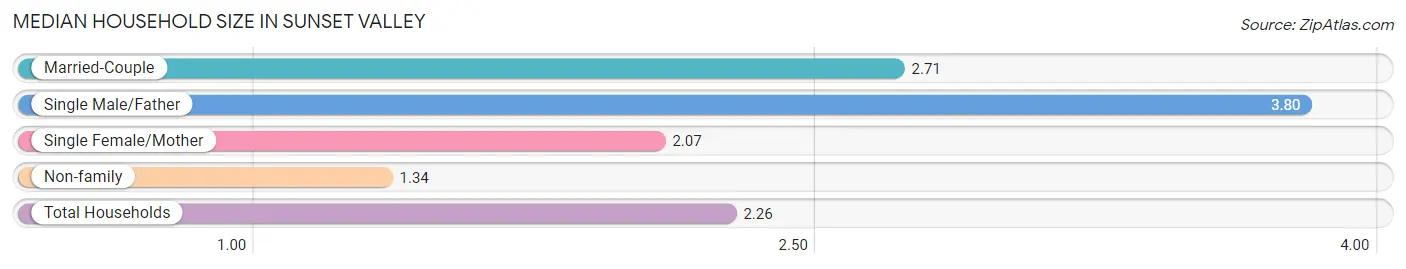
| Household Type | # Households | Household Size |
| Married-Couple | 149 (60.1%) | 2.71 |
| Single Male/Father | 5 (2.0%) | 3.80 |
| Single Female/Mother | 15 (6.0%) | 2.07 |
| Non-family | 79 (31.9%) | 1.34 |
| Total Households | 248 (100.0%) | 2.26 |
Household Size by Marriage Status in Sunset Valley
Out of a total of 248 households in Sunset Valley, 169 (68.1%) are family households, while 79 (31.9%) are nonfamily households. The most numerous type of family households are 2-person households, comprising 106, and the most common type of nonfamily households are 1-person households, comprising 57.
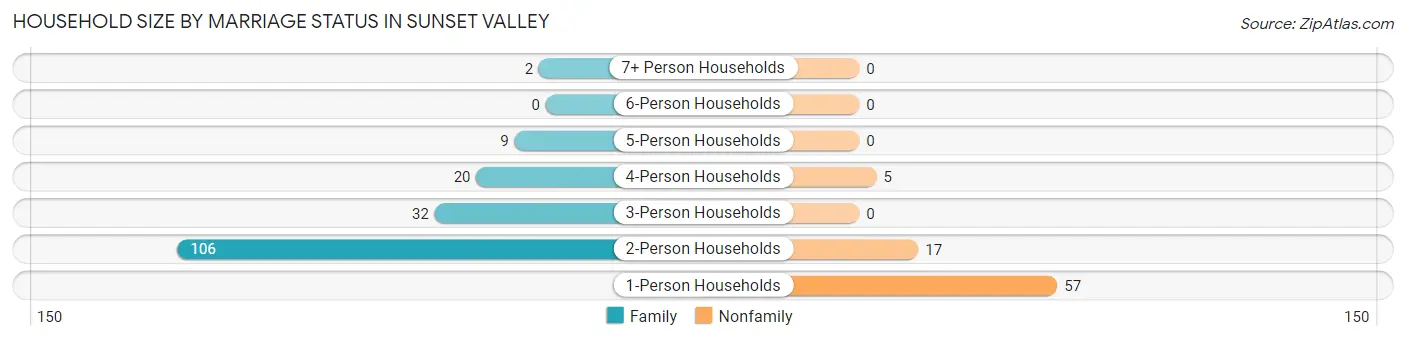
| Household Size | Family Households | Nonfamily Households |
| 1-Person Households | - | 57 (23.0%) |
| 2-Person Households | 106 (42.7%) | 17 (6.9%) |
| 3-Person Households | 32 (12.9%) | 0 (0.0%) |
| 4-Person Households | 20 (8.1%) | 5 (2.0%) |
| 5-Person Households | 9 (3.6%) | 0 (0.0%) |
| 6-Person Households | 0 (0.0%) | 0 (0.0%) |
| 7+ Person Households | 2 (0.8%) | 0 (0.0%) |
| Total | 169 (68.1%) | 79 (31.9%) |
Female Fertility in Sunset Valley
Fertility by Age in Sunset Valley
Average fertility rate in Sunset Valley is 43.0 births per 1,000 women. Women in the age bracket of 35 to 50 years have the highest fertility rate with 63.0 births per 1,000 women. Women in the age bracket of 35 to 50 years acount for 100.0% of all women with births.
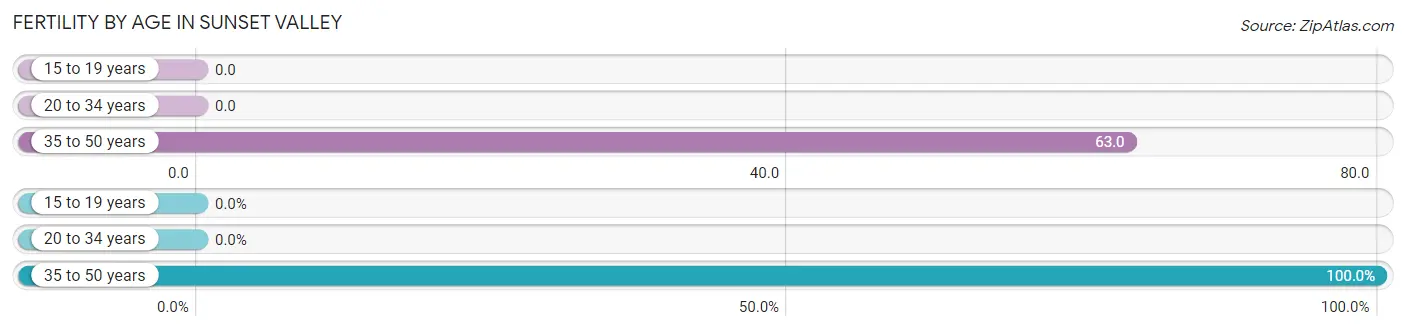
| Age Bracket | Women with Births | Births / 1,000 Women |
| 15 to 19 years | 0 (0.0%) | 0.0 |
| 20 to 34 years | 0 (0.0%) | 0.0 |
| 35 to 50 years | 3 (100.0%) | 63.0 |
| Total | 3 (100.0%) | 43.0 |
Fertility by Age by Marriage Status in Sunset Valley
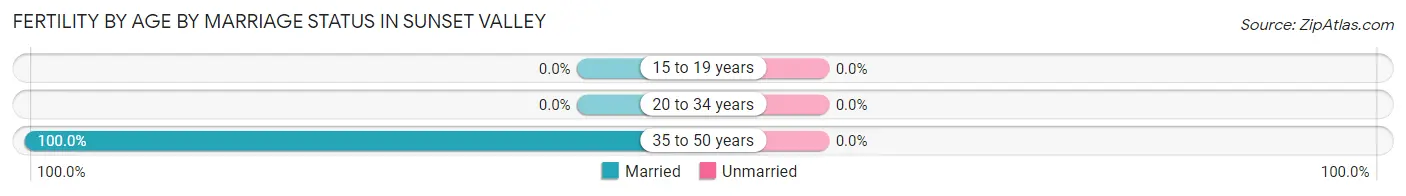
| Age Bracket | Married | Unmarried |
| 15 to 19 years | 0 (0.0%) | 0 (0.0%) |
| 20 to 34 years | 0 (0.0%) | 0 (0.0%) |
| 35 to 50 years | 3 (100.0%) | 0 (0.0%) |
| Total | 3 (100.0%) | 0 (0.0%) |
Fertility by Education in Sunset Valley
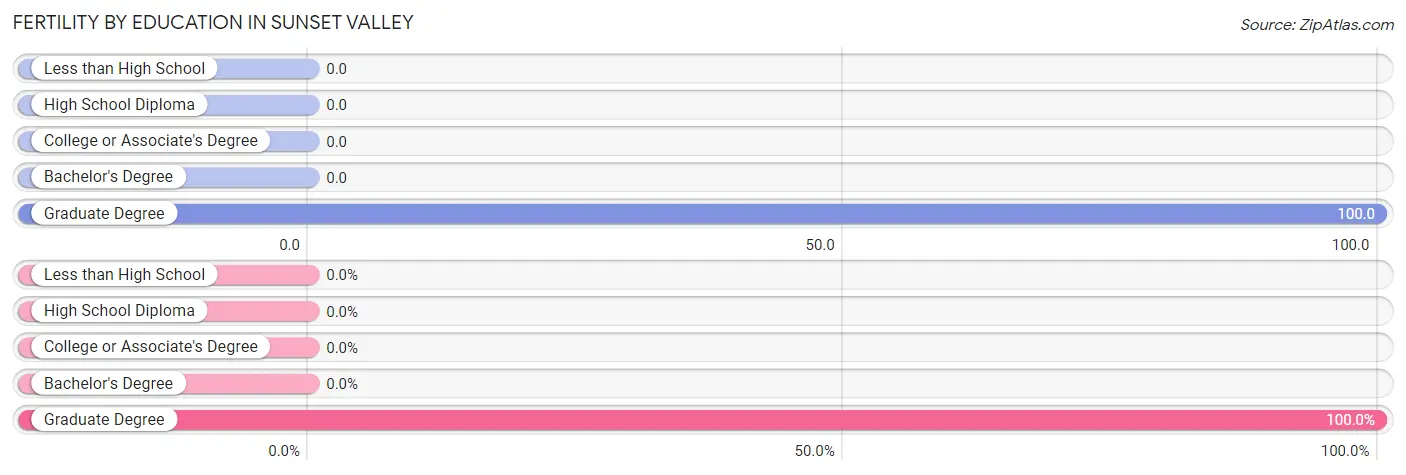
| Educational Attainment | Women with Births | Births / 1,000 Women |
| Less than High School | 0 (0.0%) | 0.0 |
| High School Diploma | 0 (0.0%) | 0.0 |
| College or Associate's Degree | 0 (0.0%) | 0.0 |
| Bachelor's Degree | 0 (0.0%) | 0.0 |
| Graduate Degree | 3 (100.0%) | 100.0 |
| Total | 3 (100.0%) | 43.0 |
Fertility by Education by Marriage Status in Sunset Valley
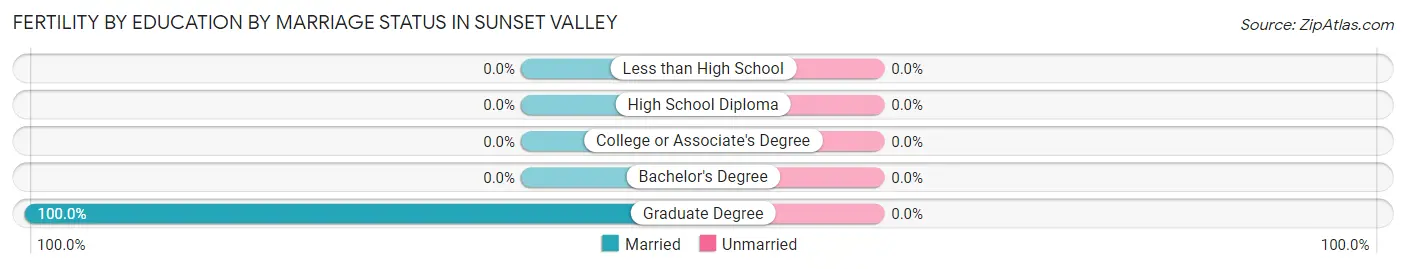
| Educational Attainment | Married | Unmarried |
| Less than High School | 0 (0.0%) | 0 (0.0%) |
| High School Diploma | 0 (0.0%) | 0 (0.0%) |
| College or Associate's Degree | 0 (0.0%) | 0 (0.0%) |
| Bachelor's Degree | 0 (0.0%) | 0 (0.0%) |
| Graduate Degree | 3 (100.0%) | 0 (0.0%) |
| Total | 3 (100.0%) | 0 (0.0%) |
Employment Characteristics in Sunset Valley
Employment by Class of Employer in Sunset Valley
Among the 250 employed individuals in Sunset Valley, private company employees (137 | 54.8%), state government employees (36 | 14.4%), and self-employed (not incorporated) (28 | 11.2%) make up the most common classes of employment.
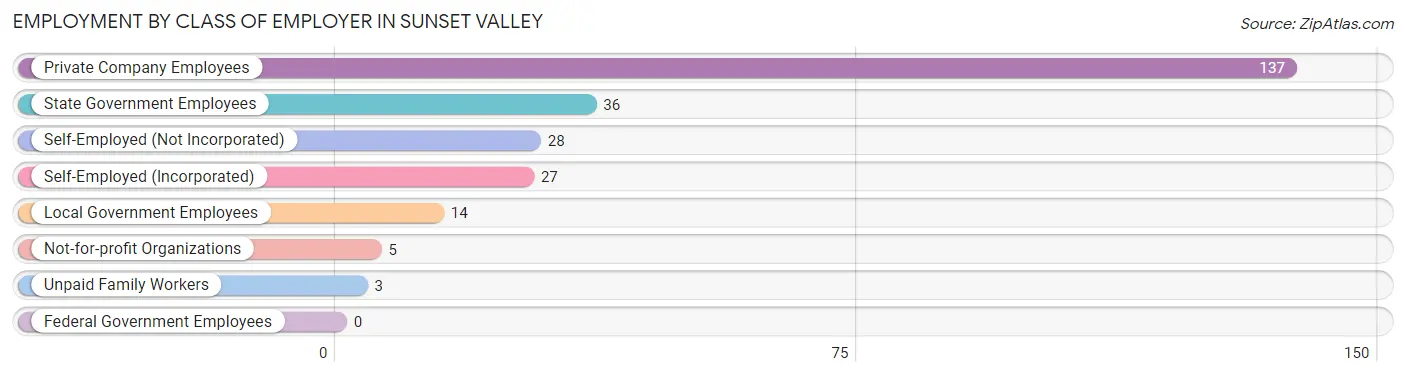
| Employer Class | # Employees | % Employees |
| Private Company Employees | 137 | 54.8% |
| Self-Employed (Incorporated) | 27 | 10.8% |
| Self-Employed (Not Incorporated) | 28 | 11.2% |
| Not-for-profit Organizations | 5 | 2.0% |
| Local Government Employees | 14 | 5.6% |
| State Government Employees | 36 | 14.4% |
| Federal Government Employees | 0 | 0.0% |
| Unpaid Family Workers | 3 | 1.2% |
| Total | 250 | 100.0% |
Employment Status by Age in Sunset Valley
According to the labor force statistics for Sunset Valley, out of the total population over 16 years of age (474), 53.8% or 255 individuals are in the labor force, with 2.0% or 5 of them unemployed. The age group with the highest labor force participation rate is 25 to 29 years, with 100.0% or 15 individuals in the labor force. Within the labor force, the 65 to 74 years age range has the highest percentage of unemployed individuals, with 10.7% or 3 of them being unemployed.
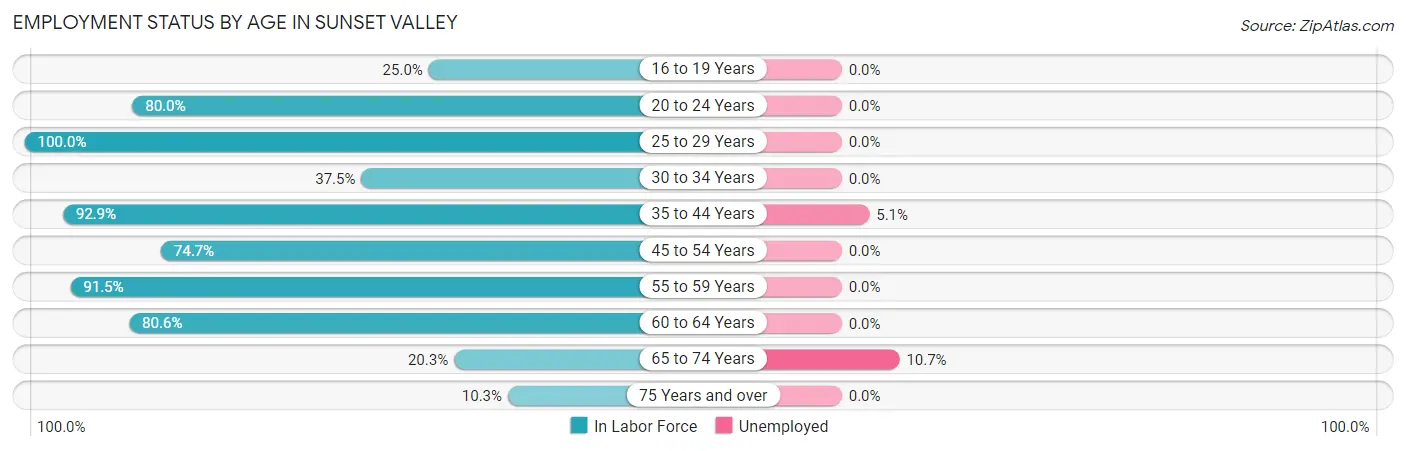
| Age Bracket | In Labor Force | Unemployed |
| 16 to 19 Years | 4 (25.0%) | 0 (0.0%) |
| 20 to 24 Years | 16 (80.0%) | 0 (0.0%) |
| 25 to 29 Years | 15 (100.0%) | 0 (0.0%) |
| 30 to 34 Years | 3 (37.5%) | 0 (0.0%) |
| 35 to 44 Years | 39 (92.9%) | 2 (5.1%) |
| 45 to 54 Years | 65 (74.7%) | 0 (0.0%) |
| 55 to 59 Years | 54 (91.5%) | 0 (0.0%) |
| 60 to 64 Years | 25 (80.6%) | 0 (0.0%) |
| 65 to 74 Years | 28 (20.3%) | 3 (10.7%) |
| 75 Years and over | 6 (10.3%) | 0 (0.0%) |
| Total | 255 (53.8%) | 5 (2.0%) |
Employment Status by Educational Attainment in Sunset Valley
According to labor force statistics for Sunset Valley, 83.1% of individuals (201) out of the total population between 25 and 64 years of age (242) are in the labor force, with 1.0% or 2 of them being unemployed. The group with the highest labor force participation rate are those with the educational attainment of high school diploma, with 89.5% or 17 individuals in the labor force. Within the labor force, individuals with bachelor's degree or higher education have the highest percentage of unemployment, with 1.3% or 2 of them being unemployed.
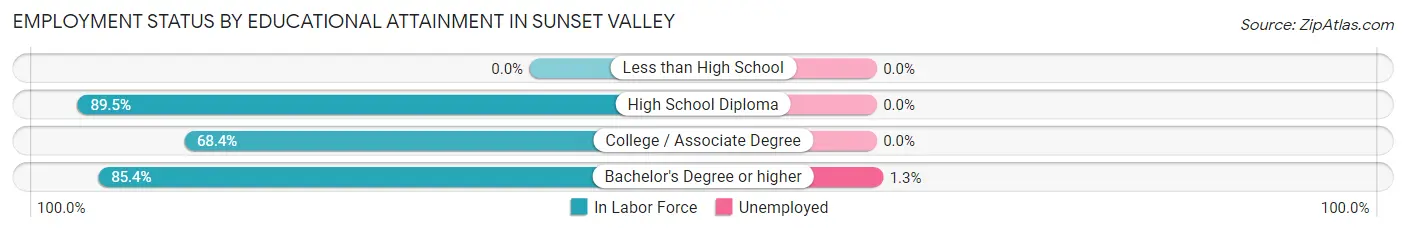
| Educational Attainment | In Labor Force | Unemployed |
| Less than High School | 0 (0.0%) | 0 (0.0%) |
| High School Diploma | 17 (89.5%) | 0 (0.0%) |
| College / Associate Degree | 26 (68.4%) | 0 (0.0%) |
| Bachelor's Degree or higher | 158 (85.4%) | 2 (1.3%) |
| Total | 201 (83.1%) | 2 (1.0%) |
Employment Occupations by Sex in Sunset Valley
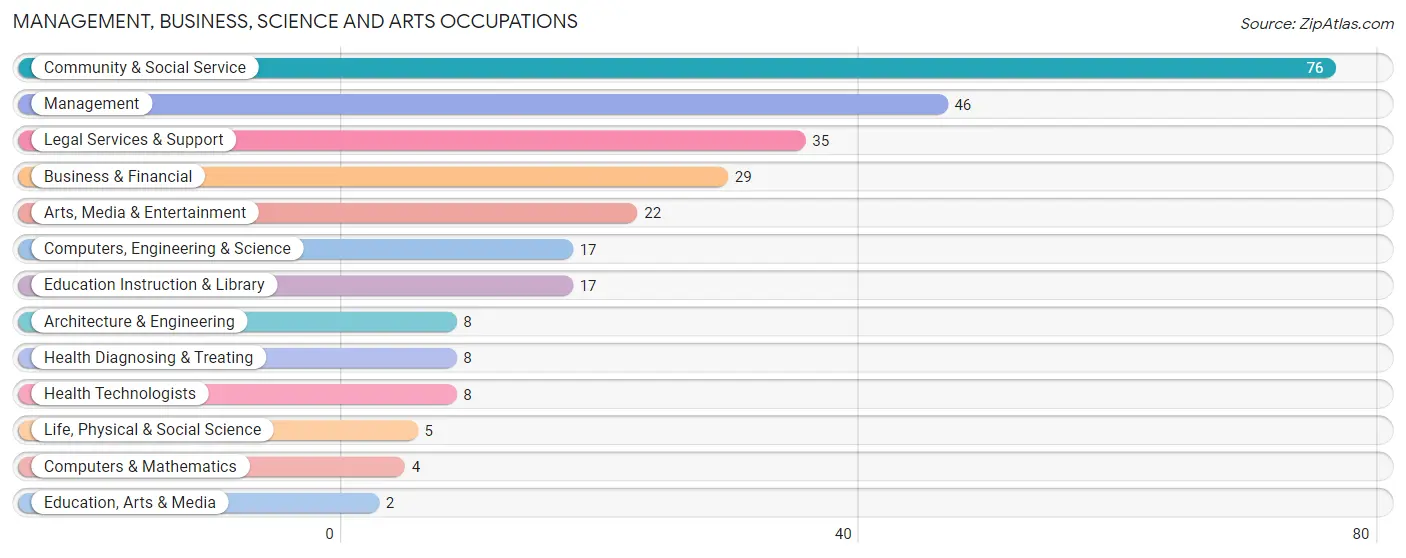
Management, Business, Science and Arts Occupations
The most common Management, Business, Science and Arts occupations in Sunset Valley are Community & Social Service (76 | 30.4%), Management (46 | 18.4%), Legal Services & Support (35 | 14.0%), Business & Financial (29 | 11.6%), and Arts, Media & Entertainment (22 | 8.8%).
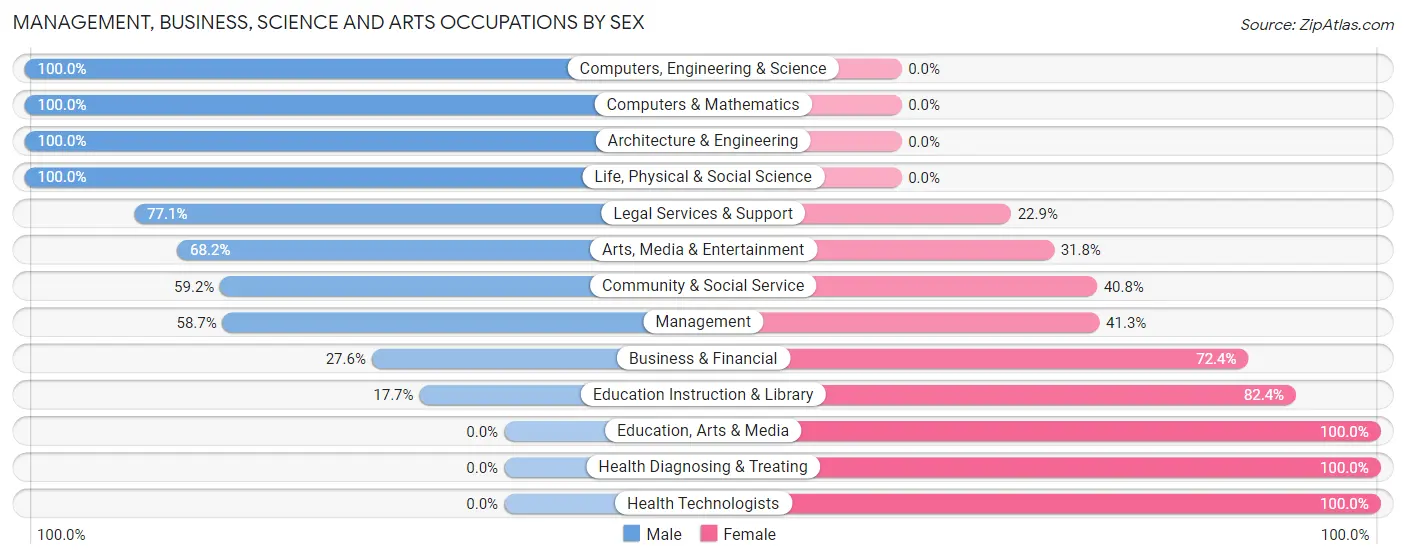
Management, Business, Science and Arts Occupations by Sex
Within the Management, Business, Science and Arts occupations in Sunset Valley, the most male-oriented occupations are Computers, Engineering & Science (100.0%), Computers & Mathematics (100.0%), and Architecture & Engineering (100.0%), while the most female-oriented occupations are Education, Arts & Media (100.0%), Health Diagnosing & Treating (100.0%), and Health Technologists (100.0%).
| Occupation | Male | Female |
| Management | 27 (58.7%) | 19 (41.3%) |
| Business & Financial | 8 (27.6%) | 21 (72.4%) |
| Computers, Engineering & Science | 17 (100.0%) | 0 (0.0%) |
| Computers & Mathematics | 4 (100.0%) | 0 (0.0%) |
| Architecture & Engineering | 8 (100.0%) | 0 (0.0%) |
| Life, Physical & Social Science | 5 (100.0%) | 0 (0.0%) |
| Community & Social Service | 45 (59.2%) | 31 (40.8%) |
| Education, Arts & Media | 0 (0.0%) | 2 (100.0%) |
| Legal Services & Support | 27 (77.1%) | 8 (22.9%) |
| Education Instruction & Library | 3 (17.6%) | 14 (82.4%) |
| Arts, Media & Entertainment | 15 (68.2%) | 7 (31.8%) |
| Health Diagnosing & Treating | 0 (0.0%) | 8 (100.0%) |
| Health Technologists | 0 (0.0%) | 8 (100.0%) |
| Total (Category) | 97 (55.1%) | 79 (44.9%) |
| Total (Overall) | 149 (59.6%) | 101 (40.4%) |
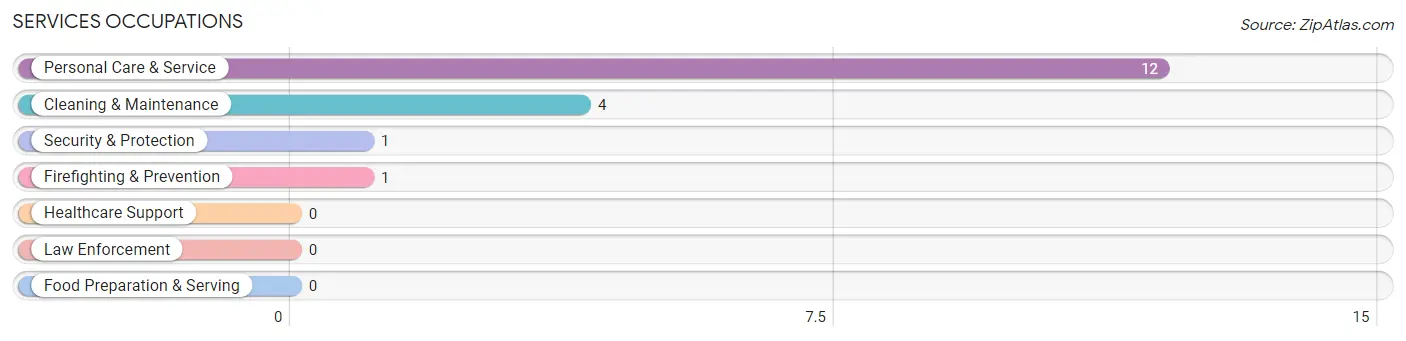
Services Occupations
The most common Services occupations in Sunset Valley are Personal Care & Service (12 | 4.8%), Cleaning & Maintenance (4 | 1.6%), Security & Protection (1 | 0.4%), and Firefighting & Prevention (1 | 0.4%).
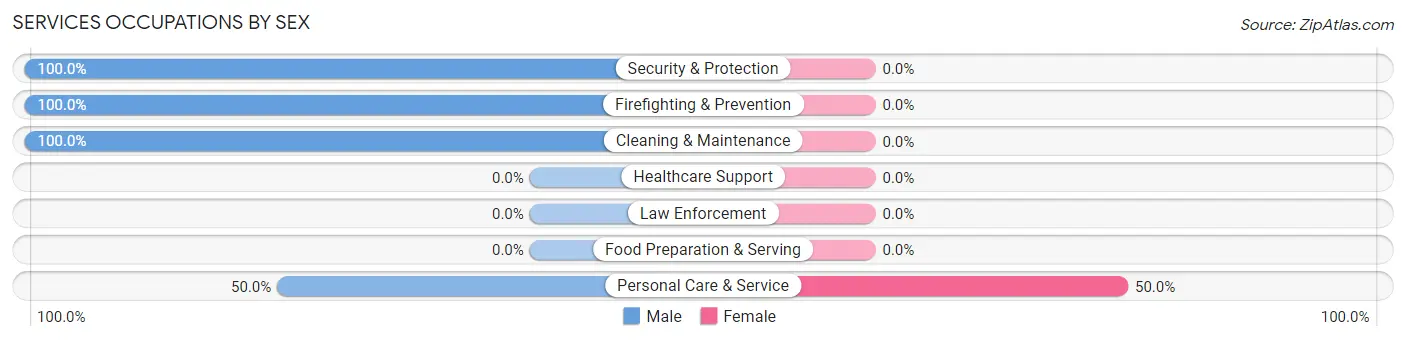
Services Occupations by Sex
| Occupation | Male | Female |
| Healthcare Support | 0 (0.0%) | 0 (0.0%) |
| Security & Protection | 1 (100.0%) | 0 (0.0%) |
| Firefighting & Prevention | 1 (100.0%) | 0 (0.0%) |
| Law Enforcement | 0 (0.0%) | 0 (0.0%) |
| Food Preparation & Serving | 0 (0.0%) | 0 (0.0%) |
| Cleaning & Maintenance | 4 (100.0%) | 0 (0.0%) |
| Personal Care & Service | 6 (50.0%) | 6 (50.0%) |
| Total (Category) | 11 (64.7%) | 6 (35.3%) |
| Total (Overall) | 149 (59.6%) | 101 (40.4%) |
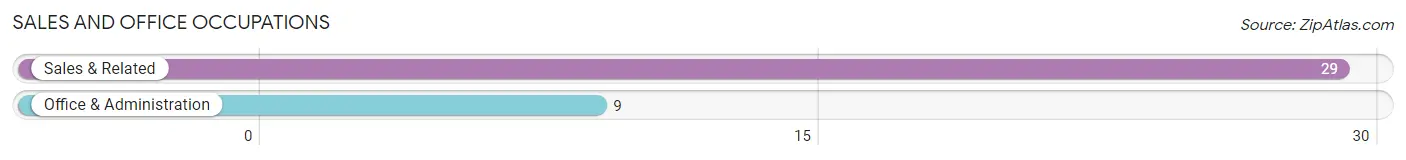
Sales and Office Occupations
The most common Sales and Office occupations in Sunset Valley are Sales & Related (29 | 11.6%), and Office & Administration (9 | 3.6%).
Sales and Office Occupations by Sex
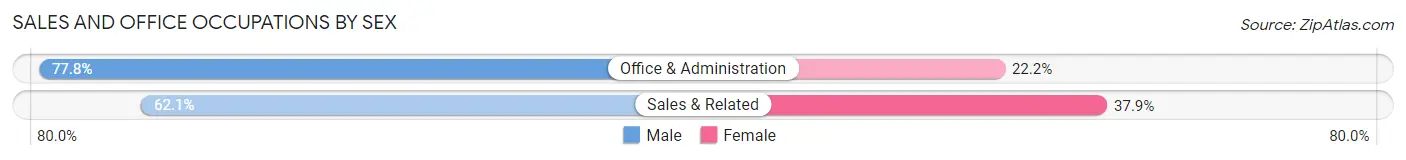
| Occupation | Male | Female |
| Sales & Related | 18 (62.1%) | 11 (37.9%) |
| Office & Administration | 7 (77.8%) | 2 (22.2%) |
| Total (Category) | 25 (65.8%) | 13 (34.2%) |
| Total (Overall) | 149 (59.6%) | 101 (40.4%) |
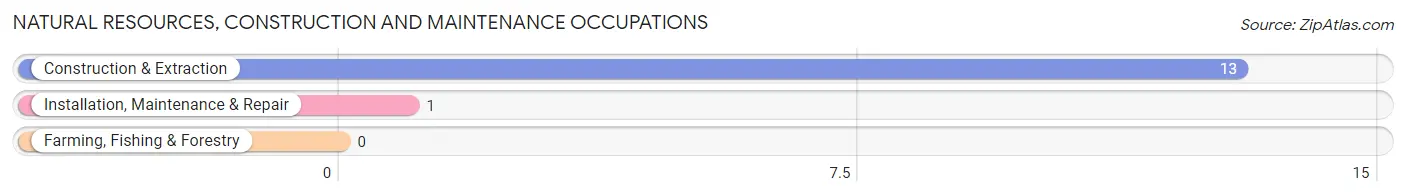
Natural Resources, Construction and Maintenance Occupations
The most common Natural Resources, Construction and Maintenance occupations in Sunset Valley are Construction & Extraction (13 | 5.2%), and Installation, Maintenance & Repair (1 | 0.4%).
Natural Resources, Construction and Maintenance Occupations by Sex
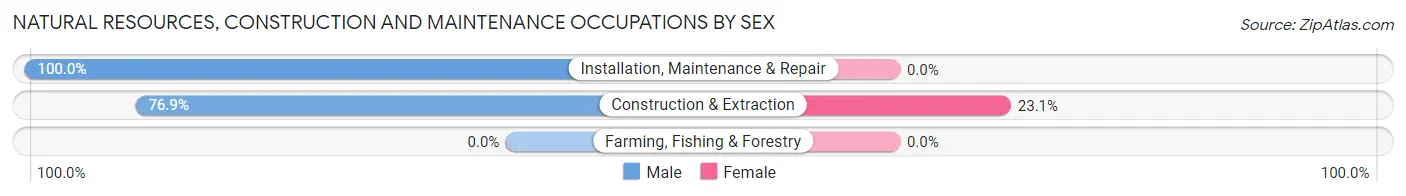
| Occupation | Male | Female |
| Farming, Fishing & Forestry | 0 (0.0%) | 0 (0.0%) |
| Construction & Extraction | 10 (76.9%) | 3 (23.1%) |
| Installation, Maintenance & Repair | 1 (100.0%) | 0 (0.0%) |
| Total (Category) | 11 (78.6%) | 3 (21.4%) |
| Total (Overall) | 149 (59.6%) | 101 (40.4%) |
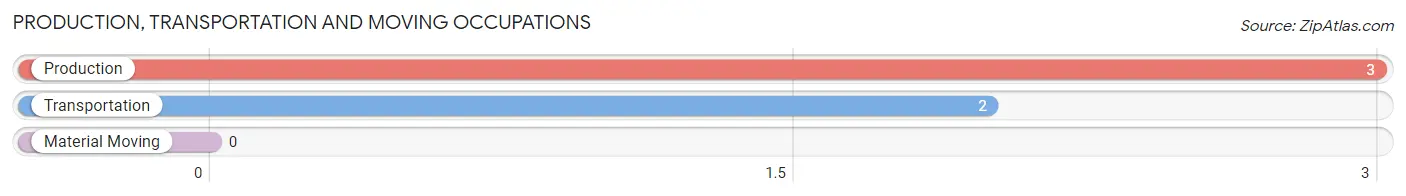
Production, Transportation and Moving Occupations
The most common Production, Transportation and Moving occupations in Sunset Valley are Production (3 | 1.2%), and Transportation (2 | 0.8%).
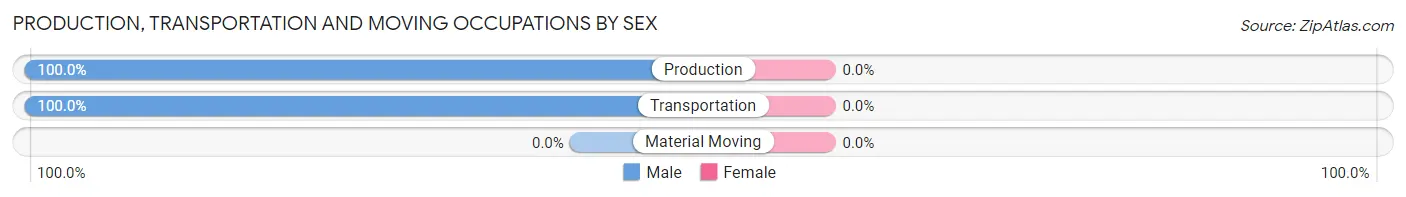
Production, Transportation and Moving Occupations by Sex
| Occupation | Male | Female |
| Production | 3 (100.0%) | 0 (0.0%) |
| Transportation | 2 (100.0%) | 0 (0.0%) |
| Material Moving | 0 (0.0%) | 0 (0.0%) |
| Total (Category) | 5 (100.0%) | 0 (0.0%) |
| Total (Overall) | 149 (59.6%) | 101 (40.4%) |
Employment Industries by Sex in Sunset Valley
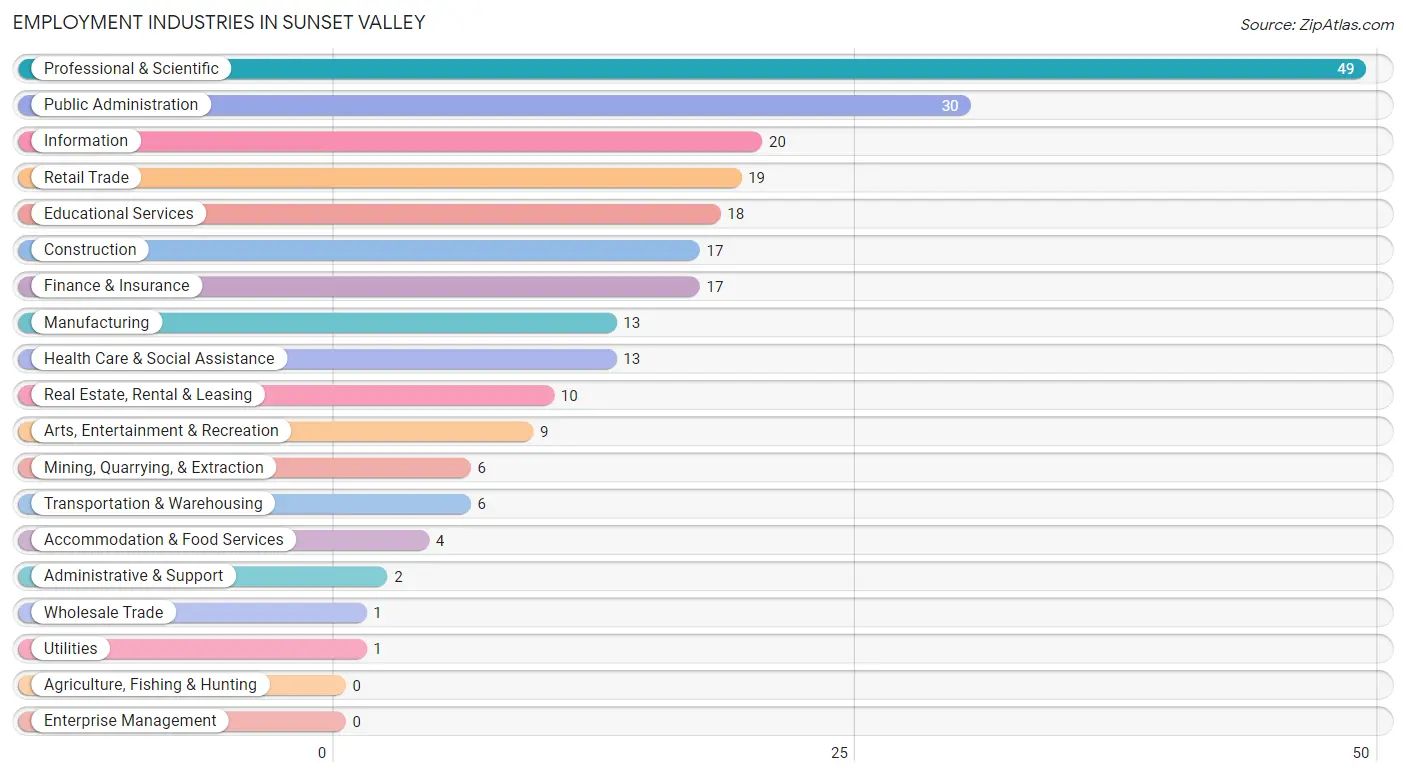
Employment Industries in Sunset Valley
The major employment industries in Sunset Valley include Professional & Scientific (49 | 19.6%), Public Administration (30 | 12.0%), Information (20 | 8.0%), Retail Trade (19 | 7.6%), and Educational Services (18 | 7.2%).
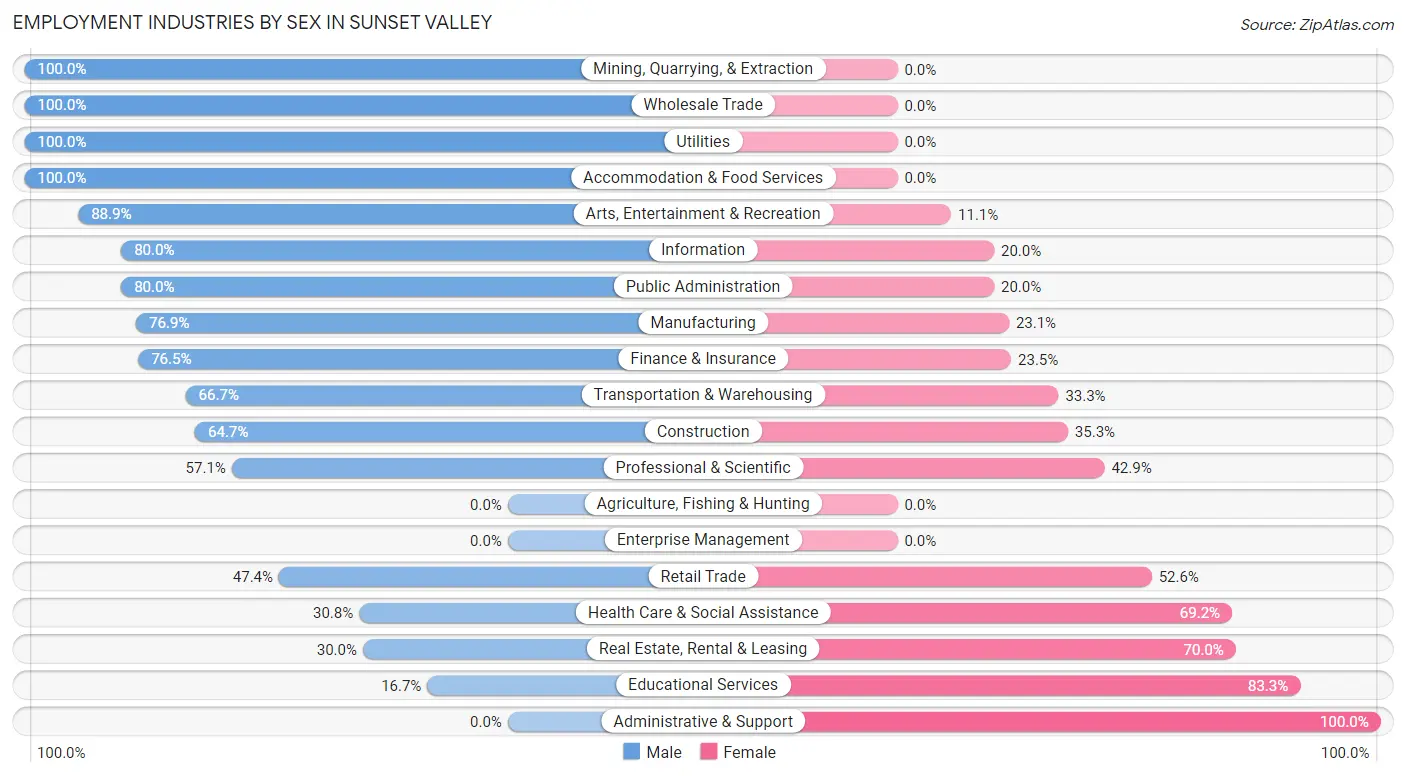
Employment Industries by Sex in Sunset Valley
The Sunset Valley industries that see more men than women are Mining, Quarrying, & Extraction (100.0%), Wholesale Trade (100.0%), and Utilities (100.0%), whereas the industries that tend to have a higher number of women are Administrative & Support (100.0%), Educational Services (83.3%), and Real Estate, Rental & Leasing (70.0%).
| Industry | Male | Female |
| Agriculture, Fishing & Hunting | 0 (0.0%) | 0 (0.0%) |
| Mining, Quarrying, & Extraction | 6 (100.0%) | 0 (0.0%) |
| Construction | 11 (64.7%) | 6 (35.3%) |
| Manufacturing | 10 (76.9%) | 3 (23.1%) |
| Wholesale Trade | 1 (100.0%) | 0 (0.0%) |
| Retail Trade | 9 (47.4%) | 10 (52.6%) |
| Transportation & Warehousing | 4 (66.7%) | 2 (33.3%) |
| Utilities | 1 (100.0%) | 0 (0.0%) |
| Information | 16 (80.0%) | 4 (20.0%) |
| Finance & Insurance | 13 (76.5%) | 4 (23.5%) |
| Real Estate, Rental & Leasing | 3 (30.0%) | 7 (70.0%) |
| Professional & Scientific | 28 (57.1%) | 21 (42.9%) |
| Enterprise Management | 0 (0.0%) | 0 (0.0%) |
| Administrative & Support | 0 (0.0%) | 2 (100.0%) |
| Educational Services | 3 (16.7%) | 15 (83.3%) |
| Health Care & Social Assistance | 4 (30.8%) | 9 (69.2%) |
| Arts, Entertainment & Recreation | 8 (88.9%) | 1 (11.1%) |
| Accommodation & Food Services | 4 (100.0%) | 0 (0.0%) |
| Public Administration | 24 (80.0%) | 6 (20.0%) |
| Total | 149 (59.6%) | 101 (40.4%) |
Education in Sunset Valley
School Enrollment in Sunset Valley
The most common levels of schooling among the 96 students in Sunset Valley are middle school (25 | 26.0%), high school (21 | 21.9%), and elementary school (20 | 20.8%).
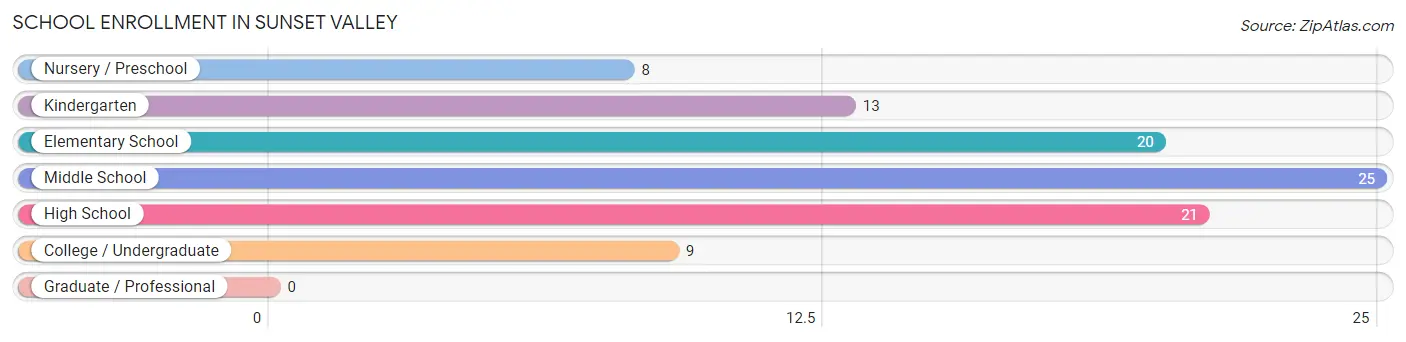
| School Level | # Students | % Students |
| Nursery / Preschool | 8 | 8.3% |
| Kindergarten | 13 | 13.5% |
| Elementary School | 20 | 20.8% |
| Middle School | 25 | 26.0% |
| High School | 21 | 21.9% |
| College / Undergraduate | 9 | 9.4% |
| Graduate / Professional | 0 | 0.0% |
| Total | 96 | 100.0% |
School Enrollment by Age by Funding Source in Sunset Valley
Out of a total of 96 students who are enrolled in schools in Sunset Valley, 45 (46.9%) attend a private institution, while the remaining 51 (53.1%) are enrolled in public schools. The age group of 3 to 4 year olds has the highest likelihood of being enrolled in private schools, with 5 (100.0% in the age bracket) enrolled. Conversely, the age group of 18 to 19 year olds has the lowest likelihood of being enrolled in a private school, with 5 (100.0% in the age bracket) attending a public institution.
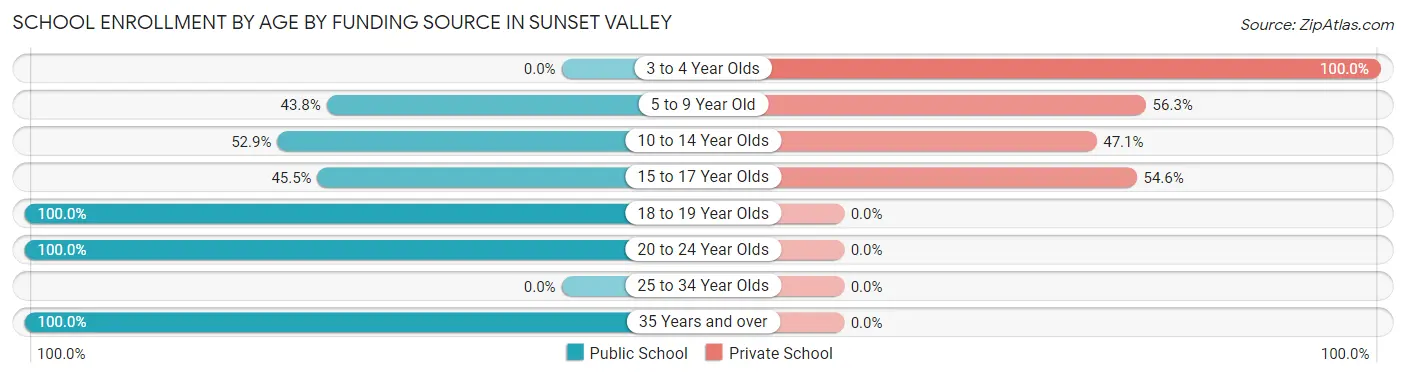
| Age Bracket | Public School | Private School |
| 3 to 4 Year Olds | 0 (0.0%) | 5 (100.0%) |
| 5 to 9 Year Old | 14 (43.8%) | 18 (56.2%) |
| 10 to 14 Year Olds | 18 (52.9%) | 16 (47.1%) |
| 15 to 17 Year Olds | 5 (45.5%) | 6 (54.5%) |
| 18 to 19 Year Olds | 5 (100.0%) | 0 (0.0%) |
| 20 to 24 Year Olds | 4 (100.0%) | 0 (0.0%) |
| 25 to 34 Year Olds | 0 (0.0%) | 0 (0.0%) |
| 35 Years and over | 5 (100.0%) | 0 (0.0%) |
| Total | 51 (53.1%) | 45 (46.9%) |
Educational Attainment by Field of Study in Sunset Valley
Business (60 | 18.9%), social sciences (45 | 14.1%), bio, nature & agricultural (30 | 9.4%), engineering (30 | 9.4%), and education (30 | 9.4%) are the most common fields of study among 318 individuals in Sunset Valley who have obtained a bachelor's degree or higher.
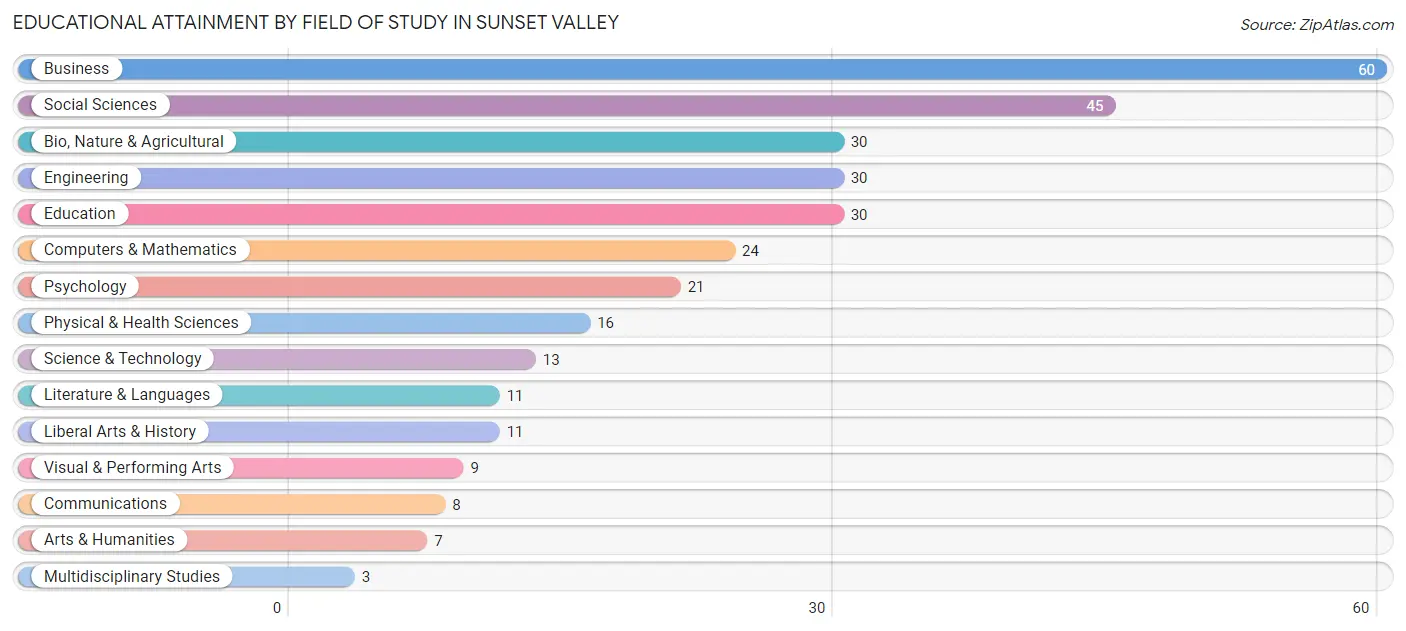
| Field of Study | # Graduates | % Graduates |
| Computers & Mathematics | 24 | 7.5% |
| Bio, Nature & Agricultural | 30 | 9.4% |
| Physical & Health Sciences | 16 | 5.0% |
| Psychology | 21 | 6.6% |
| Social Sciences | 45 | 14.1% |
| Engineering | 30 | 9.4% |
| Multidisciplinary Studies | 3 | 0.9% |
| Science & Technology | 13 | 4.1% |
| Business | 60 | 18.9% |
| Education | 30 | 9.4% |
| Literature & Languages | 11 | 3.5% |
| Liberal Arts & History | 11 | 3.5% |
| Visual & Performing Arts | 9 | 2.8% |
| Communications | 8 | 2.5% |
| Arts & Humanities | 7 | 2.2% |
| Total | 318 | 100.0% |
Transportation & Commute in Sunset Valley
Vehicle Availability by Sex in Sunset Valley
The most prevalent vehicle ownership categories in Sunset Valley are males with 2 vehicles (59, accounting for 39.6%) and females with 2 vehicles (53, making up 58.4%).
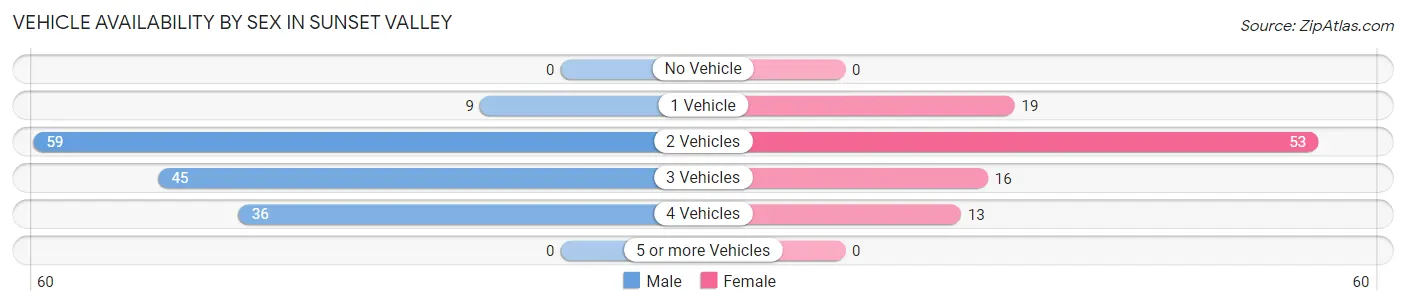
| Vehicles Available | Male | Female |
| No Vehicle | 0 (0.0%) | 0 (0.0%) |
| 1 Vehicle | 9 (6.0%) | 19 (18.8%) |
| 2 Vehicles | 59 (39.6%) | 53 (52.5%) |
| 3 Vehicles | 45 (30.2%) | 16 (15.8%) |
| 4 Vehicles | 36 (24.2%) | 13 (12.9%) |
| 5 or more Vehicles | 0 (0.0%) | 0 (0.0%) |
| Total | 149 (100.0%) | 101 (100.0%) |
Commute Time in Sunset Valley
The most frequently occuring commute durations in Sunset Valley are 45 to 59 minutes (39 commuters, 24.8%), 15 to 19 minutes (24 commuters, 15.3%), and 5 to 9 minutes (21 commuters, 13.4%).
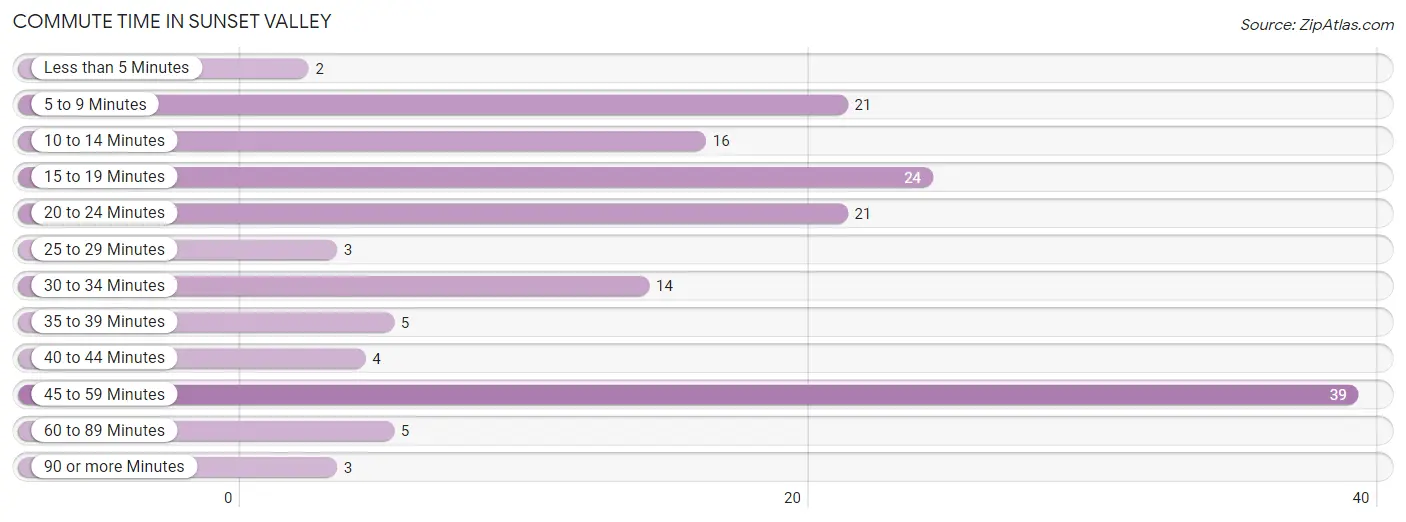
| Commute Time | # Commuters | % Commuters |
| Less than 5 Minutes | 2 | 1.3% |
| 5 to 9 Minutes | 21 | 13.4% |
| 10 to 14 Minutes | 16 | 10.2% |
| 15 to 19 Minutes | 24 | 15.3% |
| 20 to 24 Minutes | 21 | 13.4% |
| 25 to 29 Minutes | 3 | 1.9% |
| 30 to 34 Minutes | 14 | 8.9% |
| 35 to 39 Minutes | 5 | 3.2% |
| 40 to 44 Minutes | 4 | 2.5% |
| 45 to 59 Minutes | 39 | 24.8% |
| 60 to 89 Minutes | 5 | 3.2% |
| 90 or more Minutes | 3 | 1.9% |
Commute Time by Sex in Sunset Valley
The most common commute times in Sunset Valley are 45 to 59 minutes (29 commuters, 31.2%) for males and 30 to 34 minutes (13 commuters, 20.3%) for females.
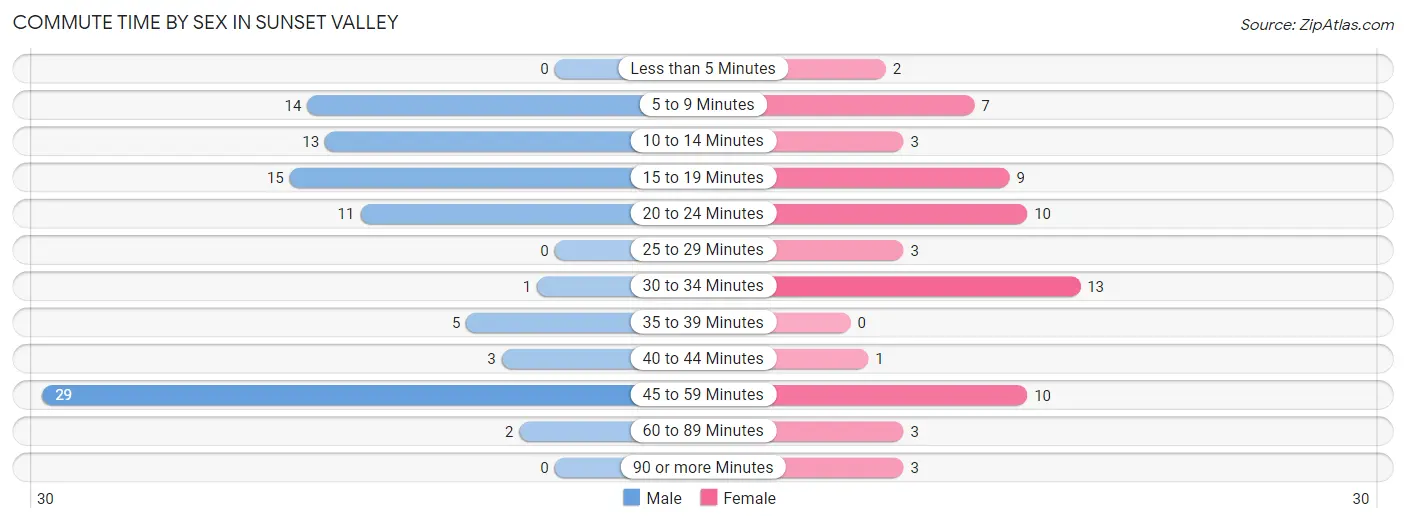
| Commute Time | Male | Female |
| Less than 5 Minutes | 0 (0.0%) | 2 (3.1%) |
| 5 to 9 Minutes | 14 (15.0%) | 7 (10.9%) |
| 10 to 14 Minutes | 13 (14.0%) | 3 (4.7%) |
| 15 to 19 Minutes | 15 (16.1%) | 9 (14.1%) |
| 20 to 24 Minutes | 11 (11.8%) | 10 (15.6%) |
| 25 to 29 Minutes | 0 (0.0%) | 3 (4.7%) |
| 30 to 34 Minutes | 1 (1.1%) | 13 (20.3%) |
| 35 to 39 Minutes | 5 (5.4%) | 0 (0.0%) |
| 40 to 44 Minutes | 3 (3.2%) | 1 (1.6%) |
| 45 to 59 Minutes | 29 (31.2%) | 10 (15.6%) |
| 60 to 89 Minutes | 2 (2.1%) | 3 (4.7%) |
| 90 or more Minutes | 0 (0.0%) | 3 (4.7%) |
Time of Departure to Work by Sex in Sunset Valley
The most frequent times of departure to work in Sunset Valley are 9:00 AM to 9:59 AM (22, 23.7%) for males and 8:00 AM to 8:29 AM (17, 26.6%) for females.
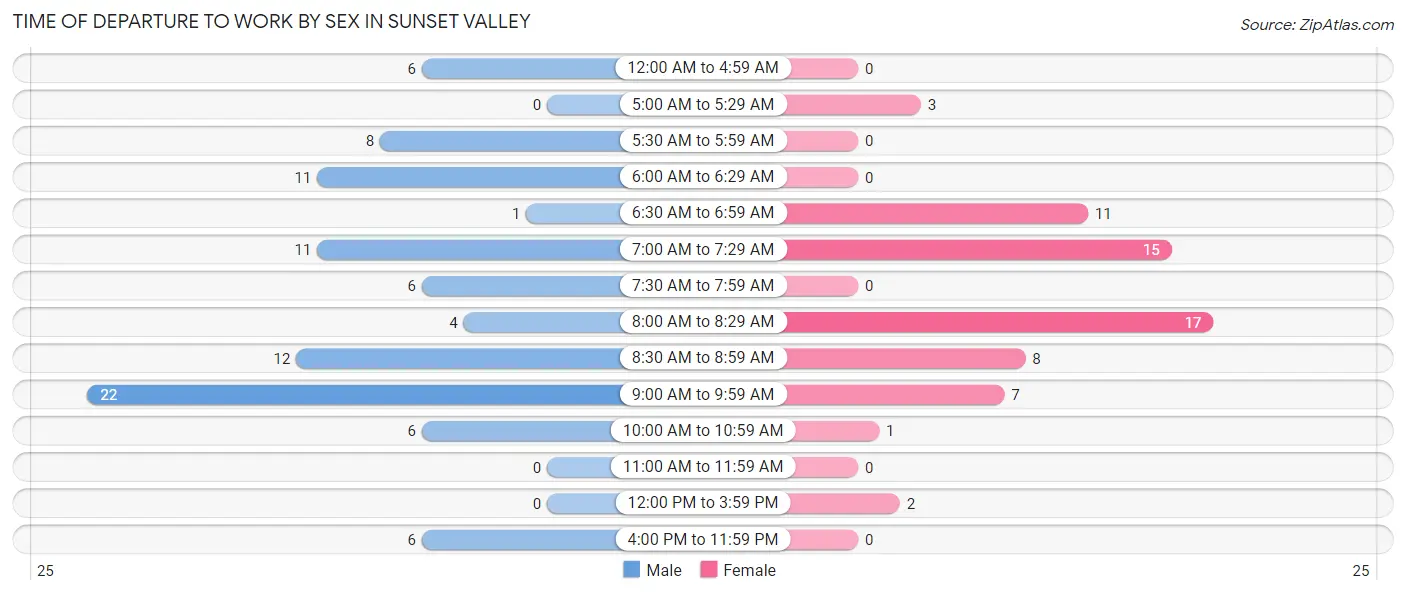
| Time of Departure | Male | Female |
| 12:00 AM to 4:59 AM | 6 (6.5%) | 0 (0.0%) |
| 5:00 AM to 5:29 AM | 0 (0.0%) | 3 (4.7%) |
| 5:30 AM to 5:59 AM | 8 (8.6%) | 0 (0.0%) |
| 6:00 AM to 6:29 AM | 11 (11.8%) | 0 (0.0%) |
| 6:30 AM to 6:59 AM | 1 (1.1%) | 11 (17.2%) |
| 7:00 AM to 7:29 AM | 11 (11.8%) | 15 (23.4%) |
| 7:30 AM to 7:59 AM | 6 (6.5%) | 0 (0.0%) |
| 8:00 AM to 8:29 AM | 4 (4.3%) | 17 (26.6%) |
| 8:30 AM to 8:59 AM | 12 (12.9%) | 8 (12.5%) |
| 9:00 AM to 9:59 AM | 22 (23.7%) | 7 (10.9%) |
| 10:00 AM to 10:59 AM | 6 (6.5%) | 1 (1.6%) |
| 11:00 AM to 11:59 AM | 0 (0.0%) | 0 (0.0%) |
| 12:00 PM to 3:59 PM | 0 (0.0%) | 2 (3.1%) |
| 4:00 PM to 11:59 PM | 6 (6.5%) | 0 (0.0%) |
| Total | 93 (100.0%) | 64 (100.0%) |
Housing Occupancy in Sunset Valley
Occupancy by Ownership in Sunset Valley
Of the total 248 dwellings in Sunset Valley, owner-occupied units account for 228 (91.9%), while renter-occupied units make up 20 (8.1%).
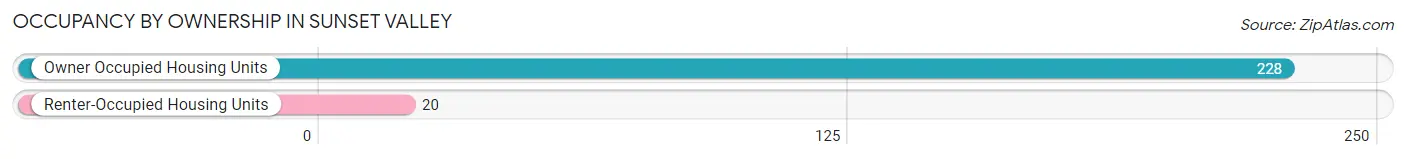
| Occupancy | # Housing Units | % Housing Units |
| Owner Occupied Housing Units | 228 | 91.9% |
| Renter-Occupied Housing Units | 20 | 8.1% |
| Total Occupied Housing Units | 248 | 100.0% |
Occupancy by Household Size in Sunset Valley
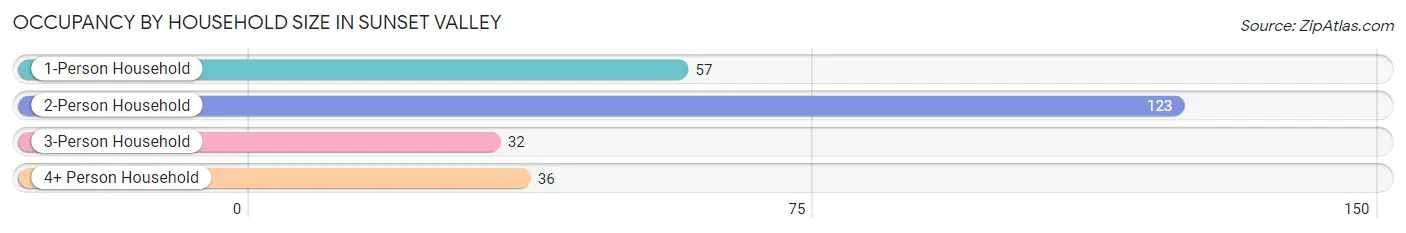
| Household Size | # Housing Units | % Housing Units |
| 1-Person Household | 57 | 23.0% |
| 2-Person Household | 123 | 49.6% |
| 3-Person Household | 32 | 12.9% |
| 4+ Person Household | 36 | 14.5% |
| Total Housing Units | 248 | 100.0% |
Occupancy by Ownership by Household Size in Sunset Valley
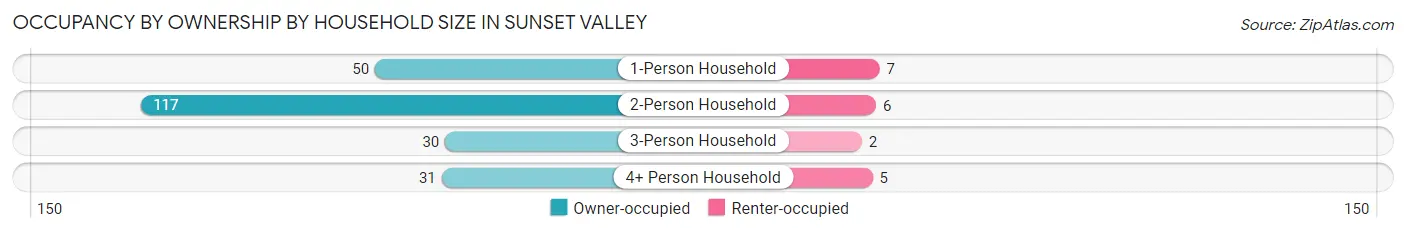
| Household Size | Owner-occupied | Renter-occupied |
| 1-Person Household | 50 (87.7%) | 7 (12.3%) |
| 2-Person Household | 117 (95.1%) | 6 (4.9%) |
| 3-Person Household | 30 (93.8%) | 2 (6.2%) |
| 4+ Person Household | 31 (86.1%) | 5 (13.9%) |
| Total Housing Units | 228 (91.9%) | 20 (8.1%) |
Occupancy by Educational Attainment in Sunset Valley
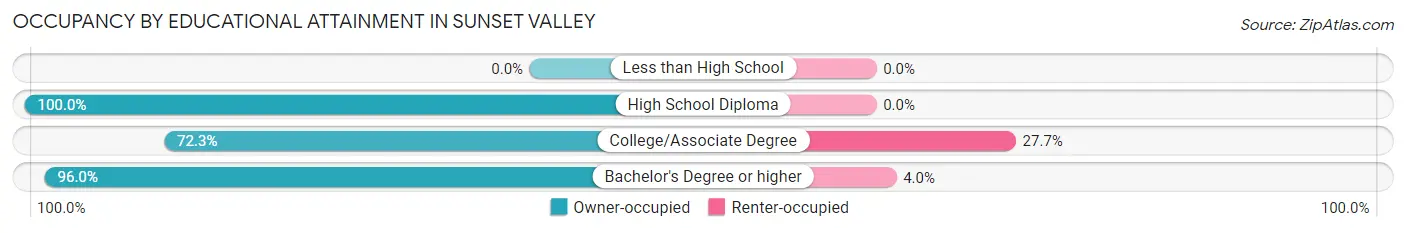
| Household Size | Owner-occupied | Renter-occupied |
| Less than High School | 0 (0.0%) | 0 (0.0%) |
| High School Diploma | 25 (100.0%) | 0 (0.0%) |
| College/Associate Degree | 34 (72.3%) | 13 (27.7%) |
| Bachelor's Degree or higher | 169 (96.0%) | 7 (4.0%) |
Occupancy by Age of Householder in Sunset Valley
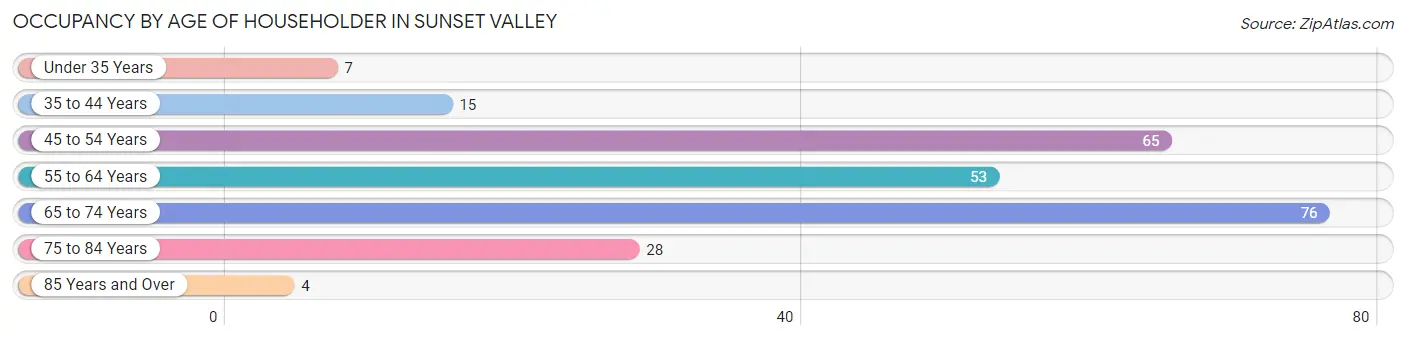
| Age Bracket | # Households | % Households |
| Under 35 Years | 7 | 2.8% |
| 35 to 44 Years | 15 | 6.0% |
| 45 to 54 Years | 65 | 26.2% |
| 55 to 64 Years | 53 | 21.4% |
| 65 to 74 Years | 76 | 30.6% |
| 75 to 84 Years | 28 | 11.3% |
| 85 Years and Over | 4 | 1.6% |
| Total | 248 | 100.0% |
Housing Finances in Sunset Valley
Median Income by Occupancy in Sunset Valley
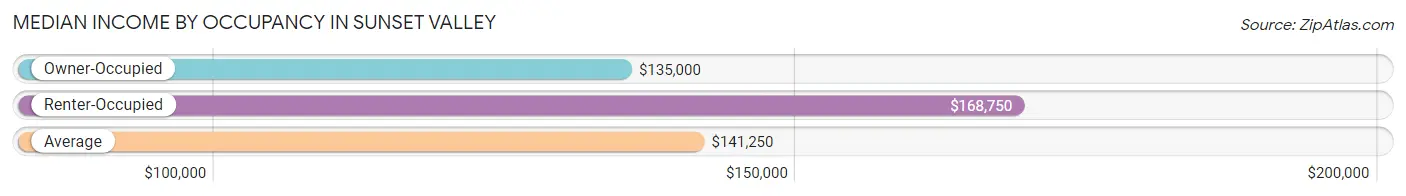
| Occupancy Type | # Households | Median Income |
| Owner-Occupied | 228 (91.9%) | $135,000 |
| Renter-Occupied | 20 (8.1%) | $168,750 |
| Average | 248 (100.0%) | $141,250 |
Occupancy by Householder Income Bracket in Sunset Valley
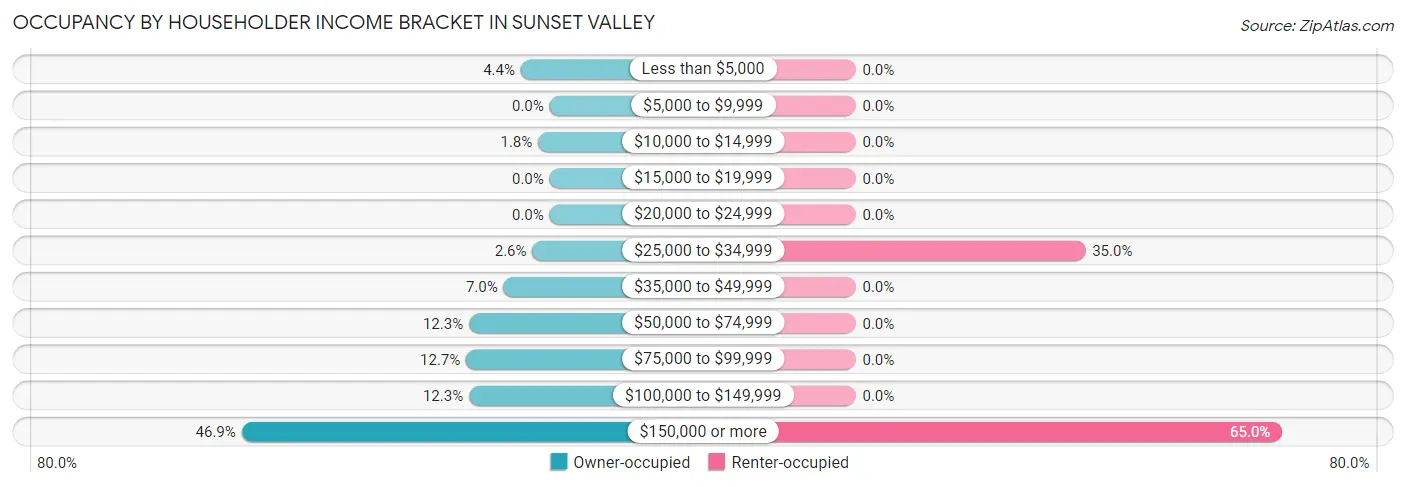
| Income Bracket | Owner-occupied | Renter-occupied |
| Less than $5,000 | 10 (4.4%) | 0 (0.0%) |
| $5,000 to $9,999 | 0 (0.0%) | 0 (0.0%) |
| $10,000 to $14,999 | 4 (1.8%) | 0 (0.0%) |
| $15,000 to $19,999 | 0 (0.0%) | 0 (0.0%) |
| $20,000 to $24,999 | 0 (0.0%) | 0 (0.0%) |
| $25,000 to $34,999 | 6 (2.6%) | 7 (35.0%) |
| $35,000 to $49,999 | 16 (7.0%) | 0 (0.0%) |
| $50,000 to $74,999 | 28 (12.3%) | 0 (0.0%) |
| $75,000 to $99,999 | 29 (12.7%) | 0 (0.0%) |
| $100,000 to $149,999 | 28 (12.3%) | 0 (0.0%) |
| $150,000 or more | 107 (46.9%) | 13 (65.0%) |
| Total | 228 (100.0%) | 20 (100.0%) |
Monthly Housing Cost Tiers in Sunset Valley
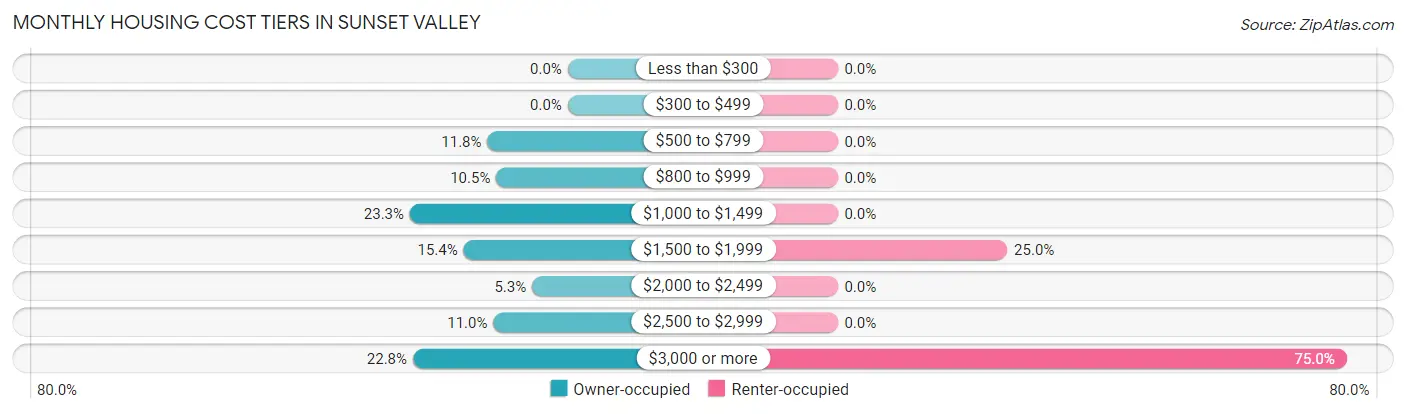
| Monthly Cost | Owner-occupied | Renter-occupied |
| Less than $300 | 0 (0.0%) | 0 (0.0%) |
| $300 to $499 | 0 (0.0%) | 0 (0.0%) |
| $500 to $799 | 27 (11.8%) | 0 (0.0%) |
| $800 to $999 | 24 (10.5%) | 0 (0.0%) |
| $1,000 to $1,499 | 53 (23.3%) | 0 (0.0%) |
| $1,500 to $1,999 | 35 (15.3%) | 5 (25.0%) |
| $2,000 to $2,499 | 12 (5.3%) | 0 (0.0%) |
| $2,500 to $2,999 | 25 (11.0%) | 0 (0.0%) |
| $3,000 or more | 52 (22.8%) | 15 (75.0%) |
| Total | 228 (100.0%) | 20 (100.0%) |
Physical Housing Characteristics in Sunset Valley
Housing Structures in Sunset Valley
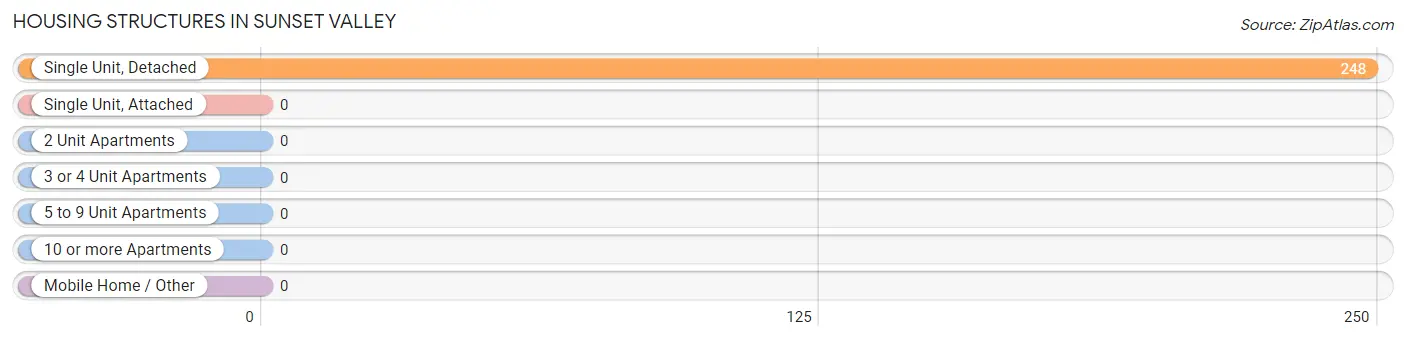
| Structure Type | # Housing Units | % Housing Units |
| Single Unit, Detached | 248 | 100.0% |
| Single Unit, Attached | 0 | 0.0% |
| 2 Unit Apartments | 0 | 0.0% |
| 3 or 4 Unit Apartments | 0 | 0.0% |
| 5 to 9 Unit Apartments | 0 | 0.0% |
| 10 or more Apartments | 0 | 0.0% |
| Mobile Home / Other | 0 | 0.0% |
| Total | 248 | 100.0% |
Housing Structures by Occupancy in Sunset Valley
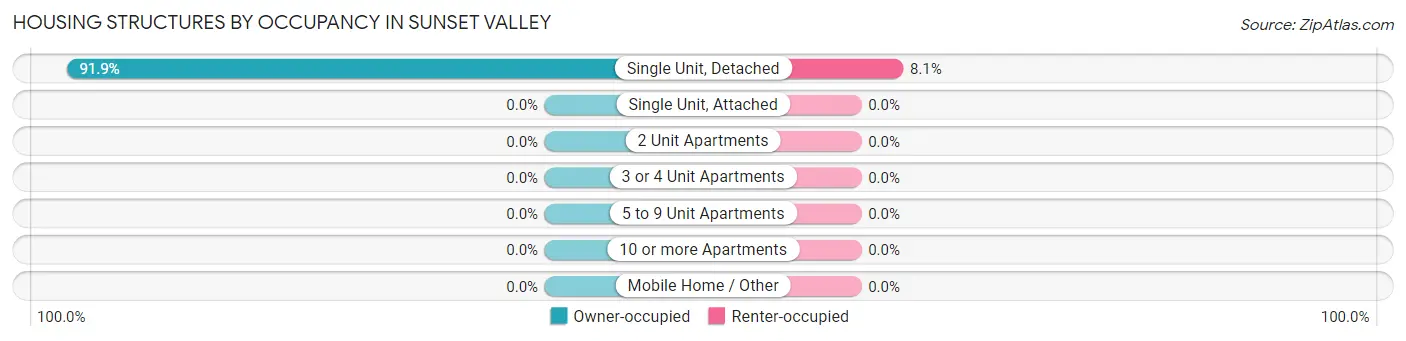
| Structure Type | Owner-occupied | Renter-occupied |
| Single Unit, Detached | 228 (91.9%) | 20 (8.1%) |
| Single Unit, Attached | 0 (0.0%) | 0 (0.0%) |
| 2 Unit Apartments | 0 (0.0%) | 0 (0.0%) |
| 3 or 4 Unit Apartments | 0 (0.0%) | 0 (0.0%) |
| 5 to 9 Unit Apartments | 0 (0.0%) | 0 (0.0%) |
| 10 or more Apartments | 0 (0.0%) | 0 (0.0%) |
| Mobile Home / Other | 0 (0.0%) | 0 (0.0%) |
| Total | 228 (91.9%) | 20 (8.1%) |
Housing Structures by Number of Rooms in Sunset Valley
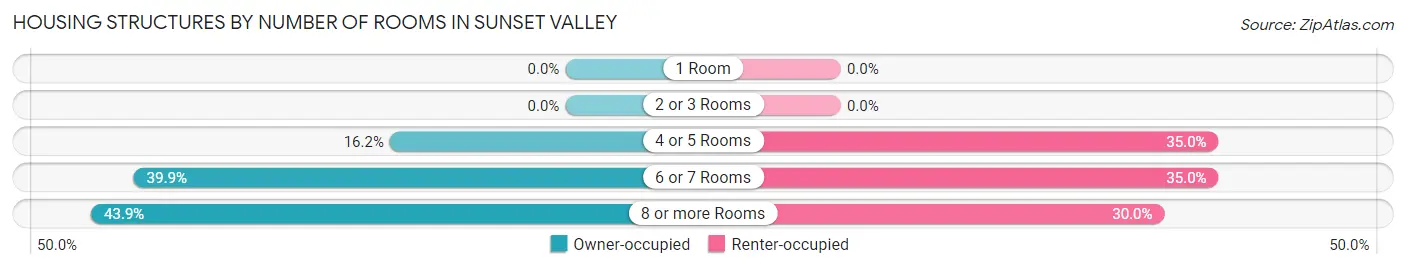
| Number of Rooms | Owner-occupied | Renter-occupied |
| 1 Room | 0 (0.0%) | 0 (0.0%) |
| 2 or 3 Rooms | 0 (0.0%) | 0 (0.0%) |
| 4 or 5 Rooms | 37 (16.2%) | 7 (35.0%) |
| 6 or 7 Rooms | 91 (39.9%) | 7 (35.0%) |
| 8 or more Rooms | 100 (43.9%) | 6 (30.0%) |
| Total | 228 (100.0%) | 20 (100.0%) |
Housing Structure by Heating Type in Sunset Valley
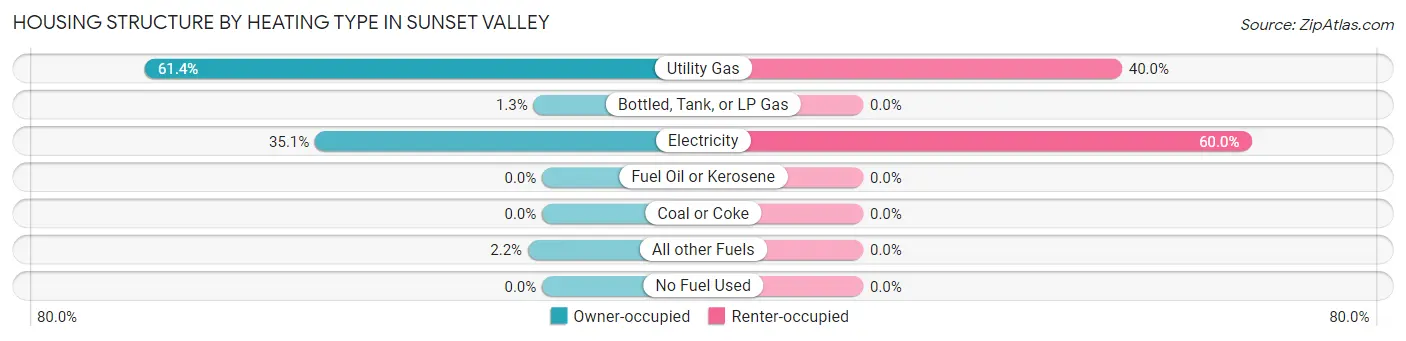
| Heating Type | Owner-occupied | Renter-occupied |
| Utility Gas | 140 (61.4%) | 8 (40.0%) |
| Bottled, Tank, or LP Gas | 3 (1.3%) | 0 (0.0%) |
| Electricity | 80 (35.1%) | 12 (60.0%) |
| Fuel Oil or Kerosene | 0 (0.0%) | 0 (0.0%) |
| Coal or Coke | 0 (0.0%) | 0 (0.0%) |
| All other Fuels | 5 (2.2%) | 0 (0.0%) |
| No Fuel Used | 0 (0.0%) | 0 (0.0%) |
| Total | 228 (100.0%) | 20 (100.0%) |
Household Vehicle Usage in Sunset Valley
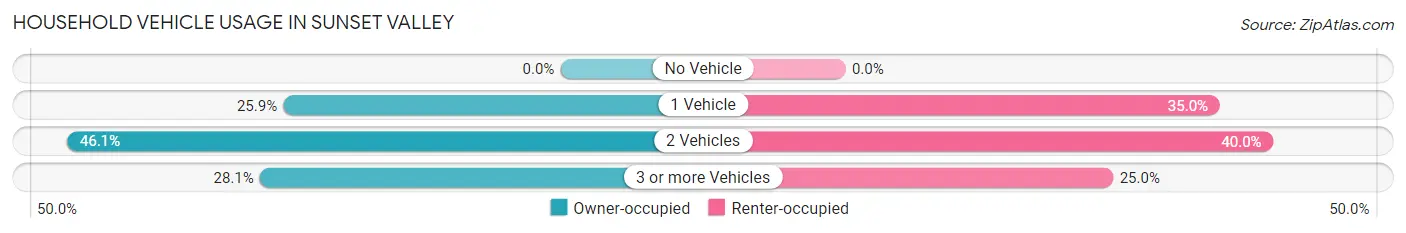
| Vehicles per Household | Owner-occupied | Renter-occupied |
| No Vehicle | 0 (0.0%) | 0 (0.0%) |
| 1 Vehicle | 59 (25.9%) | 7 (35.0%) |
| 2 Vehicles | 105 (46.1%) | 8 (40.0%) |
| 3 or more Vehicles | 64 (28.1%) | 5 (25.0%) |
| Total | 228 (100.0%) | 20 (100.0%) |
Real Estate & Mortgages in Sunset Valley
Real Estate and Mortgage Overview in Sunset Valley
| Characteristic | Without Mortgage | With Mortgage |
| Housing Units | 129 | 99 |
| Median Property Value | $715,000 | $810,900 |
| Median Household Income | $84,250 | $63 |
| Monthly Housing Costs | $1,068 | $52 |
| Real Estate Taxes | $8,317 | $0 |
Property Value by Mortgage Status in Sunset Valley
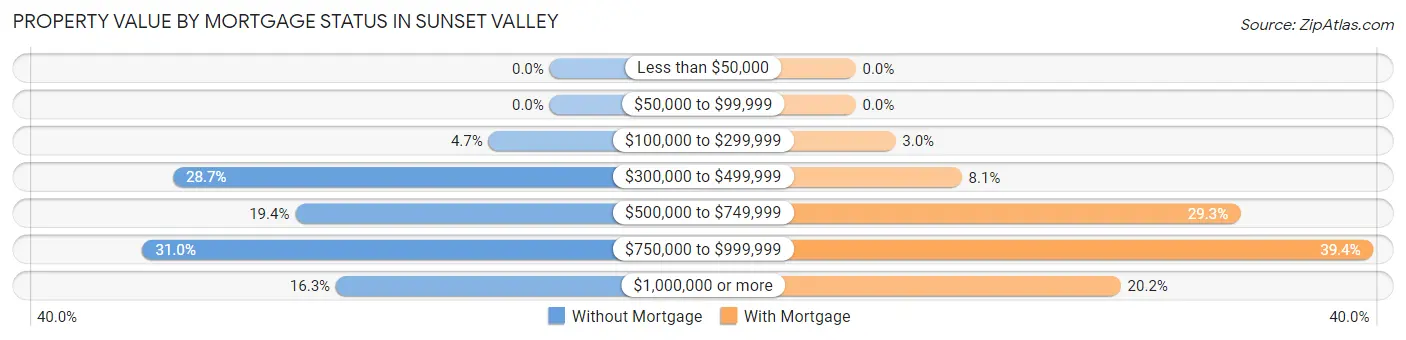
| Property Value | Without Mortgage | With Mortgage |
| Less than $50,000 | 0 (0.0%) | 0 (0.0%) |
| $50,000 to $99,999 | 0 (0.0%) | 0 (0.0%) |
| $100,000 to $299,999 | 6 (4.6%) | 3 (3.0%) |
| $300,000 to $499,999 | 37 (28.7%) | 8 (8.1%) |
| $500,000 to $749,999 | 25 (19.4%) | 29 (29.3%) |
| $750,000 to $999,999 | 40 (31.0%) | 39 (39.4%) |
| $1,000,000 or more | 21 (16.3%) | 20 (20.2%) |
| Total | 129 (100.0%) | 99 (100.0%) |
Household Income by Mortgage Status in Sunset Valley
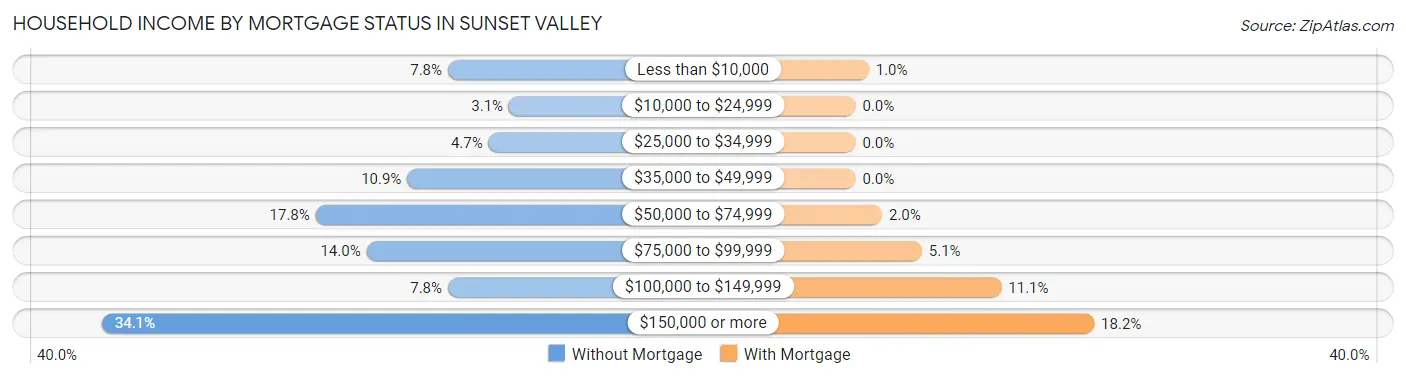
| Household Income | Without Mortgage | With Mortgage |
| Less than $10,000 | 10 (7.7%) | 1 (1.0%) |
| $10,000 to $24,999 | 4 (3.1%) | 0 (0.0%) |
| $25,000 to $34,999 | 6 (4.6%) | 0 (0.0%) |
| $35,000 to $49,999 | 14 (10.8%) | 0 (0.0%) |
| $50,000 to $74,999 | 23 (17.8%) | 2 (2.0%) |
| $75,000 to $99,999 | 18 (14.0%) | 5 (5.1%) |
| $100,000 to $149,999 | 10 (7.7%) | 11 (11.1%) |
| $150,000 or more | 44 (34.1%) | 18 (18.2%) |
| Total | 129 (100.0%) | 99 (100.0%) |
Property Value to Household Income Ratio in Sunset Valley
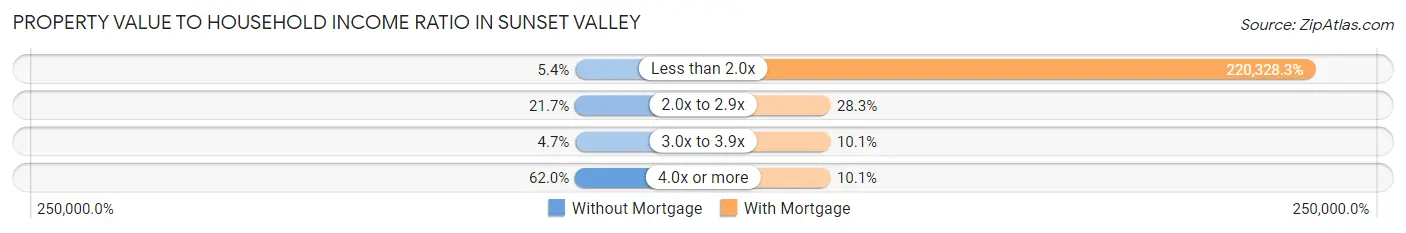
| Value-to-Income Ratio | Without Mortgage | With Mortgage |
| Less than 2.0x | 7 (5.4%) | 218,125 (220,328.3%) |
| 2.0x to 2.9x | 28 (21.7%) | 28 (28.3%) |
| 3.0x to 3.9x | 6 (4.6%) | 10 (10.1%) |
| 4.0x or more | 80 (62.0%) | 10 (10.1%) |
| Total | 129 (100.0%) | 99 (100.0%) |
Real Estate Taxes by Mortgage Status in Sunset Valley
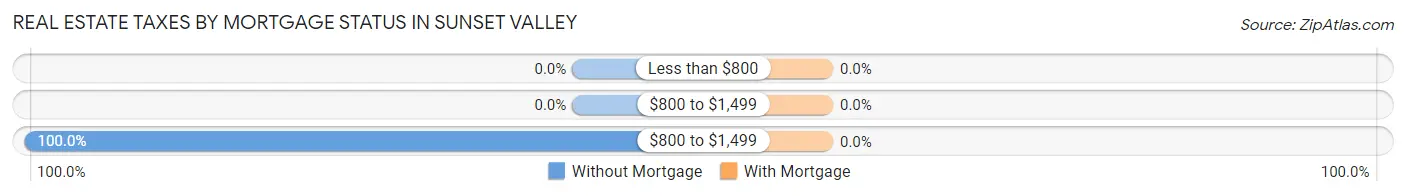
| Property Taxes | Without Mortgage | With Mortgage |
| Less than $800 | 0 (0.0%) | 0 (0.0%) |
| $800 to $1,499 | 0 (0.0%) | 0 (0.0%) |
| $800 to $1,499 | 129 (100.0%) | 0 (0.0%) |
| Total | 129 (100.0%) | 99 (100.0%) |
Health & Disability in Sunset Valley
Health Insurance Coverage by Age in Sunset Valley
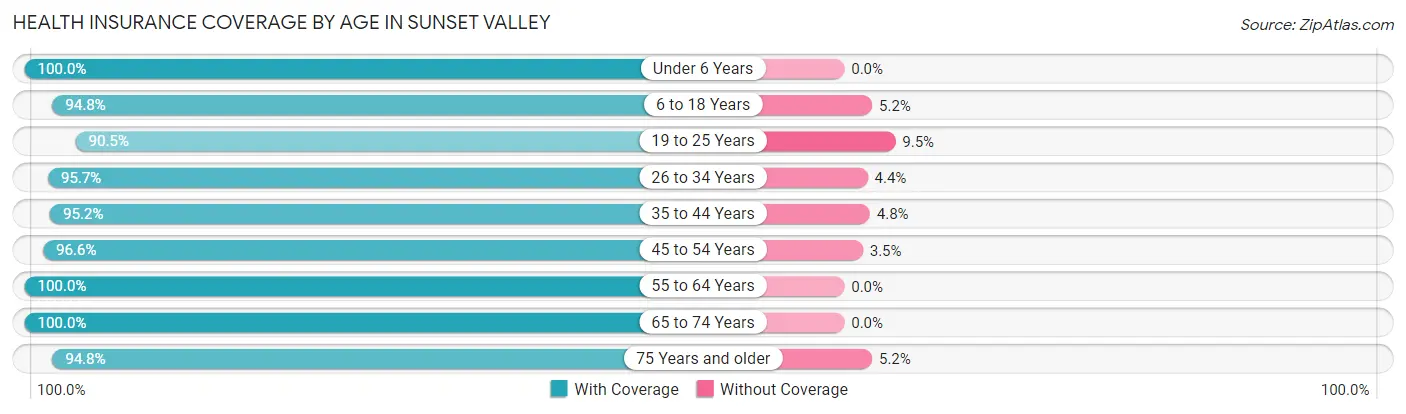
| Age Bracket | With Coverage | Without Coverage |
| Under 6 Years | 24 (100.0%) | 0 (0.0%) |
| 6 to 18 Years | 73 (94.8%) | 4 (5.2%) |
| 19 to 25 Years | 19 (90.5%) | 2 (9.5%) |
| 26 to 34 Years | 22 (95.7%) | 1 (4.3%) |
| 35 to 44 Years | 40 (95.2%) | 2 (4.8%) |
| 45 to 54 Years | 84 (96.6%) | 3 (3.5%) |
| 55 to 64 Years | 90 (100.0%) | 0 (0.0%) |
| 65 to 74 Years | 138 (100.0%) | 0 (0.0%) |
| 75 Years and older | 55 (94.8%) | 3 (5.2%) |
| Total | 545 (97.3%) | 15 (2.7%) |
Health Insurance Coverage by Citizenship Status in Sunset Valley
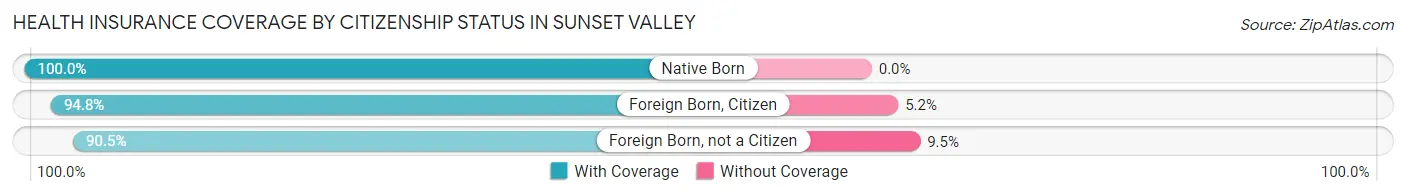
| Citizenship Status | With Coverage | Without Coverage |
| Native Born | 24 (100.0%) | 0 (0.0%) |
| Foreign Born, Citizen | 73 (94.8%) | 4 (5.2%) |
| Foreign Born, not a Citizen | 19 (90.5%) | 2 (9.5%) |
Health Insurance Coverage by Household Income in Sunset Valley
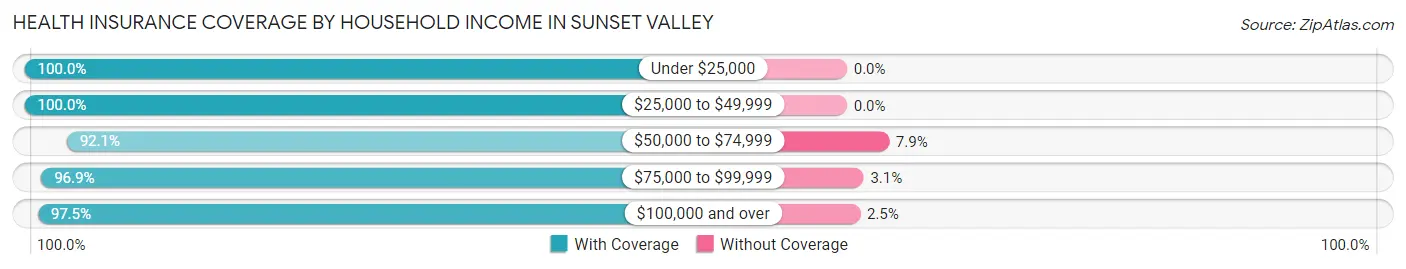
| Household Income | With Coverage | Without Coverage |
| Under $25,000 | 14 (100.0%) | 0 (0.0%) |
| $25,000 to $49,999 | 41 (100.0%) | 0 (0.0%) |
| $50,000 to $74,999 | 35 (92.1%) | 3 (7.9%) |
| $75,000 to $99,999 | 62 (96.9%) | 2 (3.1%) |
| $100,000 and over | 393 (97.5%) | 10 (2.5%) |
Public vs Private Health Insurance Coverage by Age in Sunset Valley
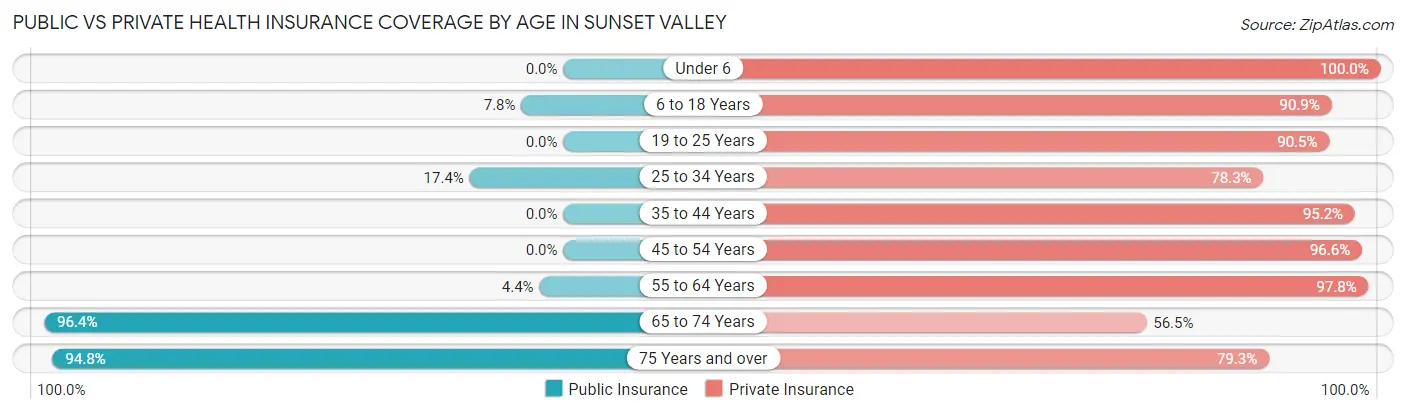
| Age Bracket | Public Insurance | Private Insurance |
| Under 6 | 0 (0.0%) | 24 (100.0%) |
| 6 to 18 Years | 6 (7.8%) | 70 (90.9%) |
| 19 to 25 Years | 0 (0.0%) | 19 (90.5%) |
| 25 to 34 Years | 4 (17.4%) | 18 (78.3%) |
| 35 to 44 Years | 0 (0.0%) | 40 (95.2%) |
| 45 to 54 Years | 0 (0.0%) | 84 (96.6%) |
| 55 to 64 Years | 4 (4.4%) | 88 (97.8%) |
| 65 to 74 Years | 133 (96.4%) | 78 (56.5%) |
| 75 Years and over | 55 (94.8%) | 46 (79.3%) |
| Total | 202 (36.1%) | 467 (83.4%) |
Disability Status by Sex by Age in Sunset Valley
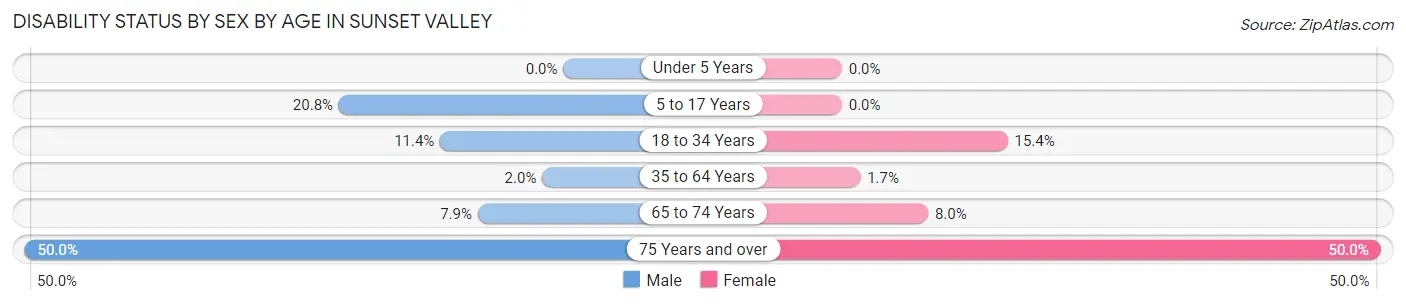
| Age Bracket | Male | Female |
| Under 5 Years | 0 (0.0%) | 0 (0.0%) |
| 5 to 17 Years | 10 (20.8%) | 0 (0.0%) |
| 18 to 34 Years | 4 (11.4%) | 2 (15.4%) |
| 35 to 64 Years | 2 (2.0%) | 2 (1.7%) |
| 65 to 74 Years | 5 (7.9%) | 6 (8.0%) |
| 75 Years and over | 13 (50.0%) | 16 (50.0%) |
Disability Class by Sex by Age in Sunset Valley
Disability Class: Hearing Difficulty
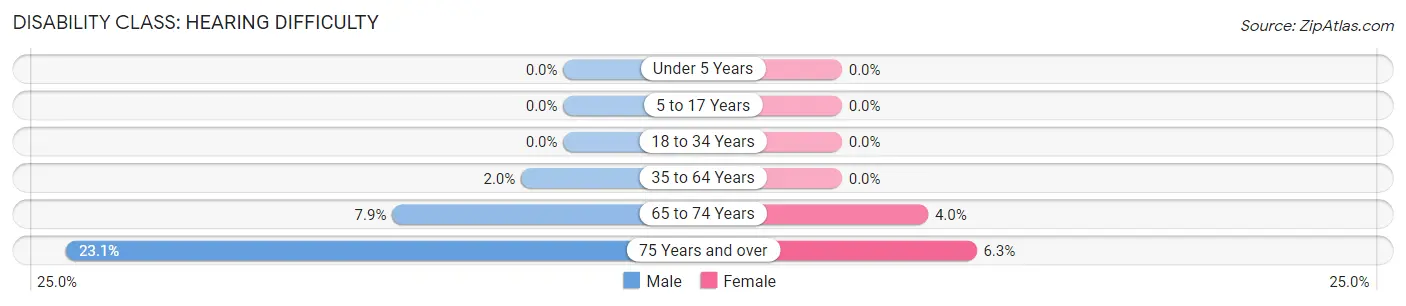
| Age Bracket | Male | Female |
| Under 5 Years | 0 (0.0%) | 0 (0.0%) |
| 5 to 17 Years | 0 (0.0%) | 0 (0.0%) |
| 18 to 34 Years | 0 (0.0%) | 0 (0.0%) |
| 35 to 64 Years | 2 (2.0%) | 0 (0.0%) |
| 65 to 74 Years | 5 (7.9%) | 3 (4.0%) |
| 75 Years and over | 6 (23.1%) | 2 (6.2%) |
Disability Class: Vision Difficulty
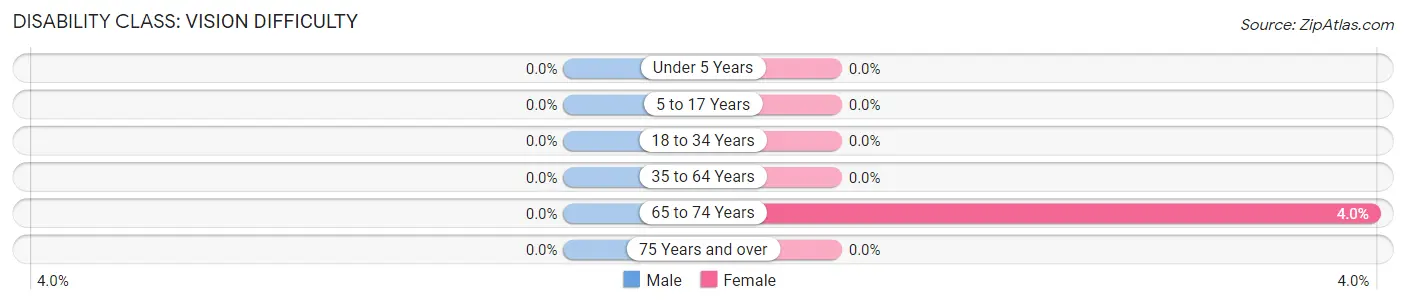
| Age Bracket | Male | Female |
| Under 5 Years | 0 (0.0%) | 0 (0.0%) |
| 5 to 17 Years | 0 (0.0%) | 0 (0.0%) |
| 18 to 34 Years | 0 (0.0%) | 0 (0.0%) |
| 35 to 64 Years | 0 (0.0%) | 0 (0.0%) |
| 65 to 74 Years | 0 (0.0%) | 3 (4.0%) |
| 75 Years and over | 0 (0.0%) | 0 (0.0%) |
Disability Class: Cognitive Difficulty
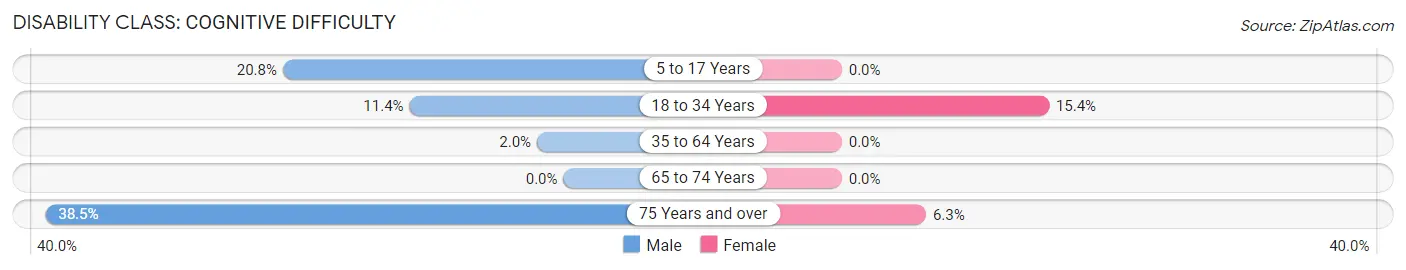
| Age Bracket | Male | Female |
| 5 to 17 Years | 10 (20.8%) | 0 (0.0%) |
| 18 to 34 Years | 4 (11.4%) | 2 (15.4%) |
| 35 to 64 Years | 2 (2.0%) | 0 (0.0%) |
| 65 to 74 Years | 0 (0.0%) | 0 (0.0%) |
| 75 Years and over | 10 (38.5%) | 2 (6.2%) |
Disability Class: Ambulatory Difficulty
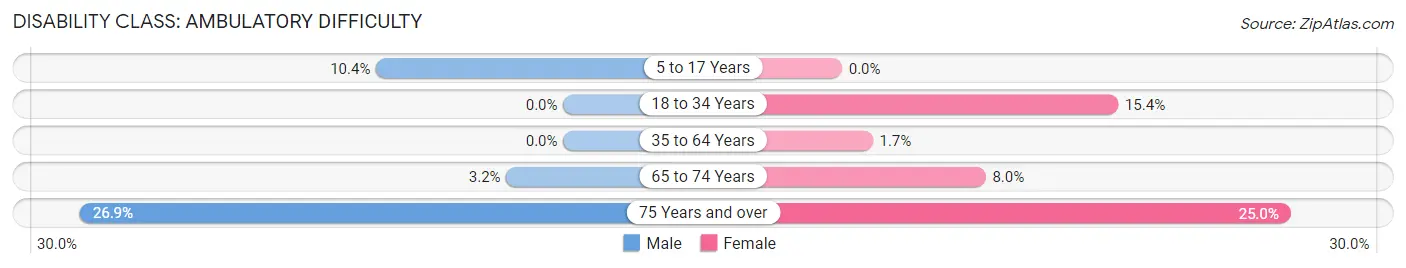
| Age Bracket | Male | Female |
| 5 to 17 Years | 5 (10.4%) | 0 (0.0%) |
| 18 to 34 Years | 0 (0.0%) | 2 (15.4%) |
| 35 to 64 Years | 0 (0.0%) | 2 (1.7%) |
| 65 to 74 Years | 2 (3.2%) | 6 (8.0%) |
| 75 Years and over | 7 (26.9%) | 8 (25.0%) |
Disability Class: Self-Care Difficulty
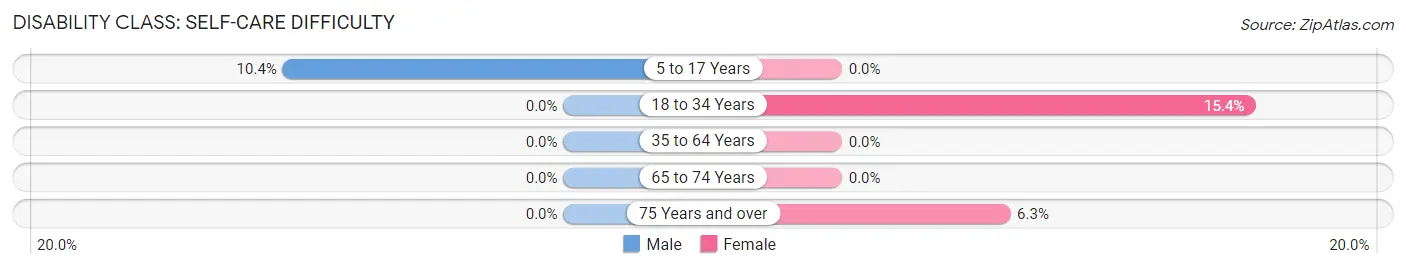
| Age Bracket | Male | Female |
| 5 to 17 Years | 5 (10.4%) | 0 (0.0%) |
| 18 to 34 Years | 0 (0.0%) | 2 (15.4%) |
| 35 to 64 Years | 0 (0.0%) | 0 (0.0%) |
| 65 to 74 Years | 0 (0.0%) | 0 (0.0%) |
| 75 Years and over | 0 (0.0%) | 2 (6.2%) |
Technology Access in Sunset Valley
Computing Device Access in Sunset Valley
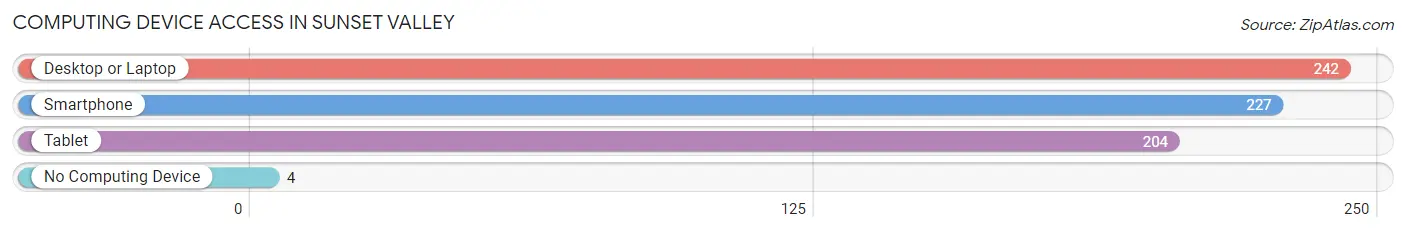
| Device Type | # Households | % Households |
| Desktop or Laptop | 242 | 97.6% |
| Smartphone | 227 | 91.5% |
| Tablet | 204 | 82.3% |
| No Computing Device | 4 | 1.6% |
| Total | 248 | 100.0% |
Internet Access in Sunset Valley
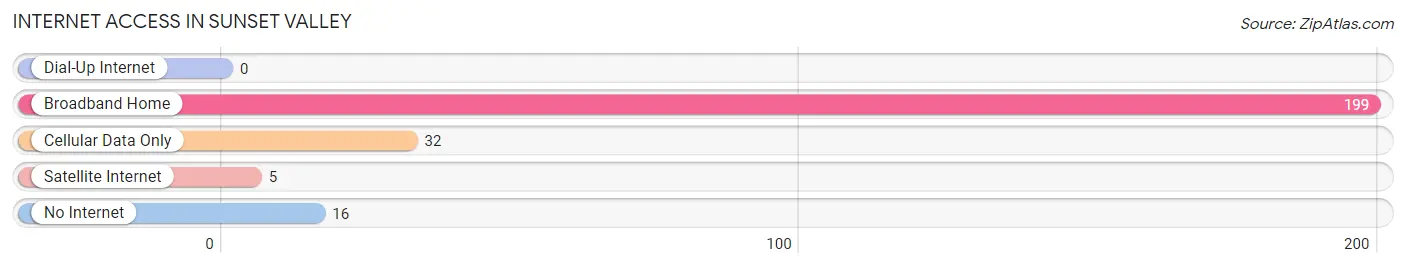
| Internet Type | # Households | % Households |
| Dial-Up Internet | 0 | 0.0% |
| Broadband Home | 199 | 80.2% |
| Cellular Data Only | 32 | 12.9% |
| Satellite Internet | 5 | 2.0% |
| No Internet | 16 | 6.5% |
| Total | 248 | 100.0% |
Sunset Valley Summary
Sunset Valley, Texas is a small city located in Travis County, Texas, United States. It is a suburb of Austin, the state capital, and is part of the Greater Austin metropolitan area. The city was incorporated in 1953 and has a population of approximately 7,000 people.
History
Sunset Valley was originally part of the Spanish land grant of 1808, which was later divided into the Austin Colony in 1821. The area was settled by German immigrants in the mid-1800s, and the city was officially incorporated in 1953. The city was named after the nearby Sunset Valley, which was a popular destination for picnics and other outdoor activities.
Geography
Sunset Valley is located in Travis County, Texas, and is situated in the Hill Country region of Central Texas. The city is located approximately 15 miles south of downtown Austin and is bordered by the cities of Austin, Buda, and Dripping Springs. The city covers an area of approximately 4.5 square miles and has an elevation of 830 feet.
The city is located in the Edwards Plateau, which is characterized by rolling hills and limestone outcroppings. The terrain is mostly flat, with some areas of rolling hills. The climate is generally mild, with hot summers and mild winters.
Economy
Sunset Valley is a small city with a diverse economy. The city is home to a variety of businesses, including retail stores, restaurants, and professional services. The city is also home to several technology companies, including Dell, IBM, and Apple.
The city is also home to several educational institutions, including the University of Texas at Austin, Austin Community College, and St. Edward's University. The city is also home to several medical facilities, including Seton Medical Center and St. David's Medical Center.
Demographics
As of the 2010 census, the population of Sunset Valley was 7,003. The racial makeup of the city was 79.3% White, 8.2% African American, 0.3% Native American, 5.2% Asian, 0.1% Pacific Islander, 4.3% from other races, and 2.6% from two or more races. Hispanic or Latino of any race were 15.2% of the population.
The median income for a household in the city was $60,945, and the median income for a family was $71,945. The per capita income for the city was $30,945. About 8.2% of families and 10.3% of the population were below the poverty line, including 14.2% of those under age 18 and 6.2% of those age 65 or over.
Sunset Valley is a small city with a diverse population and economy. The city is home to a variety of businesses, educational institutions, and medical facilities. The city is also home to a variety of cultural and recreational activities, making it an attractive place to live and work.
Common Questions
What is Per Capita Income in Sunset Valley?
Per Capita income in Sunset Valley is $91,349.
What is the Median Family Income in Sunset Valley?
Median Family Income in Sunset Valley is $173,125.
What is the Median Household income in Sunset Valley?
Median Household Income in Sunset Valley is $141,250.
What is Income or Wage Gap in Sunset Valley?
Income or Wage Gap in Sunset Valley is 40.5%.
Women in Sunset Valley earn 59.5 cents for every dollar earned by a man.
What is Inequality or Gini Index in Sunset Valley?
Inequality or Gini Index in Sunset Valley is 0.51.
What is the Total Population of Sunset Valley?
Total Population of Sunset Valley is 562.
What is the Total Male Population of Sunset Valley?
Total Male Population of Sunset Valley is 289.
What is the Total Female Population of Sunset Valley?
Total Female Population of Sunset Valley is 273.
What is the Ratio of Males per 100 Females in Sunset Valley?
There are 105.86 Males per 100 Females in Sunset Valley.
What is the Ratio of Females per 100 Males in Sunset Valley?
There are 94.46 Females per 100 Males in Sunset Valley.
What is the Median Population Age in Sunset Valley?
Median Population Age in Sunset Valley is 55.6 Years.
What is the Average Family Size in Sunset Valley
Average Family Size in Sunset Valley is 2.7 People.
What is the Average Household Size in Sunset Valley
Average Household Size in Sunset Valley is 2.3 People.
How Large is the Labor Force in Sunset Valley?
There are 255 People in the Labor Forcein in Sunset Valley.
What is the Percentage of People in the Labor Force in Sunset Valley?
53.8% of People are in the Labor Force in Sunset Valley.
What is the Unemployment Rate in Sunset Valley?
Unemployment Rate in Sunset Valley is 2.0%.