Somers, WI Map & Demographics
Somers Map
Somers Overview
$42,057
PER CAPITA INCOME
$101,031
AVG FAMILY INCOME
$70,375
AVG HOUSEHOLD INCOME
21.8%
WAGE / INCOME GAP [ % ]
78.2¢/ $1
WAGE / INCOME GAP [ $ ]
0.49
INEQUALITY / GINI INDEX
8,303
TOTAL POPULATION
4,082
MALE POPULATION
4,221
FEMALE POPULATION
96.71
MALES / 100 FEMALES
103.41
FEMALES / 100 MALES
35.7
MEDIAN AGE
3.0
AVG FAMILY SIZE
2.3
AVG HOUSEHOLD SIZE
4,376
LABOR FORCE [ PEOPLE ]
64.1%
PERCENT IN LABOR FORCE
9.9%
UNEMPLOYMENT RATE
Somers Area Codes
Income in Somers
Income Overview in Somers
Per Capita Income in Somers is $42,057, while median incomes of families and households are $101,031 and $70,375 respectively.
| Characteristic | Number | Measure |
| Per Capita Income | 8,303 | $42,057 |
| Median Family Income | 1,997 | $101,031 |
| Mean Family Income | 1,997 | $137,223 |
| Median Household Income | 3,333 | $70,375 |
| Mean Household Income | 3,333 | $102,747 |
| Income Deficit | 1,997 | $0 |
| Wage / Income Gap (%) | 8,303 | 21.80% |
| Wage / Income Gap ($) | 8,303 | 78.20¢ per $1 |
| Gini / Inequality Index | 8,303 | 0.49 |
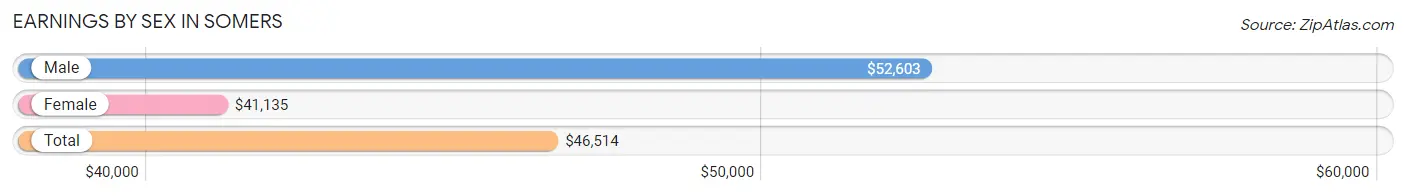
Earnings by Sex in Somers
Average Earnings in Somers are $46,514, $52,603 for men and $41,135 for women, a difference of 21.8%.
| Sex | Number | Average Earnings |
| Male | 2,257 (48.3%) | $52,603 |
| Female | 2,417 (51.7%) | $41,135 |
| Total | 4,674 (100.0%) | $46,514 |
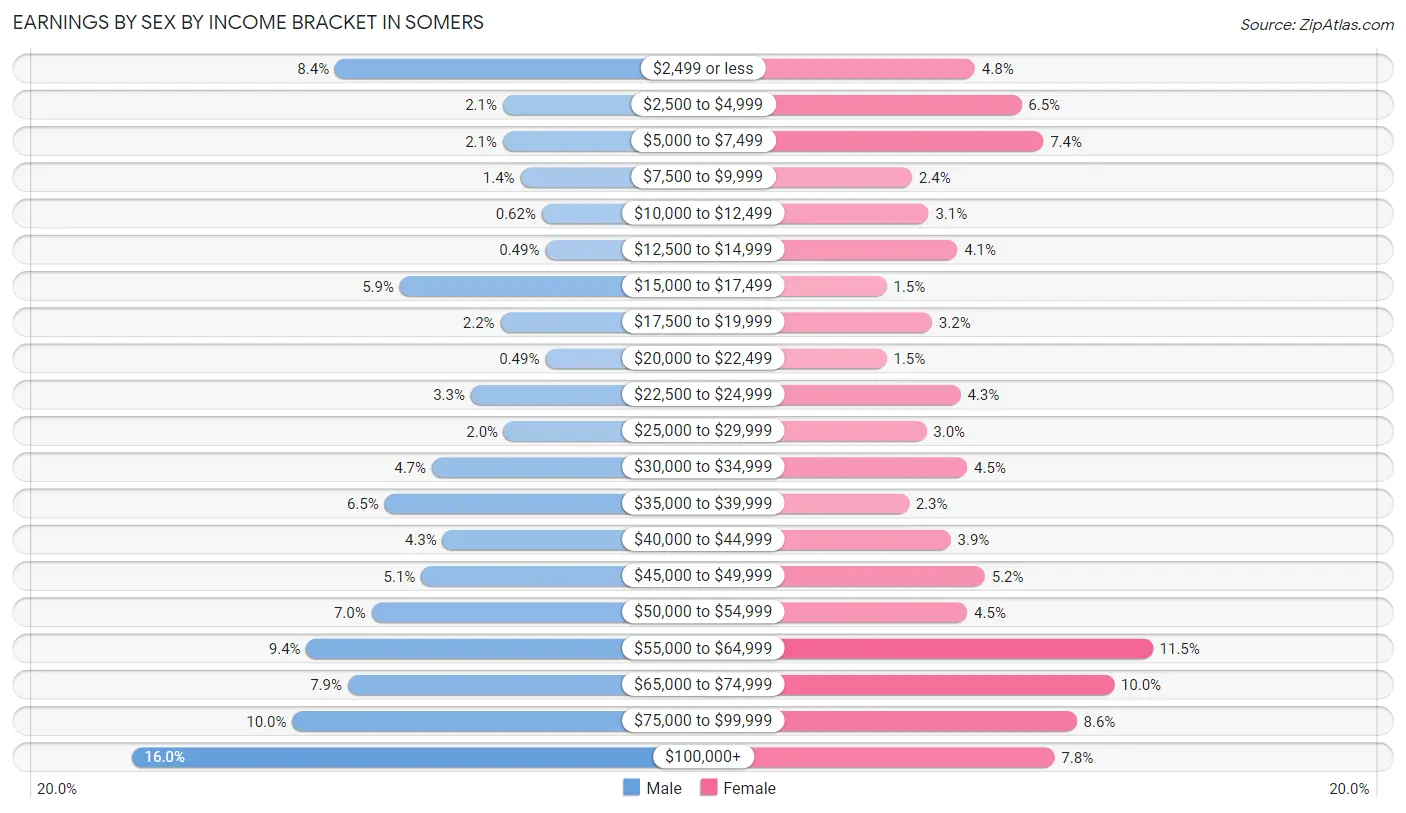
Earnings by Sex by Income Bracket in Somers
The most common earnings brackets in Somers are $100,000+ for men (361 | 16.0%) and $55,000 to $64,999 for women (277 | 11.5%).
| Income | Male | Female |
| $2,499 or less | 189 (8.4%) | 116 (4.8%) |
| $2,500 to $4,999 | 47 (2.1%) | 158 (6.5%) |
| $5,000 to $7,499 | 47 (2.1%) | 178 (7.4%) |
| $7,500 to $9,999 | 32 (1.4%) | 59 (2.4%) |
| $10,000 to $12,499 | 14 (0.6%) | 74 (3.1%) |
| $12,500 to $14,999 | 11 (0.5%) | 100 (4.1%) |
| $15,000 to $17,499 | 134 (5.9%) | 36 (1.5%) |
| $17,500 to $19,999 | 49 (2.2%) | 77 (3.2%) |
| $20,000 to $22,499 | 11 (0.5%) | 36 (1.5%) |
| $22,500 to $24,999 | 74 (3.3%) | 103 (4.3%) |
| $25,000 to $29,999 | 46 (2.0%) | 72 (3.0%) |
| $30,000 to $34,999 | 107 (4.7%) | 109 (4.5%) |
| $35,000 to $39,999 | 147 (6.5%) | 56 (2.3%) |
| $40,000 to $44,999 | 98 (4.3%) | 94 (3.9%) |
| $45,000 to $49,999 | 116 (5.1%) | 125 (5.2%) |
| $50,000 to $54,999 | 158 (7.0%) | 109 (4.5%) |
| $55,000 to $64,999 | 213 (9.4%) | 277 (11.5%) |
| $65,000 to $74,999 | 178 (7.9%) | 242 (10.0%) |
| $75,000 to $99,999 | 225 (10.0%) | 208 (8.6%) |
| $100,000+ | 361 (16.0%) | 188 (7.8%) |
| Total | 2,257 (100.0%) | 2,417 (100.0%) |
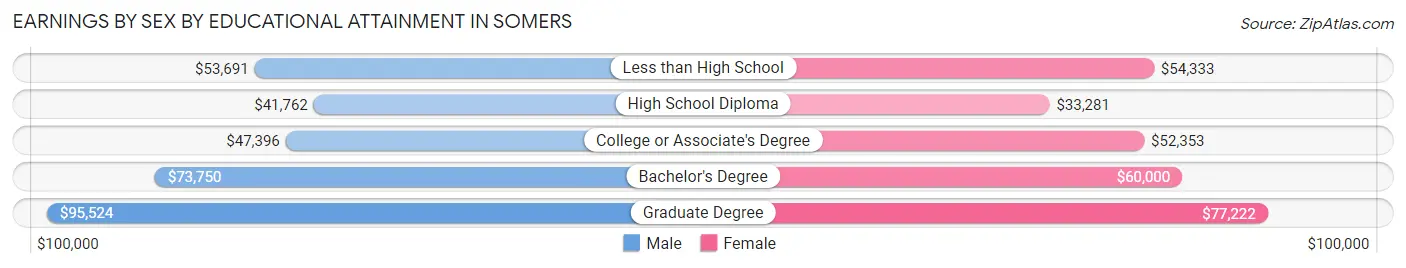
Earnings by Sex by Educational Attainment in Somers
Average earnings in Somers are $59,181 for men and $57,146 for women, a difference of 3.4%. Men with an educational attainment of graduate degree enjoy the highest average annual earnings of $95,524, while those with high school diploma education earn the least with $41,762. Women with an educational attainment of graduate degree earn the most with the average annual earnings of $77,222, while those with high school diploma education have the smallest earnings of $33,281.
| Educational Attainment | Male Income | Female Income |
| Less than High School | $53,691 | $54,333 |
| High School Diploma | $41,762 | $33,281 |
| College or Associate's Degree | $47,396 | $52,353 |
| Bachelor's Degree | $73,750 | $60,000 |
| Graduate Degree | $95,524 | $77,222 |
| Total | $59,181 | $57,146 |
Family Income in Somers
Family Income Brackets in Somers
According to the Somers family income data, there are 557 families falling into the $100,000 to $149,999 income range, which is the most common income bracket and makes up 27.9% of all families.
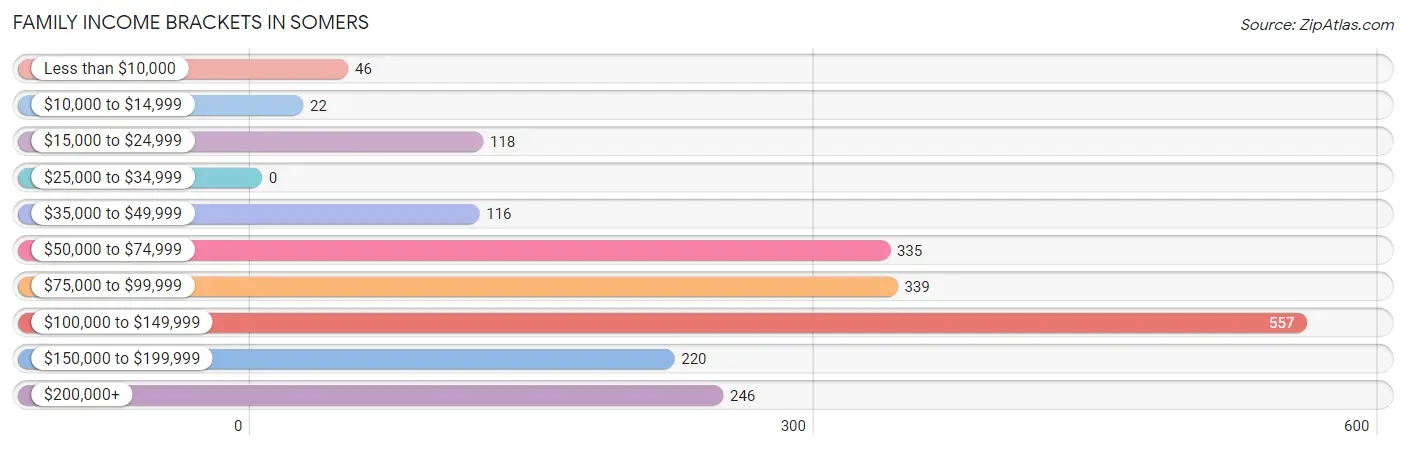
| Income Bracket | # Families | % Families |
| Less than $10,000 | 46 | 2.3% |
| $10,000 to $14,999 | 22 | 1.1% |
| $15,000 to $24,999 | 118 | 5.9% |
| $25,000 to $34,999 | 0 | 0.0% |
| $35,000 to $49,999 | 116 | 5.8% |
| $50,000 to $74,999 | 335 | 16.8% |
| $75,000 to $99,999 | 339 | 17.0% |
| $100,000 to $149,999 | 557 | 27.9% |
| $150,000 to $199,999 | 220 | 11.0% |
| $200,000+ | 246 | 12.3% |
Family Income by Famaliy Size in Somers
4-person families (263 | 13.2%) account for the highest median family income in Somers with $158,839 per family, while 2-person families (1,055 | 52.8%) have the highest median income of $42,220 per family member.
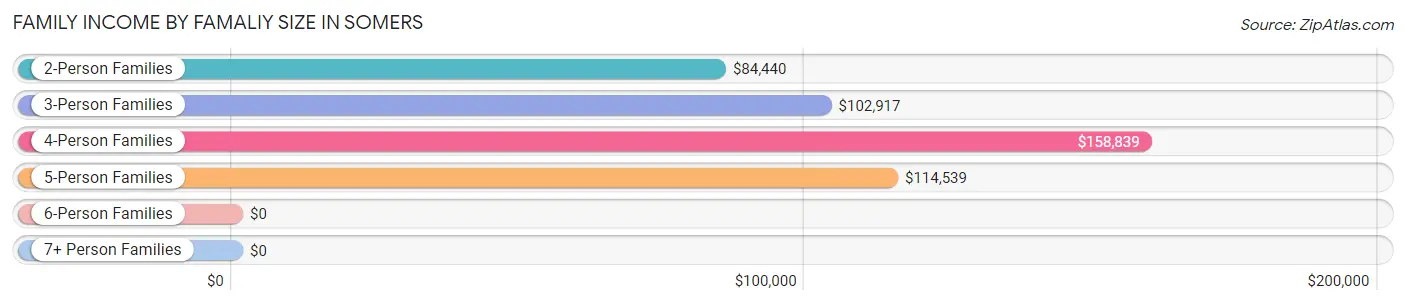
| Income Bracket | # Families | Median Income |
| 2-Person Families | 1,055 (52.8%) | $84,440 |
| 3-Person Families | 387 (19.4%) | $102,917 |
| 4-Person Families | 263 (13.2%) | $158,839 |
| 5-Person Families | 191 (9.6%) | $114,539 |
| 6-Person Families | 80 (4.0%) | $0 |
| 7+ Person Families | 21 (1.1%) | $0 |
| Total | 1,997 (100.0%) | $101,031 |
Family Income by Number of Earners in Somers
The median family income in Somers is $101,031, with families comprising 3+ earners (265) having the highest median family income of $137,850, while families with no earners (272) have the lowest median family income of $59,655, accounting for 13.3% and 13.6% of families, respectively.
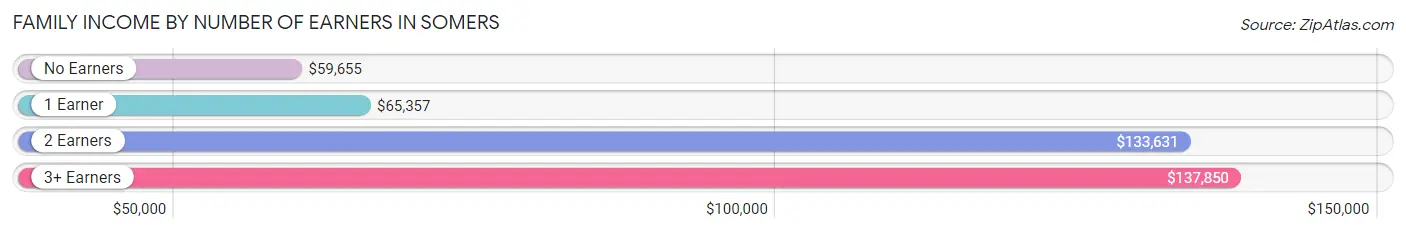
| Number of Earners | # Families | Median Income |
| No Earners | 272 (13.6%) | $59,655 |
| 1 Earner | 702 (35.1%) | $65,357 |
| 2 Earners | 758 (38.0%) | $133,631 |
| 3+ Earners | 265 (13.3%) | $137,850 |
| Total | 1,997 (100.0%) | $101,031 |
Household Income in Somers
Household Income Brackets in Somers
With 680 households falling in the category, the $100,000 to $149,999 income range is the most frequent in Somers, accounting for 20.4% of all households. In contrast, only 153 households (4.6%) fall into the less than $10,000 income bracket, making it the least populous group.
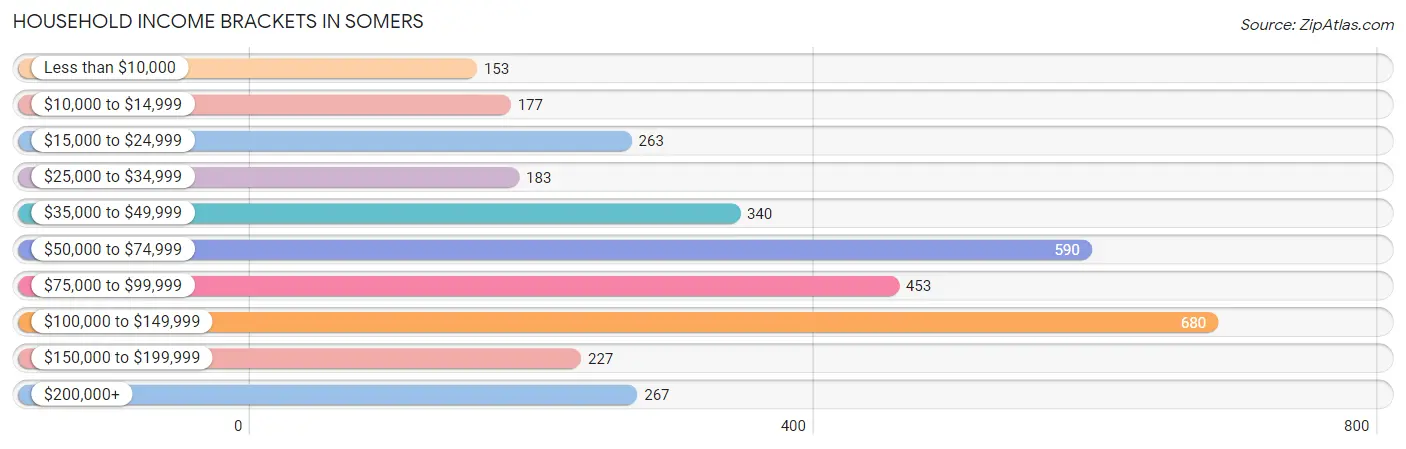
| Income Bracket | # Households | % Households |
| Less than $10,000 | 153 | 4.6% |
| $10,000 to $14,999 | 177 | 5.3% |
| $15,000 to $24,999 | 263 | 7.9% |
| $25,000 to $34,999 | 183 | 5.5% |
| $35,000 to $49,999 | 340 | 10.2% |
| $50,000 to $74,999 | 590 | 17.7% |
| $75,000 to $99,999 | 453 | 13.6% |
| $100,000 to $149,999 | 680 | 20.4% |
| $150,000 to $199,999 | 227 | 6.8% |
| $200,000+ | 267 | 8.0% |
Household Income by Householder Age in Somers
The median household income in Somers is $70,375, with the highest median household income of $101,125 found in the 45 to 64 years age bracket for the primary householder. A total of 1,312 households (39.4%) fall into this category. Meanwhile, the 15 to 24 years age bracket for the primary householder has the lowest median household income of $24,135, with 232 households (7.0%) in this group.
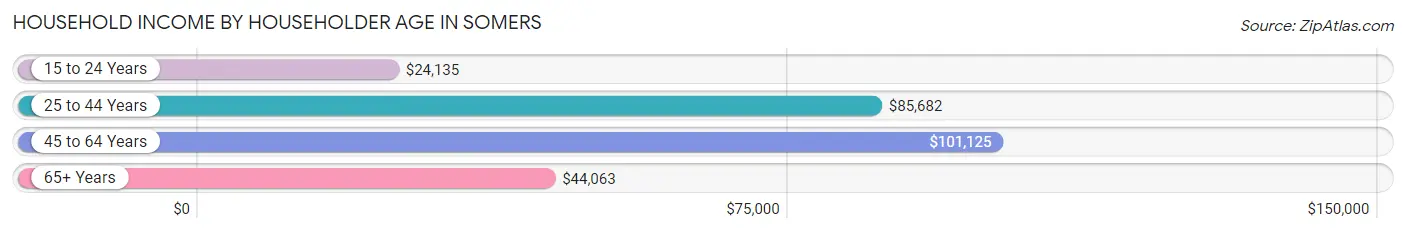
| Income Bracket | # Households | Median Income |
| 15 to 24 Years | 232 (7.0%) | $24,135 |
| 25 to 44 Years | 1,008 (30.2%) | $85,682 |
| 45 to 64 Years | 1,312 (39.4%) | $101,125 |
| 65+ Years | 781 (23.4%) | $44,063 |
| Total | 3,333 (100.0%) | $70,375 |
Poverty in Somers
Income Below Poverty by Sex and Age in Somers
With 5.7% poverty level for males and 13.5% for females among the residents of Somers, 6 to 11 year old males and 18 to 24 year old females are the most vulnerable to poverty, with 55 males (16.4%) and 140 females (22.2%) in their respective age groups living below the poverty level.
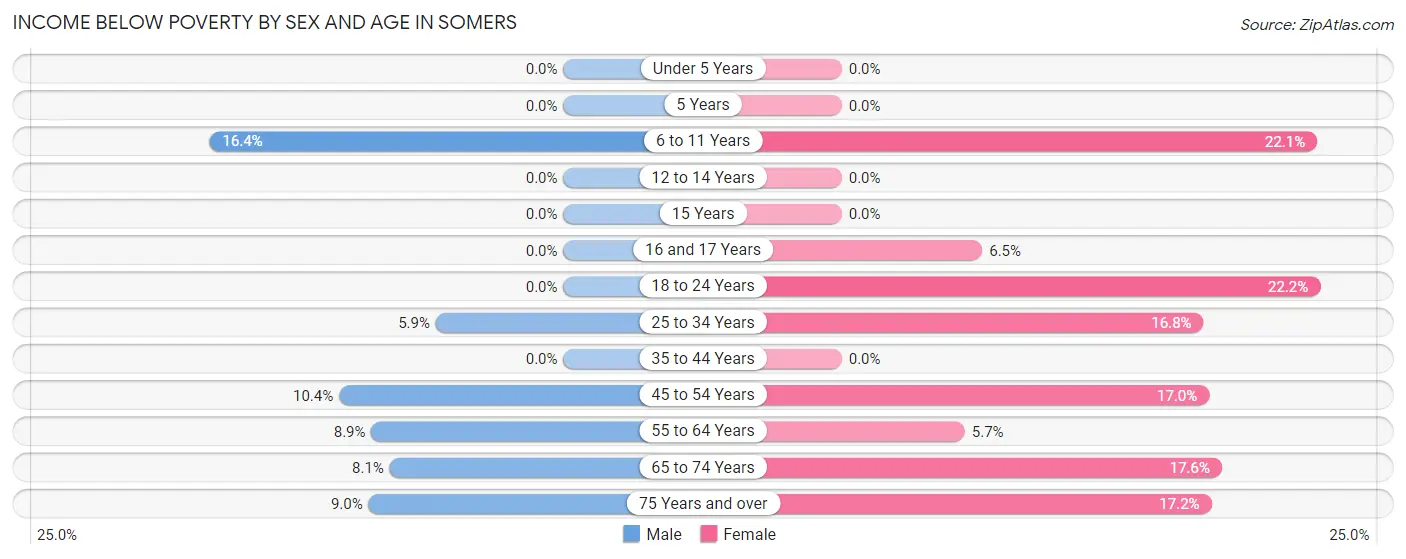
| Age Bracket | Male | Female |
| Under 5 Years | 0 (0.0%) | 0 (0.0%) |
| 5 Years | 0 (0.0%) | 0 (0.0%) |
| 6 to 11 Years | 55 (16.4%) | 56 (22.1%) |
| 12 to 14 Years | 0 (0.0%) | 0 (0.0%) |
| 15 Years | 0 (0.0%) | 0 (0.0%) |
| 16 and 17 Years | 0 (0.0%) | 6 (6.5%) |
| 18 to 24 Years | 0 (0.0%) | 140 (22.2%) |
| 25 to 34 Years | 26 (5.9%) | 77 (16.8%) |
| 35 to 44 Years | 0 (0.0%) | 0 (0.0%) |
| 45 to 54 Years | 46 (10.4%) | 83 (17.0%) |
| 55 to 64 Years | 55 (8.9%) | 36 (5.7%) |
| 65 to 74 Years | 20 (8.1%) | 73 (17.6%) |
| 75 Years and over | 17 (9.0%) | 53 (17.2%) |
| Total | 219 (5.7%) | 524 (13.5%) |
Income Above Poverty by Sex and Age in Somers
According to the poverty statistics in Somers, males aged under 5 years and females aged under 5 years are the age groups that are most secure financially, with 100.0% of males and 100.0% of females in these age groups living above the poverty line.
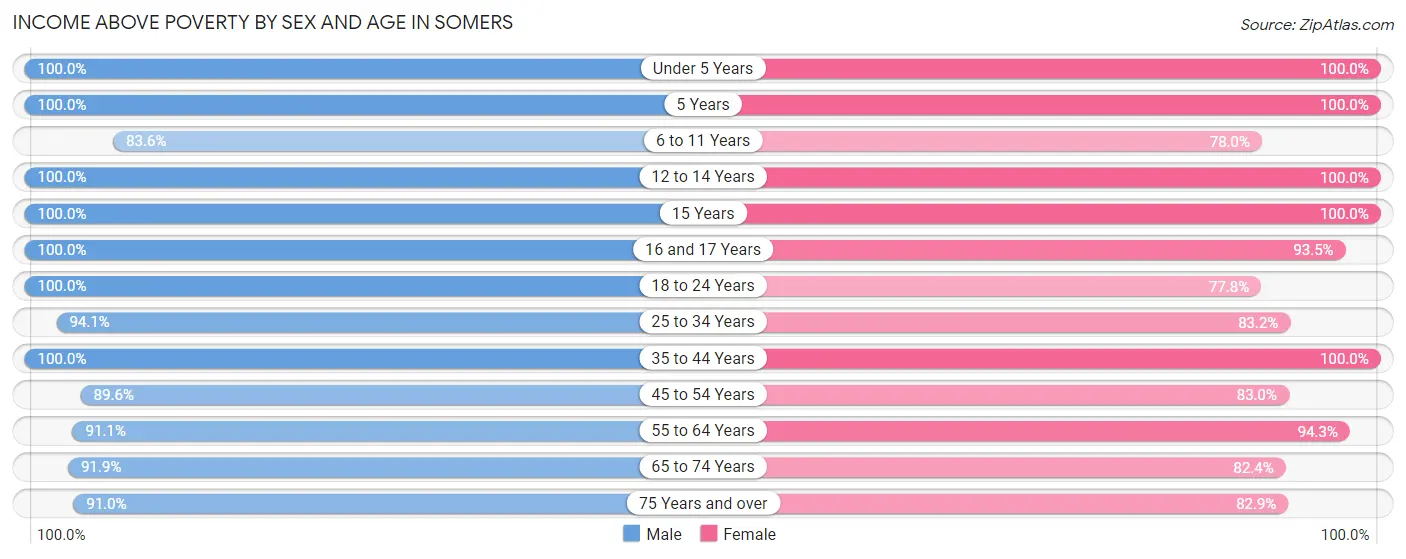
| Age Bracket | Male | Female |
| Under 5 Years | 376 (100.0%) | 21 (100.0%) |
| 5 Years | 24 (100.0%) | 64 (100.0%) |
| 6 to 11 Years | 280 (83.6%) | 198 (77.9%) |
| 12 to 14 Years | 185 (100.0%) | 92 (100.0%) |
| 15 Years | 102 (100.0%) | 14 (100.0%) |
| 16 and 17 Years | 59 (100.0%) | 86 (93.5%) |
| 18 to 24 Years | 311 (100.0%) | 491 (77.8%) |
| 25 to 34 Years | 413 (94.1%) | 382 (83.2%) |
| 35 to 44 Years | 504 (100.0%) | 421 (100.0%) |
| 45 to 54 Years | 396 (89.6%) | 404 (83.0%) |
| 55 to 64 Years | 562 (91.1%) | 594 (94.3%) |
| 65 to 74 Years | 228 (91.9%) | 341 (82.4%) |
| 75 Years and over | 171 (91.0%) | 256 (82.9%) |
| Total | 3,611 (94.3%) | 3,364 (86.5%) |
Income Below Poverty Among Married-Couple Families in Somers
The poverty statistics for married-couple families in Somers show that 1.8% or 28 of the total 1,592 families live below the poverty line. Families with no children have the highest poverty rate of 3.0%, comprising of 28 families. On the other hand, families with 1 or 2 children have the lowest poverty rate of 0.0%, which includes 0 families.
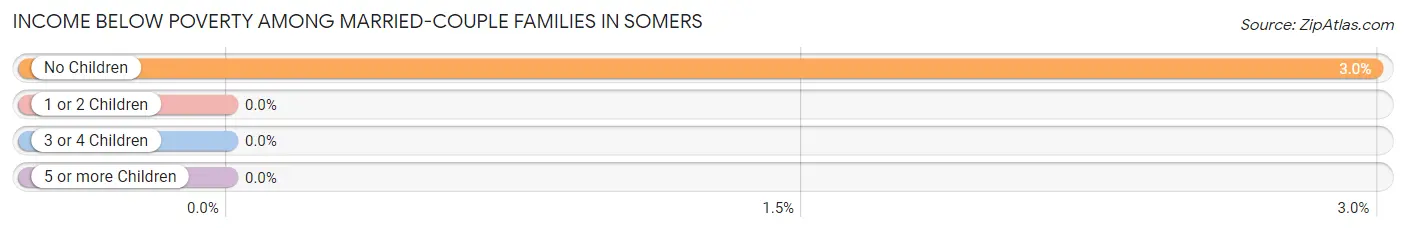
| Children | Above Poverty | Below Poverty |
| No Children | 910 (97.0%) | 28 (3.0%) |
| 1 or 2 Children | 481 (100.0%) | 0 (0.0%) |
| 3 or 4 Children | 152 (100.0%) | 0 (0.0%) |
| 5 or more Children | 21 (100.0%) | 0 (0.0%) |
| Total | 1,564 (98.2%) | 28 (1.8%) |
Income Below Poverty Among Single-Parent Households in Somers
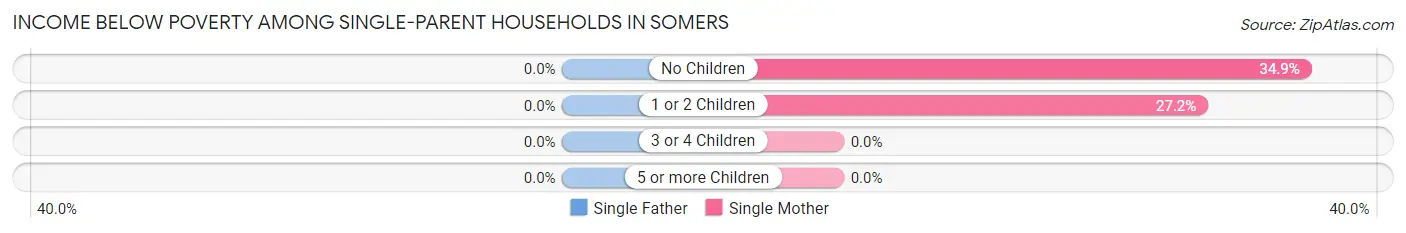
| Children | Single Father | Single Mother |
| No Children | 0 (0.0%) | 38 (34.9%) |
| 1 or 2 Children | 0 (0.0%) | 60 (27.2%) |
| 3 or 4 Children | 0 (0.0%) | 0 (0.0%) |
| 5 or more Children | 0 (0.0%) | 0 (0.0%) |
| Total | 0 (0.0%) | 98 (29.7%) |
Income Below Poverty Among Married-Couple vs Single-Parent Households in Somers
The poverty data for Somers shows that 28 of the married-couple family households (1.8%) and 98 of the single-parent households (24.2%) are living below the poverty level. Within the married-couple family households, those with no children have the highest poverty rate, with 28 households (3.0%) falling below the poverty line. Among the single-parent households, those with no children have the highest poverty rate, with 38 household (27.5%) living below poverty.
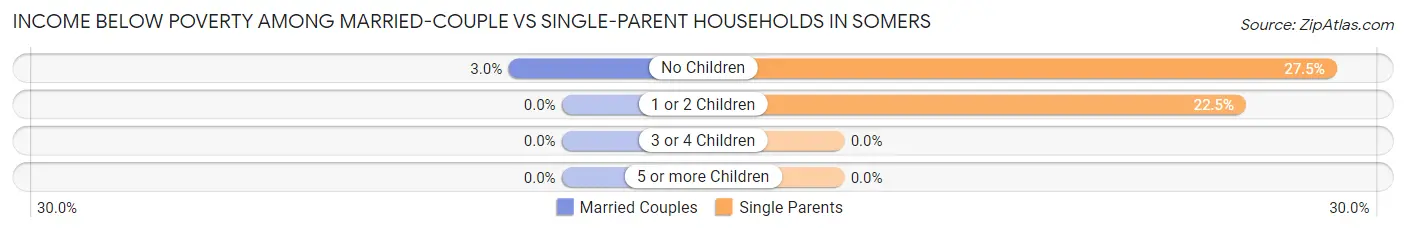
| Children | Married-Couple Families | Single-Parent Households |
| No Children | 28 (3.0%) | 38 (27.5%) |
| 1 or 2 Children | 0 (0.0%) | 60 (22.5%) |
| 3 or 4 Children | 0 (0.0%) | 0 (0.0%) |
| 5 or more Children | 0 (0.0%) | 0 (0.0%) |
| Total | 28 (1.8%) | 98 (24.2%) |
Race in Somers
The most populous races in Somers are White / Caucasian (6,875 | 82.8%), Hispanic or Latino (781 | 9.4%), and Two or more Races (554 | 6.7%).
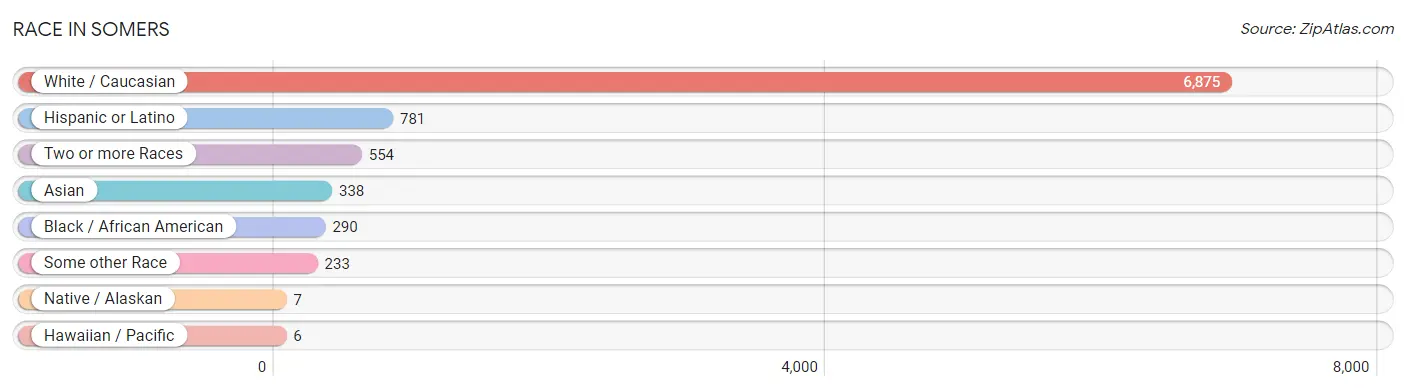
| Race | # Population | % Population |
| Asian | 338 | 4.1% |
| Black / African American | 290 | 3.5% |
| Hawaiian / Pacific | 6 | 0.1% |
| Hispanic or Latino | 781 | 9.4% |
| Native / Alaskan | 7 | 0.1% |
| White / Caucasian | 6,875 | 82.8% |
| Two or more Races | 554 | 6.7% |
| Some other Race | 233 | 2.8% |
| Total | 8,303 | 100.0% |
Ancestry in Somers
The most populous ancestries reported in Somers are German (2,818 | 33.9%), Irish (813 | 9.8%), Italian (801 | 9.7%), English (597 | 7.2%), and Mexican (519 | 6.2%), together accounting for 66.8% of all Somers residents.
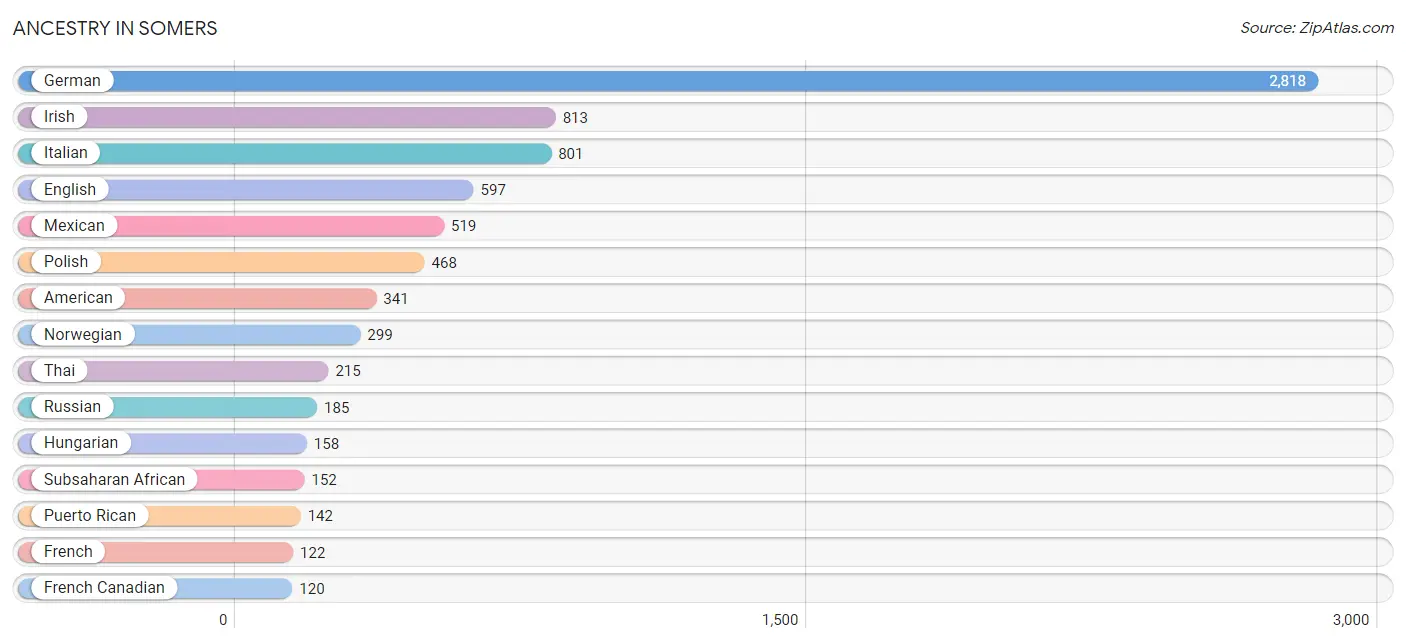
| Ancestry | # Population | % Population |
| African | 118 | 1.4% |
| American | 341 | 4.1% |
| Arab | 100 | 1.2% |
| Armenian | 26 | 0.3% |
| Austrian | 15 | 0.2% |
| Bahamian | 5 | 0.1% |
| Belgian | 18 | 0.2% |
| Bhutanese | 29 | 0.4% |
| British | 14 | 0.2% |
| Burmese | 25 | 0.3% |
| Cherokee | 67 | 0.8% |
| Croatian | 28 | 0.3% |
| Czech | 84 | 1.0% |
| Czechoslovakian | 13 | 0.2% |
| Danish | 107 | 1.3% |
| Dutch | 38 | 0.5% |
| Eastern European | 73 | 0.9% |
| Ecuadorian | 67 | 0.8% |
| English | 597 | 7.2% |
| European | 75 | 0.9% |
| Finnish | 25 | 0.3% |
| French | 122 | 1.5% |
| French Canadian | 120 | 1.5% |
| German | 2,818 | 33.9% |
| Greek | 23 | 0.3% |
| Hungarian | 158 | 1.9% |
| Icelander | 5 | 0.1% |
| Indian (Asian) | 7 | 0.1% |
| Irish | 813 | 9.8% |
| Italian | 801 | 9.7% |
| Jamaican | 11 | 0.1% |
| Korean | 82 | 1.0% |
| Lithuanian | 93 | 1.1% |
| Mexican | 519 | 6.2% |
| Mongolian | 4 | 0.1% |
| Native Hawaiian | 7 | 0.1% |
| Nigerian | 13 | 0.2% |
| Norwegian | 299 | 3.6% |
| Palestinian | 100 | 1.2% |
| Polish | 468 | 5.6% |
| Puerto Rican | 142 | 1.7% |
| Russian | 185 | 2.2% |
| Scandinavian | 99 | 1.2% |
| Scotch-Irish | 101 | 1.2% |
| Scottish | 64 | 0.8% |
| Serbian | 16 | 0.2% |
| Slovak | 42 | 0.5% |
| South American | 67 | 0.8% |
| Spaniard | 39 | 0.5% |
| Sri Lankan | 7 | 0.1% |
| Subsaharan African | 152 | 1.8% |
| Sudanese | 12 | 0.1% |
| Swedish | 96 | 1.2% |
| Swiss | 11 | 0.1% |
| Thai | 215 | 2.6% |
| Ukrainian | 75 | 0.9% |
| Welsh | 38 | 0.5% | View All 57 Rows |
Immigrants in Somers
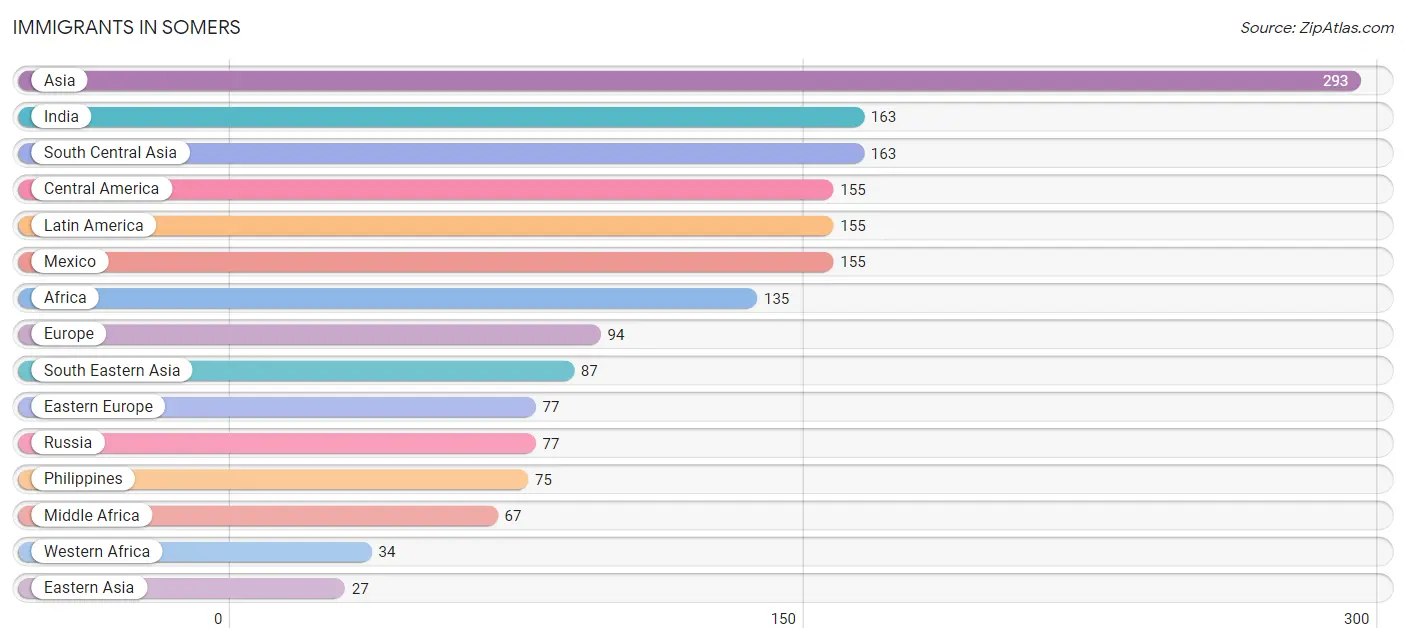
The most numerous immigrant groups reported in Somers came from Asia (293 | 3.5%), India (163 | 2.0%), South Central Asia (163 | 2.0%), Central America (155 | 1.9%), and Latin America (155 | 1.9%), together accounting for 11.2% of all Somers residents.
| Immigration Origin | # Population | % Population |
| Africa | 135 | 1.6% |
| Asia | 293 | 3.5% |
| Central America | 155 | 1.9% |
| Eastern Africa | 22 | 0.3% |
| Eastern Asia | 27 | 0.3% |
| Eastern Europe | 77 | 0.9% |
| Europe | 94 | 1.1% |
| India | 163 | 2.0% |
| Italy | 12 | 0.1% |
| Japan | 18 | 0.2% |
| Kenya | 22 | 0.3% |
| Korea | 9 | 0.1% |
| Latin America | 155 | 1.9% |
| Malaysia | 4 | 0.1% |
| Mexico | 155 | 1.9% |
| Middle Africa | 67 | 0.8% |
| Northern Africa | 12 | 0.1% |
| Northern Europe | 5 | 0.1% |
| Philippines | 75 | 0.9% |
| Russia | 77 | 0.9% |
| South Central Asia | 163 | 2.0% |
| South Eastern Asia | 87 | 1.1% |
| Southern Europe | 12 | 0.1% |
| Sudan | 12 | 0.1% |
| Western Africa | 34 | 0.4% | View All 25 Rows |
Sex and Age in Somers
Sex and Age in Somers
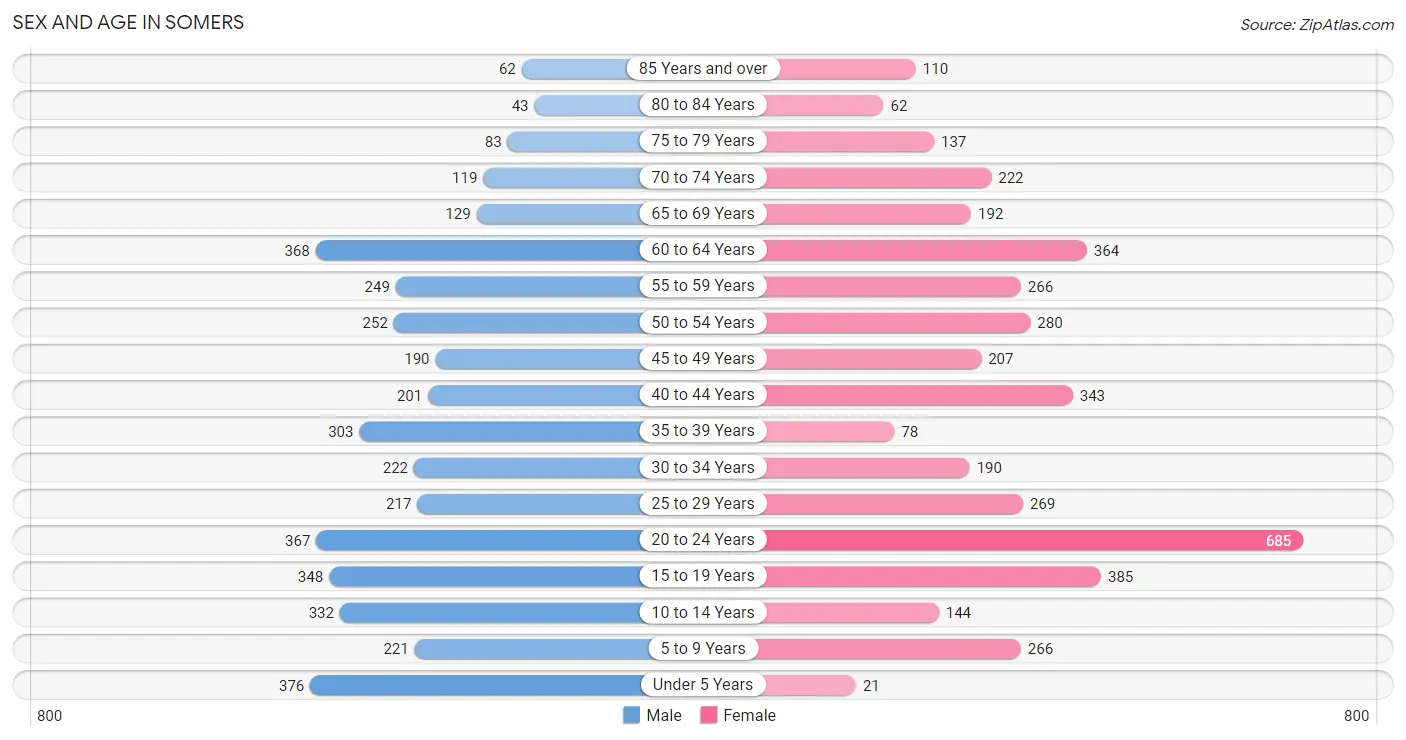
The most populous age groups in Somers are Under 5 Years (376 | 9.2%) for men and 20 to 24 Years (685 | 16.2%) for women.
| Age Bracket | Male | Female |
| Under 5 Years | 376 (9.2%) | 21 (0.5%) |
| 5 to 9 Years | 221 (5.4%) | 266 (6.3%) |
| 10 to 14 Years | 332 (8.1%) | 144 (3.4%) |
| 15 to 19 Years | 348 (8.5%) | 385 (9.1%) |
| 20 to 24 Years | 367 (9.0%) | 685 (16.2%) |
| 25 to 29 Years | 217 (5.3%) | 269 (6.4%) |
| 30 to 34 Years | 222 (5.4%) | 190 (4.5%) |
| 35 to 39 Years | 303 (7.4%) | 78 (1.8%) |
| 40 to 44 Years | 201 (4.9%) | 343 (8.1%) |
| 45 to 49 Years | 190 (4.6%) | 207 (4.9%) |
| 50 to 54 Years | 252 (6.2%) | 280 (6.6%) |
| 55 to 59 Years | 249 (6.1%) | 266 (6.3%) |
| 60 to 64 Years | 368 (9.0%) | 364 (8.6%) |
| 65 to 69 Years | 129 (3.2%) | 192 (4.5%) |
| 70 to 74 Years | 119 (2.9%) | 222 (5.3%) |
| 75 to 79 Years | 83 (2.0%) | 137 (3.3%) |
| 80 to 84 Years | 43 (1.1%) | 62 (1.5%) |
| 85 Years and over | 62 (1.5%) | 110 (2.6%) |
| Total | 4,082 (100.0%) | 4,221 (100.0%) |
Families and Households in Somers
Median Family Size in Somers
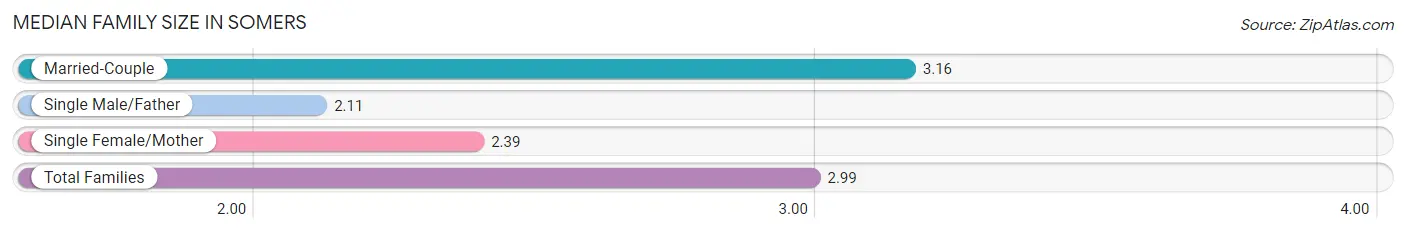
The median family size in Somers is 2.99 persons per family, with married-couple families (1,592 | 79.7%) accounting for the largest median family size of 3.16 persons per family. On the other hand, single male/father families (75 | 3.8%) represent the smallest median family size with 2.11 persons per family.
| Family Type | # Families | Family Size |
| Married-Couple | 1,592 (79.7%) | 3.16 |
| Single Male/Father | 75 (3.8%) | 2.11 |
| Single Female/Mother | 330 (16.5%) | 2.39 |
| Total Families | 1,997 (100.0%) | 2.99 |
Median Household Size in Somers
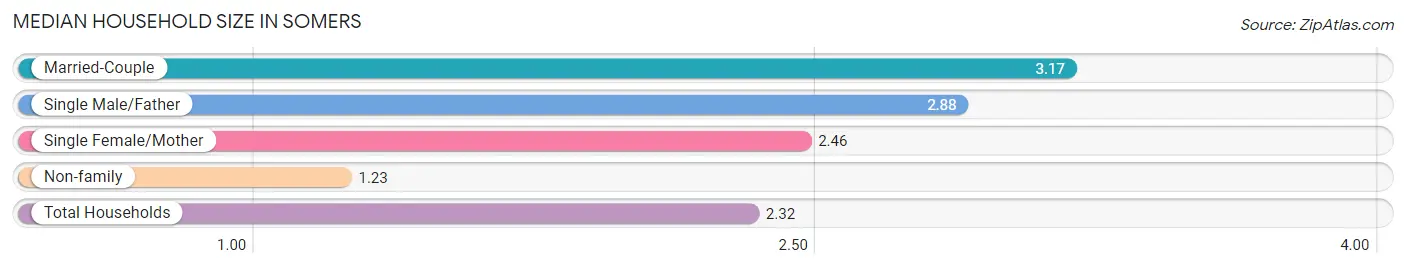
The median household size in Somers is 2.32 persons per household, with married-couple households (1,592 | 47.8%) accounting for the largest median household size of 3.17 persons per household. non-family households (1,336 | 40.1%) represent the smallest median household size with 1.23 persons per household.
| Household Type | # Households | Household Size |
| Married-Couple | 1,592 (47.8%) | 3.17 |
| Single Male/Father | 75 (2.2%) | 2.88 |
| Single Female/Mother | 330 (9.9%) | 2.46 |
| Non-family | 1,336 (40.1%) | 1.23 |
| Total Households | 3,333 (100.0%) | 2.32 |
Household Size by Marriage Status in Somers
Out of a total of 3,333 households in Somers, 1,997 (59.9%) are family households, while 1,336 (40.1%) are nonfamily households. The most numerous type of family households are 2-person households, comprising 999, and the most common type of nonfamily households are 1-person households, comprising 1,111.
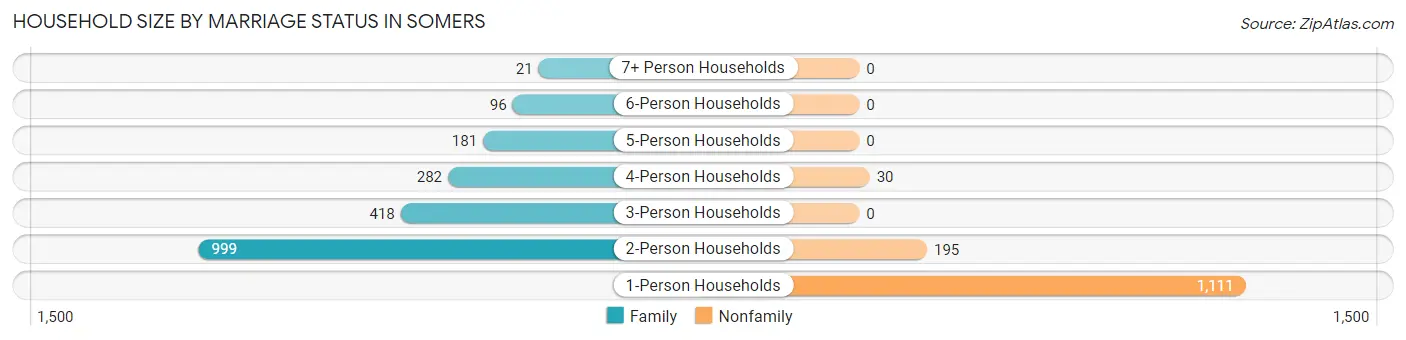
| Household Size | Family Households | Nonfamily Households |
| 1-Person Households | - | 1,111 (33.3%) |
| 2-Person Households | 999 (30.0%) | 195 (5.9%) |
| 3-Person Households | 418 (12.5%) | 0 (0.0%) |
| 4-Person Households | 282 (8.5%) | 30 (0.9%) |
| 5-Person Households | 181 (5.4%) | 0 (0.0%) |
| 6-Person Households | 96 (2.9%) | 0 (0.0%) |
| 7+ Person Households | 21 (0.6%) | 0 (0.0%) |
| Total | 1,997 (59.9%) | 1,336 (40.1%) |
Female Fertility in Somers
Fertility by Age in Somers
Average fertility rate in Somers is 70.0 births per 1,000 women. Women in the age bracket of 35 to 50 years have the highest fertility rate with 101.0 births per 1,000 women. Women in the age bracket of 20 to 34 years acount for 56.2% of all women with births.
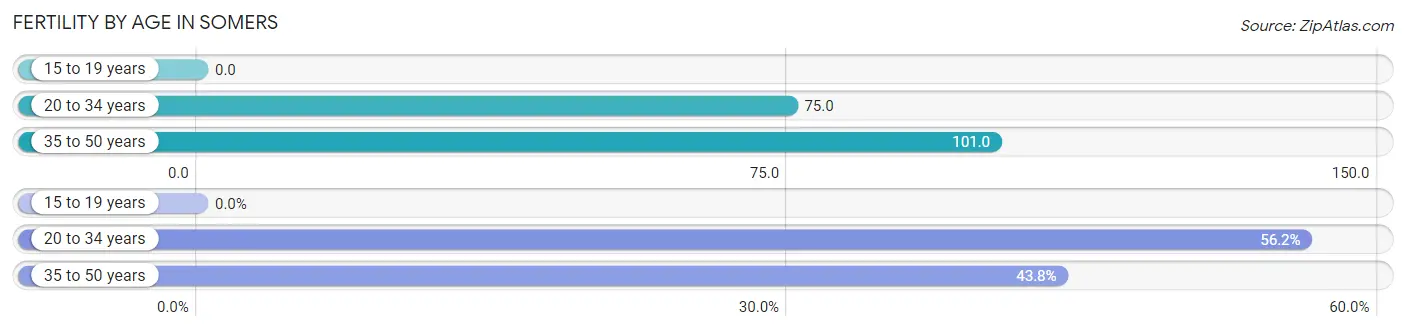
| Age Bracket | Women with Births | Births / 1,000 Women |
| 15 to 19 years | 0 (0.0%) | 0.0 |
| 20 to 34 years | 86 (56.2%) | 75.0 |
| 35 to 50 years | 67 (43.8%) | 101.0 |
| Total | 153 (100.0%) | 70.0 |
Fertility by Age by Marriage Status in Somers
62.1% of women with births (153) in Somers are married. The highest percentage of unmarried women with births falls into 20 to 34 years age bracket with 67.4% of them unmarried at the time of birth, while the lowest percentage of unmarried women with births belong to 35 to 50 years age bracket with 0.0% of them unmarried.
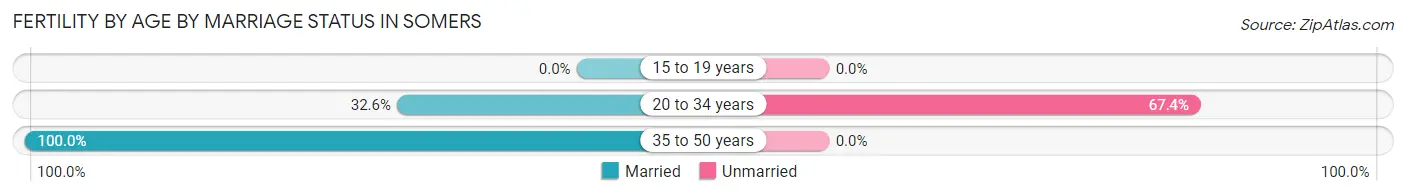
| Age Bracket | Married | Unmarried |
| 15 to 19 years | 0 (0.0%) | 0 (0.0%) |
| 20 to 34 years | 28 (32.6%) | 58 (67.4%) |
| 35 to 50 years | 67 (100.0%) | 0 (0.0%) |
| Total | 95 (62.1%) | 58 (37.9%) |
Fertility by Education in Somers
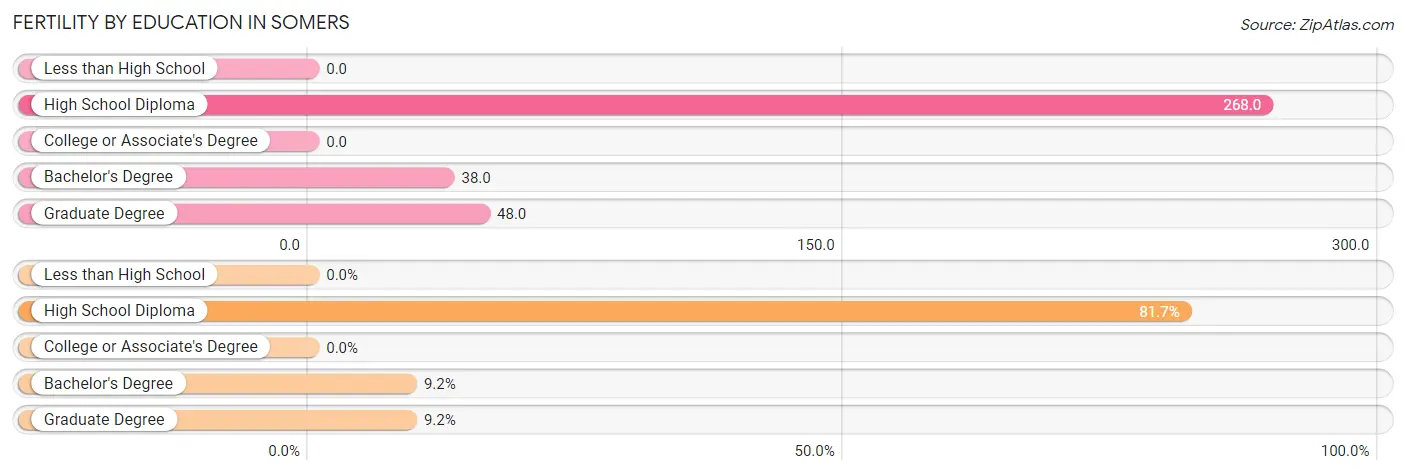
| Educational Attainment | Women with Births | Births / 1,000 Women |
| Less than High School | 0 (0.0%) | 0.0 |
| High School Diploma | 125 (81.7%) | 268.0 |
| College or Associate's Degree | 0 (0.0%) | 0.0 |
| Bachelor's Degree | 14 (9.1%) | 38.0 |
| Graduate Degree | 14 (9.1%) | 48.0 |
| Total | 153 (100.0%) | 70.0 |
Fertility by Education by Marriage Status in Somers
37.9% of women with births in Somers are unmarried. Women with the educational attainment of bachelor's degree are most likely to be married with 100.0% of them married at childbirth, while women with the educational attainment of high school diploma are least likely to be married with 46.4% of them unmarried at childbirth.
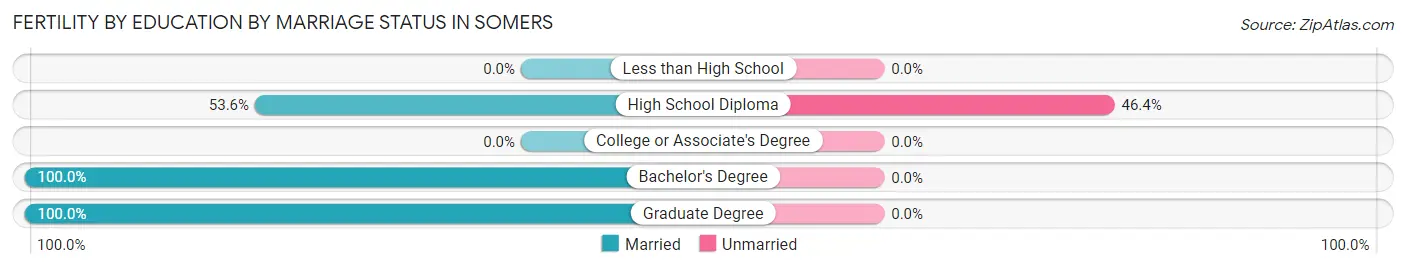
| Educational Attainment | Married | Unmarried |
| Less than High School | 0 (0.0%) | 0 (0.0%) |
| High School Diploma | 67 (53.6%) | 58 (46.4%) |
| College or Associate's Degree | 0 (0.0%) | 0 (0.0%) |
| Bachelor's Degree | 14 (100.0%) | 0 (0.0%) |
| Graduate Degree | 14 (100.0%) | 0 (0.0%) |
| Total | 95 (62.1%) | 58 (37.9%) |
Employment Characteristics in Somers
Employment by Class of Employer in Somers
Among the 3,865 employed individuals in Somers, private company employees (2,719 | 70.4%), not-for-profit organizations (468 | 12.1%), and local government employees (285 | 7.4%) make up the most common classes of employment.
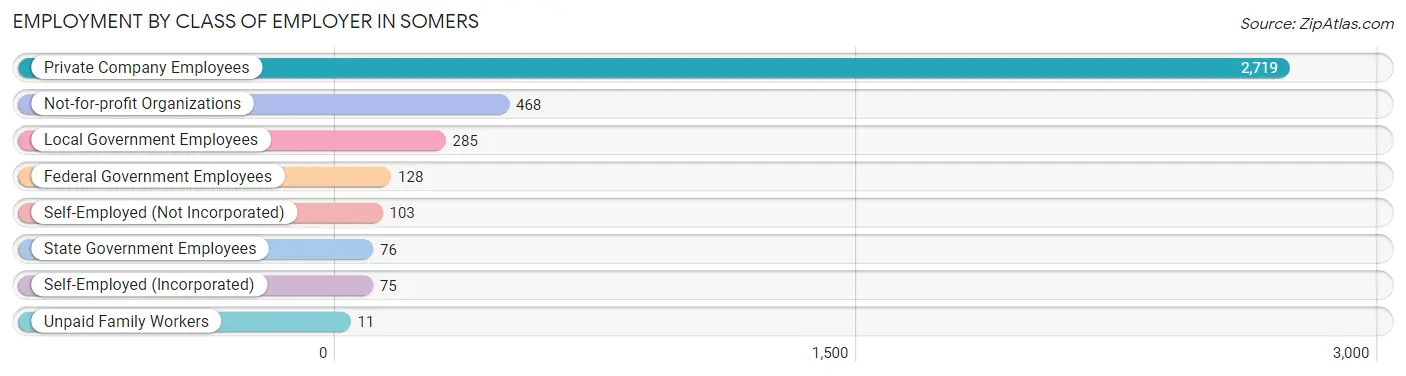
| Employer Class | # Employees | % Employees |
| Private Company Employees | 2,719 | 70.4% |
| Self-Employed (Incorporated) | 75 | 1.9% |
| Self-Employed (Not Incorporated) | 103 | 2.7% |
| Not-for-profit Organizations | 468 | 12.1% |
| Local Government Employees | 285 | 7.4% |
| State Government Employees | 76 | 2.0% |
| Federal Government Employees | 128 | 3.3% |
| Unpaid Family Workers | 11 | 0.3% |
| Total | 3,865 | 100.0% |
Employment Status by Age in Somers
According to the labor force statistics for Somers, out of the total population over 16 years of age (6,827), 64.1% or 4,376 individuals are in the labor force, with 9.9% or 433 of them unemployed. The age group with the highest labor force participation rate is 35 to 44 years, with 91.0% or 842 individuals in the labor force. Within the labor force, the 25 to 29 years age range has the highest percentage of unemployed individuals, with 24.2% or 107 of them being unemployed.
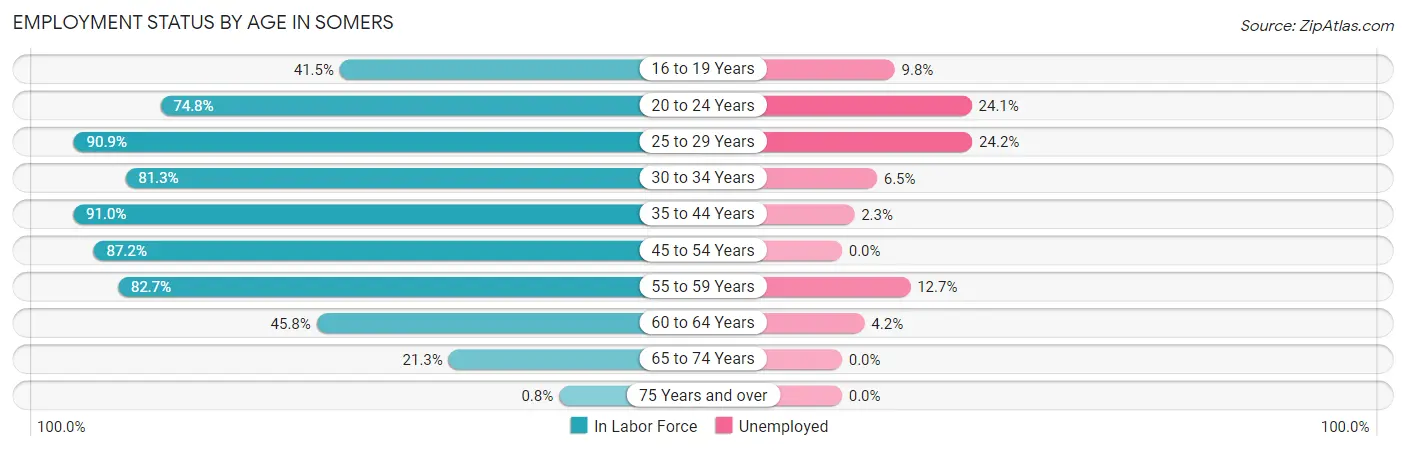
| Age Bracket | In Labor Force | Unemployed |
| 16 to 19 Years | 256 (41.5%) | 25 (9.8%) |
| 20 to 24 Years | 787 (74.8%) | 190 (24.1%) |
| 25 to 29 Years | 442 (90.9%) | 107 (24.2%) |
| 30 to 34 Years | 335 (81.3%) | 22 (6.5%) |
| 35 to 44 Years | 842 (91.0%) | 19 (2.3%) |
| 45 to 54 Years | 810 (87.2%) | 0 (0.0%) |
| 55 to 59 Years | 426 (82.7%) | 54 (12.7%) |
| 60 to 64 Years | 335 (45.8%) | 14 (4.2%) |
| 65 to 74 Years | 141 (21.3%) | 0 (0.0%) |
| 75 Years and over | 4 (0.8%) | 0 (0.0%) |
| Total | 4,376 (64.1%) | 433 (9.9%) |
Employment Status by Educational Attainment in Somers
According to labor force statistics for Somers, 79.8% of individuals (3,191) out of the total population between 25 and 64 years of age (3,999) are in the labor force, with 6.8% or 217 of them being unemployed. The group with the highest labor force participation rate are those with the educational attainment of bachelor's degree or higher, with 88.3% or 1,432 individuals in the labor force. Within the labor force, individuals with college / associate degree education have the highest percentage of unemployment, with 10.7% or 117 of them being unemployed.
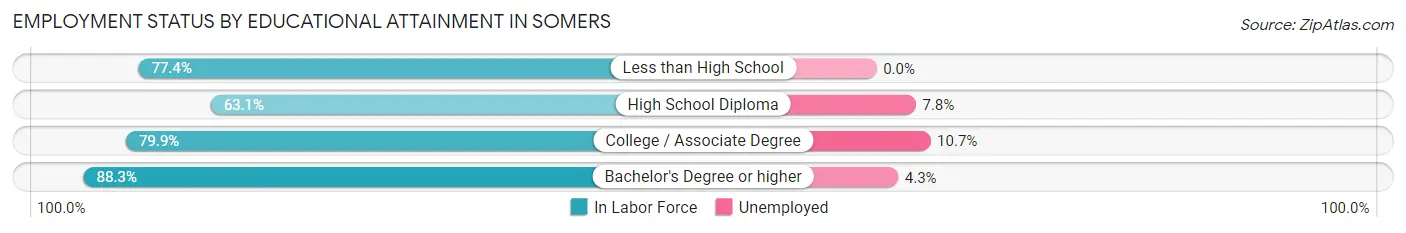
| Educational Attainment | In Labor Force | Unemployed |
| Less than High School | 151 (77.4%) | 0 (0.0%) |
| High School Diploma | 512 (63.1%) | 63 (7.8%) |
| College / Associate Degree | 1,095 (79.9%) | 147 (10.7%) |
| Bachelor's Degree or higher | 1,432 (88.3%) | 70 (4.3%) |
| Total | 3,191 (79.8%) | 272 (6.8%) |
Employment Occupations by Sex in Somers
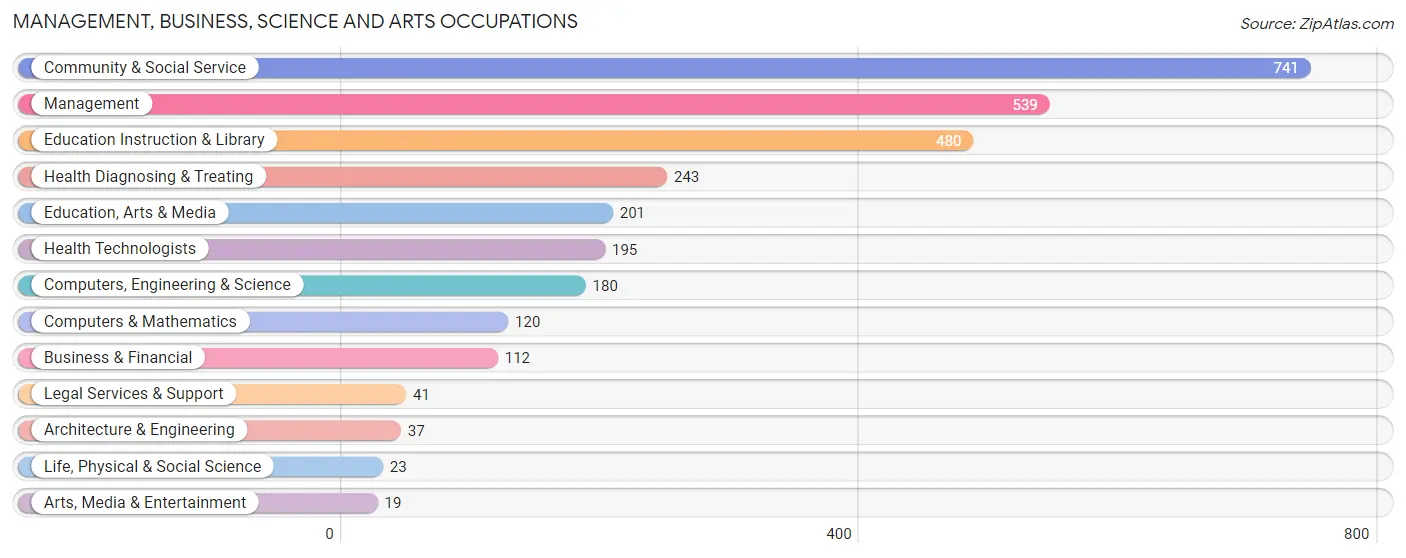
Management, Business, Science and Arts Occupations
The most common Management, Business, Science and Arts occupations in Somers are Community & Social Service (741 | 19.0%), Management (539 | 13.8%), Education Instruction & Library (480 | 12.3%), Health Diagnosing & Treating (243 | 6.2%), and Education, Arts & Media (201 | 5.2%).
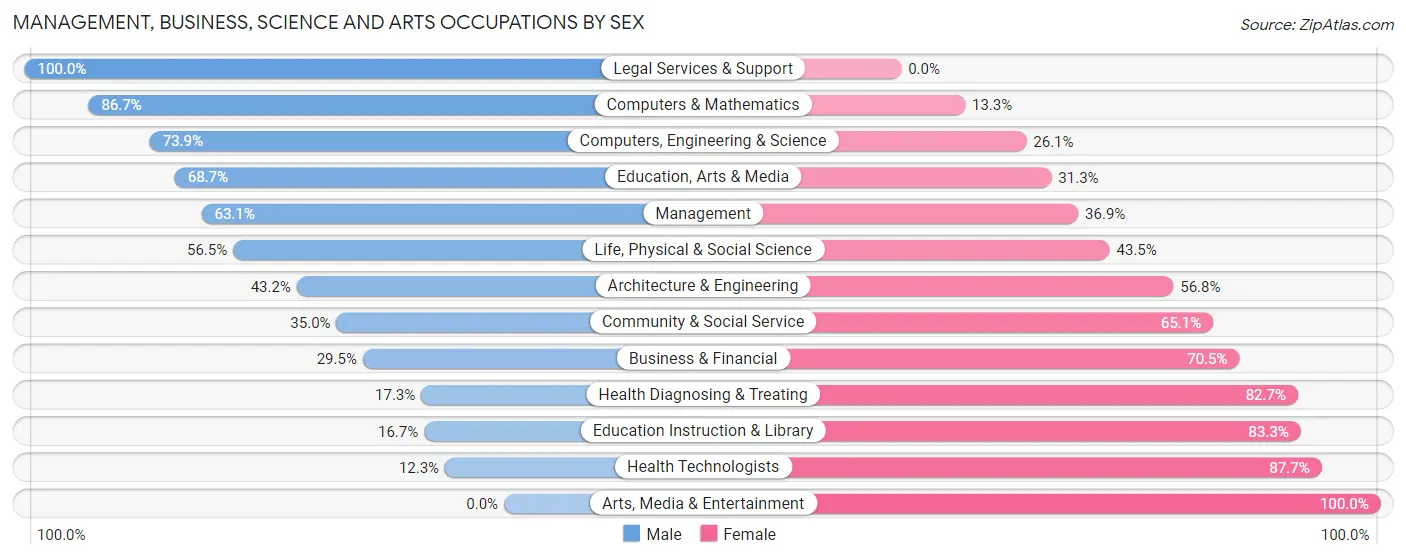
Management, Business, Science and Arts Occupations by Sex
Within the Management, Business, Science and Arts occupations in Somers, the most male-oriented occupations are Legal Services & Support (100.0%), Computers & Mathematics (86.7%), and Computers, Engineering & Science (73.9%), while the most female-oriented occupations are Arts, Media & Entertainment (100.0%), Health Technologists (87.7%), and Education Instruction & Library (83.3%).
| Occupation | Male | Female |
| Management | 340 (63.1%) | 199 (36.9%) |
| Business & Financial | 33 (29.5%) | 79 (70.5%) |
| Computers, Engineering & Science | 133 (73.9%) | 47 (26.1%) |
| Computers & Mathematics | 104 (86.7%) | 16 (13.3%) |
| Architecture & Engineering | 16 (43.2%) | 21 (56.8%) |
| Life, Physical & Social Science | 13 (56.5%) | 10 (43.5%) |
| Community & Social Service | 259 (34.9%) | 482 (65.0%) |
| Education, Arts & Media | 138 (68.7%) | 63 (31.3%) |
| Legal Services & Support | 41 (100.0%) | 0 (0.0%) |
| Education Instruction & Library | 80 (16.7%) | 400 (83.3%) |
| Arts, Media & Entertainment | 0 (0.0%) | 19 (100.0%) |
| Health Diagnosing & Treating | 42 (17.3%) | 201 (82.7%) |
| Health Technologists | 24 (12.3%) | 171 (87.7%) |
| Total (Category) | 807 (44.5%) | 1,008 (55.5%) |
| Total (Overall) | 1,970 (50.6%) | 1,925 (49.4%) |
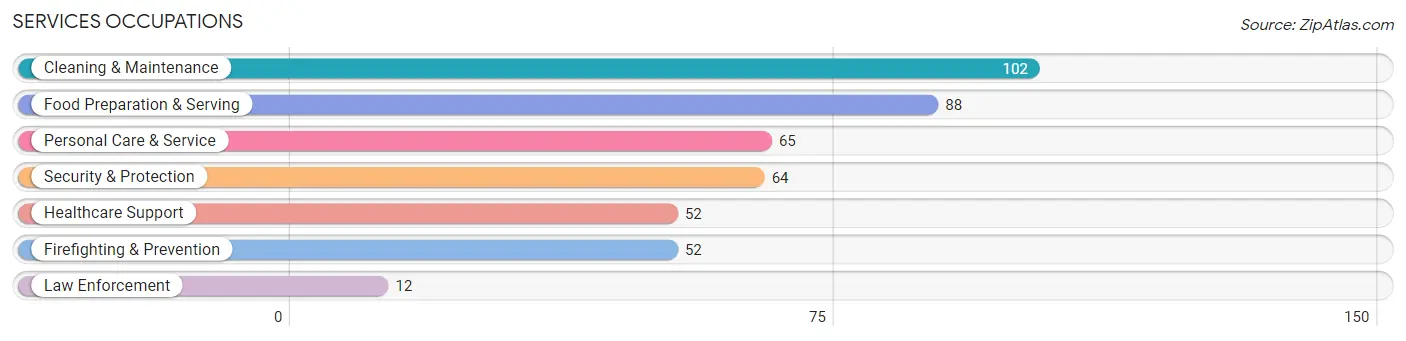
Services Occupations
The most common Services occupations in Somers are Cleaning & Maintenance (102 | 2.6%), Food Preparation & Serving (88 | 2.3%), Personal Care & Service (65 | 1.7%), Security & Protection (64 | 1.6%), and Healthcare Support (52 | 1.3%).
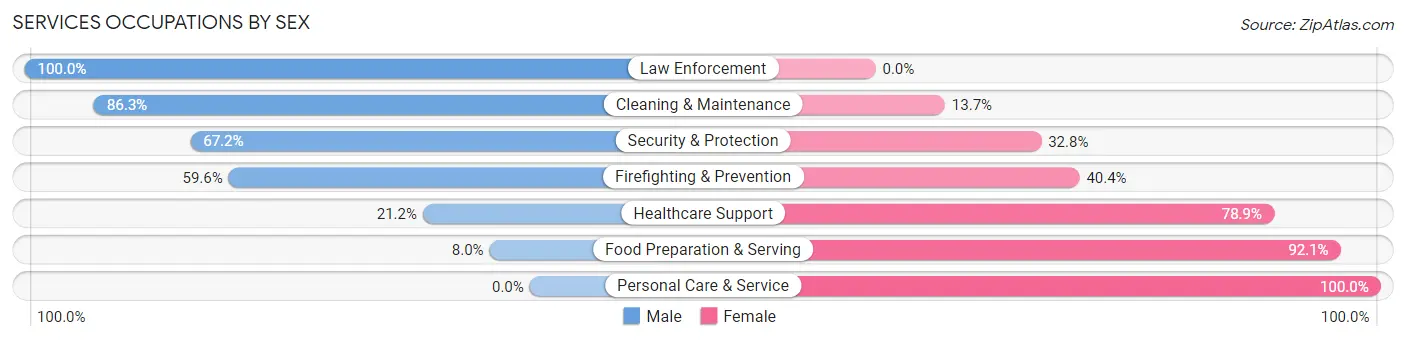
Services Occupations by Sex
Within the Services occupations in Somers, the most male-oriented occupations are Law Enforcement (100.0%), Cleaning & Maintenance (86.3%), and Security & Protection (67.2%), while the most female-oriented occupations are Personal Care & Service (100.0%), Food Preparation & Serving (92.0%), and Healthcare Support (78.8%).
| Occupation | Male | Female |
| Healthcare Support | 11 (21.1%) | 41 (78.8%) |
| Security & Protection | 43 (67.2%) | 21 (32.8%) |
| Firefighting & Prevention | 31 (59.6%) | 21 (40.4%) |
| Law Enforcement | 12 (100.0%) | 0 (0.0%) |
| Food Preparation & Serving | 7 (8.0%) | 81 (92.0%) |
| Cleaning & Maintenance | 88 (86.3%) | 14 (13.7%) |
| Personal Care & Service | 0 (0.0%) | 65 (100.0%) |
| Total (Category) | 149 (40.2%) | 222 (59.8%) |
| Total (Overall) | 1,970 (50.6%) | 1,925 (49.4%) |
Sales and Office Occupations
The most common Sales and Office occupations in Somers are Sales & Related (398 | 10.2%), and Office & Administration (312 | 8.0%).
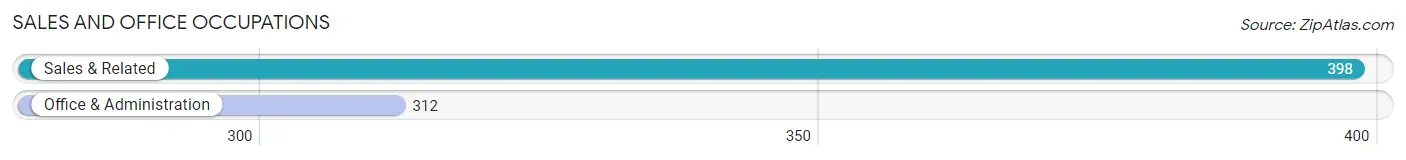
Sales and Office Occupations by Sex
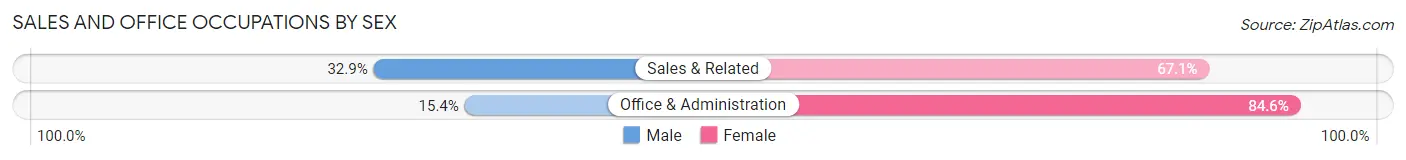
| Occupation | Male | Female |
| Sales & Related | 131 (32.9%) | 267 (67.1%) |
| Office & Administration | 48 (15.4%) | 264 (84.6%) |
| Total (Category) | 179 (25.2%) | 531 (74.8%) |
| Total (Overall) | 1,970 (50.6%) | 1,925 (49.4%) |
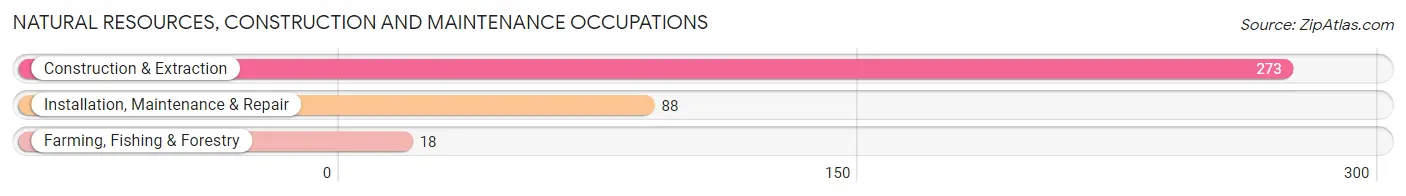
Natural Resources, Construction and Maintenance Occupations
The most common Natural Resources, Construction and Maintenance occupations in Somers are Construction & Extraction (273 | 7.0%), Installation, Maintenance & Repair (88 | 2.3%), and Farming, Fishing & Forestry (18 | 0.5%).
Natural Resources, Construction and Maintenance Occupations by Sex
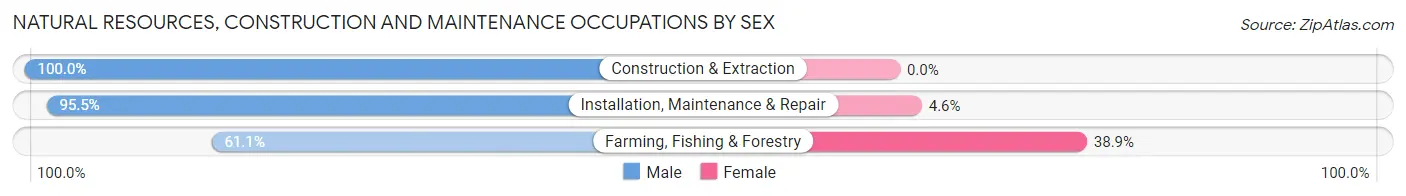
| Occupation | Male | Female |
| Farming, Fishing & Forestry | 11 (61.1%) | 7 (38.9%) |
| Construction & Extraction | 273 (100.0%) | 0 (0.0%) |
| Installation, Maintenance & Repair | 84 (95.5%) | 4 (4.5%) |
| Total (Category) | 368 (97.1%) | 11 (2.9%) |
| Total (Overall) | 1,970 (50.6%) | 1,925 (49.4%) |
Production, Transportation and Moving Occupations
The most common Production, Transportation and Moving occupations in Somers are Material Moving (291 | 7.5%), Transportation (173 | 4.4%), and Production (156 | 4.0%).
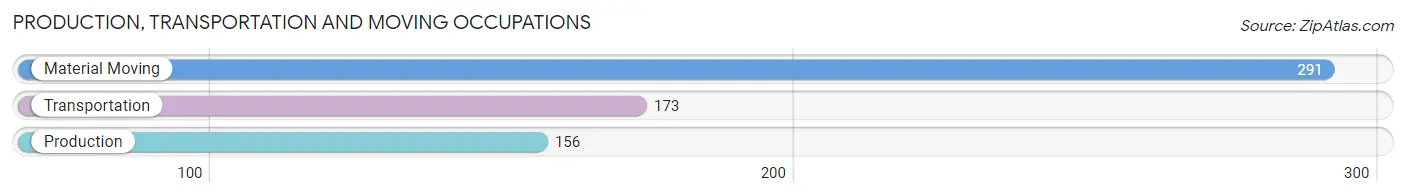
Production, Transportation and Moving Occupations by Sex
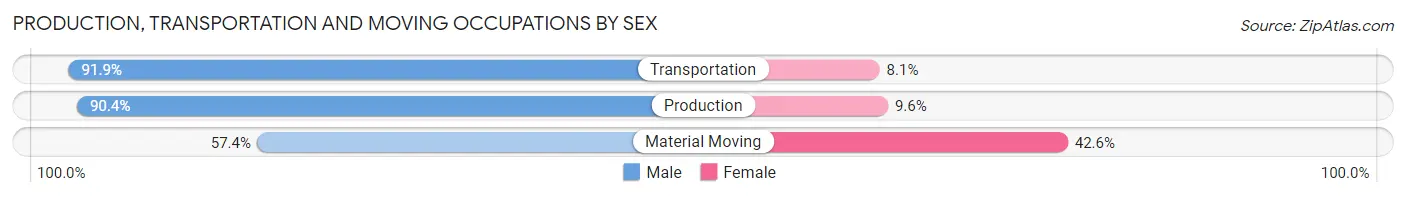
| Occupation | Male | Female |
| Production | 141 (90.4%) | 15 (9.6%) |
| Transportation | 159 (91.9%) | 14 (8.1%) |
| Material Moving | 167 (57.4%) | 124 (42.6%) |
| Total (Category) | 467 (75.3%) | 153 (24.7%) |
| Total (Overall) | 1,970 (50.6%) | 1,925 (49.4%) |
Employment Industries by Sex in Somers
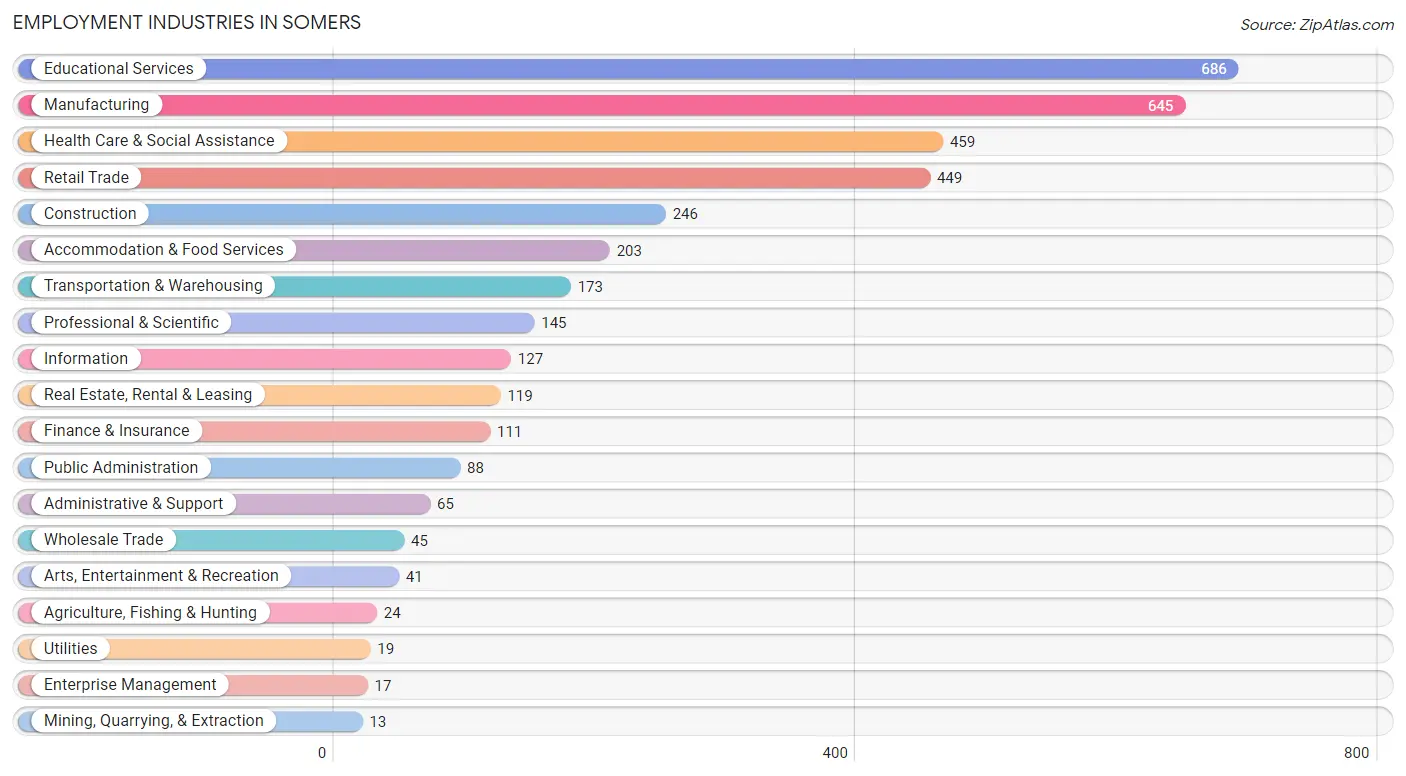
Employment Industries in Somers
The major employment industries in Somers include Educational Services (686 | 17.6%), Manufacturing (645 | 16.6%), Health Care & Social Assistance (459 | 11.8%), Retail Trade (449 | 11.5%), and Construction (246 | 6.3%).
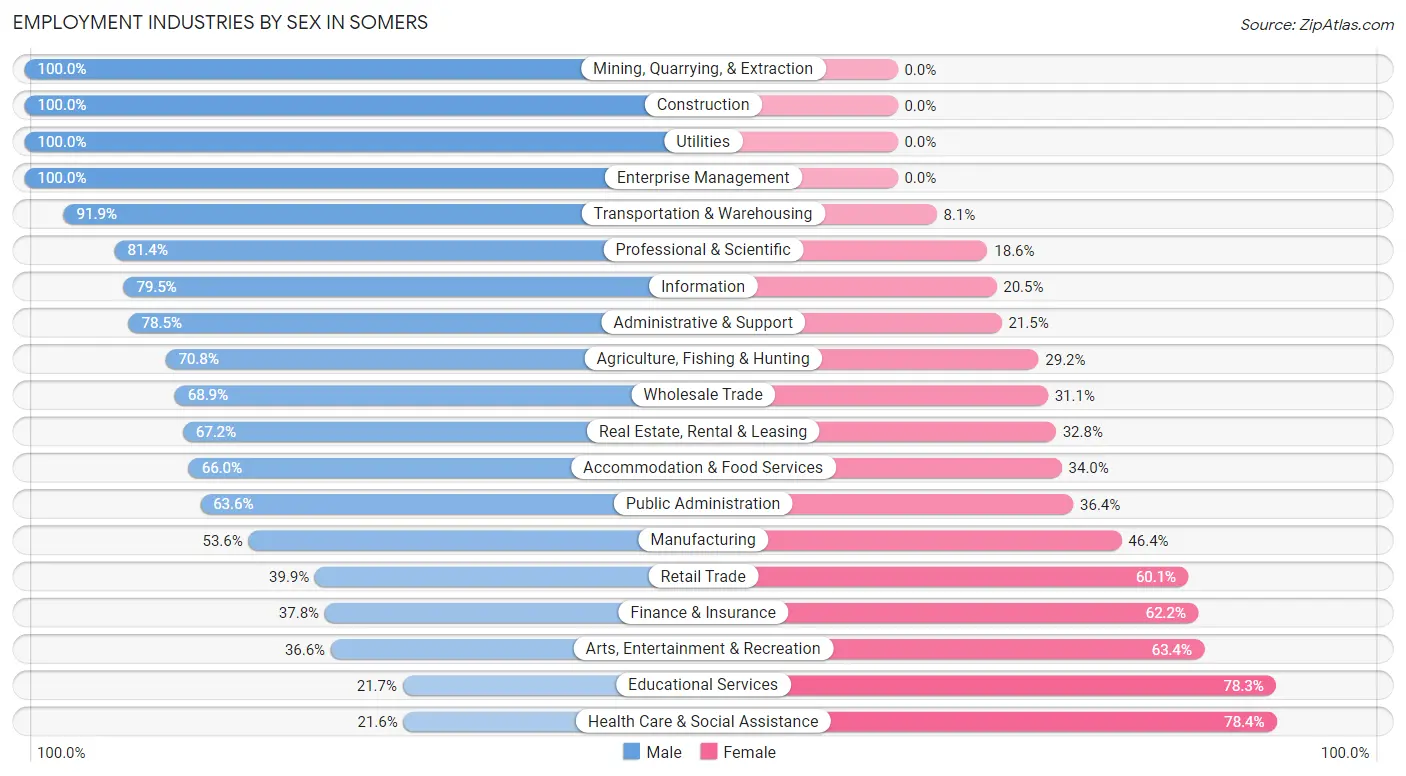
Employment Industries by Sex in Somers
The Somers industries that see more men than women are Mining, Quarrying, & Extraction (100.0%), Construction (100.0%), and Utilities (100.0%), whereas the industries that tend to have a higher number of women are Health Care & Social Assistance (78.4%), Educational Services (78.3%), and Arts, Entertainment & Recreation (63.4%).
| Industry | Male | Female |
| Agriculture, Fishing & Hunting | 17 (70.8%) | 7 (29.2%) |
| Mining, Quarrying, & Extraction | 13 (100.0%) | 0 (0.0%) |
| Construction | 246 (100.0%) | 0 (0.0%) |
| Manufacturing | 346 (53.6%) | 299 (46.4%) |
| Wholesale Trade | 31 (68.9%) | 14 (31.1%) |
| Retail Trade | 179 (39.9%) | 270 (60.1%) |
| Transportation & Warehousing | 159 (91.9%) | 14 (8.1%) |
| Utilities | 19 (100.0%) | 0 (0.0%) |
| Information | 101 (79.5%) | 26 (20.5%) |
| Finance & Insurance | 42 (37.8%) | 69 (62.2%) |
| Real Estate, Rental & Leasing | 80 (67.2%) | 39 (32.8%) |
| Professional & Scientific | 118 (81.4%) | 27 (18.6%) |
| Enterprise Management | 17 (100.0%) | 0 (0.0%) |
| Administrative & Support | 51 (78.5%) | 14 (21.5%) |
| Educational Services | 149 (21.7%) | 537 (78.3%) |
| Health Care & Social Assistance | 99 (21.6%) | 360 (78.4%) |
| Arts, Entertainment & Recreation | 15 (36.6%) | 26 (63.4%) |
| Accommodation & Food Services | 134 (66.0%) | 69 (34.0%) |
| Public Administration | 56 (63.6%) | 32 (36.4%) |
| Total | 1,970 (50.6%) | 1,925 (49.4%) |
Education in Somers
School Enrollment in Somers
The most common levels of schooling among the 2,436 students in Somers are college / undergraduate (1,051 | 43.1%), elementary school (422 | 17.3%), and high school (391 | 16.1%).
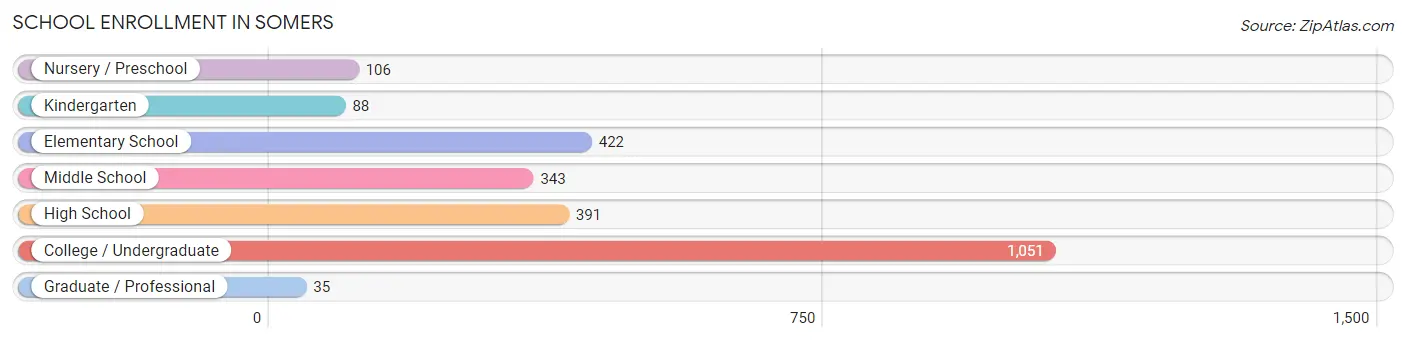
| School Level | # Students | % Students |
| Nursery / Preschool | 106 | 4.3% |
| Kindergarten | 88 | 3.6% |
| Elementary School | 422 | 17.3% |
| Middle School | 343 | 14.1% |
| High School | 391 | 16.1% |
| College / Undergraduate | 1,051 | 43.1% |
| Graduate / Professional | 35 | 1.4% |
| Total | 2,436 | 100.0% |
School Enrollment by Age by Funding Source in Somers
Out of a total of 2,436 students who are enrolled in schools in Somers, 850 (34.9%) attend a private institution, while the remaining 1,586 (65.1%) are enrolled in public schools. The age group of 25 to 34 year olds has the highest likelihood of being enrolled in private schools, with 36 (80.0% in the age bracket) enrolled. Conversely, the age group of 35 years and over has the lowest likelihood of being enrolled in a private school, with 89 (90.8% in the age bracket) attending a public institution.
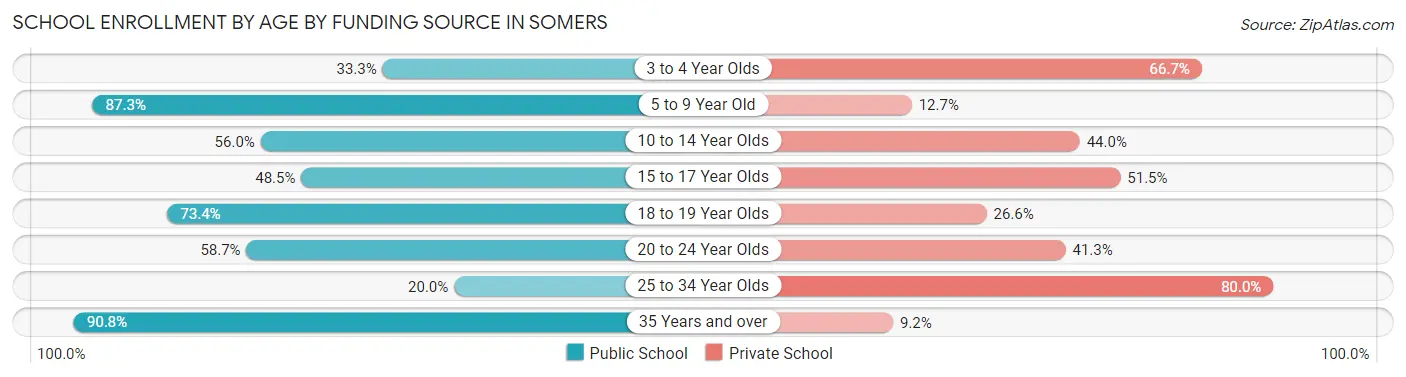
| Age Bracket | Public School | Private School |
| 3 to 4 Year Olds | 29 (33.3%) | 58 (66.7%) |
| 5 to 9 Year Old | 413 (87.3%) | 60 (12.7%) |
| 10 to 14 Year Olds | 251 (56.0%) | 197 (44.0%) |
| 15 to 17 Year Olds | 126 (48.5%) | 134 (51.5%) |
| 18 to 19 Year Olds | 342 (73.4%) | 124 (26.6%) |
| 20 to 24 Year Olds | 328 (58.7%) | 231 (41.3%) |
| 25 to 34 Year Olds | 9 (20.0%) | 36 (80.0%) |
| 35 Years and over | 89 (90.8%) | 9 (9.2%) |
| Total | 1,586 (65.1%) | 850 (34.9%) |
Educational Attainment by Field of Study in Somers
Education (590 | 26.4%), business (331 | 14.8%), social sciences (265 | 11.9%), liberal arts & history (221 | 9.9%), and science & technology (219 | 9.8%) are the most common fields of study among 2,232 individuals in Somers who have obtained a bachelor's degree or higher.
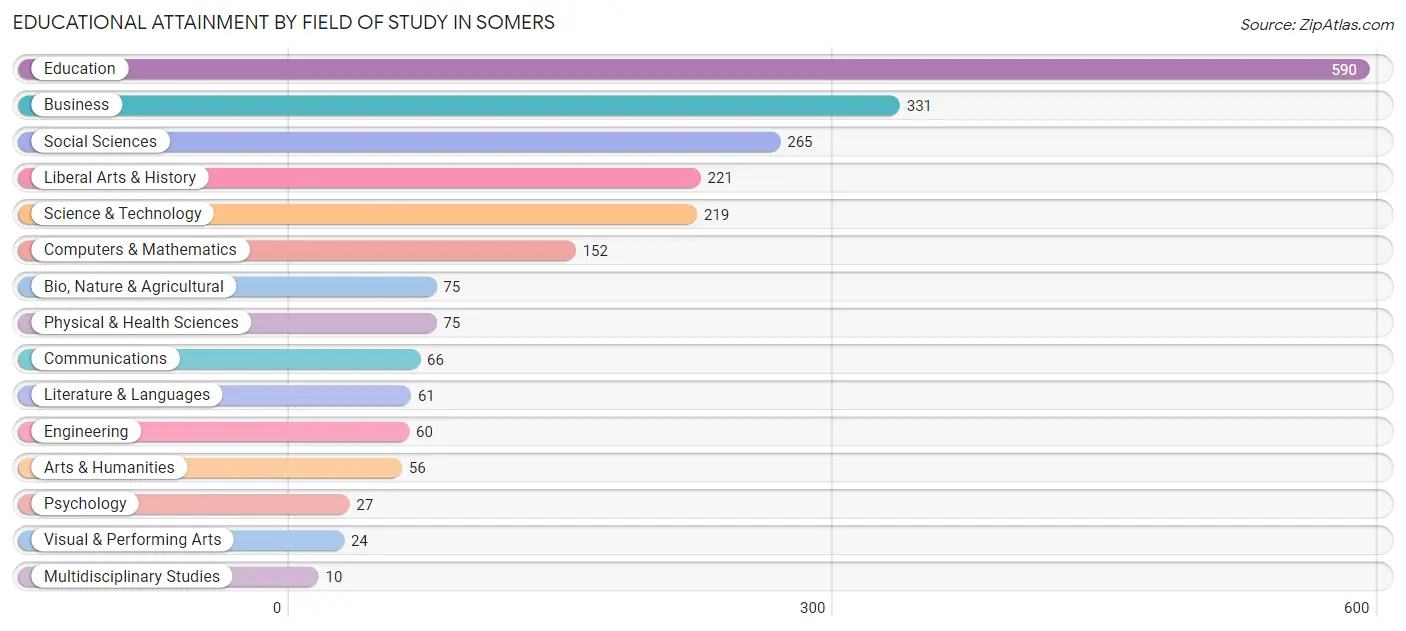
| Field of Study | # Graduates | % Graduates |
| Computers & Mathematics | 152 | 6.8% |
| Bio, Nature & Agricultural | 75 | 3.4% |
| Physical & Health Sciences | 75 | 3.4% |
| Psychology | 27 | 1.2% |
| Social Sciences | 265 | 11.9% |
| Engineering | 60 | 2.7% |
| Multidisciplinary Studies | 10 | 0.4% |
| Science & Technology | 219 | 9.8% |
| Business | 331 | 14.8% |
| Education | 590 | 26.4% |
| Literature & Languages | 61 | 2.7% |
| Liberal Arts & History | 221 | 9.9% |
| Visual & Performing Arts | 24 | 1.1% |
| Communications | 66 | 3.0% |
| Arts & Humanities | 56 | 2.5% |
| Total | 2,232 | 100.0% |
Transportation & Commute in Somers
Vehicle Availability by Sex in Somers
The most prevalent vehicle ownership categories in Somers are males with 2 vehicles (939, accounting for 49.4%) and females with 2 vehicles (703, making up 53.7%).
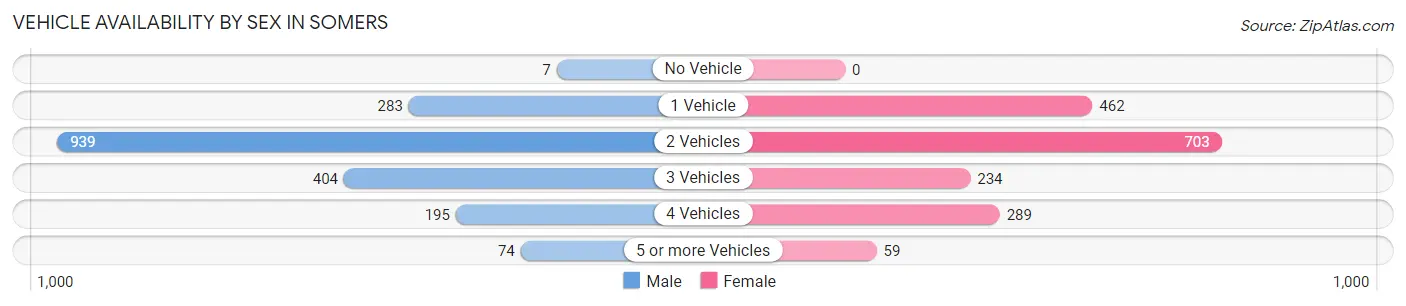
| Vehicles Available | Male | Female |
| No Vehicle | 7 (0.4%) | 0 (0.0%) |
| 1 Vehicle | 283 (14.9%) | 462 (26.5%) |
| 2 Vehicles | 939 (49.4%) | 703 (40.2%) |
| 3 Vehicles | 404 (21.2%) | 234 (13.4%) |
| 4 Vehicles | 195 (10.2%) | 289 (16.5%) |
| 5 or more Vehicles | 74 (3.9%) | 59 (3.4%) |
| Total | 1,902 (100.0%) | 1,747 (100.0%) |
Commute Time in Somers
The most frequently occuring commute durations in Somers are 15 to 19 minutes (691 commuters, 19.3%), 20 to 24 minutes (651 commuters, 18.2%), and 30 to 34 minutes (366 commuters, 10.2%).
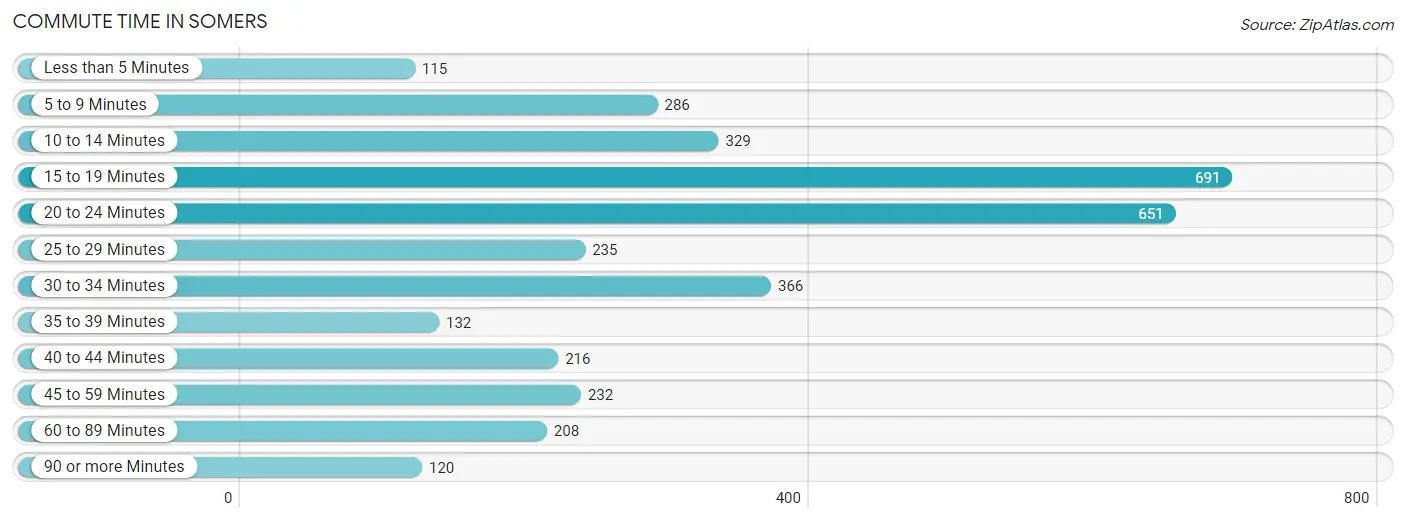
| Commute Time | # Commuters | % Commuters |
| Less than 5 Minutes | 115 | 3.2% |
| 5 to 9 Minutes | 286 | 8.0% |
| 10 to 14 Minutes | 329 | 9.2% |
| 15 to 19 Minutes | 691 | 19.3% |
| 20 to 24 Minutes | 651 | 18.2% |
| 25 to 29 Minutes | 235 | 6.6% |
| 30 to 34 Minutes | 366 | 10.2% |
| 35 to 39 Minutes | 132 | 3.7% |
| 40 to 44 Minutes | 216 | 6.0% |
| 45 to 59 Minutes | 232 | 6.5% |
| 60 to 89 Minutes | 208 | 5.8% |
| 90 or more Minutes | 120 | 3.4% |
Commute Time by Sex in Somers
The most common commute times in Somers are 20 to 24 minutes (385 commuters, 21.0%) for males and 15 to 19 minutes (374 commuters, 21.4%) for females.
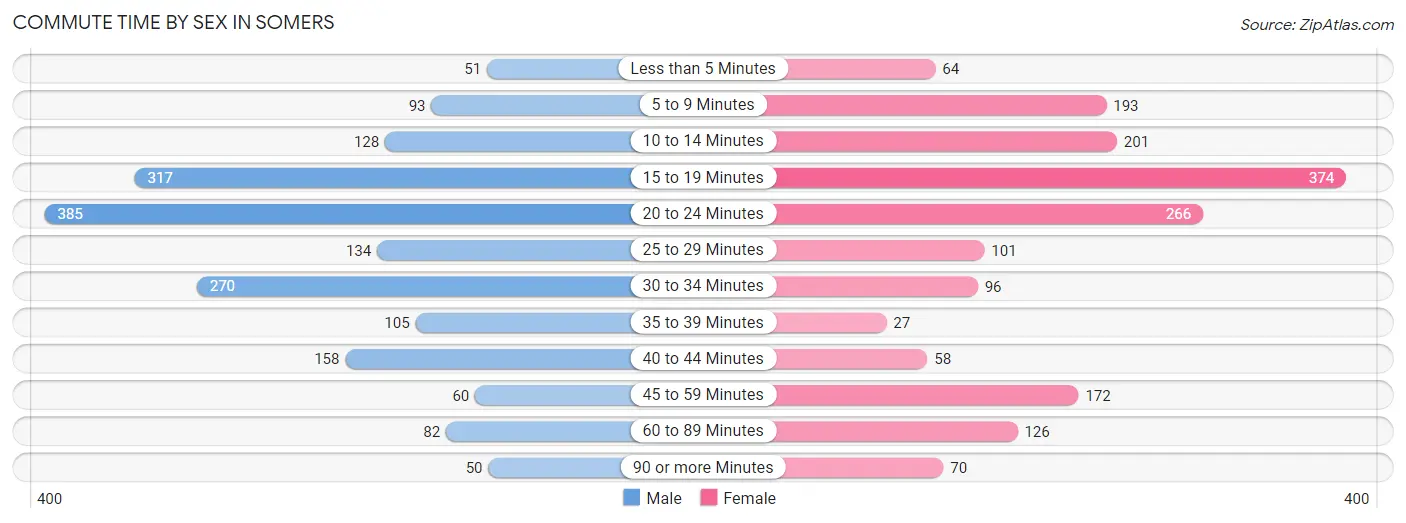
| Commute Time | Male | Female |
| Less than 5 Minutes | 51 (2.8%) | 64 (3.7%) |
| 5 to 9 Minutes | 93 (5.1%) | 193 (11.0%) |
| 10 to 14 Minutes | 128 (7.0%) | 201 (11.5%) |
| 15 to 19 Minutes | 317 (17.3%) | 374 (21.4%) |
| 20 to 24 Minutes | 385 (21.0%) | 266 (15.2%) |
| 25 to 29 Minutes | 134 (7.3%) | 101 (5.8%) |
| 30 to 34 Minutes | 270 (14.7%) | 96 (5.5%) |
| 35 to 39 Minutes | 105 (5.7%) | 27 (1.5%) |
| 40 to 44 Minutes | 158 (8.6%) | 58 (3.3%) |
| 45 to 59 Minutes | 60 (3.3%) | 172 (9.8%) |
| 60 to 89 Minutes | 82 (4.5%) | 126 (7.2%) |
| 90 or more Minutes | 50 (2.7%) | 70 (4.0%) |
Time of Departure to Work by Sex in Somers
The most frequent times of departure to work in Somers are 12:00 PM to 3:59 PM (321, 17.5%) for males and 7:00 AM to 7:29 AM (403, 23.1%) for females.
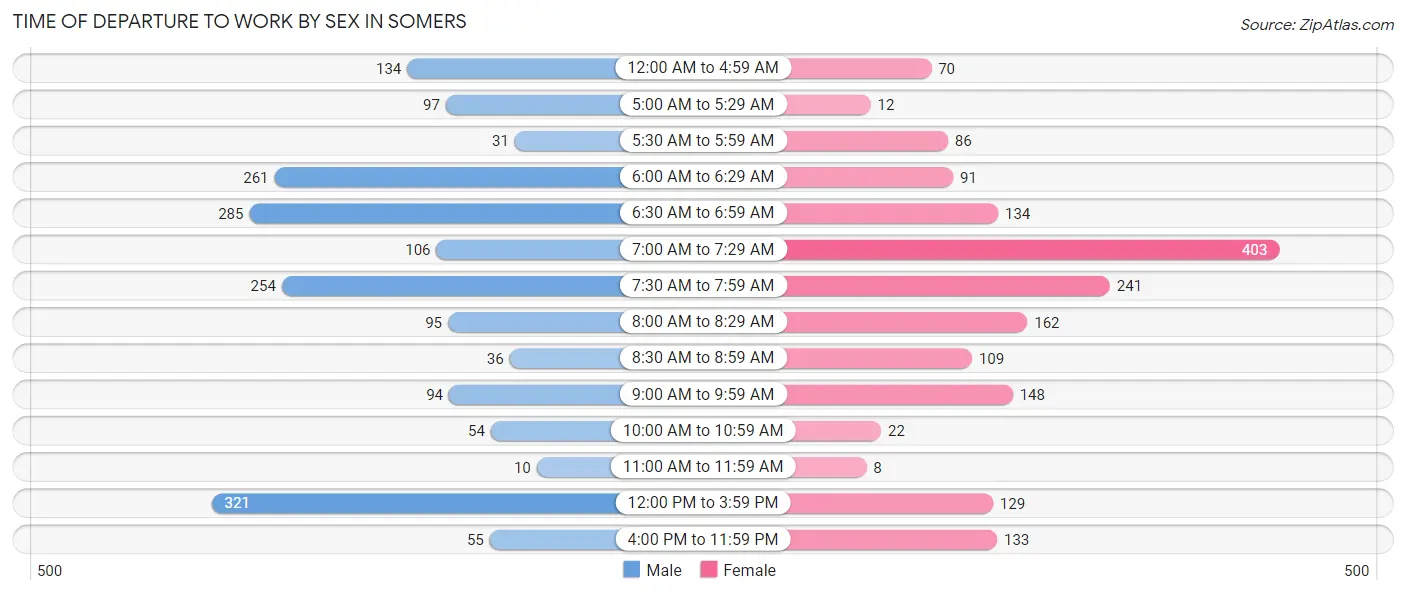
| Time of Departure | Male | Female |
| 12:00 AM to 4:59 AM | 134 (7.3%) | 70 (4.0%) |
| 5:00 AM to 5:29 AM | 97 (5.3%) | 12 (0.7%) |
| 5:30 AM to 5:59 AM | 31 (1.7%) | 86 (4.9%) |
| 6:00 AM to 6:29 AM | 261 (14.2%) | 91 (5.2%) |
| 6:30 AM to 6:59 AM | 285 (15.5%) | 134 (7.7%) |
| 7:00 AM to 7:29 AM | 106 (5.8%) | 403 (23.1%) |
| 7:30 AM to 7:59 AM | 254 (13.9%) | 241 (13.8%) |
| 8:00 AM to 8:29 AM | 95 (5.2%) | 162 (9.3%) |
| 8:30 AM to 8:59 AM | 36 (2.0%) | 109 (6.2%) |
| 9:00 AM to 9:59 AM | 94 (5.1%) | 148 (8.5%) |
| 10:00 AM to 10:59 AM | 54 (2.9%) | 22 (1.3%) |
| 11:00 AM to 11:59 AM | 10 (0.5%) | 8 (0.5%) |
| 12:00 PM to 3:59 PM | 321 (17.5%) | 129 (7.4%) |
| 4:00 PM to 11:59 PM | 55 (3.0%) | 133 (7.6%) |
| Total | 1,833 (100.0%) | 1,748 (100.0%) |
Housing Occupancy in Somers
Occupancy by Ownership in Somers
Of the total 3,333 dwellings in Somers, owner-occupied units account for 2,017 (60.5%), while renter-occupied units make up 1,316 (39.5%).
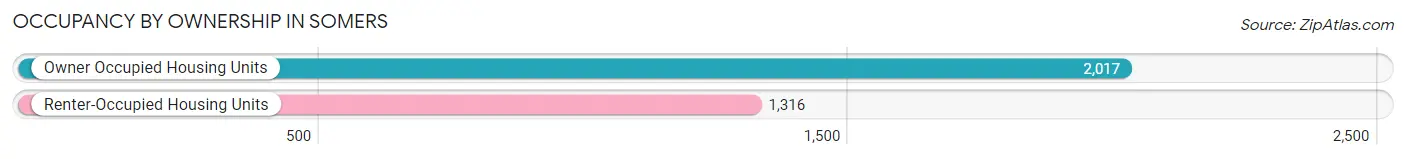
| Occupancy | # Housing Units | % Housing Units |
| Owner Occupied Housing Units | 2,017 | 60.5% |
| Renter-Occupied Housing Units | 1,316 | 39.5% |
| Total Occupied Housing Units | 3,333 | 100.0% |
Occupancy by Household Size in Somers
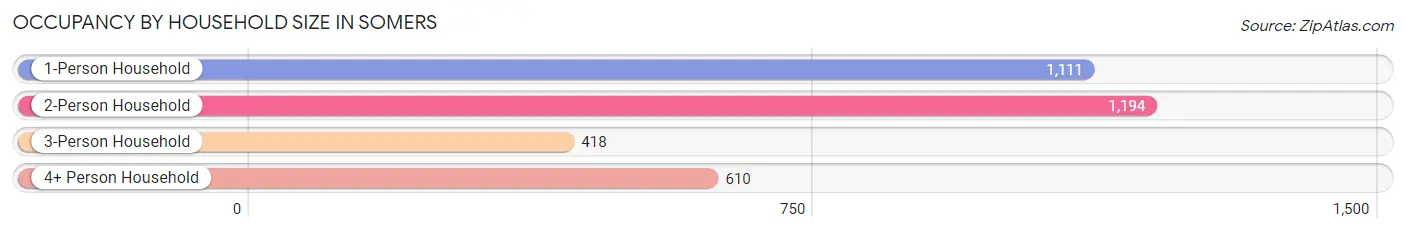
| Household Size | # Housing Units | % Housing Units |
| 1-Person Household | 1,111 | 33.3% |
| 2-Person Household | 1,194 | 35.8% |
| 3-Person Household | 418 | 12.5% |
| 4+ Person Household | 610 | 18.3% |
| Total Housing Units | 3,333 | 100.0% |
Occupancy by Ownership by Household Size in Somers
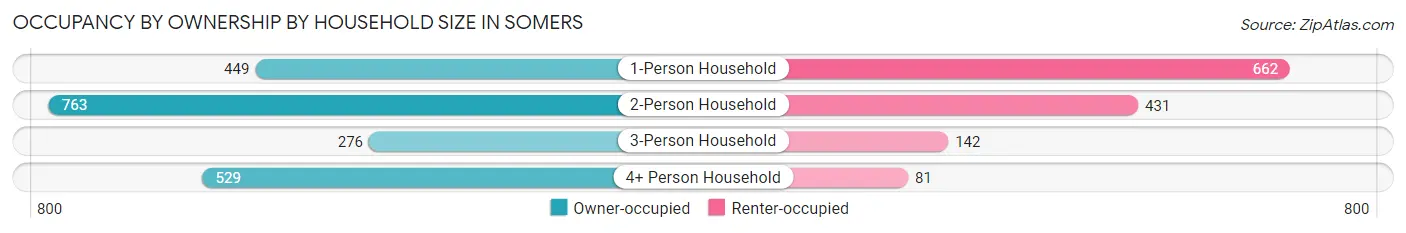
| Household Size | Owner-occupied | Renter-occupied |
| 1-Person Household | 449 (40.4%) | 662 (59.6%) |
| 2-Person Household | 763 (63.9%) | 431 (36.1%) |
| 3-Person Household | 276 (66.0%) | 142 (34.0%) |
| 4+ Person Household | 529 (86.7%) | 81 (13.3%) |
| Total Housing Units | 2,017 (60.5%) | 1,316 (39.5%) |
Occupancy by Educational Attainment in Somers
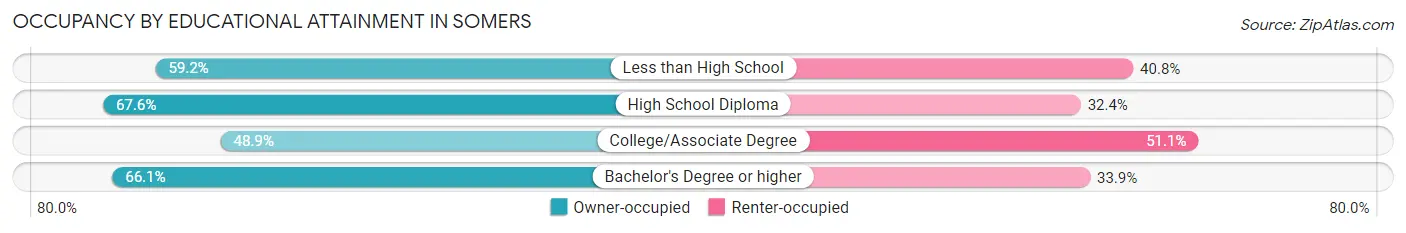
| Household Size | Owner-occupied | Renter-occupied |
| Less than High School | 109 (59.2%) | 75 (40.8%) |
| High School Diploma | 454 (67.6%) | 218 (32.4%) |
| College/Associate Degree | 521 (48.9%) | 544 (51.1%) |
| Bachelor's Degree or higher | 933 (66.1%) | 479 (33.9%) |
Occupancy by Age of Householder in Somers
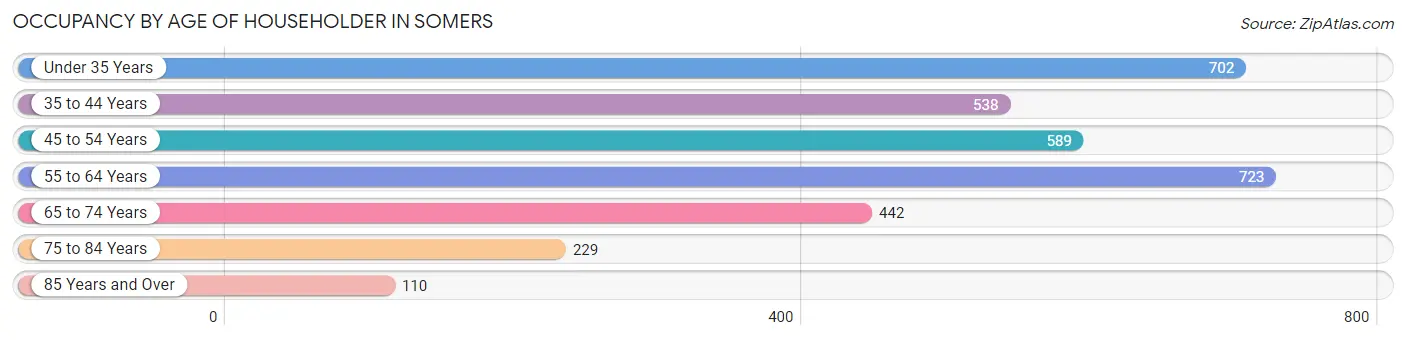
| Age Bracket | # Households | % Households |
| Under 35 Years | 702 | 21.1% |
| 35 to 44 Years | 538 | 16.1% |
| 45 to 54 Years | 589 | 17.7% |
| 55 to 64 Years | 723 | 21.7% |
| 65 to 74 Years | 442 | 13.3% |
| 75 to 84 Years | 229 | 6.9% |
| 85 Years and Over | 110 | 3.3% |
| Total | 3,333 | 100.0% |
Housing Finances in Somers
Median Income by Occupancy in Somers
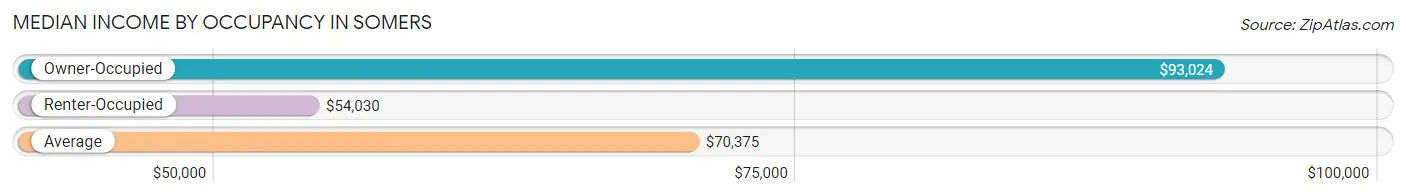
| Occupancy Type | # Households | Median Income |
| Owner-Occupied | 2,017 (60.5%) | $93,024 |
| Renter-Occupied | 1,316 (39.5%) | $54,030 |
| Average | 3,333 (100.0%) | $70,375 |
Occupancy by Householder Income Bracket in Somers
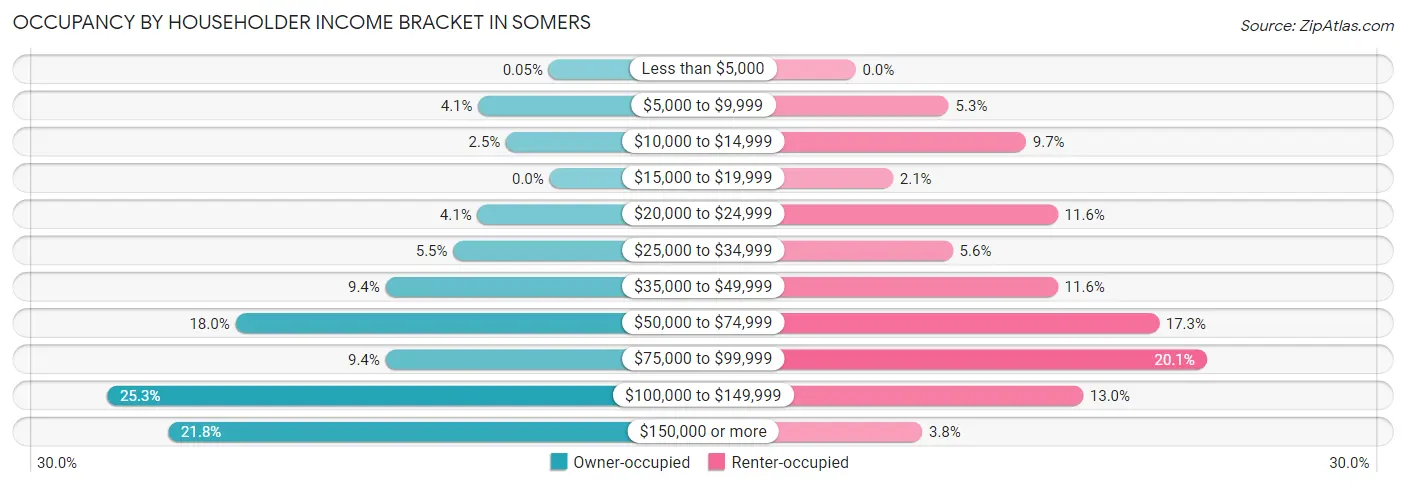
| Income Bracket | Owner-occupied | Renter-occupied |
| Less than $5,000 | 1 (0.1%) | 0 (0.0%) |
| $5,000 to $9,999 | 82 (4.1%) | 70 (5.3%) |
| $10,000 to $14,999 | 50 (2.5%) | 128 (9.7%) |
| $15,000 to $19,999 | 0 (0.0%) | 28 (2.1%) |
| $20,000 to $24,999 | 83 (4.1%) | 152 (11.6%) |
| $25,000 to $34,999 | 111 (5.5%) | 73 (5.6%) |
| $35,000 to $49,999 | 189 (9.4%) | 152 (11.6%) |
| $50,000 to $74,999 | 362 (17.9%) | 228 (17.3%) |
| $75,000 to $99,999 | 189 (9.4%) | 264 (20.1%) |
| $100,000 to $149,999 | 510 (25.3%) | 171 (13.0%) |
| $150,000 or more | 440 (21.8%) | 50 (3.8%) |
| Total | 2,017 (100.0%) | 1,316 (100.0%) |
Monthly Housing Cost Tiers in Somers
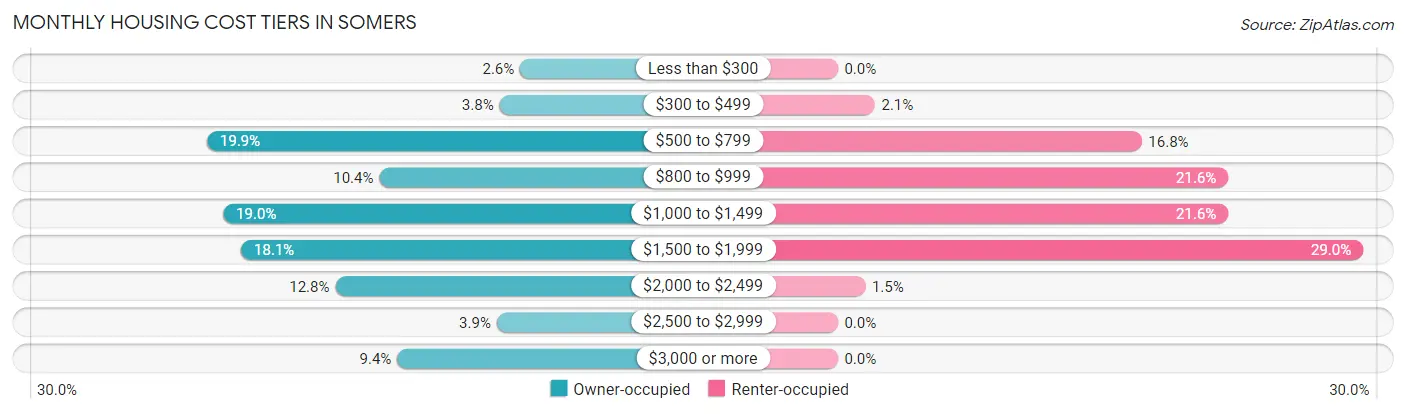
| Monthly Cost | Owner-occupied | Renter-occupied |
| Less than $300 | 53 (2.6%) | 0 (0.0%) |
| $300 to $499 | 76 (3.8%) | 27 (2.1%) |
| $500 to $799 | 402 (19.9%) | 221 (16.8%) |
| $800 to $999 | 210 (10.4%) | 284 (21.6%) |
| $1,000 to $1,499 | 384 (19.0%) | 284 (21.6%) |
| $1,500 to $1,999 | 364 (18.0%) | 382 (29.0%) |
| $2,000 to $2,499 | 259 (12.8%) | 20 (1.5%) |
| $2,500 to $2,999 | 79 (3.9%) | 0 (0.0%) |
| $3,000 or more | 190 (9.4%) | 0 (0.0%) |
| Total | 2,017 (100.0%) | 1,316 (100.0%) |
Physical Housing Characteristics in Somers
Housing Structures in Somers
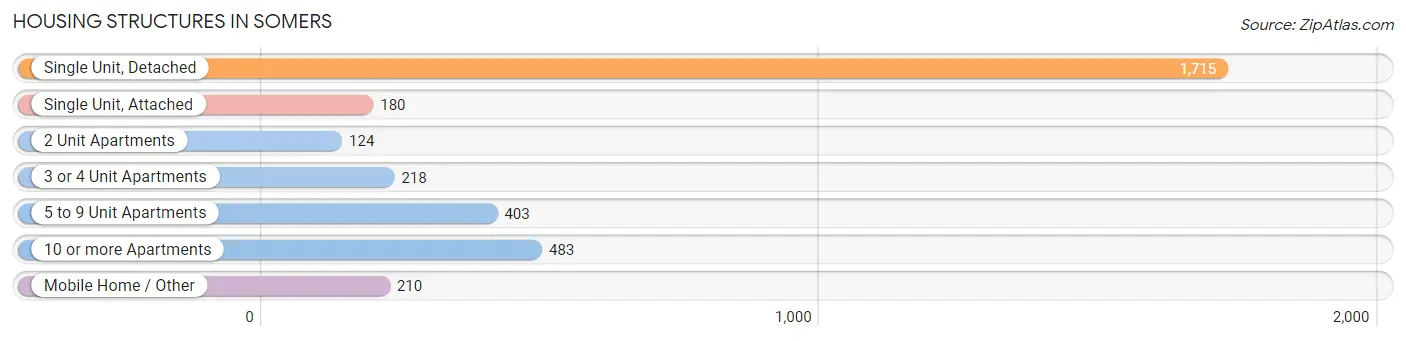
| Structure Type | # Housing Units | % Housing Units |
| Single Unit, Detached | 1,715 | 51.5% |
| Single Unit, Attached | 180 | 5.4% |
| 2 Unit Apartments | 124 | 3.7% |
| 3 or 4 Unit Apartments | 218 | 6.5% |
| 5 to 9 Unit Apartments | 403 | 12.1% |
| 10 or more Apartments | 483 | 14.5% |
| Mobile Home / Other | 210 | 6.3% |
| Total | 3,333 | 100.0% |
Housing Structures by Occupancy in Somers
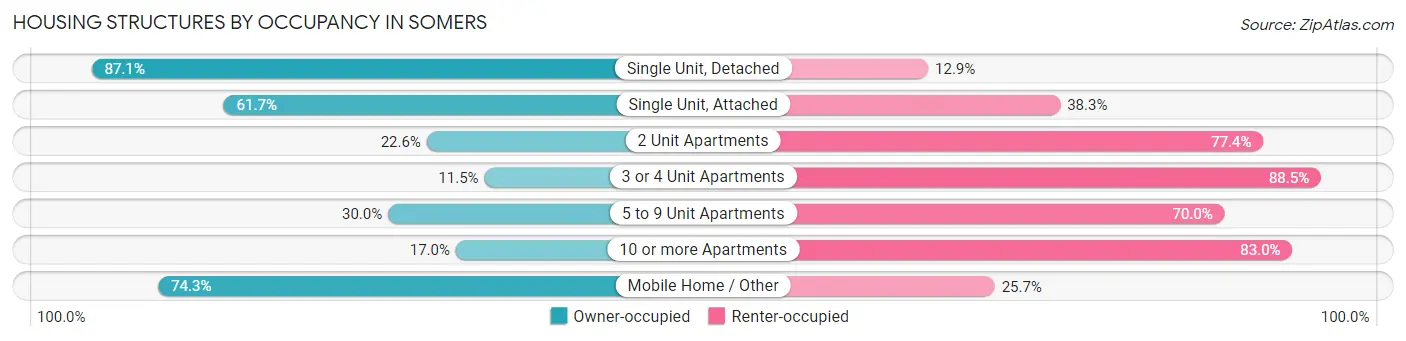
| Structure Type | Owner-occupied | Renter-occupied |
| Single Unit, Detached | 1,494 (87.1%) | 221 (12.9%) |
| Single Unit, Attached | 111 (61.7%) | 69 (38.3%) |
| 2 Unit Apartments | 28 (22.6%) | 96 (77.4%) |
| 3 or 4 Unit Apartments | 25 (11.5%) | 193 (88.5%) |
| 5 to 9 Unit Apartments | 121 (30.0%) | 282 (70.0%) |
| 10 or more Apartments | 82 (17.0%) | 401 (83.0%) |
| Mobile Home / Other | 156 (74.3%) | 54 (25.7%) |
| Total | 2,017 (60.5%) | 1,316 (39.5%) |
Housing Structures by Number of Rooms in Somers
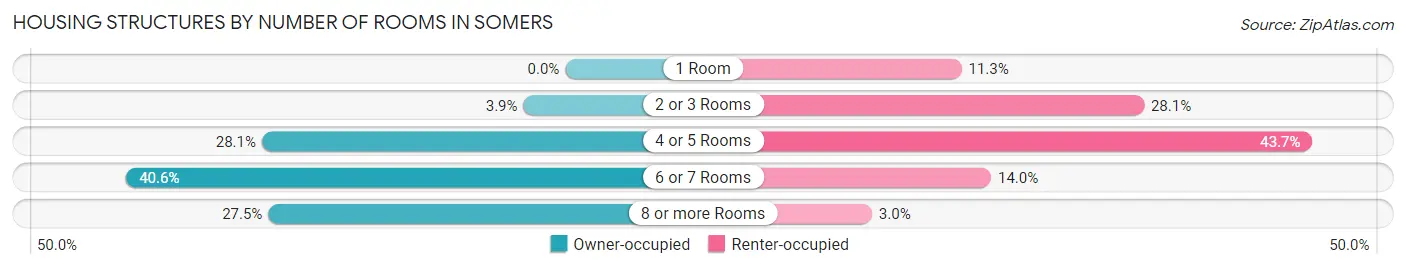
| Number of Rooms | Owner-occupied | Renter-occupied |
| 1 Room | 0 (0.0%) | 148 (11.3%) |
| 2 or 3 Rooms | 78 (3.9%) | 370 (28.1%) |
| 4 or 5 Rooms | 566 (28.1%) | 575 (43.7%) |
| 6 or 7 Rooms | 819 (40.6%) | 184 (14.0%) |
| 8 or more Rooms | 554 (27.5%) | 39 (3.0%) |
| Total | 2,017 (100.0%) | 1,316 (100.0%) |
Housing Structure by Heating Type in Somers
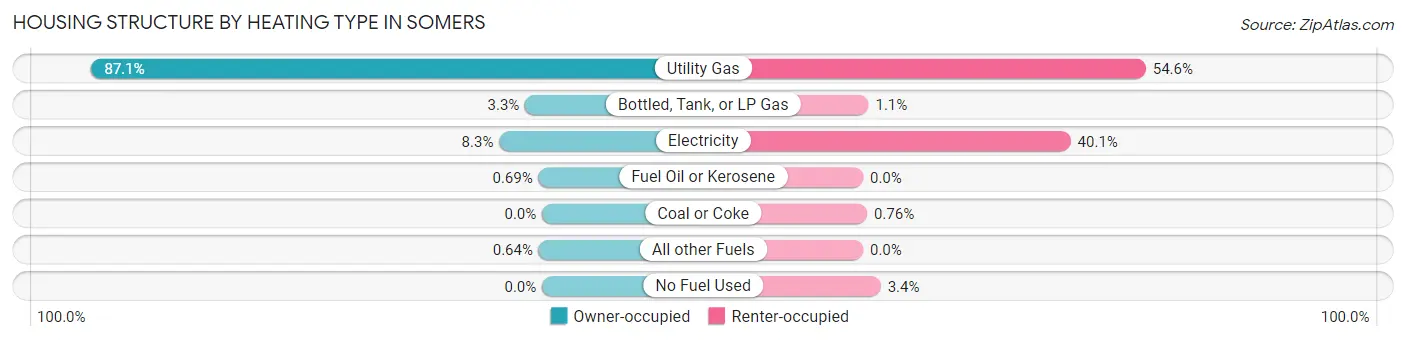
| Heating Type | Owner-occupied | Renter-occupied |
| Utility Gas | 1,757 (87.1%) | 719 (54.6%) |
| Bottled, Tank, or LP Gas | 66 (3.3%) | 14 (1.1%) |
| Electricity | 167 (8.3%) | 528 (40.1%) |
| Fuel Oil or Kerosene | 14 (0.7%) | 0 (0.0%) |
| Coal or Coke | 0 (0.0%) | 10 (0.8%) |
| All other Fuels | 13 (0.6%) | 0 (0.0%) |
| No Fuel Used | 0 (0.0%) | 45 (3.4%) |
| Total | 2,017 (100.0%) | 1,316 (100.0%) |
Household Vehicle Usage in Somers
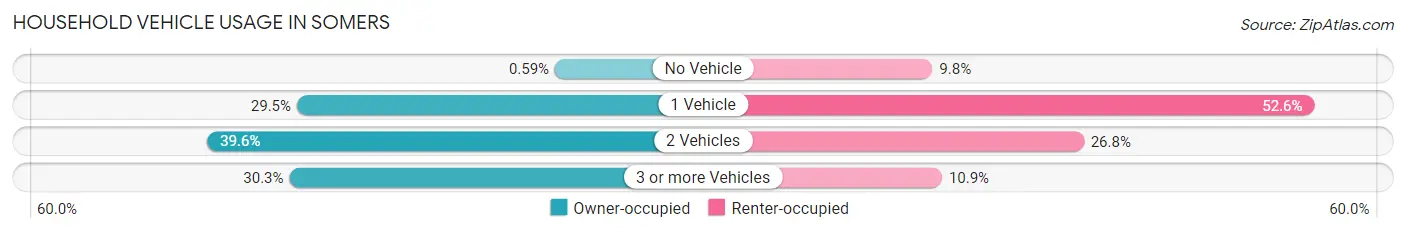
| Vehicles per Household | Owner-occupied | Renter-occupied |
| No Vehicle | 12 (0.6%) | 129 (9.8%) |
| 1 Vehicle | 595 (29.5%) | 692 (52.6%) |
| 2 Vehicles | 798 (39.6%) | 352 (26.8%) |
| 3 or more Vehicles | 612 (30.3%) | 143 (10.9%) |
| Total | 2,017 (100.0%) | 1,316 (100.0%) |
Real Estate & Mortgages in Somers
Real Estate and Mortgage Overview in Somers
| Characteristic | Without Mortgage | With Mortgage |
| Housing Units | 837 | 1,180 |
| Median Property Value | $241,000 | $285,500 |
| Median Household Income | $57,943 | $354 |
| Monthly Housing Costs | $687 | $190 |
| Real Estate Taxes | $4,010 | $14 |
Property Value by Mortgage Status in Somers
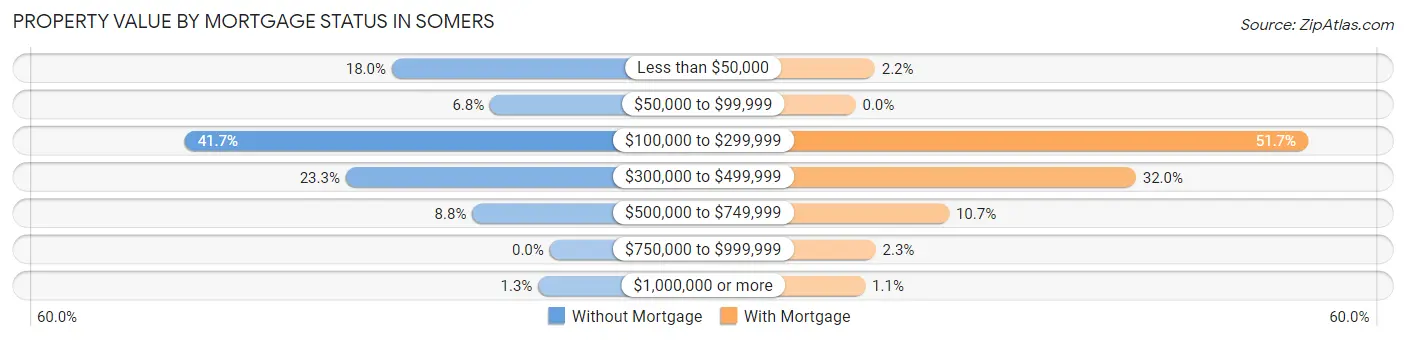
| Property Value | Without Mortgage | With Mortgage |
| Less than $50,000 | 151 (18.0%) | 26 (2.2%) |
| $50,000 to $99,999 | 57 (6.8%) | 0 (0.0%) |
| $100,000 to $299,999 | 349 (41.7%) | 610 (51.7%) |
| $300,000 to $499,999 | 195 (23.3%) | 378 (32.0%) |
| $500,000 to $749,999 | 74 (8.8%) | 126 (10.7%) |
| $750,000 to $999,999 | 0 (0.0%) | 27 (2.3%) |
| $1,000,000 or more | 11 (1.3%) | 13 (1.1%) |
| Total | 837 (100.0%) | 1,180 (100.0%) |
Household Income by Mortgage Status in Somers
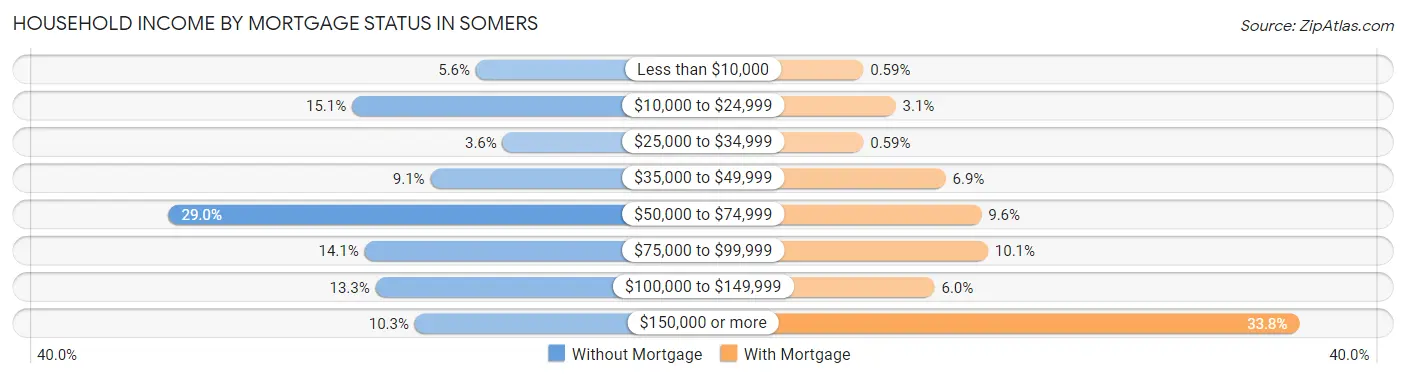
| Household Income | Without Mortgage | With Mortgage |
| Less than $10,000 | 47 (5.6%) | 7 (0.6%) |
| $10,000 to $24,999 | 126 (15.0%) | 36 (3.0%) |
| $25,000 to $34,999 | 30 (3.6%) | 7 (0.6%) |
| $35,000 to $49,999 | 76 (9.1%) | 81 (6.9%) |
| $50,000 to $74,999 | 243 (29.0%) | 113 (9.6%) |
| $75,000 to $99,999 | 118 (14.1%) | 119 (10.1%) |
| $100,000 to $149,999 | 111 (13.3%) | 71 (6.0%) |
| $150,000 or more | 86 (10.3%) | 399 (33.8%) |
| Total | 837 (100.0%) | 1,180 (100.0%) |
Property Value to Household Income Ratio in Somers
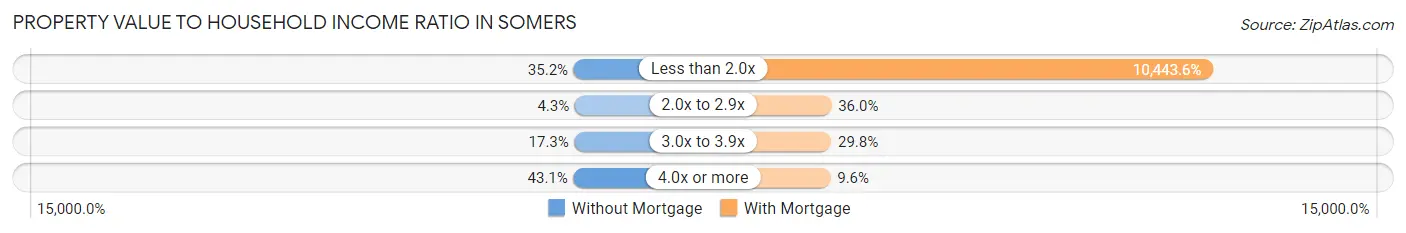
| Value-to-Income Ratio | Without Mortgage | With Mortgage |
| Less than 2.0x | 295 (35.2%) | 123,235 (10,443.6%) |
| 2.0x to 2.9x | 36 (4.3%) | 425 (36.0%) |
| 3.0x to 3.9x | 145 (17.3%) | 352 (29.8%) |
| 4.0x or more | 361 (43.1%) | 113 (9.6%) |
| Total | 837 (100.0%) | 1,180 (100.0%) |
Real Estate Taxes by Mortgage Status in Somers
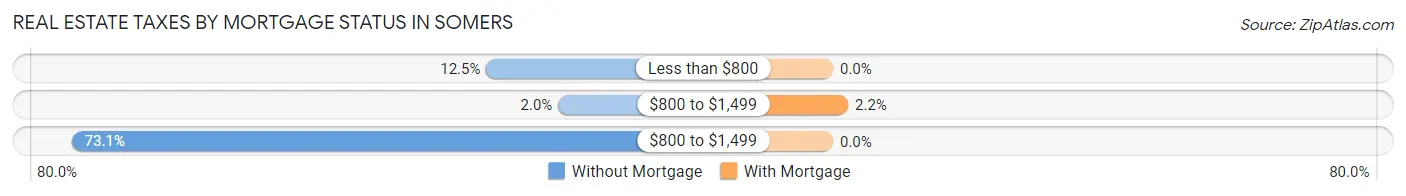
| Property Taxes | Without Mortgage | With Mortgage |
| Less than $800 | 105 (12.5%) | 0 (0.0%) |
| $800 to $1,499 | 17 (2.0%) | 26 (2.2%) |
| $800 to $1,499 | 612 (73.1%) | 0 (0.0%) |
| Total | 837 (100.0%) | 1,180 (100.0%) |
Health & Disability in Somers
Health Insurance Coverage by Age in Somers
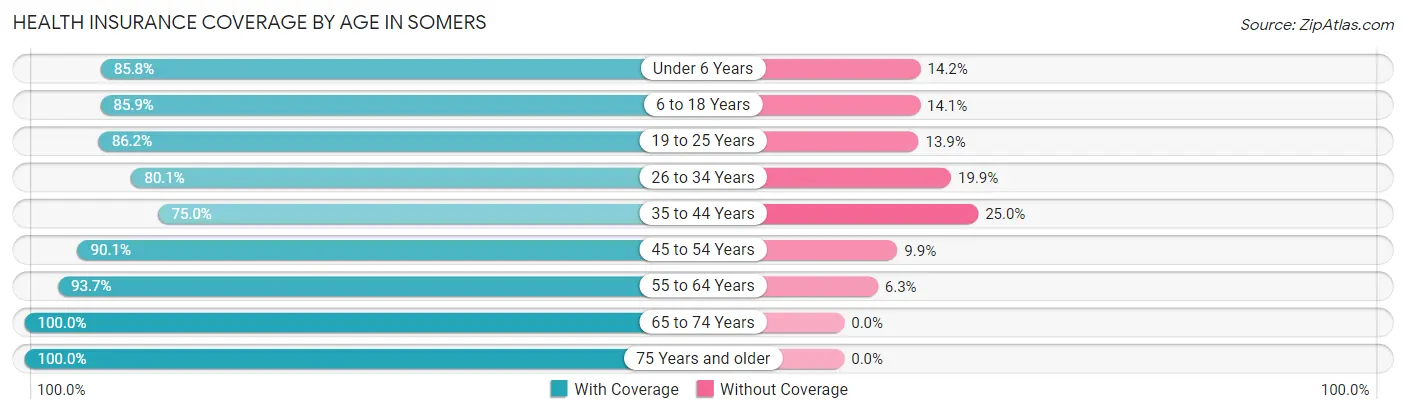
| Age Bracket | With Coverage | Without Coverage |
| Under 6 Years | 416 (85.8%) | 69 (14.2%) |
| 6 to 18 Years | 1,172 (85.9%) | 193 (14.1%) |
| 19 to 25 Years | 1,201 (86.2%) | 193 (13.9%) |
| 26 to 34 Years | 595 (80.1%) | 148 (19.9%) |
| 35 to 44 Years | 694 (75.0%) | 231 (25.0%) |
| 45 to 54 Years | 837 (90.1%) | 92 (9.9%) |
| 55 to 64 Years | 1,169 (93.7%) | 78 (6.3%) |
| 65 to 74 Years | 662 (100.0%) | 0 (0.0%) |
| 75 Years and older | 497 (100.0%) | 0 (0.0%) |
| Total | 7,243 (87.8%) | 1,004 (12.2%) |
Health Insurance Coverage by Citizenship Status in Somers
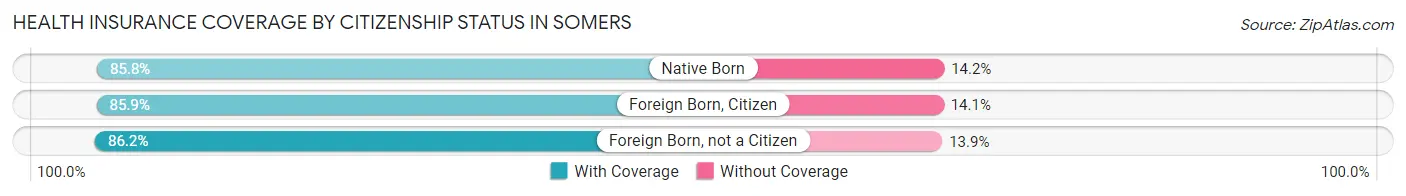
| Citizenship Status | With Coverage | Without Coverage |
| Native Born | 416 (85.8%) | 69 (14.2%) |
| Foreign Born, Citizen | 1,172 (85.9%) | 193 (14.1%) |
| Foreign Born, not a Citizen | 1,201 (86.2%) | 193 (13.9%) |
Health Insurance Coverage by Household Income in Somers
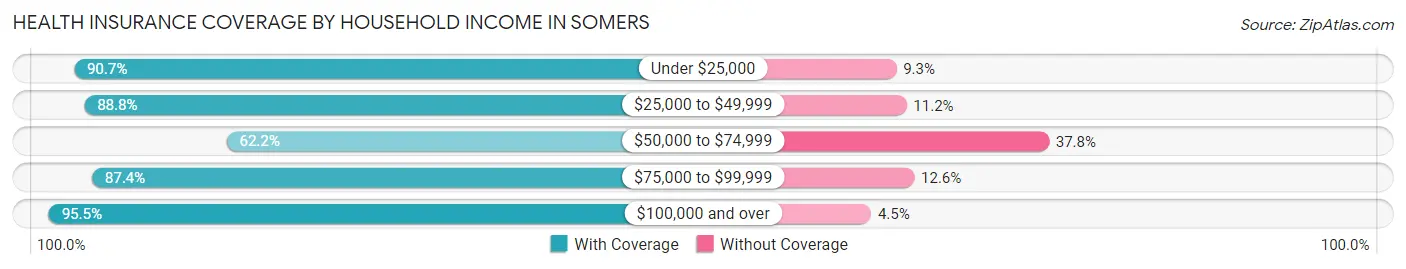
| Household Income | With Coverage | Without Coverage |
| Under $25,000 | 813 (90.7%) | 83 (9.3%) |
| $25,000 to $49,999 | 692 (88.8%) | 87 (11.2%) |
| $50,000 to $74,999 | 744 (62.2%) | 453 (37.8%) |
| $75,000 to $99,999 | 811 (87.4%) | 117 (12.6%) |
| $100,000 and over | 3,689 (95.5%) | 175 (4.5%) |
Public vs Private Health Insurance Coverage by Age in Somers
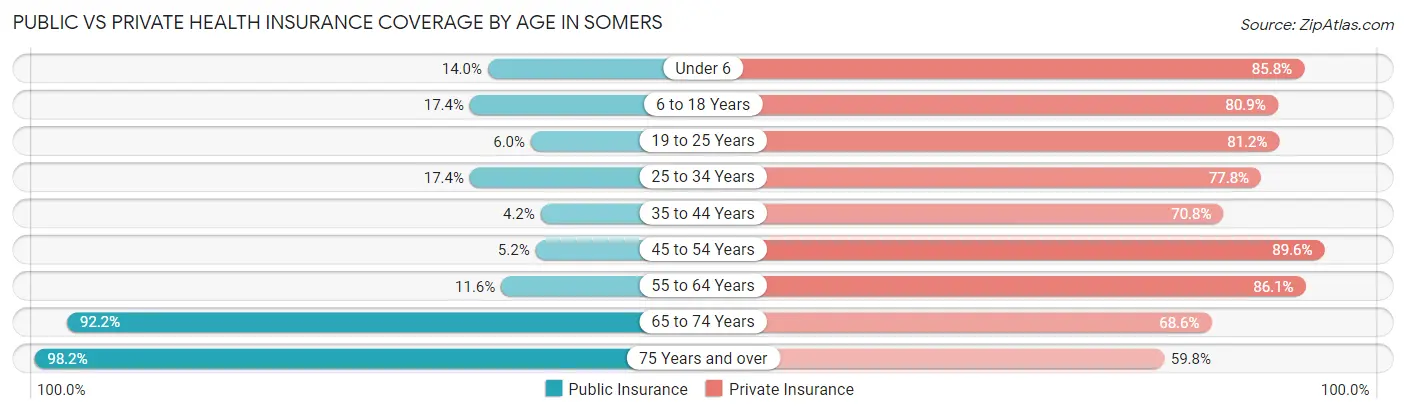
| Age Bracket | Public Insurance | Private Insurance |
| Under 6 | 68 (14.0%) | 416 (85.8%) |
| 6 to 18 Years | 237 (17.4%) | 1,104 (80.9%) |
| 19 to 25 Years | 84 (6.0%) | 1,132 (81.2%) |
| 25 to 34 Years | 129 (17.4%) | 578 (77.8%) |
| 35 to 44 Years | 39 (4.2%) | 655 (70.8%) |
| 45 to 54 Years | 48 (5.2%) | 832 (89.6%) |
| 55 to 64 Years | 144 (11.6%) | 1,073 (86.1%) |
| 65 to 74 Years | 610 (92.1%) | 454 (68.6%) |
| 75 Years and over | 488 (98.2%) | 297 (59.8%) |
| Total | 1,847 (22.4%) | 6,541 (79.3%) |
Disability Status by Sex by Age in Somers
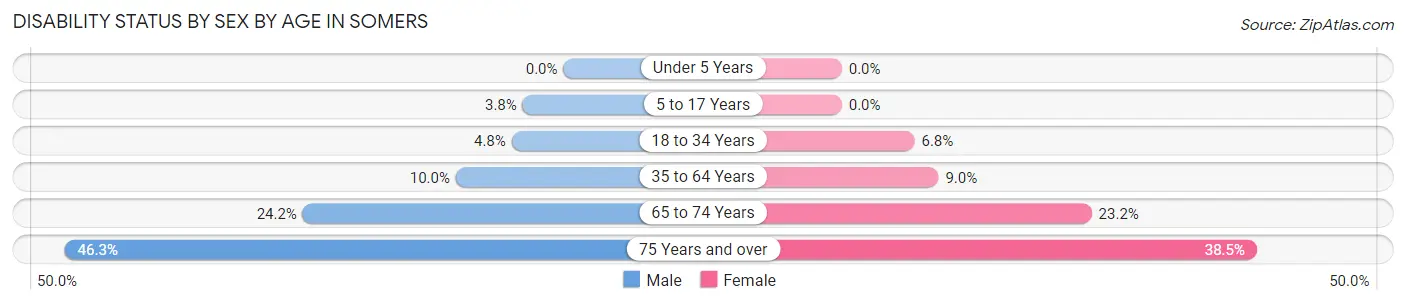
| Age Bracket | Male | Female |
| Under 5 Years | 0 (0.0%) | 0 (0.0%) |
| 5 to 17 Years | 27 (3.8%) | 0 (0.0%) |
| 18 to 34 Years | 45 (4.8%) | 96 (6.8%) |
| 35 to 64 Years | 156 (10.0%) | 138 (9.0%) |
| 65 to 74 Years | 60 (24.2%) | 96 (23.2%) |
| 75 Years and over | 87 (46.3%) | 119 (38.5%) |
Disability Class by Sex by Age in Somers
Disability Class: Hearing Difficulty
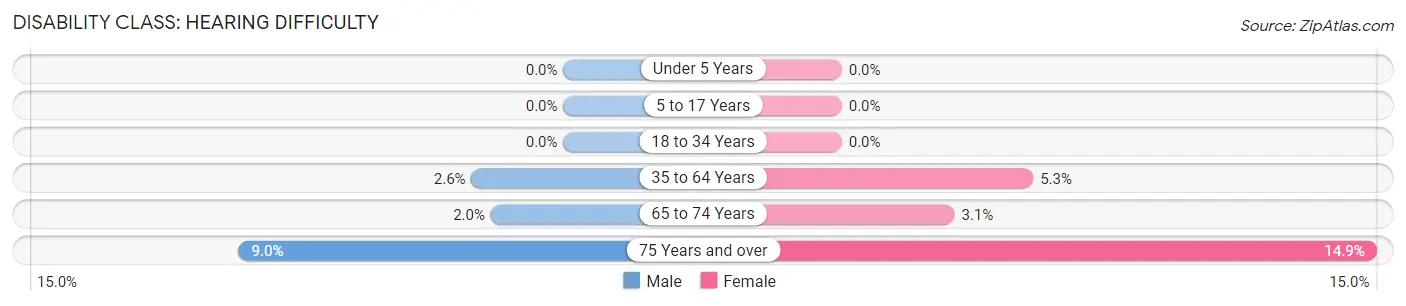
| Age Bracket | Male | Female |
| Under 5 Years | 0 (0.0%) | 0 (0.0%) |
| 5 to 17 Years | 0 (0.0%) | 0 (0.0%) |
| 18 to 34 Years | 0 (0.0%) | 0 (0.0%) |
| 35 to 64 Years | 40 (2.6%) | 82 (5.3%) |
| 65 to 74 Years | 5 (2.0%) | 13 (3.1%) |
| 75 Years and over | 17 (9.0%) | 46 (14.9%) |
Disability Class: Vision Difficulty
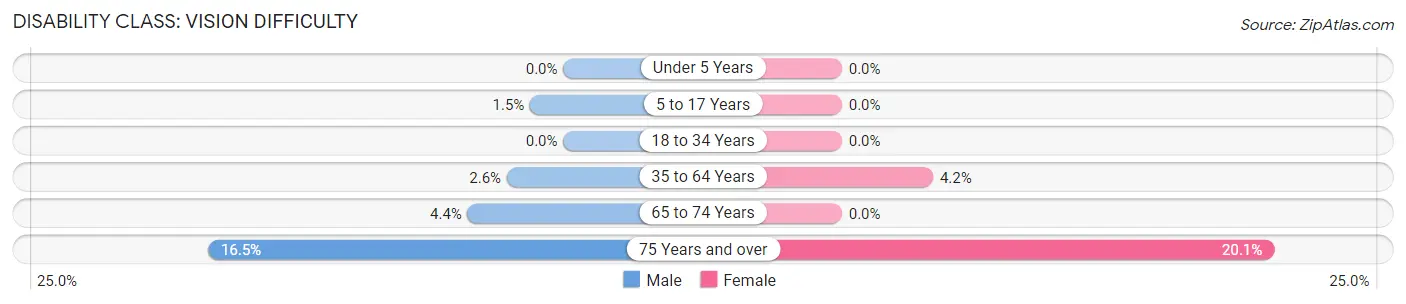
| Age Bracket | Male | Female |
| Under 5 Years | 0 (0.0%) | 0 (0.0%) |
| 5 to 17 Years | 11 (1.5%) | 0 (0.0%) |
| 18 to 34 Years | 0 (0.0%) | 0 (0.0%) |
| 35 to 64 Years | 41 (2.6%) | 65 (4.2%) |
| 65 to 74 Years | 11 (4.4%) | 0 (0.0%) |
| 75 Years and over | 31 (16.5%) | 62 (20.1%) |
Disability Class: Cognitive Difficulty
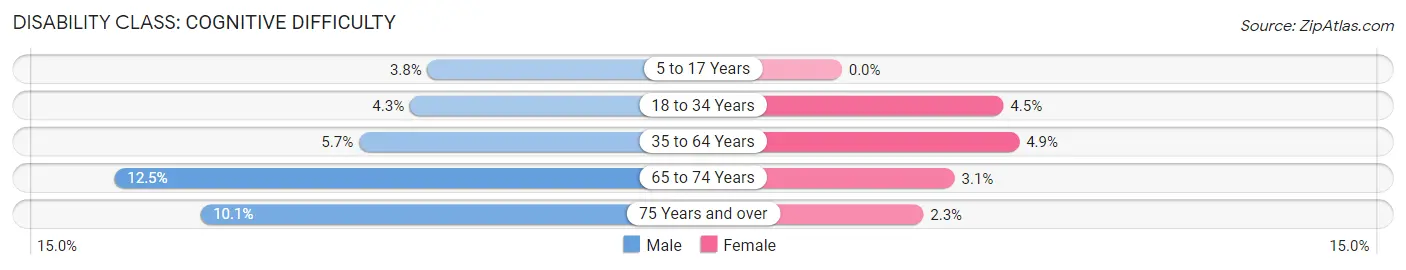
| Age Bracket | Male | Female |
| 5 to 17 Years | 27 (3.8%) | 0 (0.0%) |
| 18 to 34 Years | 40 (4.3%) | 64 (4.5%) |
| 35 to 64 Years | 89 (5.7%) | 76 (4.9%) |
| 65 to 74 Years | 31 (12.5%) | 13 (3.1%) |
| 75 Years and over | 19 (10.1%) | 7 (2.3%) |
Disability Class: Ambulatory Difficulty
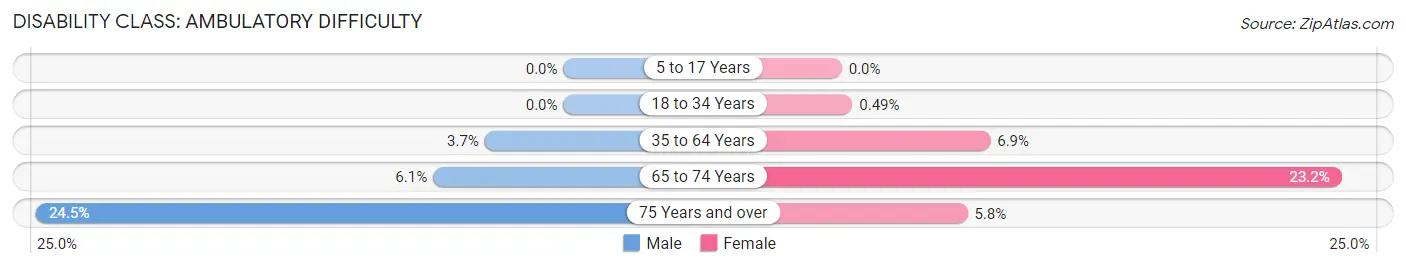
| Age Bracket | Male | Female |
| 5 to 17 Years | 0 (0.0%) | 0 (0.0%) |
| 18 to 34 Years | 0 (0.0%) | 7 (0.5%) |
| 35 to 64 Years | 57 (3.6%) | 106 (6.9%) |
| 65 to 74 Years | 15 (6.0%) | 96 (23.2%) |
| 75 Years and over | 46 (24.5%) | 18 (5.8%) |
Disability Class: Self-Care Difficulty
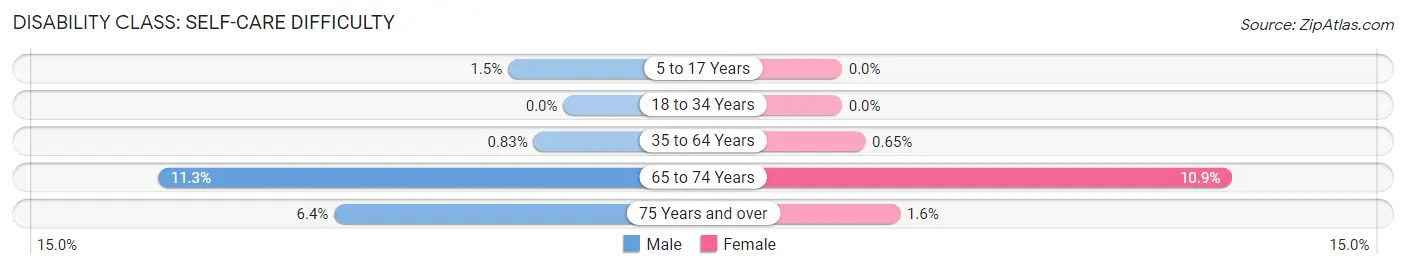
| Age Bracket | Male | Female |
| 5 to 17 Years | 11 (1.5%) | 0 (0.0%) |
| 18 to 34 Years | 0 (0.0%) | 0 (0.0%) |
| 35 to 64 Years | 13 (0.8%) | 10 (0.6%) |
| 65 to 74 Years | 28 (11.3%) | 45 (10.9%) |
| 75 Years and over | 12 (6.4%) | 5 (1.6%) |
Technology Access in Somers
Computing Device Access in Somers
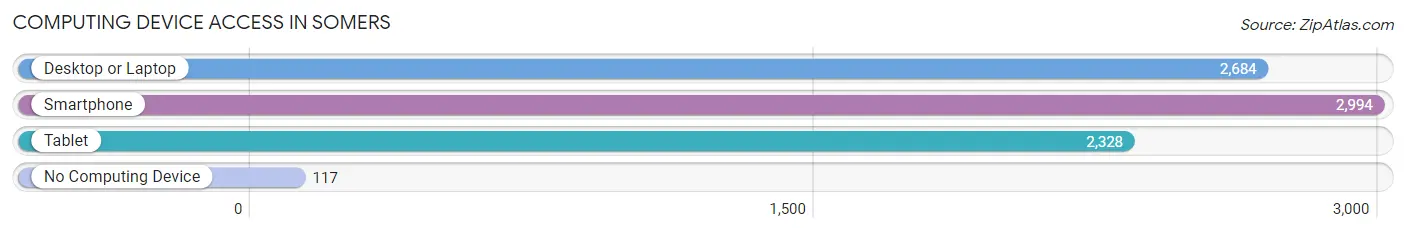
| Device Type | # Households | % Households |
| Desktop or Laptop | 2,684 | 80.5% |
| Smartphone | 2,994 | 89.8% |
| Tablet | 2,328 | 69.9% |
| No Computing Device | 117 | 3.5% |
| Total | 3,333 | 100.0% |
Internet Access in Somers
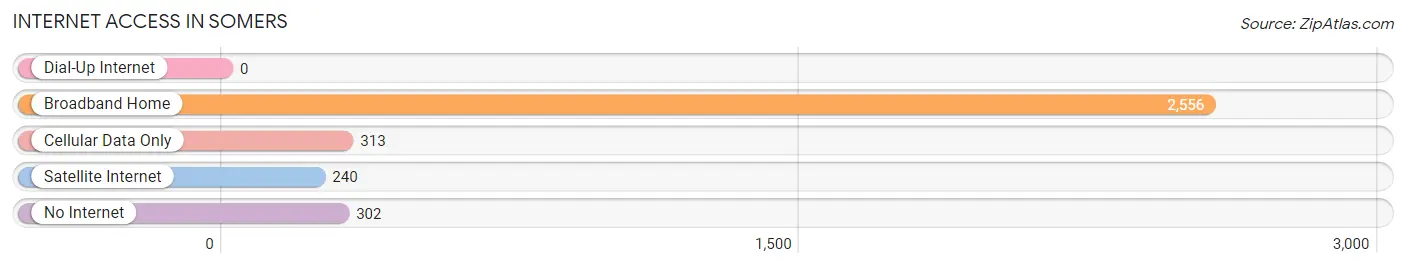
| Internet Type | # Households | % Households |
| Dial-Up Internet | 0 | 0.0% |
| Broadband Home | 2,556 | 76.7% |
| Cellular Data Only | 313 | 9.4% |
| Satellite Internet | 240 | 7.2% |
| No Internet | 302 | 9.1% |
| Total | 3,333 | 100.0% |
Somers Summary
Somers, Wisconsin is a small village located in Kenosha County, Wisconsin. It is situated on the western shore of Lake Michigan, about 25 miles south of Milwaukee. The village has a population of approximately 8,000 people and is part of the Milwaukee metropolitan area.
History
Somers was first settled in 1836 by a group of settlers from New York. The village was originally known as “Somersville” and was named after the Somers family who were among the first settlers. The village was incorporated in 1891 and was officially named “Somers”.
In the late 19th century, Somers was a popular summer resort destination for wealthy Chicagoans. The village was known for its beautiful beaches and its many resorts. In the early 20th century, the village was home to a number of factories, including a brickyard, a canning factory, and a paper mill.
Geography
Somers is located in southeastern Wisconsin, on the western shore of Lake Michigan. The village is situated on the banks of the Pike River, which flows into the lake. The village is surrounded by rolling hills and is located in the Kettle Moraine State Forest.
The village has a total area of 4.2 square miles, of which 0.2 square miles is water. The village is located at an elevation of 690 feet above sea level.
Economy
Somers’ economy is largely based on tourism and manufacturing. The village is home to a number of resorts and hotels, as well as several restaurants and bars. The village is also home to a number of manufacturing companies, including a paper mill, a canning factory, and a brickyard.
Demographics
As of the 2010 census, the village had a population of 8,000 people. The racial makeup of the village was 94.2% White, 1.2% African American, 0.7% Native American, 0.7% Asian, 0.1% Pacific Islander, 1.2% from other races, and 2.0% from two or more races. Hispanic or Latino of any race were 3.2% of the population.
The median income for a household in the village was $50,000, and the median income for a family was $60,000. The per capita income for the village was $25,000. About 8.2% of families and 10.2% of the population were below the poverty line, including 14.2% of those under age 18 and 5.2% of those age 65 or over.
Common Questions
What is Per Capita Income in Somers?
Per Capita income in Somers is $42,057.
What is the Median Family Income in Somers?
Median Family Income in Somers is $101,031.
What is the Median Household income in Somers?
Median Household Income in Somers is $70,375.
What is Income or Wage Gap in Somers?
Income or Wage Gap in Somers is 21.8%.
Women in Somers earn 78.2 cents for every dollar earned by a man.
What is Inequality or Gini Index in Somers?
Inequality or Gini Index in Somers is 0.49.
What is the Total Population of Somers?
Total Population of Somers is 8,303.
What is the Total Male Population of Somers?
Total Male Population of Somers is 4,082.
What is the Total Female Population of Somers?
Total Female Population of Somers is 4,221.
What is the Ratio of Males per 100 Females in Somers?
There are 96.71 Males per 100 Females in Somers.
What is the Ratio of Females per 100 Males in Somers?
There are 103.41 Females per 100 Males in Somers.
What is the Median Population Age in Somers?
Median Population Age in Somers is 35.7 Years.
What is the Average Family Size in Somers
Average Family Size in Somers is 3.0 People.
What is the Average Household Size in Somers
Average Household Size in Somers is 2.3 People.
How Large is the Labor Force in Somers?
There are 4,376 People in the Labor Forcein in Somers.
What is the Percentage of People in the Labor Force in Somers?
64.1% of People are in the Labor Force in Somers.
What is the Unemployment Rate in Somers?
Unemployment Rate in Somers is 9.9%.