Bridge City, LA Map & Demographics
Bridge City Map
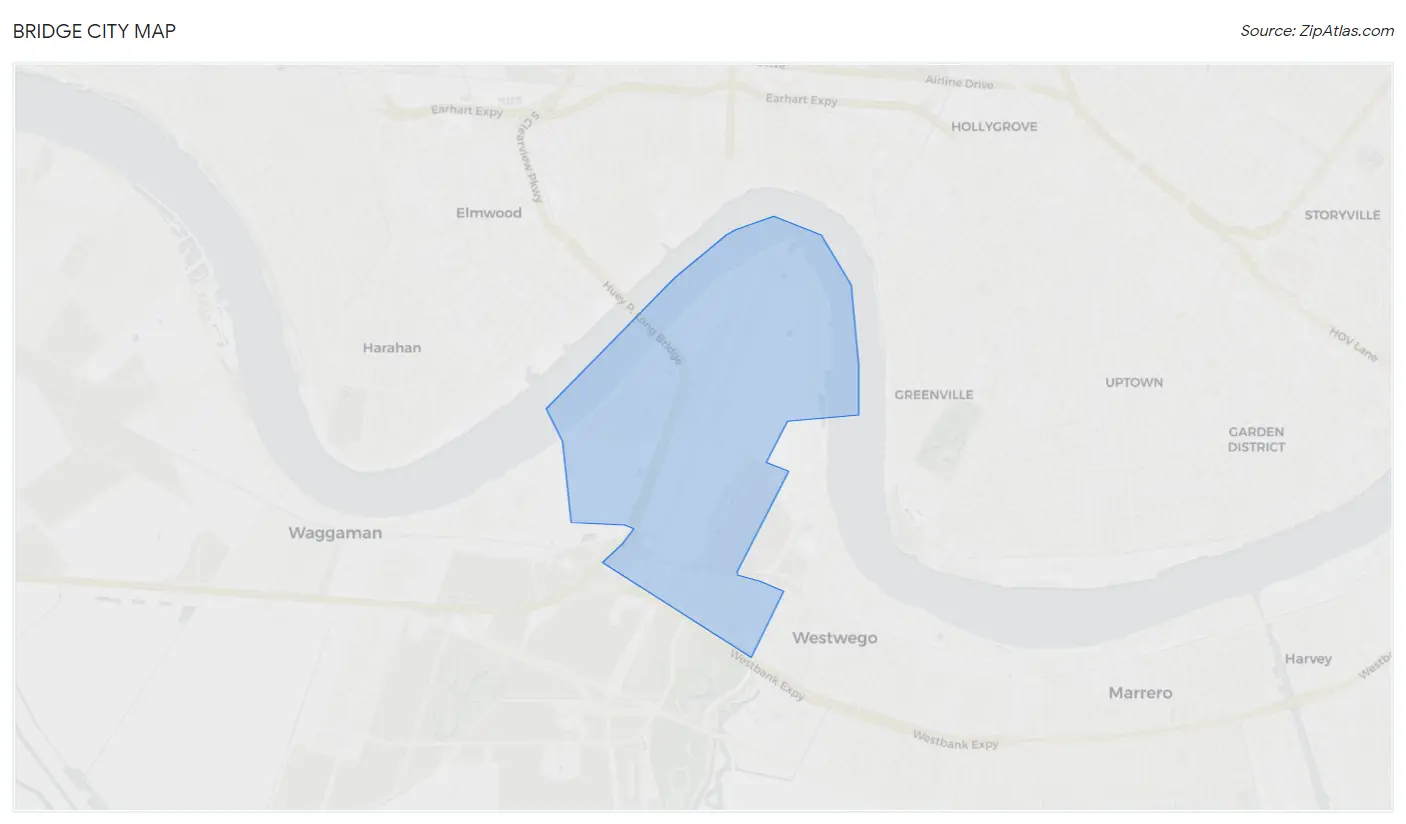
Bridge City Overview
$22,152
PER CAPITA INCOME
$56,628
AVG FAMILY INCOME
$50,282
AVG HOUSEHOLD INCOME
43.7%
WAGE / INCOME GAP [ % ]
56.3¢/ $1
WAGE / INCOME GAP [ $ ]
0.40
INEQUALITY / GINI INDEX
6,916
TOTAL POPULATION
3,631
MALE POPULATION
3,285
FEMALE POPULATION
110.53
MALES / 100 FEMALES
90.47
FEMALES / 100 MALES
32.7
MEDIAN AGE
3.4
AVG FAMILY SIZE
2.6
AVG HOUSEHOLD SIZE
3,038
LABOR FORCE [ PEOPLE ]
61.3%
PERCENT IN LABOR FORCE
10.9%
UNEMPLOYMENT RATE
Bridge City Area Codes
Income in Bridge City
Income Overview in Bridge City
Per Capita Income in Bridge City is $22,152, while median incomes of families and households are $56,628 and $50,282 respectively.
| Characteristic | Number | Measure |
| Per Capita Income | 6,916 | $22,152 |
| Median Family Income | 1,542 | $56,628 |
| Mean Family Income | 1,542 | $63,997 |
| Median Household Income | 2,582 | $50,282 |
| Mean Household Income | 2,582 | $58,415 |
| Income Deficit | 1,542 | $0 |
| Wage / Income Gap (%) | 6,916 | 43.73% |
| Wage / Income Gap ($) | 6,916 | 56.27¢ per $1 |
| Gini / Inequality Index | 6,916 | 0.40 |
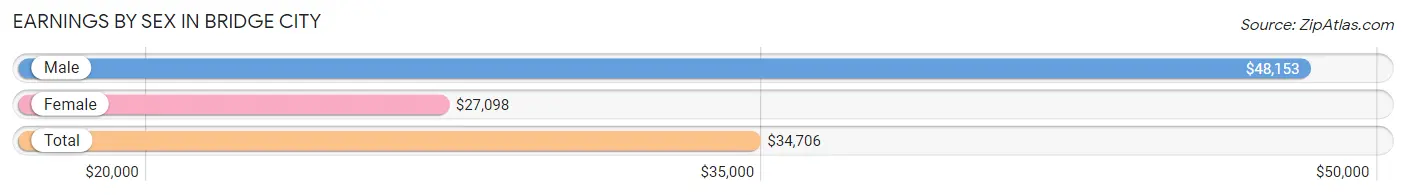
Earnings by Sex in Bridge City
Average Earnings in Bridge City are $34,706, $48,153 for men and $27,098 for women, a difference of 43.7%.
| Sex | Number | Average Earnings |
| Male | 1,684 (57.5%) | $48,153 |
| Female | 1,244 (42.5%) | $27,098 |
| Total | 2,928 (100.0%) | $34,706 |
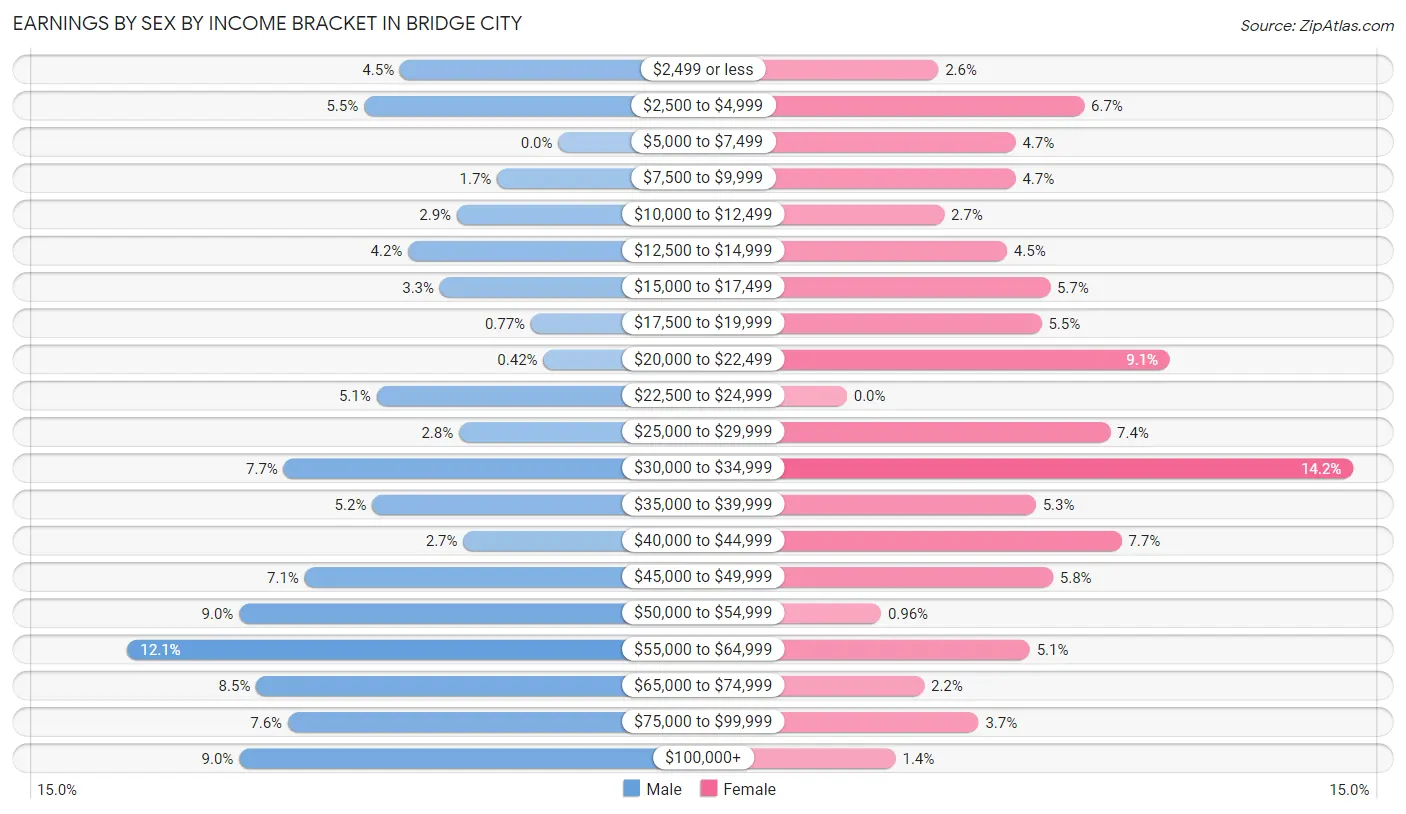
Earnings by Sex by Income Bracket in Bridge City
The most common earnings brackets in Bridge City are $55,000 to $64,999 for men (204 | 12.1%) and $30,000 to $34,999 for women (177 | 14.2%).
| Income | Male | Female |
| $2,499 or less | 75 (4.4%) | 32 (2.6%) |
| $2,500 to $4,999 | 92 (5.5%) | 83 (6.7%) |
| $5,000 to $7,499 | 0 (0.0%) | 59 (4.7%) |
| $7,500 to $9,999 | 29 (1.7%) | 59 (4.7%) |
| $10,000 to $12,499 | 48 (2.9%) | 34 (2.7%) |
| $12,500 to $14,999 | 71 (4.2%) | 56 (4.5%) |
| $15,000 to $17,499 | 56 (3.3%) | 71 (5.7%) |
| $17,500 to $19,999 | 13 (0.8%) | 68 (5.5%) |
| $20,000 to $22,499 | 7 (0.4%) | 113 (9.1%) |
| $22,500 to $24,999 | 86 (5.1%) | 0 (0.0%) |
| $25,000 to $29,999 | 47 (2.8%) | 92 (7.4%) |
| $30,000 to $34,999 | 130 (7.7%) | 177 (14.2%) |
| $35,000 to $39,999 | 88 (5.2%) | 66 (5.3%) |
| $40,000 to $44,999 | 45 (2.7%) | 96 (7.7%) |
| $45,000 to $49,999 | 120 (7.1%) | 72 (5.8%) |
| $50,000 to $54,999 | 151 (9.0%) | 12 (1.0%) |
| $55,000 to $64,999 | 204 (12.1%) | 64 (5.1%) |
| $65,000 to $74,999 | 143 (8.5%) | 27 (2.2%) |
| $75,000 to $99,999 | 128 (7.6%) | 46 (3.7%) |
| $100,000+ | 151 (9.0%) | 17 (1.4%) |
| Total | 1,684 (100.0%) | 1,244 (100.0%) |
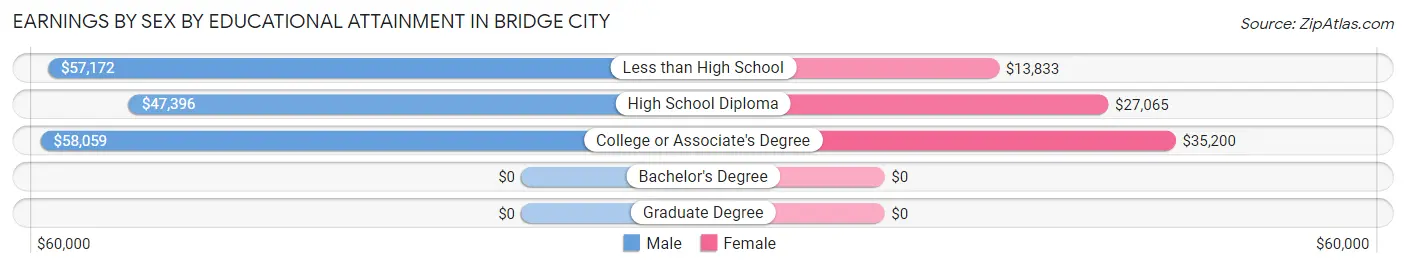
Earnings by Sex by Educational Attainment in Bridge City
Average earnings in Bridge City are $49,787 for men and $32,865 for women, a difference of 34.0%. Men with an educational attainment of college or associate's degree enjoy the highest average annual earnings of $58,059, while those with high school diploma education earn the least with $47,396. Women with an educational attainment of college or associate's degree earn the most with the average annual earnings of $35,200, while those with less than high school education have the smallest earnings of $13,833.
| Educational Attainment | Male Income | Female Income |
| Less than High School | $57,172 | $13,833 |
| High School Diploma | $47,396 | $27,065 |
| College or Associate's Degree | $58,059 | $35,200 |
| Bachelor's Degree | - | - |
| Graduate Degree | - | - |
| Total | $49,787 | $32,865 |
Family Income in Bridge City
Family Income Brackets in Bridge City
According to the Bridge City family income data, there are 412 families falling into the $50,000 to $74,999 income range, which is the most common income bracket and makes up 26.7% of all families. Conversely, the $10,000 to $14,999 income bracket is the least frequent group with only 22 families (1.4%) belonging to this category.
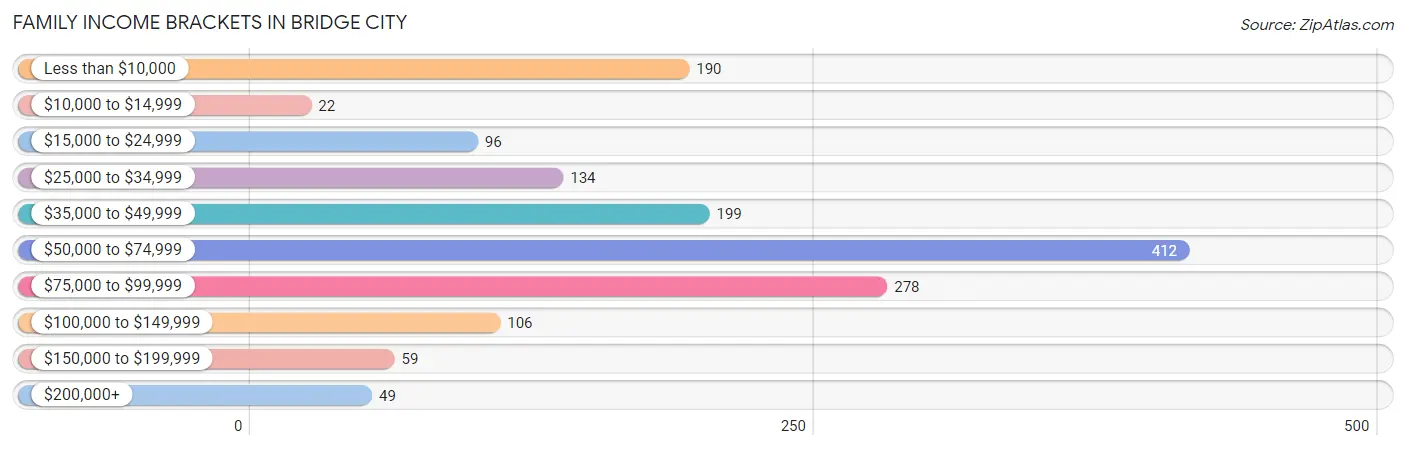
| Income Bracket | # Families | % Families |
| Less than $10,000 | 190 | 12.3% |
| $10,000 to $14,999 | 22 | 1.4% |
| $15,000 to $24,999 | 96 | 6.2% |
| $25,000 to $34,999 | 134 | 8.7% |
| $35,000 to $49,999 | 199 | 12.9% |
| $50,000 to $74,999 | 412 | 26.7% |
| $75,000 to $99,999 | 278 | 18.0% |
| $100,000 to $149,999 | 106 | 6.9% |
| $150,000 to $199,999 | 59 | 3.8% |
| $200,000+ | 49 | 3.2% |
Family Income by Famaliy Size in Bridge City
2-person families (745 | 48.3%) account for the highest median family income in Bridge City with $70,507 per family, while 2-person families (745 | 48.3%) have the highest median income of $35,254 per family member.
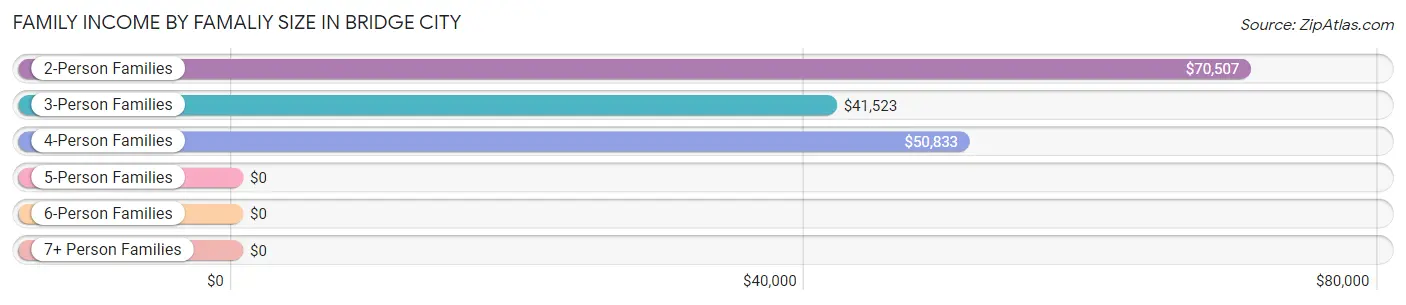
| Income Bracket | # Families | Median Income |
| 2-Person Families | 745 (48.3%) | $70,507 |
| 3-Person Families | 344 (22.3%) | $41,523 |
| 4-Person Families | 274 (17.8%) | $50,833 |
| 5-Person Families | 133 (8.6%) | $0 |
| 6-Person Families | 36 (2.3%) | $0 |
| 7+ Person Families | 10 (0.6%) | $0 |
| Total | 1,542 (100.0%) | $56,628 |
Family Income by Number of Earners in Bridge City
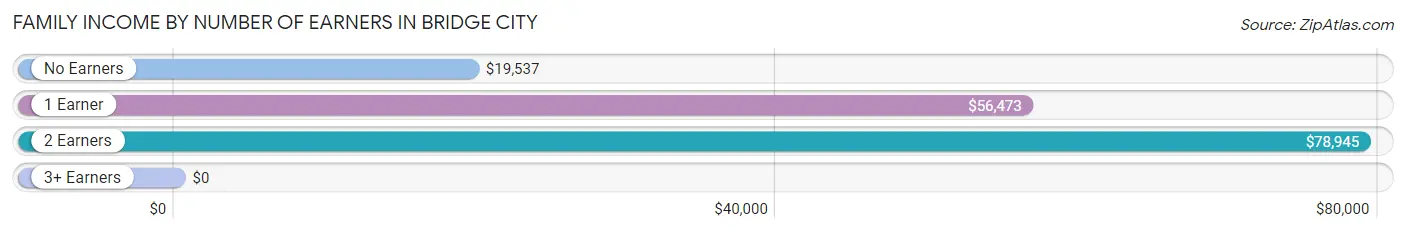
| Number of Earners | # Families | Median Income |
| No Earners | 278 (18.0%) | $19,537 |
| 1 Earner | 643 (41.7%) | $56,473 |
| 2 Earners | 501 (32.5%) | $78,945 |
| 3+ Earners | 120 (7.8%) | $0 |
| Total | 1,542 (100.0%) | $56,628 |
Household Income in Bridge City
Household Income Brackets in Bridge City
With 509 households falling in the category, the $50,000 to $74,999 income range is the most frequent in Bridge City, accounting for 19.7% of all households. In contrast, only 59 households (2.3%) fall into the $150,000 to $199,999 income bracket, making it the least populous group.
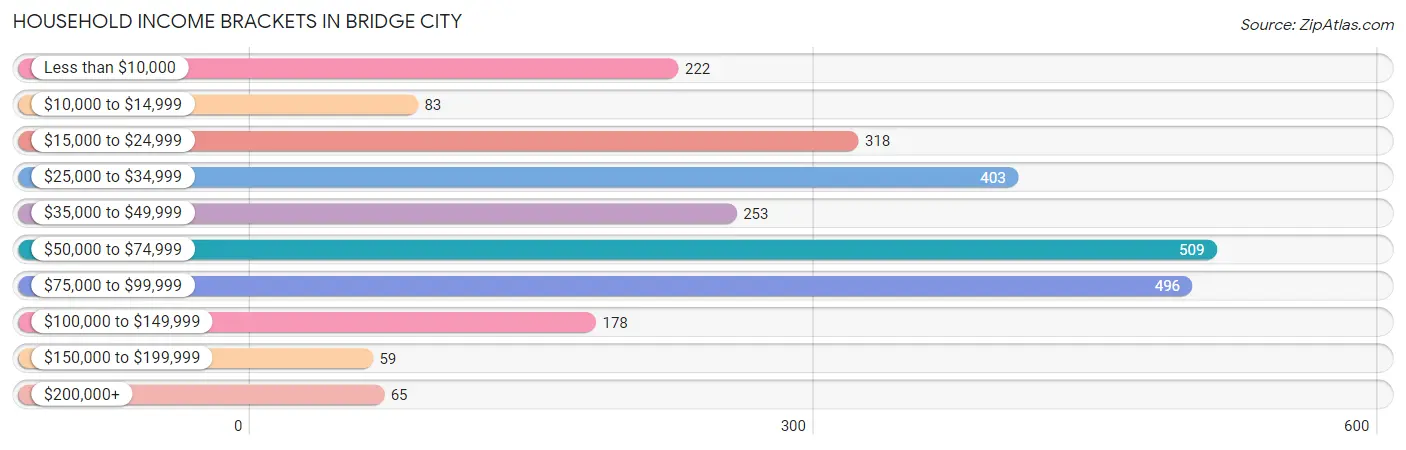
| Income Bracket | # Households | % Households |
| Less than $10,000 | 222 | 8.6% |
| $10,000 to $14,999 | 83 | 3.2% |
| $15,000 to $24,999 | 318 | 12.3% |
| $25,000 to $34,999 | 403 | 15.6% |
| $35,000 to $49,999 | 253 | 9.8% |
| $50,000 to $74,999 | 509 | 19.7% |
| $75,000 to $99,999 | 496 | 19.2% |
| $100,000 to $149,999 | 178 | 6.9% |
| $150,000 to $199,999 | 59 | 2.3% |
| $200,000+ | 65 | 2.5% |
Household Income by Householder Age in Bridge City
The median household income in Bridge City is $50,282, with the highest median household income of $65,128 found in the 45 to 64 years age bracket for the primary householder. A total of 1,034 households (40.1%) fall into this category. Meanwhile, the 15 to 24 years age bracket for the primary householder has the lowest median household income of $0, with 36 households (1.4%) in this group.
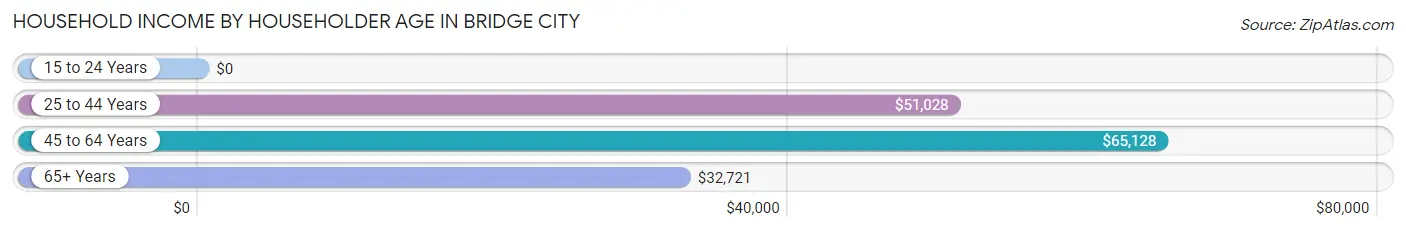
| Income Bracket | # Households | Median Income |
| 15 to 24 Years | 36 (1.4%) | $0 |
| 25 to 44 Years | 863 (33.4%) | $51,028 |
| 45 to 64 Years | 1,034 (40.1%) | $65,128 |
| 65+ Years | 649 (25.1%) | $32,721 |
| Total | 2,582 (100.0%) | $50,282 |
Poverty in Bridge City
Income Below Poverty by Sex and Age in Bridge City
With 19.6% poverty level for males and 39.0% for females among the residents of Bridge City, 12 to 14 year old males and 5 year old females are the most vulnerable to poverty, with 80 males (52.3%) and 40 females (97.6%) in their respective age groups living below the poverty level.
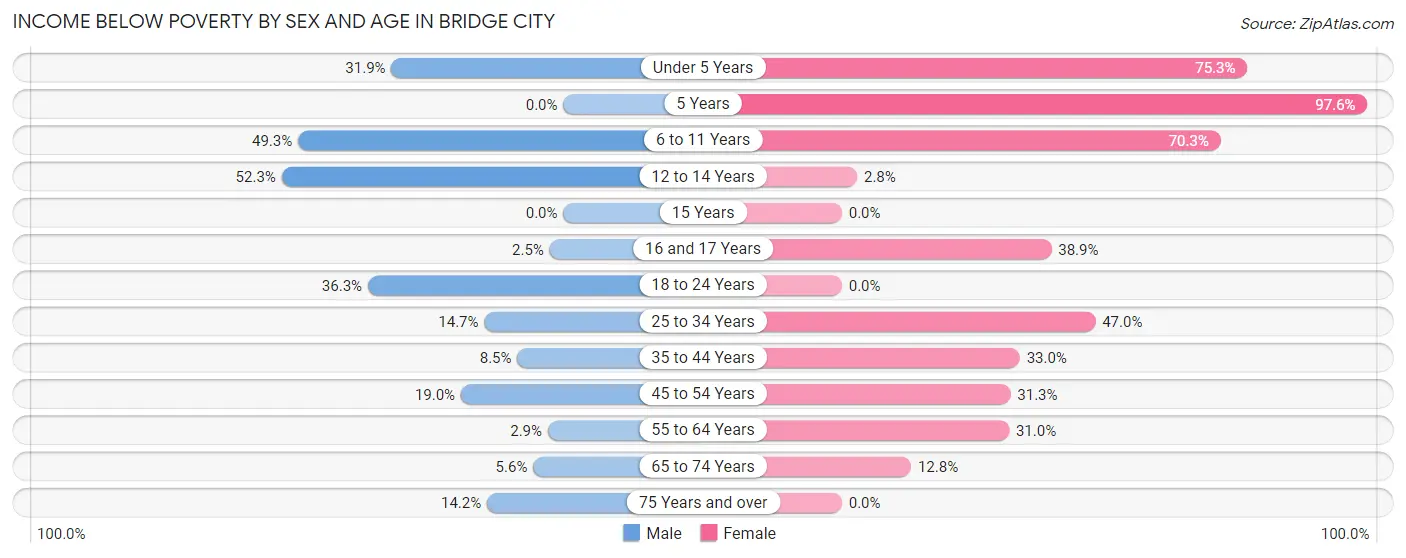
| Age Bracket | Male | Female |
| Under 5 Years | 105 (31.9%) | 140 (75.3%) |
| 5 Years | 0 (0.0%) | 40 (97.6%) |
| 6 to 11 Years | 196 (49.2%) | 429 (70.3%) |
| 12 to 14 Years | 80 (52.3%) | 3 (2.8%) |
| 15 Years | 0 (0.0%) | 0 (0.0%) |
| 16 and 17 Years | 3 (2.5%) | 21 (38.9%) |
| 18 to 24 Years | 78 (36.3%) | 0 (0.0%) |
| 25 to 34 Years | 72 (14.7%) | 246 (47.0%) |
| 35 to 44 Years | 28 (8.5%) | 106 (33.0%) |
| 45 to 54 Years | 81 (19.0%) | 97 (31.3%) |
| 55 to 64 Years | 15 (2.9%) | 157 (31.0%) |
| 65 to 74 Years | 17 (5.6%) | 42 (12.8%) |
| 75 Years and over | 17 (14.2%) | 0 (0.0%) |
| Total | 692 (19.6%) | 1,281 (39.0%) |
Income Above Poverty by Sex and Age in Bridge City
According to the poverty statistics in Bridge City, males aged 5 years and females aged 18 to 24 years are the age groups that are most secure financially, with 100.0% of males and 100.0% of females in these age groups living above the poverty line.
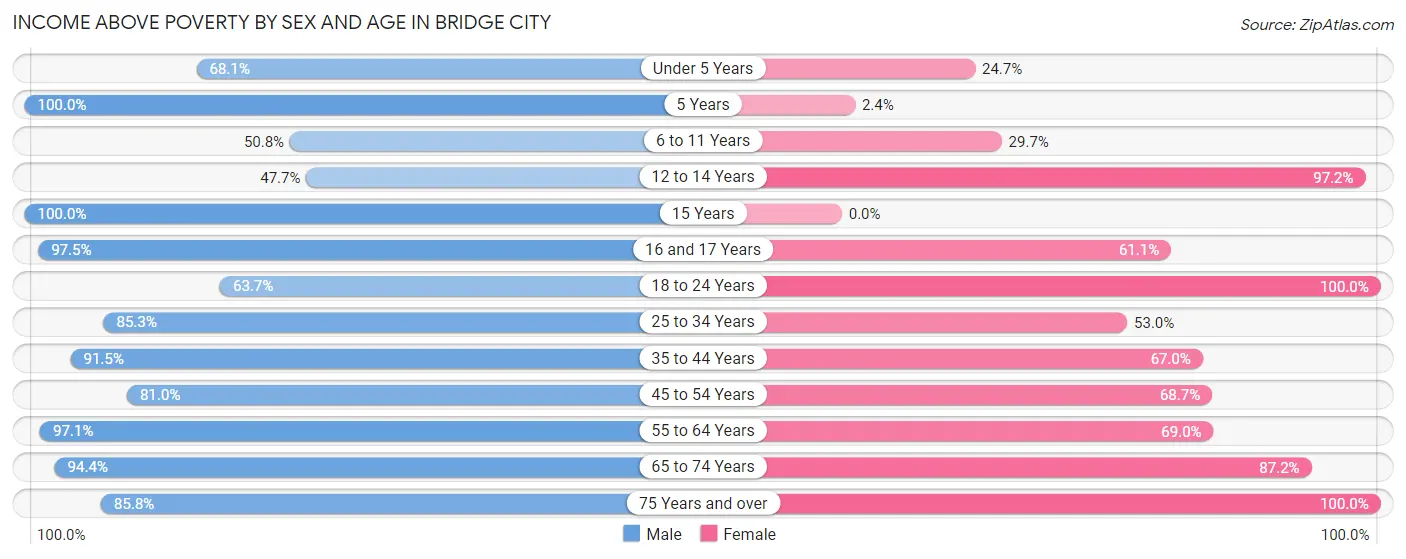
| Age Bracket | Male | Female |
| Under 5 Years | 224 (68.1%) | 46 (24.7%) |
| 5 Years | 57 (100.0%) | 1 (2.4%) |
| 6 to 11 Years | 202 (50.7%) | 181 (29.7%) |
| 12 to 14 Years | 73 (47.7%) | 103 (97.2%) |
| 15 Years | 62 (100.0%) | 0 (0.0%) |
| 16 and 17 Years | 115 (97.5%) | 33 (61.1%) |
| 18 to 24 Years | 137 (63.7%) | 190 (100.0%) |
| 25 to 34 Years | 419 (85.3%) | 277 (53.0%) |
| 35 to 44 Years | 300 (91.5%) | 215 (67.0%) |
| 45 to 54 Years | 345 (81.0%) | 213 (68.7%) |
| 55 to 64 Years | 507 (97.1%) | 349 (69.0%) |
| 65 to 74 Years | 287 (94.4%) | 285 (87.2%) |
| 75 Years and over | 103 (85.8%) | 111 (100.0%) |
| Total | 2,831 (80.4%) | 2,004 (61.0%) |
Income Below Poverty Among Married-Couple Families in Bridge City
The poverty statistics for married-couple families in Bridge City show that 2.9% or 22 of the total 753 families live below the poverty line. Families with no children have the highest poverty rate of 4.3%, comprising of 22 families. On the other hand, families with 1 or 2 children have the lowest poverty rate of 0.0%, which includes 0 families.
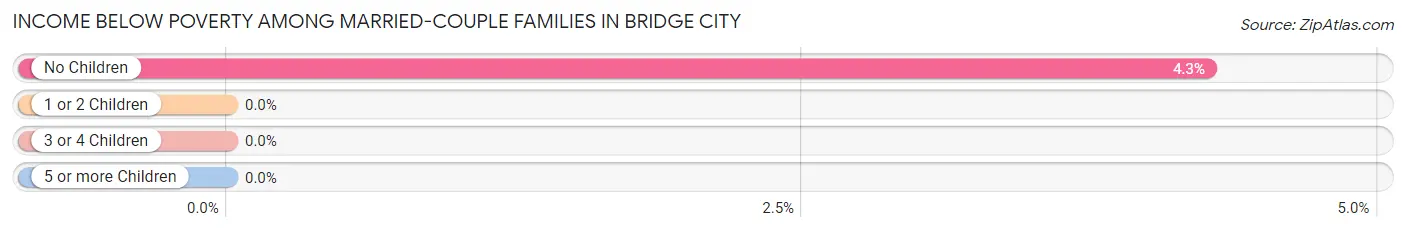
| Children | Above Poverty | Below Poverty |
| No Children | 494 (95.7%) | 22 (4.3%) |
| 1 or 2 Children | 208 (100.0%) | 0 (0.0%) |
| 3 or 4 Children | 29 (100.0%) | 0 (0.0%) |
| 5 or more Children | 0 (0.0%) | 0 (0.0%) |
| Total | 731 (97.1%) | 22 (2.9%) |
Income Below Poverty Among Single-Parent Households in Bridge City
According to the poverty data in Bridge City, 15.0% or 32 single-father households and 40.5% or 233 single-mother households are living below the poverty line. Among single-father households, those with 1 or 2 children have the highest poverty rate, with 32 households (22.1%) experiencing poverty. Likewise, among single-mother households, those with 3 or 4 children have the highest poverty rate, with 95 households (61.3%) falling below the poverty line.
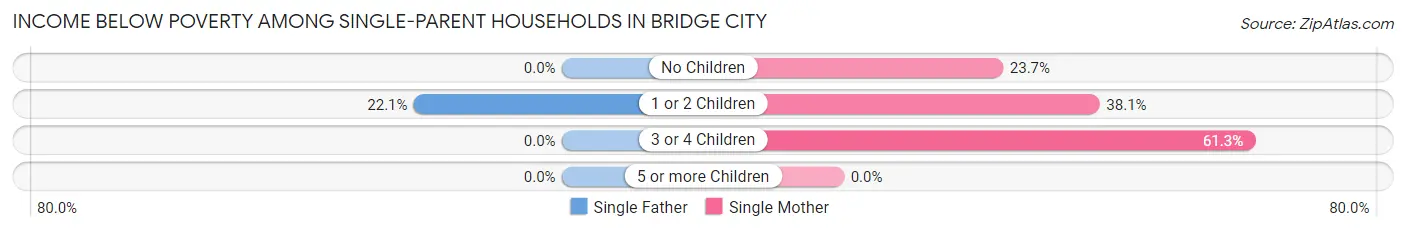
| Children | Single Father | Single Mother |
| No Children | 0 (0.0%) | 37 (23.7%) |
| 1 or 2 Children | 32 (22.1%) | 101 (38.1%) |
| 3 or 4 Children | 0 (0.0%) | 95 (61.3%) |
| 5 or more Children | 0 (0.0%) | 0 (0.0%) |
| Total | 32 (15.0%) | 233 (40.5%) |
Income Below Poverty Among Married-Couple vs Single-Parent Households in Bridge City
The poverty data for Bridge City shows that 22 of the married-couple family households (2.9%) and 265 of the single-parent households (33.6%) are living below the poverty level. Within the married-couple family households, those with no children have the highest poverty rate, with 22 households (4.3%) falling below the poverty line. Among the single-parent households, those with 3 or 4 children have the highest poverty rate, with 95 household (61.3%) living below poverty.
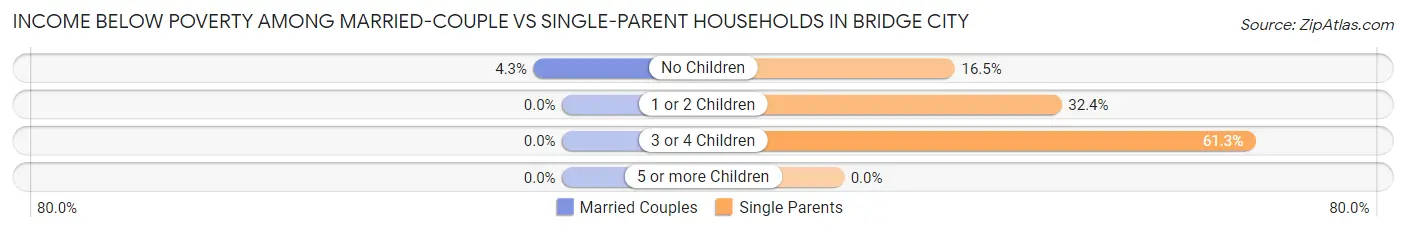
| Children | Married-Couple Families | Single-Parent Households |
| No Children | 22 (4.3%) | 37 (16.5%) |
| 1 or 2 Children | 0 (0.0%) | 133 (32.4%) |
| 3 or 4 Children | 0 (0.0%) | 95 (61.3%) |
| 5 or more Children | 0 (0.0%) | 0 (0.0%) |
| Total | 22 (2.9%) | 265 (33.6%) |
Race in Bridge City
The most populous races in Bridge City are Black / African American (3,289 | 47.6%), White / Caucasian (2,282 | 33.0%), and Hispanic or Latino (1,835 | 26.5%).
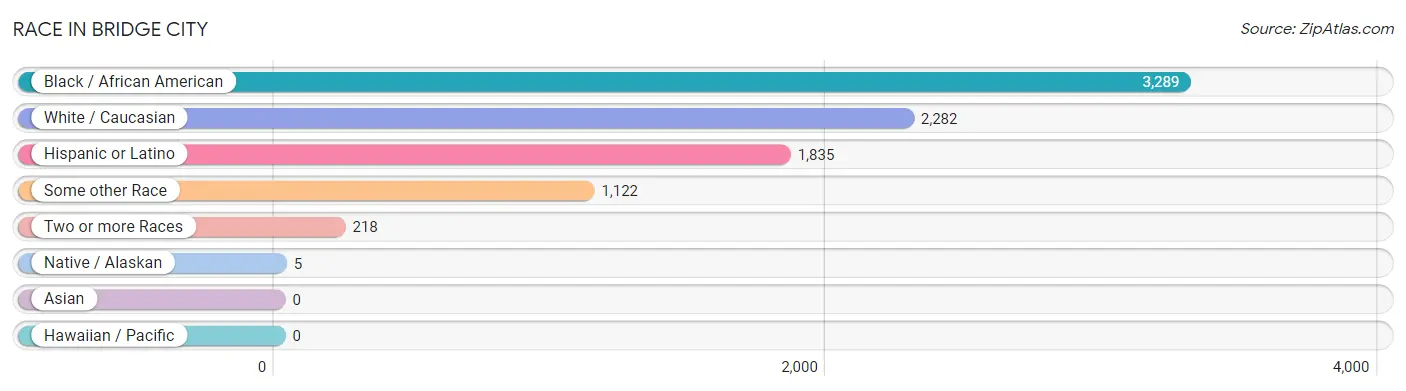
| Race | # Population | % Population |
| Asian | 0 | 0.0% |
| Black / African American | 3,289 | 47.6% |
| Hawaiian / Pacific | 0 | 0.0% |
| Hispanic or Latino | 1,835 | 26.5% |
| Native / Alaskan | 5 | 0.1% |
| White / Caucasian | 2,282 | 33.0% |
| Two or more Races | 218 | 3.2% |
| Some other Race | 1,122 | 16.2% |
| Total | 6,916 | 100.0% |
Ancestry in Bridge City
The most populous ancestries reported in Bridge City are French (725 | 10.5%), American (409 | 5.9%), Dominican (363 | 5.2%), Italian (345 | 5.0%), and English (294 | 4.3%), together accounting for 30.9% of all Bridge City residents.
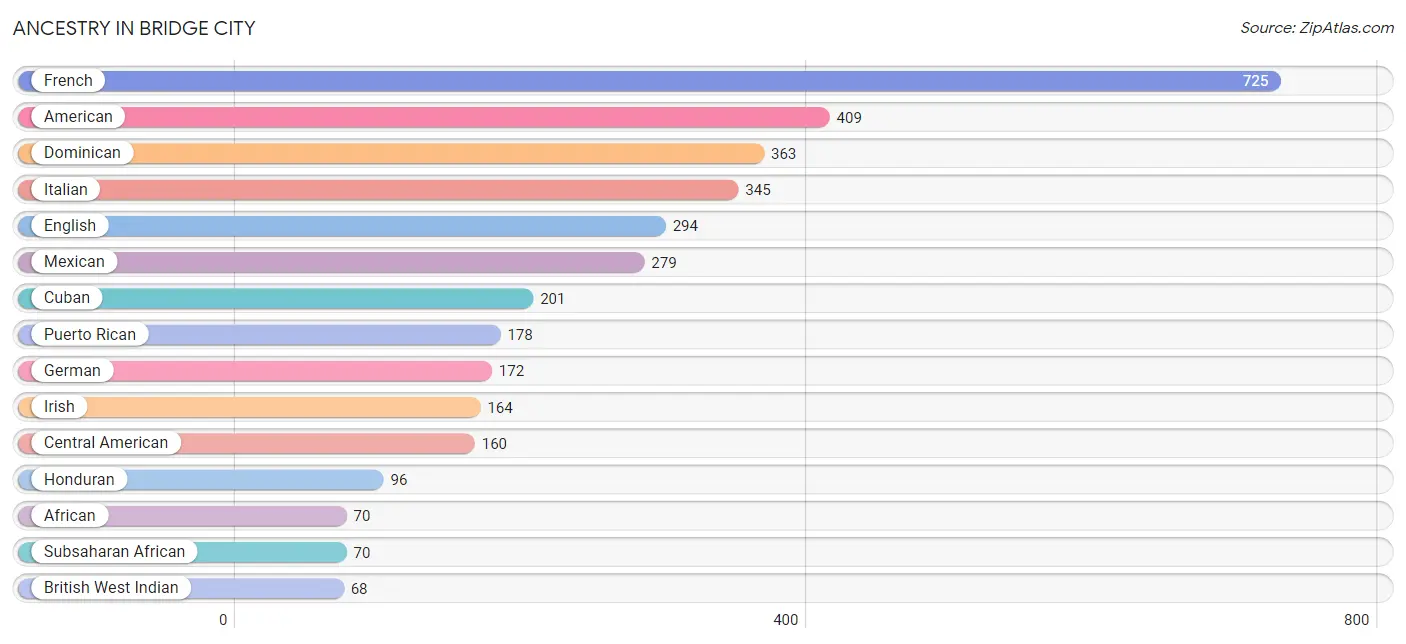
| Ancestry | # Population | % Population |
| African | 70 | 1.0% |
| American | 409 | 5.9% |
| Barbadian | 45 | 0.6% |
| British | 35 | 0.5% |
| British West Indian | 68 | 1.0% |
| Cajun | 38 | 0.5% |
| Central American | 160 | 2.3% |
| Cuban | 201 | 2.9% |
| Dominican | 363 | 5.2% |
| Dutch | 14 | 0.2% |
| Eastern European | 29 | 0.4% |
| Ecuadorian | 9 | 0.1% |
| English | 294 | 4.3% |
| French | 725 | 10.5% |
| French Canadian | 21 | 0.3% |
| German | 172 | 2.5% |
| Guatemalan | 15 | 0.2% |
| Haitian | 11 | 0.2% |
| Honduran | 96 | 1.4% |
| Irish | 164 | 2.4% |
| Italian | 345 | 5.0% |
| Mexican | 279 | 4.0% |
| Nicaraguan | 49 | 0.7% |
| Potawatomi | 5 | 0.1% |
| Puerto Rican | 178 | 2.6% |
| Scandinavian | 62 | 0.9% |
| South American | 9 | 0.1% |
| Spanish | 8 | 0.1% |
| Subsaharan African | 70 | 1.0% | View All 29 Rows |
Immigrants in Bridge City
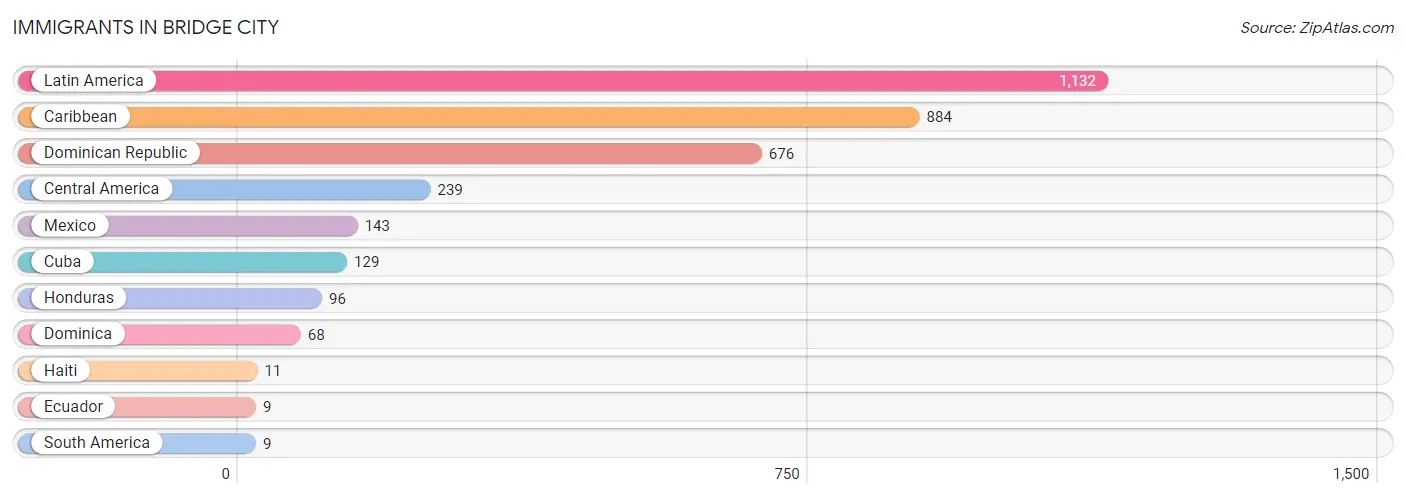
The most numerous immigrant groups reported in Bridge City came from Latin America (1,132 | 16.4%), Caribbean (884 | 12.8%), Dominican Republic (676 | 9.8%), Central America (239 | 3.5%), and Mexico (143 | 2.1%), together accounting for 44.5% of all Bridge City residents.
| Immigration Origin | # Population | % Population |
| Caribbean | 884 | 12.8% |
| Central America | 239 | 3.5% |
| Cuba | 129 | 1.9% |
| Dominica | 68 | 1.0% |
| Dominican Republic | 676 | 9.8% |
| Ecuador | 9 | 0.1% |
| Haiti | 11 | 0.2% |
| Honduras | 96 | 1.4% |
| Latin America | 1,132 | 16.4% |
| Mexico | 143 | 2.1% |
| South America | 9 | 0.1% | View All 11 Rows |
Sex and Age in Bridge City
Sex and Age in Bridge City
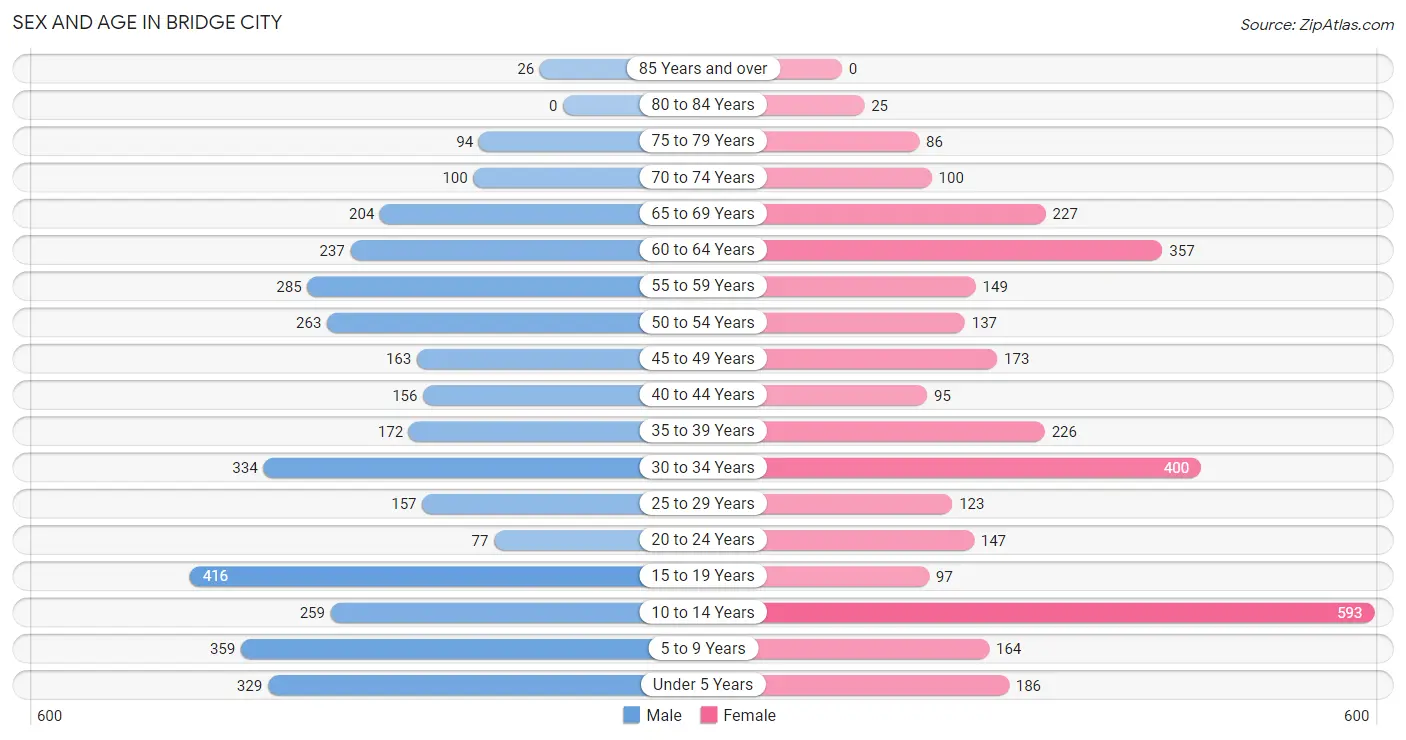
The most populous age groups in Bridge City are 15 to 19 Years (416 | 11.5%) for men and 10 to 14 Years (593 | 18.0%) for women.
| Age Bracket | Male | Female |
| Under 5 Years | 329 (9.1%) | 186 (5.7%) |
| 5 to 9 Years | 359 (9.9%) | 164 (5.0%) |
| 10 to 14 Years | 259 (7.1%) | 593 (18.0%) |
| 15 to 19 Years | 416 (11.5%) | 97 (2.9%) |
| 20 to 24 Years | 77 (2.1%) | 147 (4.5%) |
| 25 to 29 Years | 157 (4.3%) | 123 (3.7%) |
| 30 to 34 Years | 334 (9.2%) | 400 (12.2%) |
| 35 to 39 Years | 172 (4.7%) | 226 (6.9%) |
| 40 to 44 Years | 156 (4.3%) | 95 (2.9%) |
| 45 to 49 Years | 163 (4.5%) | 173 (5.3%) |
| 50 to 54 Years | 263 (7.2%) | 137 (4.2%) |
| 55 to 59 Years | 285 (7.9%) | 149 (4.5%) |
| 60 to 64 Years | 237 (6.5%) | 357 (10.9%) |
| 65 to 69 Years | 204 (5.6%) | 227 (6.9%) |
| 70 to 74 Years | 100 (2.8%) | 100 (3.0%) |
| 75 to 79 Years | 94 (2.6%) | 86 (2.6%) |
| 80 to 84 Years | 0 (0.0%) | 25 (0.8%) |
| 85 Years and over | 26 (0.7%) | 0 (0.0%) |
| Total | 3,631 (100.0%) | 3,285 (100.0%) |
Families and Households in Bridge City
Median Family Size in Bridge City
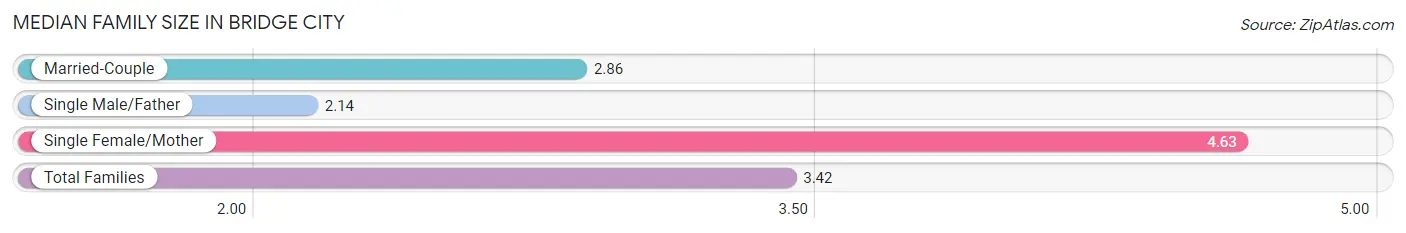
The median family size in Bridge City is 3.42 persons per family, with single female/mother families (576 | 37.3%) accounting for the largest median family size of 4.63 persons per family. On the other hand, single male/father families (213 | 13.8%) represent the smallest median family size with 2.14 persons per family.
| Family Type | # Families | Family Size |
| Married-Couple | 753 (48.8%) | 2.86 |
| Single Male/Father | 213 (13.8%) | 2.14 |
| Single Female/Mother | 576 (37.3%) | 4.63 |
| Total Families | 1,542 (100.0%) | 3.42 |
Median Household Size in Bridge City
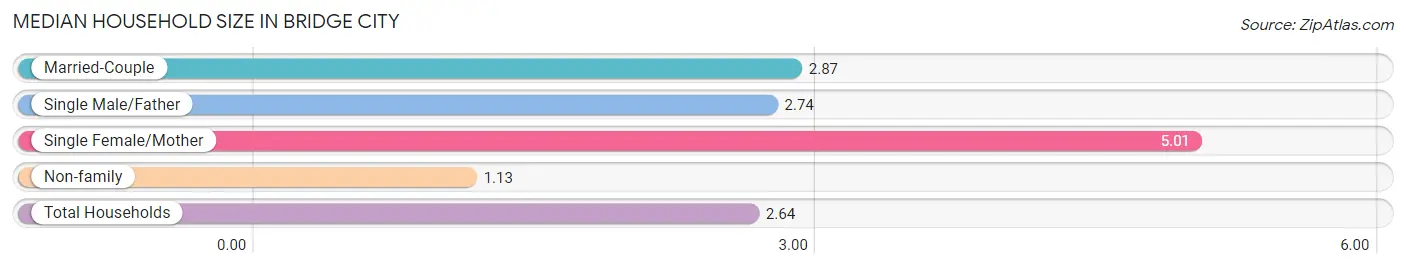
The median household size in Bridge City is 2.64 persons per household, with single female/mother households (576 | 22.3%) accounting for the largest median household size of 5.01 persons per household. non-family households (1,040 | 40.3%) represent the smallest median household size with 1.13 persons per household.
| Household Type | # Households | Household Size |
| Married-Couple | 753 (29.2%) | 2.87 |
| Single Male/Father | 213 (8.3%) | 2.74 |
| Single Female/Mother | 576 (22.3%) | 5.01 |
| Non-family | 1,040 (40.3%) | 1.13 |
| Total Households | 2,582 (100.0%) | 2.64 |
Household Size by Marriage Status in Bridge City
Out of a total of 2,582 households in Bridge City, 1,542 (59.7%) are family households, while 1,040 (40.3%) are nonfamily households. The most numerous type of family households are 2-person households, comprising 623, and the most common type of nonfamily households are 1-person households, comprising 918.
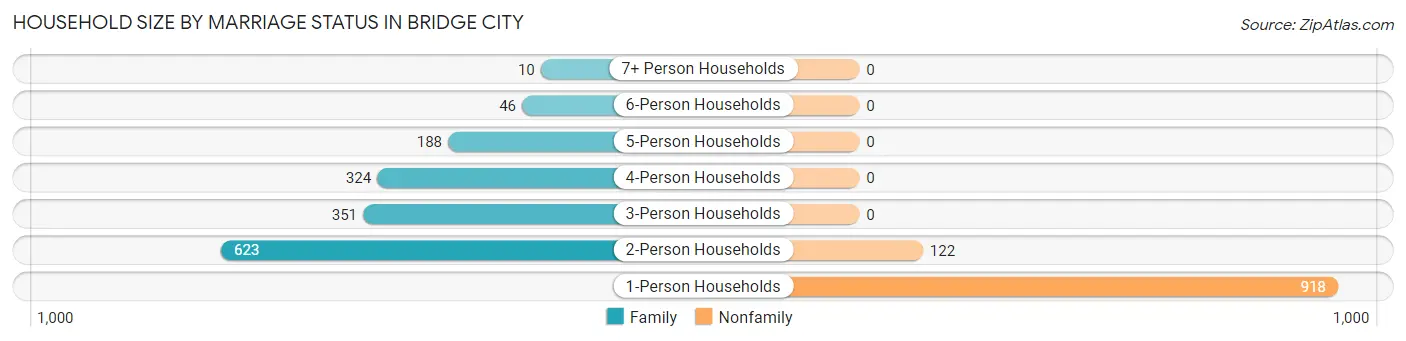
| Household Size | Family Households | Nonfamily Households |
| 1-Person Households | - | 918 (35.5%) |
| 2-Person Households | 623 (24.1%) | 122 (4.7%) |
| 3-Person Households | 351 (13.6%) | 0 (0.0%) |
| 4-Person Households | 324 (12.6%) | 0 (0.0%) |
| 5-Person Households | 188 (7.3%) | 0 (0.0%) |
| 6-Person Households | 46 (1.8%) | 0 (0.0%) |
| 7+ Person Households | 10 (0.4%) | 0 (0.0%) |
| Total | 1,542 (59.7%) | 1,040 (40.3%) |
Female Fertility in Bridge City
Fertility by Age in Bridge City
Average fertility rate in Bridge City is 83.0 births per 1,000 women. Women in the age bracket of 20 to 34 years have the highest fertility rate with 113.0 births per 1,000 women. Women in the age bracket of 20 to 34 years acount for 72.4% of all women with births.
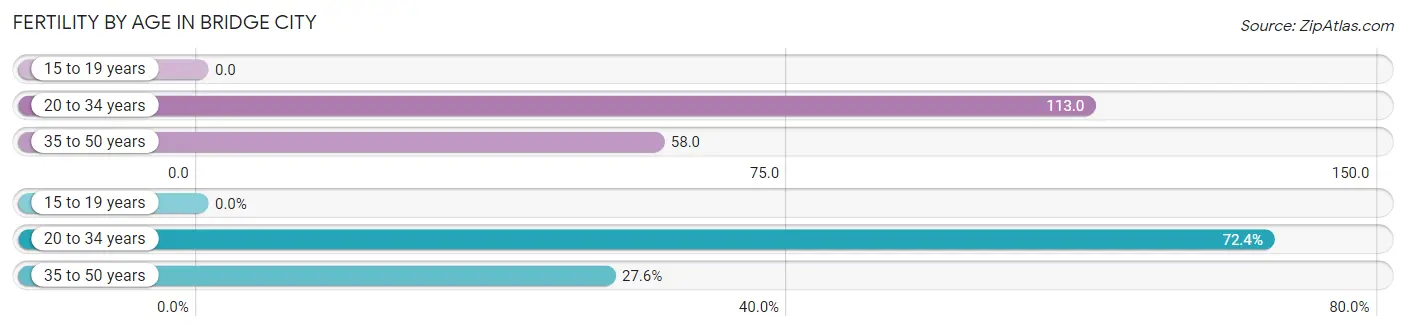
| Age Bracket | Women with Births | Births / 1,000 Women |
| 15 to 19 years | 0 (0.0%) | 0.0 |
| 20 to 34 years | 76 (72.4%) | 113.0 |
| 35 to 50 years | 29 (27.6%) | 58.0 |
| Total | 105 (100.0%) | 83.0 |
Fertility by Age by Marriage Status in Bridge City
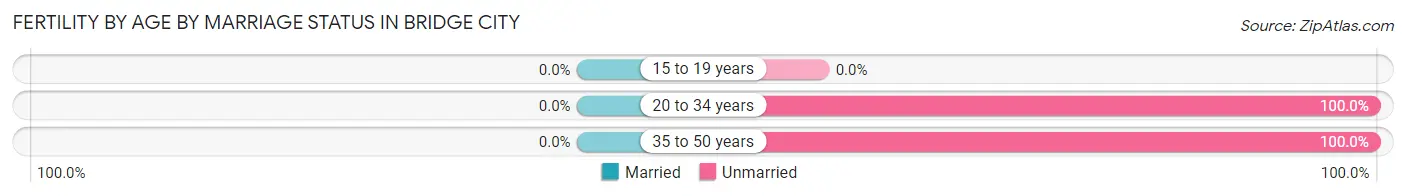
| Age Bracket | Married | Unmarried |
| 15 to 19 years | 0 (0.0%) | 0 (0.0%) |
| 20 to 34 years | 0 (0.0%) | 76 (100.0%) |
| 35 to 50 years | 0 (0.0%) | 29 (100.0%) |
| Total | 0 (0.0%) | 105 (100.0%) |
Fertility by Education in Bridge City
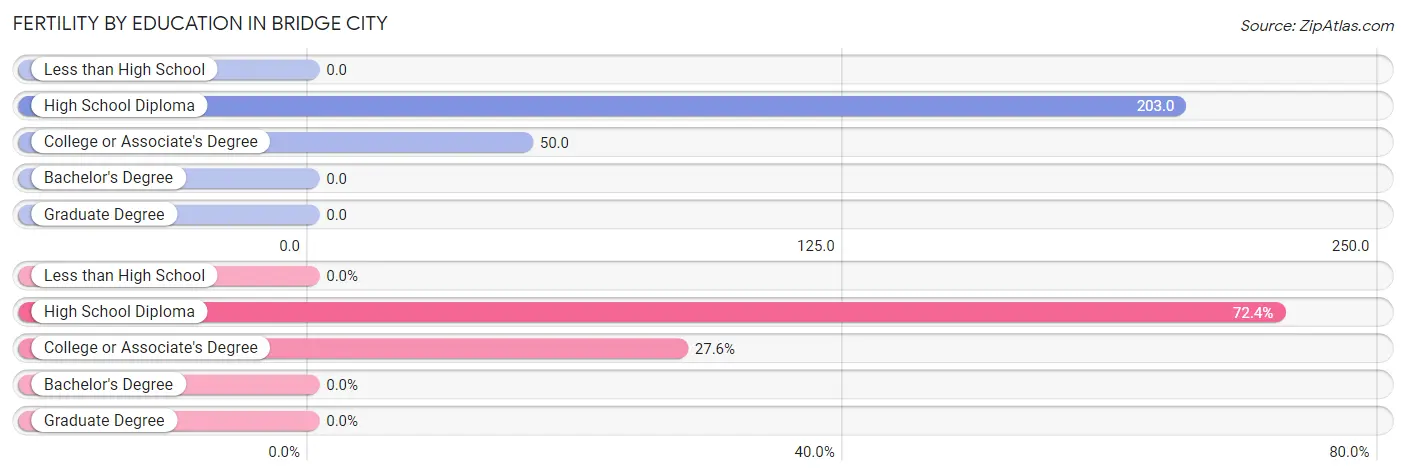
| Educational Attainment | Women with Births | Births / 1,000 Women |
| Less than High School | 0 (0.0%) | 0.0 |
| High School Diploma | 76 (72.4%) | 203.0 |
| College or Associate's Degree | 29 (27.6%) | 50.0 |
| Bachelor's Degree | 0 (0.0%) | 0.0 |
| Graduate Degree | 0 (0.0%) | 0.0 |
| Total | 105 (100.0%) | 83.0 |
Fertility by Education by Marriage Status in Bridge City
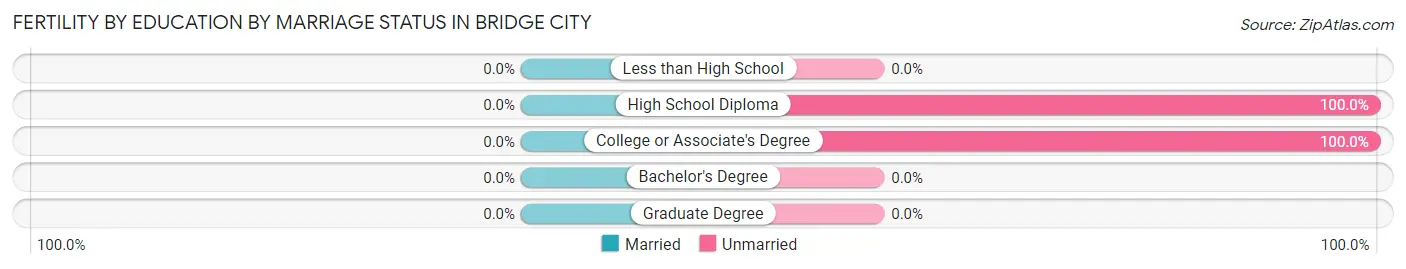
| Educational Attainment | Married | Unmarried |
| Less than High School | 0 (0.0%) | 0 (0.0%) |
| High School Diploma | 0 (0.0%) | 76 (100.0%) |
| College or Associate's Degree | 0 (0.0%) | 29 (100.0%) |
| Bachelor's Degree | 0 (0.0%) | 0 (0.0%) |
| Graduate Degree | 0 (0.0%) | 0 (0.0%) |
| Total | 0 (0.0%) | 105 (100.0%) |
Employment Characteristics in Bridge City
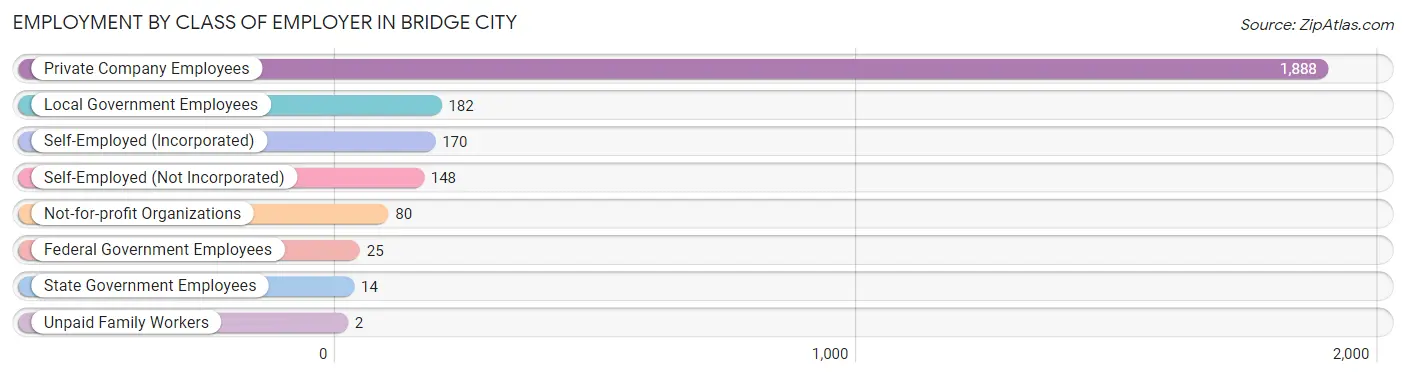
Employment by Class of Employer in Bridge City
Among the 2,509 employed individuals in Bridge City, private company employees (1,888 | 75.2%), local government employees (182 | 7.2%), and self-employed (incorporated) (170 | 6.8%) make up the most common classes of employment.
| Employer Class | # Employees | % Employees |
| Private Company Employees | 1,888 | 75.2% |
| Self-Employed (Incorporated) | 170 | 6.8% |
| Self-Employed (Not Incorporated) | 148 | 5.9% |
| Not-for-profit Organizations | 80 | 3.2% |
| Local Government Employees | 182 | 7.2% |
| State Government Employees | 14 | 0.6% |
| Federal Government Employees | 25 | 1.0% |
| Unpaid Family Workers | 2 | 0.1% |
| Total | 2,509 | 100.0% |
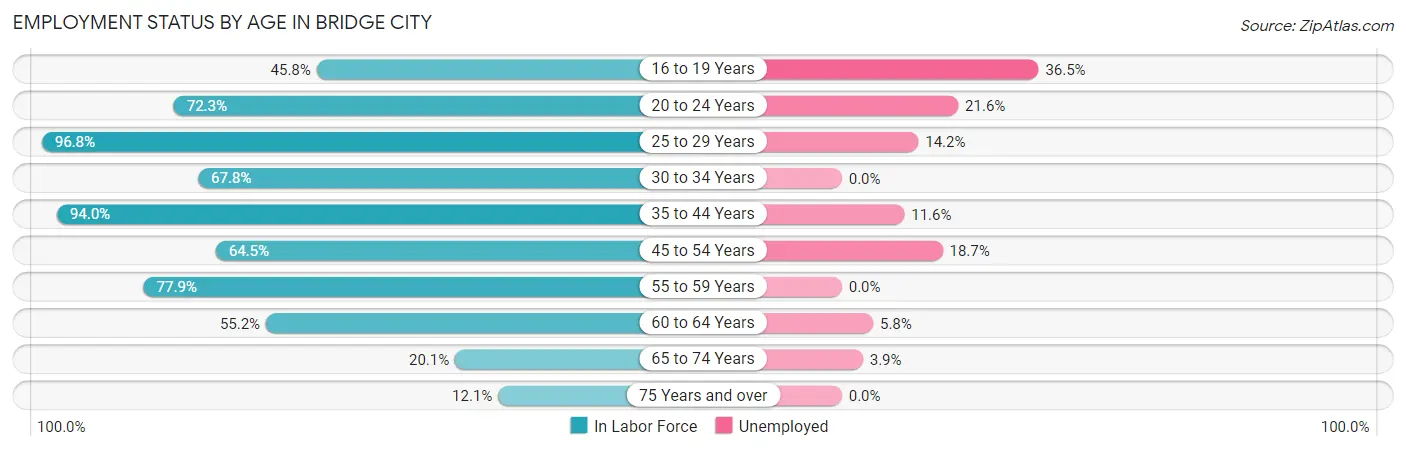
Employment Status by Age in Bridge City
According to the labor force statistics for Bridge City, out of the total population over 16 years of age (4,956), 61.3% or 3,038 individuals are in the labor force, with 10.9% or 331 of them unemployed. The age group with the highest labor force participation rate is 25 to 29 years, with 96.8% or 271 individuals in the labor force. Within the labor force, the 16 to 19 years age range has the highest percentage of unemployed individuals, with 36.5% or 74 of them being unemployed.
| Age Bracket | In Labor Force | Unemployed |
| 16 to 19 Years | 203 (45.8%) | 74 (36.5%) |
| 20 to 24 Years | 162 (72.3%) | 35 (21.6%) |
| 25 to 29 Years | 271 (96.8%) | 38 (14.2%) |
| 30 to 34 Years | 498 (67.8%) | 0 (0.0%) |
| 35 to 44 Years | 610 (94.0%) | 71 (11.6%) |
| 45 to 54 Years | 475 (64.5%) | 89 (18.7%) |
| 55 to 59 Years | 338 (77.9%) | 0 (0.0%) |
| 60 to 64 Years | 328 (55.2%) | 19 (5.8%) |
| 65 to 74 Years | 127 (20.1%) | 5 (3.9%) |
| 75 Years and over | 28 (12.1%) | 0 (0.0%) |
| Total | 3,038 (61.3%) | 331 (10.9%) |
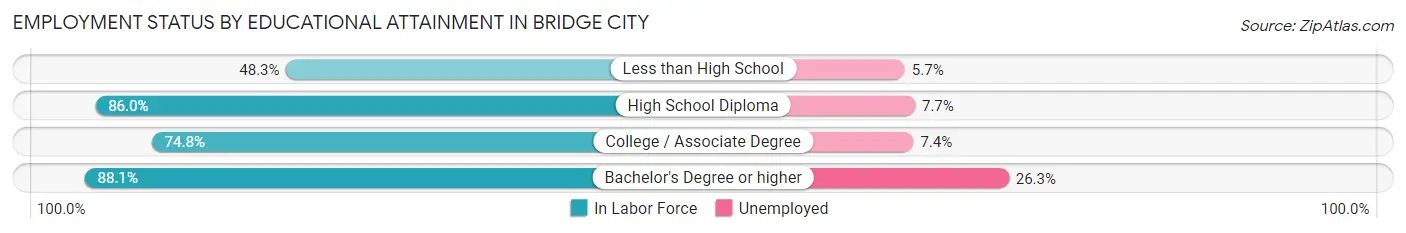
Employment Status by Educational Attainment in Bridge City
According to labor force statistics for Bridge City, 73.5% of individuals (2,519) out of the total population between 25 and 64 years of age (3,427) are in the labor force, with 8.6% or 217 of them being unemployed. The group with the highest labor force participation rate are those with the educational attainment of bachelor's degree or higher, with 88.1% or 171 individuals in the labor force. Within the labor force, individuals with bachelor's degree or higher education have the highest percentage of unemployment, with 26.3% or 45 of them being unemployed.
| Educational Attainment | In Labor Force | Unemployed |
| Less than High School | 388 (48.3%) | 46 (5.7%) |
| High School Diploma | 1,100 (86.0%) | 98 (7.7%) |
| College / Associate Degree | 861 (74.8%) | 85 (7.4%) |
| Bachelor's Degree or higher | 171 (88.1%) | 51 (26.3%) |
| Total | 2,519 (73.5%) | 295 (8.6%) |
Employment Occupations by Sex in Bridge City
Management, Business, Science and Arts Occupations
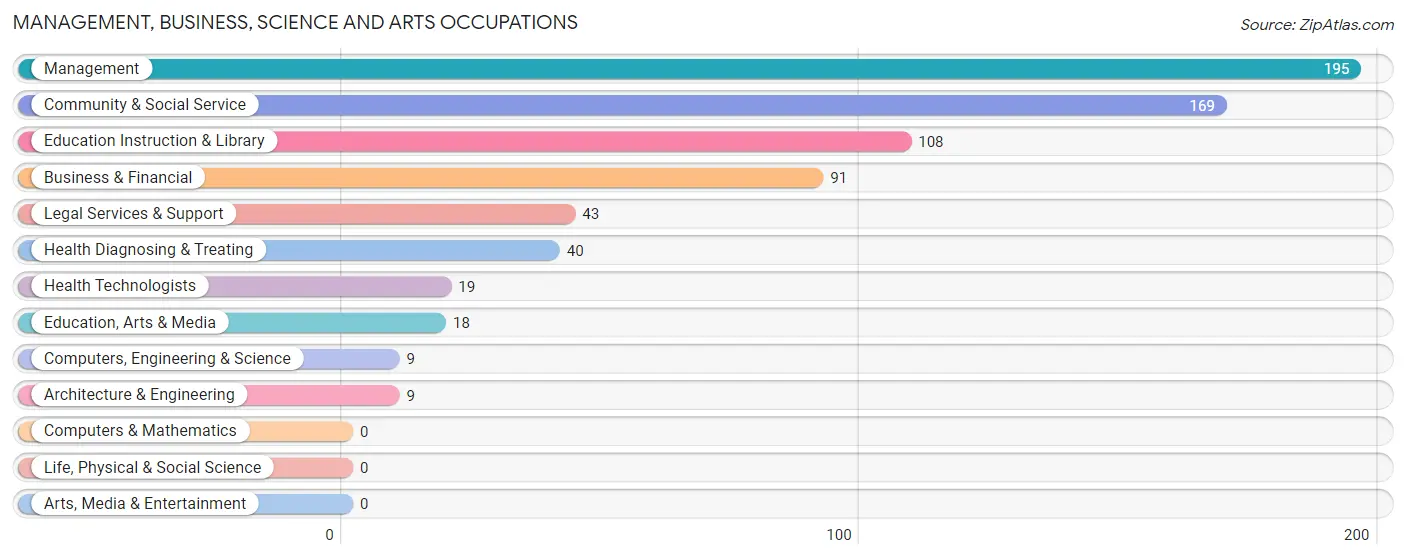
The most common Management, Business, Science and Arts occupations in Bridge City are Management (195 | 7.3%), Community & Social Service (169 | 6.3%), Education Instruction & Library (108 | 4.0%), Business & Financial (91 | 3.4%), and Legal Services & Support (43 | 1.6%).
Management, Business, Science and Arts Occupations by Sex
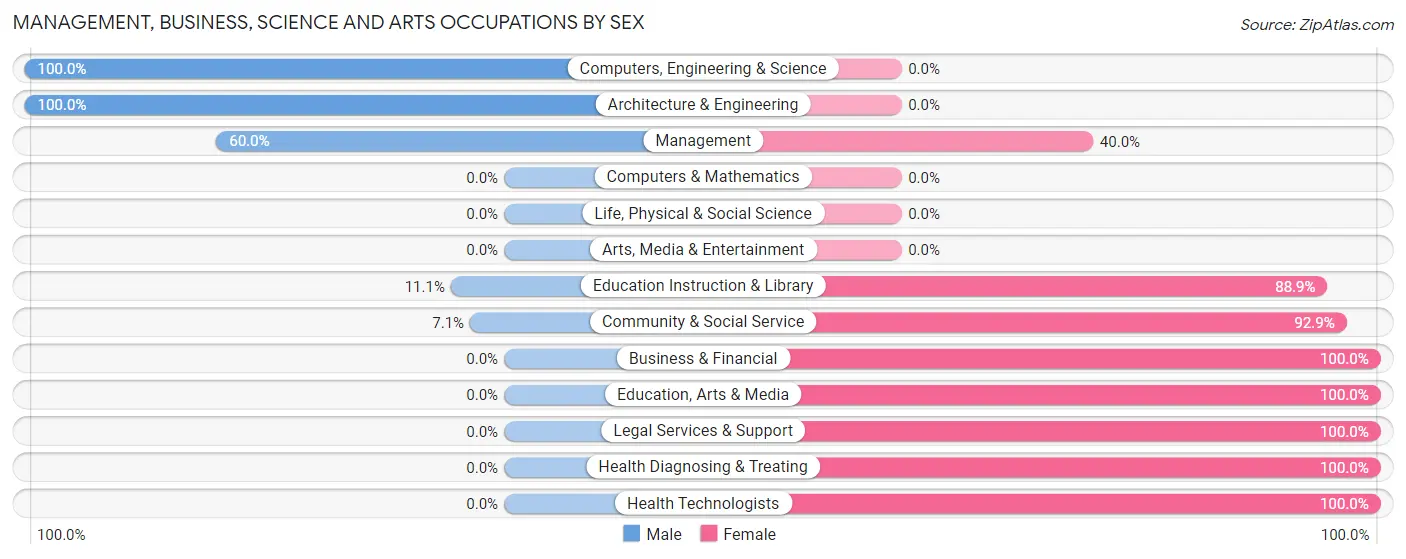
Within the Management, Business, Science and Arts occupations in Bridge City, the most male-oriented occupations are Computers, Engineering & Science (100.0%), Architecture & Engineering (100.0%), and Management (60.0%), while the most female-oriented occupations are Business & Financial (100.0%), Education, Arts & Media (100.0%), and Legal Services & Support (100.0%).
| Occupation | Male | Female |
| Management | 117 (60.0%) | 78 (40.0%) |
| Business & Financial | 0 (0.0%) | 91 (100.0%) |
| Computers, Engineering & Science | 9 (100.0%) | 0 (0.0%) |
| Computers & Mathematics | 0 (0.0%) | 0 (0.0%) |
| Architecture & Engineering | 9 (100.0%) | 0 (0.0%) |
| Life, Physical & Social Science | 0 (0.0%) | 0 (0.0%) |
| Community & Social Service | 12 (7.1%) | 157 (92.9%) |
| Education, Arts & Media | 0 (0.0%) | 18 (100.0%) |
| Legal Services & Support | 0 (0.0%) | 43 (100.0%) |
| Education Instruction & Library | 12 (11.1%) | 96 (88.9%) |
| Arts, Media & Entertainment | 0 (0.0%) | 0 (0.0%) |
| Health Diagnosing & Treating | 0 (0.0%) | 40 (100.0%) |
| Health Technologists | 0 (0.0%) | 19 (100.0%) |
| Total (Category) | 138 (27.4%) | 366 (72.6%) |
| Total (Overall) | 1,586 (59.0%) | 1,101 (41.0%) |
Services Occupations
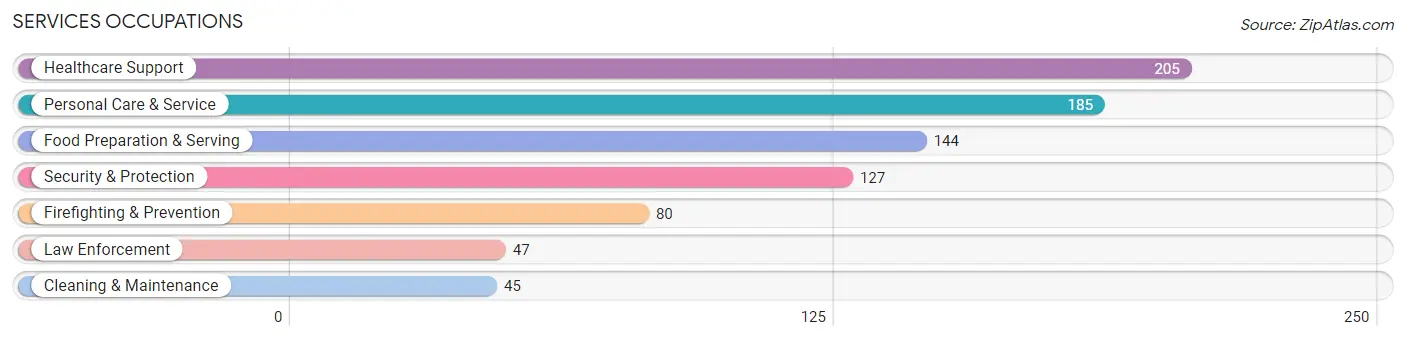
The most common Services occupations in Bridge City are Healthcare Support (205 | 7.6%), Personal Care & Service (185 | 6.9%), Food Preparation & Serving (144 | 5.4%), Security & Protection (127 | 4.7%), and Firefighting & Prevention (80 | 3.0%).
Services Occupations by Sex
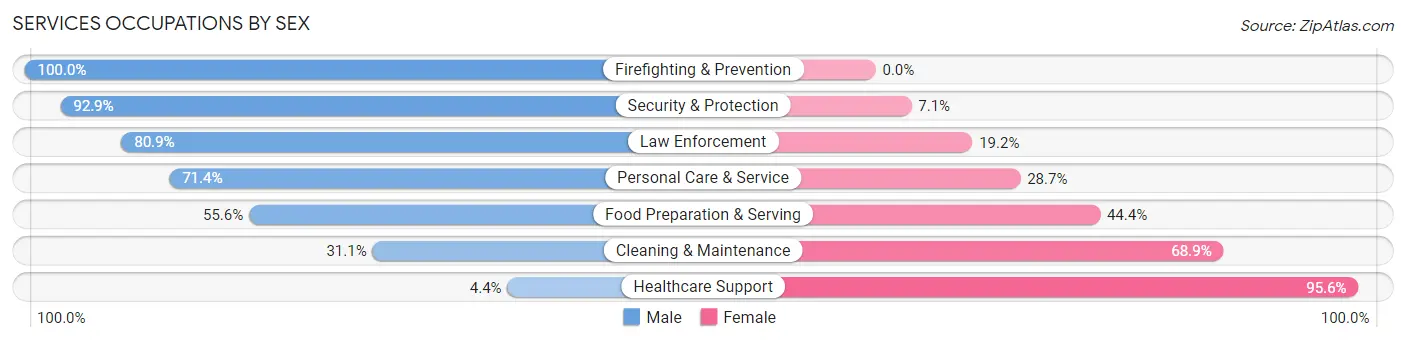
Within the Services occupations in Bridge City, the most male-oriented occupations are Firefighting & Prevention (100.0%), Security & Protection (92.9%), and Law Enforcement (80.8%), while the most female-oriented occupations are Healthcare Support (95.6%), Cleaning & Maintenance (68.9%), and Food Preparation & Serving (44.4%).
| Occupation | Male | Female |
| Healthcare Support | 9 (4.4%) | 196 (95.6%) |
| Security & Protection | 118 (92.9%) | 9 (7.1%) |
| Firefighting & Prevention | 80 (100.0%) | 0 (0.0%) |
| Law Enforcement | 38 (80.8%) | 9 (19.2%) |
| Food Preparation & Serving | 80 (55.6%) | 64 (44.4%) |
| Cleaning & Maintenance | 14 (31.1%) | 31 (68.9%) |
| Personal Care & Service | 132 (71.4%) | 53 (28.6%) |
| Total (Category) | 353 (50.0%) | 353 (50.0%) |
| Total (Overall) | 1,586 (59.0%) | 1,101 (41.0%) |
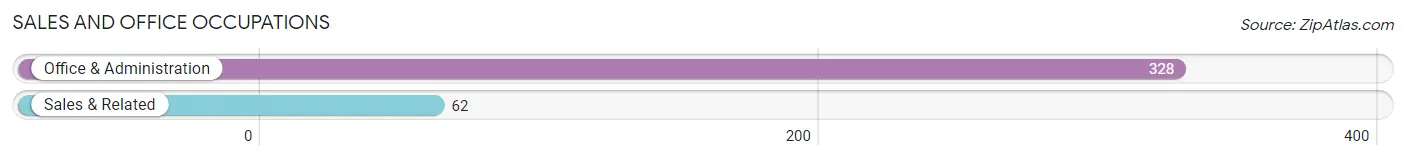
Sales and Office Occupations
The most common Sales and Office occupations in Bridge City are Office & Administration (328 | 12.2%), and Sales & Related (62 | 2.3%).
Sales and Office Occupations by Sex
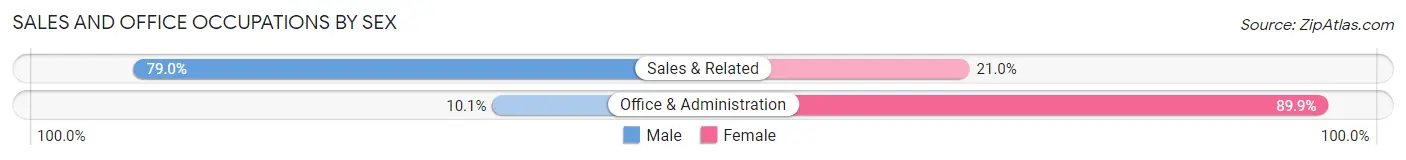
| Occupation | Male | Female |
| Sales & Related | 49 (79.0%) | 13 (21.0%) |
| Office & Administration | 33 (10.1%) | 295 (89.9%) |
| Total (Category) | 82 (21.0%) | 308 (79.0%) |
| Total (Overall) | 1,586 (59.0%) | 1,101 (41.0%) |
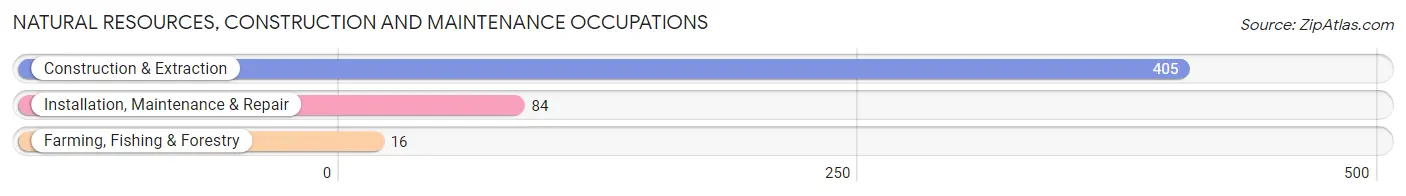
Natural Resources, Construction and Maintenance Occupations
The most common Natural Resources, Construction and Maintenance occupations in Bridge City are Construction & Extraction (405 | 15.1%), Installation, Maintenance & Repair (84 | 3.1%), and Farming, Fishing & Forestry (16 | 0.6%).
Natural Resources, Construction and Maintenance Occupations by Sex
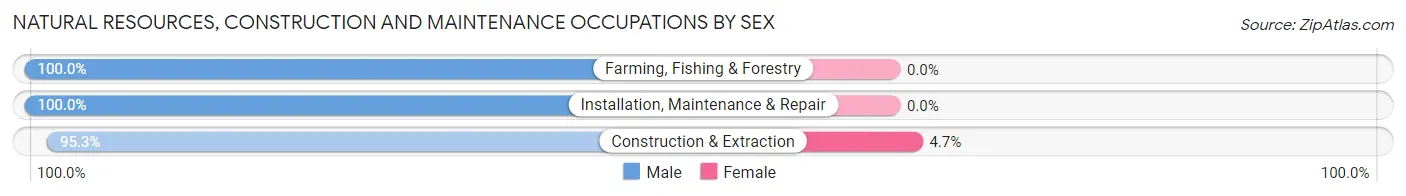
| Occupation | Male | Female |
| Farming, Fishing & Forestry | 16 (100.0%) | 0 (0.0%) |
| Construction & Extraction | 386 (95.3%) | 19 (4.7%) |
| Installation, Maintenance & Repair | 84 (100.0%) | 0 (0.0%) |
| Total (Category) | 486 (96.2%) | 19 (3.8%) |
| Total (Overall) | 1,586 (59.0%) | 1,101 (41.0%) |
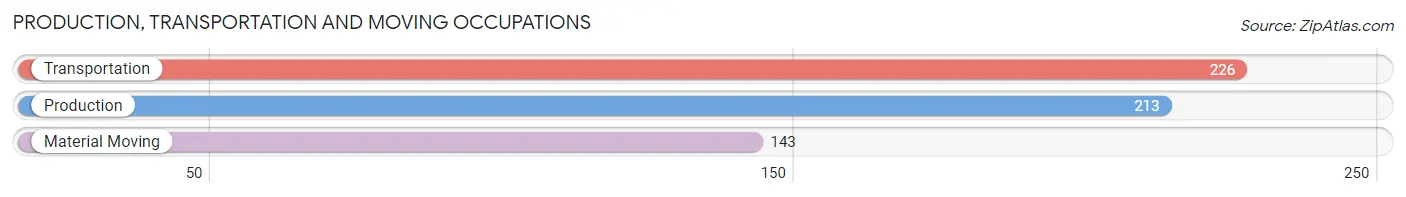
Production, Transportation and Moving Occupations
The most common Production, Transportation and Moving occupations in Bridge City are Transportation (226 | 8.4%), Production (213 | 7.9%), and Material Moving (143 | 5.3%).
Production, Transportation and Moving Occupations by Sex
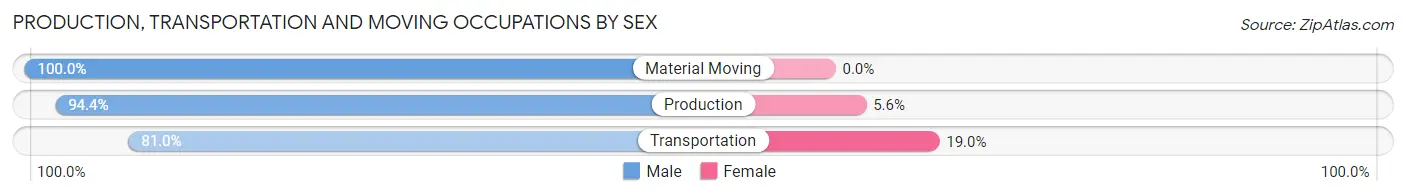
| Occupation | Male | Female |
| Production | 201 (94.4%) | 12 (5.6%) |
| Transportation | 183 (81.0%) | 43 (19.0%) |
| Material Moving | 143 (100.0%) | 0 (0.0%) |
| Total (Category) | 527 (90.5%) | 55 (9.5%) |
| Total (Overall) | 1,586 (59.0%) | 1,101 (41.0%) |
Employment Industries by Sex in Bridge City
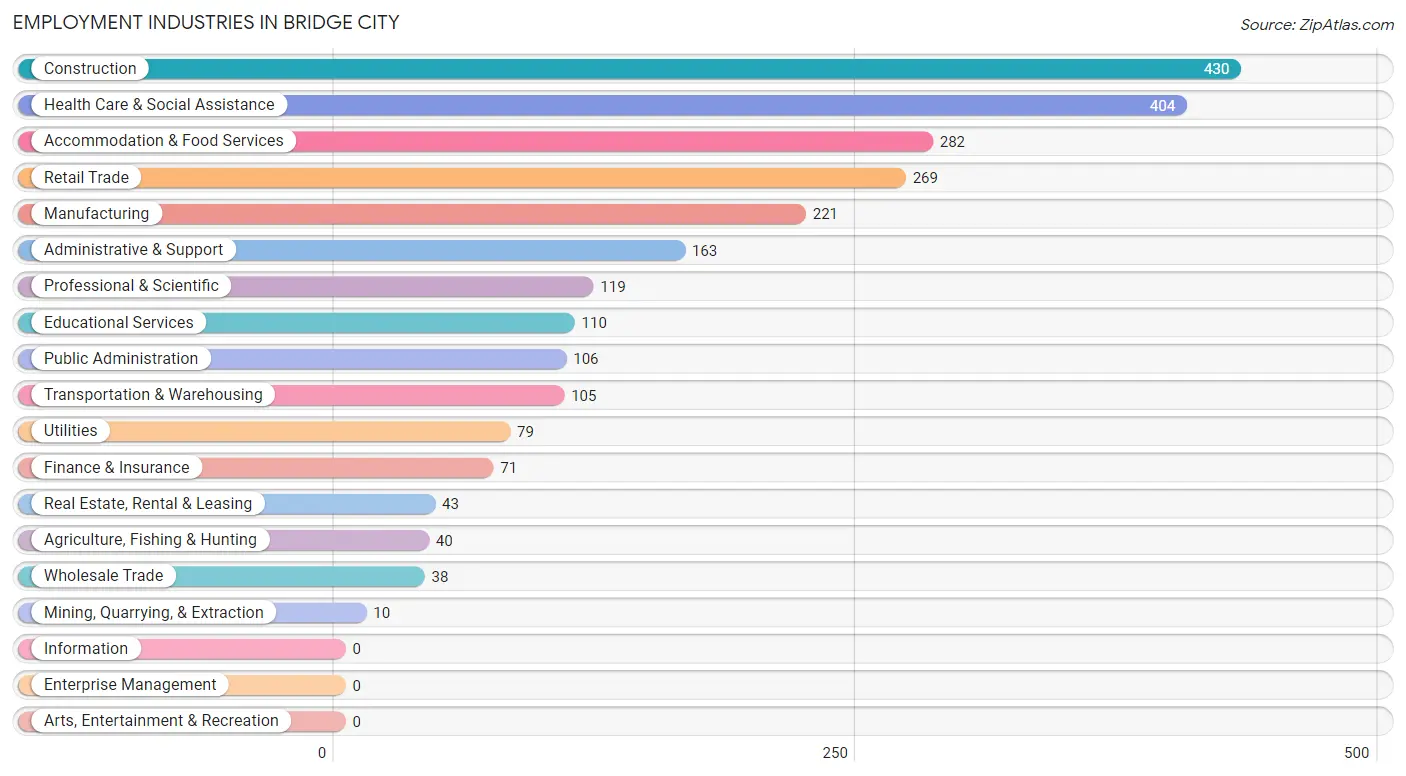
Employment Industries in Bridge City
The major employment industries in Bridge City include Construction (430 | 16.0%), Health Care & Social Assistance (404 | 15.0%), Accommodation & Food Services (282 | 10.5%), Retail Trade (269 | 10.0%), and Manufacturing (221 | 8.2%).
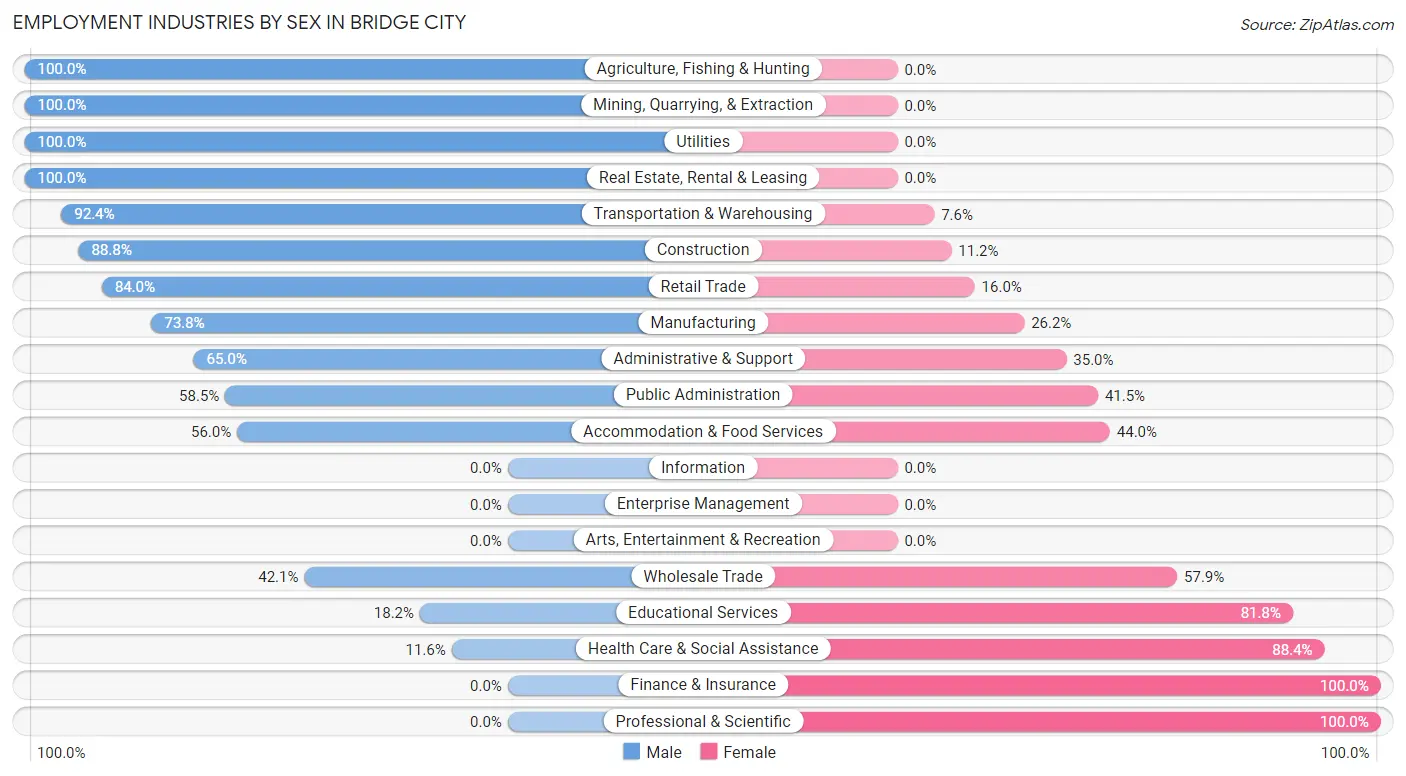
Employment Industries by Sex in Bridge City
The Bridge City industries that see more men than women are Agriculture, Fishing & Hunting (100.0%), Mining, Quarrying, & Extraction (100.0%), and Utilities (100.0%), whereas the industries that tend to have a higher number of women are Finance & Insurance (100.0%), Professional & Scientific (100.0%), and Health Care & Social Assistance (88.4%).
| Industry | Male | Female |
| Agriculture, Fishing & Hunting | 40 (100.0%) | 0 (0.0%) |
| Mining, Quarrying, & Extraction | 10 (100.0%) | 0 (0.0%) |
| Construction | 382 (88.8%) | 48 (11.2%) |
| Manufacturing | 163 (73.8%) | 58 (26.2%) |
| Wholesale Trade | 16 (42.1%) | 22 (57.9%) |
| Retail Trade | 226 (84.0%) | 43 (16.0%) |
| Transportation & Warehousing | 97 (92.4%) | 8 (7.6%) |
| Utilities | 79 (100.0%) | 0 (0.0%) |
| Information | 0 (0.0%) | 0 (0.0%) |
| Finance & Insurance | 0 (0.0%) | 71 (100.0%) |
| Real Estate, Rental & Leasing | 43 (100.0%) | 0 (0.0%) |
| Professional & Scientific | 0 (0.0%) | 119 (100.0%) |
| Enterprise Management | 0 (0.0%) | 0 (0.0%) |
| Administrative & Support | 106 (65.0%) | 57 (35.0%) |
| Educational Services | 20 (18.2%) | 90 (81.8%) |
| Health Care & Social Assistance | 47 (11.6%) | 357 (88.4%) |
| Arts, Entertainment & Recreation | 0 (0.0%) | 0 (0.0%) |
| Accommodation & Food Services | 158 (56.0%) | 124 (44.0%) |
| Public Administration | 62 (58.5%) | 44 (41.5%) |
| Total | 1,586 (59.0%) | 1,101 (41.0%) |
Education in Bridge City
School Enrollment in Bridge City
The most common levels of schooling among the 2,192 students in Bridge City are middle school (689 | 31.4%), elementary school (542 | 24.7%), and high school (426 | 19.4%).
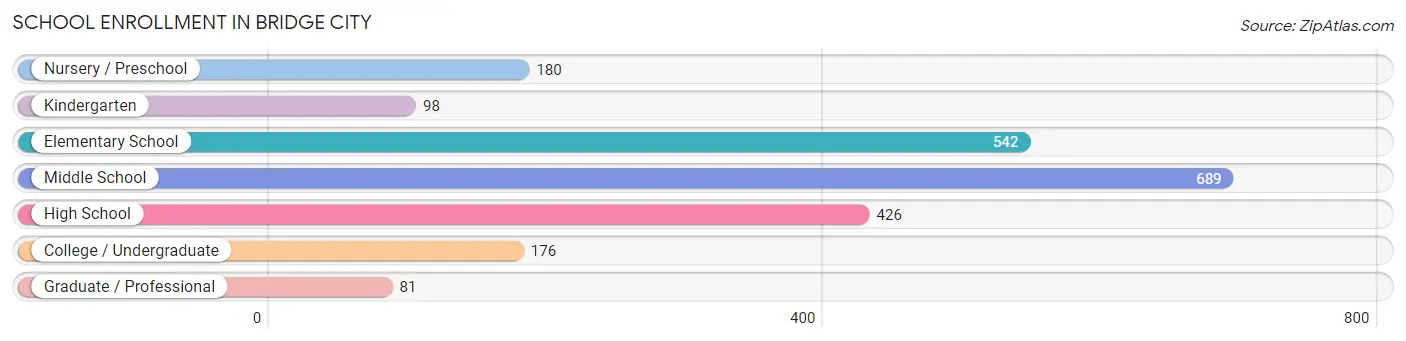
| School Level | # Students | % Students |
| Nursery / Preschool | 180 | 8.2% |
| Kindergarten | 98 | 4.5% |
| Elementary School | 542 | 24.7% |
| Middle School | 689 | 31.4% |
| High School | 426 | 19.4% |
| College / Undergraduate | 176 | 8.0% |
| Graduate / Professional | 81 | 3.7% |
| Total | 2,192 | 100.0% |
School Enrollment by Age by Funding Source in Bridge City
Out of a total of 2,192 students who are enrolled in schools in Bridge City, 232 (10.6%) attend a private institution, while the remaining 1,960 (89.4%) are enrolled in public schools. The age group of 35 years and over has the highest likelihood of being enrolled in private schools, with 15 (100.0% in the age bracket) enrolled. Conversely, the age group of 3 to 4 year olds has the lowest likelihood of being enrolled in a private school, with 180 (100.0% in the age bracket) attending a public institution.
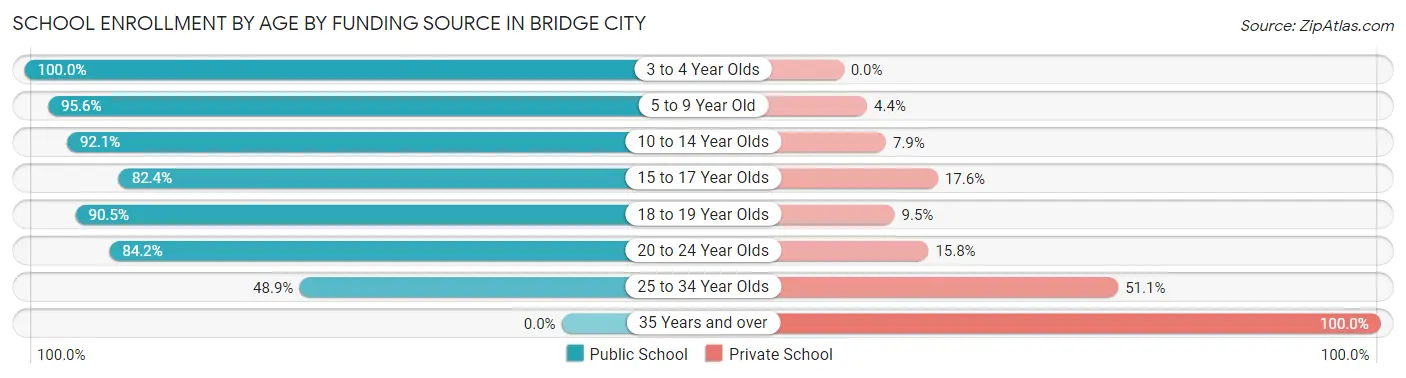
| Age Bracket | Public School | Private School |
| 3 to 4 Year Olds | 180 (100.0%) | 0 (0.0%) |
| 5 to 9 Year Old | 481 (95.6%) | 22 (4.4%) |
| 10 to 14 Year Olds | 770 (92.1%) | 66 (7.9%) |
| 15 to 17 Year Olds | 230 (82.4%) | 49 (17.6%) |
| 18 to 19 Year Olds | 143 (90.5%) | 15 (9.5%) |
| 20 to 24 Year Olds | 112 (84.2%) | 21 (15.8%) |
| 25 to 34 Year Olds | 43 (48.9%) | 45 (51.1%) |
| 35 Years and over | 0 (0.0%) | 15 (100.0%) |
| Total | 1,960 (89.4%) | 232 (10.6%) |
Educational Attainment by Field of Study in Bridge City
Business (70 | 26.0%), computers & mathematics (60 | 22.3%), bio, nature & agricultural (27 | 10.0%), education (26 | 9.7%), and liberal arts & history (26 | 9.7%) are the most common fields of study among 269 individuals in Bridge City who have obtained a bachelor's degree or higher.
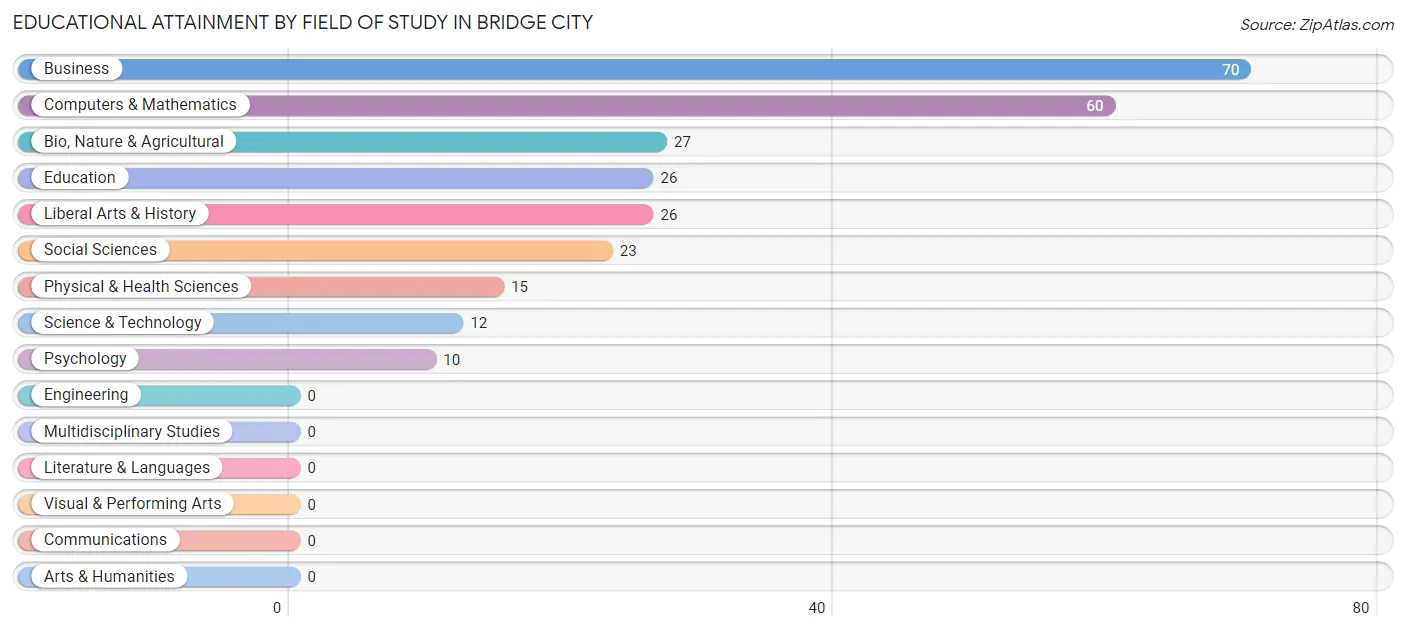
| Field of Study | # Graduates | % Graduates |
| Computers & Mathematics | 60 | 22.3% |
| Bio, Nature & Agricultural | 27 | 10.0% |
| Physical & Health Sciences | 15 | 5.6% |
| Psychology | 10 | 3.7% |
| Social Sciences | 23 | 8.6% |
| Engineering | 0 | 0.0% |
| Multidisciplinary Studies | 0 | 0.0% |
| Science & Technology | 12 | 4.5% |
| Business | 70 | 26.0% |
| Education | 26 | 9.7% |
| Literature & Languages | 0 | 0.0% |
| Liberal Arts & History | 26 | 9.7% |
| Visual & Performing Arts | 0 | 0.0% |
| Communications | 0 | 0.0% |
| Arts & Humanities | 0 | 0.0% |
| Total | 269 | 100.0% |
Transportation & Commute in Bridge City
Vehicle Availability by Sex in Bridge City
The most prevalent vehicle ownership categories in Bridge City are males with 2 vehicles (649, accounting for 45.3%) and females with 2 vehicles (453, making up 60.3%).
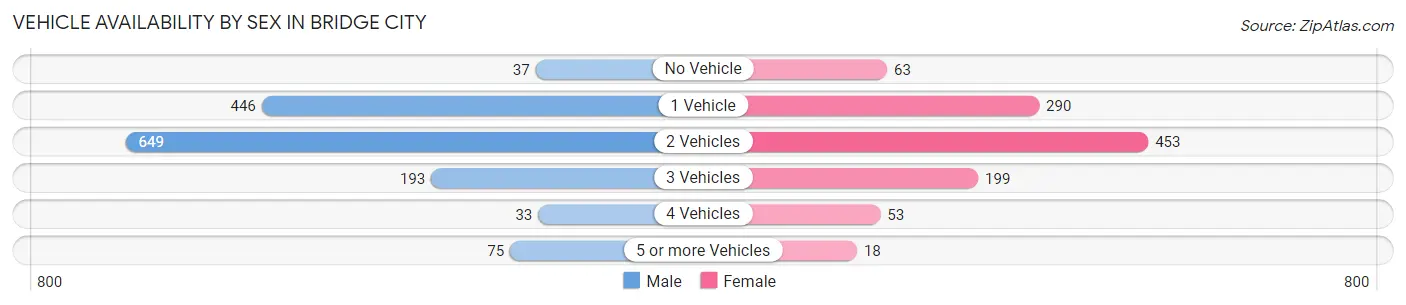
| Vehicles Available | Male | Female |
| No Vehicle | 37 (2.6%) | 63 (5.9%) |
| 1 Vehicle | 446 (31.1%) | 290 (27.0%) |
| 2 Vehicles | 649 (45.3%) | 453 (42.1%) |
| 3 Vehicles | 193 (13.5%) | 199 (18.5%) |
| 4 Vehicles | 33 (2.3%) | 53 (4.9%) |
| 5 or more Vehicles | 75 (5.2%) | 18 (1.7%) |
| Total | 1,433 (100.0%) | 1,076 (100.0%) |
Commute Time in Bridge City
The most frequently occuring commute durations in Bridge City are 15 to 19 minutes (463 commuters, 19.1%), 30 to 34 minutes (449 commuters, 18.5%), and 20 to 24 minutes (423 commuters, 17.4%).
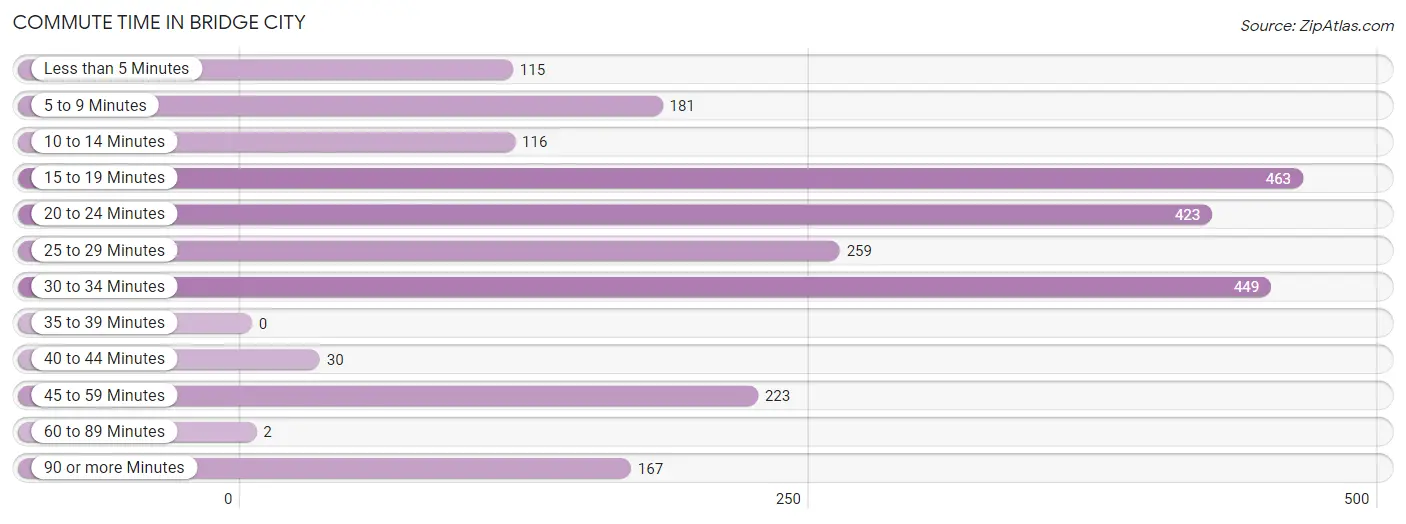
| Commute Time | # Commuters | % Commuters |
| Less than 5 Minutes | 115 | 4.7% |
| 5 to 9 Minutes | 181 | 7.4% |
| 10 to 14 Minutes | 116 | 4.8% |
| 15 to 19 Minutes | 463 | 19.1% |
| 20 to 24 Minutes | 423 | 17.4% |
| 25 to 29 Minutes | 259 | 10.7% |
| 30 to 34 Minutes | 449 | 18.5% |
| 35 to 39 Minutes | 0 | 0.0% |
| 40 to 44 Minutes | 30 | 1.2% |
| 45 to 59 Minutes | 223 | 9.2% |
| 60 to 89 Minutes | 2 | 0.1% |
| 90 or more Minutes | 167 | 6.9% |
Commute Time by Sex in Bridge City
The most common commute times in Bridge City are 30 to 34 minutes (332 commuters, 23.6%) for males and 25 to 29 minutes (239 commuters, 23.4%) for females.
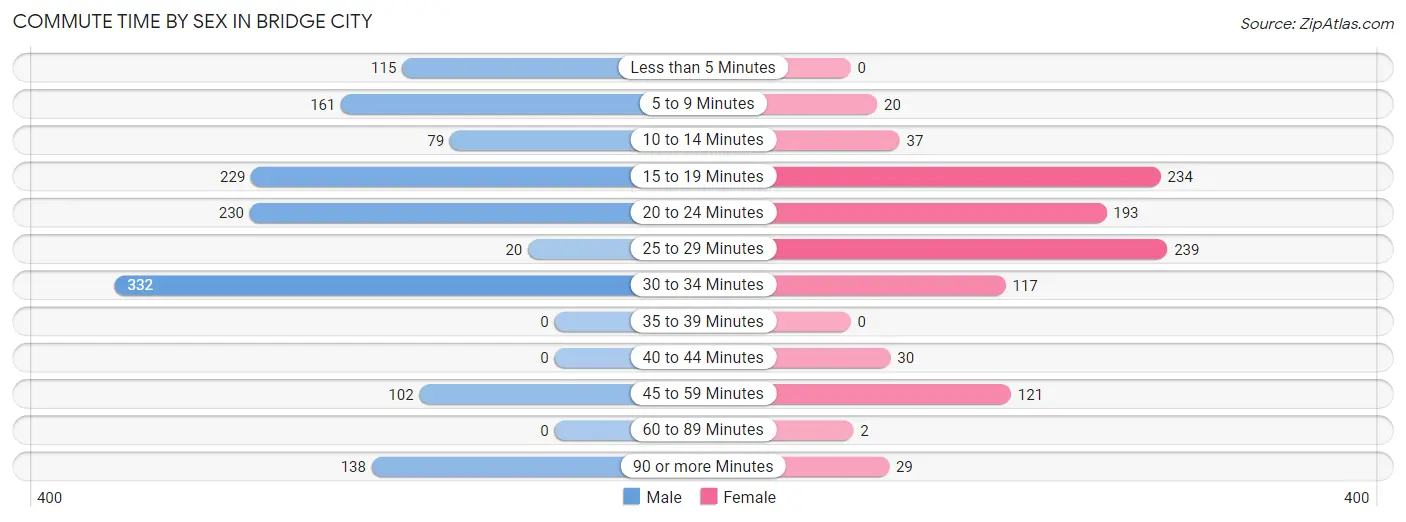
| Commute Time | Male | Female |
| Less than 5 Minutes | 115 (8.2%) | 0 (0.0%) |
| 5 to 9 Minutes | 161 (11.5%) | 20 (2.0%) |
| 10 to 14 Minutes | 79 (5.6%) | 37 (3.6%) |
| 15 to 19 Minutes | 229 (16.3%) | 234 (22.9%) |
| 20 to 24 Minutes | 230 (16.4%) | 193 (18.9%) |
| 25 to 29 Minutes | 20 (1.4%) | 239 (23.4%) |
| 30 to 34 Minutes | 332 (23.6%) | 117 (11.5%) |
| 35 to 39 Minutes | 0 (0.0%) | 0 (0.0%) |
| 40 to 44 Minutes | 0 (0.0%) | 30 (2.9%) |
| 45 to 59 Minutes | 102 (7.2%) | 121 (11.8%) |
| 60 to 89 Minutes | 0 (0.0%) | 2 (0.2%) |
| 90 or more Minutes | 138 (9.8%) | 29 (2.8%) |
Time of Departure to Work by Sex in Bridge City
The most frequent times of departure to work in Bridge City are 6:00 AM to 6:29 AM (238, 16.9%) for males and 7:00 AM to 7:29 AM (323, 31.6%) for females.
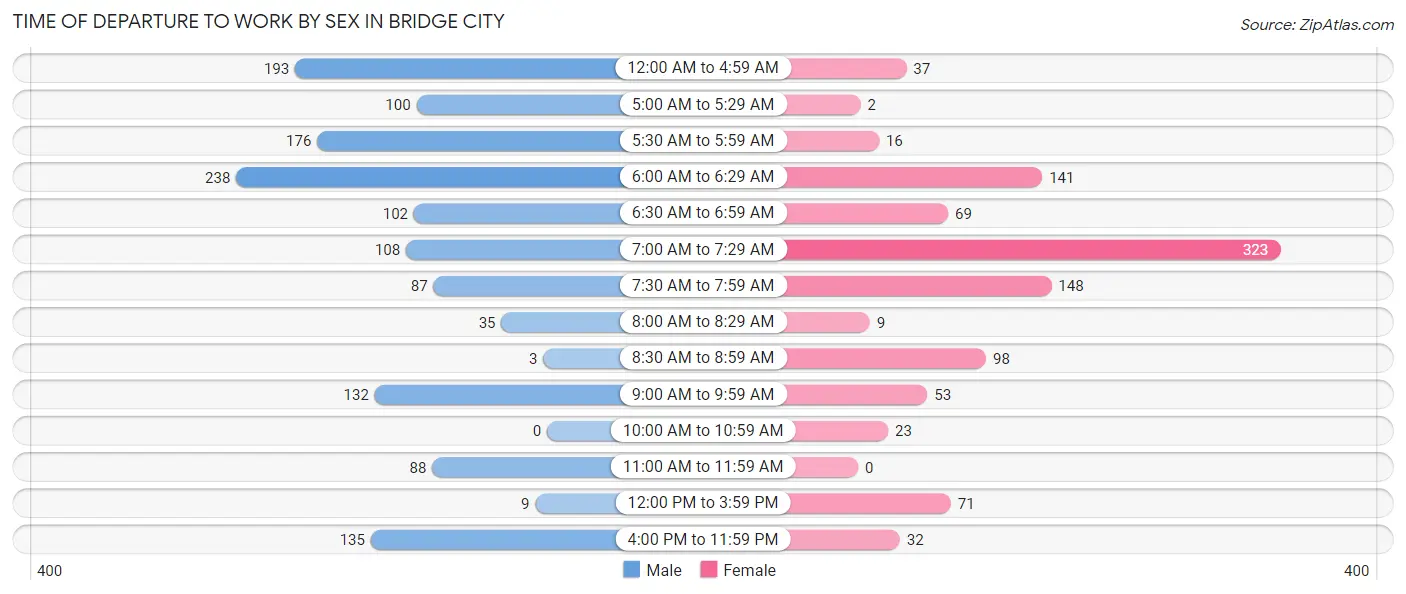
| Time of Departure | Male | Female |
| 12:00 AM to 4:59 AM | 193 (13.7%) | 37 (3.6%) |
| 5:00 AM to 5:29 AM | 100 (7.1%) | 2 (0.2%) |
| 5:30 AM to 5:59 AM | 176 (12.5%) | 16 (1.6%) |
| 6:00 AM to 6:29 AM | 238 (16.9%) | 141 (13.8%) |
| 6:30 AM to 6:59 AM | 102 (7.2%) | 69 (6.8%) |
| 7:00 AM to 7:29 AM | 108 (7.7%) | 323 (31.6%) |
| 7:30 AM to 7:59 AM | 87 (6.2%) | 148 (14.5%) |
| 8:00 AM to 8:29 AM | 35 (2.5%) | 9 (0.9%) |
| 8:30 AM to 8:59 AM | 3 (0.2%) | 98 (9.6%) |
| 9:00 AM to 9:59 AM | 132 (9.4%) | 53 (5.2%) |
| 10:00 AM to 10:59 AM | 0 (0.0%) | 23 (2.2%) |
| 11:00 AM to 11:59 AM | 88 (6.3%) | 0 (0.0%) |
| 12:00 PM to 3:59 PM | 9 (0.6%) | 71 (7.0%) |
| 4:00 PM to 11:59 PM | 135 (9.6%) | 32 (3.1%) |
| Total | 1,406 (100.0%) | 1,022 (100.0%) |
Housing Occupancy in Bridge City
Occupancy by Ownership in Bridge City
Of the total 2,582 dwellings in Bridge City, owner-occupied units account for 1,563 (60.5%), while renter-occupied units make up 1,019 (39.5%).
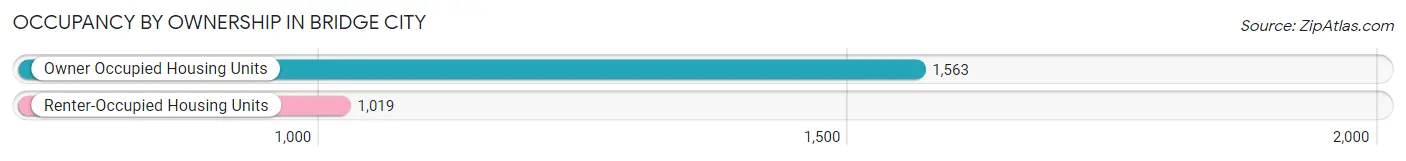
| Occupancy | # Housing Units | % Housing Units |
| Owner Occupied Housing Units | 1,563 | 60.5% |
| Renter-Occupied Housing Units | 1,019 | 39.5% |
| Total Occupied Housing Units | 2,582 | 100.0% |
Occupancy by Household Size in Bridge City
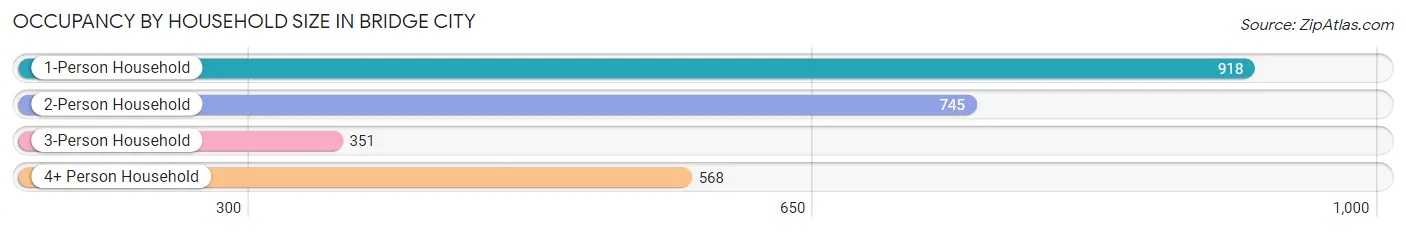
| Household Size | # Housing Units | % Housing Units |
| 1-Person Household | 918 | 35.5% |
| 2-Person Household | 745 | 28.8% |
| 3-Person Household | 351 | 13.6% |
| 4+ Person Household | 568 | 22.0% |
| Total Housing Units | 2,582 | 100.0% |
Occupancy by Ownership by Household Size in Bridge City
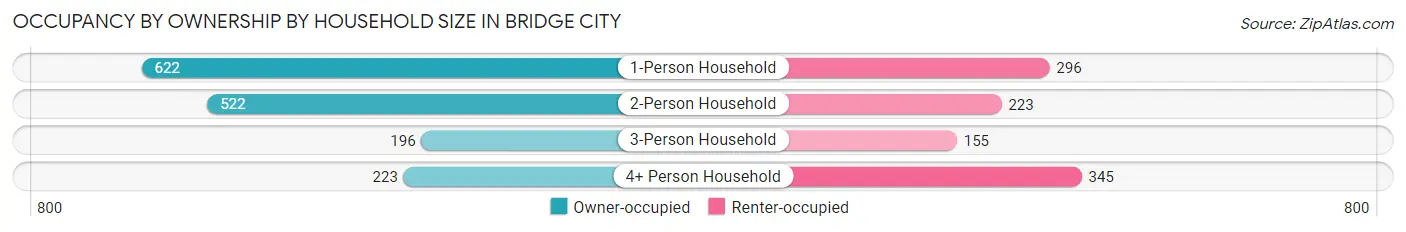
| Household Size | Owner-occupied | Renter-occupied |
| 1-Person Household | 622 (67.8%) | 296 (32.2%) |
| 2-Person Household | 522 (70.1%) | 223 (29.9%) |
| 3-Person Household | 196 (55.8%) | 155 (44.2%) |
| 4+ Person Household | 223 (39.3%) | 345 (60.7%) |
| Total Housing Units | 1,563 (60.5%) | 1,019 (39.5%) |
Occupancy by Educational Attainment in Bridge City
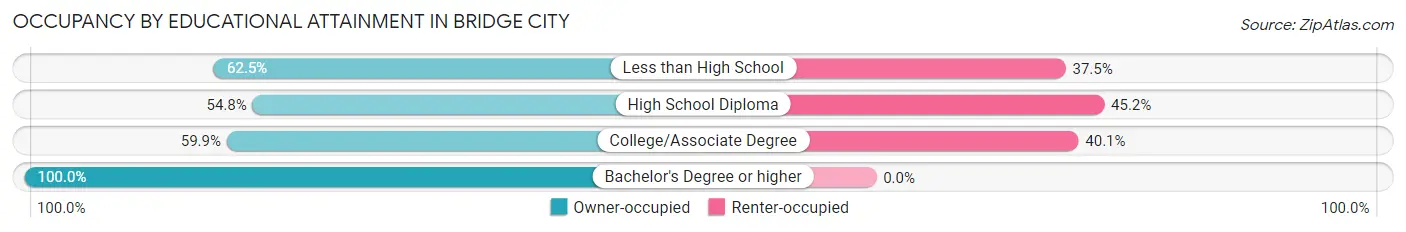
| Household Size | Owner-occupied | Renter-occupied |
| Less than High School | 406 (62.5%) | 244 (37.5%) |
| High School Diploma | 518 (54.8%) | 427 (45.2%) |
| College/Associate Degree | 520 (59.9%) | 348 (40.1%) |
| Bachelor's Degree or higher | 119 (100.0%) | 0 (0.0%) |
Occupancy by Age of Householder in Bridge City
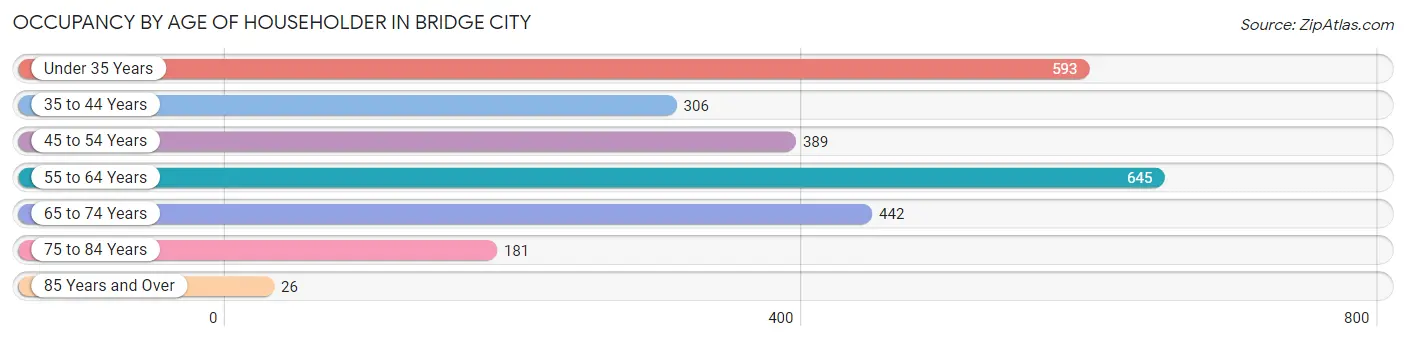
| Age Bracket | # Households | % Households |
| Under 35 Years | 593 | 23.0% |
| 35 to 44 Years | 306 | 11.8% |
| 45 to 54 Years | 389 | 15.1% |
| 55 to 64 Years | 645 | 25.0% |
| 65 to 74 Years | 442 | 17.1% |
| 75 to 84 Years | 181 | 7.0% |
| 85 Years and Over | 26 | 1.0% |
| Total | 2,582 | 100.0% |
Housing Finances in Bridge City
Median Income by Occupancy in Bridge City
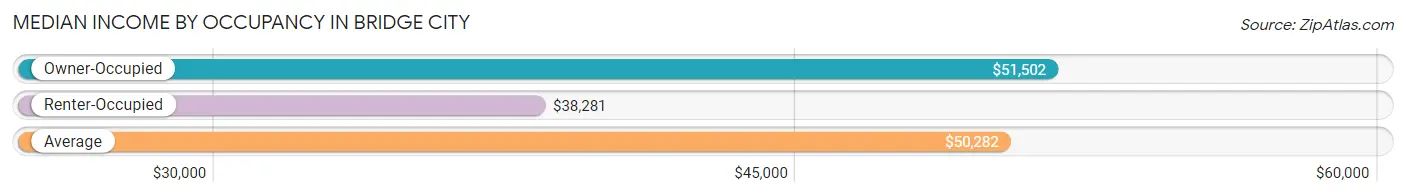
| Occupancy Type | # Households | Median Income |
| Owner-Occupied | 1,563 (60.5%) | $51,502 |
| Renter-Occupied | 1,019 (39.5%) | $38,281 |
| Average | 2,582 (100.0%) | $50,282 |
Occupancy by Householder Income Bracket in Bridge City
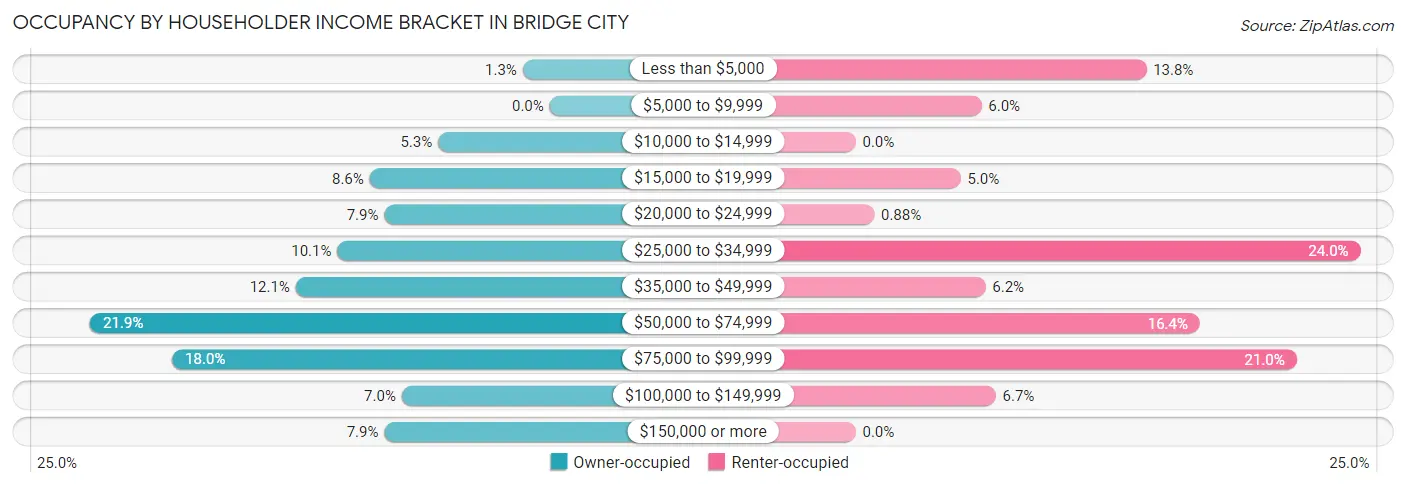
| Income Bracket | Owner-occupied | Renter-occupied |
| Less than $5,000 | 20 (1.3%) | 141 (13.8%) |
| $5,000 to $9,999 | 0 (0.0%) | 61 (6.0%) |
| $10,000 to $14,999 | 83 (5.3%) | 0 (0.0%) |
| $15,000 to $19,999 | 134 (8.6%) | 51 (5.0%) |
| $20,000 to $24,999 | 123 (7.9%) | 9 (0.9%) |
| $25,000 to $34,999 | 158 (10.1%) | 245 (24.0%) |
| $35,000 to $49,999 | 189 (12.1%) | 63 (6.2%) |
| $50,000 to $74,999 | 342 (21.9%) | 167 (16.4%) |
| $75,000 to $99,999 | 281 (18.0%) | 214 (21.0%) |
| $100,000 to $149,999 | 110 (7.0%) | 68 (6.7%) |
| $150,000 or more | 123 (7.9%) | 0 (0.0%) |
| Total | 1,563 (100.0%) | 1,019 (100.0%) |
Monthly Housing Cost Tiers in Bridge City
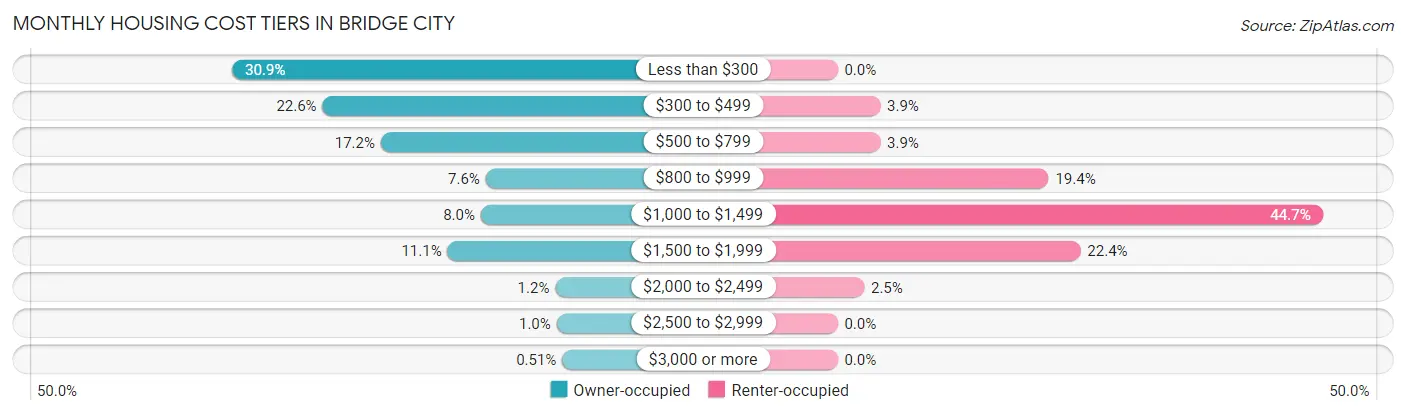
| Monthly Cost | Owner-occupied | Renter-occupied |
| Less than $300 | 483 (30.9%) | 0 (0.0%) |
| $300 to $499 | 353 (22.6%) | 40 (3.9%) |
| $500 to $799 | 269 (17.2%) | 40 (3.9%) |
| $800 to $999 | 118 (7.5%) | 198 (19.4%) |
| $1,000 to $1,499 | 125 (8.0%) | 455 (44.7%) |
| $1,500 to $1,999 | 173 (11.1%) | 228 (22.4%) |
| $2,000 to $2,499 | 18 (1.1%) | 25 (2.5%) |
| $2,500 to $2,999 | 16 (1.0%) | 0 (0.0%) |
| $3,000 or more | 8 (0.5%) | 0 (0.0%) |
| Total | 1,563 (100.0%) | 1,019 (100.0%) |
Physical Housing Characteristics in Bridge City
Housing Structures in Bridge City
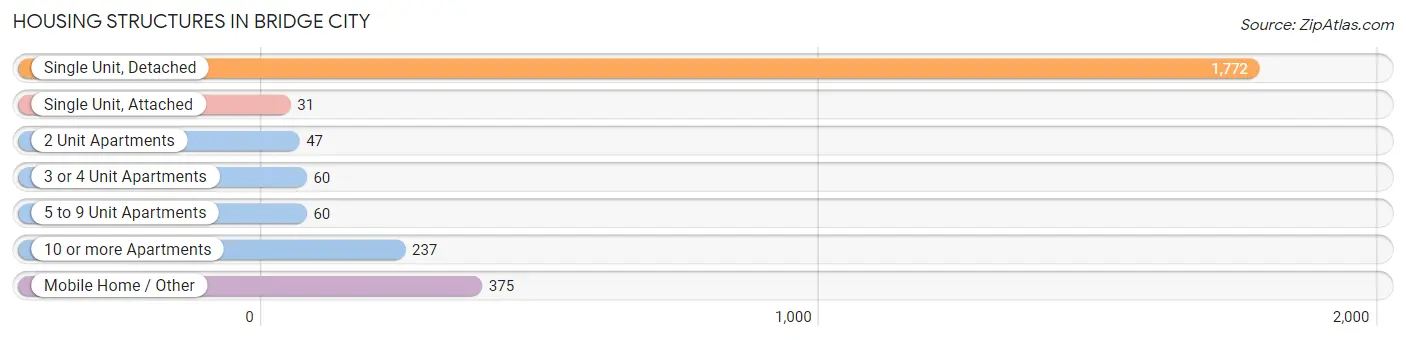
| Structure Type | # Housing Units | % Housing Units |
| Single Unit, Detached | 1,772 | 68.6% |
| Single Unit, Attached | 31 | 1.2% |
| 2 Unit Apartments | 47 | 1.8% |
| 3 or 4 Unit Apartments | 60 | 2.3% |
| 5 to 9 Unit Apartments | 60 | 2.3% |
| 10 or more Apartments | 237 | 9.2% |
| Mobile Home / Other | 375 | 14.5% |
| Total | 2,582 | 100.0% |
Housing Structures by Occupancy in Bridge City
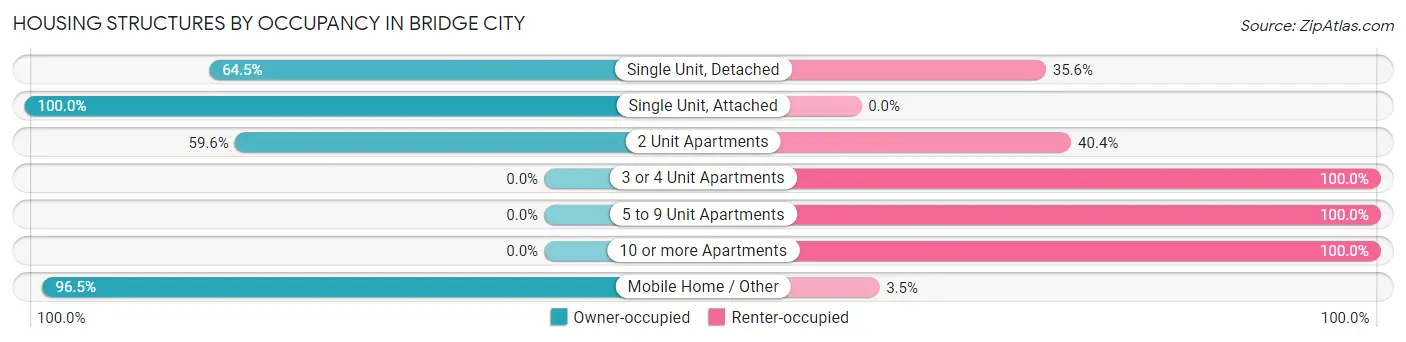
| Structure Type | Owner-occupied | Renter-occupied |
| Single Unit, Detached | 1,142 (64.4%) | 630 (35.5%) |
| Single Unit, Attached | 31 (100.0%) | 0 (0.0%) |
| 2 Unit Apartments | 28 (59.6%) | 19 (40.4%) |
| 3 or 4 Unit Apartments | 0 (0.0%) | 60 (100.0%) |
| 5 to 9 Unit Apartments | 0 (0.0%) | 60 (100.0%) |
| 10 or more Apartments | 0 (0.0%) | 237 (100.0%) |
| Mobile Home / Other | 362 (96.5%) | 13 (3.5%) |
| Total | 1,563 (60.5%) | 1,019 (39.5%) |
Housing Structures by Number of Rooms in Bridge City
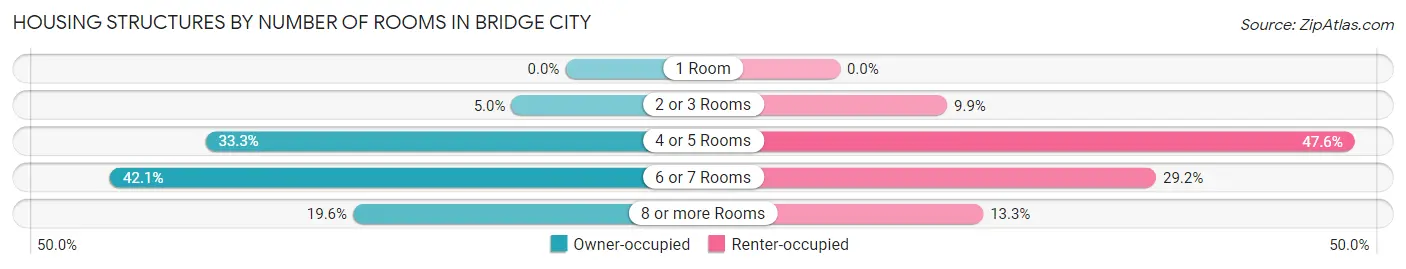
| Number of Rooms | Owner-occupied | Renter-occupied |
| 1 Room | 0 (0.0%) | 0 (0.0%) |
| 2 or 3 Rooms | 78 (5.0%) | 101 (9.9%) |
| 4 or 5 Rooms | 520 (33.3%) | 485 (47.6%) |
| 6 or 7 Rooms | 658 (42.1%) | 298 (29.2%) |
| 8 or more Rooms | 307 (19.6%) | 135 (13.3%) |
| Total | 1,563 (100.0%) | 1,019 (100.0%) |
Housing Structure by Heating Type in Bridge City
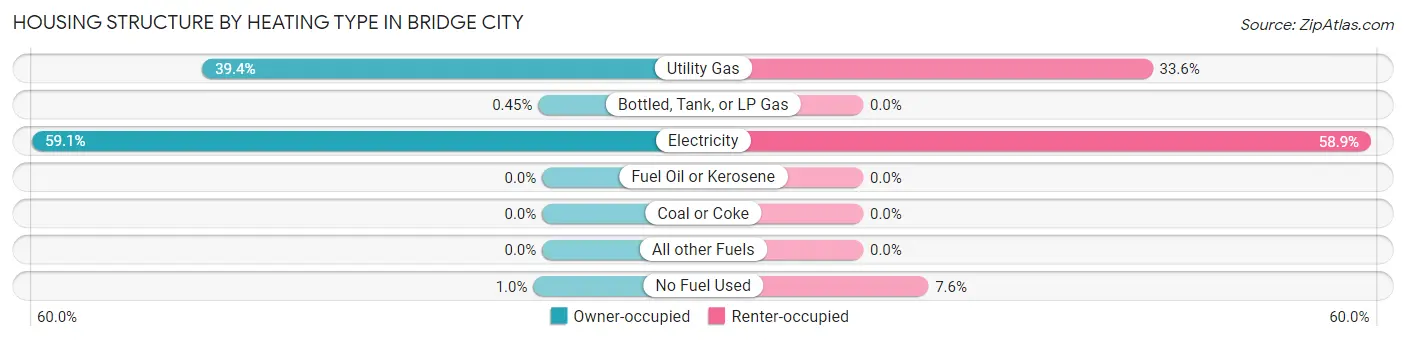
| Heating Type | Owner-occupied | Renter-occupied |
| Utility Gas | 616 (39.4%) | 342 (33.6%) |
| Bottled, Tank, or LP Gas | 7 (0.4%) | 0 (0.0%) |
| Electricity | 924 (59.1%) | 600 (58.9%) |
| Fuel Oil or Kerosene | 0 (0.0%) | 0 (0.0%) |
| Coal or Coke | 0 (0.0%) | 0 (0.0%) |
| All other Fuels | 0 (0.0%) | 0 (0.0%) |
| No Fuel Used | 16 (1.0%) | 77 (7.6%) |
| Total | 1,563 (100.0%) | 1,019 (100.0%) |
Household Vehicle Usage in Bridge City
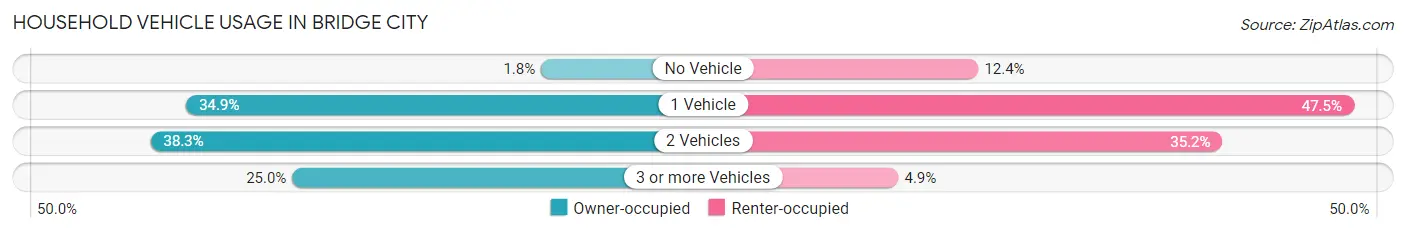
| Vehicles per Household | Owner-occupied | Renter-occupied |
| No Vehicle | 28 (1.8%) | 126 (12.4%) |
| 1 Vehicle | 546 (34.9%) | 484 (47.5%) |
| 2 Vehicles | 598 (38.3%) | 359 (35.2%) |
| 3 or more Vehicles | 391 (25.0%) | 50 (4.9%) |
| Total | 1,563 (100.0%) | 1,019 (100.0%) |
Real Estate & Mortgages in Bridge City
Real Estate and Mortgage Overview in Bridge City
| Characteristic | Without Mortgage | With Mortgage |
| Housing Units | 1,073 | 490 |
| Median Property Value | $89,800 | $141,900 |
| Median Household Income | $50,801 | $61 |
| Monthly Housing Costs | $329 | $8 |
| Real Estate Taxes | $652 | $170 |
Property Value by Mortgage Status in Bridge City
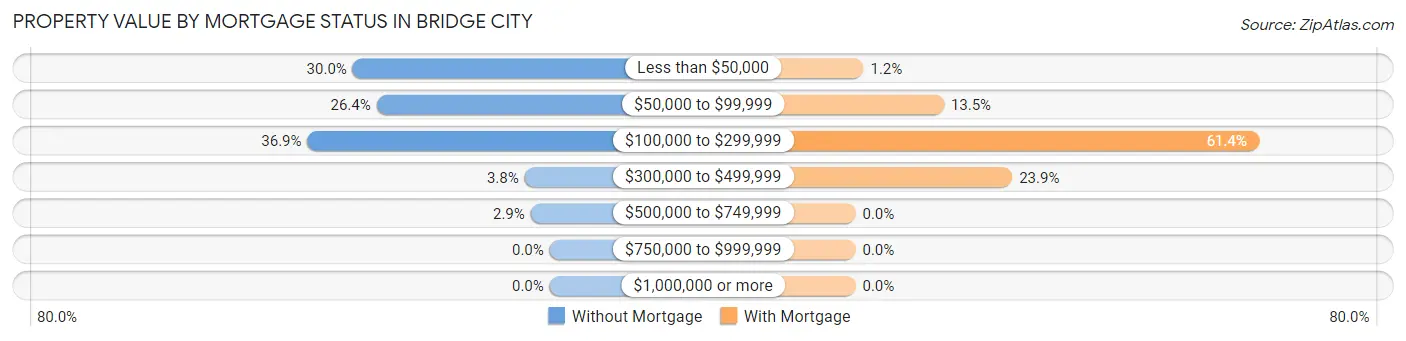
| Property Value | Without Mortgage | With Mortgage |
| Less than $50,000 | 322 (30.0%) | 6 (1.2%) |
| $50,000 to $99,999 | 283 (26.4%) | 66 (13.5%) |
| $100,000 to $299,999 | 396 (36.9%) | 301 (61.4%) |
| $300,000 to $499,999 | 41 (3.8%) | 117 (23.9%) |
| $500,000 to $749,999 | 31 (2.9%) | 0 (0.0%) |
| $750,000 to $999,999 | 0 (0.0%) | 0 (0.0%) |
| $1,000,000 or more | 0 (0.0%) | 0 (0.0%) |
| Total | 1,073 (100.0%) | 490 (100.0%) |
Household Income by Mortgage Status in Bridge City
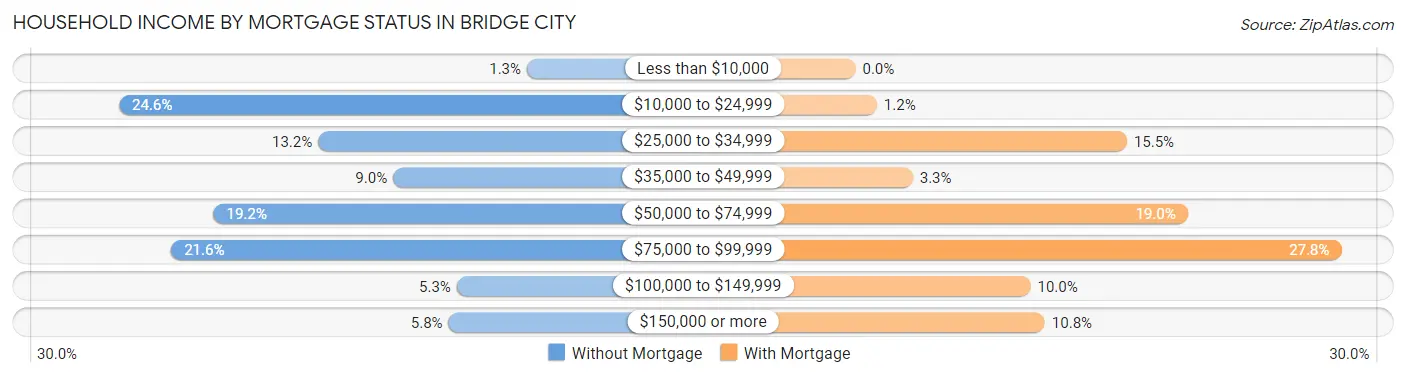
| Household Income | Without Mortgage | With Mortgage |
| Less than $10,000 | 14 (1.3%) | 0 (0.0%) |
| $10,000 to $24,999 | 264 (24.6%) | 6 (1.2%) |
| $25,000 to $34,999 | 142 (13.2%) | 76 (15.5%) |
| $35,000 to $49,999 | 96 (8.9%) | 16 (3.3%) |
| $50,000 to $74,999 | 206 (19.2%) | 93 (19.0%) |
| $75,000 to $99,999 | 232 (21.6%) | 136 (27.8%) |
| $100,000 to $149,999 | 57 (5.3%) | 49 (10.0%) |
| $150,000 or more | 62 (5.8%) | 53 (10.8%) |
| Total | 1,073 (100.0%) | 490 (100.0%) |
Property Value to Household Income Ratio in Bridge City
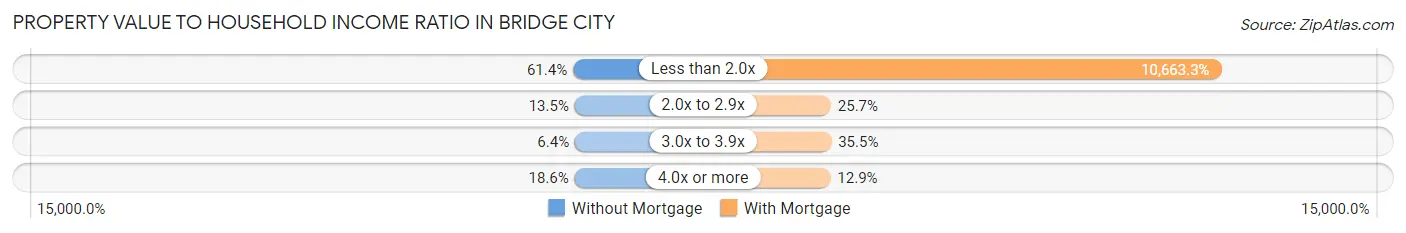
| Value-to-Income Ratio | Without Mortgage | With Mortgage |
| Less than 2.0x | 659 (61.4%) | 52,250 (10,663.3%) |
| 2.0x to 2.9x | 145 (13.5%) | 126 (25.7%) |
| 3.0x to 3.9x | 69 (6.4%) | 174 (35.5%) |
| 4.0x or more | 200 (18.6%) | 63 (12.9%) |
| Total | 1,073 (100.0%) | 490 (100.0%) |
Real Estate Taxes by Mortgage Status in Bridge City
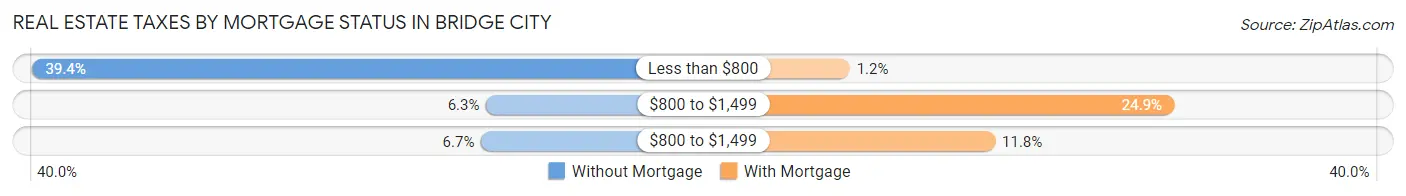
| Property Taxes | Without Mortgage | With Mortgage |
| Less than $800 | 423 (39.4%) | 6 (1.2%) |
| $800 to $1,499 | 68 (6.3%) | 122 (24.9%) |
| $800 to $1,499 | 72 (6.7%) | 58 (11.8%) |
| Total | 1,073 (100.0%) | 490 (100.0%) |
Health & Disability in Bridge City
Health Insurance Coverage by Age in Bridge City
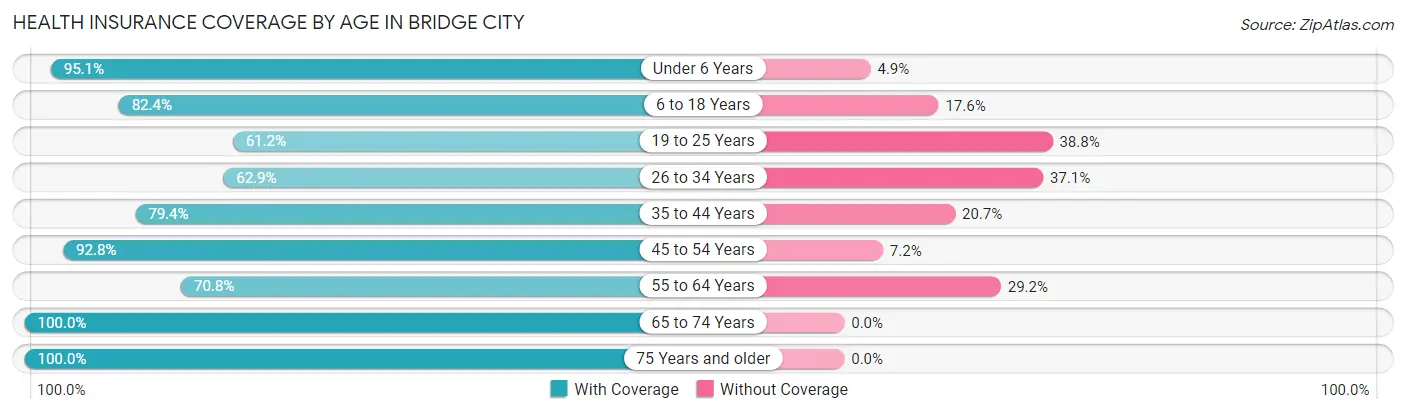
| Age Bracket | With Coverage | Without Coverage |
| Under 6 Years | 583 (95.1%) | 30 (4.9%) |
| 6 to 18 Years | 1,380 (82.4%) | 294 (17.6%) |
| 19 to 25 Years | 156 (61.2%) | 99 (38.8%) |
| 26 to 34 Years | 608 (62.9%) | 358 (37.1%) |
| 35 to 44 Years | 515 (79.3%) | 134 (20.6%) |
| 45 to 54 Years | 683 (92.8%) | 53 (7.2%) |
| 55 to 64 Years | 728 (70.8%) | 300 (29.2%) |
| 65 to 74 Years | 631 (100.0%) | 0 (0.0%) |
| 75 Years and older | 231 (100.0%) | 0 (0.0%) |
| Total | 5,515 (81.3%) | 1,268 (18.7%) |
Health Insurance Coverage by Citizenship Status in Bridge City
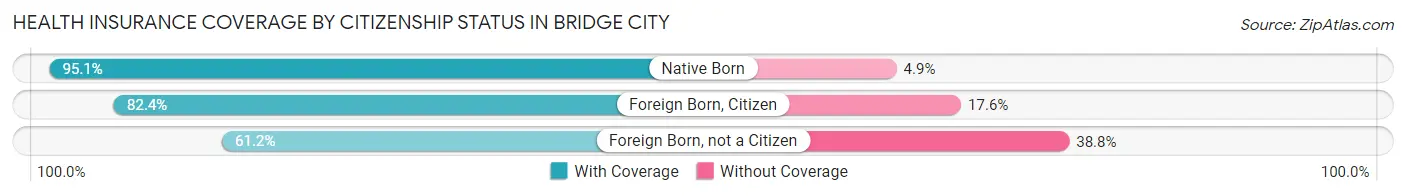
| Citizenship Status | With Coverage | Without Coverage |
| Native Born | 583 (95.1%) | 30 (4.9%) |
| Foreign Born, Citizen | 1,380 (82.4%) | 294 (17.6%) |
| Foreign Born, not a Citizen | 156 (61.2%) | 99 (38.8%) |
Health Insurance Coverage by Household Income in Bridge City
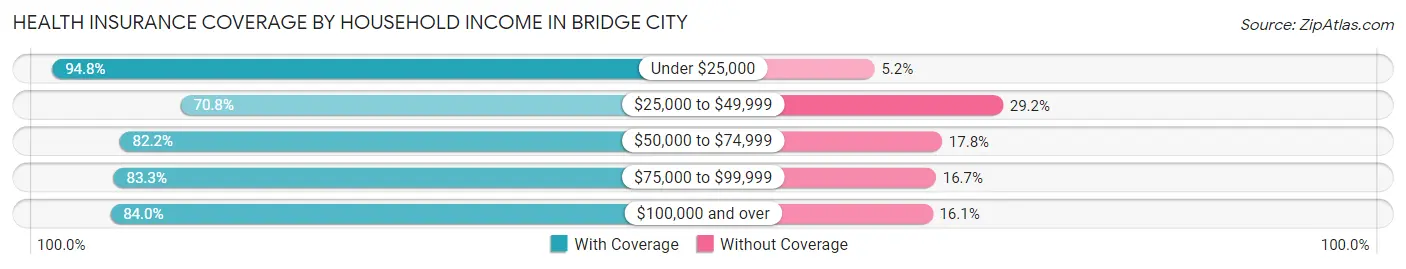
| Household Income | With Coverage | Without Coverage |
| Under $25,000 | 1,135 (94.8%) | 62 (5.2%) |
| $25,000 to $49,999 | 1,496 (70.8%) | 618 (29.2%) |
| $50,000 to $74,999 | 1,079 (82.2%) | 234 (17.8%) |
| $75,000 to $99,999 | 1,005 (83.3%) | 201 (16.7%) |
| $100,000 and over | 800 (84.0%) | 153 (16.1%) |
Public vs Private Health Insurance Coverage by Age in Bridge City
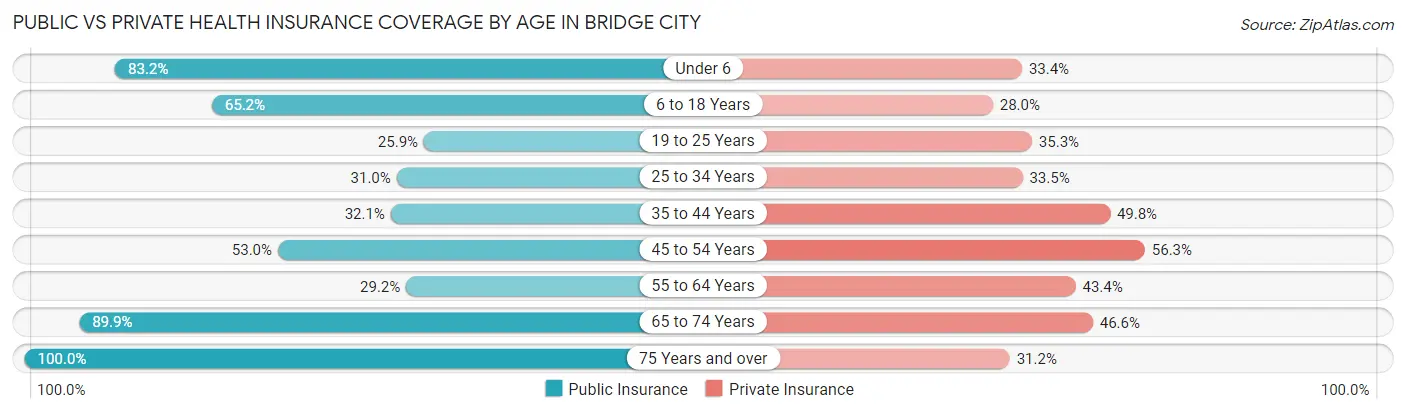
| Age Bracket | Public Insurance | Private Insurance |
| Under 6 | 510 (83.2%) | 205 (33.4%) |
| 6 to 18 Years | 1,092 (65.2%) | 469 (28.0%) |
| 19 to 25 Years | 66 (25.9%) | 90 (35.3%) |
| 25 to 34 Years | 299 (30.9%) | 324 (33.5%) |
| 35 to 44 Years | 208 (32.1%) | 323 (49.8%) |
| 45 to 54 Years | 390 (53.0%) | 414 (56.2%) |
| 55 to 64 Years | 300 (29.2%) | 446 (43.4%) |
| 65 to 74 Years | 567 (89.9%) | 294 (46.6%) |
| 75 Years and over | 231 (100.0%) | 72 (31.2%) |
| Total | 3,663 (54.0%) | 2,637 (38.9%) |
Disability Status by Sex by Age in Bridge City
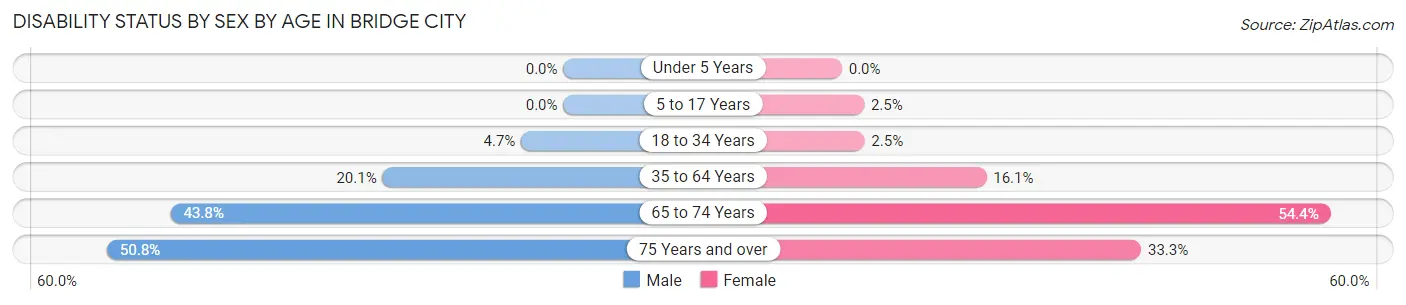
| Age Bracket | Male | Female |
| Under 5 Years | 0 (0.0%) | 0 (0.0%) |
| 5 to 17 Years | 0 (0.0%) | 20 (2.5%) |
| 18 to 34 Years | 32 (4.7%) | 18 (2.5%) |
| 35 to 64 Years | 257 (20.1%) | 183 (16.1%) |
| 65 to 74 Years | 133 (43.8%) | 178 (54.4%) |
| 75 Years and over | 61 (50.8%) | 37 (33.3%) |
Disability Class by Sex by Age in Bridge City
Disability Class: Hearing Difficulty
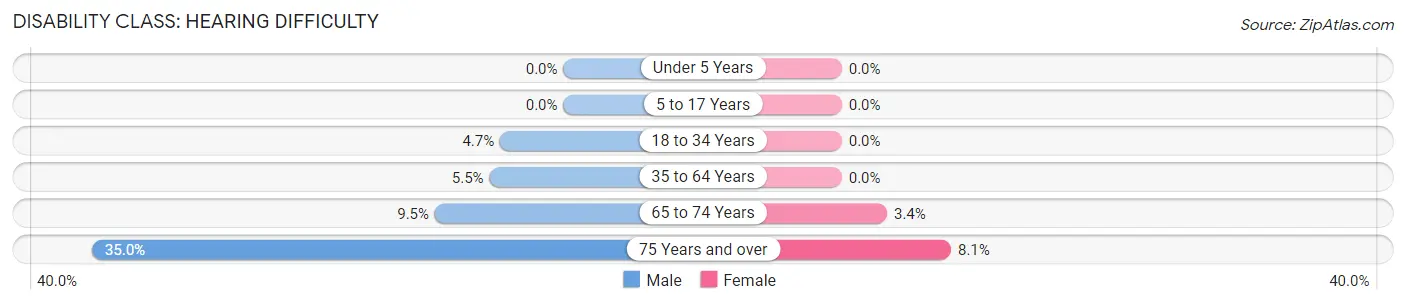
| Age Bracket | Male | Female |
| Under 5 Years | 0 (0.0%) | 0 (0.0%) |
| 5 to 17 Years | 0 (0.0%) | 0 (0.0%) |
| 18 to 34 Years | 32 (4.7%) | 0 (0.0%) |
| 35 to 64 Years | 70 (5.5%) | 0 (0.0%) |
| 65 to 74 Years | 29 (9.5%) | 11 (3.4%) |
| 75 Years and over | 42 (35.0%) | 9 (8.1%) |
Disability Class: Vision Difficulty
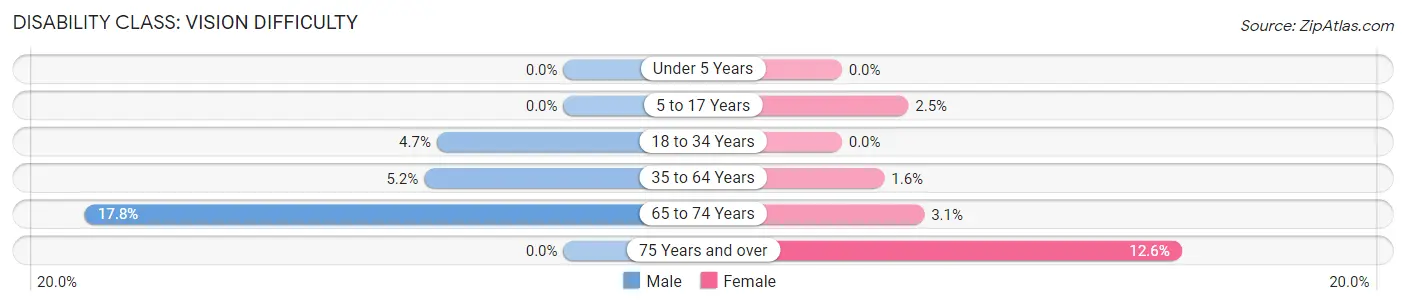
| Age Bracket | Male | Female |
| Under 5 Years | 0 (0.0%) | 0 (0.0%) |
| 5 to 17 Years | 0 (0.0%) | 20 (2.5%) |
| 18 to 34 Years | 32 (4.7%) | 0 (0.0%) |
| 35 to 64 Years | 66 (5.2%) | 18 (1.6%) |
| 65 to 74 Years | 54 (17.8%) | 10 (3.1%) |
| 75 Years and over | 0 (0.0%) | 14 (12.6%) |
Disability Class: Cognitive Difficulty
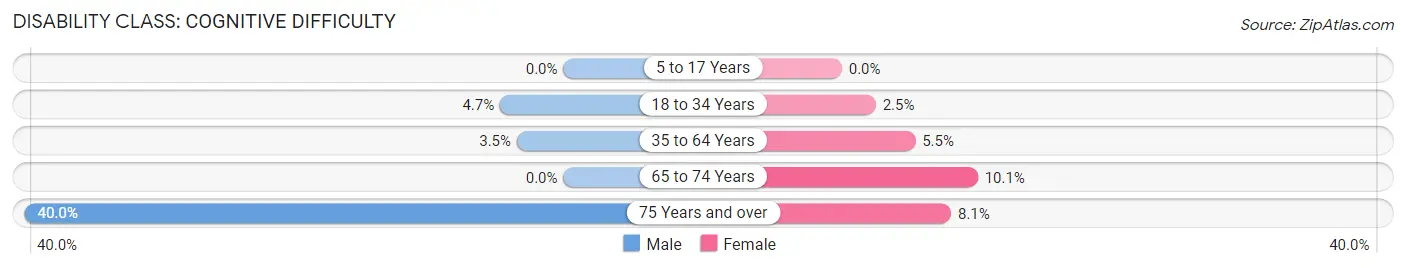
| Age Bracket | Male | Female |
| 5 to 17 Years | 0 (0.0%) | 0 (0.0%) |
| 18 to 34 Years | 32 (4.7%) | 18 (2.5%) |
| 35 to 64 Years | 44 (3.5%) | 62 (5.4%) |
| 65 to 74 Years | 0 (0.0%) | 33 (10.1%) |
| 75 Years and over | 48 (40.0%) | 9 (8.1%) |
Disability Class: Ambulatory Difficulty
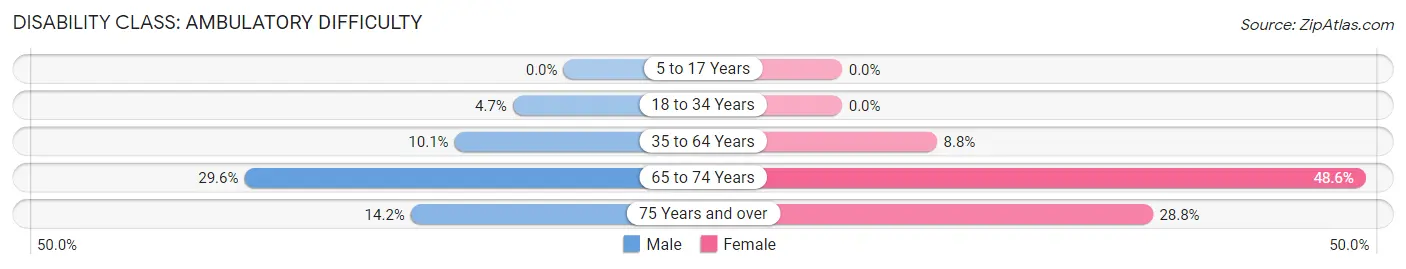
| Age Bracket | Male | Female |
| 5 to 17 Years | 0 (0.0%) | 0 (0.0%) |
| 18 to 34 Years | 32 (4.7%) | 0 (0.0%) |
| 35 to 64 Years | 129 (10.1%) | 100 (8.8%) |
| 65 to 74 Years | 90 (29.6%) | 159 (48.6%) |
| 75 Years and over | 17 (14.2%) | 32 (28.8%) |
Disability Class: Self-Care Difficulty
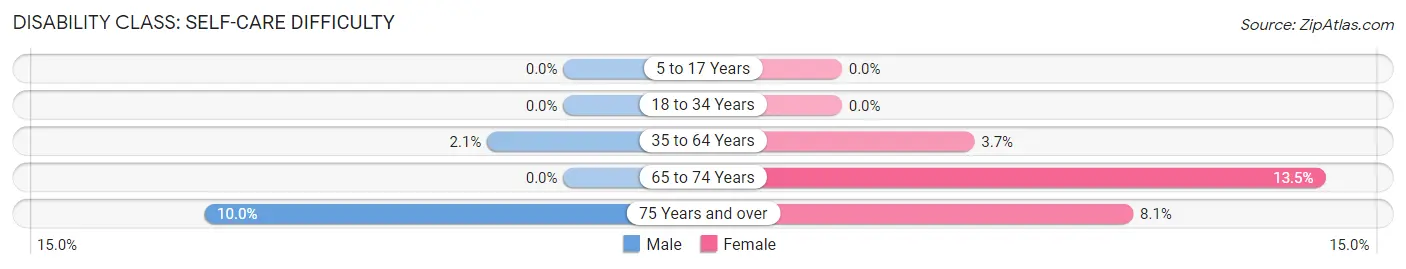
| Age Bracket | Male | Female |
| 5 to 17 Years | 0 (0.0%) | 0 (0.0%) |
| 18 to 34 Years | 0 (0.0%) | 0 (0.0%) |
| 35 to 64 Years | 27 (2.1%) | 42 (3.7%) |
| 65 to 74 Years | 0 (0.0%) | 44 (13.5%) |
| 75 Years and over | 12 (10.0%) | 9 (8.1%) |
Technology Access in Bridge City
Computing Device Access in Bridge City
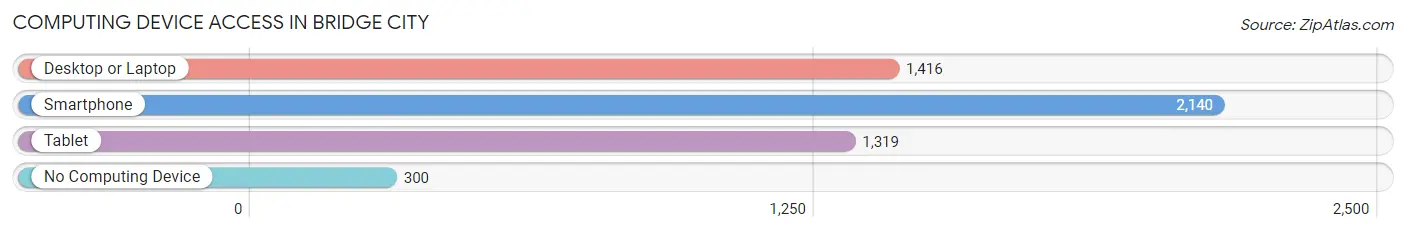
| Device Type | # Households | % Households |
| Desktop or Laptop | 1,416 | 54.8% |
| Smartphone | 2,140 | 82.9% |
| Tablet | 1,319 | 51.1% |
| No Computing Device | 300 | 11.6% |
| Total | 2,582 | 100.0% |
Internet Access in Bridge City
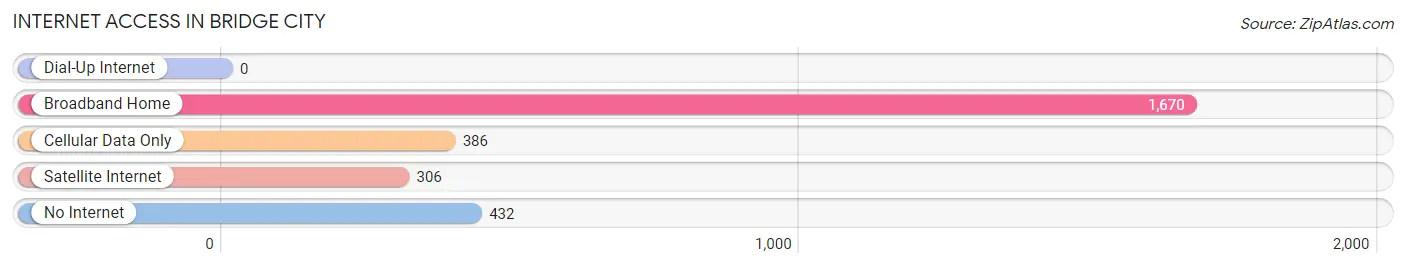
| Internet Type | # Households | % Households |
| Dial-Up Internet | 0 | 0.0% |
| Broadband Home | 1,670 | 64.7% |
| Cellular Data Only | 386 | 14.9% |
| Satellite Internet | 306 | 11.8% |
| No Internet | 432 | 16.7% |
| Total | 2,582 | 100.0% |
Bridge City Summary
City of Bridge City Louisiana
Bridge City is a small city located in Jefferson Parish, Louisiana. It is situated on the west bank of the Mississippi River, just south of New Orleans. The city is part of the Greater New Orleans Metropolitan Area and is home to a population of approximately 8,000 people.
History
The area that is now Bridge City was originally inhabited by Native American tribes, including the Choctaw and Houma. The first European settlers arrived in the area in the late 1700s, and the area was eventually incorporated as the town of Bridge City in 1883. The town was named for the bridge that was built across the Mississippi River in 1884.
The town grew steadily throughout the late 19th and early 20th centuries, and by the 1950s, it had become a thriving community. The city was home to a number of businesses, including a shipbuilding company, a sugar refinery, and a paper mill.
In the 1960s, the city began to experience a decline in population and economic activity. This was due in part to the construction of the Huey P. Long Bridge, which diverted traffic away from the city. The city also suffered from the effects of Hurricane Katrina in 2005, which caused extensive damage to the city.
Geography
Bridge City is located in Jefferson Parish, Louisiana, on the west bank of the Mississippi River. The city is situated just south of New Orleans and is part of the Greater New Orleans Metropolitan Area. The city covers an area of approximately 4.5 square miles and has a population of approximately 8,000 people.
The city is bordered by the Mississippi River to the east, the Intracoastal Waterway to the south, and the Gulf of Mexico to the west. The city is also home to a number of parks and recreational areas, including the Bridge City Park, the Bridge City Nature Trail, and the Bridge City Marina.
Economy
Bridge City is home to a number of businesses and industries, including shipbuilding, sugar refining, and paper milling. The city is also home to a number of retail stores, restaurants, and other businesses.
The city is also home to a number of educational institutions, including the University of New Orleans, Tulane University, and the University of Louisiana at Lafayette.
Demographics
As of the 2010 census, the population of Bridge City was 8,000 people. The racial makeup of the city was 79.3% White, 15.2% African American, 0.7% Native American, 0.7% Asian, 0.1% Pacific Islander, and 3.9% from other races. The median household income was $37,941, and the median family income was $45,941.
Conclusion
Bridge City is a small city located in Jefferson Parish, Louisiana. It is situated on the west bank of the Mississippi River, just south of New Orleans. The city is part of the Greater New Orleans Metropolitan Area and is home to a population of approximately 8,000 people. The city is home to a number of businesses and industries, including shipbuilding, sugar refining, and paper milling. The city is also home to a number of educational institutions, including the University of New Orleans, Tulane University, and the University of Louisiana at Lafayette. The racial makeup of the city was 79.3% White, 15.2% African American, 0.7% Native American, 0.7% Asian, 0.1% Pacific Islander, and 3.9% from other races. The median household income was $37,941, and the median family income was $45,941. Bridge City is a vibrant and diverse community that offers a variety of opportunities for its residents.
Common Questions
What is Per Capita Income in Bridge City?
Per Capita income in Bridge City is $22,152.
What is the Median Family Income in Bridge City?
Median Family Income in Bridge City is $56,628.
What is the Median Household income in Bridge City?
Median Household Income in Bridge City is $50,282.
What is Income or Wage Gap in Bridge City?
Income or Wage Gap in Bridge City is 43.7%.
Women in Bridge City earn 56.3 cents for every dollar earned by a man.
What is Inequality or Gini Index in Bridge City?
Inequality or Gini Index in Bridge City is 0.40.
What is the Total Population of Bridge City?
Total Population of Bridge City is 6,916.
What is the Total Male Population of Bridge City?
Total Male Population of Bridge City is 3,631.
What is the Total Female Population of Bridge City?
Total Female Population of Bridge City is 3,285.
What is the Ratio of Males per 100 Females in Bridge City?
There are 110.53 Males per 100 Females in Bridge City.
What is the Ratio of Females per 100 Males in Bridge City?
There are 90.47 Females per 100 Males in Bridge City.
What is the Median Population Age in Bridge City?
Median Population Age in Bridge City is 32.7 Years.
What is the Average Family Size in Bridge City
Average Family Size in Bridge City is 3.4 People.
What is the Average Household Size in Bridge City
Average Household Size in Bridge City is 2.6 People.
How Large is the Labor Force in Bridge City?
There are 3,038 People in the Labor Forcein in Bridge City.
What is the Percentage of People in the Labor Force in Bridge City?
61.3% of People are in the Labor Force in Bridge City.
What is the Unemployment Rate in Bridge City?
Unemployment Rate in Bridge City is 10.9%.