Fearrington Village, NC Map & Demographics
Fearrington Village Map
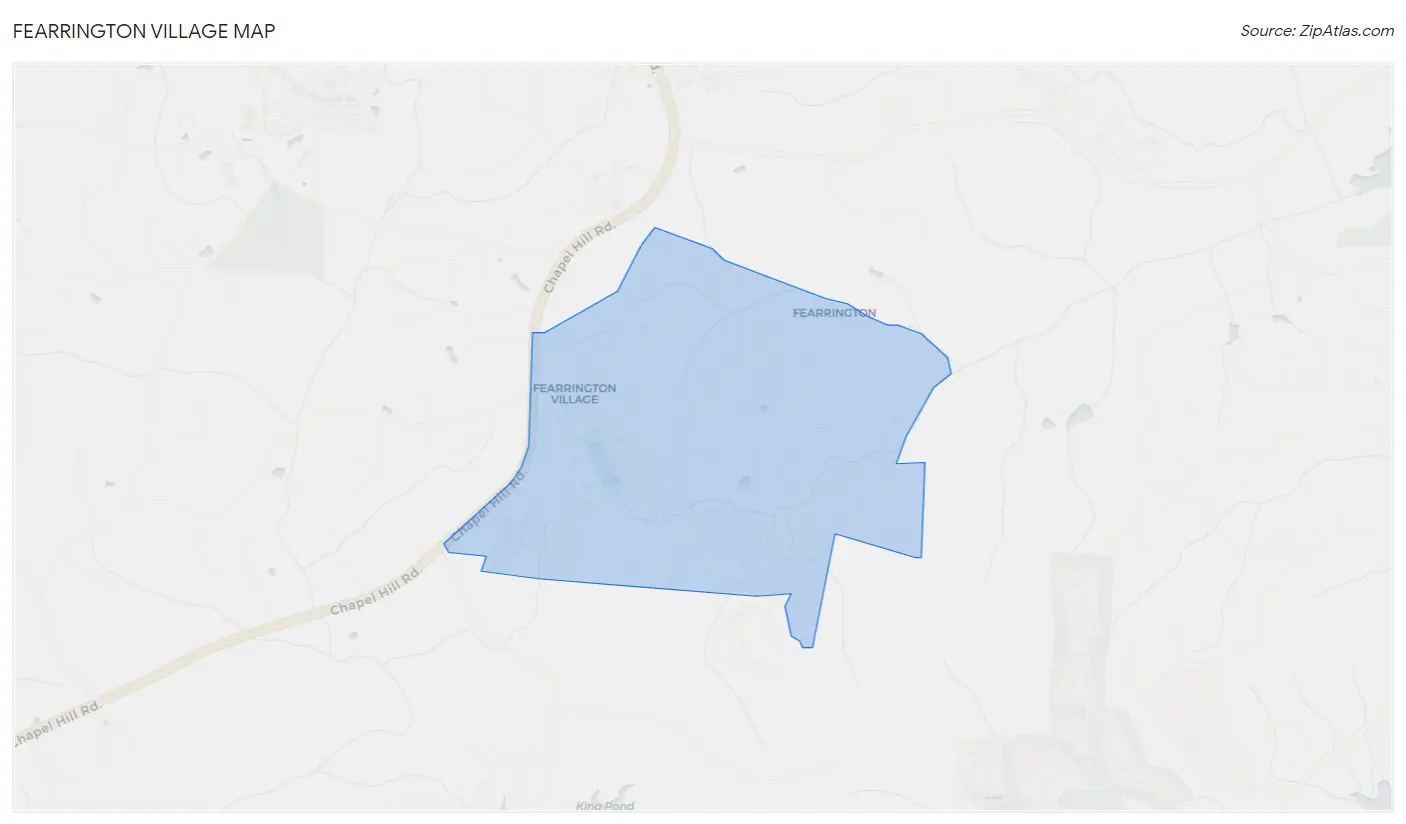
Fearrington Village Overview
$72,581
PER CAPITA INCOME
$135,597
AVG FAMILY INCOME
$95,391
AVG HOUSEHOLD INCOME
0.41
INEQUALITY / GINI INDEX
2,582
TOTAL POPULATION
1,104
MALE POPULATION
1,478
FEMALE POPULATION
74.70
MALES / 100 FEMALES
133.88
FEMALES / 100 MALES
73.7
MEDIAN AGE
2.2
AVG FAMILY SIZE
1.7
AVG HOUSEHOLD SIZE
558
LABOR FORCE [ PEOPLE ]
21.6%
PERCENT IN LABOR FORCE
Fearrington Village Area Codes
Income in Fearrington Village
Income Overview in Fearrington Village
Per Capita Income in Fearrington Village is $72,581, while median incomes of families and households are $135,597 and $95,391 respectively.
| Characteristic | Number | Measure |
| Per Capita Income | 2,582 | $72,581 |
| Median Family Income | 765 | $135,597 |
| Mean Family Income | 765 | $144,419 |
| Median Household Income | 1,516 | $95,391 |
| Mean Household Income | 1,516 | $123,756 |
| Income Deficit | 765 | $0 |
| Wage / Income Gap (%) | 2,582 | 0.00% |
| Wage / Income Gap ($) | 2,582 | 100.00¢ per $1 |
| Gini / Inequality Index | 2,582 | 0.41 |
Earnings by Sex in Fearrington Village
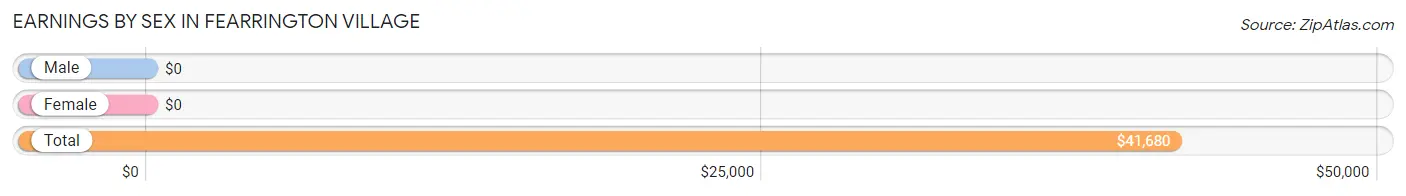
| Sex | Number | Average Earnings |
| Male | 422 (56.3%) | $0 |
| Female | 327 (43.7%) | $0 |
| Total | 749 (100.0%) | $41,680 |
Earnings by Sex by Income Bracket in Fearrington Village
The most common earnings brackets in Fearrington Village are $100,000+ for men (158 | 37.4%) and $65,000 to $74,999 for women (86 | 26.3%).
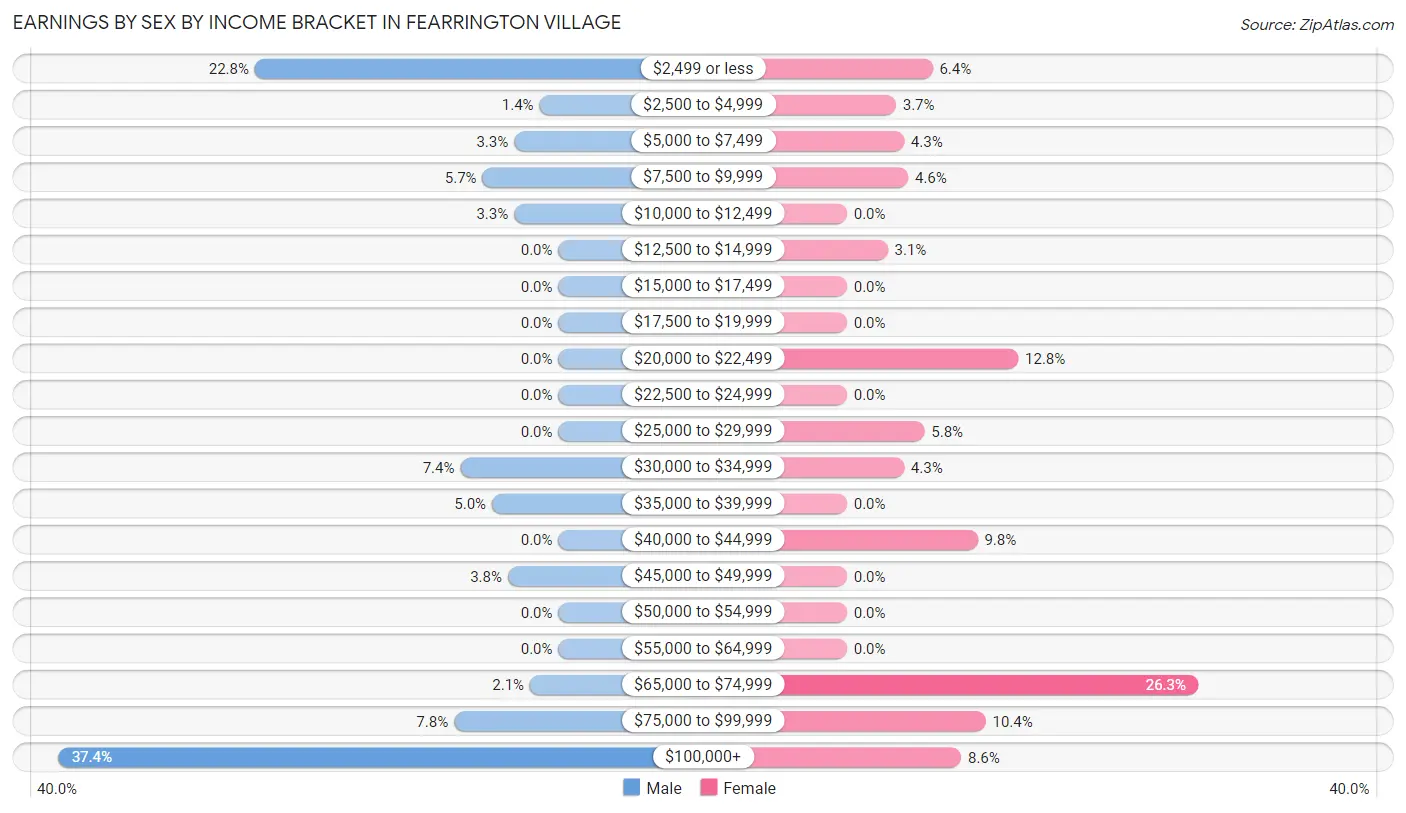
| Income | Male | Female |
| $2,499 or less | 96 (22.8%) | 21 (6.4%) |
| $2,500 to $4,999 | 6 (1.4%) | 12 (3.7%) |
| $5,000 to $7,499 | 14 (3.3%) | 14 (4.3%) |
| $7,500 to $9,999 | 24 (5.7%) | 15 (4.6%) |
| $10,000 to $12,499 | 14 (3.3%) | 0 (0.0%) |
| $12,500 to $14,999 | 0 (0.0%) | 10 (3.1%) |
| $15,000 to $17,499 | 0 (0.0%) | 0 (0.0%) |
| $17,500 to $19,999 | 0 (0.0%) | 0 (0.0%) |
| $20,000 to $22,499 | 0 (0.0%) | 42 (12.8%) |
| $22,500 to $24,999 | 0 (0.0%) | 0 (0.0%) |
| $25,000 to $29,999 | 0 (0.0%) | 19 (5.8%) |
| $30,000 to $34,999 | 31 (7.3%) | 14 (4.3%) |
| $35,000 to $39,999 | 21 (5.0%) | 0 (0.0%) |
| $40,000 to $44,999 | 0 (0.0%) | 32 (9.8%) |
| $45,000 to $49,999 | 16 (3.8%) | 0 (0.0%) |
| $50,000 to $54,999 | 0 (0.0%) | 0 (0.0%) |
| $55,000 to $64,999 | 0 (0.0%) | 0 (0.0%) |
| $65,000 to $74,999 | 9 (2.1%) | 86 (26.3%) |
| $75,000 to $99,999 | 33 (7.8%) | 34 (10.4%) |
| $100,000+ | 158 (37.4%) | 28 (8.6%) |
| Total | 422 (100.0%) | 327 (100.0%) |
Earnings by Sex by Educational Attainment in Fearrington Village
Average earnings in Fearrington Village are $92,121 for men and $65,982 for women, a difference of 28.4%. Men with an educational attainment of bachelor's degree enjoy the highest average annual earnings of $112,520, while those with bachelor's degree education earn the least with $112,520. Women with an educational attainment of bachelor's degree earn the most with the average annual earnings of $70,799, while those with bachelor's degree education have the smallest earnings of $70,799.
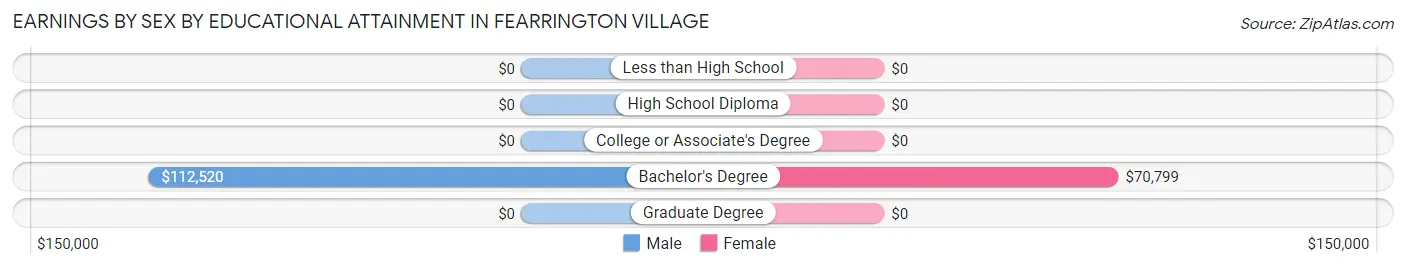
| Educational Attainment | Male Income | Female Income |
| Less than High School | - | - |
| High School Diploma | - | - |
| College or Associate's Degree | - | - |
| Bachelor's Degree | $112,520 | $70,799 |
| Graduate Degree | - | - |
| Total | $92,121 | $65,982 |
Family Income in Fearrington Village
Family Income Brackets in Fearrington Village
According to the Fearrington Village family income data, there are 228 families falling into the $200,000+ income range, which is the most common income bracket and makes up 29.8% of all families.
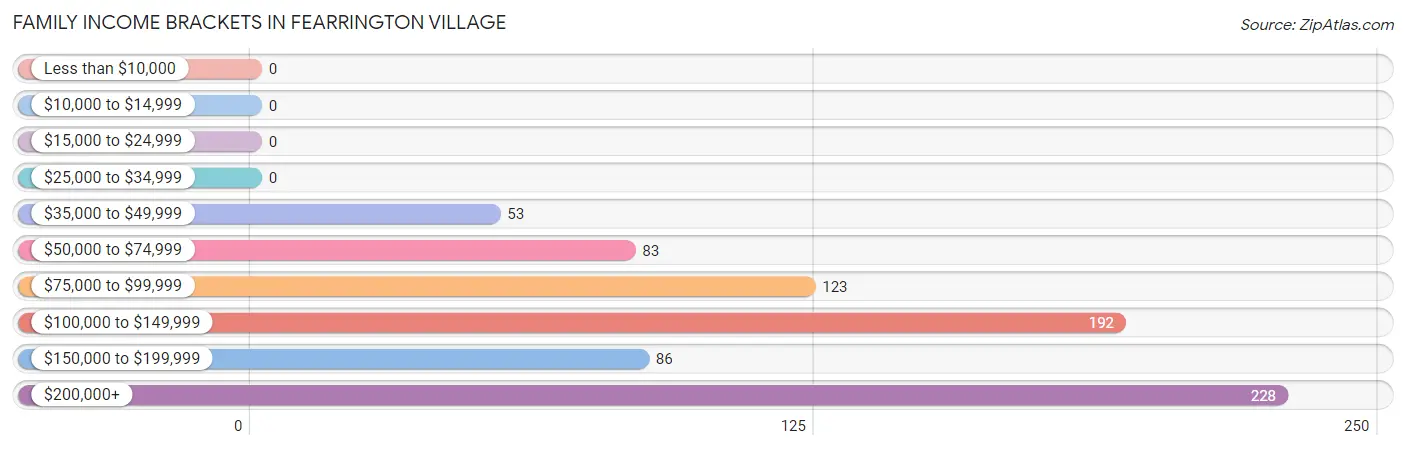
| Income Bracket | # Families | % Families |
| Less than $10,000 | 0 | 0.0% |
| $10,000 to $14,999 | 0 | 0.0% |
| $15,000 to $24,999 | 0 | 0.0% |
| $25,000 to $34,999 | 0 | 0.0% |
| $35,000 to $49,999 | 53 | 6.9% |
| $50,000 to $74,999 | 83 | 10.8% |
| $75,000 to $99,999 | 123 | 16.1% |
| $100,000 to $149,999 | 192 | 25.1% |
| $150,000 to $199,999 | 86 | 11.2% |
| $200,000+ | 228 | 29.8% |
Family Income by Famaliy Size in Fearrington Village
2-person families (665 | 86.9%) account for the highest median family income in Fearrington Village with $112,250 per family, while 2-person families (665 | 86.9%) have the highest median income of $56,125 per family member.
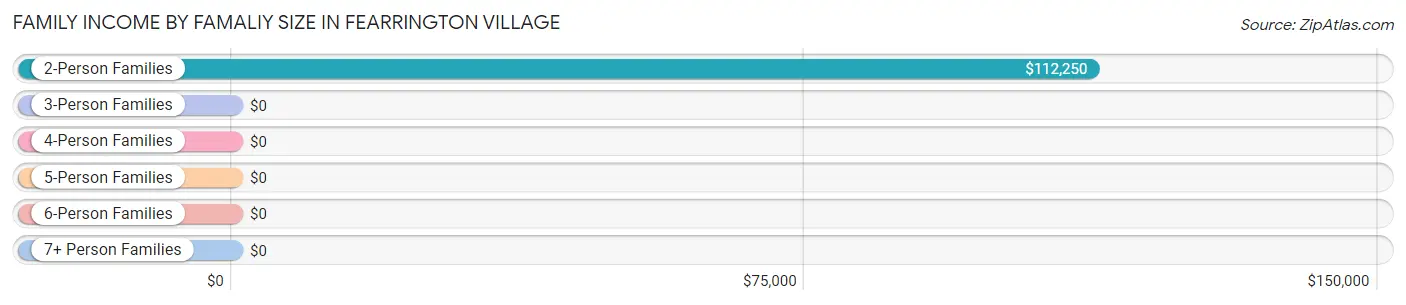
| Income Bracket | # Families | Median Income |
| 2-Person Families | 665 (86.9%) | $112,250 |
| 3-Person Families | 28 (3.7%) | $0 |
| 4-Person Families | 72 (9.4%) | $0 |
| 5-Person Families | 0 (0.0%) | $0 |
| 6-Person Families | 0 (0.0%) | $0 |
| 7+ Person Families | 0 (0.0%) | $0 |
| Total | 765 (100.0%) | $135,597 |
Family Income by Number of Earners in Fearrington Village

| Number of Earners | # Families | Median Income |
| No Earners | 475 (62.1%) | $111,450 |
| 1 Earner | 132 (17.2%) | $94,531 |
| 2 Earners | 86 (11.2%) | $0 |
| 3+ Earners | 72 (9.4%) | $0 |
| Total | 765 (100.0%) | $135,597 |
Household Income in Fearrington Village
Household Income Brackets in Fearrington Village
With 306 households falling in the category, the $100,000 to $149,999 income range is the most frequent in Fearrington Village, accounting for 20.2% of all households. In contrast, only 14 households (0.9%) fall into the $10,000 to $14,999 income bracket, making it the least populous group.
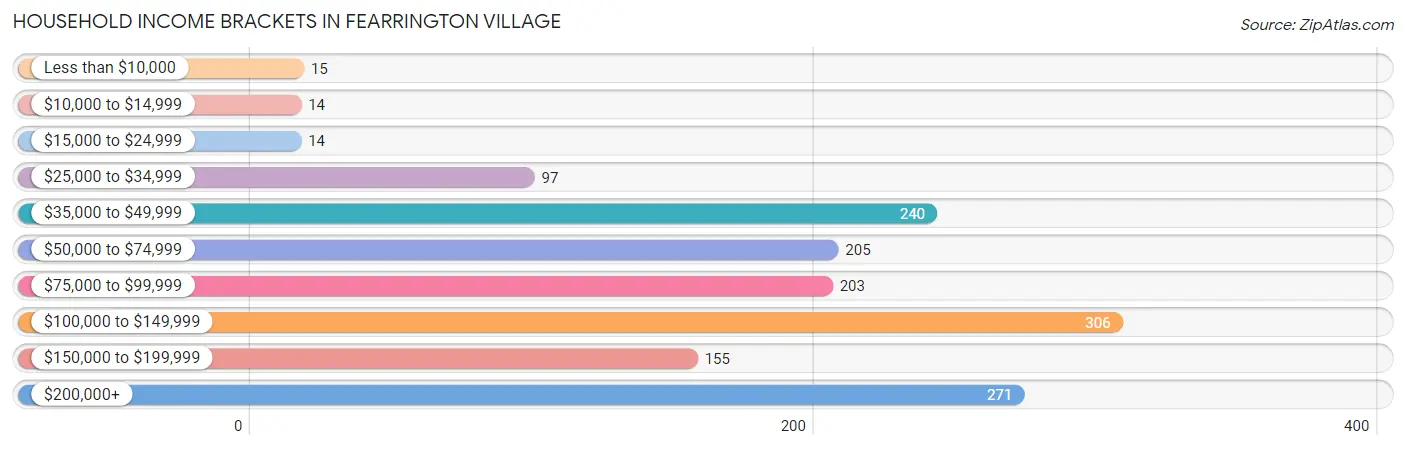
| Income Bracket | # Households | % Households |
| Less than $10,000 | 15 | 1.0% |
| $10,000 to $14,999 | 14 | 0.9% |
| $15,000 to $24,999 | 14 | 0.9% |
| $25,000 to $34,999 | 97 | 6.4% |
| $35,000 to $49,999 | 240 | 15.8% |
| $50,000 to $74,999 | 205 | 13.5% |
| $75,000 to $99,999 | 203 | 13.4% |
| $100,000 to $149,999 | 306 | 20.2% |
| $150,000 to $199,999 | 155 | 10.2% |
| $200,000+ | 271 | 17.9% |
Household Income by Householder Age in Fearrington Village
The median household income in Fearrington Village is $95,391, with the highest median household income of $203,438 found in the 45 to 64 years age bracket for the primary householder. A total of 182 households (12.0%) fall into this category.
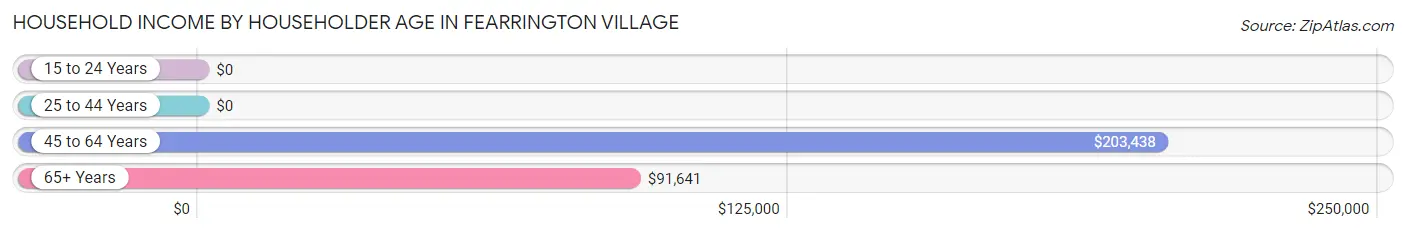
| Income Bracket | # Households | Median Income |
| 15 to 24 Years | 0 (0.0%) | $0 |
| 25 to 44 Years | 25 (1.7%) | $0 |
| 45 to 64 Years | 182 (12.0%) | $203,438 |
| 65+ Years | 1,309 (86.4%) | $91,641 |
| Total | 1,516 (100.0%) | $95,391 |
Poverty in Fearrington Village
Income Below Poverty by Sex and Age in Fearrington Village
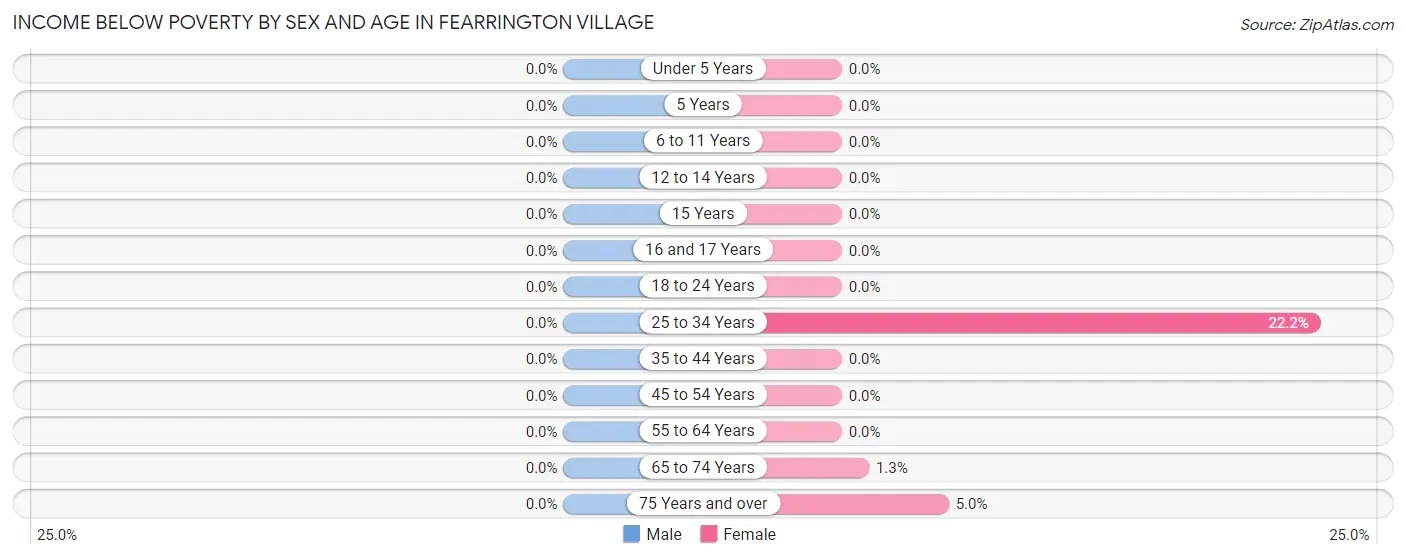
| Age Bracket | Male | Female |
| Under 5 Years | 0 (0.0%) | 0 (0.0%) |
| 5 Years | 0 (0.0%) | 0 (0.0%) |
| 6 to 11 Years | 0 (0.0%) | 0 (0.0%) |
| 12 to 14 Years | 0 (0.0%) | 0 (0.0%) |
| 15 Years | 0 (0.0%) | 0 (0.0%) |
| 16 and 17 Years | 0 (0.0%) | 0 (0.0%) |
| 18 to 24 Years | 0 (0.0%) | 0 (0.0%) |
| 25 to 34 Years | 0 (0.0%) | 4 (22.2%) |
| 35 to 44 Years | 0 (0.0%) | 0 (0.0%) |
| 45 to 54 Years | 0 (0.0%) | 0 (0.0%) |
| 55 to 64 Years | 0 (0.0%) | 0 (0.0%) |
| 65 to 74 Years | 0 (0.0%) | 8 (1.3%) |
| 75 Years and over | 0 (0.0%) | 28 (5.0%) |
| Total | 0 (0.0%) | 40 (2.7%) |
Income Above Poverty by Sex and Age in Fearrington Village
According to the poverty statistics in Fearrington Village, males aged 18 to 24 years and females aged 18 to 24 years are the age groups that are most secure financially, with 100.0% of males and 100.0% of females in these age groups living above the poverty line.
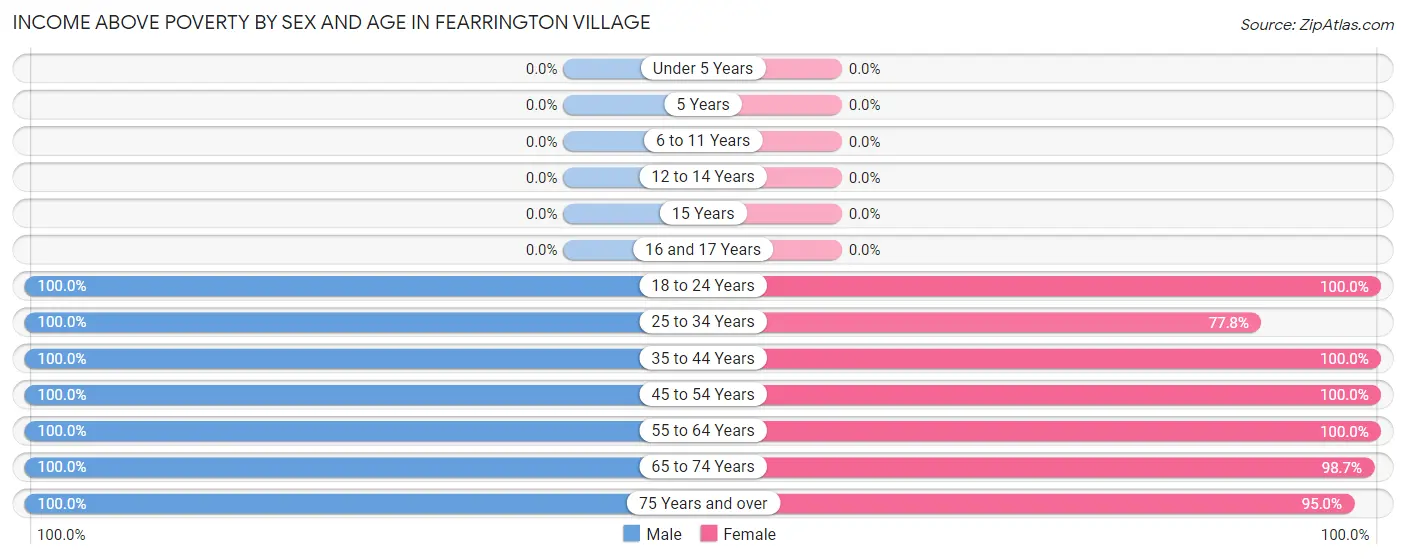
| Age Bracket | Male | Female |
| Under 5 Years | 0 (0.0%) | 0 (0.0%) |
| 5 Years | 0 (0.0%) | 0 (0.0%) |
| 6 to 11 Years | 0 (0.0%) | 0 (0.0%) |
| 12 to 14 Years | 0 (0.0%) | 0 (0.0%) |
| 15 Years | 0 (0.0%) | 0 (0.0%) |
| 16 and 17 Years | 0 (0.0%) | 0 (0.0%) |
| 18 to 24 Years | 96 (100.0%) | 66 (100.0%) |
| 25 to 34 Years | 15 (100.0%) | 14 (77.8%) |
| 35 to 44 Years | 45 (100.0%) | 13 (100.0%) |
| 45 to 54 Years | 35 (100.0%) | 17 (100.0%) |
| 55 to 64 Years | 106 (100.0%) | 147 (100.0%) |
| 65 to 74 Years | 257 (100.0%) | 626 (98.7%) |
| 75 Years and over | 526 (100.0%) | 536 (95.0%) |
| Total | 1,080 (100.0%) | 1,419 (97.3%) |
Income Below Poverty Among Married-Couple Families in Fearrington Village
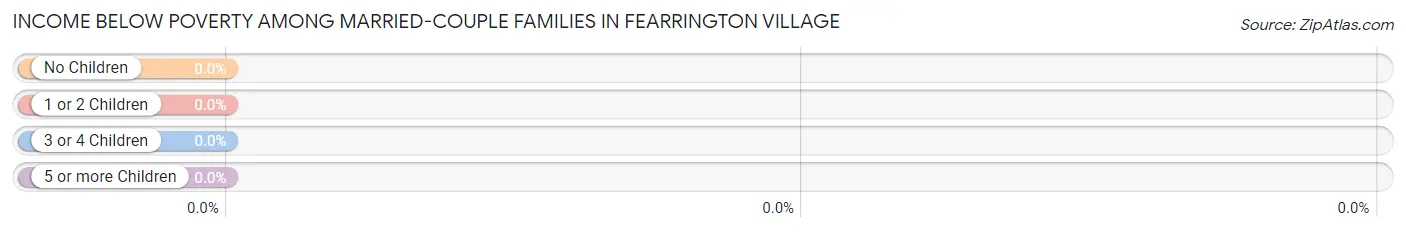
| Children | Above Poverty | Below Poverty |
| No Children | 751 (100.0%) | 0 (0.0%) |
| 1 or 2 Children | 0 (0.0%) | 0 (0.0%) |
| 3 or 4 Children | 0 (0.0%) | 0 (0.0%) |
| 5 or more Children | 0 (0.0%) | 0 (0.0%) |
| Total | 751 (100.0%) | 0 (0.0%) |
Income Below Poverty Among Single-Parent Households in Fearrington Village
| Children | Single Father | Single Mother |
| No Children | 0 (0.0%) | 0 (0.0%) |
| 1 or 2 Children | 0 (0.0%) | 0 (0.0%) |
| 3 or 4 Children | 0 (0.0%) | 0 (0.0%) |
| 5 or more Children | 0 (0.0%) | 0 (0.0%) |
| Total | 0 (0.0%) | 0 (0.0%) |
Income Below Poverty Among Married-Couple vs Single-Parent Households in Fearrington Village
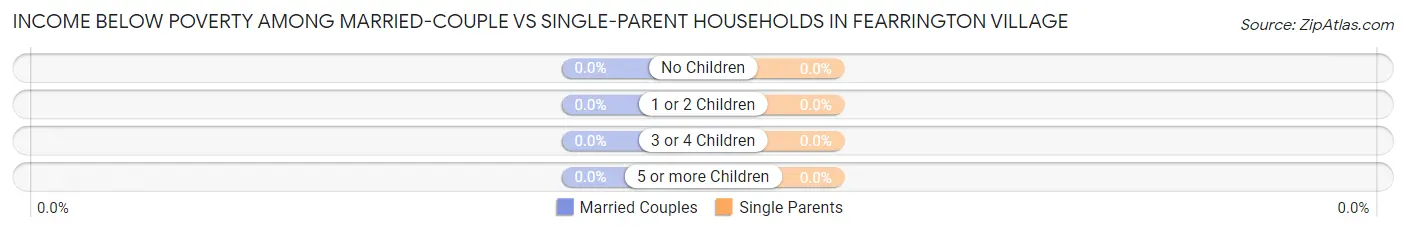
| Children | Married-Couple Families | Single-Parent Households |
| No Children | 0 (0.0%) | 0 (0.0%) |
| 1 or 2 Children | 0 (0.0%) | 0 (0.0%) |
| 3 or 4 Children | 0 (0.0%) | 0 (0.0%) |
| 5 or more Children | 0 (0.0%) | 0 (0.0%) |
| Total | 0 (0.0%) | 0 (0.0%) |
Race in Fearrington Village
The most populous races in Fearrington Village are White / Caucasian (2,445 | 94.7%), Asian (79 | 3.1%), and Black / African American (44 | 1.7%).
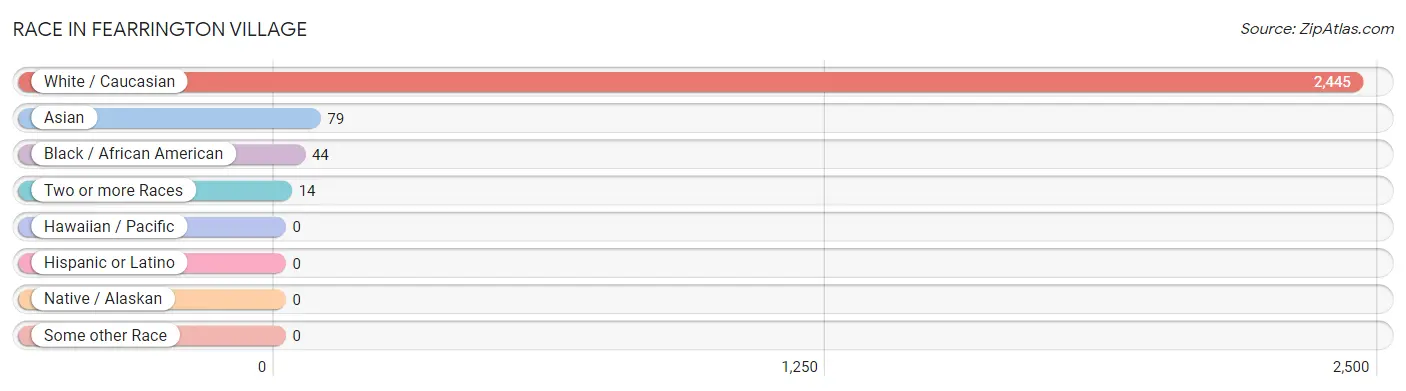
| Race | # Population | % Population |
| Asian | 79 | 3.1% |
| Black / African American | 44 | 1.7% |
| Hawaiian / Pacific | 0 | 0.0% |
| Hispanic or Latino | 0 | 0.0% |
| Native / Alaskan | 0 | 0.0% |
| White / Caucasian | 2,445 | 94.7% |
| Two or more Races | 14 | 0.5% |
| Some other Race | 0 | 0.0% |
| Total | 2,582 | 100.0% |
Ancestry in Fearrington Village
The most populous ancestries reported in Fearrington Village are English (897 | 34.7%), German (581 | 22.5%), Irish (388 | 15.0%), Scottish (202 | 7.8%), and Italian (190 | 7.4%), together accounting for 87.5% of all Fearrington Village residents.
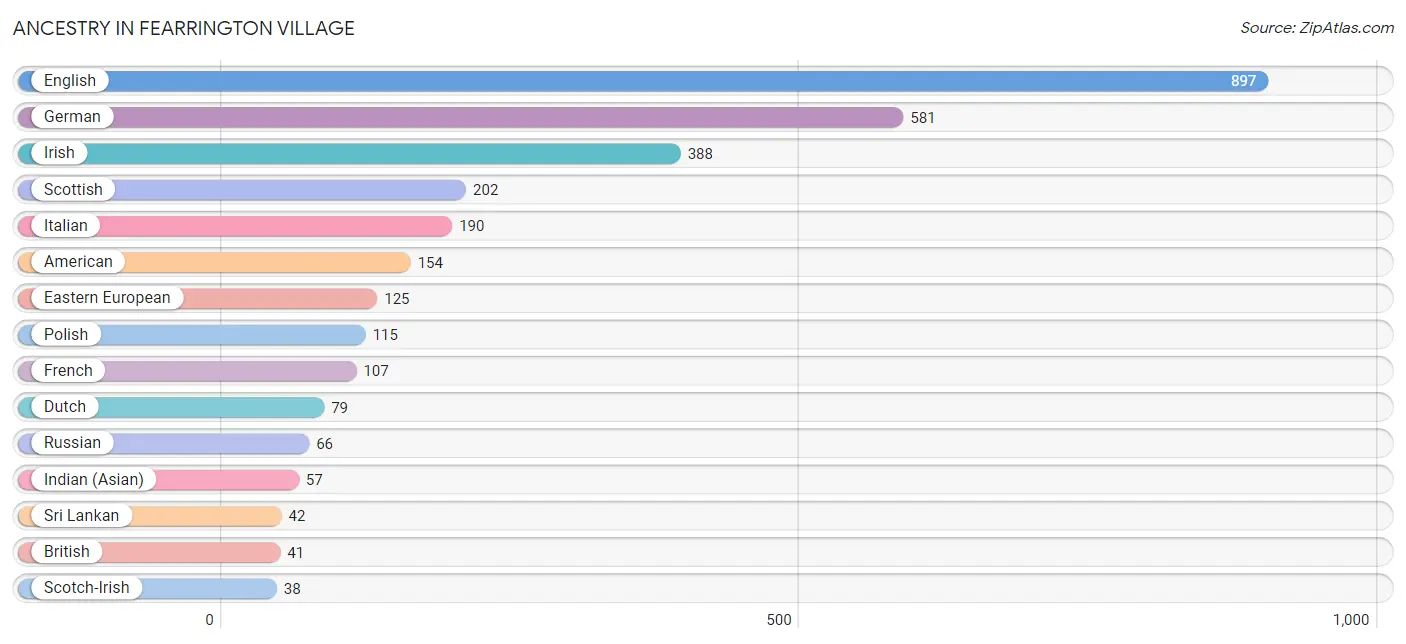
| Ancestry | # Population | % Population |
| American | 154 | 6.0% |
| Austrian | 21 | 0.8% |
| Belgian | 15 | 0.6% |
| British | 41 | 1.6% |
| British West Indian | 26 | 1.0% |
| Danish | 25 | 1.0% |
| Dutch | 79 | 3.1% |
| Eastern European | 125 | 4.8% |
| English | 897 | 34.7% |
| European | 32 | 1.2% |
| French | 107 | 4.1% |
| French Canadian | 14 | 0.5% |
| German | 581 | 22.5% |
| Indian (Asian) | 57 | 2.2% |
| Irish | 388 | 15.0% |
| Italian | 190 | 7.4% |
| Lithuanian | 28 | 1.1% |
| Northern European | 14 | 0.5% |
| Polish | 115 | 4.4% |
| Romanian | 12 | 0.5% |
| Russian | 66 | 2.6% |
| Scandinavian | 21 | 0.8% |
| Scotch-Irish | 38 | 1.5% |
| Scottish | 202 | 7.8% |
| Slovak | 21 | 0.8% |
| Sri Lankan | 42 | 1.6% |
| Thai | 22 | 0.9% |
| Welsh | 11 | 0.4% |
| West Indian | 9 | 0.4% | View All 29 Rows |
Immigrants in Fearrington Village
The most numerous immigrant groups reported in Fearrington Village came from Asia (92 | 3.6%), China (57 | 2.2%), Eastern Asia (57 | 2.2%), Europe (44 | 1.7%), and Western Europe (29 | 1.1%), together accounting for 10.8% of all Fearrington Village residents.
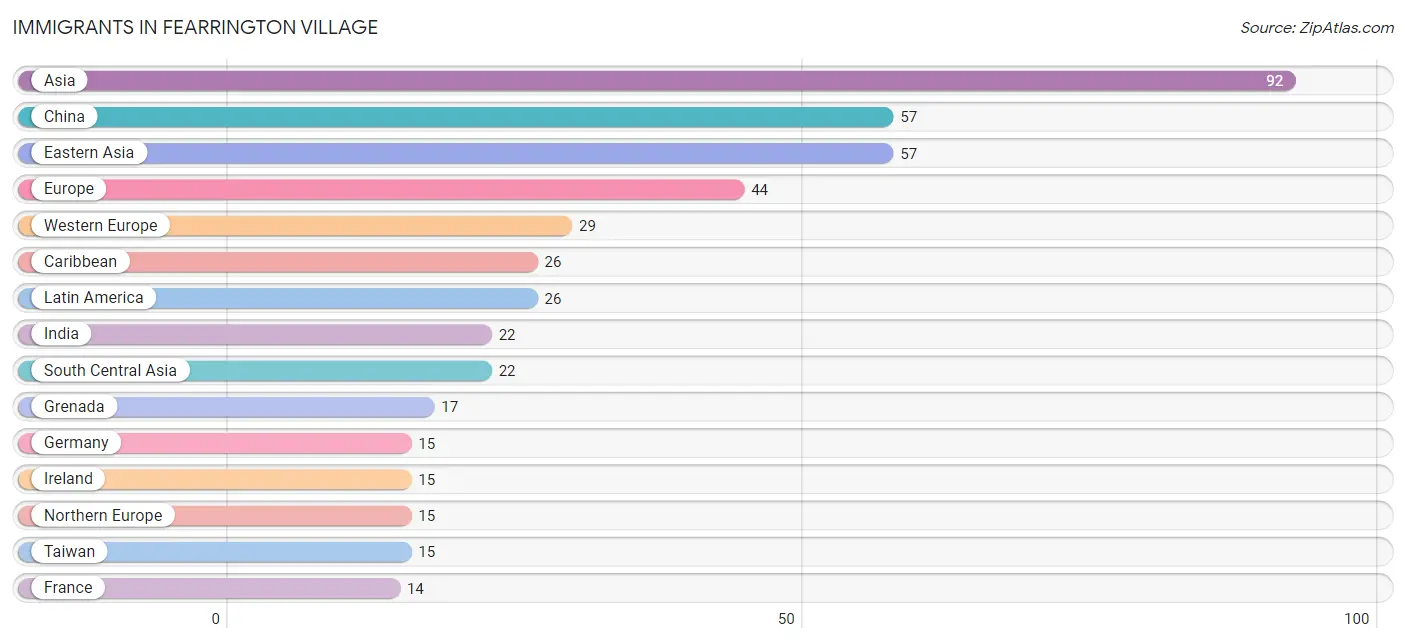
| Immigration Origin | # Population | % Population |
| Asia | 92 | 3.6% |
| Canada | 11 | 0.4% |
| Caribbean | 26 | 1.0% |
| China | 57 | 2.2% |
| Eastern Asia | 57 | 2.2% |
| Europe | 44 | 1.7% |
| France | 14 | 0.5% |
| Germany | 15 | 0.6% |
| Grenada | 17 | 0.7% |
| India | 22 | 0.9% |
| Ireland | 15 | 0.6% |
| Israel | 13 | 0.5% |
| Latin America | 26 | 1.0% |
| Northern Europe | 15 | 0.6% |
| South Central Asia | 22 | 0.9% |
| Taiwan | 15 | 0.6% |
| Western Asia | 13 | 0.5% |
| Western Europe | 29 | 1.1% | View All 18 Rows |
Sex and Age in Fearrington Village
Sex and Age in Fearrington Village
The most populous age groups in Fearrington Village are 75 to 79 Years (286 | 25.9%) for men and 70 to 74 Years (398 | 26.9%) for women.
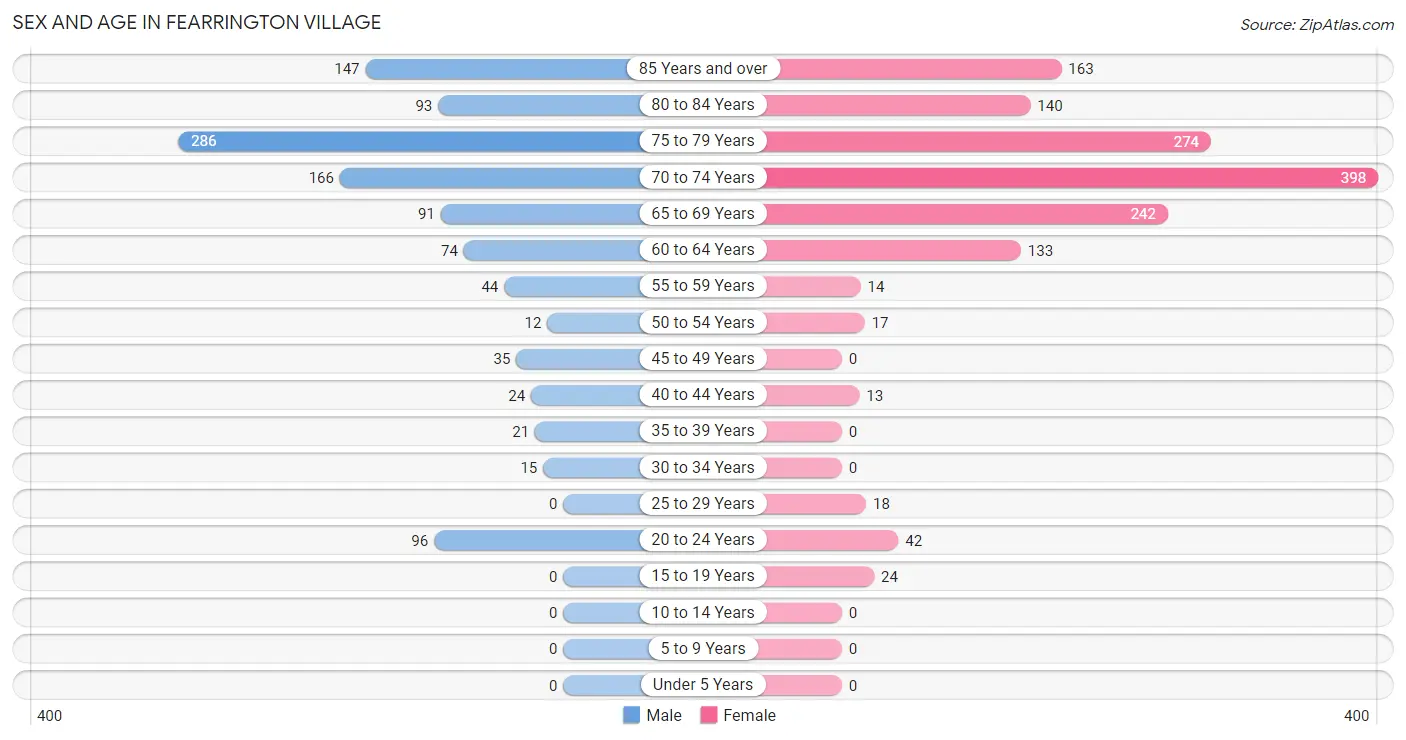
| Age Bracket | Male | Female |
| Under 5 Years | 0 (0.0%) | 0 (0.0%) |
| 5 to 9 Years | 0 (0.0%) | 0 (0.0%) |
| 10 to 14 Years | 0 (0.0%) | 0 (0.0%) |
| 15 to 19 Years | 0 (0.0%) | 24 (1.6%) |
| 20 to 24 Years | 96 (8.7%) | 42 (2.8%) |
| 25 to 29 Years | 0 (0.0%) | 18 (1.2%) |
| 30 to 34 Years | 15 (1.4%) | 0 (0.0%) |
| 35 to 39 Years | 21 (1.9%) | 0 (0.0%) |
| 40 to 44 Years | 24 (2.2%) | 13 (0.9%) |
| 45 to 49 Years | 35 (3.2%) | 0 (0.0%) |
| 50 to 54 Years | 12 (1.1%) | 17 (1.1%) |
| 55 to 59 Years | 44 (4.0%) | 14 (0.9%) |
| 60 to 64 Years | 74 (6.7%) | 133 (9.0%) |
| 65 to 69 Years | 91 (8.2%) | 242 (16.4%) |
| 70 to 74 Years | 166 (15.0%) | 398 (26.9%) |
| 75 to 79 Years | 286 (25.9%) | 274 (18.5%) |
| 80 to 84 Years | 93 (8.4%) | 140 (9.5%) |
| 85 Years and over | 147 (13.3%) | 163 (11.0%) |
| Total | 1,104 (100.0%) | 1,478 (100.0%) |
Families and Households in Fearrington Village
Median Family Size in Fearrington Village
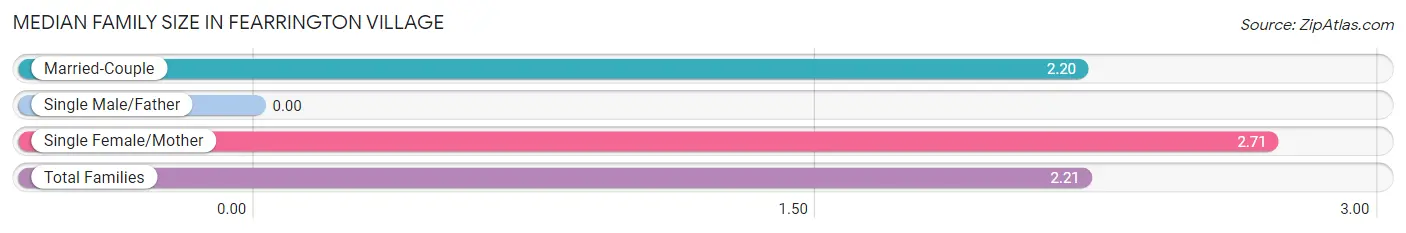
| Family Type | # Families | Family Size |
| Married-Couple | 751 (98.2%) | 2.20 |
| Single Male/Father | 0 (0.0%) | - |
| Single Female/Mother | 14 (1.8%) | 2.71 |
| Total Families | 765 (100.0%) | 2.21 |
Median Household Size in Fearrington Village
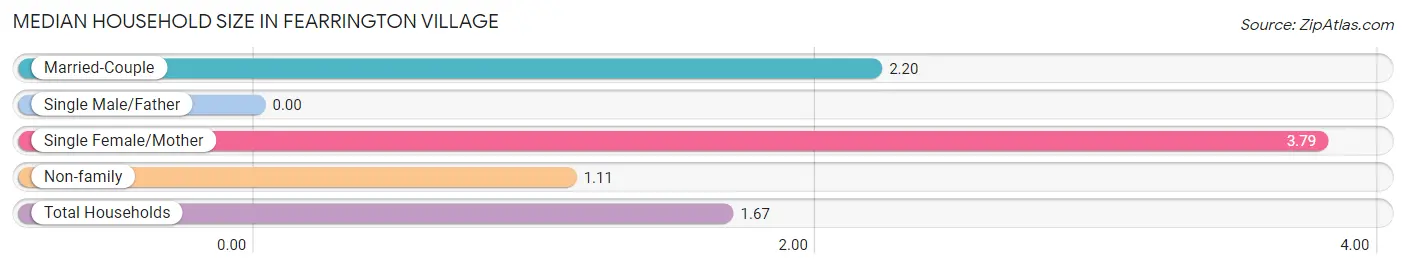
| Household Type | # Households | Household Size |
| Married-Couple | 751 (49.5%) | 2.20 |
| Single Male/Father | 0 (0.0%) | - |
| Single Female/Mother | 14 (0.9%) | 3.79 |
| Non-family | 751 (49.5%) | 1.11 |
| Total Households | 1,516 (100.0%) | 1.67 |
Household Size by Marriage Status in Fearrington Village
Out of a total of 1,516 households in Fearrington Village, 765 (50.5%) are family households, while 751 (49.5%) are nonfamily households. The most numerous type of family households are 2-person households, comprising 651, and the most common type of nonfamily households are 1-person households, comprising 678.
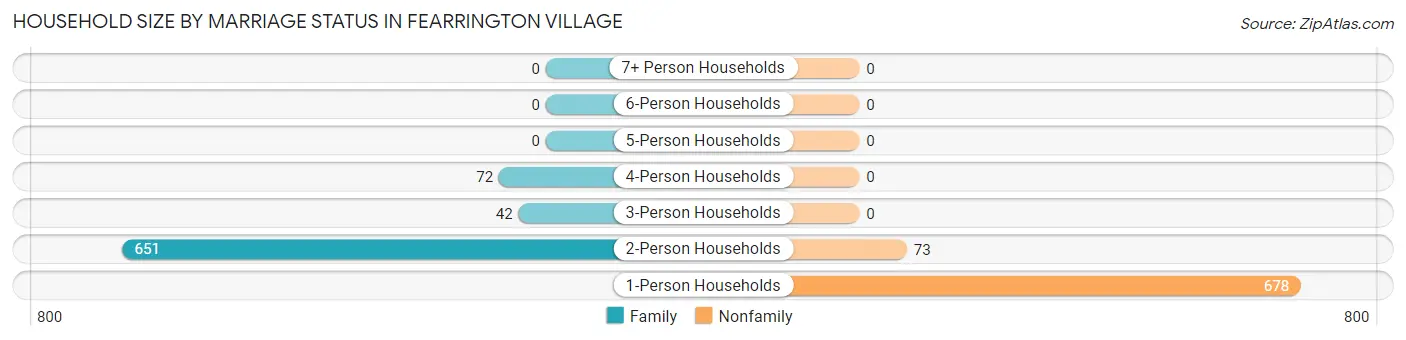
| Household Size | Family Households | Nonfamily Households |
| 1-Person Households | - | 678 (44.7%) |
| 2-Person Households | 651 (42.9%) | 73 (4.8%) |
| 3-Person Households | 42 (2.8%) | 0 (0.0%) |
| 4-Person Households | 72 (4.8%) | 0 (0.0%) |
| 5-Person Households | 0 (0.0%) | 0 (0.0%) |
| 6-Person Households | 0 (0.0%) | 0 (0.0%) |
| 7+ Person Households | 0 (0.0%) | 0 (0.0%) |
| Total | 765 (50.5%) | 751 (49.5%) |
Female Fertility in Fearrington Village
Fertility by Age in Fearrington Village
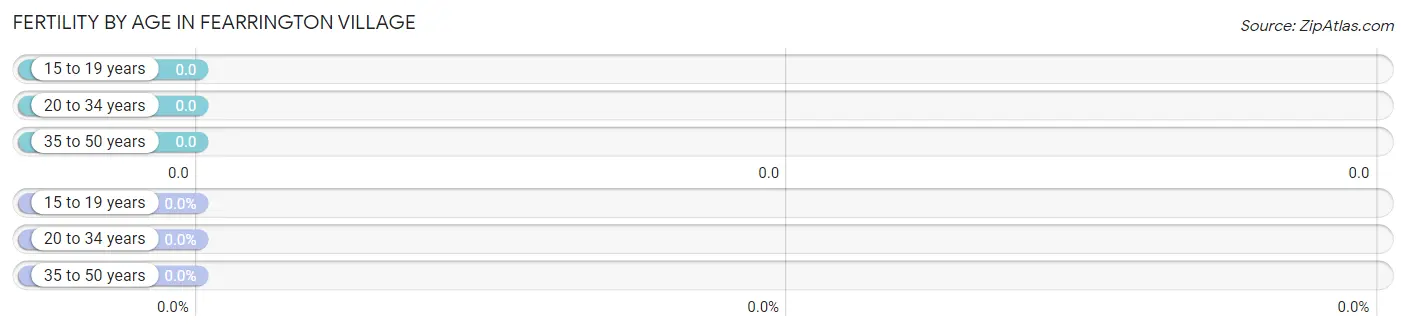
| Age Bracket | Women with Births | Births / 1,000 Women |
| 15 to 19 years | 0 (0.0%) | 0.0 |
| 20 to 34 years | 0 (0.0%) | 0.0 |
| 35 to 50 years | 0 (0.0%) | 0.0 |
| Total | 0 (0.0%) | 0.0 |
Fertility by Age by Marriage Status in Fearrington Village
| Age Bracket | Married | Unmarried |
| 15 to 19 years | 0 (0.0%) | 0 (0.0%) |
| 20 to 34 years | 0 (0.0%) | 0 (0.0%) |
| 35 to 50 years | 0 (0.0%) | 0 (0.0%) |
| Total | 0 (0.0%) | 0 (0.0%) |
Fertility by Education in Fearrington Village
| Educational Attainment | Women with Births | Births / 1,000 Women |
| Less than High School | 0 (0.0%) | 0.0 |
| High School Diploma | 0 (0.0%) | 0.0 |
| College or Associate's Degree | 0 (0.0%) | 0.0 |
| Bachelor's Degree | 0 (0.0%) | 0.0 |
| Graduate Degree | 0 (0.0%) | 0.0 |
| Total | 0 (0.0%) | 0.0 |
Fertility by Education by Marriage Status in Fearrington Village
| Educational Attainment | Married | Unmarried |
| Less than High School | 0 (0.0%) | 0 (0.0%) |
| High School Diploma | 0 (0.0%) | 0 (0.0%) |
| College or Associate's Degree | 0 (0.0%) | 0 (0.0%) |
| Bachelor's Degree | 0 (0.0%) | 0 (0.0%) |
| Graduate Degree | 0 (0.0%) | 0 (0.0%) |
| Total | 0 (0.0%) | 0 (0.0%) |
Employment Characteristics in Fearrington Village
Employment by Class of Employer in Fearrington Village
Among the 557 employed individuals in Fearrington Village, private company employees (197 | 35.4%), not-for-profit organizations (102 | 18.3%), and self-employed (not incorporated) (82 | 14.7%) make up the most common classes of employment.
| Employer Class | # Employees | % Employees |
| Private Company Employees | 197 | 35.4% |
| Self-Employed (Incorporated) | 39 | 7.0% |
| Self-Employed (Not Incorporated) | 82 | 14.7% |
| Not-for-profit Organizations | 102 | 18.3% |
| Local Government Employees | 72 | 12.9% |
| State Government Employees | 35 | 6.3% |
| Federal Government Employees | 30 | 5.4% |
| Unpaid Family Workers | 0 | 0.0% |
| Total | 557 | 100.0% |
Employment Status by Age in Fearrington Village
| Age Bracket | In Labor Force | Unemployed |
| 16 to 19 Years | 0 (0.0%) | 0 (0.0%) |
| 20 to 24 Years | 42 (30.4%) | 0 (0.0%) |
| 25 to 29 Years | 14 (77.8%) | 0 (0.0%) |
| 30 to 34 Years | 15 (100.0%) | 0 (0.0%) |
| 35 to 44 Years | 34 (58.6%) | 0 (0.0%) |
| 45 to 54 Years | 52 (81.3%) | 0 (0.0%) |
| 55 to 59 Years | 58 (100.0%) | 0 (0.0%) |
| 60 to 64 Years | 151 (72.9%) | 0 (0.0%) |
| 65 to 74 Years | 171 (19.1%) | 0 (0.0%) |
| 75 Years and over | 20 (1.8%) | 0 (0.0%) |
| Total | 558 (21.6%) | 0 (0.0%) |
Employment Status by Educational Attainment in Fearrington Village
| Educational Attainment | In Labor Force | Unemployed |
| Less than High School | 0 (0.0%) | 0 (0.0%) |
| High School Diploma | 21 (100.0%) | 0 (0.0%) |
| College / Associate Degree | 15 (100.0%) | 0 (0.0%) |
| Bachelor's Degree or higher | 288 (80.0%) | 0 (0.0%) |
| Total | 324 (77.1%) | 0 (0.0%) |
Employment Occupations by Sex in Fearrington Village
Management, Business, Science and Arts Occupations
The most common Management, Business, Science and Arts occupations in Fearrington Village are Health Diagnosing & Treating (128 | 23.6%), Business & Financial (115 | 21.2%), Health Technologists (86 | 15.9%), Management (75 | 13.8%), and Computers, Engineering & Science (57 | 10.5%).
Management, Business, Science and Arts Occupations by Sex
Within the Management, Business, Science and Arts occupations in Fearrington Village, the most male-oriented occupations are Computers, Engineering & Science (100.0%), Computers & Mathematics (100.0%), and Life, Physical & Social Science (100.0%), while the most female-oriented occupations are Community & Social Service (100.0%), Arts, Media & Entertainment (100.0%), and Health Diagnosing & Treating (100.0%).
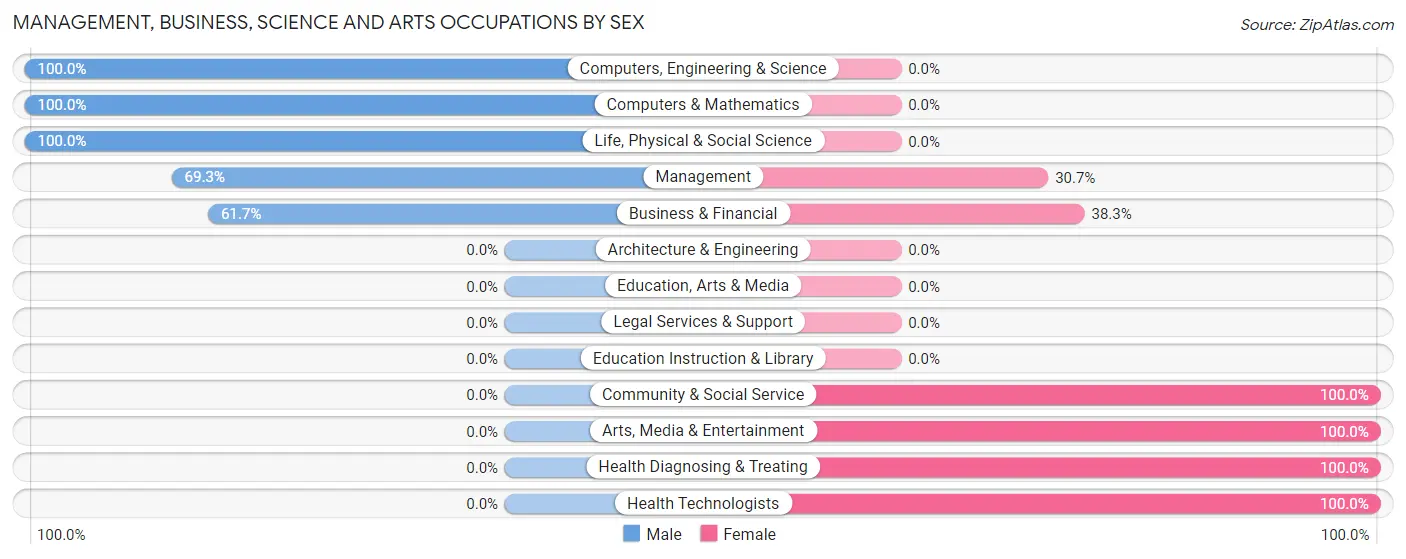
| Occupation | Male | Female |
| Management | 52 (69.3%) | 23 (30.7%) |
| Business & Financial | 71 (61.7%) | 44 (38.3%) |
| Computers, Engineering & Science | 57 (100.0%) | 0 (0.0%) |
| Computers & Mathematics | 42 (100.0%) | 0 (0.0%) |
| Architecture & Engineering | 0 (0.0%) | 0 (0.0%) |
| Life, Physical & Social Science | 15 (100.0%) | 0 (0.0%) |
| Community & Social Service | 0 (0.0%) | 13 (100.0%) |
| Education, Arts & Media | 0 (0.0%) | 0 (0.0%) |
| Legal Services & Support | 0 (0.0%) | 0 (0.0%) |
| Education Instruction & Library | 0 (0.0%) | 0 (0.0%) |
| Arts, Media & Entertainment | 0 (0.0%) | 13 (100.0%) |
| Health Diagnosing & Treating | 0 (0.0%) | 128 (100.0%) |
| Health Technologists | 0 (0.0%) | 86 (100.0%) |
| Total (Category) | 180 (46.4%) | 208 (53.6%) |
| Total (Overall) | 263 (48.5%) | 279 (51.5%) |
Services Occupations
The most common Services occupations in Fearrington Village are Security & Protection (31 | 5.7%), Firefighting & Prevention (31 | 5.7%), and Cleaning & Maintenance (21 | 3.9%).
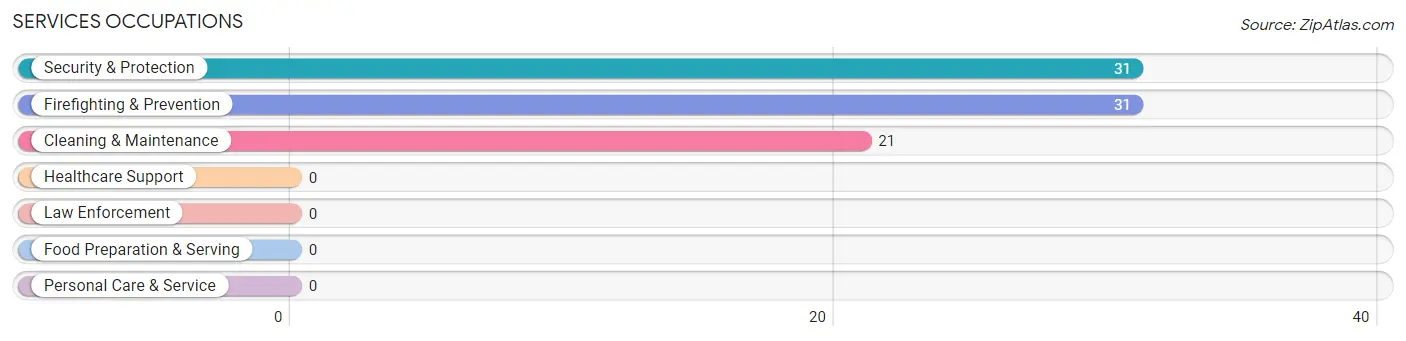
Services Occupations by Sex
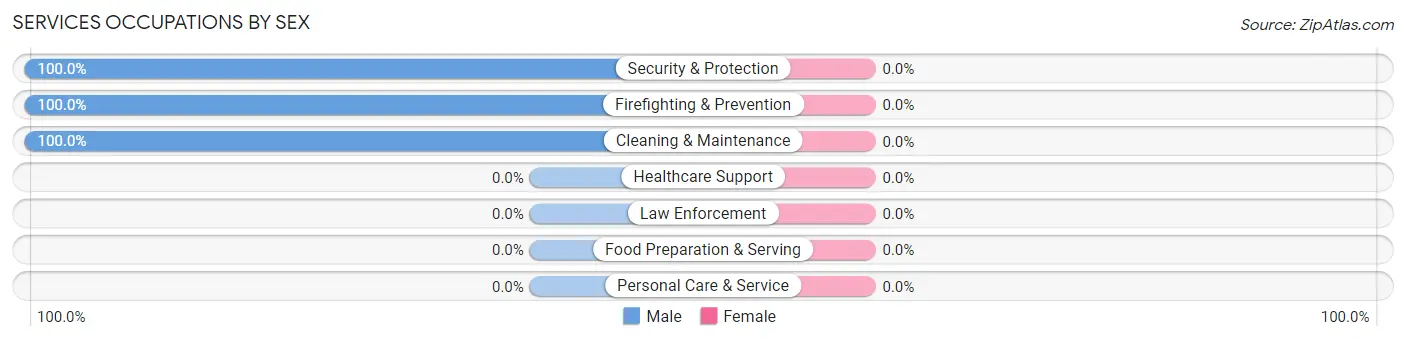
| Occupation | Male | Female |
| Healthcare Support | 0 (0.0%) | 0 (0.0%) |
| Security & Protection | 31 (100.0%) | 0 (0.0%) |
| Firefighting & Prevention | 31 (100.0%) | 0 (0.0%) |
| Law Enforcement | 0 (0.0%) | 0 (0.0%) |
| Food Preparation & Serving | 0 (0.0%) | 0 (0.0%) |
| Cleaning & Maintenance | 21 (100.0%) | 0 (0.0%) |
| Personal Care & Service | 0 (0.0%) | 0 (0.0%) |
| Total (Category) | 52 (100.0%) | 0 (0.0%) |
| Total (Overall) | 263 (48.5%) | 279 (51.5%) |
Sales and Office Occupations
The most common Sales and Office occupations in Fearrington Village are Office & Administration (57 | 10.5%), and Sales & Related (45 | 8.3%).
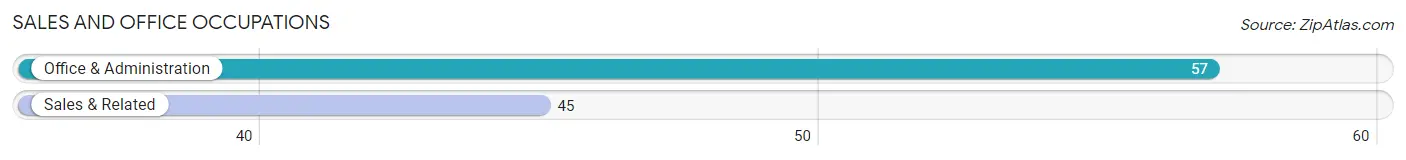
Sales and Office Occupations by Sex
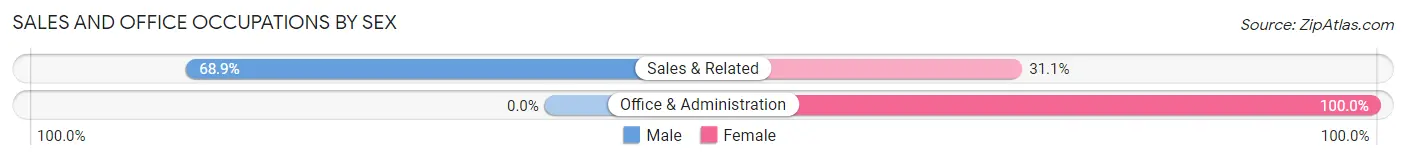
| Occupation | Male | Female |
| Sales & Related | 31 (68.9%) | 14 (31.1%) |
| Office & Administration | 0 (0.0%) | 57 (100.0%) |
| Total (Category) | 31 (30.4%) | 71 (69.6%) |
| Total (Overall) | 263 (48.5%) | 279 (51.5%) |
Natural Resources, Construction and Maintenance Occupations
Natural Resources, Construction and Maintenance Occupations by Sex
| Occupation | Male | Female |
| Farming, Fishing & Forestry | 0 (0.0%) | 0 (0.0%) |
| Construction & Extraction | 0 (0.0%) | 0 (0.0%) |
| Installation, Maintenance & Repair | 0 (0.0%) | 0 (0.0%) |
| Total (Category) | 0 (0.0%) | 0 (0.0%) |
| Total (Overall) | 263 (48.5%) | 279 (51.5%) |
Production, Transportation and Moving Occupations
Production, Transportation and Moving Occupations by Sex
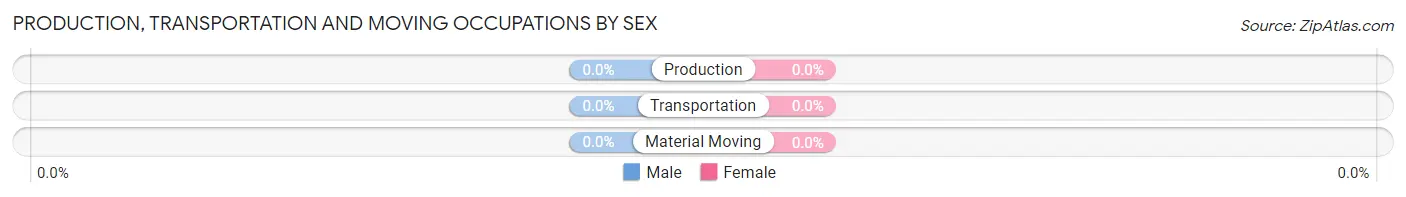
| Occupation | Male | Female |
| Production | 0 (0.0%) | 0 (0.0%) |
| Transportation | 0 (0.0%) | 0 (0.0%) |
| Material Moving | 0 (0.0%) | 0 (0.0%) |
| Total (Category) | 0 (0.0%) | 0 (0.0%) |
| Total (Overall) | 263 (48.5%) | 279 (51.5%) |
Employment Industries by Sex in Fearrington Village
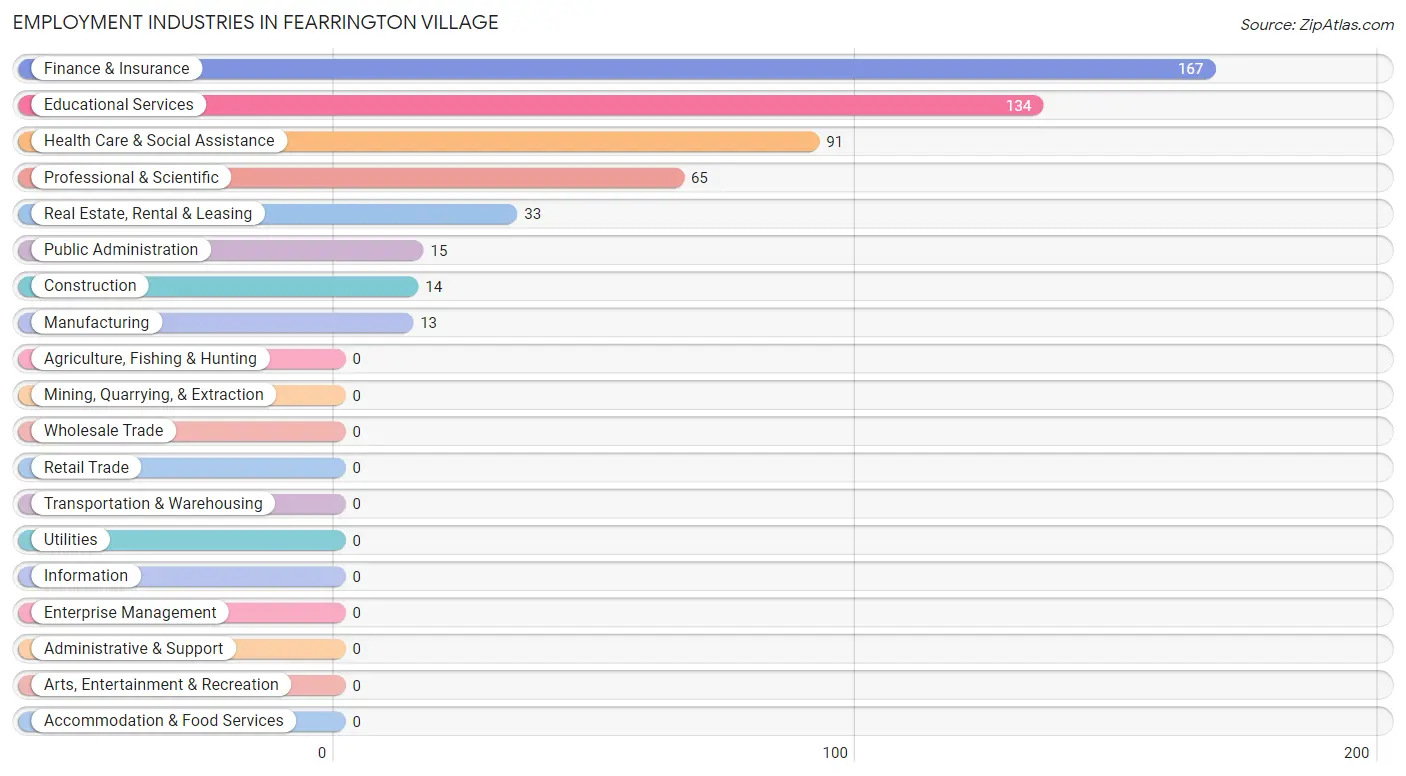
Employment Industries in Fearrington Village
The major employment industries in Fearrington Village include Finance & Insurance (167 | 30.8%), Educational Services (134 | 24.7%), Health Care & Social Assistance (91 | 16.8%), Professional & Scientific (65 | 12.0%), and Real Estate, Rental & Leasing (33 | 6.1%).
Employment Industries by Sex in Fearrington Village
The Fearrington Village industries that see more men than women are Construction (100.0%), Public Administration (100.0%), and Professional & Scientific (90.8%), whereas the industries that tend to have a higher number of women are Manufacturing (100.0%), Health Care & Social Assistance (76.9%), and Educational Services (73.9%).
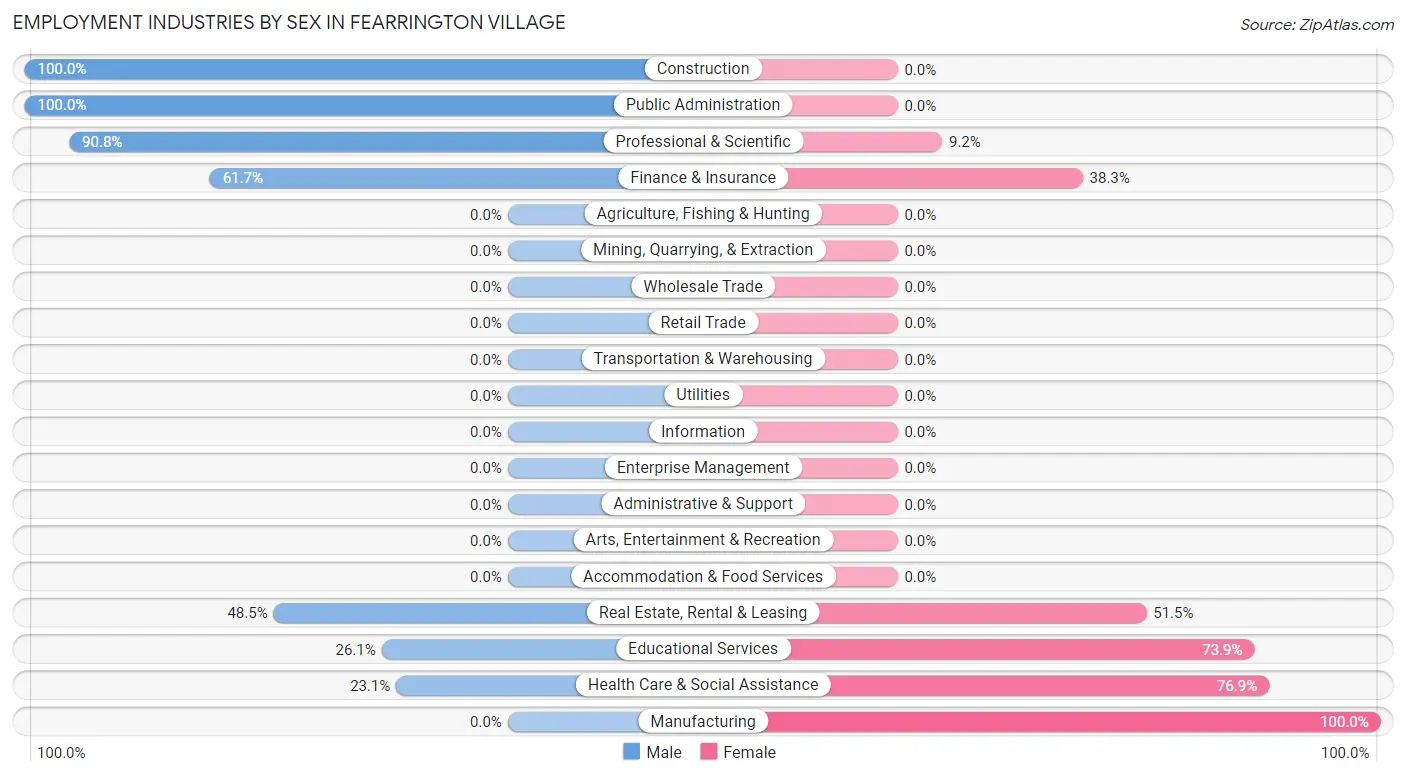
| Industry | Male | Female |
| Agriculture, Fishing & Hunting | 0 (0.0%) | 0 (0.0%) |
| Mining, Quarrying, & Extraction | 0 (0.0%) | 0 (0.0%) |
| Construction | 14 (100.0%) | 0 (0.0%) |
| Manufacturing | 0 (0.0%) | 13 (100.0%) |
| Wholesale Trade | 0 (0.0%) | 0 (0.0%) |
| Retail Trade | 0 (0.0%) | 0 (0.0%) |
| Transportation & Warehousing | 0 (0.0%) | 0 (0.0%) |
| Utilities | 0 (0.0%) | 0 (0.0%) |
| Information | 0 (0.0%) | 0 (0.0%) |
| Finance & Insurance | 103 (61.7%) | 64 (38.3%) |
| Real Estate, Rental & Leasing | 16 (48.5%) | 17 (51.5%) |
| Professional & Scientific | 59 (90.8%) | 6 (9.2%) |
| Enterprise Management | 0 (0.0%) | 0 (0.0%) |
| Administrative & Support | 0 (0.0%) | 0 (0.0%) |
| Educational Services | 35 (26.1%) | 99 (73.9%) |
| Health Care & Social Assistance | 21 (23.1%) | 70 (76.9%) |
| Arts, Entertainment & Recreation | 0 (0.0%) | 0 (0.0%) |
| Accommodation & Food Services | 0 (0.0%) | 0 (0.0%) |
| Public Administration | 15 (100.0%) | 0 (0.0%) |
| Total | 263 (48.5%) | 279 (51.5%) |
Education in Fearrington Village
School Enrollment in Fearrington Village
The most common levels of schooling among the 155 students in Fearrington Village are college / undergraduate (120 | 77.4%), and graduate / professional (35 | 22.6%).
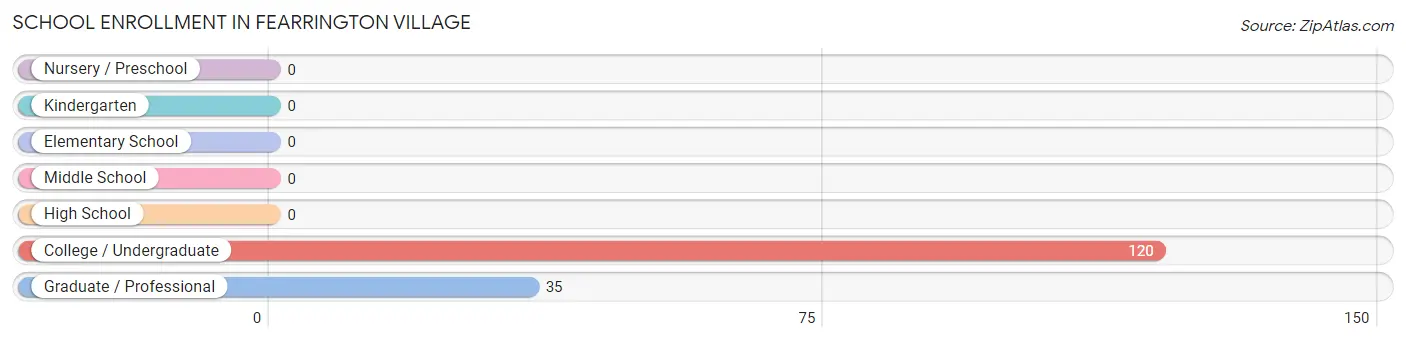
| School Level | # Students | % Students |
| Nursery / Preschool | 0 | 0.0% |
| Kindergarten | 0 | 0.0% |
| Elementary School | 0 | 0.0% |
| Middle School | 0 | 0.0% |
| High School | 0 | 0.0% |
| College / Undergraduate | 120 | 77.4% |
| Graduate / Professional | 35 | 22.6% |
| Total | 155 | 100.0% |
School Enrollment by Age by Funding Source in Fearrington Village
Out of a total of 155 students who are enrolled in schools in Fearrington Village, 24 (15.5%) attend a private institution, while the remaining 131 (84.5%) are enrolled in public schools. The age group of 18 to 19 year olds has the highest likelihood of being enrolled in private schools, with 24 (100.0% in the age bracket) enrolled. Conversely, the age group of 20 to 24 year olds has the lowest likelihood of being enrolled in a private school, with 96 (100.0% in the age bracket) attending a public institution.
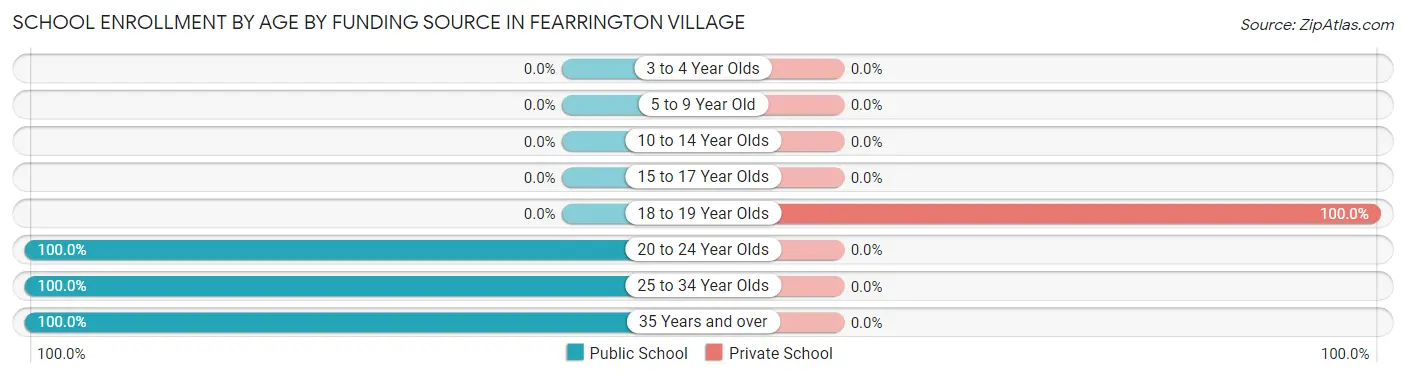
| Age Bracket | Public School | Private School |
| 3 to 4 Year Olds | 0 (0.0%) | 0 (0.0%) |
| 5 to 9 Year Old | 0 (0.0%) | 0 (0.0%) |
| 10 to 14 Year Olds | 0 (0.0%) | 0 (0.0%) |
| 15 to 17 Year Olds | 0 (0.0%) | 0 (0.0%) |
| 18 to 19 Year Olds | 0 (0.0%) | 24 (100.0%) |
| 20 to 24 Year Olds | 96 (100.0%) | 0 (0.0%) |
| 25 to 34 Year Olds | 14 (100.0%) | 0 (0.0%) |
| 35 Years and over | 21 (100.0%) | 0 (0.0%) |
| Total | 131 (84.5%) | 24 (15.5%) |
Educational Attainment by Field of Study in Fearrington Village
Business (265 | 13.3%), visual & performing arts (244 | 12.3%), social sciences (228 | 11.5%), computers & mathematics (222 | 11.2%), and education (210 | 10.6%) are the most common fields of study among 1,987 individuals in Fearrington Village who have obtained a bachelor's degree or higher.
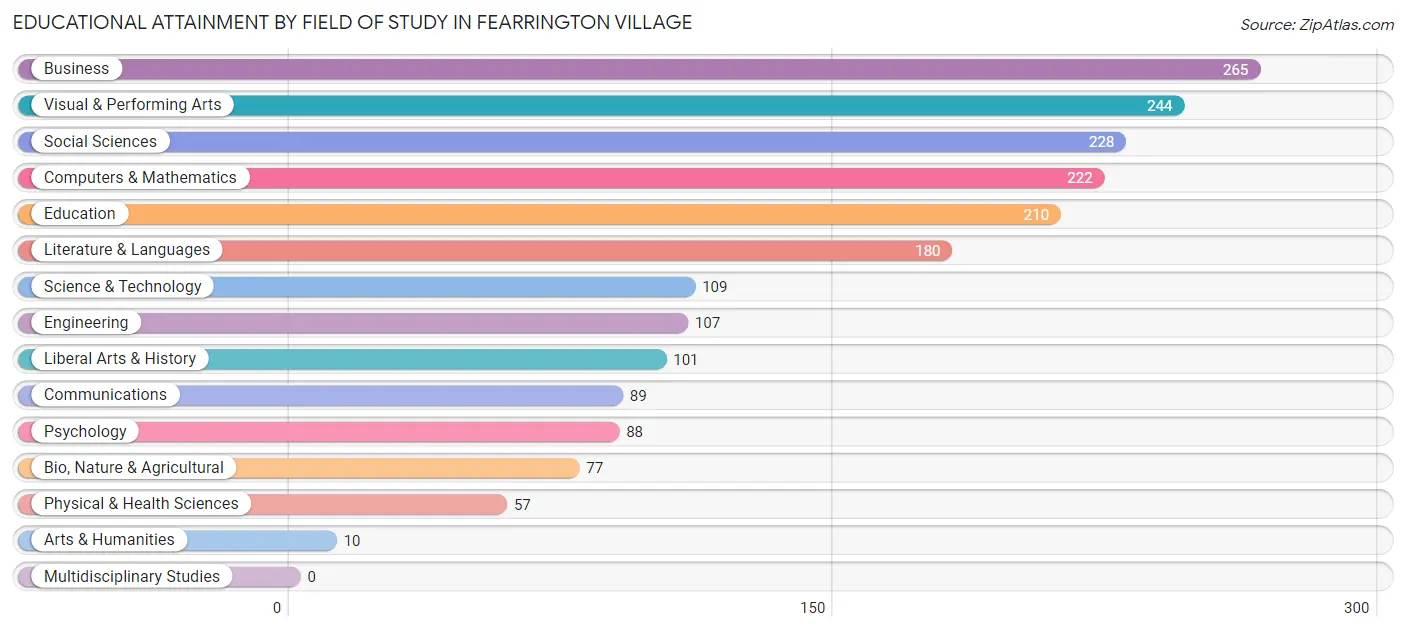
| Field of Study | # Graduates | % Graduates |
| Computers & Mathematics | 222 | 11.2% |
| Bio, Nature & Agricultural | 77 | 3.9% |
| Physical & Health Sciences | 57 | 2.9% |
| Psychology | 88 | 4.4% |
| Social Sciences | 228 | 11.5% |
| Engineering | 107 | 5.4% |
| Multidisciplinary Studies | 0 | 0.0% |
| Science & Technology | 109 | 5.5% |
| Business | 265 | 13.3% |
| Education | 210 | 10.6% |
| Literature & Languages | 180 | 9.1% |
| Liberal Arts & History | 101 | 5.1% |
| Visual & Performing Arts | 244 | 12.3% |
| Communications | 89 | 4.5% |
| Arts & Humanities | 10 | 0.5% |
| Total | 1,987 | 100.0% |
Transportation & Commute in Fearrington Village
Vehicle Availability by Sex in Fearrington Village
The most prevalent vehicle ownership categories in Fearrington Village are males with 2 vehicles (152, accounting for 54.7%) and females with 2 vehicles (91, making up 54.5%).
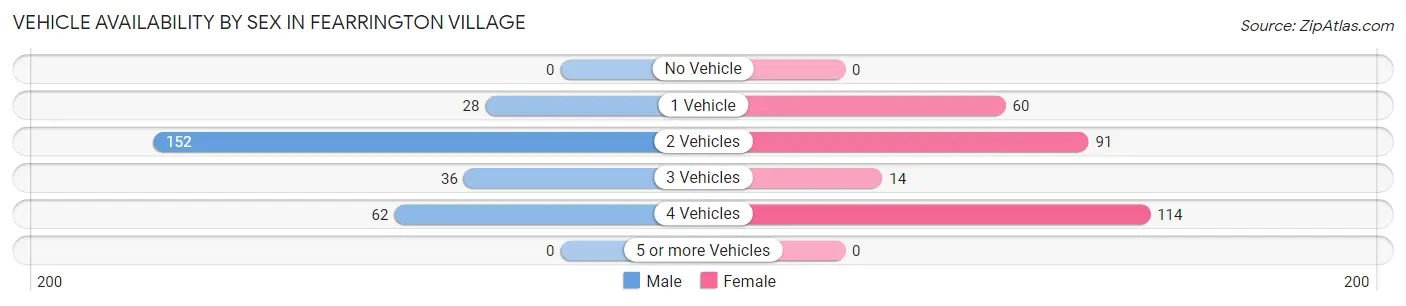
| Vehicles Available | Male | Female |
| No Vehicle | 0 (0.0%) | 0 (0.0%) |
| 1 Vehicle | 28 (10.1%) | 60 (21.5%) |
| 2 Vehicles | 152 (54.7%) | 91 (32.6%) |
| 3 Vehicles | 36 (13.0%) | 14 (5.0%) |
| 4 Vehicles | 62 (22.3%) | 114 (40.9%) |
| 5 or more Vehicles | 0 (0.0%) | 0 (0.0%) |
| Total | 278 (100.0%) | 279 (100.0%) |
Commute Time in Fearrington Village
The most frequently occuring commute durations in Fearrington Village are 30 to 34 minutes (131 commuters, 31.7%), 15 to 19 minutes (72 commuters, 17.4%), and 45 to 59 minutes (63 commuters, 15.2%).
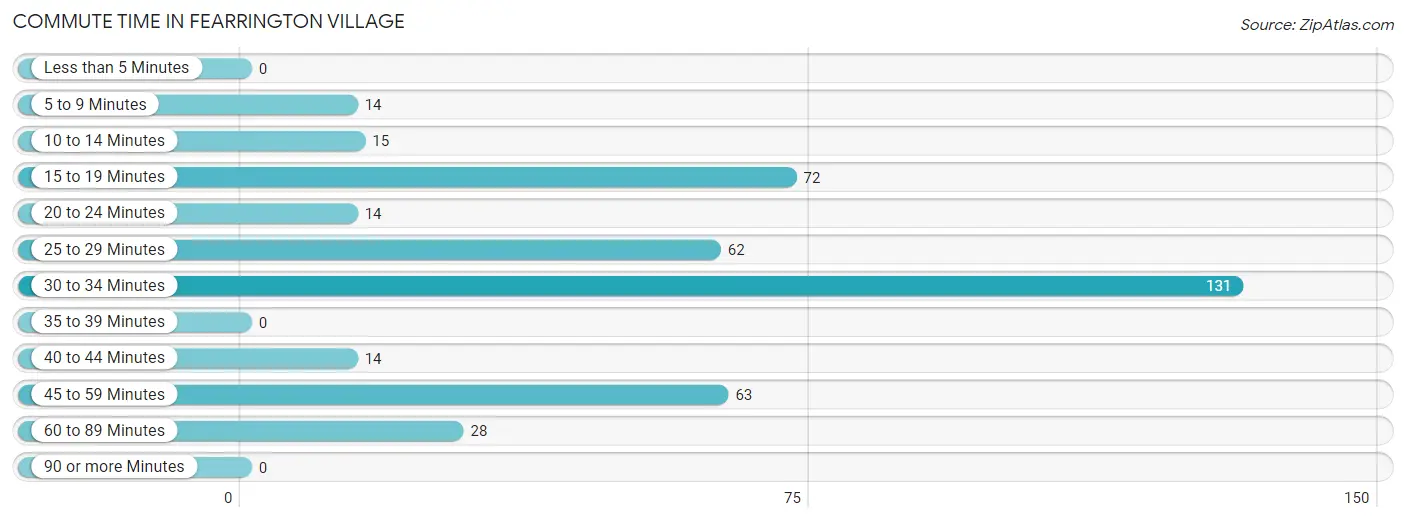
| Commute Time | # Commuters | % Commuters |
| Less than 5 Minutes | 0 | 0.0% |
| 5 to 9 Minutes | 14 | 3.4% |
| 10 to 14 Minutes | 15 | 3.6% |
| 15 to 19 Minutes | 72 | 17.4% |
| 20 to 24 Minutes | 14 | 3.4% |
| 25 to 29 Minutes | 62 | 15.0% |
| 30 to 34 Minutes | 131 | 31.7% |
| 35 to 39 Minutes | 0 | 0.0% |
| 40 to 44 Minutes | 14 | 3.4% |
| 45 to 59 Minutes | 63 | 15.2% |
| 60 to 89 Minutes | 28 | 6.8% |
| 90 or more Minutes | 0 | 0.0% |
Commute Time by Sex in Fearrington Village
The most common commute times in Fearrington Village are 25 to 29 minutes (62 commuters, 32.8%) for males and 15 to 19 minutes (72 commuters, 32.1%) for females.
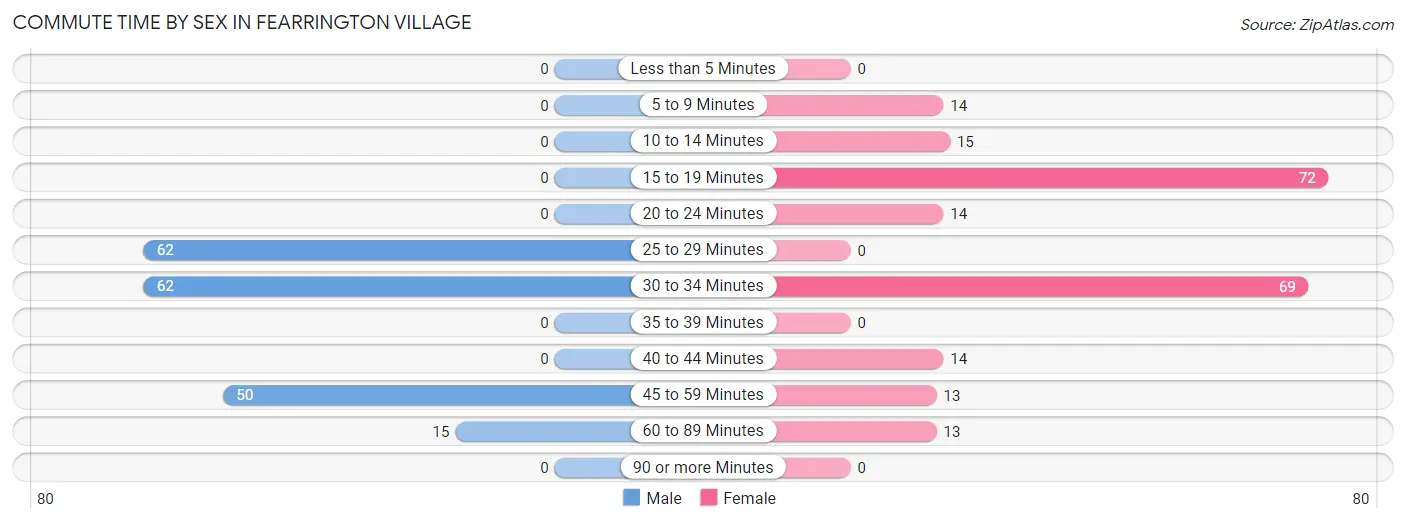
| Commute Time | Male | Female |
| Less than 5 Minutes | 0 (0.0%) | 0 (0.0%) |
| 5 to 9 Minutes | 0 (0.0%) | 14 (6.2%) |
| 10 to 14 Minutes | 0 (0.0%) | 15 (6.7%) |
| 15 to 19 Minutes | 0 (0.0%) | 72 (32.1%) |
| 20 to 24 Minutes | 0 (0.0%) | 14 (6.2%) |
| 25 to 29 Minutes | 62 (32.8%) | 0 (0.0%) |
| 30 to 34 Minutes | 62 (32.8%) | 69 (30.8%) |
| 35 to 39 Minutes | 0 (0.0%) | 0 (0.0%) |
| 40 to 44 Minutes | 0 (0.0%) | 14 (6.2%) |
| 45 to 59 Minutes | 50 (26.5%) | 13 (5.8%) |
| 60 to 89 Minutes | 15 (7.9%) | 13 (5.8%) |
| 90 or more Minutes | 0 (0.0%) | 0 (0.0%) |
Time of Departure to Work by Sex in Fearrington Village
The most frequent times of departure to work in Fearrington Village are 8:00 AM to 8:29 AM (95, 50.3%) for males and 7:30 AM to 7:59 AM (86, 38.4%) for females.
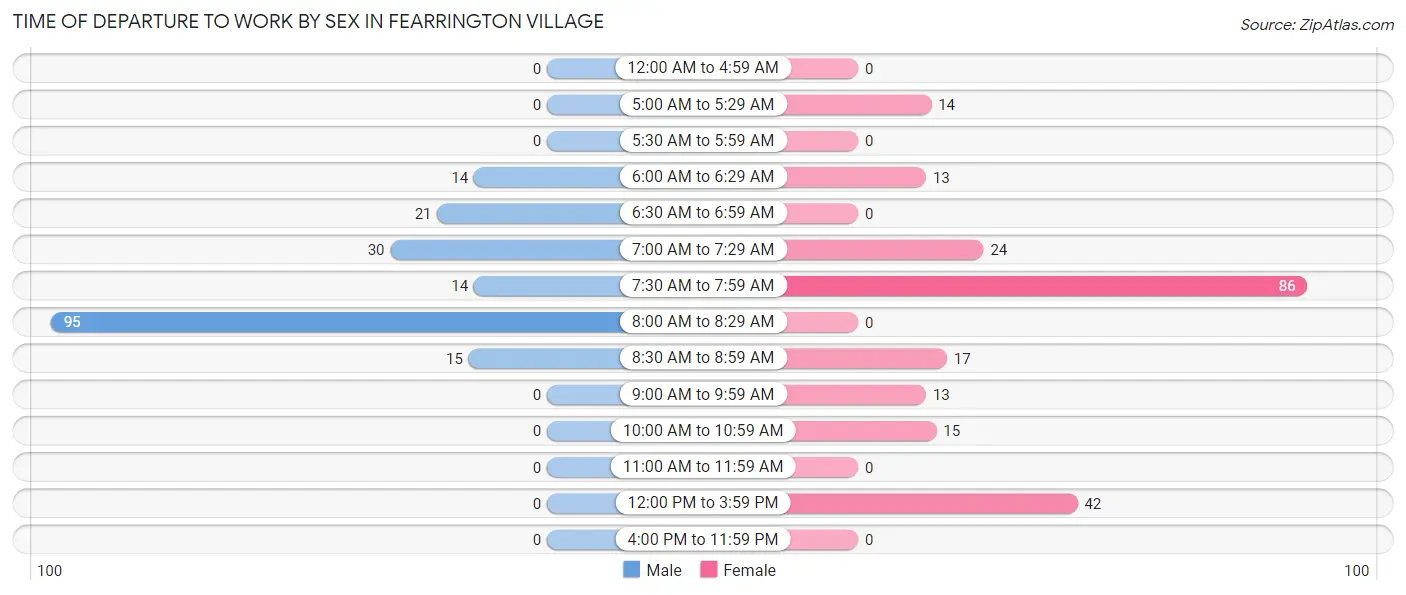
| Time of Departure | Male | Female |
| 12:00 AM to 4:59 AM | 0 (0.0%) | 0 (0.0%) |
| 5:00 AM to 5:29 AM | 0 (0.0%) | 14 (6.2%) |
| 5:30 AM to 5:59 AM | 0 (0.0%) | 0 (0.0%) |
| 6:00 AM to 6:29 AM | 14 (7.4%) | 13 (5.8%) |
| 6:30 AM to 6:59 AM | 21 (11.1%) | 0 (0.0%) |
| 7:00 AM to 7:29 AM | 30 (15.9%) | 24 (10.7%) |
| 7:30 AM to 7:59 AM | 14 (7.4%) | 86 (38.4%) |
| 8:00 AM to 8:29 AM | 95 (50.3%) | 0 (0.0%) |
| 8:30 AM to 8:59 AM | 15 (7.9%) | 17 (7.6%) |
| 9:00 AM to 9:59 AM | 0 (0.0%) | 13 (5.8%) |
| 10:00 AM to 10:59 AM | 0 (0.0%) | 15 (6.7%) |
| 11:00 AM to 11:59 AM | 0 (0.0%) | 0 (0.0%) |
| 12:00 PM to 3:59 PM | 0 (0.0%) | 42 (18.8%) |
| 4:00 PM to 11:59 PM | 0 (0.0%) | 0 (0.0%) |
| Total | 189 (100.0%) | 224 (100.0%) |
Housing Occupancy in Fearrington Village
Occupancy by Ownership in Fearrington Village
Of the total 1,516 dwellings in Fearrington Village, owner-occupied units account for 1,206 (79.5%), while renter-occupied units make up 310 (20.4%).
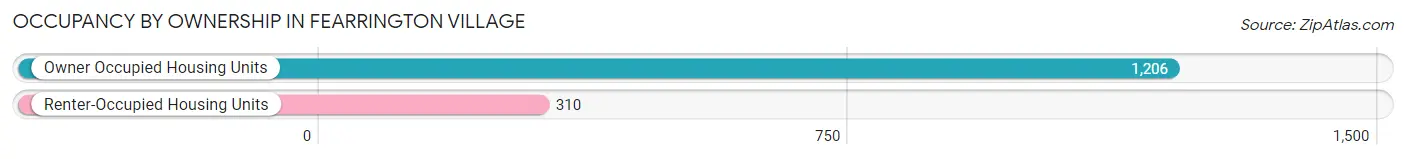
| Occupancy | # Housing Units | % Housing Units |
| Owner Occupied Housing Units | 1,206 | 79.5% |
| Renter-Occupied Housing Units | 310 | 20.4% |
| Total Occupied Housing Units | 1,516 | 100.0% |
Occupancy by Household Size in Fearrington Village
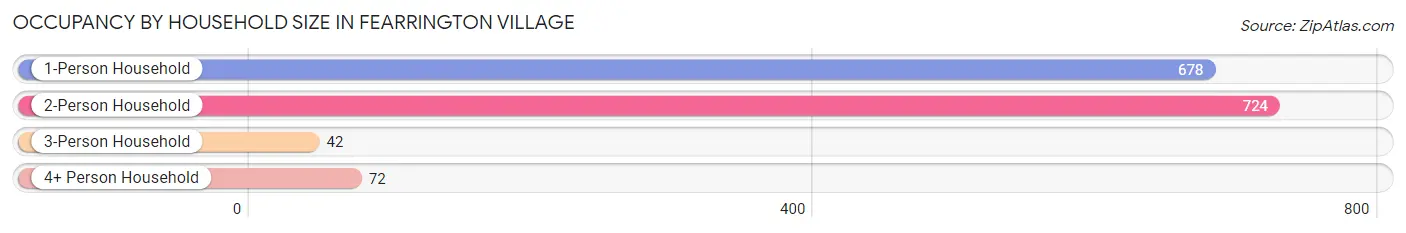
| Household Size | # Housing Units | % Housing Units |
| 1-Person Household | 678 | 44.7% |
| 2-Person Household | 724 | 47.8% |
| 3-Person Household | 42 | 2.8% |
| 4+ Person Household | 72 | 4.8% |
| Total Housing Units | 1,516 | 100.0% |
Occupancy by Ownership by Household Size in Fearrington Village
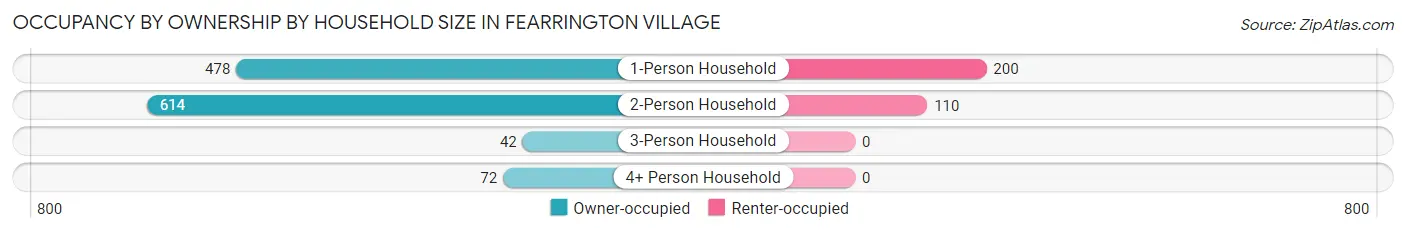
| Household Size | Owner-occupied | Renter-occupied |
| 1-Person Household | 478 (70.5%) | 200 (29.5%) |
| 2-Person Household | 614 (84.8%) | 110 (15.2%) |
| 3-Person Household | 42 (100.0%) | 0 (0.0%) |
| 4+ Person Household | 72 (100.0%) | 0 (0.0%) |
| Total Housing Units | 1,206 (79.5%) | 310 (20.4%) |
Occupancy by Educational Attainment in Fearrington Village
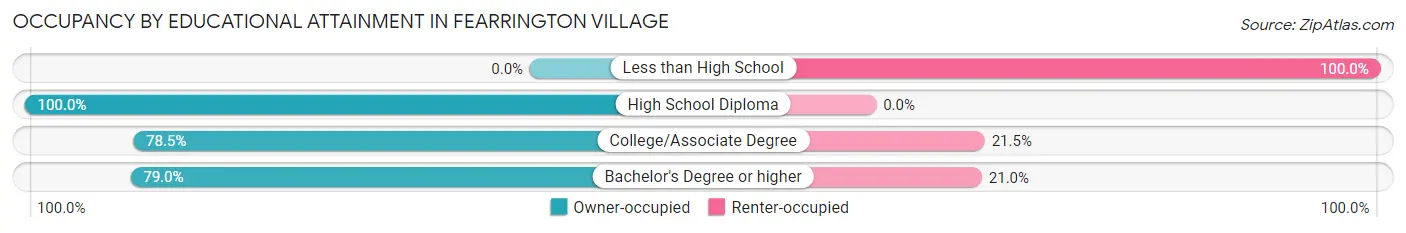
| Household Size | Owner-occupied | Renter-occupied |
| Less than High School | 0 (0.0%) | 9 (100.0%) |
| High School Diploma | 75 (100.0%) | 0 (0.0%) |
| College/Associate Degree | 124 (78.5%) | 34 (21.5%) |
| Bachelor's Degree or higher | 1,007 (79.0%) | 267 (21.0%) |
Occupancy by Age of Householder in Fearrington Village
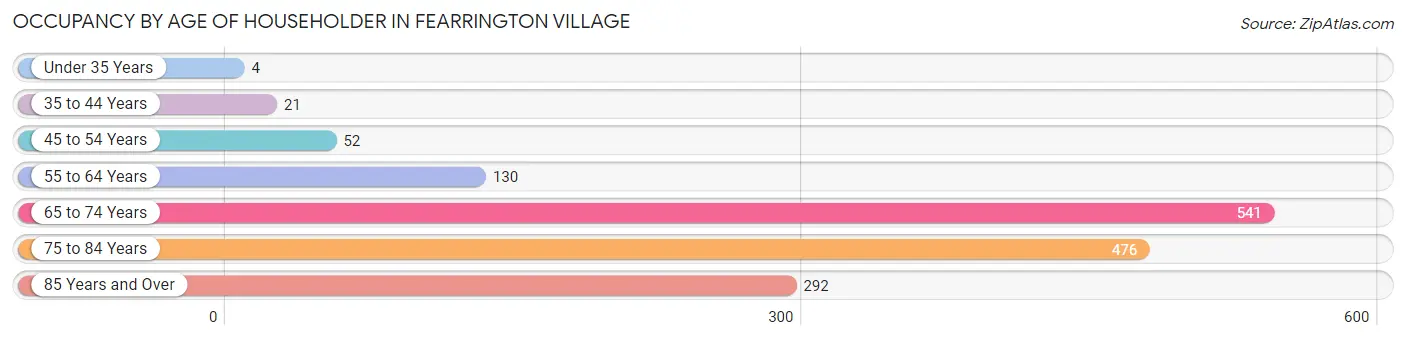
| Age Bracket | # Households | % Households |
| Under 35 Years | 4 | 0.3% |
| 35 to 44 Years | 21 | 1.4% |
| 45 to 54 Years | 52 | 3.4% |
| 55 to 64 Years | 130 | 8.6% |
| 65 to 74 Years | 541 | 35.7% |
| 75 to 84 Years | 476 | 31.4% |
| 85 Years and Over | 292 | 19.3% |
| Total | 1,516 | 100.0% |
Housing Finances in Fearrington Village
Median Income by Occupancy in Fearrington Village
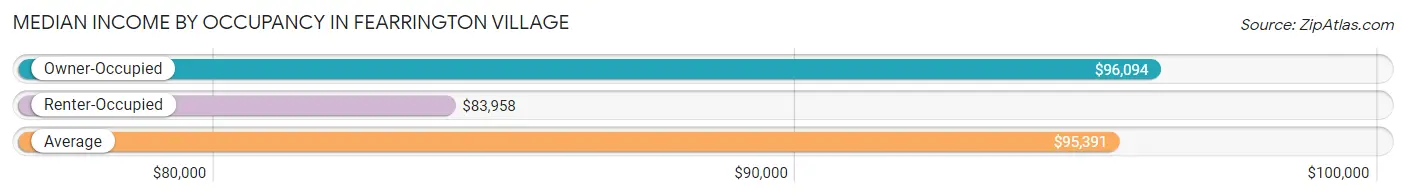
| Occupancy Type | # Households | Median Income |
| Owner-Occupied | 1,206 (79.5%) | $96,094 |
| Renter-Occupied | 310 (20.4%) | $83,958 |
| Average | 1,516 (100.0%) | $95,391 |
Occupancy by Householder Income Bracket in Fearrington Village
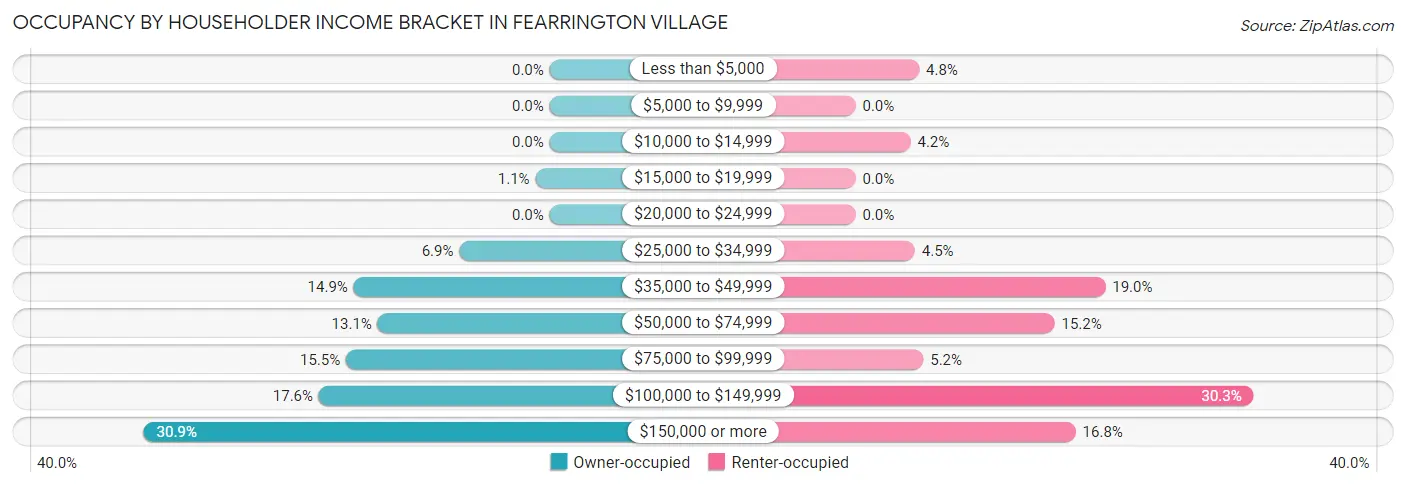
| Income Bracket | Owner-occupied | Renter-occupied |
| Less than $5,000 | 0 (0.0%) | 15 (4.8%) |
| $5,000 to $9,999 | 0 (0.0%) | 0 (0.0%) |
| $10,000 to $14,999 | 0 (0.0%) | 13 (4.2%) |
| $15,000 to $19,999 | 13 (1.1%) | 0 (0.0%) |
| $20,000 to $24,999 | 0 (0.0%) | 0 (0.0%) |
| $25,000 to $34,999 | 83 (6.9%) | 14 (4.5%) |
| $35,000 to $49,999 | 180 (14.9%) | 59 (19.0%) |
| $50,000 to $74,999 | 158 (13.1%) | 47 (15.2%) |
| $75,000 to $99,999 | 187 (15.5%) | 16 (5.2%) |
| $100,000 to $149,999 | 212 (17.6%) | 94 (30.3%) |
| $150,000 or more | 373 (30.9%) | 52 (16.8%) |
| Total | 1,206 (100.0%) | 310 (100.0%) |
Monthly Housing Cost Tiers in Fearrington Village
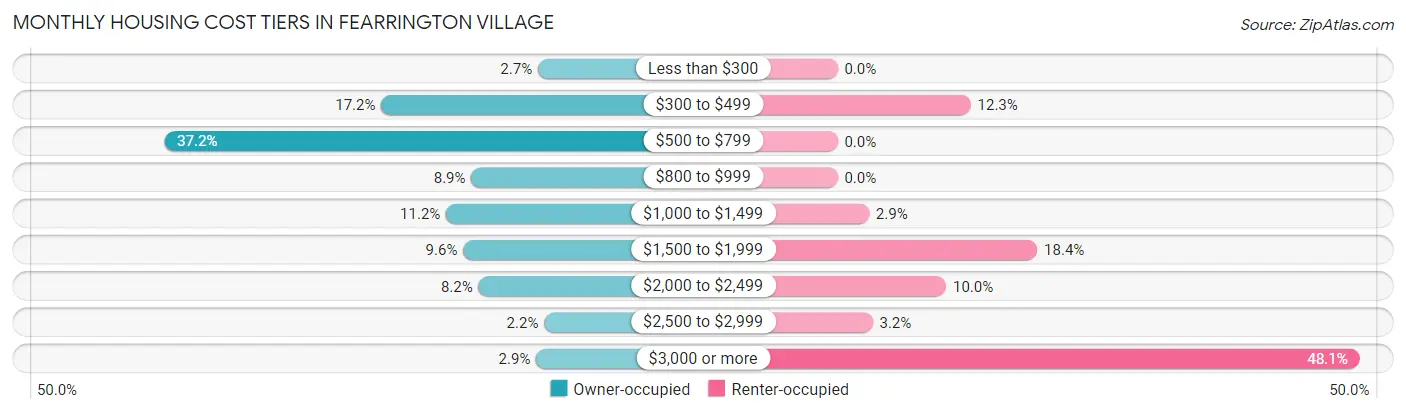
| Monthly Cost | Owner-occupied | Renter-occupied |
| Less than $300 | 33 (2.7%) | 0 (0.0%) |
| $300 to $499 | 207 (17.2%) | 38 (12.3%) |
| $500 to $799 | 448 (37.1%) | 0 (0.0%) |
| $800 to $999 | 107 (8.9%) | 0 (0.0%) |
| $1,000 to $1,499 | 135 (11.2%) | 9 (2.9%) |
| $1,500 to $1,999 | 116 (9.6%) | 57 (18.4%) |
| $2,000 to $2,499 | 99 (8.2%) | 31 (10.0%) |
| $2,500 to $2,999 | 26 (2.2%) | 10 (3.2%) |
| $3,000 or more | 35 (2.9%) | 149 (48.1%) |
| Total | 1,206 (100.0%) | 310 (100.0%) |
Physical Housing Characteristics in Fearrington Village
Housing Structures in Fearrington Village
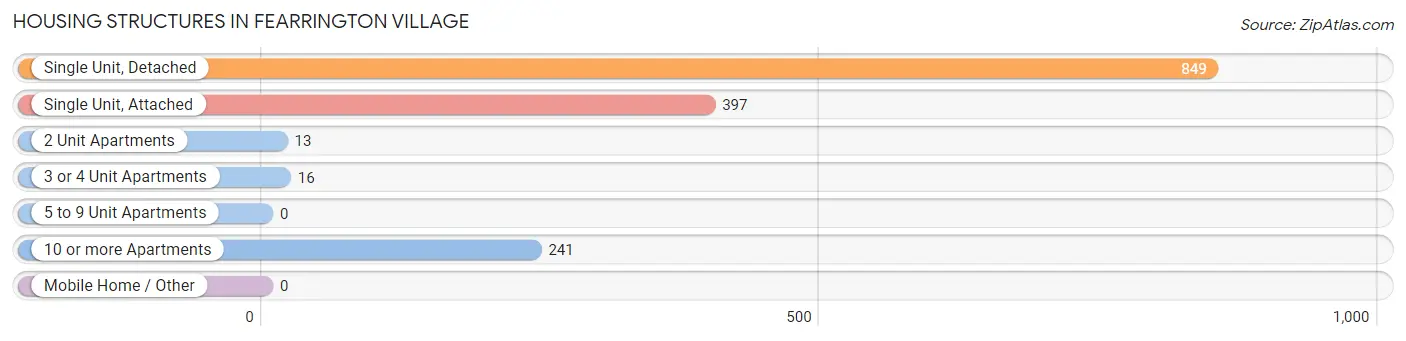
| Structure Type | # Housing Units | % Housing Units |
| Single Unit, Detached | 849 | 56.0% |
| Single Unit, Attached | 397 | 26.2% |
| 2 Unit Apartments | 13 | 0.9% |
| 3 or 4 Unit Apartments | 16 | 1.1% |
| 5 to 9 Unit Apartments | 0 | 0.0% |
| 10 or more Apartments | 241 | 15.9% |
| Mobile Home / Other | 0 | 0.0% |
| Total | 1,516 | 100.0% |
Housing Structures by Occupancy in Fearrington Village
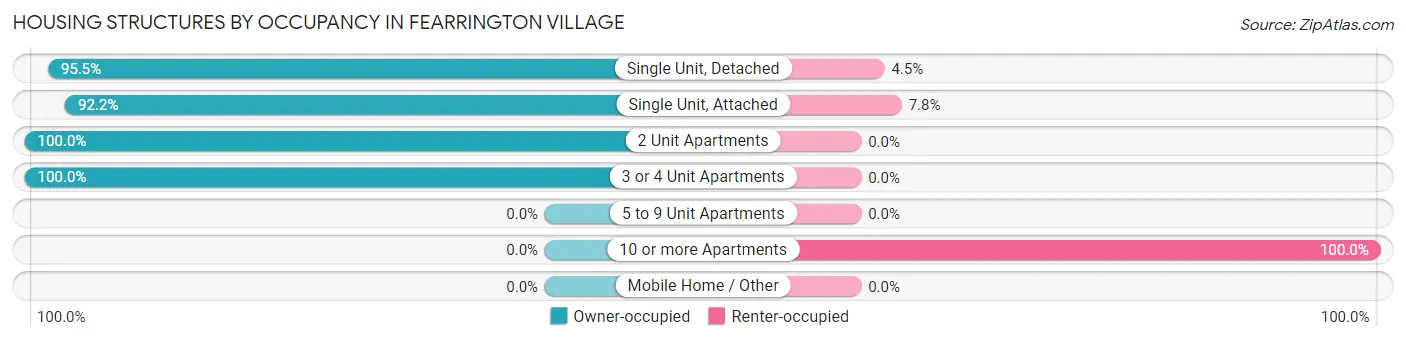
| Structure Type | Owner-occupied | Renter-occupied |
| Single Unit, Detached | 811 (95.5%) | 38 (4.5%) |
| Single Unit, Attached | 366 (92.2%) | 31 (7.8%) |
| 2 Unit Apartments | 13 (100.0%) | 0 (0.0%) |
| 3 or 4 Unit Apartments | 16 (100.0%) | 0 (0.0%) |
| 5 to 9 Unit Apartments | 0 (0.0%) | 0 (0.0%) |
| 10 or more Apartments | 0 (0.0%) | 241 (100.0%) |
| Mobile Home / Other | 0 (0.0%) | 0 (0.0%) |
| Total | 1,206 (79.5%) | 310 (20.4%) |
Housing Structures by Number of Rooms in Fearrington Village
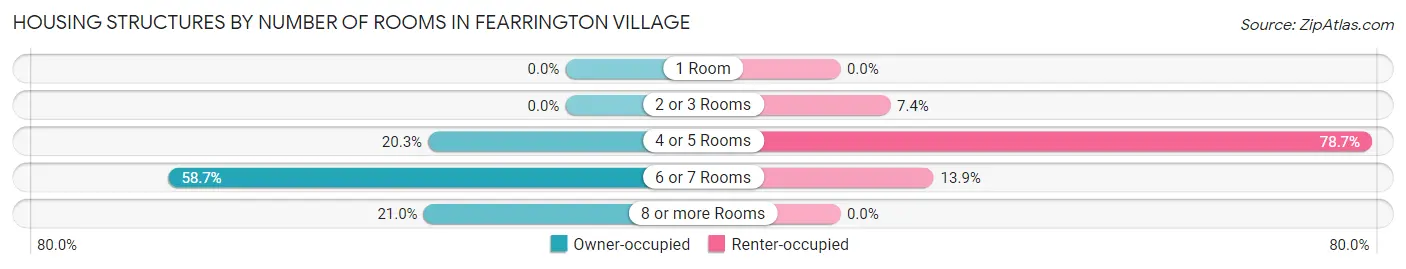
| Number of Rooms | Owner-occupied | Renter-occupied |
| 1 Room | 0 (0.0%) | 0 (0.0%) |
| 2 or 3 Rooms | 0 (0.0%) | 23 (7.4%) |
| 4 or 5 Rooms | 245 (20.3%) | 244 (78.7%) |
| 6 or 7 Rooms | 708 (58.7%) | 43 (13.9%) |
| 8 or more Rooms | 253 (21.0%) | 0 (0.0%) |
| Total | 1,206 (100.0%) | 310 (100.0%) |
Housing Structure by Heating Type in Fearrington Village
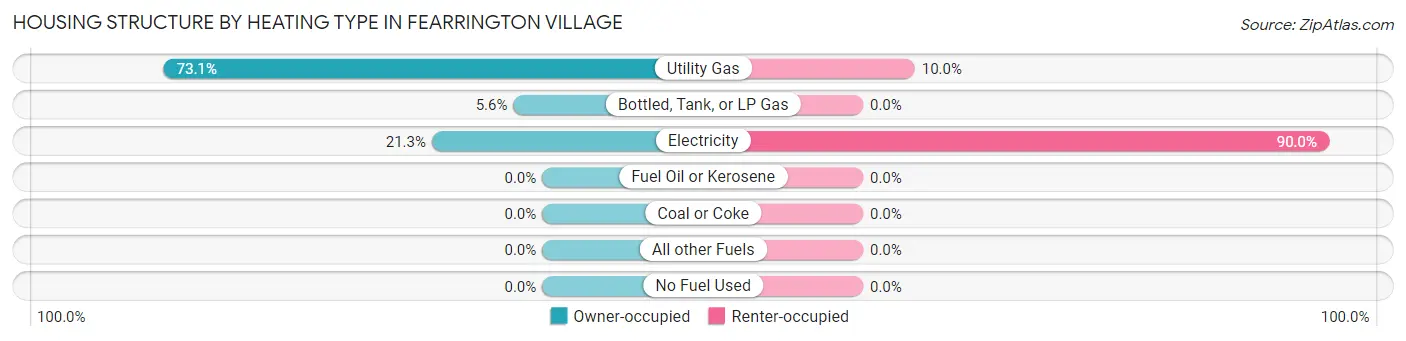
| Heating Type | Owner-occupied | Renter-occupied |
| Utility Gas | 882 (73.1%) | 31 (10.0%) |
| Bottled, Tank, or LP Gas | 67 (5.6%) | 0 (0.0%) |
| Electricity | 257 (21.3%) | 279 (90.0%) |
| Fuel Oil or Kerosene | 0 (0.0%) | 0 (0.0%) |
| Coal or Coke | 0 (0.0%) | 0 (0.0%) |
| All other Fuels | 0 (0.0%) | 0 (0.0%) |
| No Fuel Used | 0 (0.0%) | 0 (0.0%) |
| Total | 1,206 (100.0%) | 310 (100.0%) |
Household Vehicle Usage in Fearrington Village
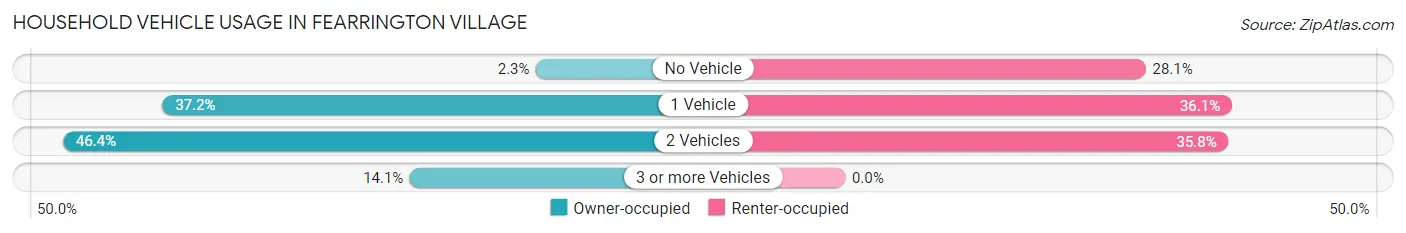
| Vehicles per Household | Owner-occupied | Renter-occupied |
| No Vehicle | 28 (2.3%) | 87 (28.1%) |
| 1 Vehicle | 448 (37.1%) | 112 (36.1%) |
| 2 Vehicles | 560 (46.4%) | 111 (35.8%) |
| 3 or more Vehicles | 170 (14.1%) | 0 (0.0%) |
| Total | 1,206 (100.0%) | 310 (100.0%) |
Real Estate & Mortgages in Fearrington Village
Real Estate and Mortgage Overview in Fearrington Village
| Characteristic | Without Mortgage | With Mortgage |
| Housing Units | 763 | 443 |
| Median Property Value | $437,500 | $362,200 |
| Median Household Income | $79,835 | $192 |
| Monthly Housing Costs | $586 | $35 |
| Real Estate Taxes | $2,967 | $0 |
Property Value by Mortgage Status in Fearrington Village
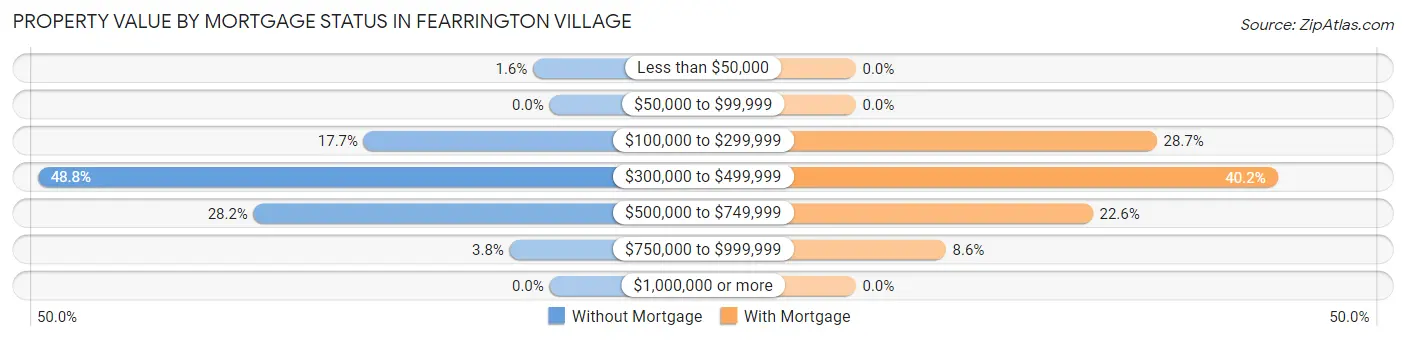
| Property Value | Without Mortgage | With Mortgage |
| Less than $50,000 | 12 (1.6%) | 0 (0.0%) |
| $50,000 to $99,999 | 0 (0.0%) | 0 (0.0%) |
| $100,000 to $299,999 | 135 (17.7%) | 127 (28.7%) |
| $300,000 to $499,999 | 372 (48.7%) | 178 (40.2%) |
| $500,000 to $749,999 | 215 (28.2%) | 100 (22.6%) |
| $750,000 to $999,999 | 29 (3.8%) | 38 (8.6%) |
| $1,000,000 or more | 0 (0.0%) | 0 (0.0%) |
| Total | 763 (100.0%) | 443 (100.0%) |
Household Income by Mortgage Status in Fearrington Village
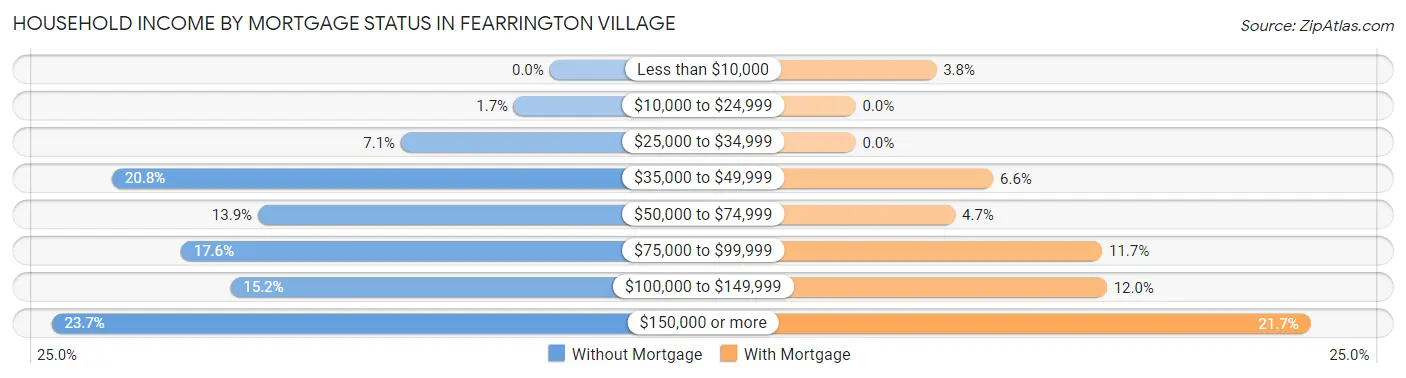
| Household Income | Without Mortgage | With Mortgage |
| Less than $10,000 | 0 (0.0%) | 17 (3.8%) |
| $10,000 to $24,999 | 13 (1.7%) | 0 (0.0%) |
| $25,000 to $34,999 | 54 (7.1%) | 0 (0.0%) |
| $35,000 to $49,999 | 159 (20.8%) | 29 (6.6%) |
| $50,000 to $74,999 | 106 (13.9%) | 21 (4.7%) |
| $75,000 to $99,999 | 134 (17.6%) | 52 (11.7%) |
| $100,000 to $149,999 | 116 (15.2%) | 53 (12.0%) |
| $150,000 or more | 181 (23.7%) | 96 (21.7%) |
| Total | 763 (100.0%) | 443 (100.0%) |
Property Value to Household Income Ratio in Fearrington Village
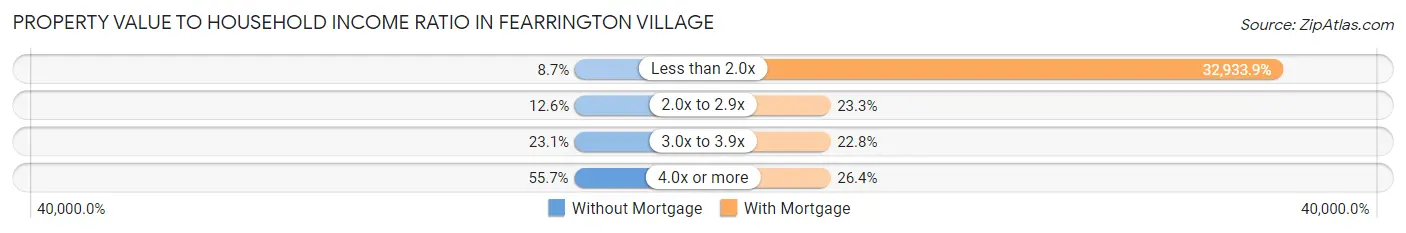
| Value-to-Income Ratio | Without Mortgage | With Mortgage |
| Less than 2.0x | 66 (8.6%) | 145,897 (32,933.9%) |
| 2.0x to 2.9x | 96 (12.6%) | 103 (23.3%) |
| 3.0x to 3.9x | 176 (23.1%) | 101 (22.8%) |
| 4.0x or more | 425 (55.7%) | 117 (26.4%) |
| Total | 763 (100.0%) | 443 (100.0%) |
Real Estate Taxes by Mortgage Status in Fearrington Village
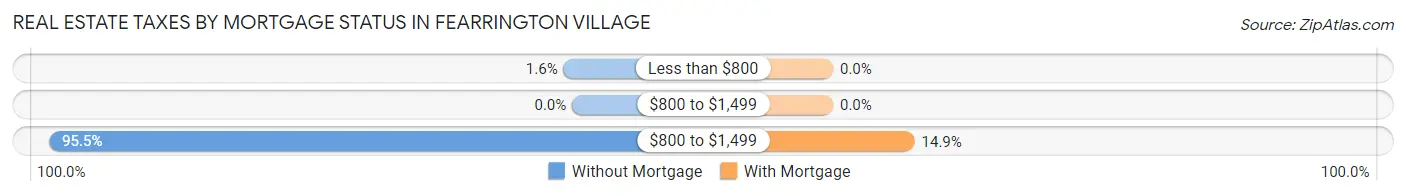
| Property Taxes | Without Mortgage | With Mortgage |
| Less than $800 | 12 (1.6%) | 0 (0.0%) |
| $800 to $1,499 | 0 (0.0%) | 0 (0.0%) |
| $800 to $1,499 | 729 (95.5%) | 66 (14.9%) |
| Total | 763 (100.0%) | 443 (100.0%) |
Health & Disability in Fearrington Village
Health Insurance Coverage by Age in Fearrington Village
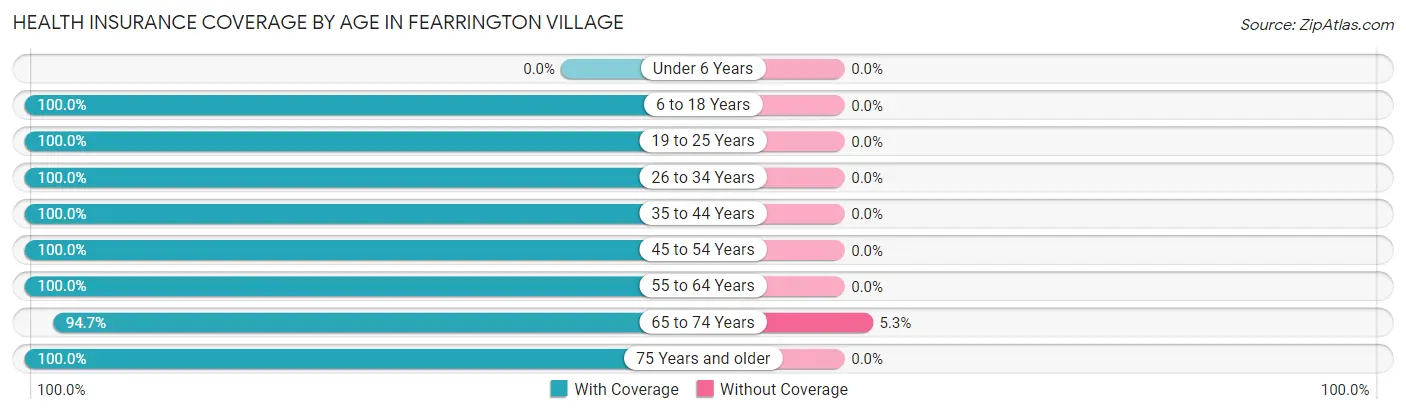
| Age Bracket | With Coverage | Without Coverage |
| Under 6 Years | 0 (0.0%) | 0 (0.0%) |
| 6 to 18 Years | 24 (100.0%) | 0 (0.0%) |
| 19 to 25 Years | 138 (100.0%) | 0 (0.0%) |
| 26 to 34 Years | 18 (100.0%) | 0 (0.0%) |
| 35 to 44 Years | 58 (100.0%) | 0 (0.0%) |
| 45 to 54 Years | 52 (100.0%) | 0 (0.0%) |
| 55 to 64 Years | 253 (100.0%) | 0 (0.0%) |
| 65 to 74 Years | 844 (94.7%) | 47 (5.3%) |
| 75 Years and older | 1,090 (100.0%) | 0 (0.0%) |
| Total | 2,477 (98.1%) | 47 (1.9%) |
Health Insurance Coverage by Citizenship Status in Fearrington Village
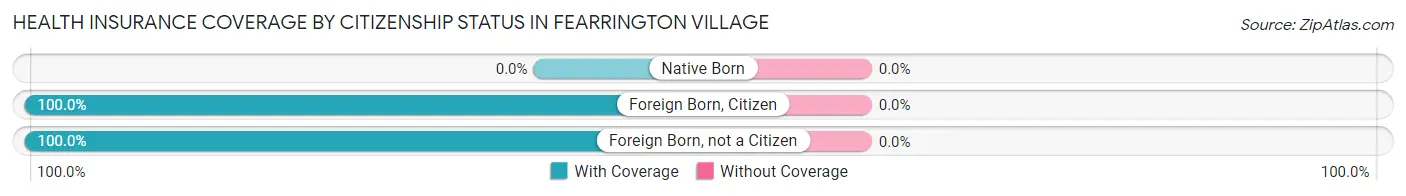
| Citizenship Status | With Coverage | Without Coverage |
| Native Born | 0 (0.0%) | 0 (0.0%) |
| Foreign Born, Citizen | 24 (100.0%) | 0 (0.0%) |
| Foreign Born, not a Citizen | 138 (100.0%) | 0 (0.0%) |
Health Insurance Coverage by Household Income in Fearrington Village
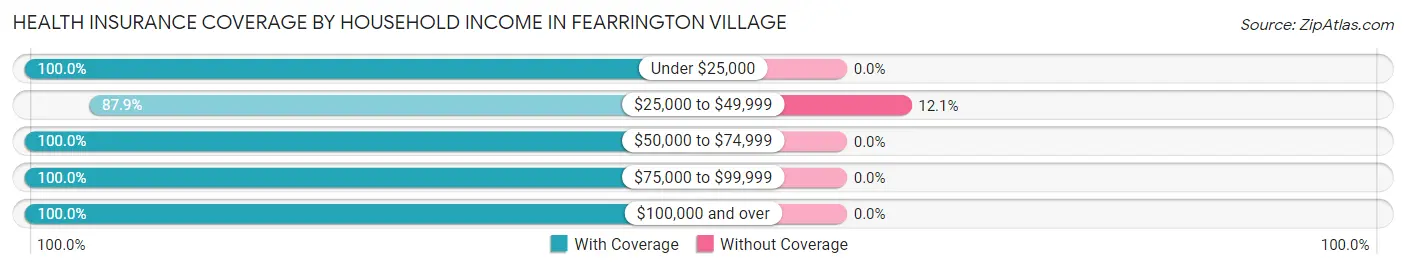
| Household Income | With Coverage | Without Coverage |
| Under $25,000 | 41 (100.0%) | 0 (0.0%) |
| $25,000 to $49,999 | 342 (87.9%) | 47 (12.1%) |
| $50,000 to $74,999 | 263 (100.0%) | 0 (0.0%) |
| $75,000 to $99,999 | 337 (100.0%) | 0 (0.0%) |
| $100,000 and over | 1,494 (100.0%) | 0 (0.0%) |
Public vs Private Health Insurance Coverage by Age in Fearrington Village
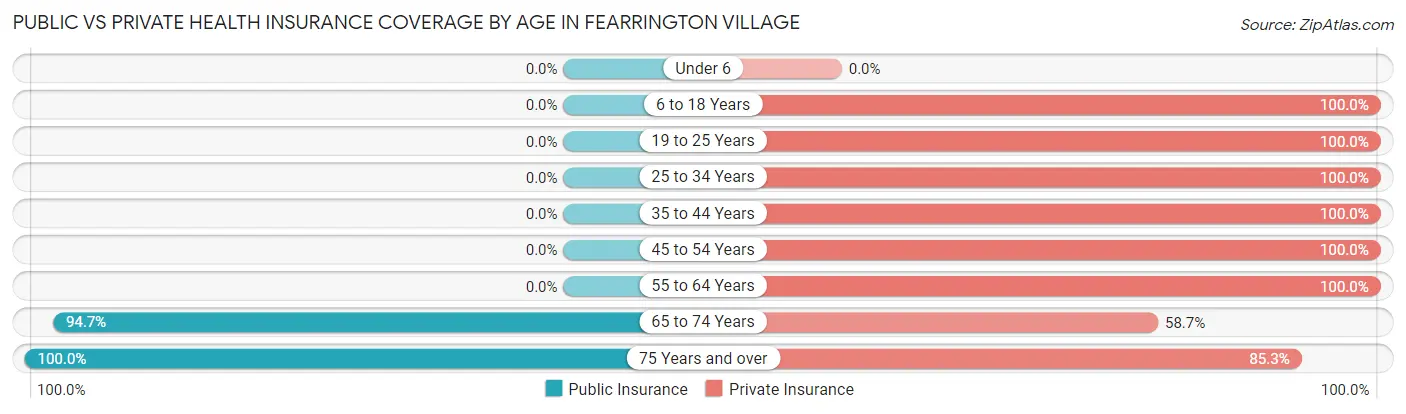
| Age Bracket | Public Insurance | Private Insurance |
| Under 6 | 0 (0.0%) | 0 (0.0%) |
| 6 to 18 Years | 0 (0.0%) | 24 (100.0%) |
| 19 to 25 Years | 0 (0.0%) | 138 (100.0%) |
| 25 to 34 Years | 0 (0.0%) | 18 (100.0%) |
| 35 to 44 Years | 0 (0.0%) | 58 (100.0%) |
| 45 to 54 Years | 0 (0.0%) | 52 (100.0%) |
| 55 to 64 Years | 0 (0.0%) | 253 (100.0%) |
| 65 to 74 Years | 844 (94.7%) | 523 (58.7%) |
| 75 Years and over | 1,090 (100.0%) | 930 (85.3%) |
| Total | 1,934 (76.6%) | 1,996 (79.1%) |
Disability Status by Sex by Age in Fearrington Village
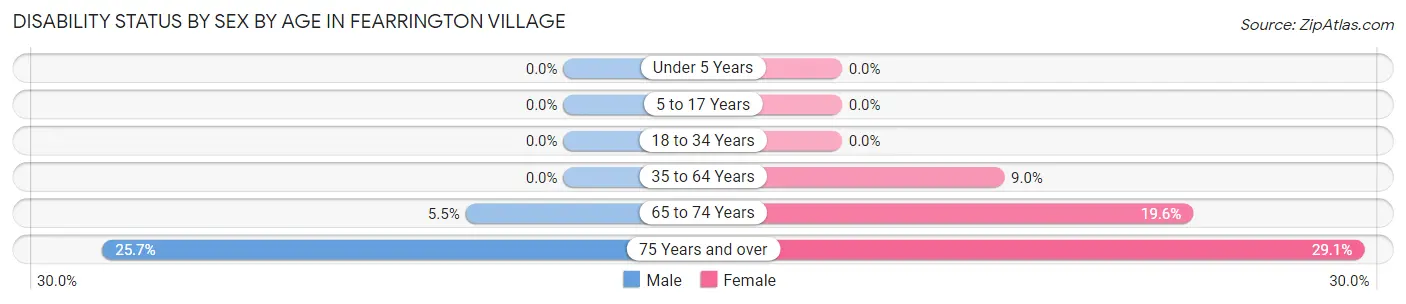
| Age Bracket | Male | Female |
| Under 5 Years | 0 (0.0%) | 0 (0.0%) |
| 5 to 17 Years | 0 (0.0%) | 0 (0.0%) |
| 18 to 34 Years | 0 (0.0%) | 0 (0.0%) |
| 35 to 64 Years | 0 (0.0%) | 16 (9.0%) |
| 65 to 74 Years | 14 (5.4%) | 124 (19.6%) |
| 75 Years and over | 135 (25.7%) | 164 (29.1%) |
Disability Class by Sex by Age in Fearrington Village
Disability Class: Hearing Difficulty
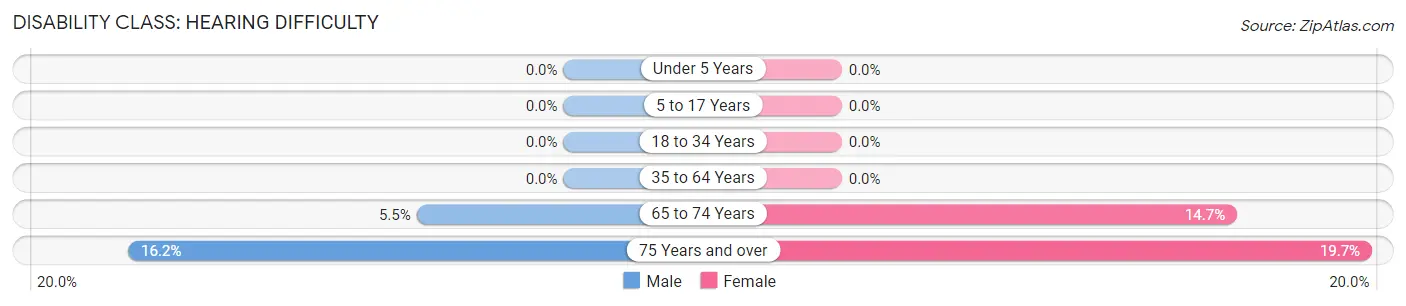
| Age Bracket | Male | Female |
| Under 5 Years | 0 (0.0%) | 0 (0.0%) |
| 5 to 17 Years | 0 (0.0%) | 0 (0.0%) |
| 18 to 34 Years | 0 (0.0%) | 0 (0.0%) |
| 35 to 64 Years | 0 (0.0%) | 0 (0.0%) |
| 65 to 74 Years | 14 (5.4%) | 93 (14.7%) |
| 75 Years and over | 85 (16.2%) | 111 (19.7%) |
Disability Class: Vision Difficulty
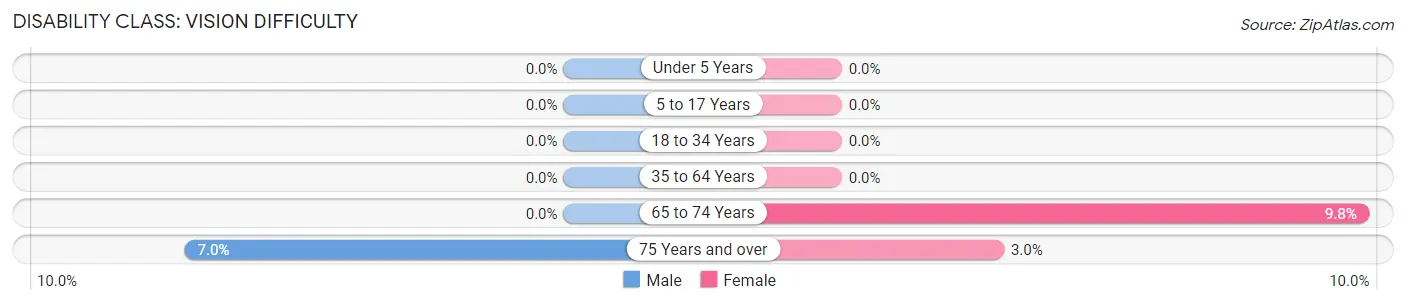
| Age Bracket | Male | Female |
| Under 5 Years | 0 (0.0%) | 0 (0.0%) |
| 5 to 17 Years | 0 (0.0%) | 0 (0.0%) |
| 18 to 34 Years | 0 (0.0%) | 0 (0.0%) |
| 35 to 64 Years | 0 (0.0%) | 0 (0.0%) |
| 65 to 74 Years | 0 (0.0%) | 62 (9.8%) |
| 75 Years and over | 37 (7.0%) | 17 (3.0%) |
Disability Class: Cognitive Difficulty
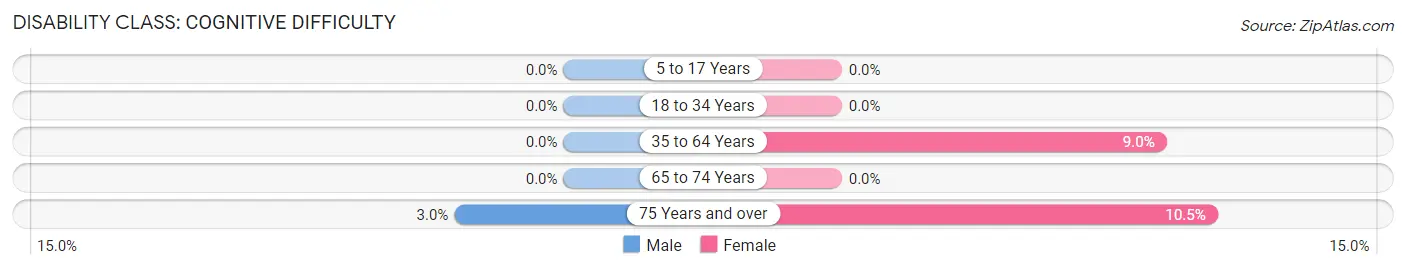
| Age Bracket | Male | Female |
| 5 to 17 Years | 0 (0.0%) | 0 (0.0%) |
| 18 to 34 Years | 0 (0.0%) | 0 (0.0%) |
| 35 to 64 Years | 0 (0.0%) | 16 (9.0%) |
| 65 to 74 Years | 0 (0.0%) | 0 (0.0%) |
| 75 Years and over | 16 (3.0%) | 59 (10.5%) |
Disability Class: Ambulatory Difficulty
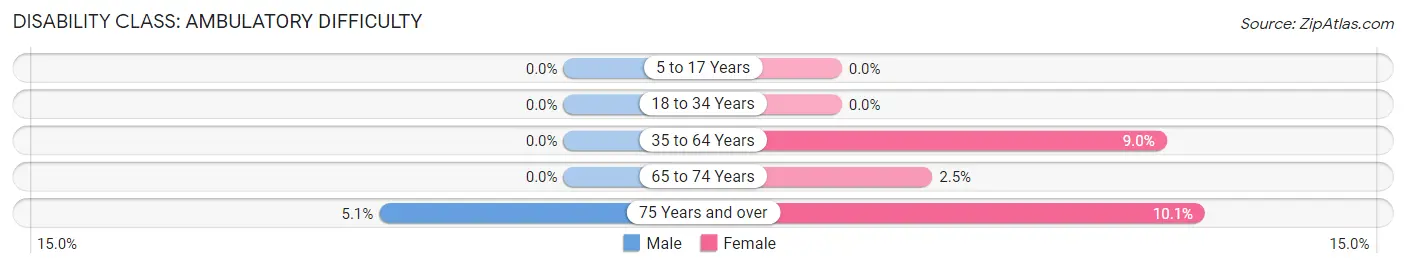
| Age Bracket | Male | Female |
| 5 to 17 Years | 0 (0.0%) | 0 (0.0%) |
| 18 to 34 Years | 0 (0.0%) | 0 (0.0%) |
| 35 to 64 Years | 0 (0.0%) | 16 (9.0%) |
| 65 to 74 Years | 0 (0.0%) | 16 (2.5%) |
| 75 Years and over | 27 (5.1%) | 57 (10.1%) |
Disability Class: Self-Care Difficulty
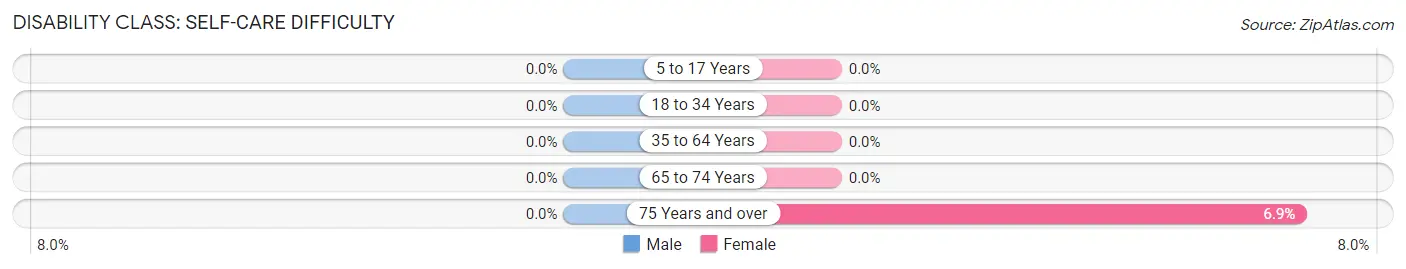
| Age Bracket | Male | Female |
| 5 to 17 Years | 0 (0.0%) | 0 (0.0%) |
| 18 to 34 Years | 0 (0.0%) | 0 (0.0%) |
| 35 to 64 Years | 0 (0.0%) | 0 (0.0%) |
| 65 to 74 Years | 0 (0.0%) | 0 (0.0%) |
| 75 Years and over | 0 (0.0%) | 39 (6.9%) |
Technology Access in Fearrington Village
Computing Device Access in Fearrington Village
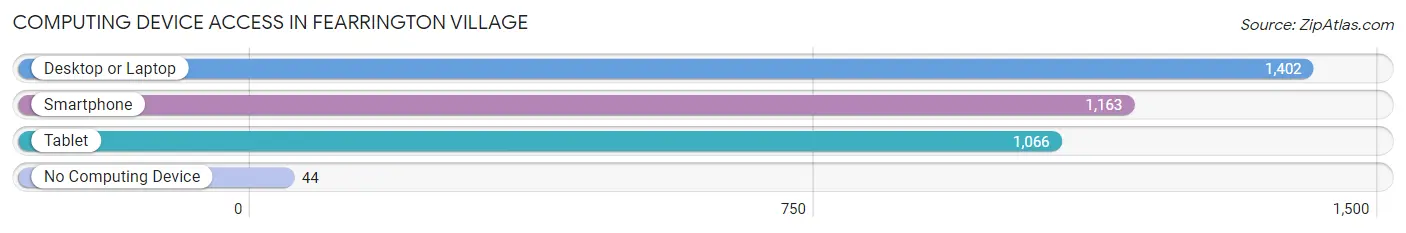
| Device Type | # Households | % Households |
| Desktop or Laptop | 1,402 | 92.5% |
| Smartphone | 1,163 | 76.7% |
| Tablet | 1,066 | 70.3% |
| No Computing Device | 44 | 2.9% |
| Total | 1,516 | 100.0% |
Internet Access in Fearrington Village
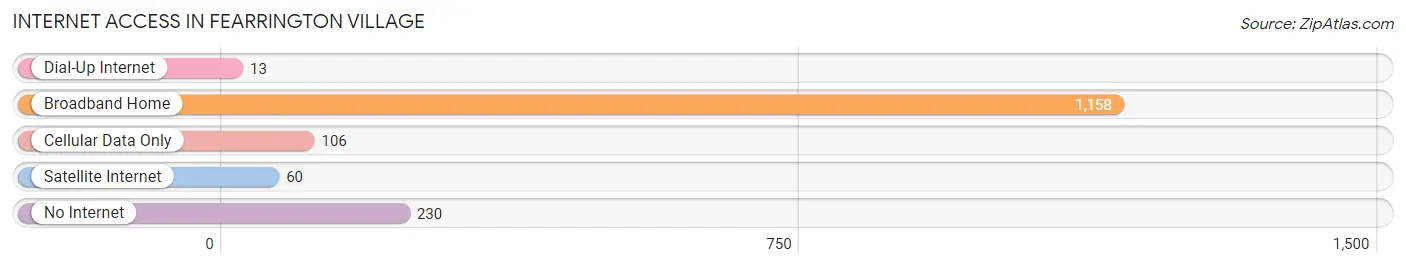
| Internet Type | # Households | % Households |
| Dial-Up Internet | 13 | 0.9% |
| Broadband Home | 1,158 | 76.4% |
| Cellular Data Only | 106 | 7.0% |
| Satellite Internet | 60 | 4.0% |
| No Internet | 230 | 15.2% |
| Total | 1,516 | 100.0% |
Fearrington Village Summary
History
The history of Fearrington Village, North Carolina dates back to the late 1700s when the area was first settled by Quakers. The village was originally known as “Fearrington’s Crossroads” and was located at the intersection of two major roads. The village was named after the Fearrington family, who were among the first settlers in the area.
The village was a small farming community for many years, but in the early 1900s, the village began to grow and develop. The village was incorporated in 1913 and the first mayor was elected in 1914.
In the 1950s, Fearrington Village began to experience a period of growth and development. The village was home to several businesses, including a grocery store, a hardware store, and a post office. The village also had a school, a library, and a fire station.
In the late 1970s, Fearrington Village began to experience a period of decline. Many of the businesses in the village closed and the population began to decline. In the early 1980s, the village was in danger of becoming a ghost town.
In the late 1980s, Fearrington Village began to experience a period of revitalization. The village was home to several new businesses, including a restaurant, a bed and breakfast, and a bookstore. The village also had a new library and a new fire station.
In the early 2000s, Fearrington Village experienced a period of growth and development. The village was home to several new businesses, including a grocery store, a hardware store, and a post office. The village also had a school, a library, and a fire station.
Geography
Fearrington Village is located in Chatham County, North Carolina. The village is situated in the Piedmont region of North Carolina, which is characterized by rolling hills and lush forests. The village is located approximately 25 miles south of Raleigh and is bordered by the towns of Pittsboro, Siler City, and Sanford.
The village is located at an elevation of approximately 500 feet above sea level. The village is located in a humid subtropical climate zone, which is characterized by hot, humid summers and mild winters.
Economy
The economy of Fearrington Village is largely based on agriculture and tourism. The village is home to several farms, which produce a variety of crops, including corn, soybeans, and tobacco. The village is also home to several wineries, which produce a variety of wines.
The village is also home to several businesses, including a grocery store, a hardware store, and a post office. The village also has a school, a library, and a fire station.
The village is also home to several tourist attractions, including the Fearrington House Museum, which is a historic house museum that showcases the history of the village. The village is also home to several restaurants, which serve a variety of cuisines.
Demographics
As of the 2010 census, the population of Fearrington Village was 1,845. The population is largely white (94.3%) and the median age is 44. The median household income is $68,750 and the median home value is $310,000. The village is home to several churches, including the Fearrington United Methodist Church and the Fearrington Presbyterian Church.
Common Questions
What is Per Capita Income in Fearrington Village?
Per Capita income in Fearrington Village is $72,581.
What is the Median Family Income in Fearrington Village?
Median Family Income in Fearrington Village is $135,597.
What is the Median Household income in Fearrington Village?
Median Household Income in Fearrington Village is $95,391.
What is Inequality or Gini Index in Fearrington Village?
Inequality or Gini Index in Fearrington Village is 0.41.
What is the Total Population of Fearrington Village?
Total Population of Fearrington Village is 2,582.
What is the Total Male Population of Fearrington Village?
Total Male Population of Fearrington Village is 1,104.
What is the Total Female Population of Fearrington Village?
Total Female Population of Fearrington Village is 1,478.
What is the Ratio of Males per 100 Females in Fearrington Village?
There are 74.70 Males per 100 Females in Fearrington Village.
What is the Ratio of Females per 100 Males in Fearrington Village?
There are 133.88 Females per 100 Males in Fearrington Village.
What is the Median Population Age in Fearrington Village?
Median Population Age in Fearrington Village is 73.7 Years.
What is the Average Family Size in Fearrington Village
Average Family Size in Fearrington Village is 2.2 People.
What is the Average Household Size in Fearrington Village
Average Household Size in Fearrington Village is 1.7 People.
How Large is the Labor Force in Fearrington Village?
There are 558 People in the Labor Forcein in Fearrington Village.
What is the Percentage of People in the Labor Force in Fearrington Village?
21.6% of People are in the Labor Force in Fearrington Village.