White Hall, WV Map & Demographics
White Hall Map
White Hall Overview
$35,840
PER CAPITA INCOME
$84,583
AVG FAMILY INCOME
$67,679
AVG HOUSEHOLD INCOME
8.3%
WAGE / INCOME GAP [ % ]
91.7¢/ $1
WAGE / INCOME GAP [ $ ]
0.36
INEQUALITY / GINI INDEX
1,025
TOTAL POPULATION
562
MALE POPULATION
463
FEMALE POPULATION
121.38
MALES / 100 FEMALES
82.38
FEMALES / 100 MALES
35.2
MEDIAN AGE
3.4
AVG FAMILY SIZE
2.6
AVG HOUSEHOLD SIZE
547
LABOR FORCE [ PEOPLE ]
69.9%
PERCENT IN LABOR FORCE
5.0%
UNEMPLOYMENT RATE
Income in White Hall
Income Overview in White Hall
Per Capita Income in White Hall is $35,840, while median incomes of families and households are $84,583 and $67,679 respectively.
| Characteristic | Number | Measure |
| Per Capita Income | 1,025 | $35,840 |
| Median Family Income | 232 | $84,583 |
| Mean Family Income | 232 | $100,414 |
| Median Household Income | 395 | $67,679 |
| Mean Household Income | 395 | $86,398 |
| Income Deficit | 232 | $0 |
| Wage / Income Gap (%) | 1,025 | 8.29% |
| Wage / Income Gap ($) | 1,025 | 91.71¢ per $1 |
| Gini / Inequality Index | 1,025 | 0.36 |
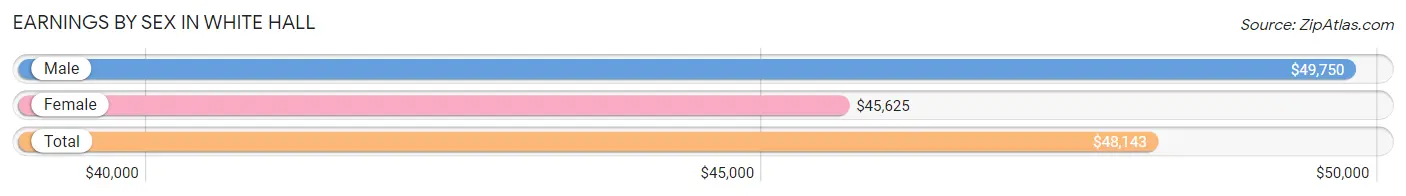
Earnings by Sex in White Hall
Average Earnings in White Hall are $48,143, $49,750 for men and $45,625 for women, a difference of 8.3%.
| Sex | Number | Average Earnings |
| Male | 321 (57.3%) | $49,750 |
| Female | 239 (42.7%) | $45,625 |
| Total | 560 (100.0%) | $48,143 |
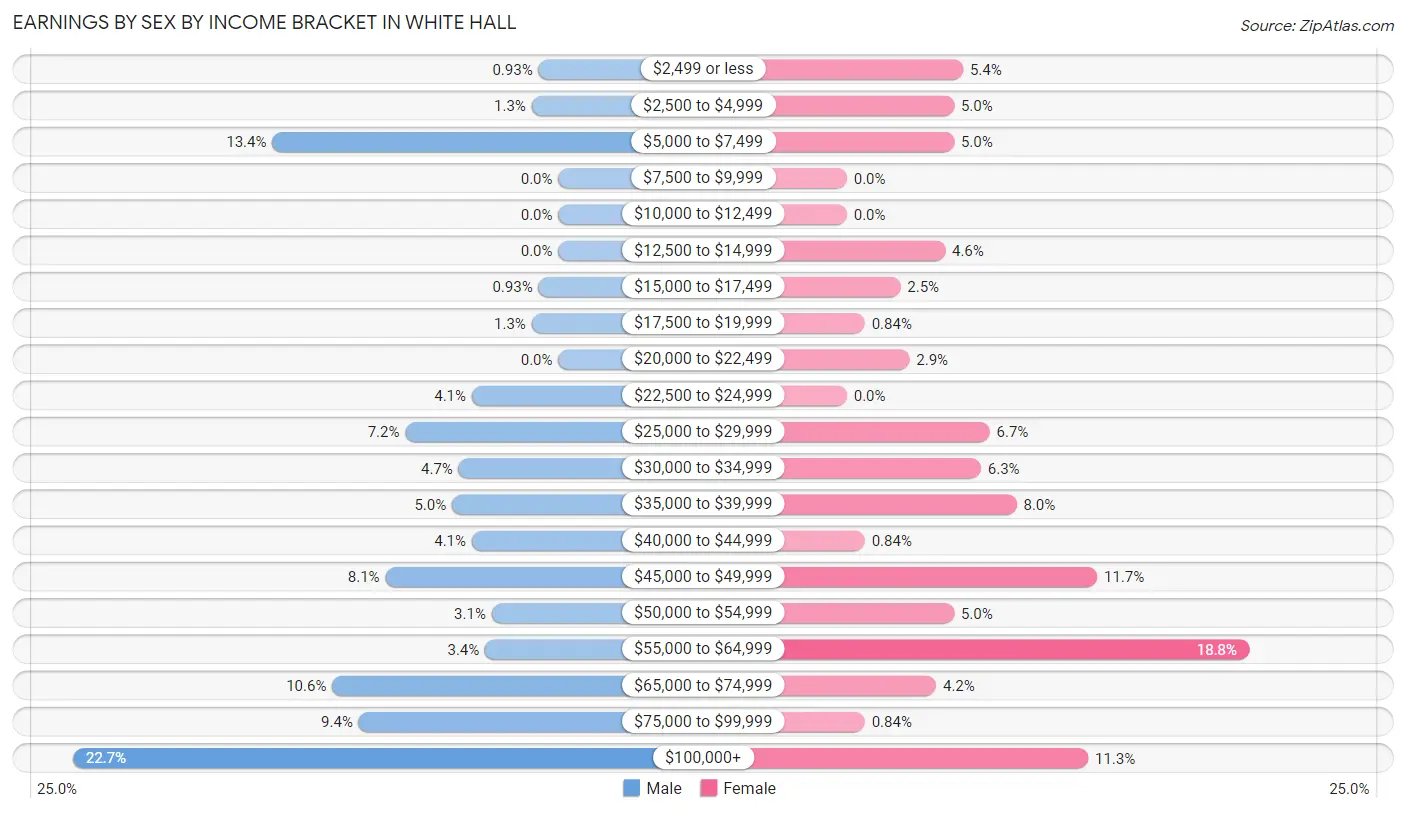
Earnings by Sex by Income Bracket in White Hall
The most common earnings brackets in White Hall are $100,000+ for men (73 | 22.7%) and $55,000 to $64,999 for women (45 | 18.8%).
| Income | Male | Female |
| $2,499 or less | 3 (0.9%) | 13 (5.4%) |
| $2,500 to $4,999 | 4 (1.3%) | 12 (5.0%) |
| $5,000 to $7,499 | 43 (13.4%) | 12 (5.0%) |
| $7,500 to $9,999 | 0 (0.0%) | 0 (0.0%) |
| $10,000 to $12,499 | 0 (0.0%) | 0 (0.0%) |
| $12,500 to $14,999 | 0 (0.0%) | 11 (4.6%) |
| $15,000 to $17,499 | 3 (0.9%) | 6 (2.5%) |
| $17,500 to $19,999 | 4 (1.3%) | 2 (0.8%) |
| $20,000 to $22,499 | 0 (0.0%) | 7 (2.9%) |
| $22,500 to $24,999 | 13 (4.1%) | 0 (0.0%) |
| $25,000 to $29,999 | 23 (7.2%) | 16 (6.7%) |
| $30,000 to $34,999 | 15 (4.7%) | 15 (6.3%) |
| $35,000 to $39,999 | 16 (5.0%) | 19 (8.0%) |
| $40,000 to $44,999 | 13 (4.1%) | 2 (0.8%) |
| $45,000 to $49,999 | 26 (8.1%) | 28 (11.7%) |
| $50,000 to $54,999 | 10 (3.1%) | 12 (5.0%) |
| $55,000 to $64,999 | 11 (3.4%) | 45 (18.8%) |
| $65,000 to $74,999 | 34 (10.6%) | 10 (4.2%) |
| $75,000 to $99,999 | 30 (9.3%) | 2 (0.8%) |
| $100,000+ | 73 (22.7%) | 27 (11.3%) |
| Total | 321 (100.0%) | 239 (100.0%) |
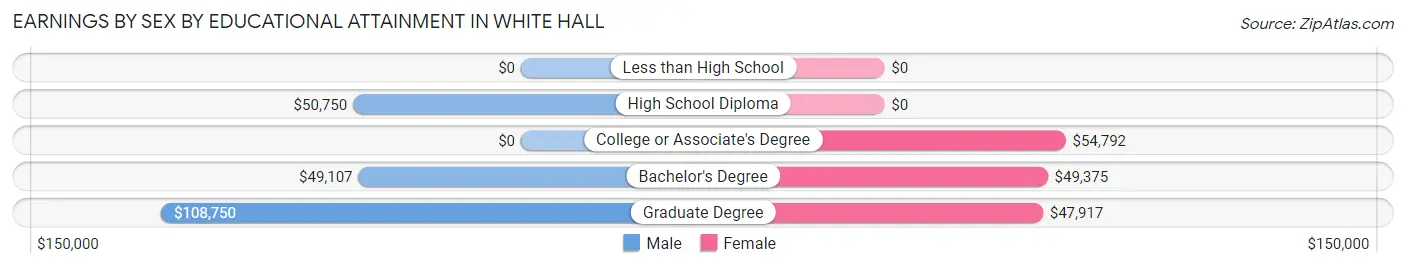
Earnings by Sex by Educational Attainment in White Hall
Average earnings in White Hall are $60,208 for men and $47,153 for women, a difference of 21.7%. Men with an educational attainment of graduate degree enjoy the highest average annual earnings of $108,750, while those with bachelor's degree education earn the least with $49,107. Women with an educational attainment of college or associate's degree earn the most with the average annual earnings of $54,792, while those with graduate degree education have the smallest earnings of $47,917.
| Educational Attainment | Male Income | Female Income |
| Less than High School | - | - |
| High School Diploma | $50,750 | $0 |
| College or Associate's Degree | - | - |
| Bachelor's Degree | $49,107 | $49,375 |
| Graduate Degree | $108,750 | $47,917 |
| Total | $60,208 | $47,153 |
Family Income in White Hall
Family Income Brackets in White Hall
According to the White Hall family income data, there are 57 families falling into the $50,000 to $74,999 income range, which is the most common income bracket and makes up 24.6% of all families. Conversely, the $10,000 to $14,999 income bracket is the least frequent group with only 4 families (1.7%) belonging to this category.
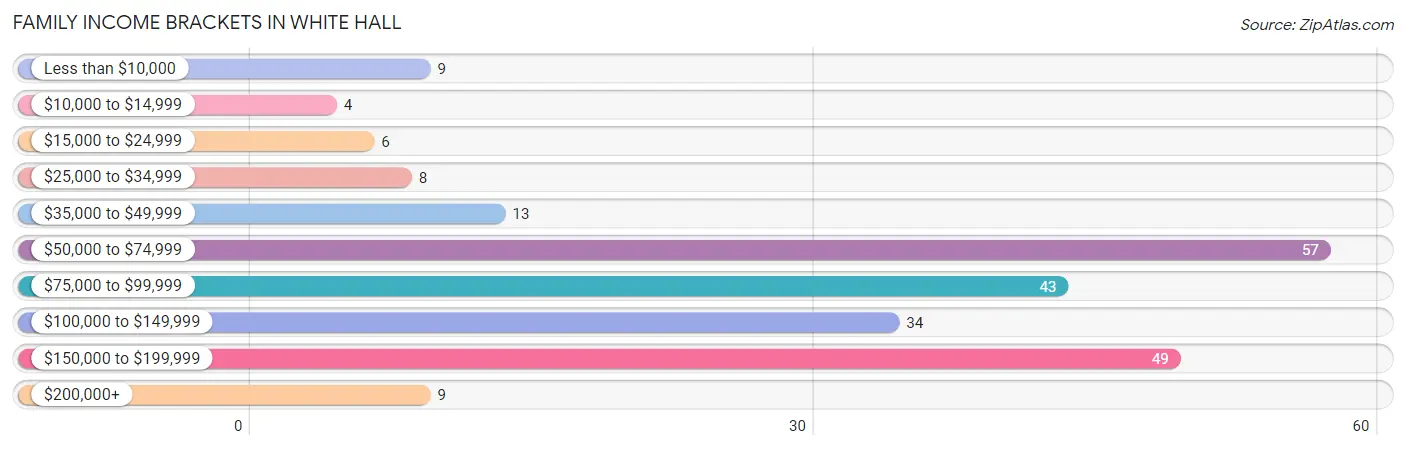
| Income Bracket | # Families | % Families |
| Less than $10,000 | 9 | 3.9% |
| $10,000 to $14,999 | 4 | 1.7% |
| $15,000 to $24,999 | 6 | 2.6% |
| $25,000 to $34,999 | 8 | 3.4% |
| $35,000 to $49,999 | 13 | 5.6% |
| $50,000 to $74,999 | 57 | 24.6% |
| $75,000 to $99,999 | 43 | 18.5% |
| $100,000 to $149,999 | 34 | 14.7% |
| $150,000 to $199,999 | 49 | 21.1% |
| $200,000+ | 9 | 3.9% |
Family Income by Famaliy Size in White Hall
5-person families (39 | 16.8%) account for the highest median family income in White Hall with $136,750 per family, while 2-person families (79 | 34.1%) have the highest median income of $39,844 per family member.
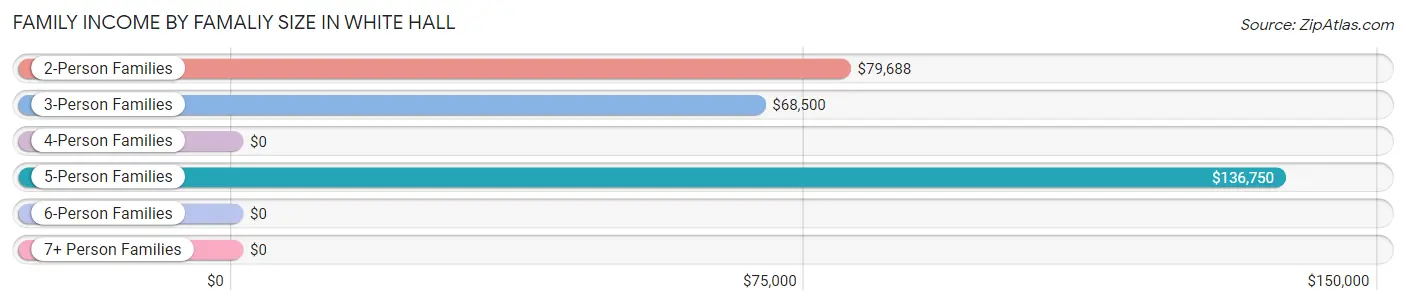
| Income Bracket | # Families | Median Income |
| 2-Person Families | 79 (34.1%) | $79,688 |
| 3-Person Families | 84 (36.2%) | $68,500 |
| 4-Person Families | 21 (9.0%) | $0 |
| 5-Person Families | 39 (16.8%) | $136,750 |
| 6-Person Families | 9 (3.9%) | $0 |
| 7+ Person Families | 0 (0.0%) | $0 |
| Total | 232 (100.0%) | $84,583 |
Family Income by Number of Earners in White Hall
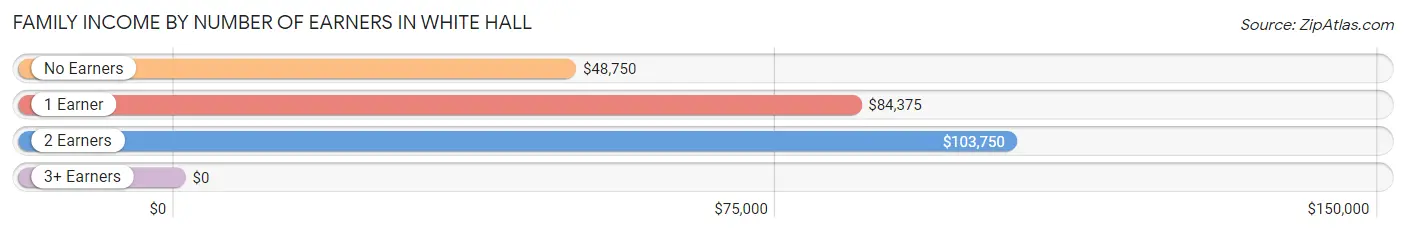
| Number of Earners | # Families | Median Income |
| No Earners | 27 (11.6%) | $48,750 |
| 1 Earner | 72 (31.0%) | $84,375 |
| 2 Earners | 120 (51.7%) | $103,750 |
| 3+ Earners | 13 (5.6%) | $0 |
| Total | 232 (100.0%) | $84,583 |
Household Income in White Hall
Household Income Brackets in White Hall
With 117 households falling in the category, the $50,000 to $74,999 income range is the most frequent in White Hall, accounting for 29.6% of all households. In contrast, only 5 households (1.3%) fall into the $10,000 to $14,999 income bracket, making it the least populous group.
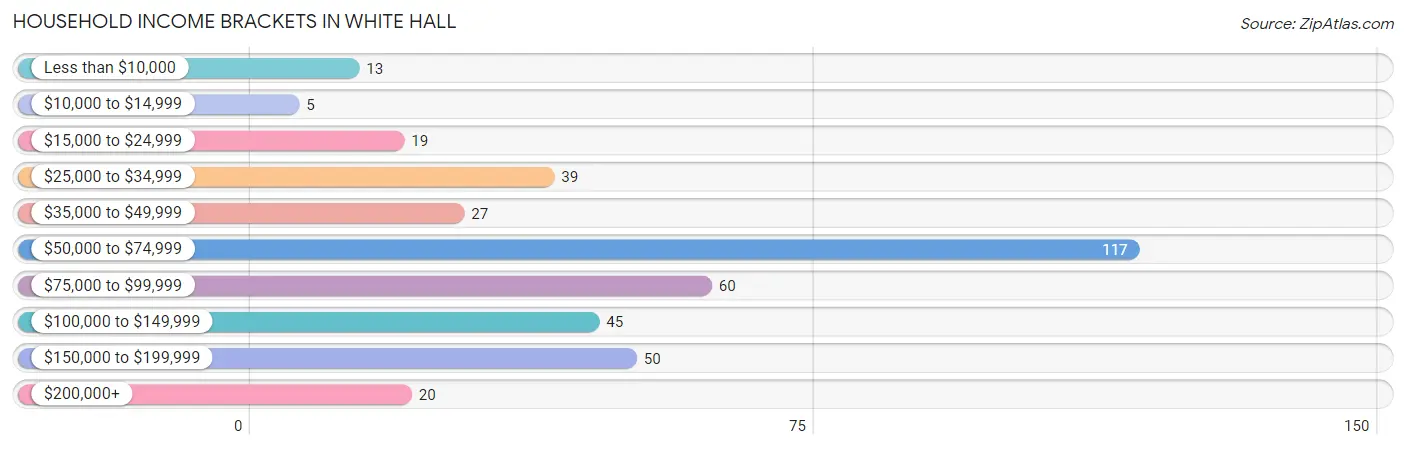
| Income Bracket | # Households | % Households |
| Less than $10,000 | 13 | 3.3% |
| $10,000 to $14,999 | 5 | 1.3% |
| $15,000 to $24,999 | 19 | 4.8% |
| $25,000 to $34,999 | 39 | 9.9% |
| $35,000 to $49,999 | 27 | 6.8% |
| $50,000 to $74,999 | 117 | 29.6% |
| $75,000 to $99,999 | 60 | 15.2% |
| $100,000 to $149,999 | 45 | 11.4% |
| $150,000 to $199,999 | 50 | 12.7% |
| $200,000+ | 20 | 5.1% |
Household Income by Householder Age in White Hall
The median household income in White Hall is $67,679, with the highest median household income of $84,063 found in the 25 to 44 years age bracket for the primary householder. A total of 174 households (44.1%) fall into this category. Meanwhile, the 15 to 24 years age bracket for the primary householder has the lowest median household income of $0, with 42 households (10.6%) in this group.
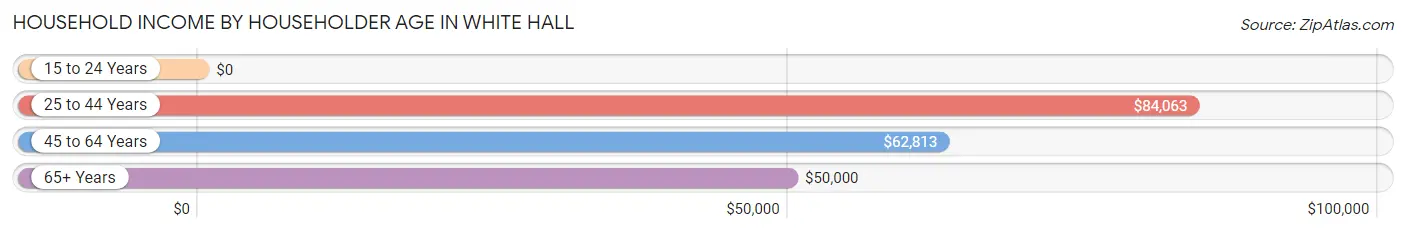
| Income Bracket | # Households | Median Income |
| 15 to 24 Years | 42 (10.6%) | $0 |
| 25 to 44 Years | 174 (44.1%) | $84,063 |
| 45 to 64 Years | 109 (27.6%) | $62,813 |
| 65+ Years | 70 (17.7%) | $50,000 |
| Total | 395 (100.0%) | $67,679 |
Poverty in White Hall
Income Below Poverty by Sex and Age in White Hall
With 3.6% poverty level for males and 9.9% for females among the residents of White Hall, 45 to 54 year old males and 12 to 14 year old females are the most vulnerable to poverty, with 9 males (13.9%) and 8 females (66.7%) in their respective age groups living below the poverty level.
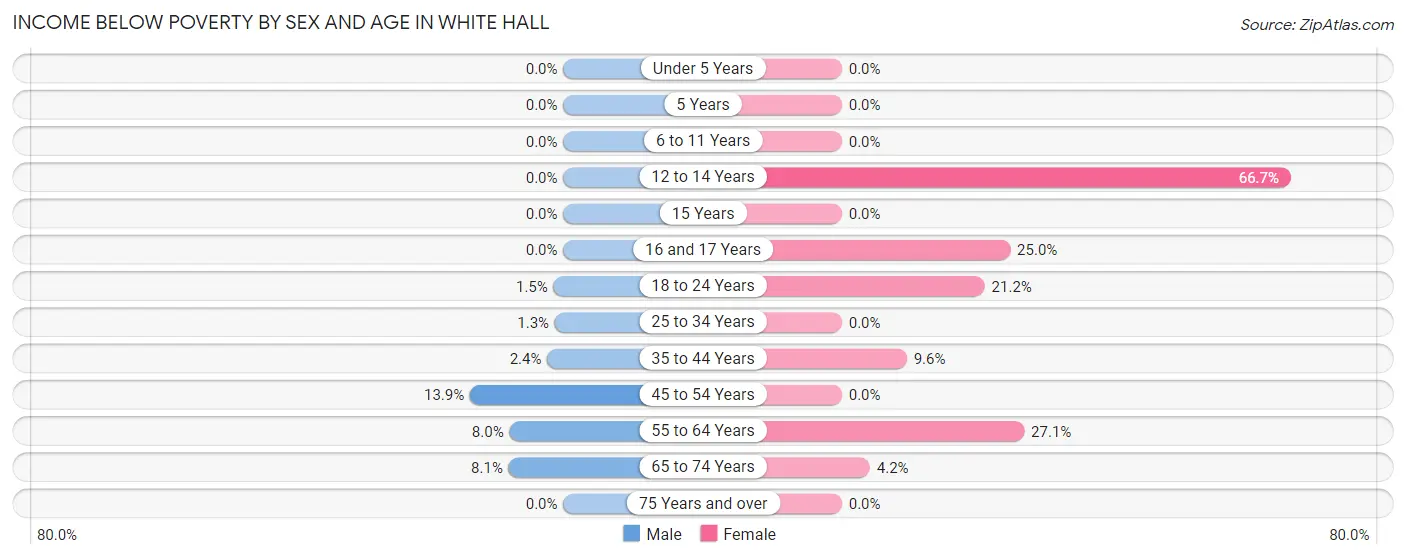
| Age Bracket | Male | Female |
| Under 5 Years | 0 (0.0%) | 0 (0.0%) |
| 5 Years | 0 (0.0%) | 0 (0.0%) |
| 6 to 11 Years | 0 (0.0%) | 0 (0.0%) |
| 12 to 14 Years | 0 (0.0%) | 8 (66.7%) |
| 15 Years | 0 (0.0%) | 0 (0.0%) |
| 16 and 17 Years | 0 (0.0%) | 8 (25.0%) |
| 18 to 24 Years | 1 (1.5%) | 7 (21.2%) |
| 25 to 34 Years | 1 (1.3%) | 0 (0.0%) |
| 35 to 44 Years | 2 (2.4%) | 8 (9.6%) |
| 45 to 54 Years | 9 (13.9%) | 0 (0.0%) |
| 55 to 64 Years | 4 (8.0%) | 13 (27.1%) |
| 65 to 74 Years | 3 (8.1%) | 2 (4.2%) |
| 75 Years and over | 0 (0.0%) | 0 (0.0%) |
| Total | 20 (3.6%) | 46 (9.9%) |
Income Above Poverty by Sex and Age in White Hall
According to the poverty statistics in White Hall, males aged under 5 years and females aged under 5 years are the age groups that are most secure financially, with 100.0% of males and 100.0% of females in these age groups living above the poverty line.
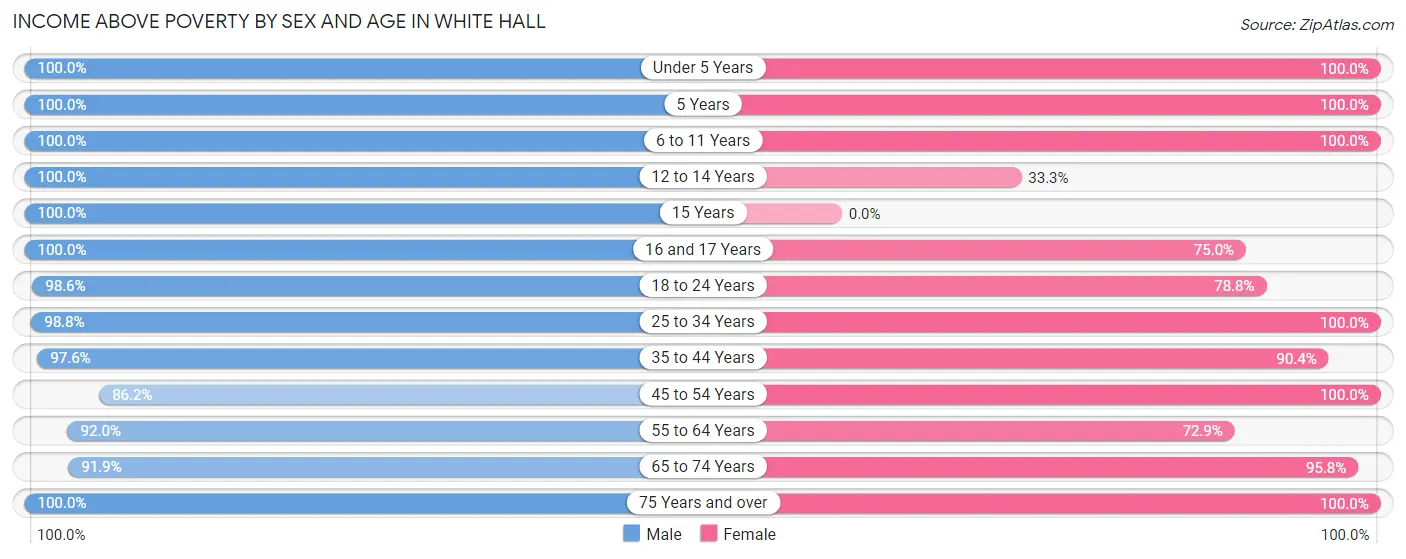
| Age Bracket | Male | Female |
| Under 5 Years | 29 (100.0%) | 36 (100.0%) |
| 5 Years | 12 (100.0%) | 8 (100.0%) |
| 6 to 11 Years | 33 (100.0%) | 31 (100.0%) |
| 12 to 14 Years | 60 (100.0%) | 4 (33.3%) |
| 15 Years | 22 (100.0%) | 0 (0.0%) |
| 16 and 17 Years | 4 (100.0%) | 24 (75.0%) |
| 18 to 24 Years | 68 (98.6%) | 26 (78.8%) |
| 25 to 34 Years | 79 (98.8%) | 47 (100.0%) |
| 35 to 44 Years | 82 (97.6%) | 75 (90.4%) |
| 45 to 54 Years | 56 (86.2%) | 54 (100.0%) |
| 55 to 64 Years | 46 (92.0%) | 35 (72.9%) |
| 65 to 74 Years | 34 (91.9%) | 46 (95.8%) |
| 75 Years and over | 17 (100.0%) | 31 (100.0%) |
| Total | 542 (96.4%) | 417 (90.1%) |
Income Below Poverty Among Married-Couple Families in White Hall
The poverty statistics for married-couple families in White Hall show that 2.4% or 4 of the total 170 families live below the poverty line. Families with no children have the highest poverty rate of 5.3%, comprising of 4 families. On the other hand, families with 1 or 2 children have the lowest poverty rate of 0.0%, which includes 0 families.
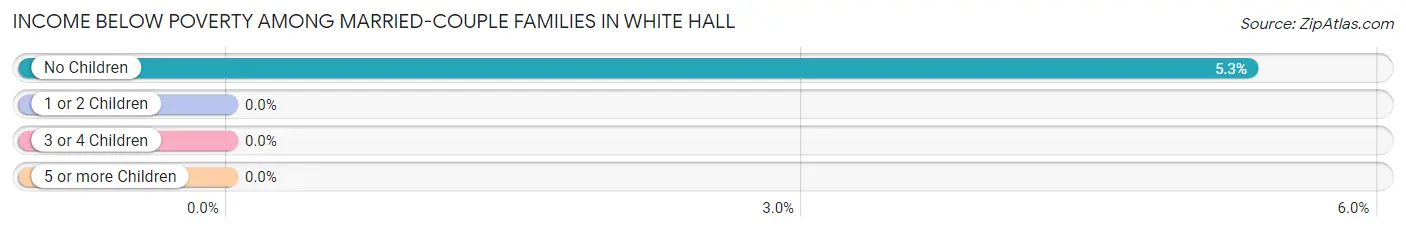
| Children | Above Poverty | Below Poverty |
| No Children | 71 (94.7%) | 4 (5.3%) |
| 1 or 2 Children | 75 (100.0%) | 0 (0.0%) |
| 3 or 4 Children | 20 (100.0%) | 0 (0.0%) |
| 5 or more Children | 0 (0.0%) | 0 (0.0%) |
| Total | 166 (97.7%) | 4 (2.4%) |
Income Below Poverty Among Single-Parent Households in White Hall
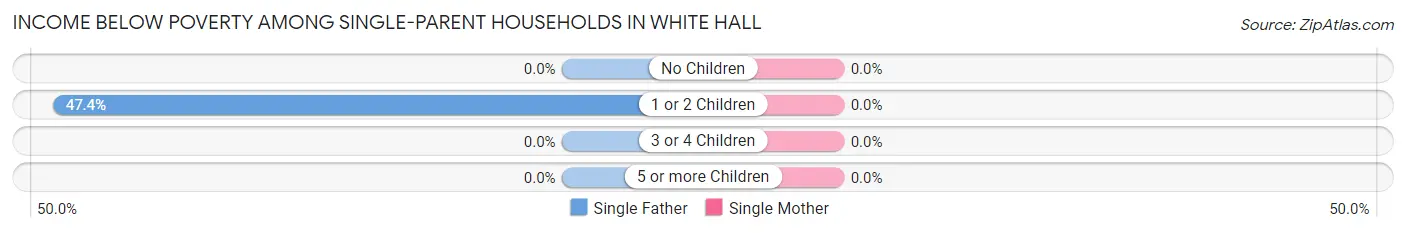
| Children | Single Father | Single Mother |
| No Children | 0 (0.0%) | 0 (0.0%) |
| 1 or 2 Children | 9 (47.4%) | 0 (0.0%) |
| 3 or 4 Children | 0 (0.0%) | 0 (0.0%) |
| 5 or more Children | 0 (0.0%) | 0 (0.0%) |
| Total | 9 (42.9%) | 0 (0.0%) |
Income Below Poverty Among Married-Couple vs Single-Parent Households in White Hall
The poverty data for White Hall shows that 4 of the married-couple family households (2.4%) and 9 of the single-parent households (14.5%) are living below the poverty level. Within the married-couple family households, those with no children have the highest poverty rate, with 4 households (5.3%) falling below the poverty line. Among the single-parent households, those with 1 or 2 children have the highest poverty rate, with 9 household (17.0%) living below poverty.
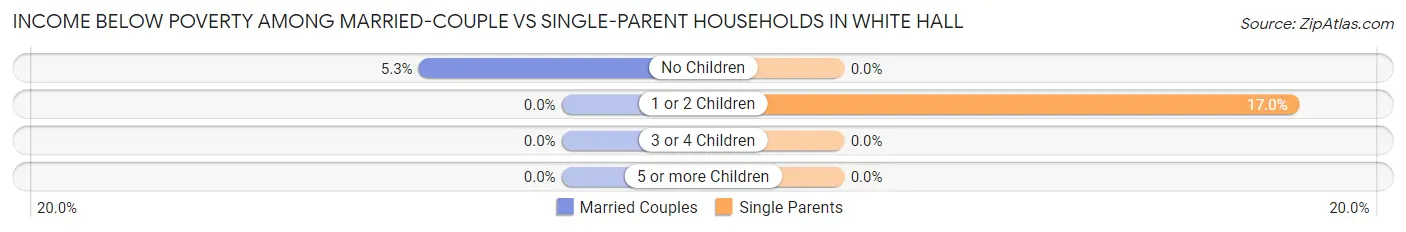
| Children | Married-Couple Families | Single-Parent Households |
| No Children | 4 (5.3%) | 0 (0.0%) |
| 1 or 2 Children | 0 (0.0%) | 9 (17.0%) |
| 3 or 4 Children | 0 (0.0%) | 0 (0.0%) |
| 5 or more Children | 0 (0.0%) | 0 (0.0%) |
| Total | 4 (2.4%) | 9 (14.5%) |
Race in White Hall
The most populous races in White Hall are White / Caucasian (857 | 83.6%), Asian (100 | 9.8%), and Black / African American (35 | 3.4%).
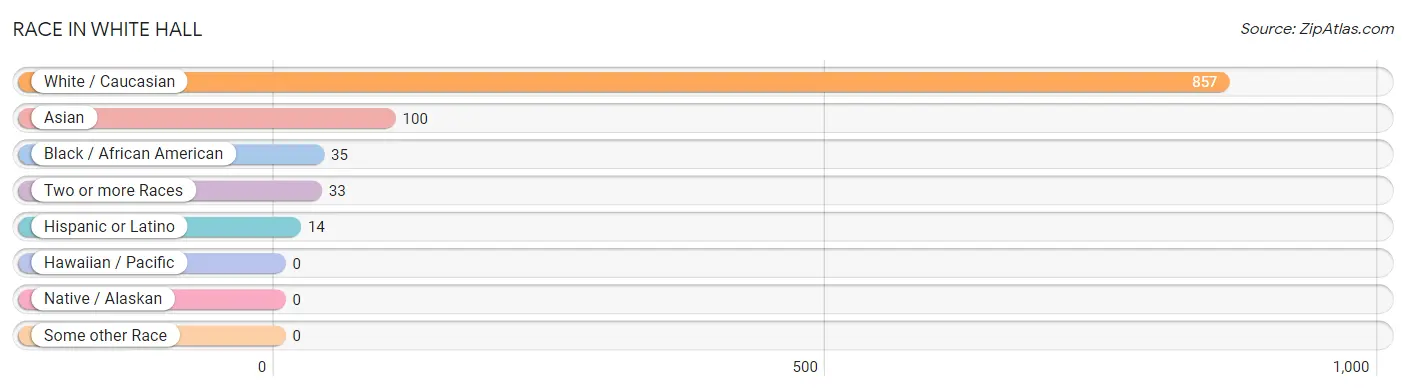
| Race | # Population | % Population |
| Asian | 100 | 9.8% |
| Black / African American | 35 | 3.4% |
| Hawaiian / Pacific | 0 | 0.0% |
| Hispanic or Latino | 14 | 1.4% |
| Native / Alaskan | 0 | 0.0% |
| White / Caucasian | 857 | 83.6% |
| Two or more Races | 33 | 3.2% |
| Some other Race | 0 | 0.0% |
| Total | 1,025 | 100.0% |
Ancestry in White Hall
The most populous ancestries reported in White Hall are Irish (200 | 19.5%), German (158 | 15.4%), English (106 | 10.3%), Italian (76 | 7.4%), and Indian (Asian) (62 | 6.0%), together accounting for 58.7% of all White Hall residents.
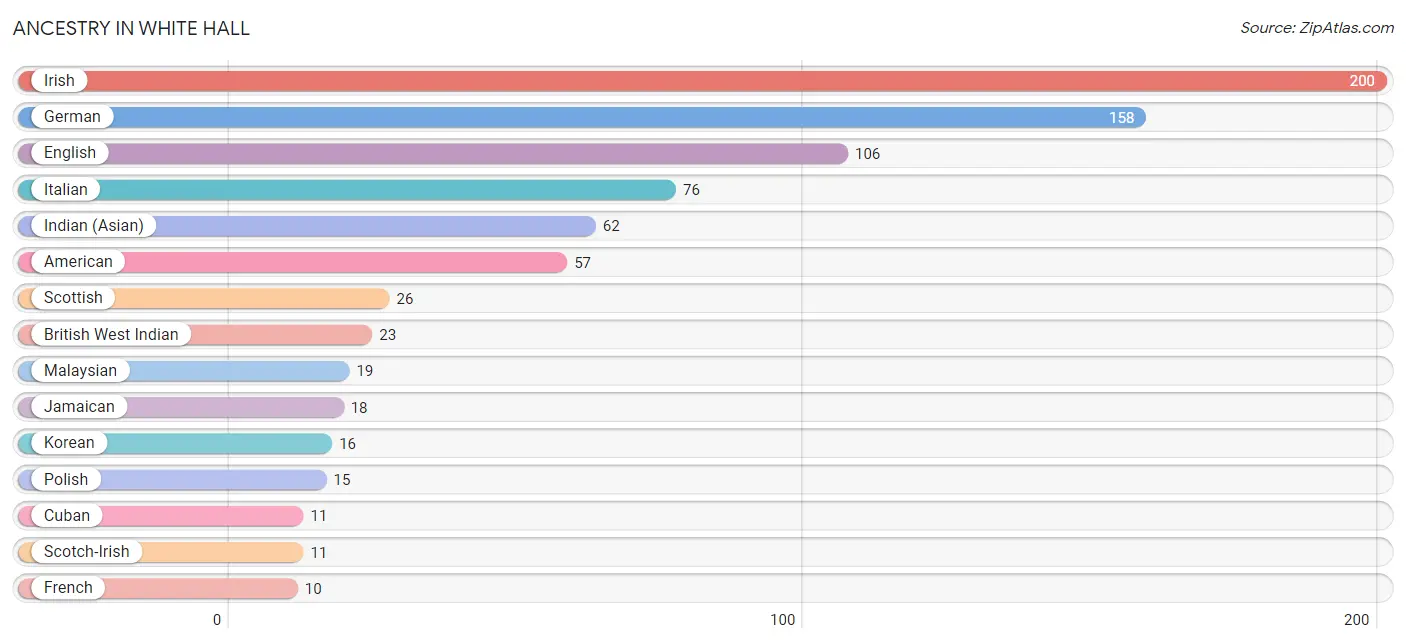
| Ancestry | # Population | % Population |
| American | 57 | 5.6% |
| British | 5 | 0.5% |
| British West Indian | 23 | 2.2% |
| Cuban | 11 | 1.1% |
| Dutch | 8 | 0.8% |
| English | 106 | 10.3% |
| European | 2 | 0.2% |
| French | 10 | 1.0% |
| German | 158 | 15.4% |
| Greek | 2 | 0.2% |
| Hungarian | 6 | 0.6% |
| Indian (Asian) | 62 | 6.0% |
| Irish | 200 | 19.5% |
| Italian | 76 | 7.4% |
| Jamaican | 18 | 1.8% |
| Korean | 16 | 1.6% |
| Malaysian | 19 | 1.8% |
| Norwegian | 2 | 0.2% |
| Pakistani | 1 | 0.1% |
| Polish | 15 | 1.5% |
| Scotch-Irish | 11 | 1.1% |
| Scottish | 26 | 2.5% |
| Spanish | 3 | 0.3% |
| Thai | 5 | 0.5% |
| Welsh | 5 | 0.5% | View All 25 Rows |
Immigrants in White Hall
The most numerous immigrant groups reported in White Hall came from Asia (14 | 1.4%), South Eastern Asia (14 | 1.4%), Philippines (13 | 1.3%), Caribbean (11 | 1.1%), and Latin America (11 | 1.1%), together accounting for 6.1% of all White Hall residents.
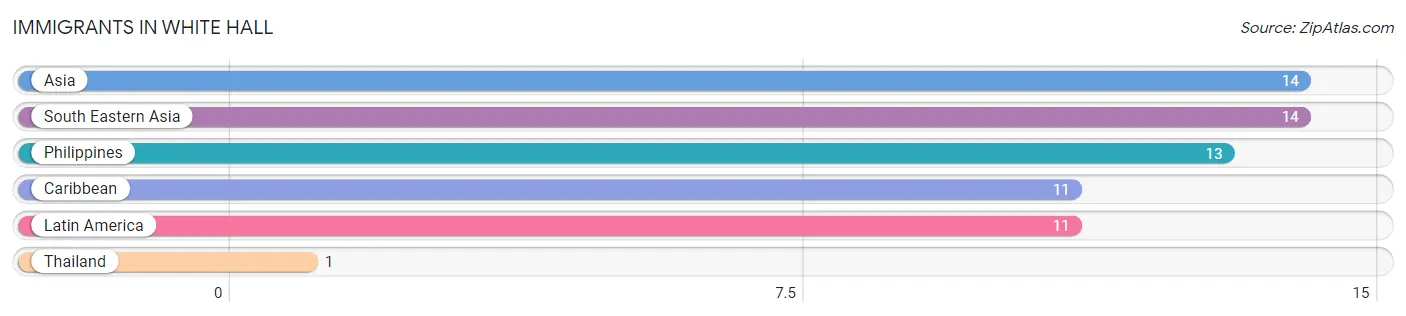
| Immigration Origin | # Population | % Population |
| Asia | 14 | 1.4% |
| Caribbean | 11 | 1.1% |
| Latin America | 11 | 1.1% |
| Philippines | 13 | 1.3% |
| South Eastern Asia | 14 | 1.4% |
| Thailand | 1 | 0.1% | View All 6 Rows |
Sex and Age in White Hall
Sex and Age in White Hall
The most populous age groups in White Hall are 10 to 14 Years (76 | 13.5%) for men and 35 to 39 Years (68 | 14.7%) for women.
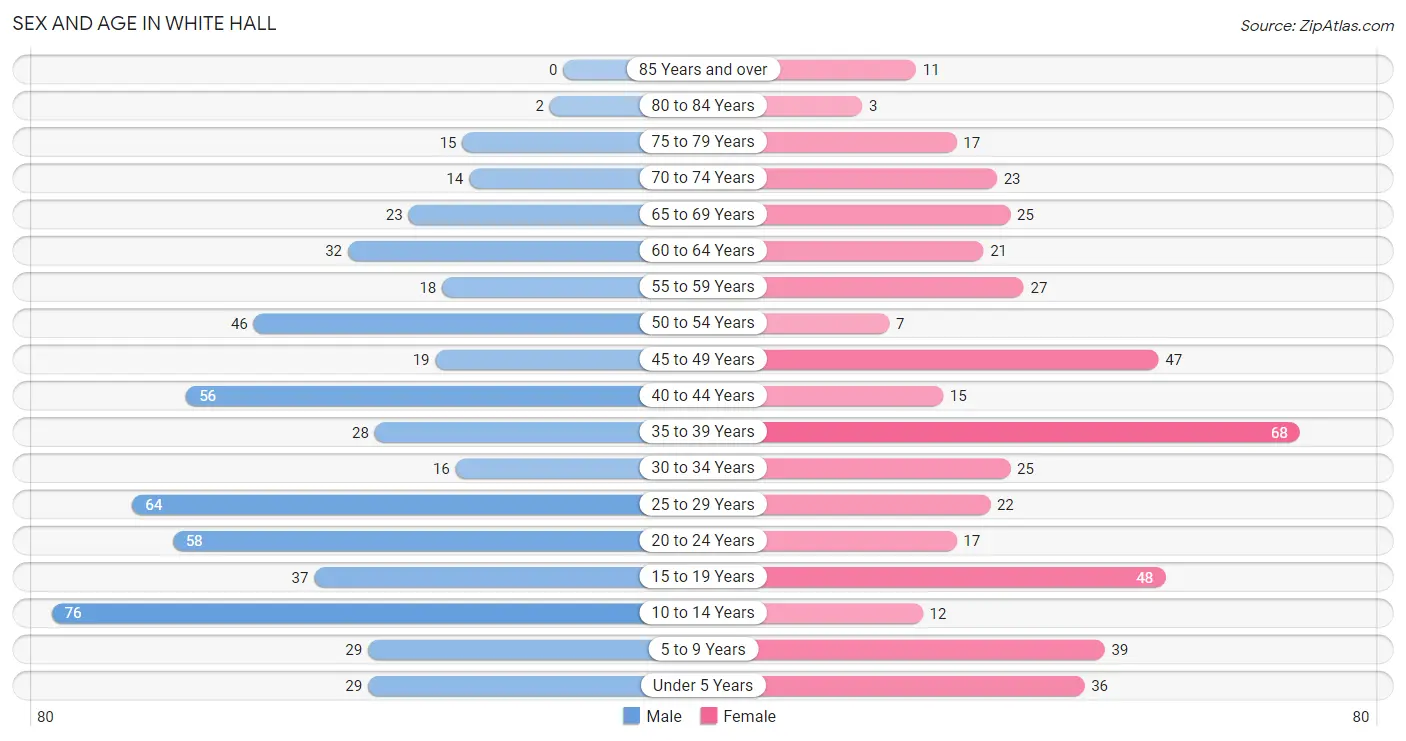
| Age Bracket | Male | Female |
| Under 5 Years | 29 (5.2%) | 36 (7.8%) |
| 5 to 9 Years | 29 (5.2%) | 39 (8.4%) |
| 10 to 14 Years | 76 (13.5%) | 12 (2.6%) |
| 15 to 19 Years | 37 (6.6%) | 48 (10.4%) |
| 20 to 24 Years | 58 (10.3%) | 17 (3.7%) |
| 25 to 29 Years | 64 (11.4%) | 22 (4.8%) |
| 30 to 34 Years | 16 (2.9%) | 25 (5.4%) |
| 35 to 39 Years | 28 (5.0%) | 68 (14.7%) |
| 40 to 44 Years | 56 (10.0%) | 15 (3.2%) |
| 45 to 49 Years | 19 (3.4%) | 47 (10.2%) |
| 50 to 54 Years | 46 (8.2%) | 7 (1.5%) |
| 55 to 59 Years | 18 (3.2%) | 27 (5.8%) |
| 60 to 64 Years | 32 (5.7%) | 21 (4.5%) |
| 65 to 69 Years | 23 (4.1%) | 25 (5.4%) |
| 70 to 74 Years | 14 (2.5%) | 23 (5.0%) |
| 75 to 79 Years | 15 (2.7%) | 17 (3.7%) |
| 80 to 84 Years | 2 (0.4%) | 3 (0.6%) |
| 85 Years and over | 0 (0.0%) | 11 (2.4%) |
| Total | 562 (100.0%) | 463 (100.0%) |
Families and Households in White Hall
Median Family Size in White Hall
The median family size in White Hall is 3.41 persons per family, with single male/father families (21 | 9.0%) accounting for the largest median family size of 5.9 persons per family. On the other hand, single female/mother families (41 | 17.7%) represent the smallest median family size with 2.73 persons per family.
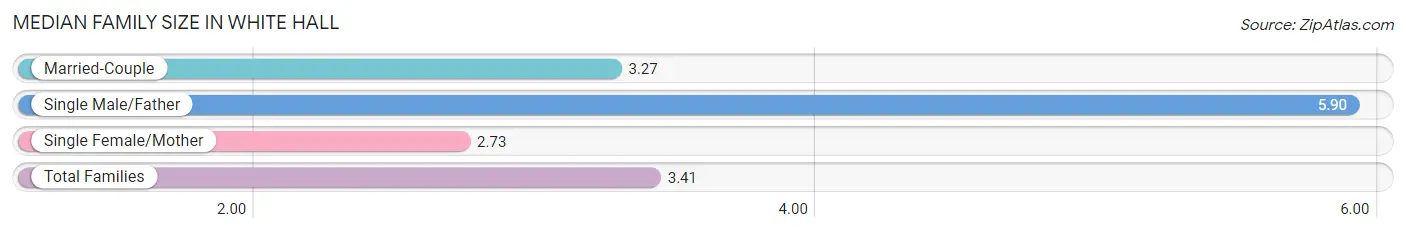
| Family Type | # Families | Family Size |
| Married-Couple | 170 (73.3%) | 3.27 |
| Single Male/Father | 21 (9.0%) | 5.90 |
| Single Female/Mother | 41 (17.7%) | 2.73 |
| Total Families | 232 (100.0%) | 3.41 |
Median Household Size in White Hall
The median household size in White Hall is 2.59 persons per household, with single male/father households (21 | 5.3%) accounting for the largest median household size of 5.95 persons per household. non-family households (163 | 41.3%) represent the smallest median household size with 1.42 persons per household.
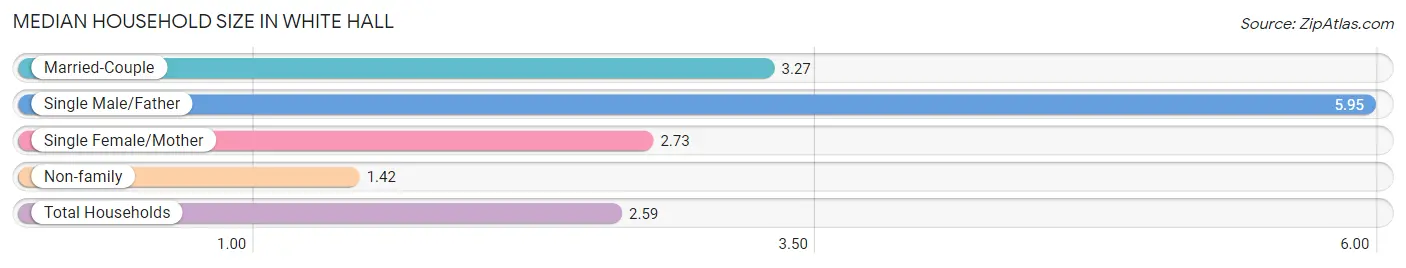
| Household Type | # Households | Household Size |
| Married-Couple | 170 (43.0%) | 3.27 |
| Single Male/Father | 21 (5.3%) | 5.95 |
| Single Female/Mother | 41 (10.4%) | 2.73 |
| Non-family | 163 (41.3%) | 1.42 |
| Total Households | 395 (100.0%) | 2.59 |
Household Size by Marriage Status in White Hall
Out of a total of 395 households in White Hall, 232 (58.7%) are family households, while 163 (41.3%) are nonfamily households. The most numerous type of family households are 3-person households, comprising 84, and the most common type of nonfamily households are 1-person households, comprising 113.
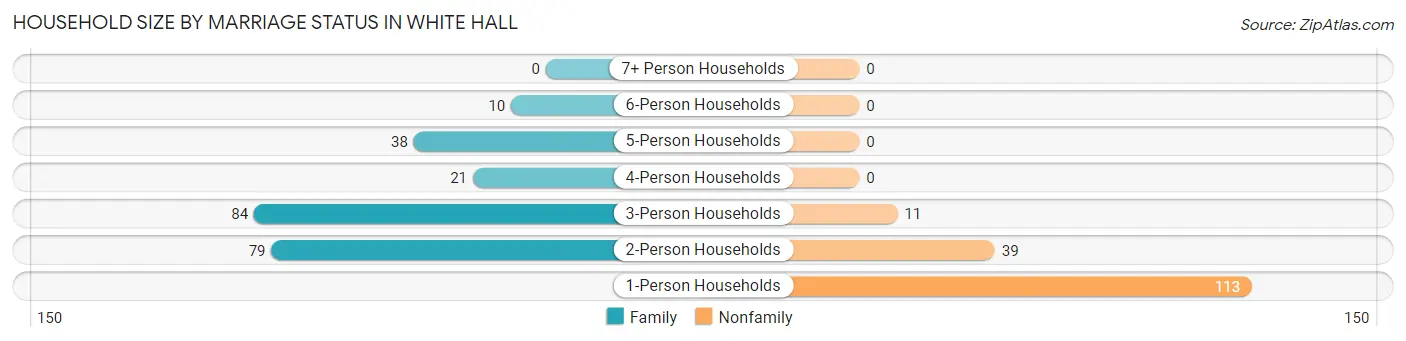
| Household Size | Family Households | Nonfamily Households |
| 1-Person Households | - | 113 (28.6%) |
| 2-Person Households | 79 (20.0%) | 39 (9.9%) |
| 3-Person Households | 84 (21.3%) | 11 (2.8%) |
| 4-Person Households | 21 (5.3%) | 0 (0.0%) |
| 5-Person Households | 38 (9.6%) | 0 (0.0%) |
| 6-Person Households | 10 (2.5%) | 0 (0.0%) |
| 7+ Person Households | 0 (0.0%) | 0 (0.0%) |
| Total | 232 (58.7%) | 163 (41.3%) |
Female Fertility in White Hall
Fertility by Age in White Hall
Average fertility rate in White Hall is 124.0 births per 1,000 women. Women in the age bracket of 15 to 19 years have the highest fertility rate with 333.0 births per 1,000 women. Women in the age bracket of 15 to 19 years acount for 53.3% of all women with births.
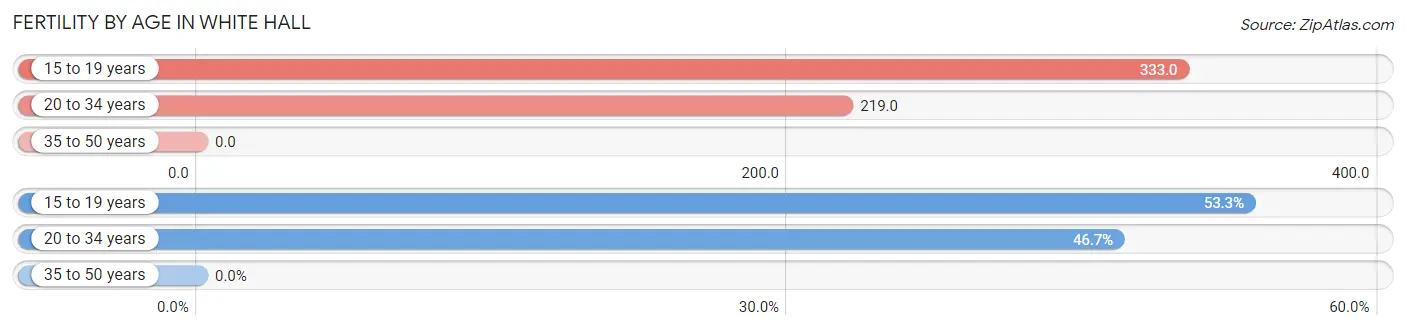
| Age Bracket | Women with Births | Births / 1,000 Women |
| 15 to 19 years | 16 (53.3%) | 333.0 |
| 20 to 34 years | 14 (46.7%) | 219.0 |
| 35 to 50 years | 0 (0.0%) | 0.0 |
| Total | 30 (100.0%) | 124.0 |
Fertility by Age by Marriage Status in White Hall
46.7% of women with births (30) in White Hall are married. The highest percentage of unmarried women with births falls into 15 to 19 years age bracket with 100.0% of them unmarried at the time of birth, while the lowest percentage of unmarried women with births belong to 20 to 34 years age bracket with 0.0% of them unmarried.
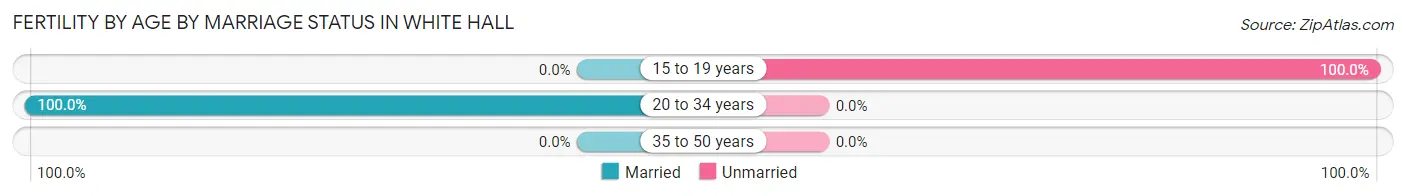
| Age Bracket | Married | Unmarried |
| 15 to 19 years | 0 (0.0%) | 16 (100.0%) |
| 20 to 34 years | 14 (100.0%) | 0 (0.0%) |
| 35 to 50 years | 0 (0.0%) | 0 (0.0%) |
| Total | 14 (46.7%) | 16 (53.3%) |
Fertility by Education in White Hall
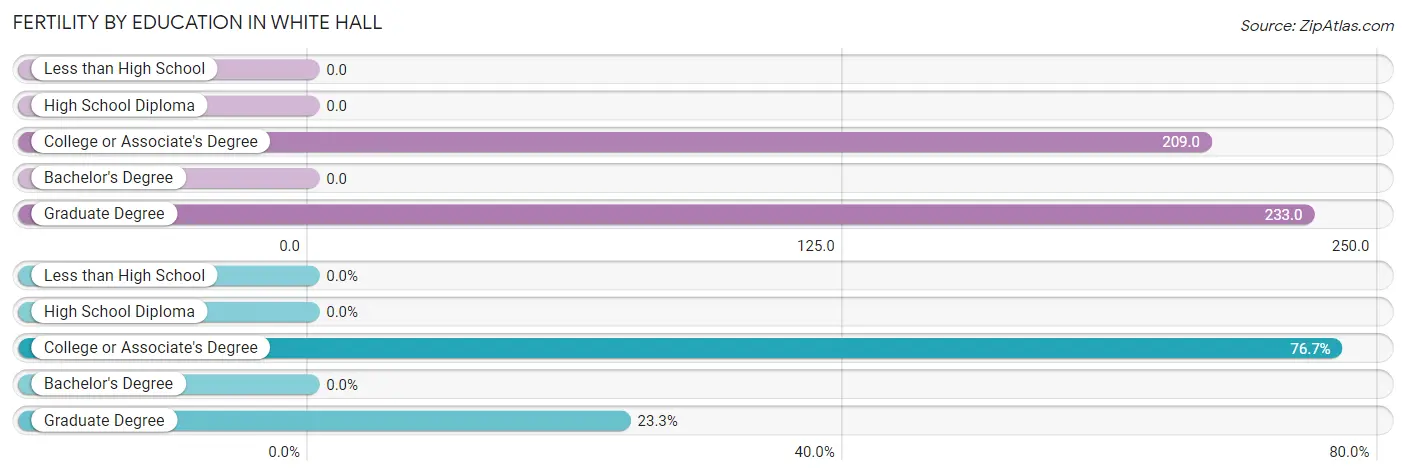
| Educational Attainment | Women with Births | Births / 1,000 Women |
| Less than High School | 0 (0.0%) | 0.0 |
| High School Diploma | 0 (0.0%) | 0.0 |
| College or Associate's Degree | 23 (76.7%) | 209.0 |
| Bachelor's Degree | 0 (0.0%) | 0.0 |
| Graduate Degree | 7 (23.3%) | 233.0 |
| Total | 30 (100.0%) | 124.0 |
Fertility by Education by Marriage Status in White Hall
53.3% of women with births in White Hall are unmarried. Women with the educational attainment of graduate degree are most likely to be married with 100.0% of them married at childbirth, while women with the educational attainment of college or associate's degree are least likely to be married with 69.6% of them unmarried at childbirth.
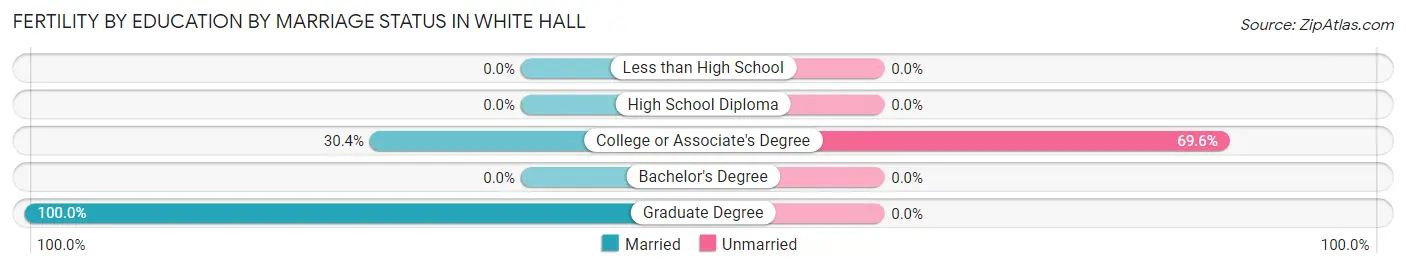
| Educational Attainment | Married | Unmarried |
| Less than High School | 0 (0.0%) | 0 (0.0%) |
| High School Diploma | 0 (0.0%) | 0 (0.0%) |
| College or Associate's Degree | 7 (30.4%) | 16 (69.6%) |
| Bachelor's Degree | 0 (0.0%) | 0 (0.0%) |
| Graduate Degree | 7 (100.0%) | 0 (0.0%) |
| Total | 14 (46.7%) | 16 (53.3%) |
Employment Characteristics in White Hall
Employment by Class of Employer in White Hall
Among the 509 employed individuals in White Hall, private company employees (329 | 64.6%), not-for-profit organizations (53 | 10.4%), and state government employees (40 | 7.9%) make up the most common classes of employment.
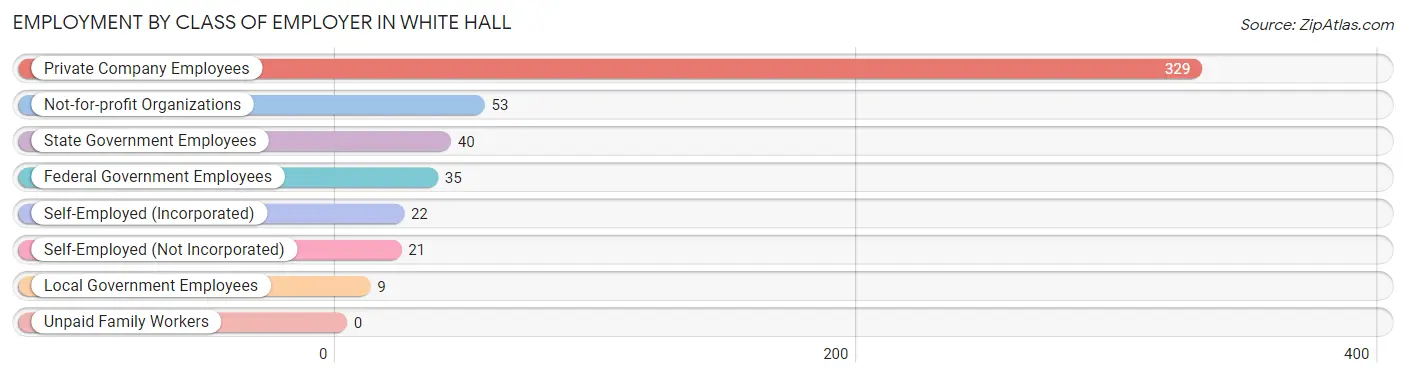
| Employer Class | # Employees | % Employees |
| Private Company Employees | 329 | 64.6% |
| Self-Employed (Incorporated) | 22 | 4.3% |
| Self-Employed (Not Incorporated) | 21 | 4.1% |
| Not-for-profit Organizations | 53 | 10.4% |
| Local Government Employees | 9 | 1.8% |
| State Government Employees | 40 | 7.9% |
| Federal Government Employees | 35 | 6.9% |
| Unpaid Family Workers | 0 | 0.0% |
| Total | 509 | 100.0% |
Employment Status by Age in White Hall
According to the labor force statistics for White Hall, out of the total population over 16 years of age (782), 69.9% or 547 individuals are in the labor force, with 5.0% or 27 of them unemployed. The age group with the highest labor force participation rate is 20 to 24 years, with 98.7% or 74 individuals in the labor force. Within the labor force, the 25 to 29 years age range has the highest percentage of unemployed individuals, with 25.6% or 21 of them being unemployed.
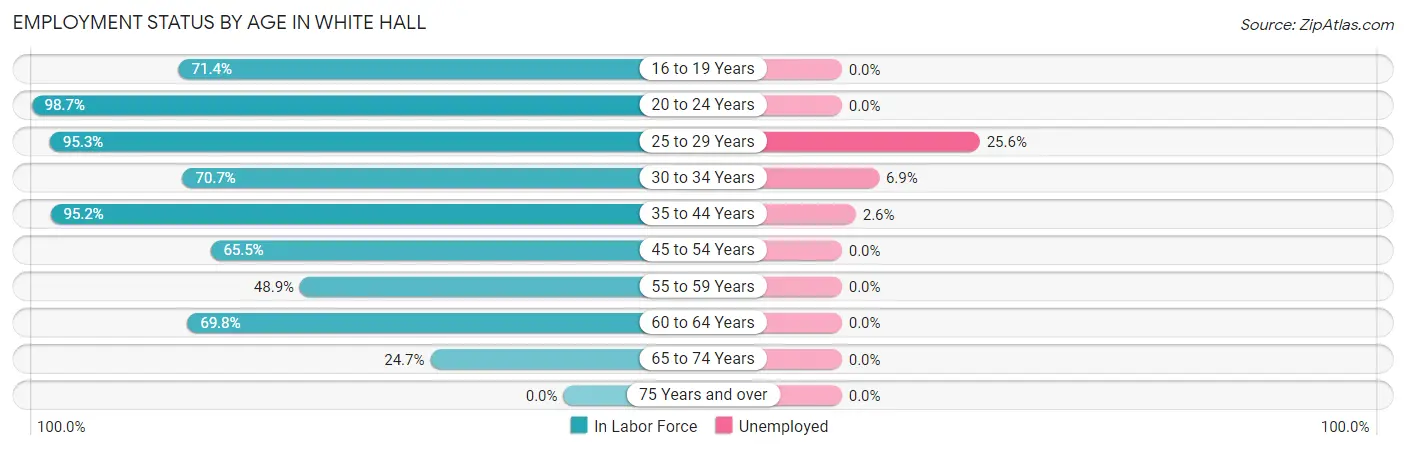
| Age Bracket | In Labor Force | Unemployed |
| 16 to 19 Years | 45 (71.4%) | 0 (0.0%) |
| 20 to 24 Years | 74 (98.7%) | 0 (0.0%) |
| 25 to 29 Years | 82 (95.3%) | 21 (25.6%) |
| 30 to 34 Years | 29 (70.7%) | 2 (6.9%) |
| 35 to 44 Years | 159 (95.2%) | 4 (2.6%) |
| 45 to 54 Years | 78 (65.5%) | 0 (0.0%) |
| 55 to 59 Years | 22 (48.9%) | 0 (0.0%) |
| 60 to 64 Years | 37 (69.8%) | 0 (0.0%) |
| 65 to 74 Years | 21 (24.7%) | 0 (0.0%) |
| 75 Years and over | 0 (0.0%) | 0 (0.0%) |
| Total | 547 (69.9%) | 27 (5.0%) |
Employment Status by Educational Attainment in White Hall
According to labor force statistics for White Hall, 79.6% of individuals (407) out of the total population between 25 and 64 years of age (511) are in the labor force, with 6.7% or 27 of them being unemployed. The group with the highest labor force participation rate are those with the educational attainment of bachelor's degree or higher, with 88.8% or 159 individuals in the labor force. Within the labor force, individuals with college / associate degree education have the highest percentage of unemployment, with 15.8% or 23 of them being unemployed.
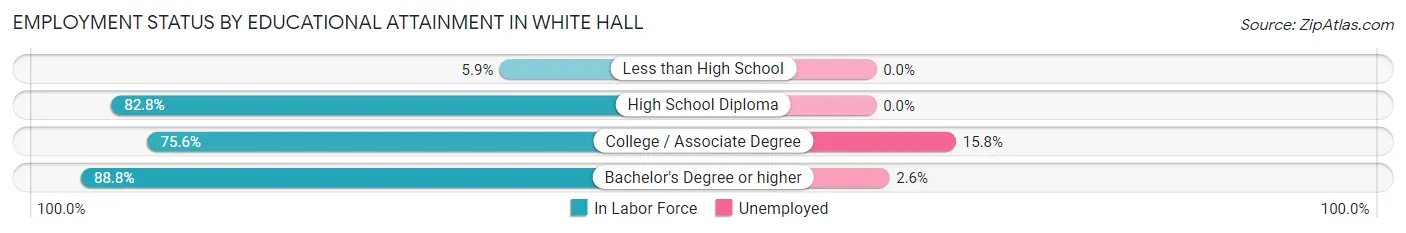
| Educational Attainment | In Labor Force | Unemployed |
| Less than High School | 1 (5.9%) | 0 (0.0%) |
| High School Diploma | 101 (82.8%) | 0 (0.0%) |
| College / Associate Degree | 146 (75.6%) | 30 (15.8%) |
| Bachelor's Degree or higher | 159 (88.8%) | 5 (2.6%) |
| Total | 407 (79.6%) | 34 (6.7%) |
Employment Occupations by Sex in White Hall
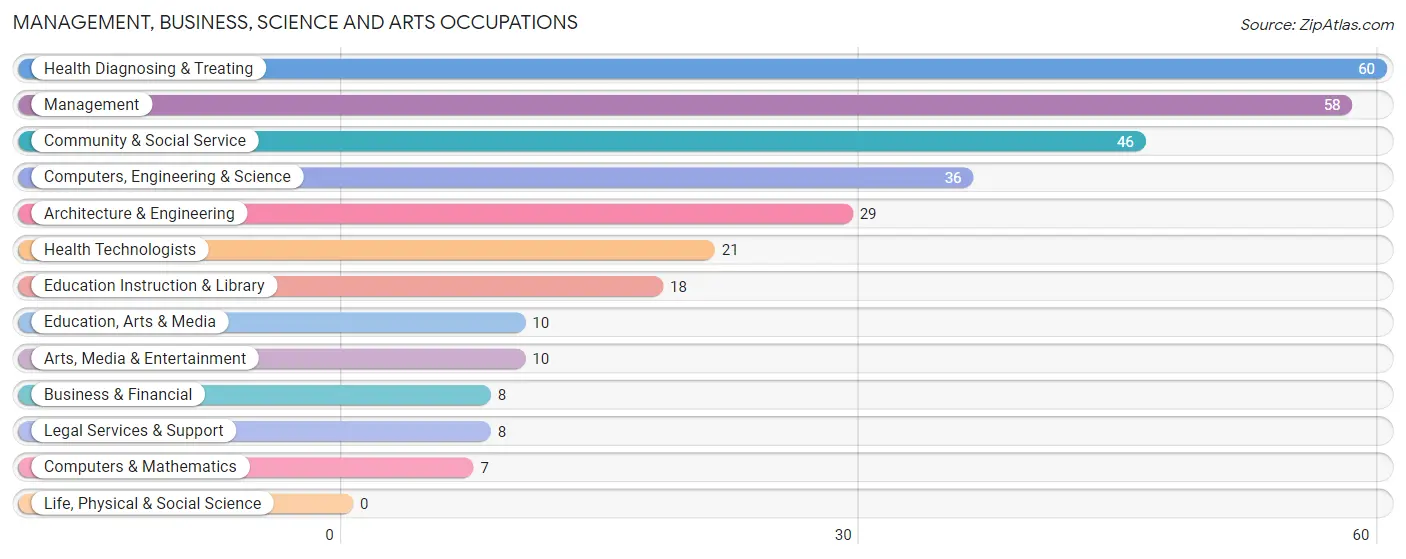
Management, Business, Science and Arts Occupations
The most common Management, Business, Science and Arts occupations in White Hall are Health Diagnosing & Treating (60 | 11.7%), Management (58 | 11.3%), Community & Social Service (46 | 8.9%), Computers, Engineering & Science (36 | 7.0%), and Architecture & Engineering (29 | 5.6%).
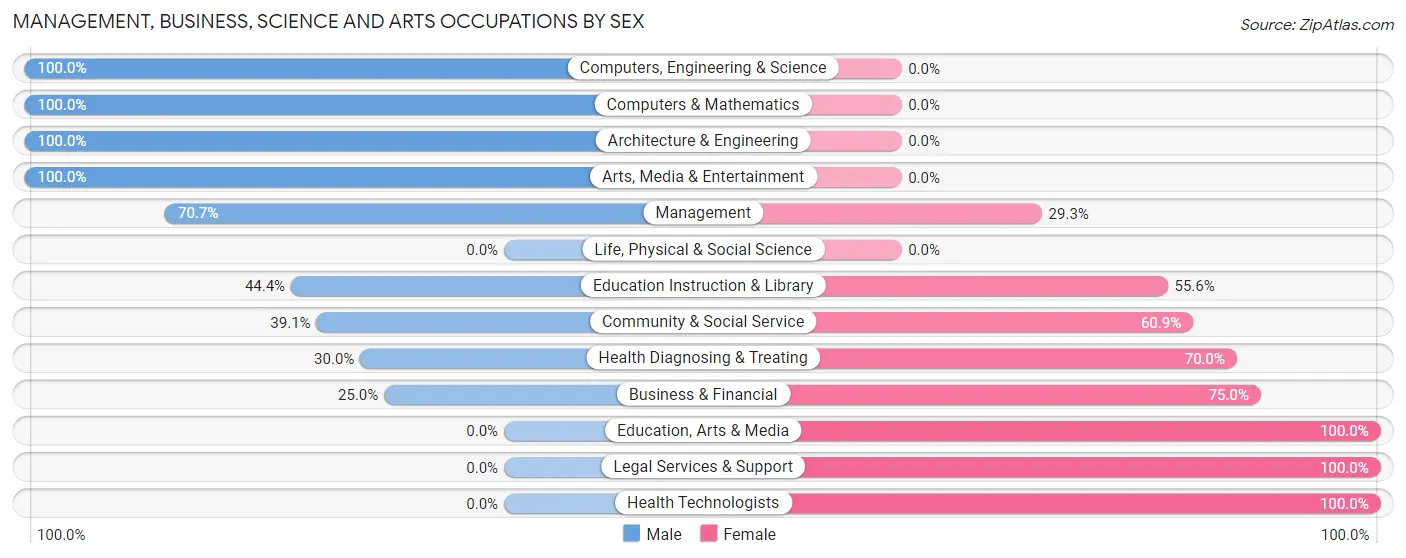
Management, Business, Science and Arts Occupations by Sex
Within the Management, Business, Science and Arts occupations in White Hall, the most male-oriented occupations are Computers, Engineering & Science (100.0%), Computers & Mathematics (100.0%), and Architecture & Engineering (100.0%), while the most female-oriented occupations are Education, Arts & Media (100.0%), Legal Services & Support (100.0%), and Health Technologists (100.0%).
| Occupation | Male | Female |
| Management | 41 (70.7%) | 17 (29.3%) |
| Business & Financial | 2 (25.0%) | 6 (75.0%) |
| Computers, Engineering & Science | 36 (100.0%) | 0 (0.0%) |
| Computers & Mathematics | 7 (100.0%) | 0 (0.0%) |
| Architecture & Engineering | 29 (100.0%) | 0 (0.0%) |
| Life, Physical & Social Science | 0 (0.0%) | 0 (0.0%) |
| Community & Social Service | 18 (39.1%) | 28 (60.9%) |
| Education, Arts & Media | 0 (0.0%) | 10 (100.0%) |
| Legal Services & Support | 0 (0.0%) | 8 (100.0%) |
| Education Instruction & Library | 8 (44.4%) | 10 (55.6%) |
| Arts, Media & Entertainment | 10 (100.0%) | 0 (0.0%) |
| Health Diagnosing & Treating | 18 (30.0%) | 42 (70.0%) |
| Health Technologists | 0 (0.0%) | 21 (100.0%) |
| Total (Category) | 115 (55.3%) | 93 (44.7%) |
| Total (Overall) | 288 (55.9%) | 227 (44.1%) |
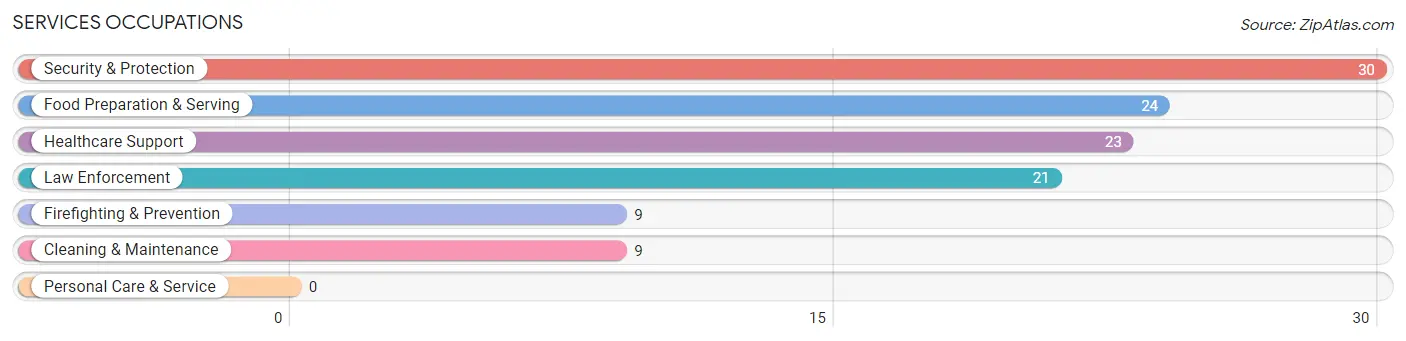
Services Occupations
The most common Services occupations in White Hall are Security & Protection (30 | 5.8%), Food Preparation & Serving (24 | 4.7%), Healthcare Support (23 | 4.5%), Law Enforcement (21 | 4.1%), and Firefighting & Prevention (9 | 1.8%).
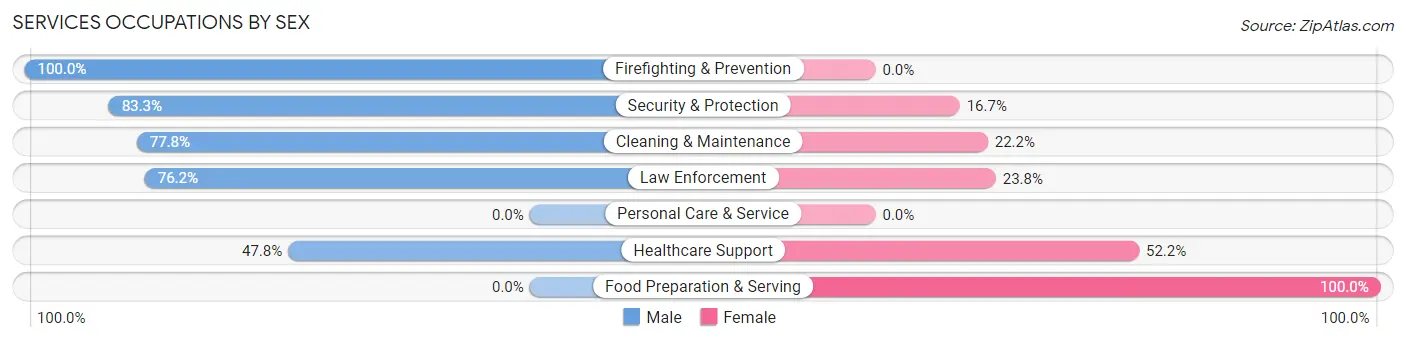
Services Occupations by Sex
Within the Services occupations in White Hall, the most male-oriented occupations are Firefighting & Prevention (100.0%), Security & Protection (83.3%), and Cleaning & Maintenance (77.8%), while the most female-oriented occupations are Food Preparation & Serving (100.0%), Healthcare Support (52.2%), and Law Enforcement (23.8%).
| Occupation | Male | Female |
| Healthcare Support | 11 (47.8%) | 12 (52.2%) |
| Security & Protection | 25 (83.3%) | 5 (16.7%) |
| Firefighting & Prevention | 9 (100.0%) | 0 (0.0%) |
| Law Enforcement | 16 (76.2%) | 5 (23.8%) |
| Food Preparation & Serving | 0 (0.0%) | 24 (100.0%) |
| Cleaning & Maintenance | 7 (77.8%) | 2 (22.2%) |
| Personal Care & Service | 0 (0.0%) | 0 (0.0%) |
| Total (Category) | 43 (50.0%) | 43 (50.0%) |
| Total (Overall) | 288 (55.9%) | 227 (44.1%) |
Sales and Office Occupations
The most common Sales and Office occupations in White Hall are Office & Administration (97 | 18.8%), and Sales & Related (38 | 7.4%).
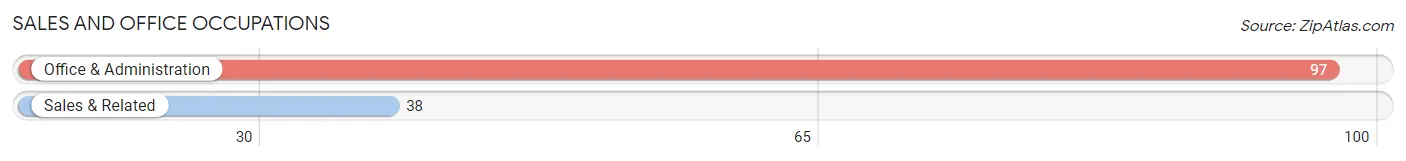
Sales and Office Occupations by Sex
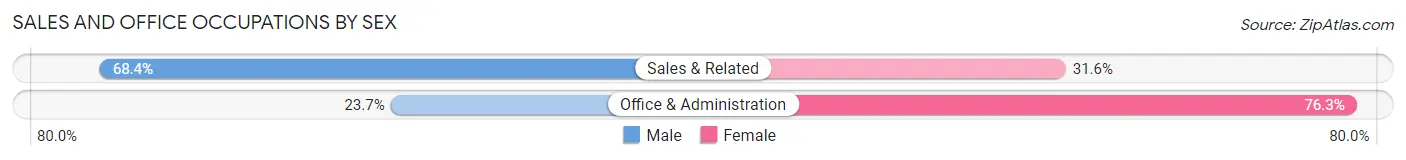
| Occupation | Male | Female |
| Sales & Related | 26 (68.4%) | 12 (31.6%) |
| Office & Administration | 23 (23.7%) | 74 (76.3%) |
| Total (Category) | 49 (36.3%) | 86 (63.7%) |
| Total (Overall) | 288 (55.9%) | 227 (44.1%) |
Natural Resources, Construction and Maintenance Occupations
The most common Natural Resources, Construction and Maintenance occupations in White Hall are Construction & Extraction (12 | 2.3%), and Installation, Maintenance & Repair (12 | 2.3%).
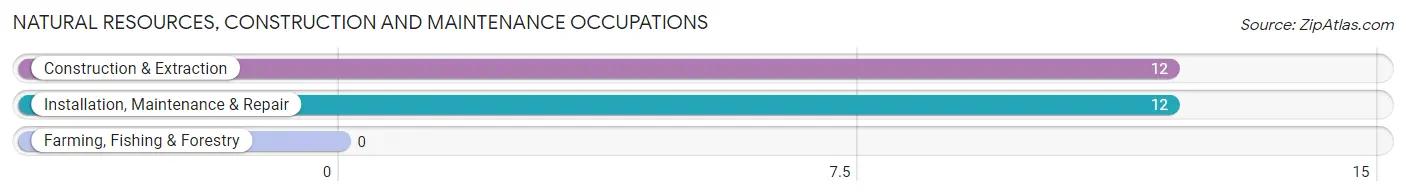
Natural Resources, Construction and Maintenance Occupations by Sex
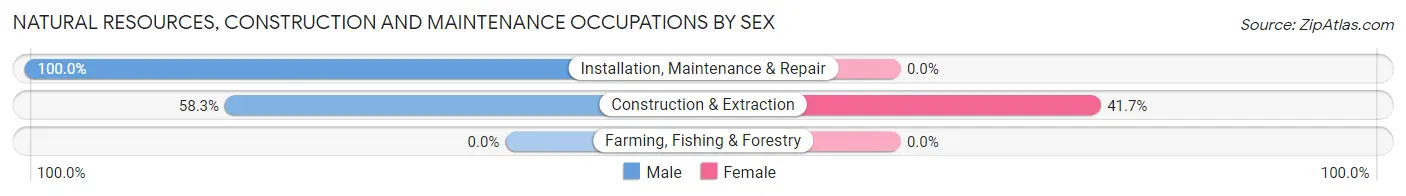
| Occupation | Male | Female |
| Farming, Fishing & Forestry | 0 (0.0%) | 0 (0.0%) |
| Construction & Extraction | 7 (58.3%) | 5 (41.7%) |
| Installation, Maintenance & Repair | 12 (100.0%) | 0 (0.0%) |
| Total (Category) | 19 (79.2%) | 5 (20.8%) |
| Total (Overall) | 288 (55.9%) | 227 (44.1%) |
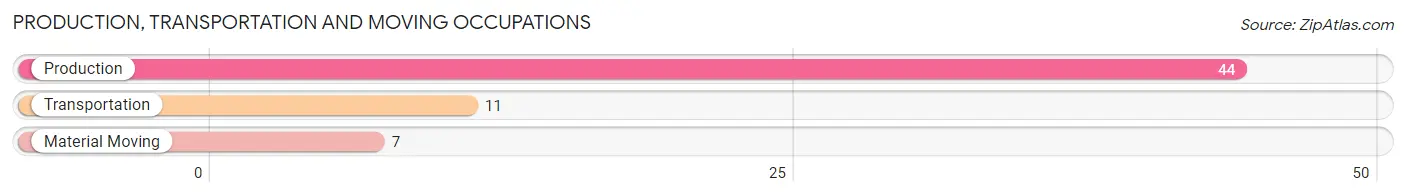
Production, Transportation and Moving Occupations
The most common Production, Transportation and Moving occupations in White Hall are Production (44 | 8.5%), Transportation (11 | 2.1%), and Material Moving (7 | 1.4%).
Production, Transportation and Moving Occupations by Sex
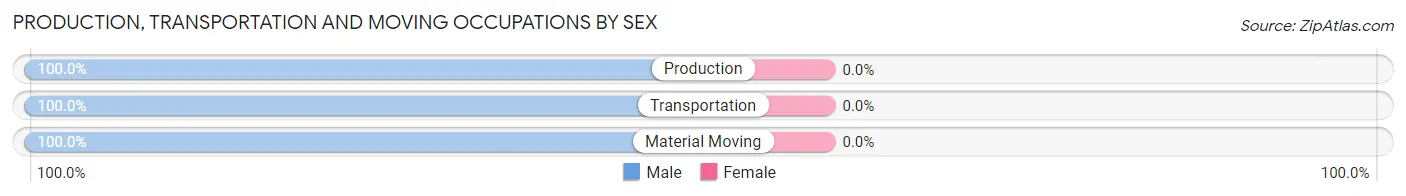
| Occupation | Male | Female |
| Production | 44 (100.0%) | 0 (0.0%) |
| Transportation | 11 (100.0%) | 0 (0.0%) |
| Material Moving | 7 (100.0%) | 0 (0.0%) |
| Total (Category) | 62 (100.0%) | 0 (0.0%) |
| Total (Overall) | 288 (55.9%) | 227 (44.1%) |
Employment Industries by Sex in White Hall
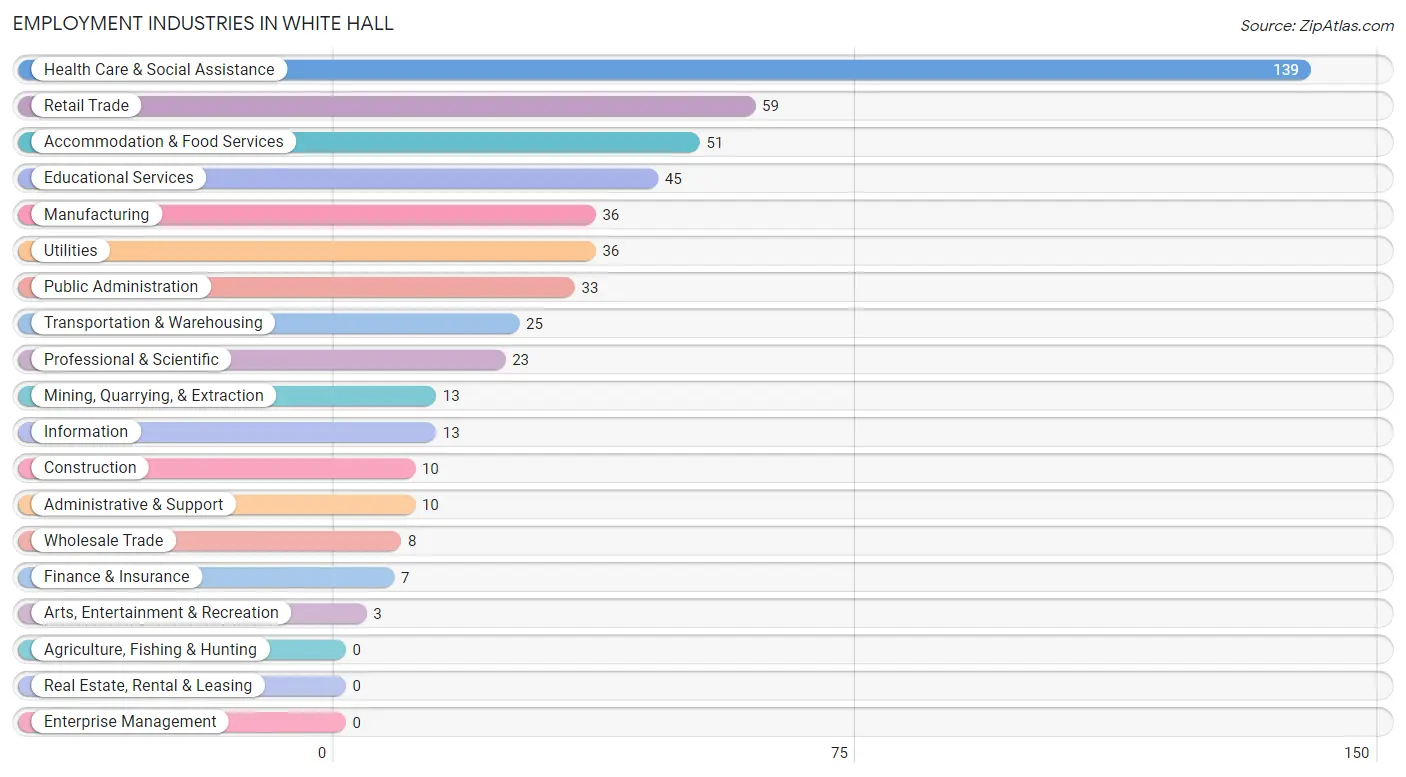
Employment Industries in White Hall
The major employment industries in White Hall include Health Care & Social Assistance (139 | 27.0%), Retail Trade (59 | 11.5%), Accommodation & Food Services (51 | 9.9%), Educational Services (45 | 8.7%), and Manufacturing (36 | 7.0%).
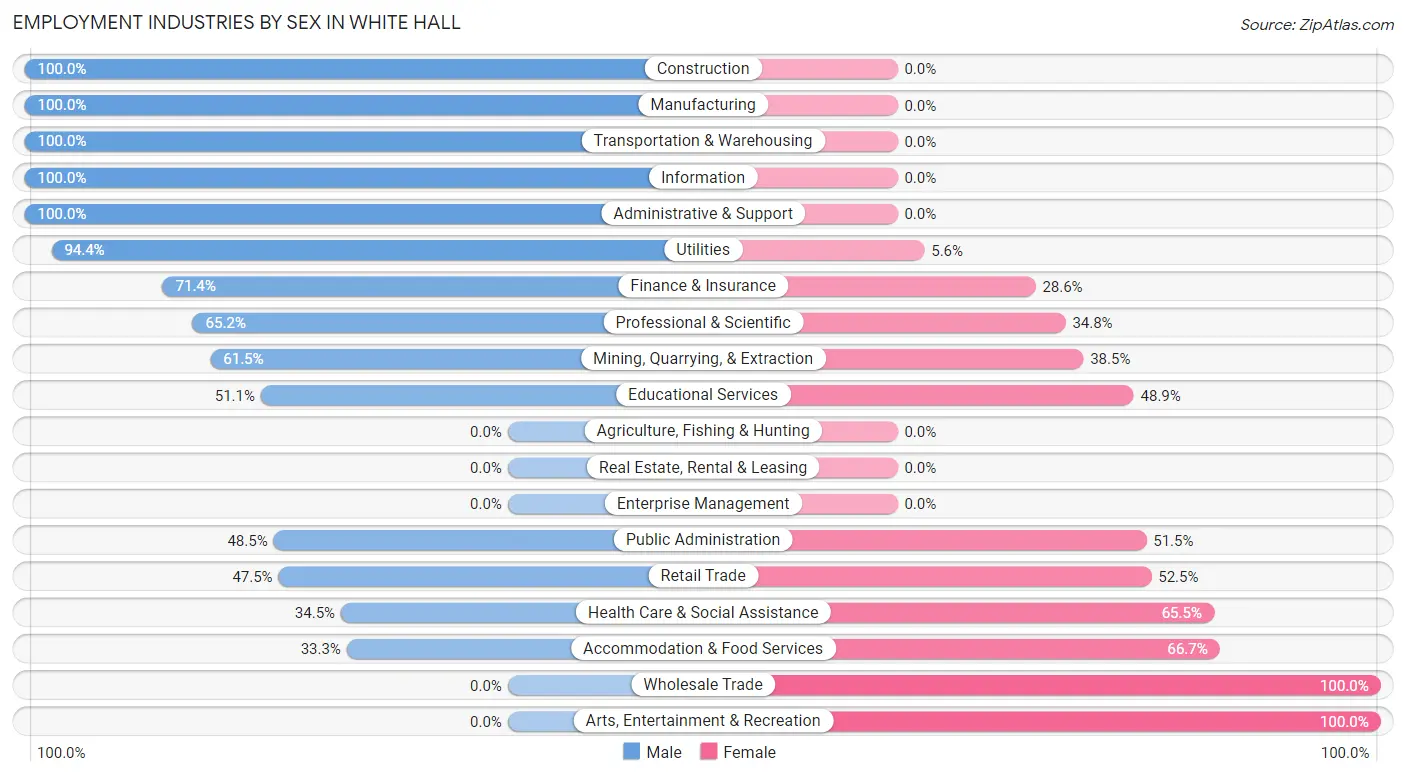
Employment Industries by Sex in White Hall
The White Hall industries that see more men than women are Construction (100.0%), Manufacturing (100.0%), and Transportation & Warehousing (100.0%), whereas the industries that tend to have a higher number of women are Wholesale Trade (100.0%), Arts, Entertainment & Recreation (100.0%), and Accommodation & Food Services (66.7%).
| Industry | Male | Female |
| Agriculture, Fishing & Hunting | 0 (0.0%) | 0 (0.0%) |
| Mining, Quarrying, & Extraction | 8 (61.5%) | 5 (38.5%) |
| Construction | 10 (100.0%) | 0 (0.0%) |
| Manufacturing | 36 (100.0%) | 0 (0.0%) |
| Wholesale Trade | 0 (0.0%) | 8 (100.0%) |
| Retail Trade | 28 (47.5%) | 31 (52.5%) |
| Transportation & Warehousing | 25 (100.0%) | 0 (0.0%) |
| Utilities | 34 (94.4%) | 2 (5.6%) |
| Information | 13 (100.0%) | 0 (0.0%) |
| Finance & Insurance | 5 (71.4%) | 2 (28.6%) |
| Real Estate, Rental & Leasing | 0 (0.0%) | 0 (0.0%) |
| Professional & Scientific | 15 (65.2%) | 8 (34.8%) |
| Enterprise Management | 0 (0.0%) | 0 (0.0%) |
| Administrative & Support | 10 (100.0%) | 0 (0.0%) |
| Educational Services | 23 (51.1%) | 22 (48.9%) |
| Health Care & Social Assistance | 48 (34.5%) | 91 (65.5%) |
| Arts, Entertainment & Recreation | 0 (0.0%) | 3 (100.0%) |
| Accommodation & Food Services | 17 (33.3%) | 34 (66.7%) |
| Public Administration | 16 (48.5%) | 17 (51.5%) |
| Total | 288 (55.9%) | 227 (44.1%) |
Education in White Hall
School Enrollment in White Hall
The most common levels of schooling among the 293 students in White Hall are middle school (83 | 28.3%), high school (63 | 21.5%), and college / undergraduate (58 | 19.8%).
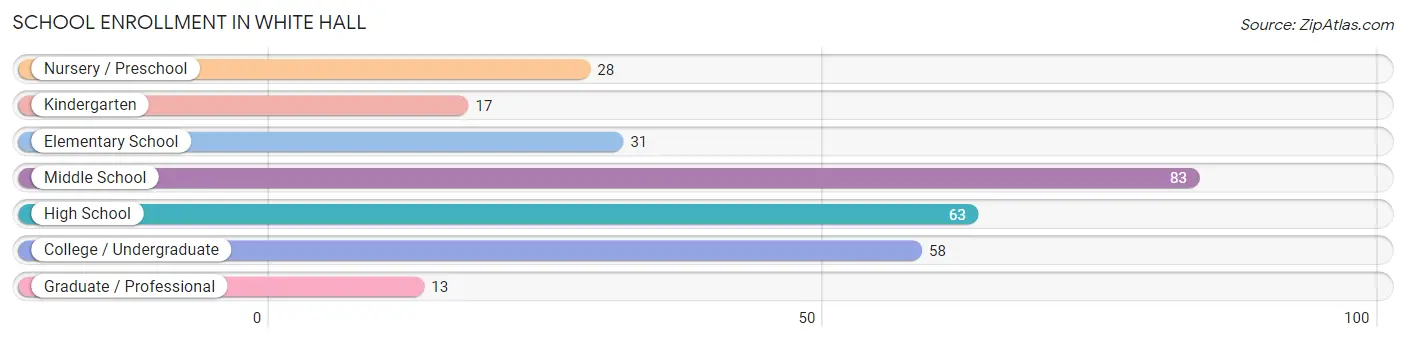
| School Level | # Students | % Students |
| Nursery / Preschool | 28 | 9.6% |
| Kindergarten | 17 | 5.8% |
| Elementary School | 31 | 10.6% |
| Middle School | 83 | 28.3% |
| High School | 63 | 21.5% |
| College / Undergraduate | 58 | 19.8% |
| Graduate / Professional | 13 | 4.4% |
| Total | 293 | 100.0% |
School Enrollment by Age by Funding Source in White Hall
Out of a total of 293 students who are enrolled in schools in White Hall, 15 (5.1%) attend a private institution, while the remaining 278 (94.9%) are enrolled in public schools. The age group of 3 to 4 year olds has the highest likelihood of being enrolled in private schools, with 12 (60.0% in the age bracket) enrolled. Conversely, the age group of 5 to 9 year old has the lowest likelihood of being enrolled in a private school, with 56 (100.0% in the age bracket) attending a public institution.
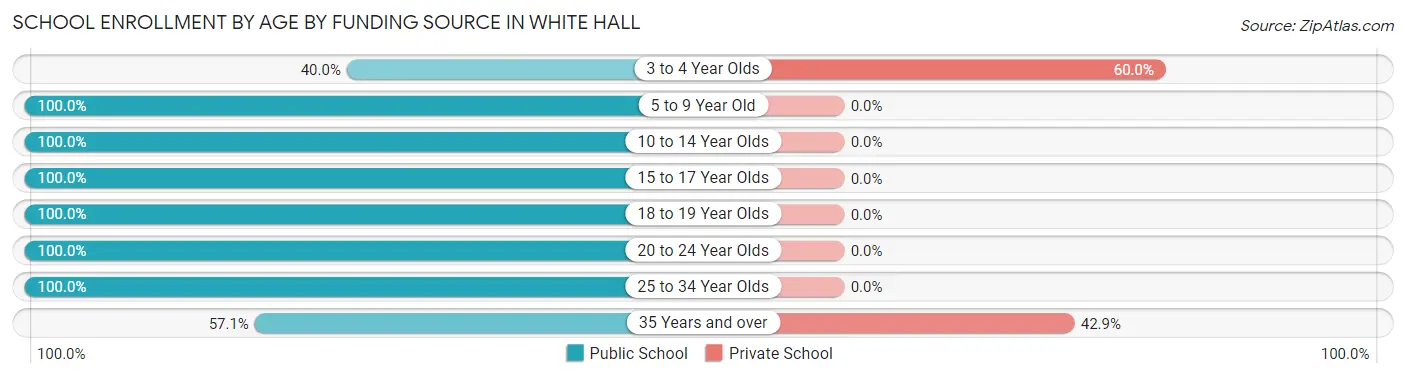
| Age Bracket | Public School | Private School |
| 3 to 4 Year Olds | 8 (40.0%) | 12 (60.0%) |
| 5 to 9 Year Old | 56 (100.0%) | 0 (0.0%) |
| 10 to 14 Year Olds | 88 (100.0%) | 0 (0.0%) |
| 15 to 17 Year Olds | 58 (100.0%) | 0 (0.0%) |
| 18 to 19 Year Olds | 27 (100.0%) | 0 (0.0%) |
| 20 to 24 Year Olds | 18 (100.0%) | 0 (0.0%) |
| 25 to 34 Year Olds | 19 (100.0%) | 0 (0.0%) |
| 35 Years and over | 4 (57.1%) | 3 (42.9%) |
| Total | 278 (94.9%) | 15 (5.1%) |
Educational Attainment by Field of Study in White Hall
Science & technology (53 | 25.7%), education (44 | 21.4%), bio, nature & agricultural (22 | 10.7%), engineering (21 | 10.2%), and business (13 | 6.3%) are the most common fields of study among 206 individuals in White Hall who have obtained a bachelor's degree or higher.
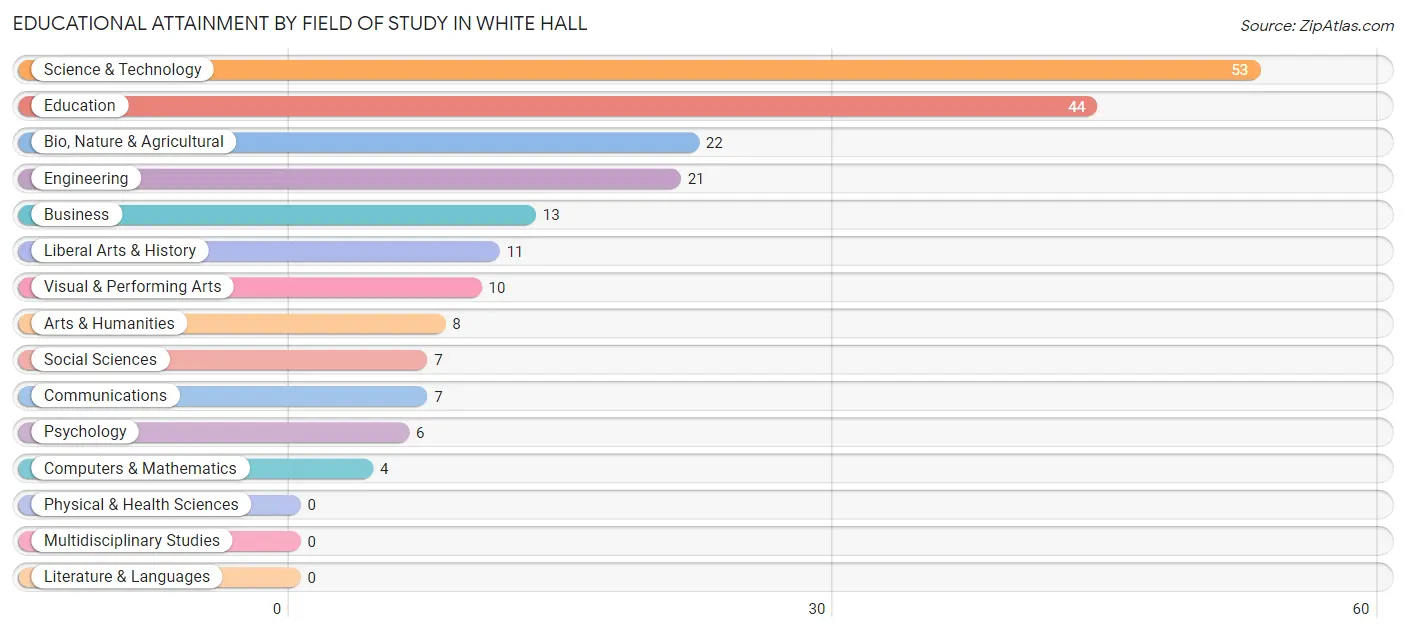
| Field of Study | # Graduates | % Graduates |
| Computers & Mathematics | 4 | 1.9% |
| Bio, Nature & Agricultural | 22 | 10.7% |
| Physical & Health Sciences | 0 | 0.0% |
| Psychology | 6 | 2.9% |
| Social Sciences | 7 | 3.4% |
| Engineering | 21 | 10.2% |
| Multidisciplinary Studies | 0 | 0.0% |
| Science & Technology | 53 | 25.7% |
| Business | 13 | 6.3% |
| Education | 44 | 21.4% |
| Literature & Languages | 0 | 0.0% |
| Liberal Arts & History | 11 | 5.3% |
| Visual & Performing Arts | 10 | 4.9% |
| Communications | 7 | 3.4% |
| Arts & Humanities | 8 | 3.9% |
| Total | 206 | 100.0% |
Transportation & Commute in White Hall
Vehicle Availability by Sex in White Hall
The most prevalent vehicle ownership categories in White Hall are males with 2 vehicles (134, accounting for 45.7%) and females with 2 vehicles (90, making up 62.0%).
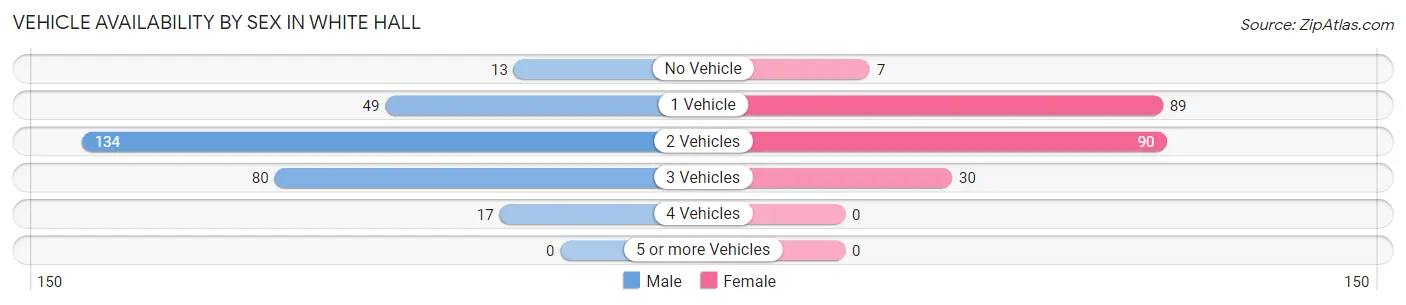
| Vehicles Available | Male | Female |
| No Vehicle | 13 (4.4%) | 7 (3.2%) |
| 1 Vehicle | 49 (16.7%) | 89 (41.2%) |
| 2 Vehicles | 134 (45.7%) | 90 (41.7%) |
| 3 Vehicles | 80 (27.3%) | 30 (13.9%) |
| 4 Vehicles | 17 (5.8%) | 0 (0.0%) |
| 5 or more Vehicles | 0 (0.0%) | 0 (0.0%) |
| Total | 293 (100.0%) | 216 (100.0%) |
Commute Time in White Hall
The most frequently occuring commute durations in White Hall are 15 to 19 minutes (98 commuters, 21.0%), 30 to 34 minutes (65 commuters, 14.0%), and 10 to 14 minutes (55 commuters, 11.8%).
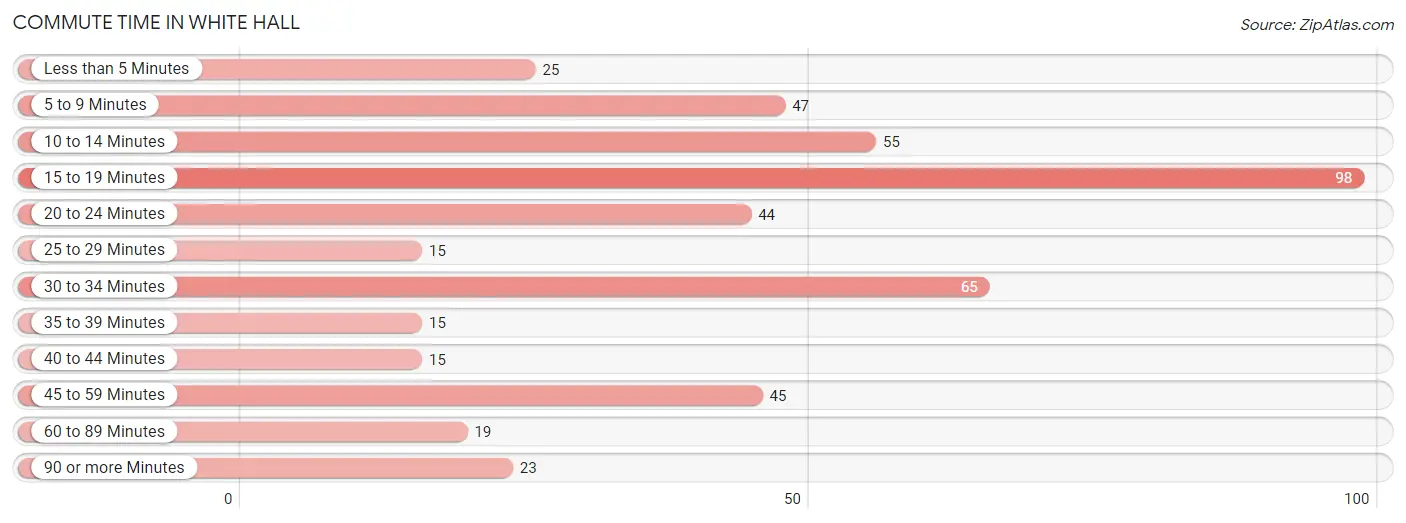
| Commute Time | # Commuters | % Commuters |
| Less than 5 Minutes | 25 | 5.4% |
| 5 to 9 Minutes | 47 | 10.1% |
| 10 to 14 Minutes | 55 | 11.8% |
| 15 to 19 Minutes | 98 | 21.0% |
| 20 to 24 Minutes | 44 | 9.4% |
| 25 to 29 Minutes | 15 | 3.2% |
| 30 to 34 Minutes | 65 | 14.0% |
| 35 to 39 Minutes | 15 | 3.2% |
| 40 to 44 Minutes | 15 | 3.2% |
| 45 to 59 Minutes | 45 | 9.7% |
| 60 to 89 Minutes | 19 | 4.1% |
| 90 or more Minutes | 23 | 4.9% |
Commute Time by Sex in White Hall
The most common commute times in White Hall are 15 to 19 minutes (52 commuters, 19.4%) for males and 15 to 19 minutes (46 commuters, 23.2%) for females.
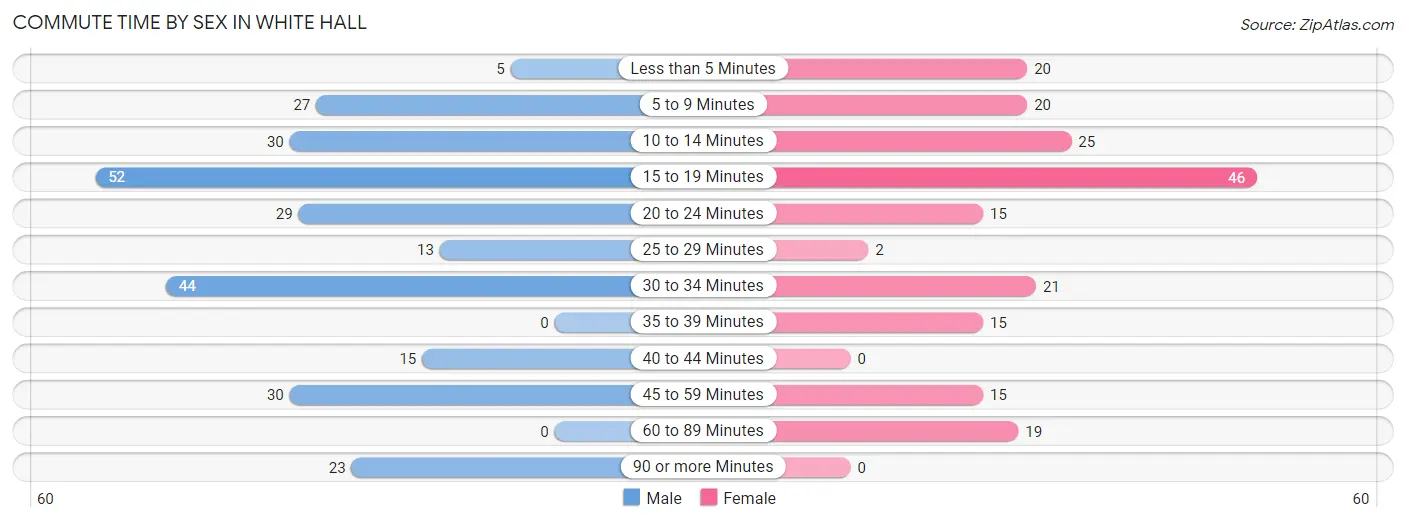
| Commute Time | Male | Female |
| Less than 5 Minutes | 5 (1.9%) | 20 (10.1%) |
| 5 to 9 Minutes | 27 (10.1%) | 20 (10.1%) |
| 10 to 14 Minutes | 30 (11.2%) | 25 (12.6%) |
| 15 to 19 Minutes | 52 (19.4%) | 46 (23.2%) |
| 20 to 24 Minutes | 29 (10.8%) | 15 (7.6%) |
| 25 to 29 Minutes | 13 (4.9%) | 2 (1.0%) |
| 30 to 34 Minutes | 44 (16.4%) | 21 (10.6%) |
| 35 to 39 Minutes | 0 (0.0%) | 15 (7.6%) |
| 40 to 44 Minutes | 15 (5.6%) | 0 (0.0%) |
| 45 to 59 Minutes | 30 (11.2%) | 15 (7.6%) |
| 60 to 89 Minutes | 0 (0.0%) | 19 (9.6%) |
| 90 or more Minutes | 23 (8.6%) | 0 (0.0%) |
Time of Departure to Work by Sex in White Hall
The most frequent times of departure to work in White Hall are 7:00 AM to 7:29 AM (42, 15.7%) for males and 8:00 AM to 8:29 AM (47, 23.7%) for females.
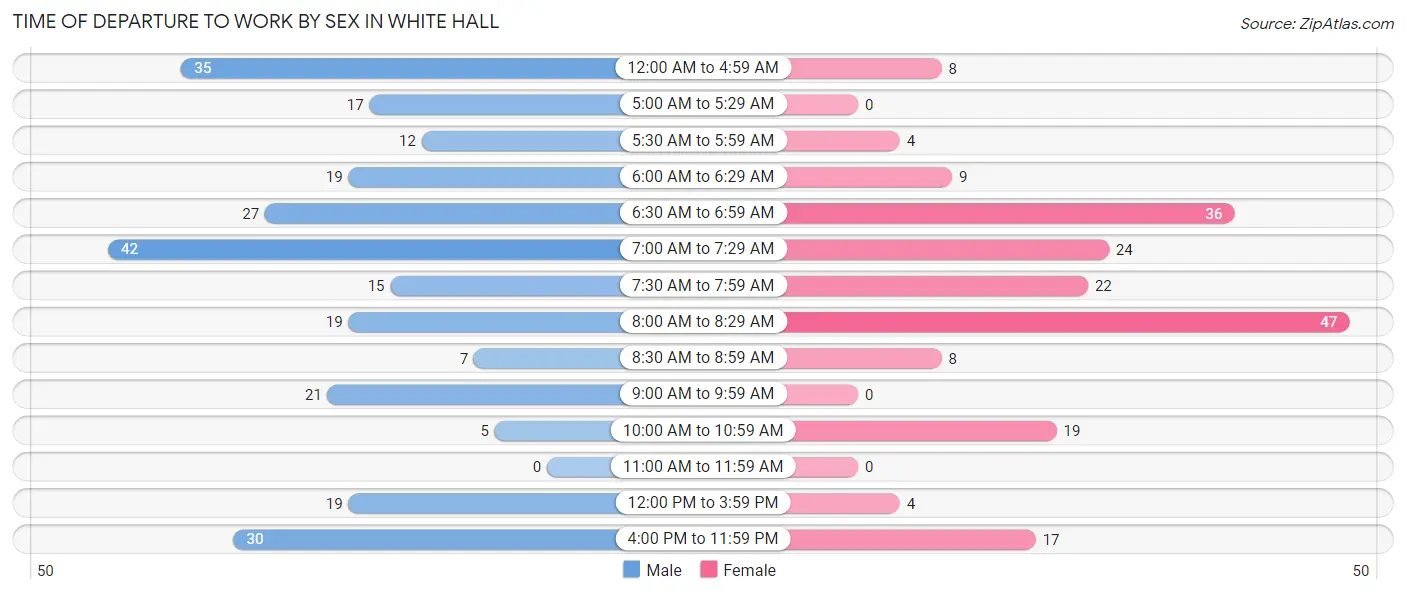
| Time of Departure | Male | Female |
| 12:00 AM to 4:59 AM | 35 (13.1%) | 8 (4.0%) |
| 5:00 AM to 5:29 AM | 17 (6.3%) | 0 (0.0%) |
| 5:30 AM to 5:59 AM | 12 (4.5%) | 4 (2.0%) |
| 6:00 AM to 6:29 AM | 19 (7.1%) | 9 (4.5%) |
| 6:30 AM to 6:59 AM | 27 (10.1%) | 36 (18.2%) |
| 7:00 AM to 7:29 AM | 42 (15.7%) | 24 (12.1%) |
| 7:30 AM to 7:59 AM | 15 (5.6%) | 22 (11.1%) |
| 8:00 AM to 8:29 AM | 19 (7.1%) | 47 (23.7%) |
| 8:30 AM to 8:59 AM | 7 (2.6%) | 8 (4.0%) |
| 9:00 AM to 9:59 AM | 21 (7.8%) | 0 (0.0%) |
| 10:00 AM to 10:59 AM | 5 (1.9%) | 19 (9.6%) |
| 11:00 AM to 11:59 AM | 0 (0.0%) | 0 (0.0%) |
| 12:00 PM to 3:59 PM | 19 (7.1%) | 4 (2.0%) |
| 4:00 PM to 11:59 PM | 30 (11.2%) | 17 (8.6%) |
| Total | 268 (100.0%) | 198 (100.0%) |
Housing Occupancy in White Hall
Occupancy by Ownership in White Hall
Of the total 395 dwellings in White Hall, owner-occupied units account for 209 (52.9%), while renter-occupied units make up 186 (47.1%).
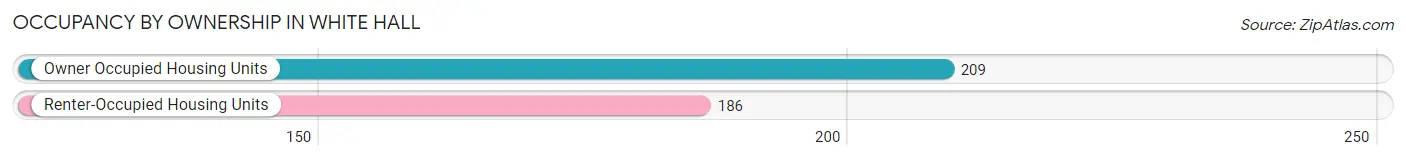
| Occupancy | # Housing Units | % Housing Units |
| Owner Occupied Housing Units | 209 | 52.9% |
| Renter-Occupied Housing Units | 186 | 47.1% |
| Total Occupied Housing Units | 395 | 100.0% |
Occupancy by Household Size in White Hall
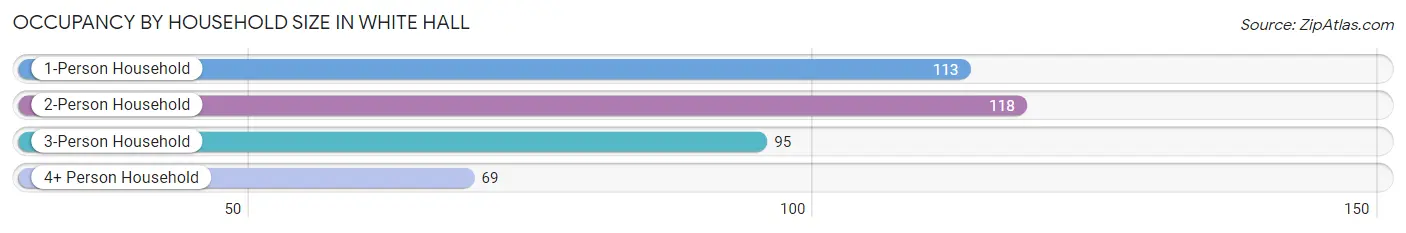
| Household Size | # Housing Units | % Housing Units |
| 1-Person Household | 113 | 28.6% |
| 2-Person Household | 118 | 29.9% |
| 3-Person Household | 95 | 24.0% |
| 4+ Person Household | 69 | 17.5% |
| Total Housing Units | 395 | 100.0% |
Occupancy by Ownership by Household Size in White Hall
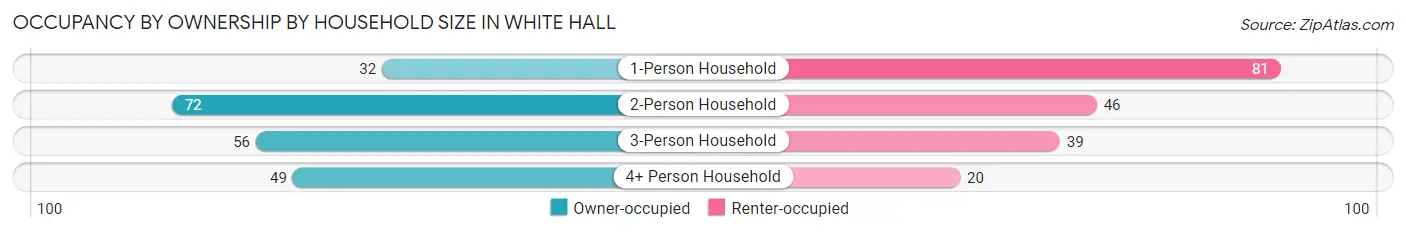
| Household Size | Owner-occupied | Renter-occupied |
| 1-Person Household | 32 (28.3%) | 81 (71.7%) |
| 2-Person Household | 72 (61.0%) | 46 (39.0%) |
| 3-Person Household | 56 (59.0%) | 39 (41.0%) |
| 4+ Person Household | 49 (71.0%) | 20 (29.0%) |
| Total Housing Units | 209 (52.9%) | 186 (47.1%) |
Occupancy by Educational Attainment in White Hall
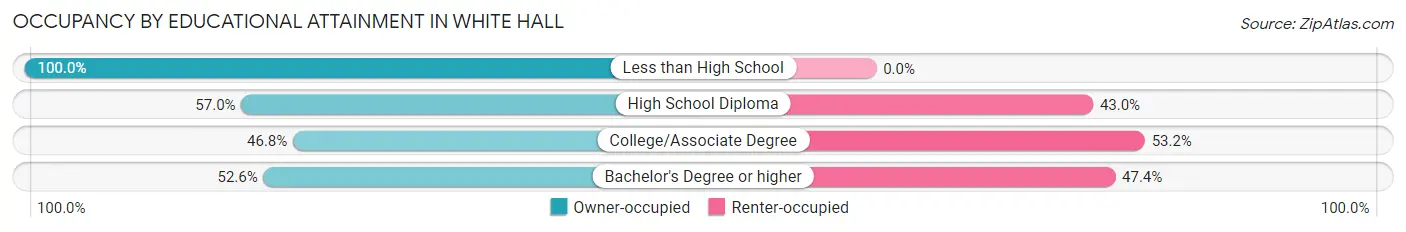
| Household Size | Owner-occupied | Renter-occupied |
| Less than High School | 9 (100.0%) | 0 (0.0%) |
| High School Diploma | 65 (57.0%) | 49 (43.0%) |
| College/Associate Degree | 65 (46.8%) | 74 (53.2%) |
| Bachelor's Degree or higher | 70 (52.6%) | 63 (47.4%) |
Occupancy by Age of Householder in White Hall
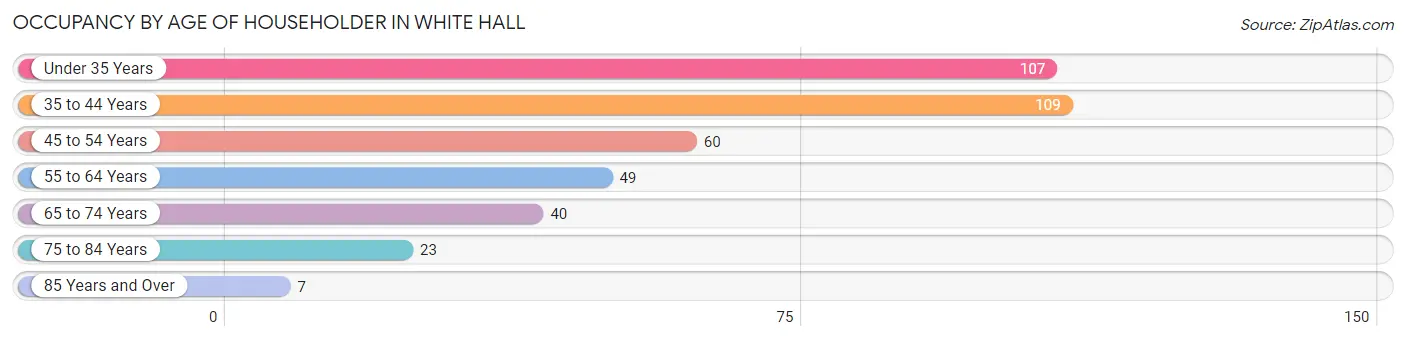
| Age Bracket | # Households | % Households |
| Under 35 Years | 107 | 27.1% |
| 35 to 44 Years | 109 | 27.6% |
| 45 to 54 Years | 60 | 15.2% |
| 55 to 64 Years | 49 | 12.4% |
| 65 to 74 Years | 40 | 10.1% |
| 75 to 84 Years | 23 | 5.8% |
| 85 Years and Over | 7 | 1.8% |
| Total | 395 | 100.0% |
Housing Finances in White Hall
Median Income by Occupancy in White Hall
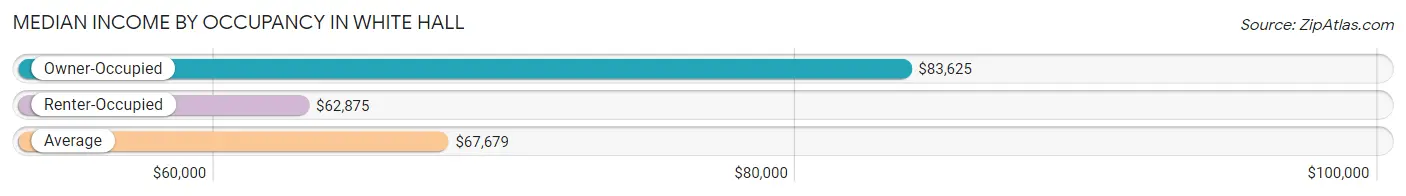
| Occupancy Type | # Households | Median Income |
| Owner-Occupied | 209 (52.9%) | $83,625 |
| Renter-Occupied | 186 (47.1%) | $62,875 |
| Average | 395 (100.0%) | $67,679 |
Occupancy by Householder Income Bracket in White Hall
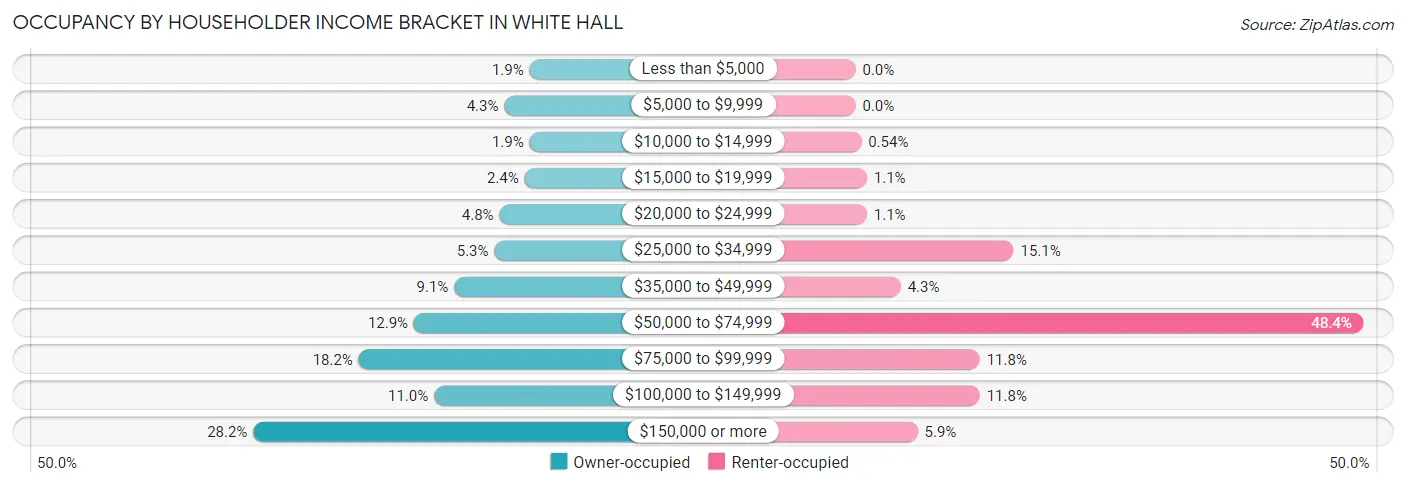
| Income Bracket | Owner-occupied | Renter-occupied |
| Less than $5,000 | 4 (1.9%) | 0 (0.0%) |
| $5,000 to $9,999 | 9 (4.3%) | 0 (0.0%) |
| $10,000 to $14,999 | 4 (1.9%) | 1 (0.5%) |
| $15,000 to $19,999 | 5 (2.4%) | 2 (1.1%) |
| $20,000 to $24,999 | 10 (4.8%) | 2 (1.1%) |
| $25,000 to $34,999 | 11 (5.3%) | 28 (15.0%) |
| $35,000 to $49,999 | 19 (9.1%) | 8 (4.3%) |
| $50,000 to $74,999 | 27 (12.9%) | 90 (48.4%) |
| $75,000 to $99,999 | 38 (18.2%) | 22 (11.8%) |
| $100,000 to $149,999 | 23 (11.0%) | 22 (11.8%) |
| $150,000 or more | 59 (28.2%) | 11 (5.9%) |
| Total | 209 (100.0%) | 186 (100.0%) |
Monthly Housing Cost Tiers in White Hall
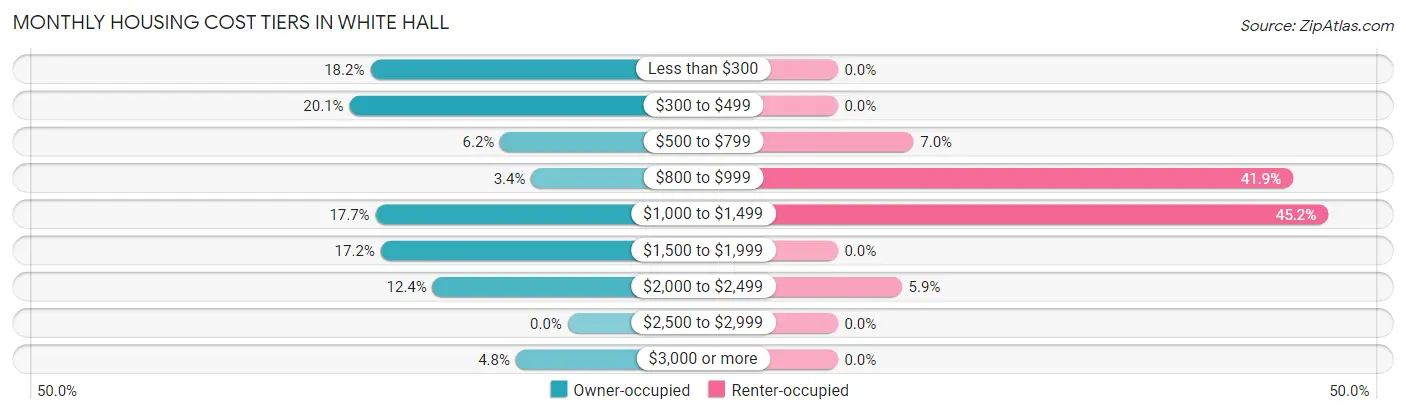
| Monthly Cost | Owner-occupied | Renter-occupied |
| Less than $300 | 38 (18.2%) | 0 (0.0%) |
| $300 to $499 | 42 (20.1%) | 0 (0.0%) |
| $500 to $799 | 13 (6.2%) | 13 (7.0%) |
| $800 to $999 | 7 (3.4%) | 78 (41.9%) |
| $1,000 to $1,499 | 37 (17.7%) | 84 (45.2%) |
| $1,500 to $1,999 | 36 (17.2%) | 0 (0.0%) |
| $2,000 to $2,499 | 26 (12.4%) | 11 (5.9%) |
| $2,500 to $2,999 | 0 (0.0%) | 0 (0.0%) |
| $3,000 or more | 10 (4.8%) | 0 (0.0%) |
| Total | 209 (100.0%) | 186 (100.0%) |
Physical Housing Characteristics in White Hall
Housing Structures in White Hall
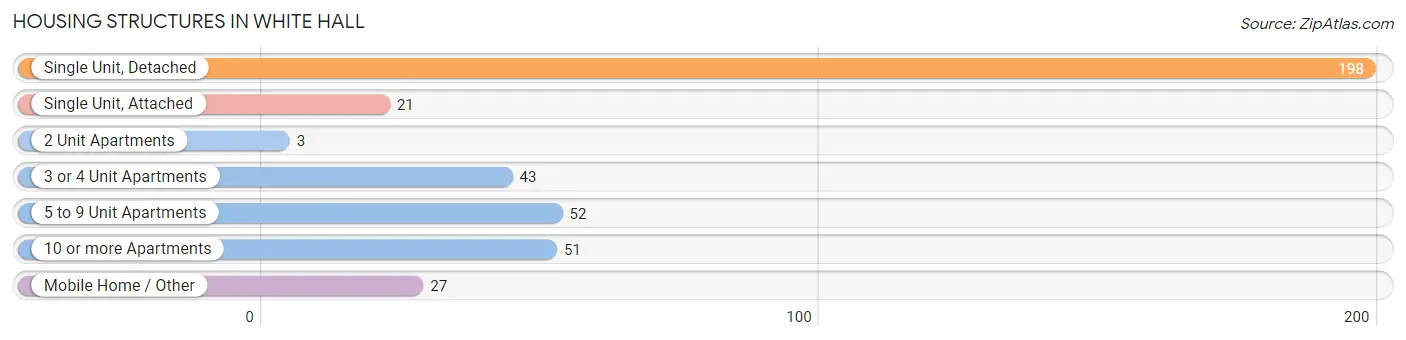
| Structure Type | # Housing Units | % Housing Units |
| Single Unit, Detached | 198 | 50.1% |
| Single Unit, Attached | 21 | 5.3% |
| 2 Unit Apartments | 3 | 0.8% |
| 3 or 4 Unit Apartments | 43 | 10.9% |
| 5 to 9 Unit Apartments | 52 | 13.2% |
| 10 or more Apartments | 51 | 12.9% |
| Mobile Home / Other | 27 | 6.8% |
| Total | 395 | 100.0% |
Housing Structures by Occupancy in White Hall
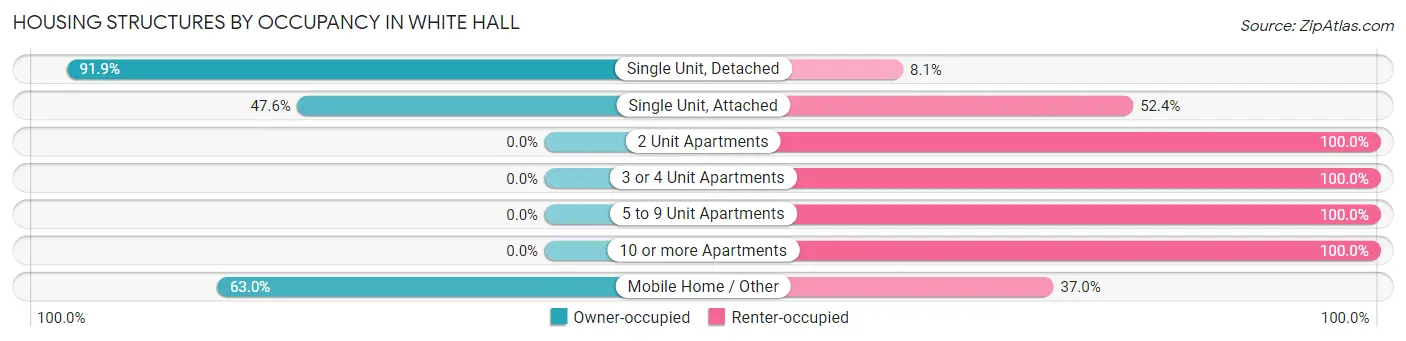
| Structure Type | Owner-occupied | Renter-occupied |
| Single Unit, Detached | 182 (91.9%) | 16 (8.1%) |
| Single Unit, Attached | 10 (47.6%) | 11 (52.4%) |
| 2 Unit Apartments | 0 (0.0%) | 3 (100.0%) |
| 3 or 4 Unit Apartments | 0 (0.0%) | 43 (100.0%) |
| 5 to 9 Unit Apartments | 0 (0.0%) | 52 (100.0%) |
| 10 or more Apartments | 0 (0.0%) | 51 (100.0%) |
| Mobile Home / Other | 17 (63.0%) | 10 (37.0%) |
| Total | 209 (52.9%) | 186 (47.1%) |
Housing Structures by Number of Rooms in White Hall
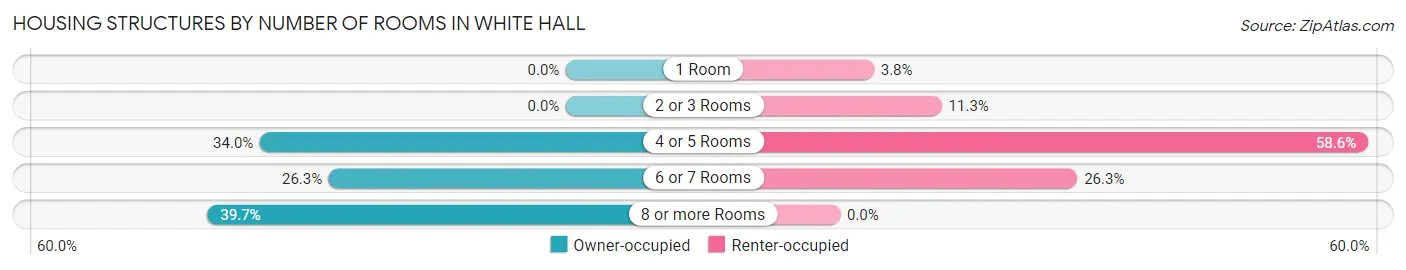
| Number of Rooms | Owner-occupied | Renter-occupied |
| 1 Room | 0 (0.0%) | 7 (3.8%) |
| 2 or 3 Rooms | 0 (0.0%) | 21 (11.3%) |
| 4 or 5 Rooms | 71 (34.0%) | 109 (58.6%) |
| 6 or 7 Rooms | 55 (26.3%) | 49 (26.3%) |
| 8 or more Rooms | 83 (39.7%) | 0 (0.0%) |
| Total | 209 (100.0%) | 186 (100.0%) |
Housing Structure by Heating Type in White Hall
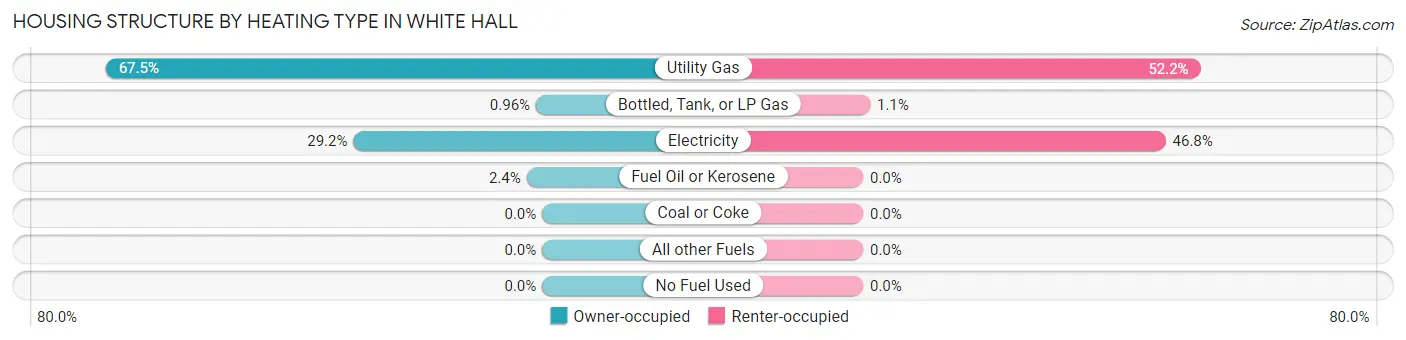
| Heating Type | Owner-occupied | Renter-occupied |
| Utility Gas | 141 (67.5%) | 97 (52.1%) |
| Bottled, Tank, or LP Gas | 2 (1.0%) | 2 (1.1%) |
| Electricity | 61 (29.2%) | 87 (46.8%) |
| Fuel Oil or Kerosene | 5 (2.4%) | 0 (0.0%) |
| Coal or Coke | 0 (0.0%) | 0 (0.0%) |
| All other Fuels | 0 (0.0%) | 0 (0.0%) |
| No Fuel Used | 0 (0.0%) | 0 (0.0%) |
| Total | 209 (100.0%) | 186 (100.0%) |
Household Vehicle Usage in White Hall
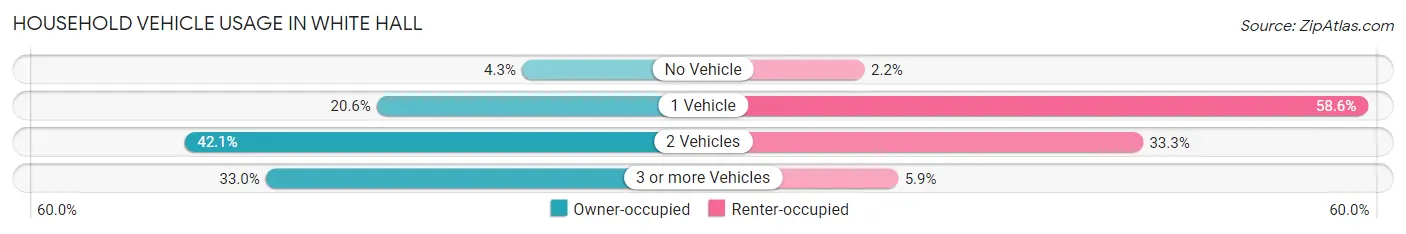
| Vehicles per Household | Owner-occupied | Renter-occupied |
| No Vehicle | 9 (4.3%) | 4 (2.1%) |
| 1 Vehicle | 43 (20.6%) | 109 (58.6%) |
| 2 Vehicles | 88 (42.1%) | 62 (33.3%) |
| 3 or more Vehicles | 69 (33.0%) | 11 (5.9%) |
| Total | 209 (100.0%) | 186 (100.0%) |
Real Estate & Mortgages in White Hall
Real Estate and Mortgage Overview in White Hall
| Characteristic | Without Mortgage | With Mortgage |
| Housing Units | 88 | 121 |
| Median Property Value | $172,500 | $243,600 |
| Median Household Income | $55,556 | $52 |
| Monthly Housing Costs | $356 | $9 |
| Real Estate Taxes | $1,096 | $0 |
Property Value by Mortgage Status in White Hall
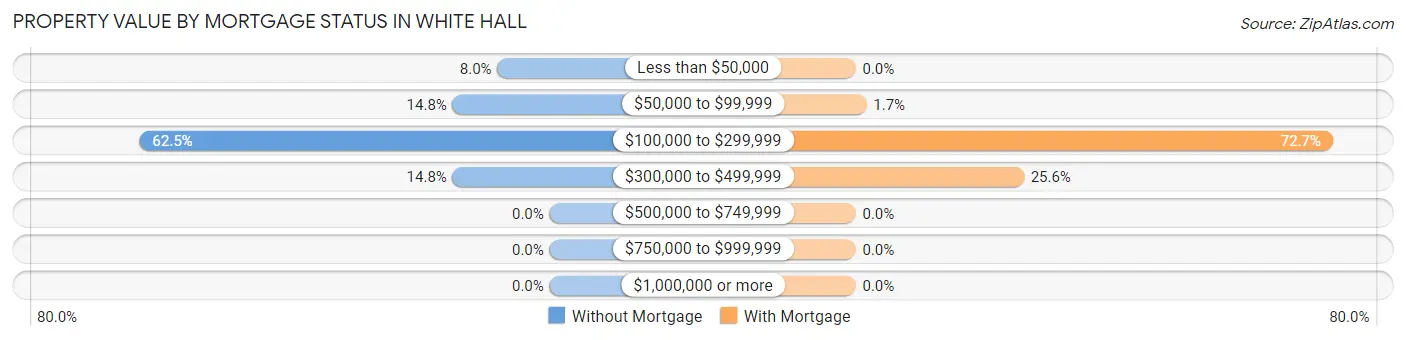
| Property Value | Without Mortgage | With Mortgage |
| Less than $50,000 | 7 (8.0%) | 0 (0.0%) |
| $50,000 to $99,999 | 13 (14.8%) | 2 (1.7%) |
| $100,000 to $299,999 | 55 (62.5%) | 88 (72.7%) |
| $300,000 to $499,999 | 13 (14.8%) | 31 (25.6%) |
| $500,000 to $749,999 | 0 (0.0%) | 0 (0.0%) |
| $750,000 to $999,999 | 0 (0.0%) | 0 (0.0%) |
| $1,000,000 or more | 0 (0.0%) | 0 (0.0%) |
| Total | 88 (100.0%) | 121 (100.0%) |
Household Income by Mortgage Status in White Hall
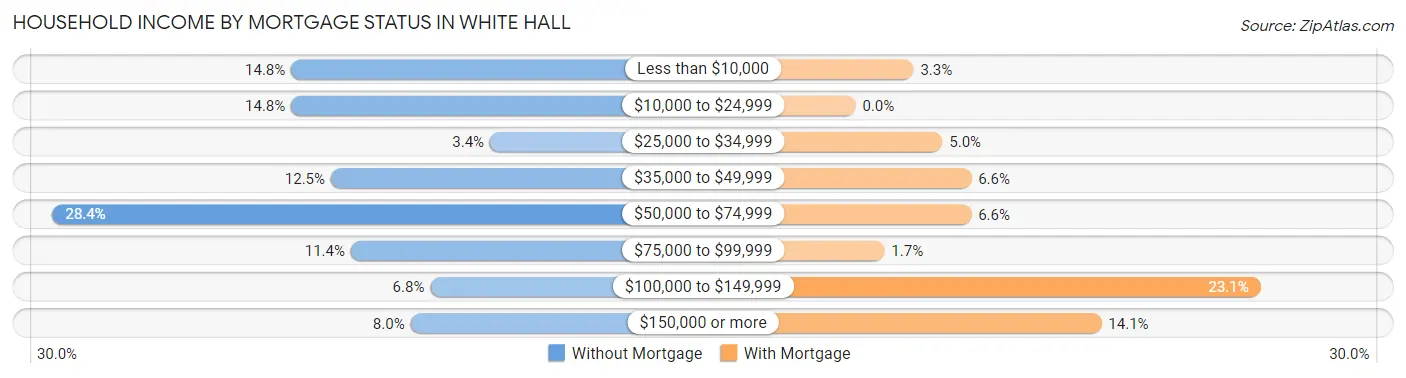
| Household Income | Without Mortgage | With Mortgage |
| Less than $10,000 | 13 (14.8%) | 4 (3.3%) |
| $10,000 to $24,999 | 13 (14.8%) | 0 (0.0%) |
| $25,000 to $34,999 | 3 (3.4%) | 6 (5.0%) |
| $35,000 to $49,999 | 11 (12.5%) | 8 (6.6%) |
| $50,000 to $74,999 | 25 (28.4%) | 8 (6.6%) |
| $75,000 to $99,999 | 10 (11.4%) | 2 (1.7%) |
| $100,000 to $149,999 | 6 (6.8%) | 28 (23.1%) |
| $150,000 or more | 7 (8.0%) | 17 (14.1%) |
| Total | 88 (100.0%) | 121 (100.0%) |
Property Value to Household Income Ratio in White Hall
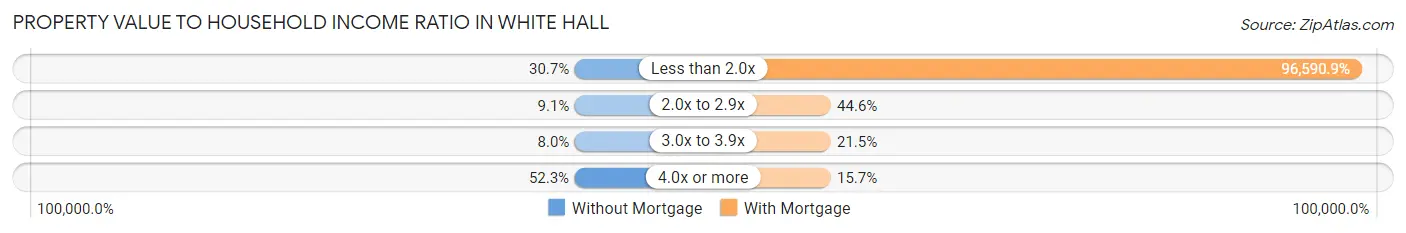
| Value-to-Income Ratio | Without Mortgage | With Mortgage |
| Less than 2.0x | 27 (30.7%) | 116,875 (96,590.9%) |
| 2.0x to 2.9x | 8 (9.1%) | 54 (44.6%) |
| 3.0x to 3.9x | 7 (8.0%) | 26 (21.5%) |
| 4.0x or more | 46 (52.3%) | 19 (15.7%) |
| Total | 88 (100.0%) | 121 (100.0%) |
Real Estate Taxes by Mortgage Status in White Hall
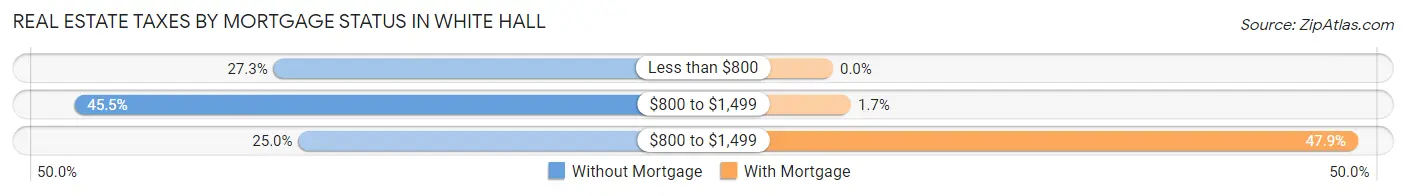
| Property Taxes | Without Mortgage | With Mortgage |
| Less than $800 | 24 (27.3%) | 0 (0.0%) |
| $800 to $1,499 | 40 (45.5%) | 2 (1.7%) |
| $800 to $1,499 | 22 (25.0%) | 58 (47.9%) |
| Total | 88 (100.0%) | 121 (100.0%) |
Health & Disability in White Hall
Health Insurance Coverage by Age in White Hall
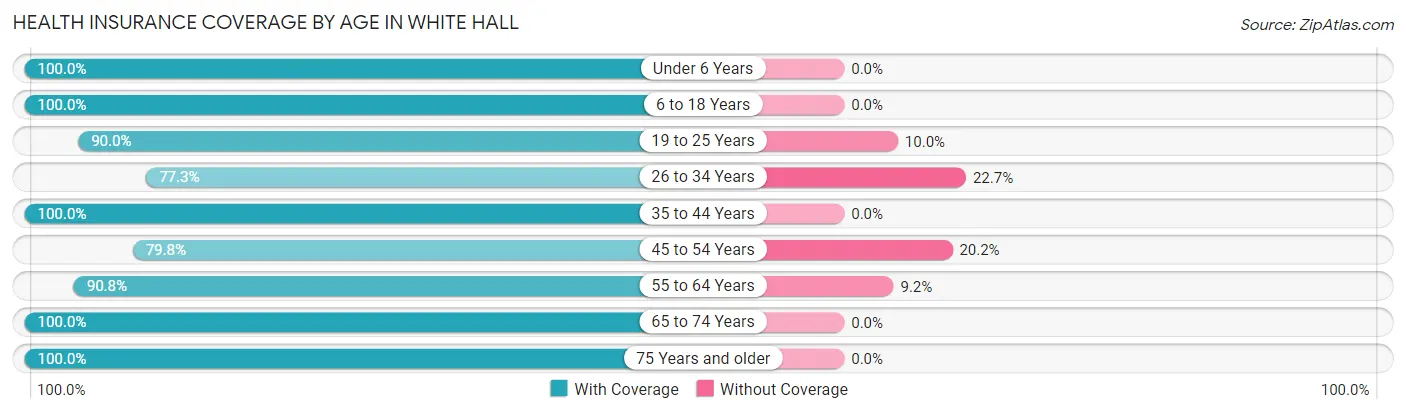
| Age Bracket | With Coverage | Without Coverage |
| Under 6 Years | 85 (100.0%) | 0 (0.0%) |
| 6 to 18 Years | 194 (100.0%) | 0 (0.0%) |
| 19 to 25 Years | 99 (90.0%) | 11 (10.0%) |
| 26 to 34 Years | 92 (77.3%) | 27 (22.7%) |
| 35 to 44 Years | 162 (100.0%) | 0 (0.0%) |
| 45 to 54 Years | 95 (79.8%) | 24 (20.2%) |
| 55 to 64 Years | 89 (90.8%) | 9 (9.2%) |
| 65 to 74 Years | 85 (100.0%) | 0 (0.0%) |
| 75 Years and older | 48 (100.0%) | 0 (0.0%) |
| Total | 949 (93.0%) | 71 (7.0%) |
Health Insurance Coverage by Citizenship Status in White Hall
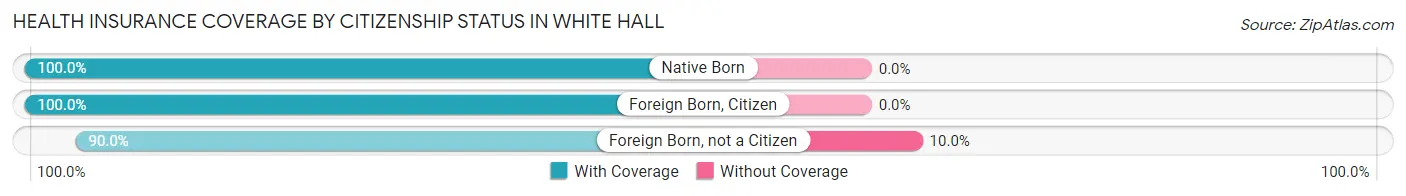
| Citizenship Status | With Coverage | Without Coverage |
| Native Born | 85 (100.0%) | 0 (0.0%) |
| Foreign Born, Citizen | 194 (100.0%) | 0 (0.0%) |
| Foreign Born, not a Citizen | 99 (90.0%) | 11 (10.0%) |
Health Insurance Coverage by Household Income in White Hall
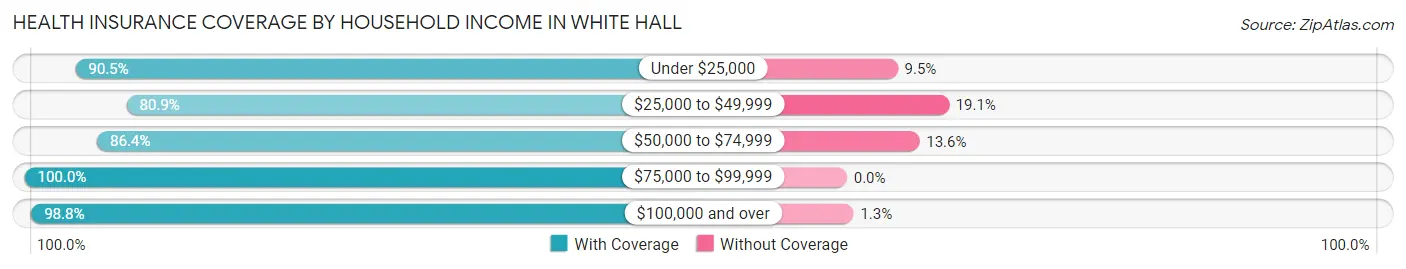
| Household Income | With Coverage | Without Coverage |
| Under $25,000 | 57 (90.5%) | 6 (9.5%) |
| $25,000 to $49,999 | 89 (80.9%) | 21 (19.1%) |
| $50,000 to $74,999 | 248 (86.4%) | 39 (13.6%) |
| $75,000 to $99,999 | 159 (100.0%) | 0 (0.0%) |
| $100,000 and over | 396 (98.8%) | 5 (1.3%) |
Public vs Private Health Insurance Coverage by Age in White Hall
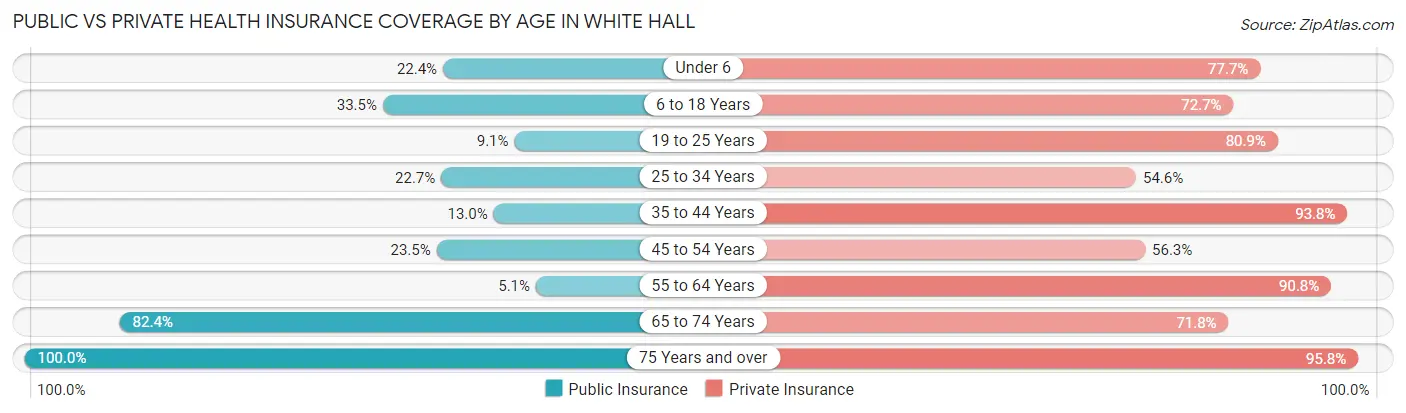
| Age Bracket | Public Insurance | Private Insurance |
| Under 6 | 19 (22.4%) | 66 (77.6%) |
| 6 to 18 Years | 65 (33.5%) | 141 (72.7%) |
| 19 to 25 Years | 10 (9.1%) | 89 (80.9%) |
| 25 to 34 Years | 27 (22.7%) | 65 (54.6%) |
| 35 to 44 Years | 21 (13.0%) | 152 (93.8%) |
| 45 to 54 Years | 28 (23.5%) | 67 (56.3%) |
| 55 to 64 Years | 5 (5.1%) | 89 (90.8%) |
| 65 to 74 Years | 70 (82.4%) | 61 (71.8%) |
| 75 Years and over | 48 (100.0%) | 46 (95.8%) |
| Total | 293 (28.7%) | 776 (76.1%) |
Disability Status by Sex by Age in White Hall
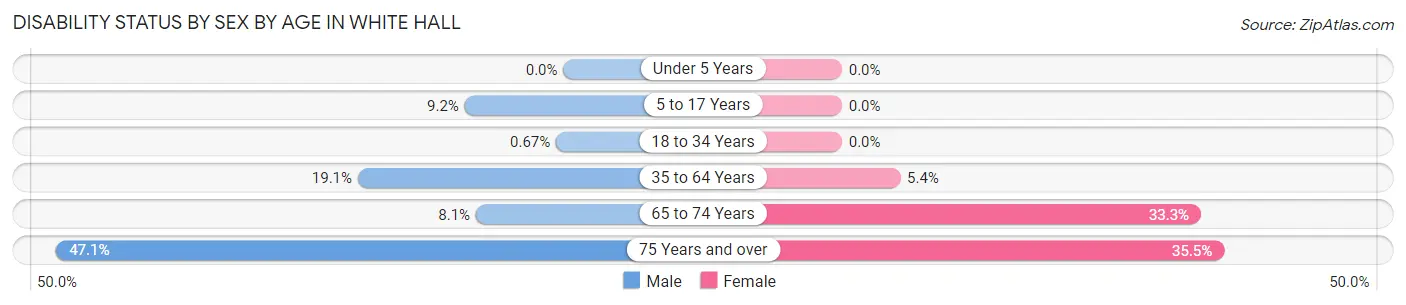
| Age Bracket | Male | Female |
| Under 5 Years | 0 (0.0%) | 0 (0.0%) |
| 5 to 17 Years | 12 (9.2%) | 0 (0.0%) |
| 18 to 34 Years | 1 (0.7%) | 0 (0.0%) |
| 35 to 64 Years | 37 (19.1%) | 10 (5.4%) |
| 65 to 74 Years | 3 (8.1%) | 16 (33.3%) |
| 75 Years and over | 8 (47.1%) | 11 (35.5%) |
Disability Class by Sex by Age in White Hall
Disability Class: Hearing Difficulty
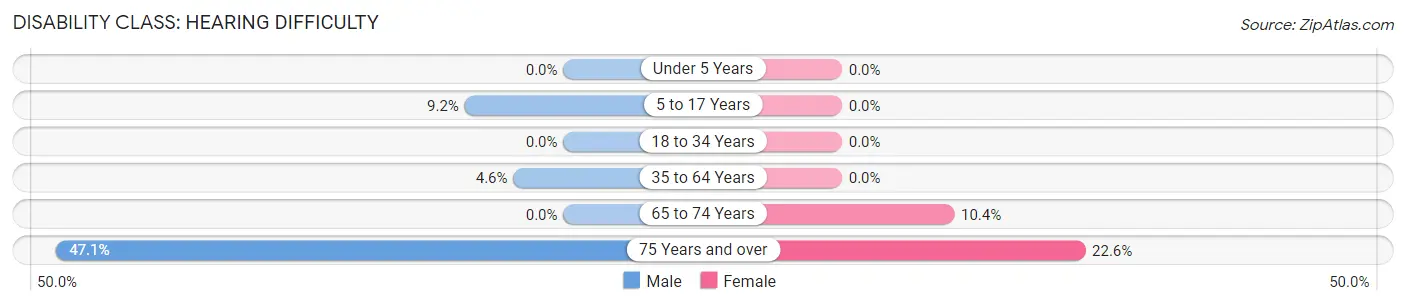
| Age Bracket | Male | Female |
| Under 5 Years | 0 (0.0%) | 0 (0.0%) |
| 5 to 17 Years | 12 (9.2%) | 0 (0.0%) |
| 18 to 34 Years | 0 (0.0%) | 0 (0.0%) |
| 35 to 64 Years | 9 (4.6%) | 0 (0.0%) |
| 65 to 74 Years | 0 (0.0%) | 5 (10.4%) |
| 75 Years and over | 8 (47.1%) | 7 (22.6%) |
Disability Class: Vision Difficulty
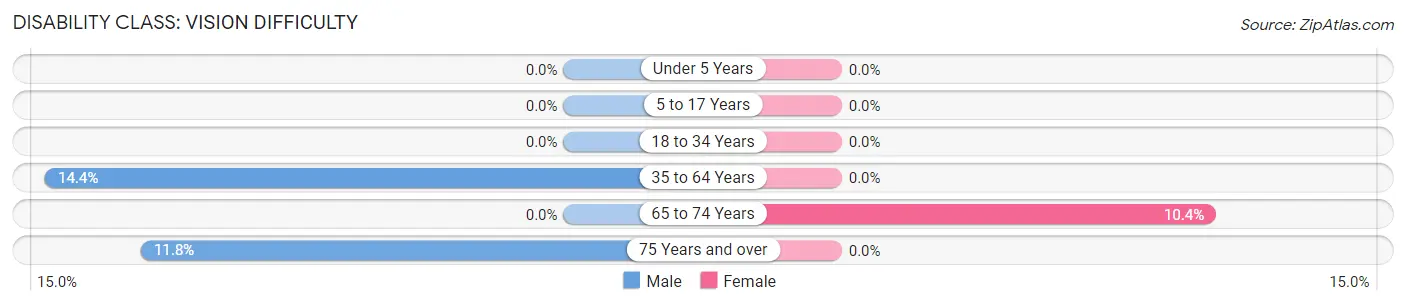
| Age Bracket | Male | Female |
| Under 5 Years | 0 (0.0%) | 0 (0.0%) |
| 5 to 17 Years | 0 (0.0%) | 0 (0.0%) |
| 18 to 34 Years | 0 (0.0%) | 0 (0.0%) |
| 35 to 64 Years | 28 (14.4%) | 0 (0.0%) |
| 65 to 74 Years | 0 (0.0%) | 5 (10.4%) |
| 75 Years and over | 2 (11.8%) | 0 (0.0%) |
Disability Class: Cognitive Difficulty
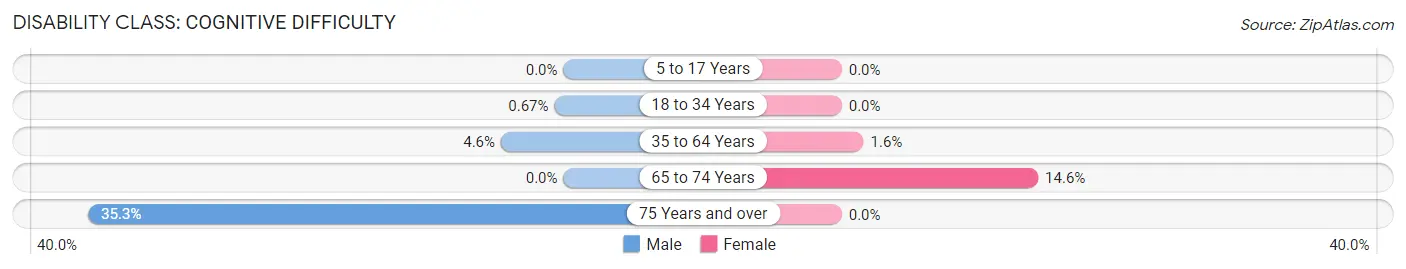
| Age Bracket | Male | Female |
| 5 to 17 Years | 0 (0.0%) | 0 (0.0%) |
| 18 to 34 Years | 1 (0.7%) | 0 (0.0%) |
| 35 to 64 Years | 9 (4.6%) | 3 (1.6%) |
| 65 to 74 Years | 0 (0.0%) | 7 (14.6%) |
| 75 Years and over | 6 (35.3%) | 0 (0.0%) |
Disability Class: Ambulatory Difficulty
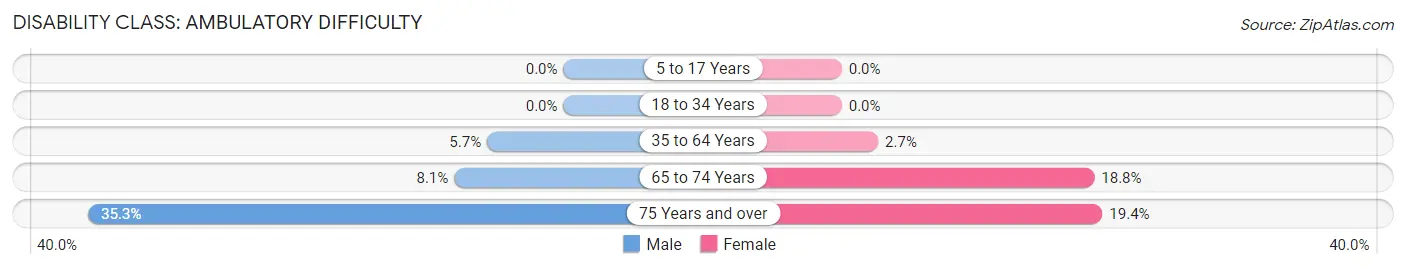
| Age Bracket | Male | Female |
| 5 to 17 Years | 0 (0.0%) | 0 (0.0%) |
| 18 to 34 Years | 0 (0.0%) | 0 (0.0%) |
| 35 to 64 Years | 11 (5.7%) | 5 (2.7%) |
| 65 to 74 Years | 3 (8.1%) | 9 (18.8%) |
| 75 Years and over | 6 (35.3%) | 6 (19.4%) |
Disability Class: Self-Care Difficulty
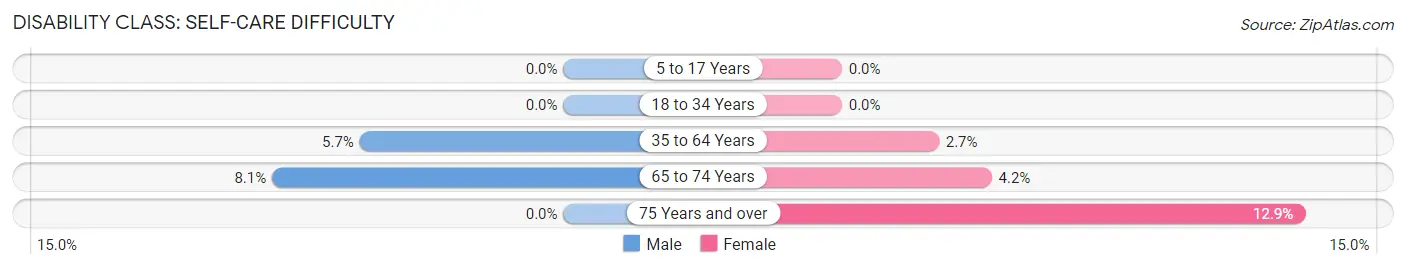
| Age Bracket | Male | Female |
| 5 to 17 Years | 0 (0.0%) | 0 (0.0%) |
| 18 to 34 Years | 0 (0.0%) | 0 (0.0%) |
| 35 to 64 Years | 11 (5.7%) | 5 (2.7%) |
| 65 to 74 Years | 3 (8.1%) | 2 (4.2%) |
| 75 Years and over | 0 (0.0%) | 4 (12.9%) |
Technology Access in White Hall
Computing Device Access in White Hall
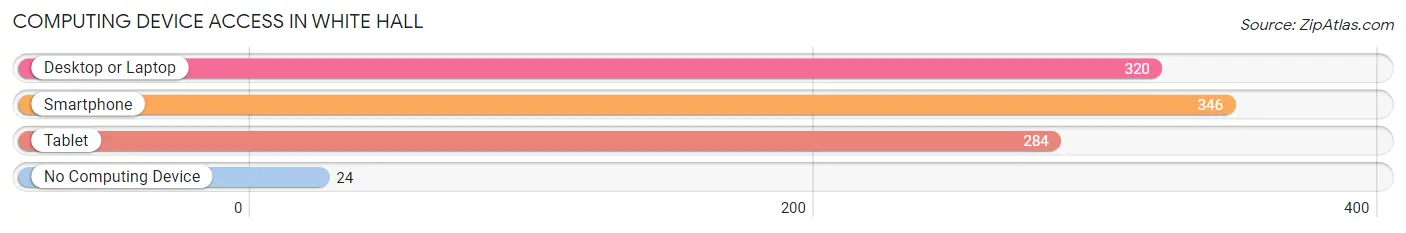
| Device Type | # Households | % Households |
| Desktop or Laptop | 320 | 81.0% |
| Smartphone | 346 | 87.6% |
| Tablet | 284 | 71.9% |
| No Computing Device | 24 | 6.1% |
| Total | 395 | 100.0% |
Internet Access in White Hall
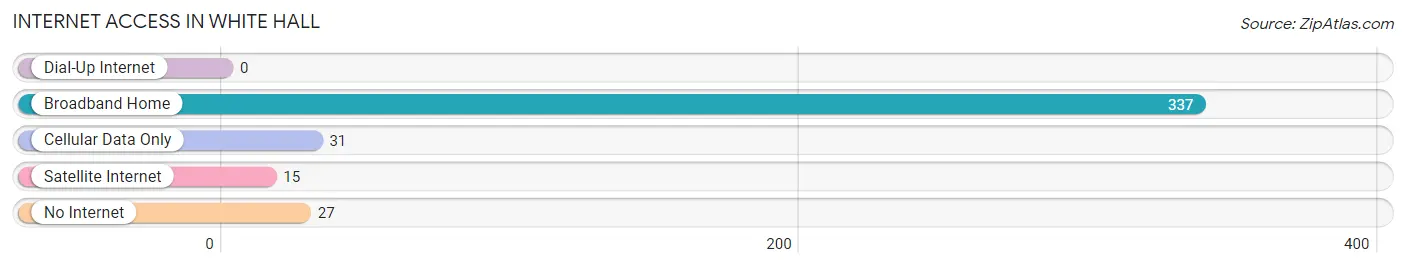
| Internet Type | # Households | % Households |
| Dial-Up Internet | 0 | 0.0% |
| Broadband Home | 337 | 85.3% |
| Cellular Data Only | 31 | 7.9% |
| Satellite Internet | 15 | 3.8% |
| No Internet | 27 | 6.8% |
| Total | 395 | 100.0% |
White Hall Summary
White Hall is a small town located in Marion County, West Virginia. It is situated on the banks of the Monongahela River, approximately 25 miles south of Pittsburgh, Pennsylvania. The town was founded in 1817 and has a population of approximately 1,500 people.
History
White Hall was founded in 1817 by a group of settlers from Pennsylvania. The town was named after the white-painted hall of the local Presbyterian church. The town was originally a farming community, but it soon developed into a small industrial center. The first industry in White Hall was a sawmill, which was built in 1820. This was followed by a gristmill, a tannery, and a woolen mill.
In the late 19th century, White Hall became a popular tourist destination. The town was known for its scenic beauty and its proximity to the Monongahela River. The town also had a number of hotels and inns, which attracted visitors from all over the region.
In the early 20th century, White Hall experienced a period of economic decline. The town’s industries began to close, and many of its residents moved away. However, the town was able to survive and eventually began to experience a period of growth in the late 20th century.
Geography
White Hall is located in Marion County, West Virginia. The town is situated on the banks of the Monongahela River, approximately 25 miles south of Pittsburgh, Pennsylvania. The town is surrounded by rolling hills and forests, and is located in a rural area.
The climate in White Hall is temperate, with hot summers and cold winters. The average annual temperature is around 50 degrees Fahrenheit. The town receives an average of 40 inches of precipitation per year.
Economy
White Hall’s economy is largely based on tourism and agriculture. The town is home to a number of small businesses, including restaurants, shops, and inns. The town also has a number of farms, which produce a variety of crops, including corn, soybeans, and wheat.
The town is also home to a number of manufacturing companies, including a plastics factory and a furniture factory. The town also has a number of small industrial parks, which are home to a variety of businesses.
Demographics
As of the 2010 census, White Hall had a population of 1,500 people. The town is predominantly white, with a small African American population. The median household income in White Hall is $37,000, and the median home value is $90,000. The town has a poverty rate of 15.5%, which is slightly higher than the national average.
White Hall is served by the Marion County Public Schools system. The town has one elementary school, one middle school, and one high school. The town also has a number of private schools, including a Catholic school and a Christian school.
White Hall is a small town with a rich history and a bright future. The town is home to a diverse population and a variety of businesses. The town is also a popular tourist destination, and is known for its scenic beauty and its proximity to the Monongahela River.
Common Questions
What is Per Capita Income in White Hall?
Per Capita income in White Hall is $35,840.
What is the Median Family Income in White Hall?
Median Family Income in White Hall is $84,583.
What is the Median Household income in White Hall?
Median Household Income in White Hall is $67,679.
What is Income or Wage Gap in White Hall?
Income or Wage Gap in White Hall is 8.3%.
Women in White Hall earn 91.7 cents for every dollar earned by a man.
What is Inequality or Gini Index in White Hall?
Inequality or Gini Index in White Hall is 0.36.
What is the Total Population of White Hall?
Total Population of White Hall is 1,025.
What is the Total Male Population of White Hall?
Total Male Population of White Hall is 562.
What is the Total Female Population of White Hall?
Total Female Population of White Hall is 463.
What is the Ratio of Males per 100 Females in White Hall?
There are 121.38 Males per 100 Females in White Hall.
What is the Ratio of Females per 100 Males in White Hall?
There are 82.38 Females per 100 Males in White Hall.
What is the Median Population Age in White Hall?
Median Population Age in White Hall is 35.2 Years.
What is the Average Family Size in White Hall
Average Family Size in White Hall is 3.4 People.
What is the Average Household Size in White Hall
Average Household Size in White Hall is 2.6 People.
How Large is the Labor Force in White Hall?
There are 547 People in the Labor Forcein in White Hall.
What is the Percentage of People in the Labor Force in White Hall?
69.9% of People are in the Labor Force in White Hall.
What is the Unemployment Rate in White Hall?
Unemployment Rate in White Hall is 5.0%.