Inwood, FL Map & Demographics
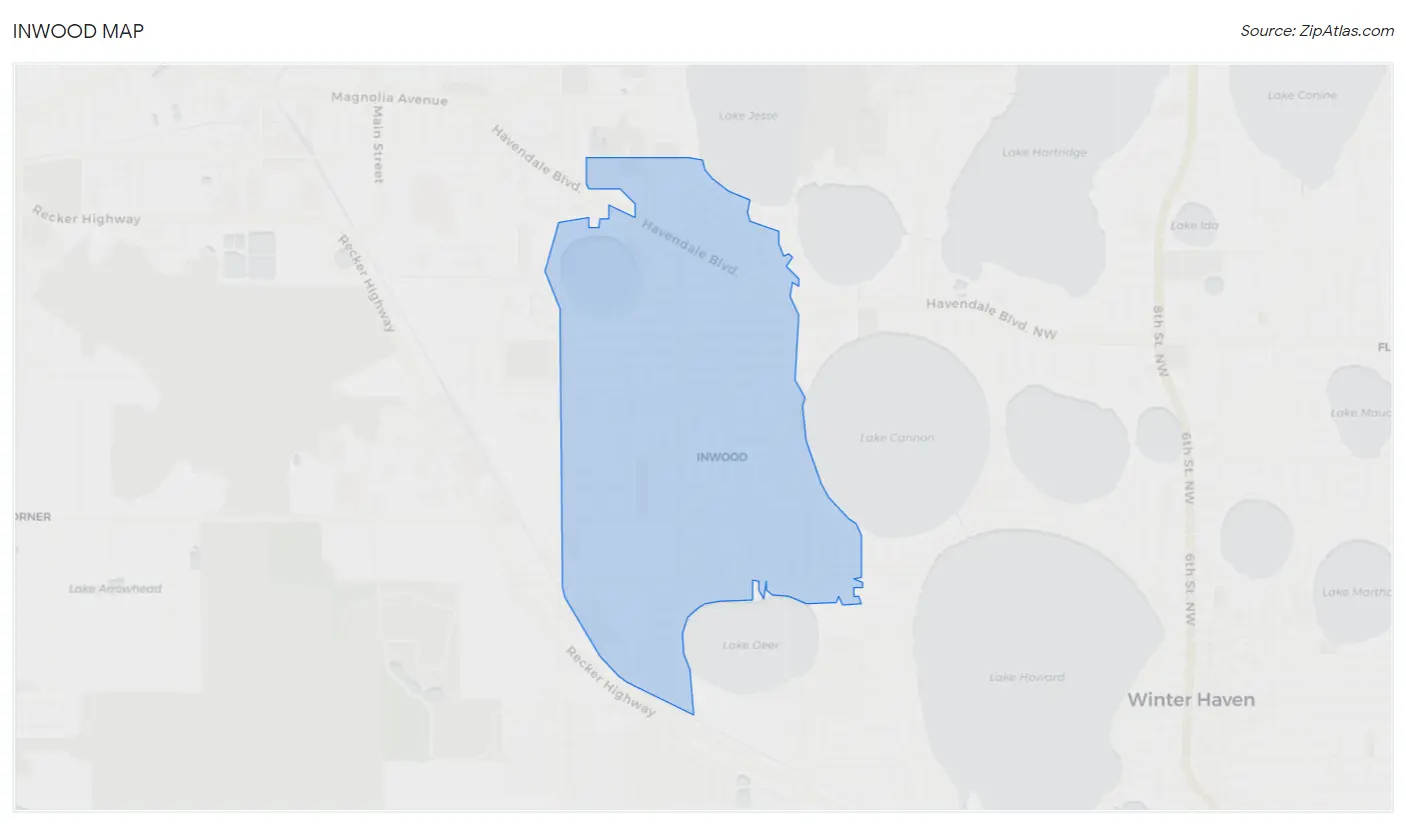
Inwood Map
Inwood Overview
$19,511
PER CAPITA INCOME
$34,916
AVG FAMILY INCOME
$34,815
AVG HOUSEHOLD INCOME
23.1%
WAGE / INCOME GAP [ % ]
76.9¢/ $1
WAGE / INCOME GAP [ $ ]
$8,952
FAMILY INCOME DEFICIT
0.46
INEQUALITY / GINI INDEX
7,054
TOTAL POPULATION
3,666
MALE POPULATION
3,388
FEMALE POPULATION
108.21
MALES / 100 FEMALES
92.42
FEMALES / 100 MALES
34.2
MEDIAN AGE
3.6
AVG FAMILY SIZE
3.0
AVG HOUSEHOLD SIZE
3,279
LABOR FORCE [ PEOPLE ]
60.8%
PERCENT IN LABOR FORCE
7.0%
UNEMPLOYMENT RATE
Income in Inwood
Income Overview in Inwood
Per Capita Income in Inwood is $19,511, while median incomes of families and households are $34,916 and $34,815 respectively.
| Characteristic | Number | Measure |
| Per Capita Income | 7,054 | $19,511 |
| Median Family Income | 1,597 | $34,916 |
| Mean Family Income | 1,597 | $53,002 |
| Median Household Income | 2,392 | $34,815 |
| Mean Household Income | 2,392 | $53,974 |
| Income Deficit | 1,597 | $8,952 |
| Wage / Income Gap (%) | 7,054 | 23.13% |
| Wage / Income Gap ($) | 7,054 | 76.87¢ per $1 |
| Gini / Inequality Index | 7,054 | 0.46 |
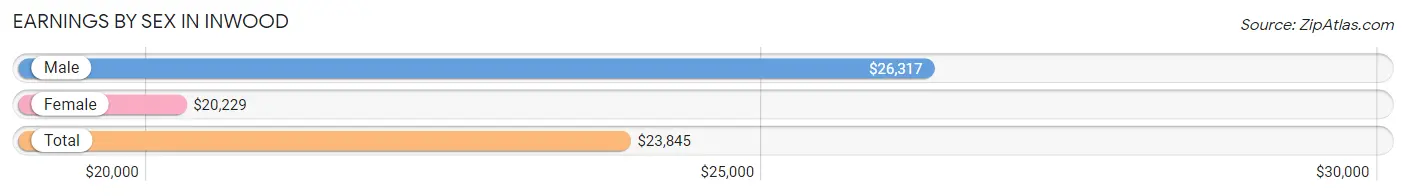
Earnings by Sex in Inwood
Average Earnings in Inwood are $23,845, $26,317 for men and $20,229 for women, a difference of 23.1%.
| Sex | Number | Average Earnings |
| Male | 1,883 (56.7%) | $26,317 |
| Female | 1,440 (43.3%) | $20,229 |
| Total | 3,323 (100.0%) | $23,845 |
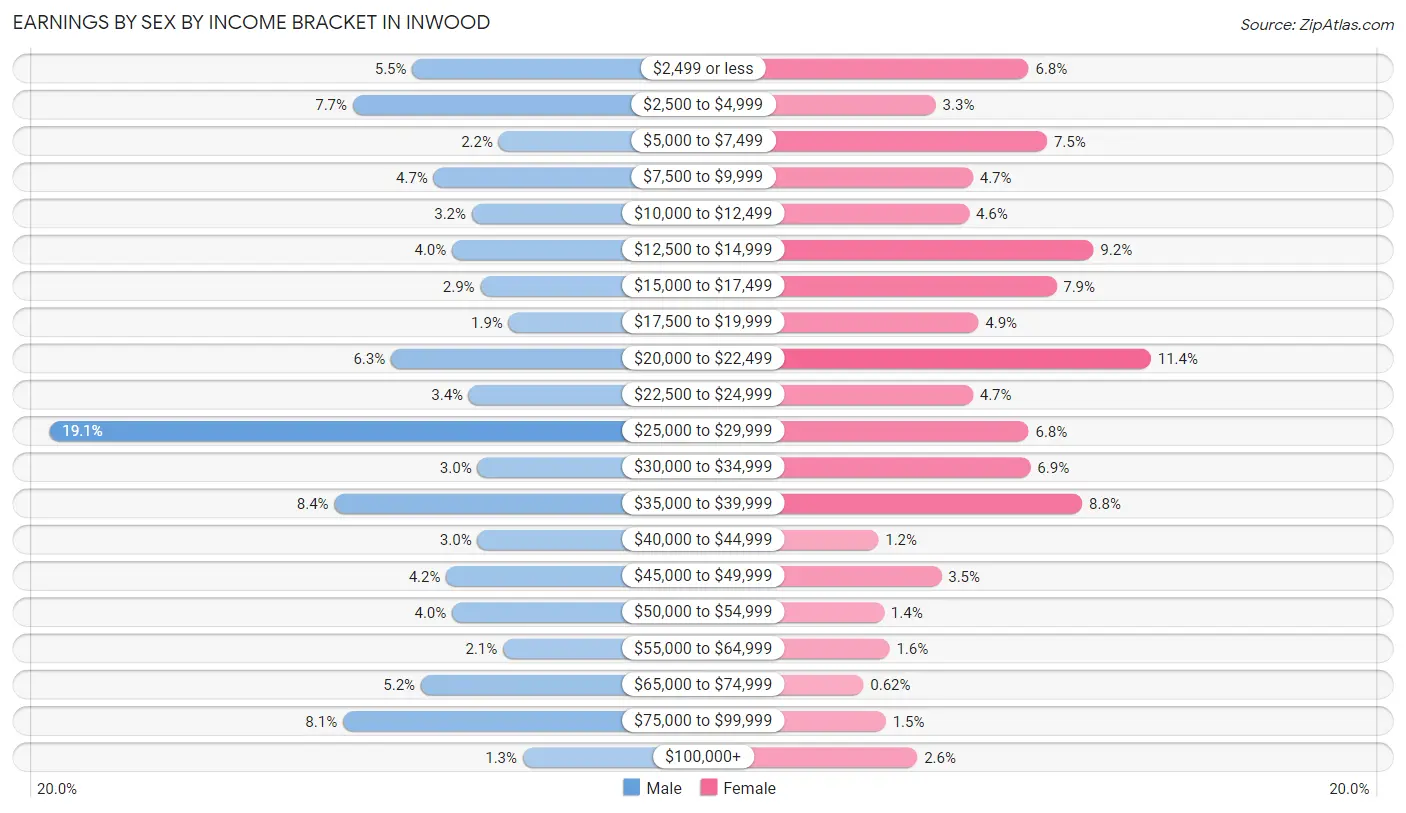
Earnings by Sex by Income Bracket in Inwood
The most common earnings brackets in Inwood are $25,000 to $29,999 for men (359 | 19.1%) and $20,000 to $22,499 for women (164 | 11.4%).
| Income | Male | Female |
| $2,499 or less | 103 (5.5%) | 98 (6.8%) |
| $2,500 to $4,999 | 145 (7.7%) | 48 (3.3%) |
| $5,000 to $7,499 | 42 (2.2%) | 108 (7.5%) |
| $7,500 to $9,999 | 88 (4.7%) | 68 (4.7%) |
| $10,000 to $12,499 | 61 (3.2%) | 66 (4.6%) |
| $12,500 to $14,999 | 75 (4.0%) | 133 (9.2%) |
| $15,000 to $17,499 | 55 (2.9%) | 113 (7.9%) |
| $17,500 to $19,999 | 35 (1.9%) | 71 (4.9%) |
| $20,000 to $22,499 | 118 (6.3%) | 164 (11.4%) |
| $22,500 to $24,999 | 63 (3.4%) | 68 (4.7%) |
| $25,000 to $29,999 | 359 (19.1%) | 98 (6.8%) |
| $30,000 to $34,999 | 57 (3.0%) | 99 (6.9%) |
| $35,000 to $39,999 | 158 (8.4%) | 127 (8.8%) |
| $40,000 to $44,999 | 57 (3.0%) | 17 (1.2%) |
| $45,000 to $49,999 | 79 (4.2%) | 51 (3.5%) |
| $50,000 to $54,999 | 75 (4.0%) | 20 (1.4%) |
| $55,000 to $64,999 | 39 (2.1%) | 23 (1.6%) |
| $65,000 to $74,999 | 97 (5.1%) | 9 (0.6%) |
| $75,000 to $99,999 | 152 (8.1%) | 21 (1.5%) |
| $100,000+ | 25 (1.3%) | 38 (2.6%) |
| Total | 1,883 (100.0%) | 1,440 (100.0%) |
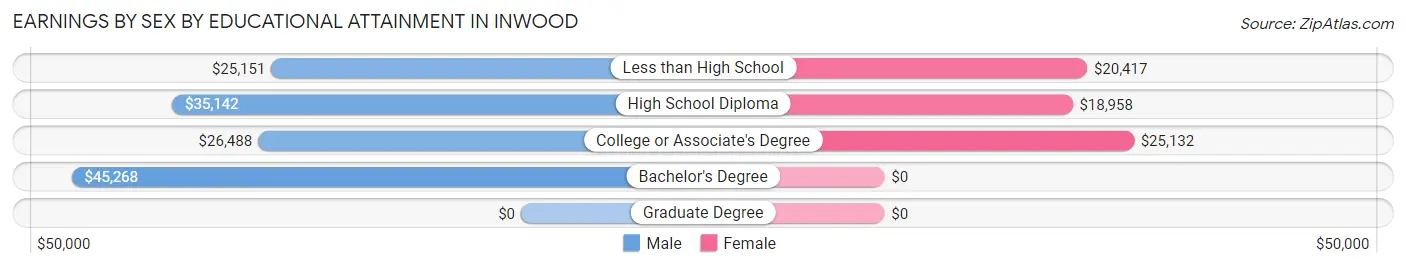
Earnings by Sex by Educational Attainment in Inwood
Average earnings in Inwood are $27,239 for men and $20,946 for women, a difference of 23.1%. Men with an educational attainment of bachelor's degree enjoy the highest average annual earnings of $45,268, while those with less than high school education earn the least with $25,151. Women with an educational attainment of college or associate's degree earn the most with the average annual earnings of $25,132, while those with high school diploma education have the smallest earnings of $18,958.
| Educational Attainment | Male Income | Female Income |
| Less than High School | $25,151 | $20,417 |
| High School Diploma | $35,142 | $18,958 |
| College or Associate's Degree | $26,488 | $25,132 |
| Bachelor's Degree | $45,268 | $0 |
| Graduate Degree | - | - |
| Total | $27,239 | $20,946 |
Family Income in Inwood
Family Income Brackets in Inwood
According to the Inwood family income data, there are 442 families falling into the $25,000 to $34,999 income range, which is the most common income bracket and makes up 27.7% of all families.
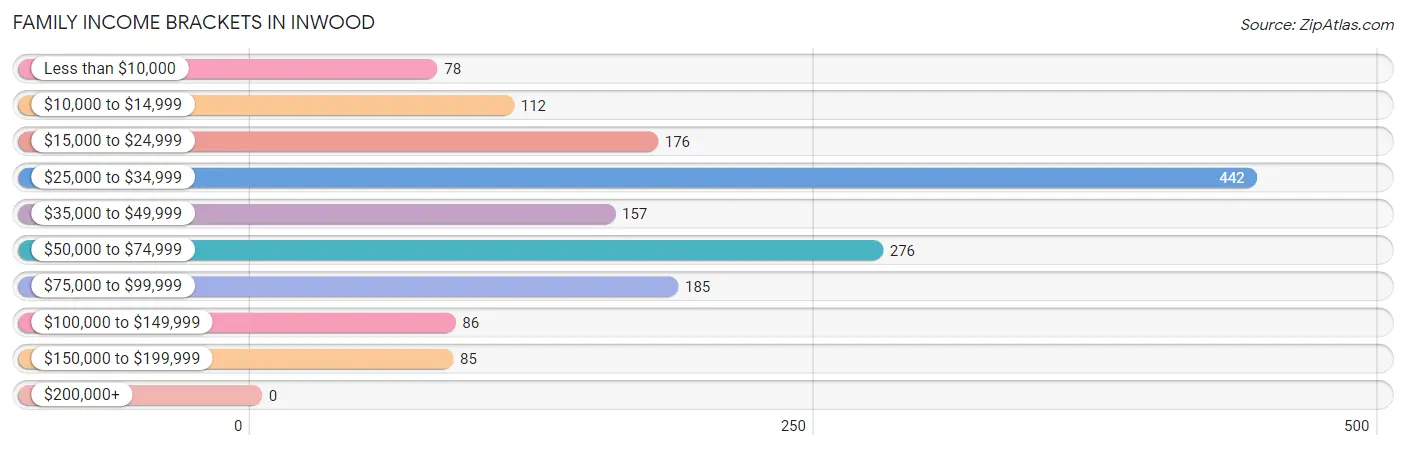
| Income Bracket | # Families | % Families |
| Less than $10,000 | 78 | 4.9% |
| $10,000 to $14,999 | 112 | 7.0% |
| $15,000 to $24,999 | 176 | 11.0% |
| $25,000 to $34,999 | 442 | 27.7% |
| $35,000 to $49,999 | 157 | 9.8% |
| $50,000 to $74,999 | 276 | 17.3% |
| $75,000 to $99,999 | 185 | 11.6% |
| $100,000 to $149,999 | 86 | 5.4% |
| $150,000 to $199,999 | 85 | 5.3% |
| $200,000+ | 0 | 0.0% |
Family Income by Famaliy Size in Inwood
7+ person families (70 | 4.4%) account for the highest median family income in Inwood with $73,974 per family, while 3-person families (236 | 14.8%) have the highest median income of $21,306 per family member.
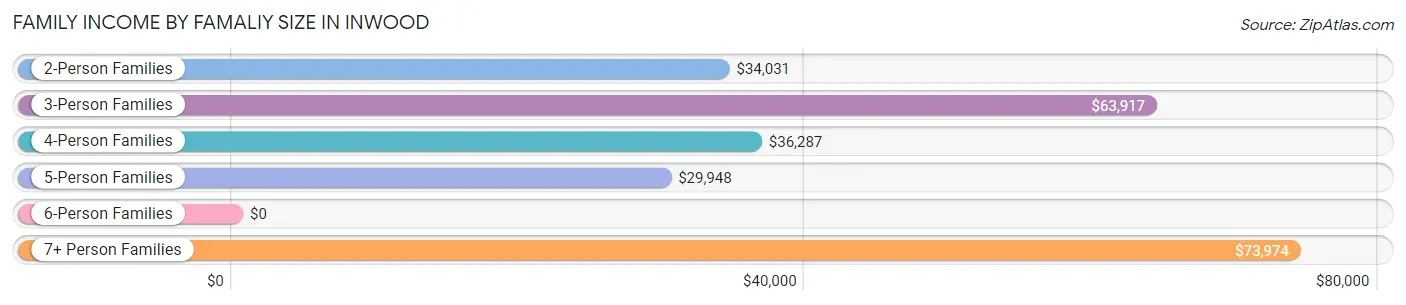
| Income Bracket | # Families | Median Income |
| 2-Person Families | 718 (45.0%) | $34,031 |
| 3-Person Families | 236 (14.8%) | $63,917 |
| 4-Person Families | 279 (17.5%) | $36,287 |
| 5-Person Families | 222 (13.9%) | $29,948 |
| 6-Person Families | 72 (4.5%) | $0 |
| 7+ Person Families | 70 (4.4%) | $73,974 |
| Total | 1,597 (100.0%) | $34,916 |
Family Income by Number of Earners in Inwood
The median family income in Inwood is $34,916, with families comprising 3+ earners (176) having the highest median family income of $72,750, while families with no earners (171) have the lowest median family income of $23,207, accounting for 11.0% and 10.7% of families, respectively.
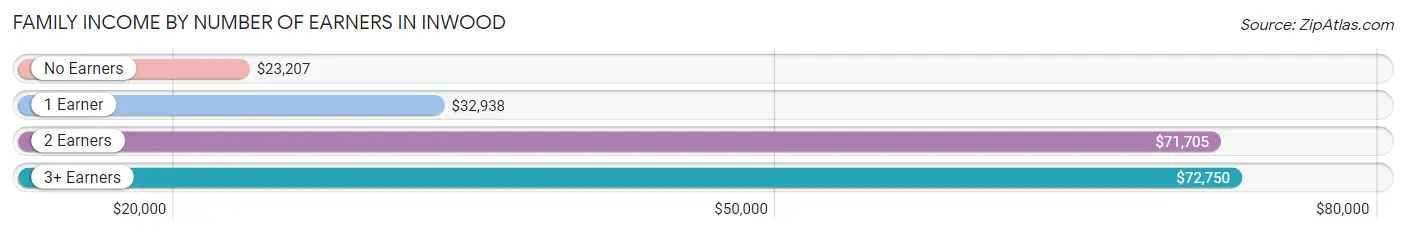
| Number of Earners | # Families | Median Income |
| No Earners | 171 (10.7%) | $23,207 |
| 1 Earner | 892 (55.8%) | $32,938 |
| 2 Earners | 358 (22.4%) | $71,705 |
| 3+ Earners | 176 (11.0%) | $72,750 |
| Total | 1,597 (100.0%) | $34,916 |
Household Income in Inwood
Household Income Brackets in Inwood
With 536 households falling in the category, the $25,000 to $34,999 income range is the most frequent in Inwood, accounting for 22.4% of all households. In contrast, only 10 households (0.4%) fall into the $200,000+ income bracket, making it the least populous group.
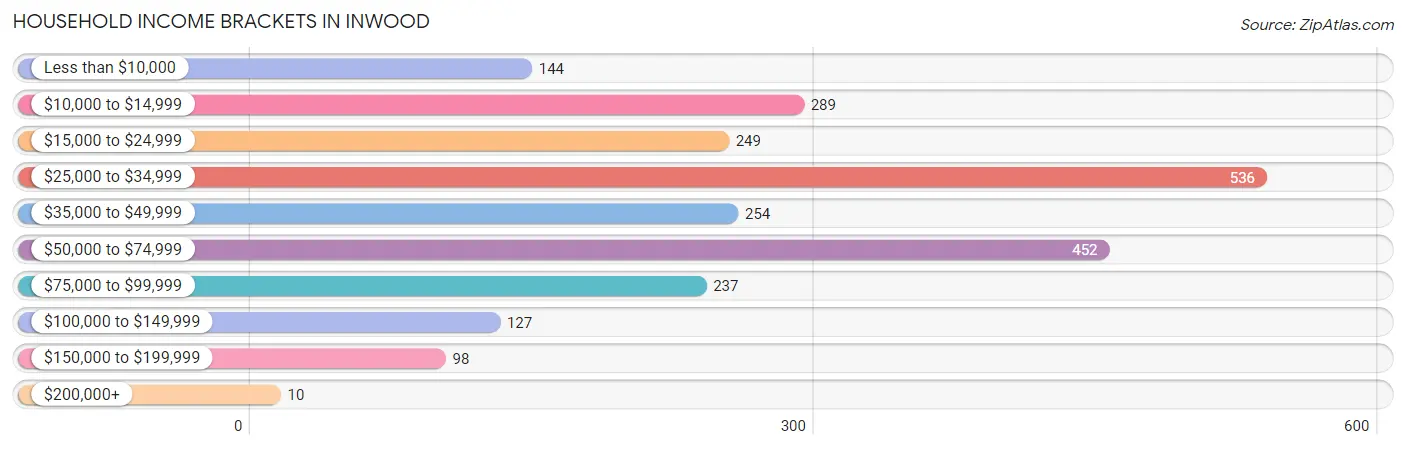
| Income Bracket | # Households | % Households |
| Less than $10,000 | 144 | 6.0% |
| $10,000 to $14,999 | 289 | 12.1% |
| $15,000 to $24,999 | 249 | 10.4% |
| $25,000 to $34,999 | 536 | 22.4% |
| $35,000 to $49,999 | 254 | 10.6% |
| $50,000 to $74,999 | 452 | 18.9% |
| $75,000 to $99,999 | 237 | 9.9% |
| $100,000 to $149,999 | 127 | 5.3% |
| $150,000 to $199,999 | 98 | 4.1% |
| $200,000+ | 10 | 0.4% |
Household Income by Householder Age in Inwood
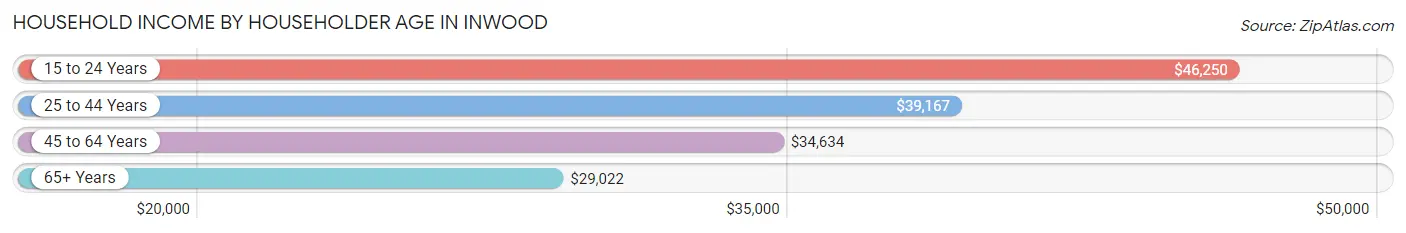
The median household income in Inwood is $34,815, with the highest median household income of $46,250 found in the 15 to 24 years age bracket for the primary householder. A total of 104 households (4.3%) fall into this category. Meanwhile, the 65+ years age bracket for the primary householder has the lowest median household income of $29,022, with 575 households (24.0%) in this group.
| Income Bracket | # Households | Median Income |
| 15 to 24 Years | 104 (4.3%) | $46,250 |
| 25 to 44 Years | 708 (29.6%) | $39,167 |
| 45 to 64 Years | 1,005 (42.0%) | $34,634 |
| 65+ Years | 575 (24.0%) | $29,022 |
| Total | 2,392 (100.0%) | $34,815 |
Poverty in Inwood
Income Below Poverty by Sex and Age in Inwood
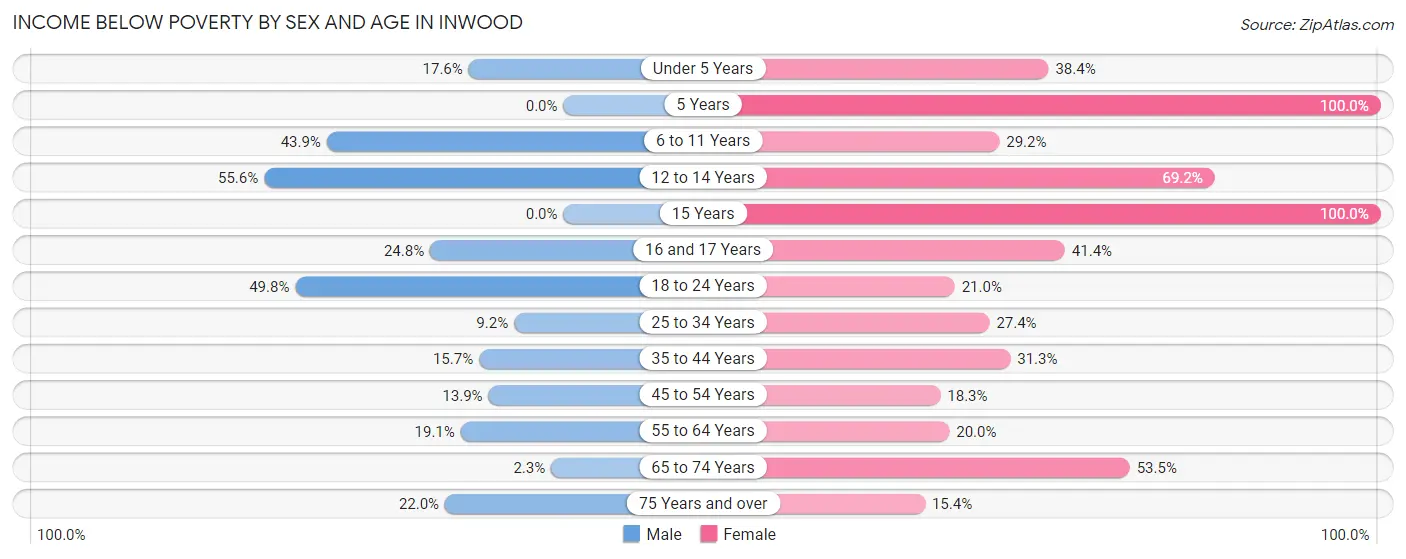
With 21.9% poverty level for males and 33.2% for females among the residents of Inwood, 12 to 14 year old males and 5 year old females are the most vulnerable to poverty, with 100 males (55.6%) and 5 females (100.0%) in their respective age groups living below the poverty level.
| Age Bracket | Male | Female |
| Under 5 Years | 64 (17.6%) | 33 (38.4%) |
| 5 Years | 0 (0.0%) | 5 (100.0%) |
| 6 to 11 Years | 105 (43.9%) | 76 (29.2%) |
| 12 to 14 Years | 100 (55.6%) | 173 (69.2%) |
| 15 Years | 0 (0.0%) | 111 (100.0%) |
| 16 and 17 Years | 25 (24.7%) | 53 (41.4%) |
| 18 to 24 Years | 212 (49.8%) | 74 (21.0%) |
| 25 to 34 Years | 45 (9.2%) | 125 (27.4%) |
| 35 to 44 Years | 65 (15.7%) | 142 (31.3%) |
| 45 to 54 Years | 64 (13.9%) | 86 (18.3%) |
| 55 to 64 Years | 98 (19.1%) | 78 (20.0%) |
| 65 to 74 Years | 5 (2.3%) | 147 (53.4%) |
| 75 Years and over | 20 (22.0%) | 23 (15.4%) |
| Total | 803 (21.9%) | 1,126 (33.2%) |
Income Above Poverty by Sex and Age in Inwood
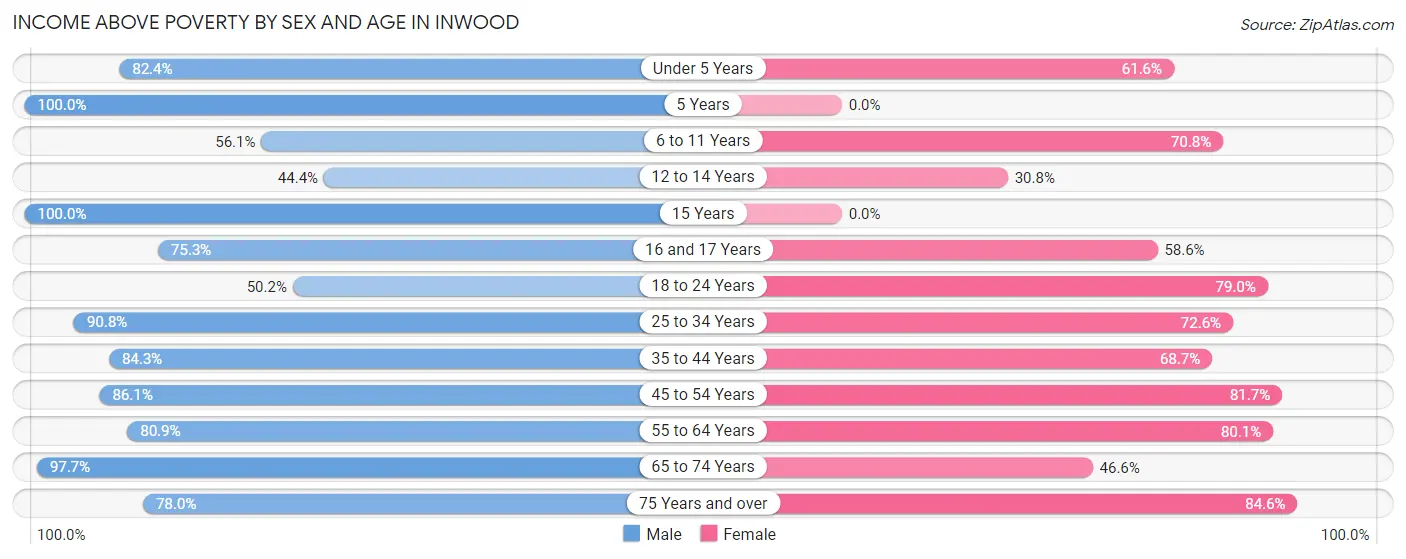
According to the poverty statistics in Inwood, males aged 5 years and females aged 75 years and over are the age groups that are most secure financially, with 100.0% of males and 84.6% of females in these age groups living above the poverty line.
| Age Bracket | Male | Female |
| Under 5 Years | 300 (82.4%) | 53 (61.6%) |
| 5 Years | 80 (100.0%) | 0 (0.0%) |
| 6 to 11 Years | 134 (56.1%) | 184 (70.8%) |
| 12 to 14 Years | 80 (44.4%) | 77 (30.8%) |
| 15 Years | 86 (100.0%) | 0 (0.0%) |
| 16 and 17 Years | 76 (75.2%) | 75 (58.6%) |
| 18 to 24 Years | 214 (50.2%) | 279 (79.0%) |
| 25 to 34 Years | 446 (90.8%) | 331 (72.6%) |
| 35 to 44 Years | 350 (84.3%) | 312 (68.7%) |
| 45 to 54 Years | 396 (86.1%) | 384 (81.7%) |
| 55 to 64 Years | 416 (80.9%) | 313 (80.0%) |
| 65 to 74 Years | 214 (97.7%) | 128 (46.6%) |
| 75 Years and over | 71 (78.0%) | 126 (84.6%) |
| Total | 2,863 (78.1%) | 2,262 (66.8%) |
Income Below Poverty Among Married-Couple Families in Inwood
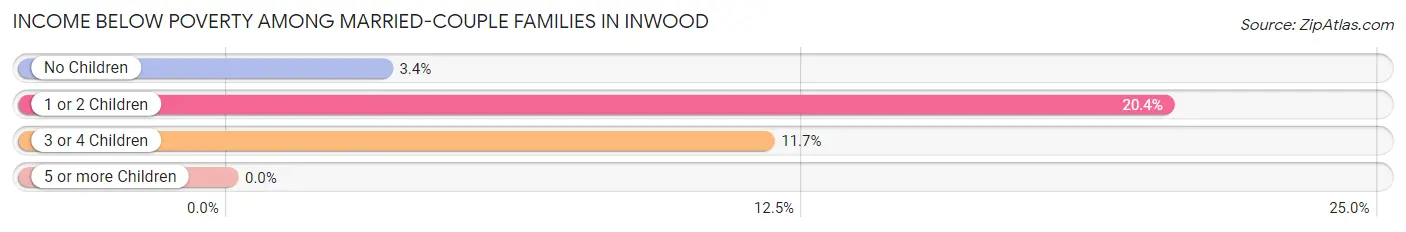
The poverty statistics for married-couple families in Inwood show that 9.0% or 88 of the total 981 families live below the poverty line. Families with 1 or 2 children have the highest poverty rate of 20.4%, comprising of 54 families. On the other hand, families with no children have the lowest poverty rate of 3.4%, which includes 20 families.
| Children | Above Poverty | Below Poverty |
| No Children | 576 (96.6%) | 20 (3.4%) |
| 1 or 2 Children | 211 (79.6%) | 54 (20.4%) |
| 3 or 4 Children | 106 (88.3%) | 14 (11.7%) |
| 5 or more Children | 0 (0.0%) | 0 (0.0%) |
| Total | 893 (91.0%) | 88 (9.0%) |
Income Below Poverty Among Single-Parent Households in Inwood
According to the poverty data in Inwood, 37.7% or 49 single-father households and 60.9% or 296 single-mother households are living below the poverty line. Among single-father households, those with 3 or 4 children have the highest poverty rate, with 25 households (100.0%) experiencing poverty. Likewise, among single-mother households, those with 3 or 4 children have the highest poverty rate, with 132 households (88.0%) falling below the poverty line.
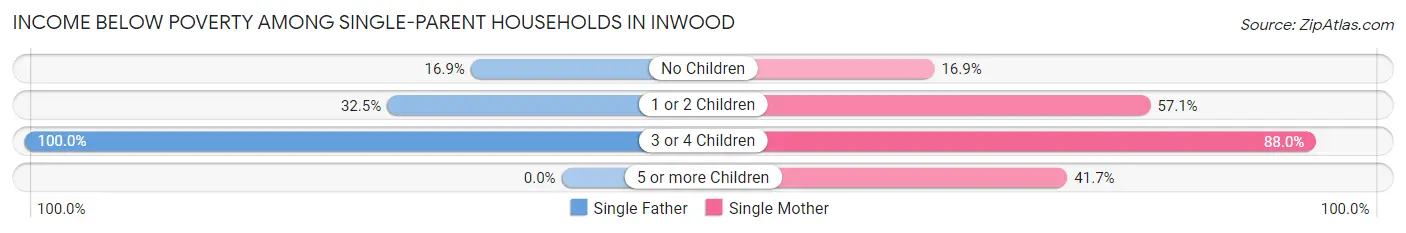
| Children | Single Father | Single Mother |
| No Children | 11 (16.9%) | 11 (16.9%) |
| 1 or 2 Children | 13 (32.5%) | 148 (57.1%) |
| 3 or 4 Children | 25 (100.0%) | 132 (88.0%) |
| 5 or more Children | 0 (0.0%) | 5 (41.7%) |
| Total | 49 (37.7%) | 296 (60.9%) |
Income Below Poverty Among Married-Couple vs Single-Parent Households in Inwood
The poverty data for Inwood shows that 88 of the married-couple family households (9.0%) and 345 of the single-parent households (56.0%) are living below the poverty level. Within the married-couple family households, those with 1 or 2 children have the highest poverty rate, with 54 households (20.4%) falling below the poverty line. Among the single-parent households, those with 3 or 4 children have the highest poverty rate, with 157 household (89.7%) living below poverty.
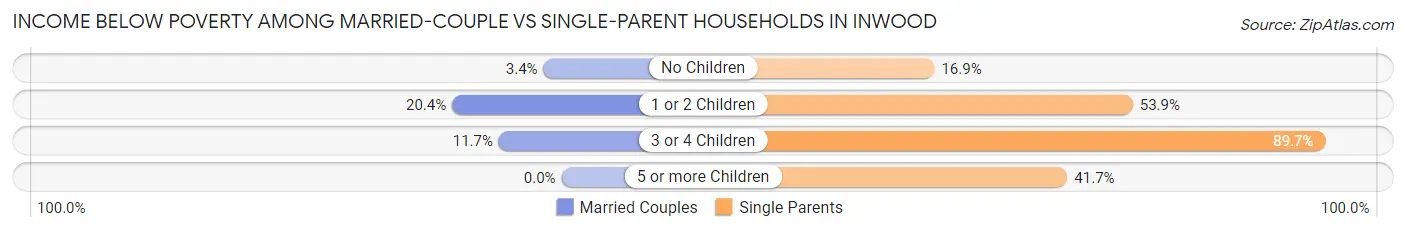
| Children | Married-Couple Families | Single-Parent Households |
| No Children | 20 (3.4%) | 22 (16.9%) |
| 1 or 2 Children | 54 (20.4%) | 161 (53.8%) |
| 3 or 4 Children | 14 (11.7%) | 157 (89.7%) |
| 5 or more Children | 0 (0.0%) | 5 (41.7%) |
| Total | 88 (9.0%) | 345 (56.0%) |
Race in Inwood
The most populous races in Inwood are White / Caucasian (2,942 | 41.7%), Black / African American (2,185 | 31.0%), and Hispanic or Latino (1,893 | 26.8%).
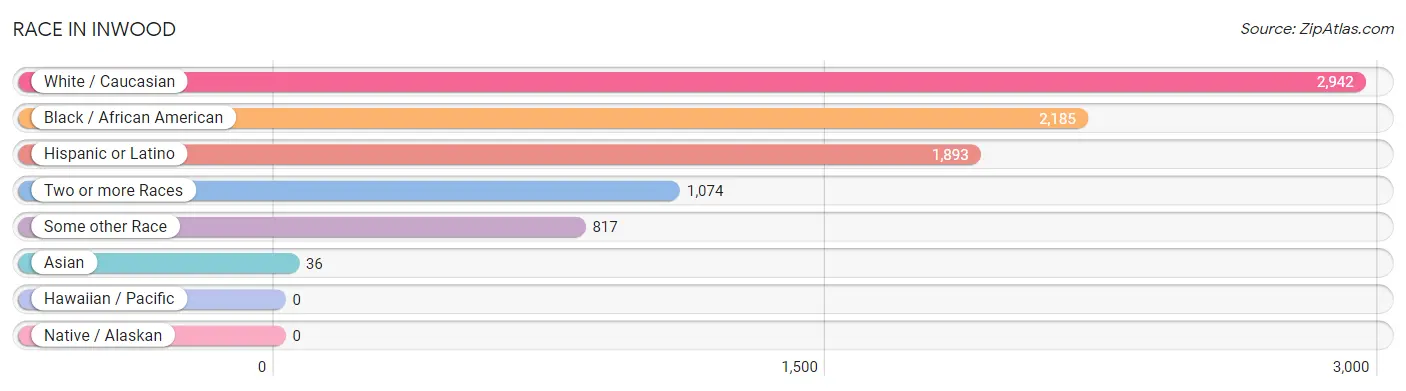
| Race | # Population | % Population |
| Asian | 36 | 0.5% |
| Black / African American | 2,185 | 31.0% |
| Hawaiian / Pacific | 0 | 0.0% |
| Hispanic or Latino | 1,893 | 26.8% |
| Native / Alaskan | 0 | 0.0% |
| White / Caucasian | 2,942 | 41.7% |
| Two or more Races | 1,074 | 15.2% |
| Some other Race | 817 | 11.6% |
| Total | 7,054 | 100.0% |
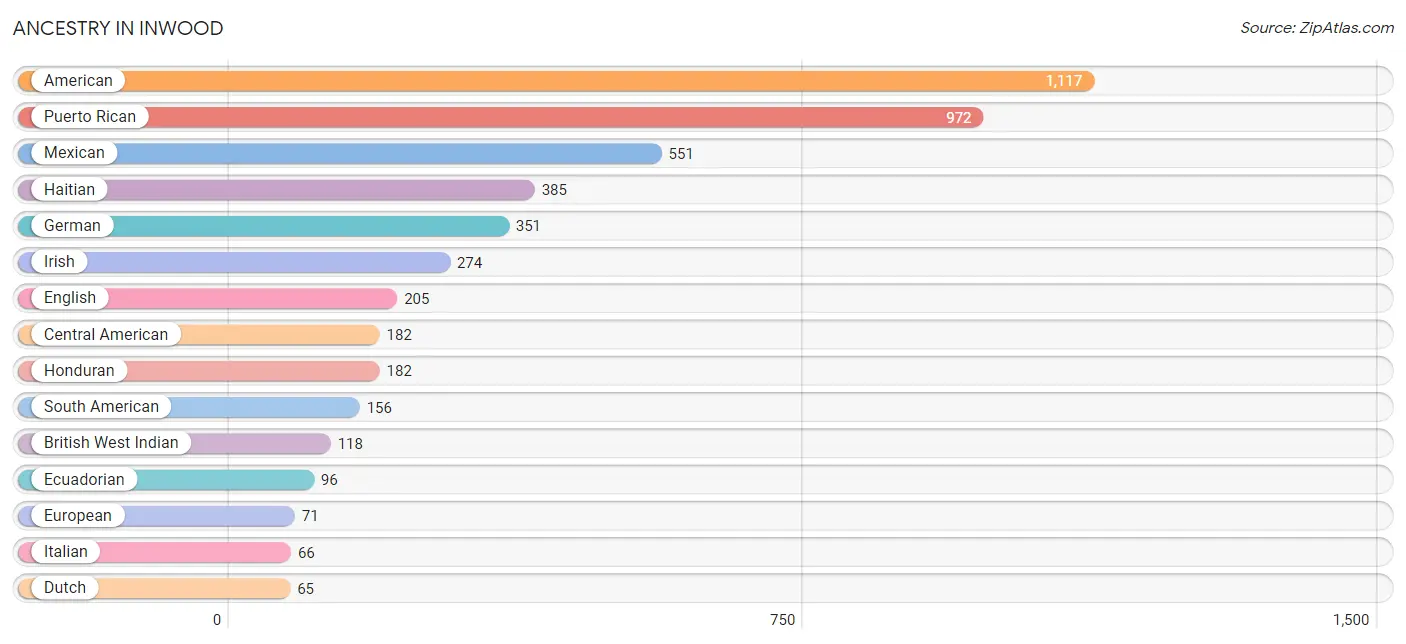
Ancestry in Inwood
The most populous ancestries reported in Inwood are American (1,117 | 15.8%), Puerto Rican (972 | 13.8%), Mexican (551 | 7.8%), Haitian (385 | 5.5%), and German (351 | 5.0%), together accounting for 47.9% of all Inwood residents.
| Ancestry | # Population | % Population |
| American | 1,117 | 15.8% |
| Argentinean | 9 | 0.1% |
| British | 11 | 0.2% |
| British West Indian | 118 | 1.7% |
| Burmese | 36 | 0.5% |
| Canadian | 29 | 0.4% |
| Central American | 182 | 2.6% |
| Colombian | 39 | 0.5% |
| Danish | 37 | 0.5% |
| Dominican | 13 | 0.2% |
| Dutch | 65 | 0.9% |
| Ecuadorian | 96 | 1.4% |
| English | 205 | 2.9% |
| European | 71 | 1.0% |
| French | 30 | 0.4% |
| French Canadian | 11 | 0.2% |
| German | 351 | 5.0% |
| Guyanese | 40 | 0.6% |
| Haitian | 385 | 5.5% |
| Honduran | 182 | 2.6% |
| Irish | 274 | 3.9% |
| Italian | 66 | 0.9% |
| Jamaican | 57 | 0.8% |
| Korean | 32 | 0.4% |
| Mexican | 551 | 7.8% |
| Polish | 21 | 0.3% |
| Puerto Rican | 972 | 13.8% |
| Scottish | 52 | 0.7% |
| South American | 156 | 2.2% |
| Spanish | 19 | 0.3% |
| Swedish | 14 | 0.2% |
| Uruguayan | 12 | 0.2% | View All 32 Rows |
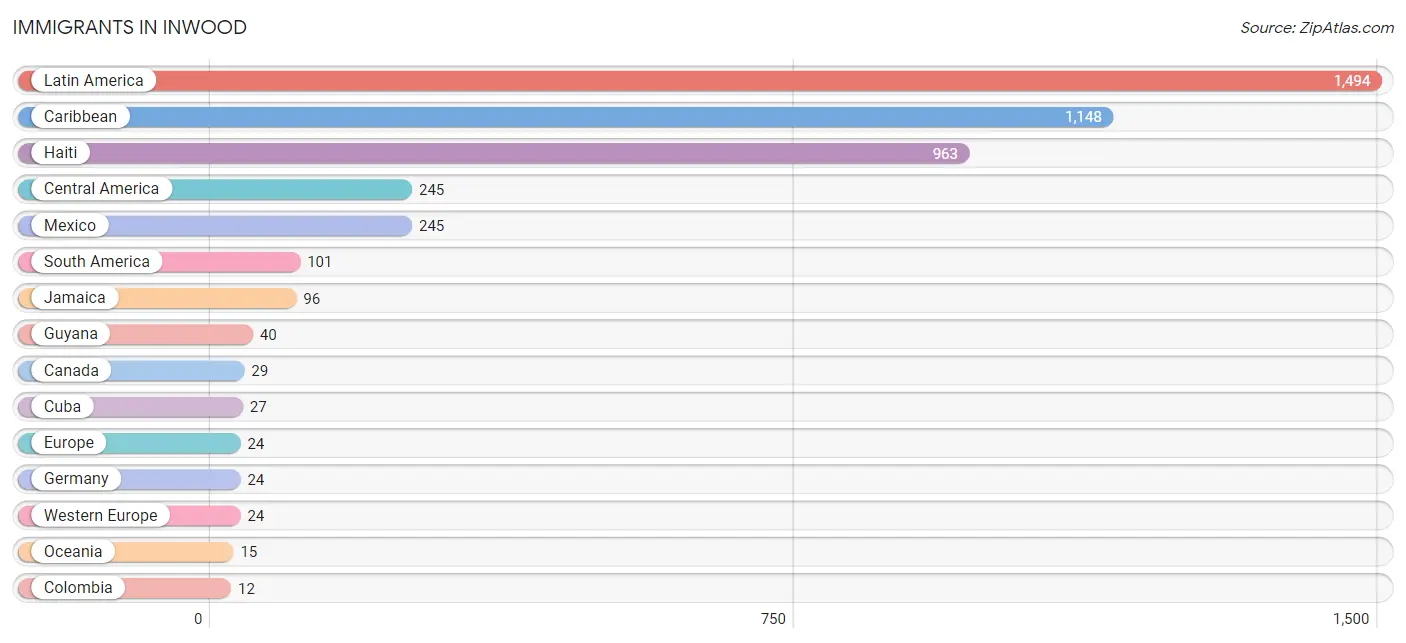
Immigrants in Inwood
The most numerous immigrant groups reported in Inwood came from Latin America (1,494 | 21.2%), Caribbean (1,148 | 16.3%), Haiti (963 | 13.7%), Central America (245 | 3.5%), and Mexico (245 | 3.5%), together accounting for 58.0% of all Inwood residents.
| Immigration Origin | # Population | % Population |
| Argentina | 9 | 0.1% |
| Asia | 11 | 0.2% |
| Canada | 29 | 0.4% |
| Caribbean | 1,148 | 16.3% |
| Central America | 245 | 3.5% |
| Colombia | 12 | 0.2% |
| Cuba | 27 | 0.4% |
| Dominican Republic | 6 | 0.1% |
| Eastern Asia | 11 | 0.2% |
| Europe | 24 | 0.3% |
| Germany | 24 | 0.3% |
| Guyana | 40 | 0.6% |
| Haiti | 963 | 13.7% |
| Jamaica | 96 | 1.4% |
| Korea | 11 | 0.2% |
| Latin America | 1,494 | 21.2% |
| Mexico | 245 | 3.5% |
| Oceania | 15 | 0.2% |
| South America | 101 | 1.4% |
| Uruguay | 12 | 0.2% |
| Western Europe | 24 | 0.3% | View All 21 Rows |
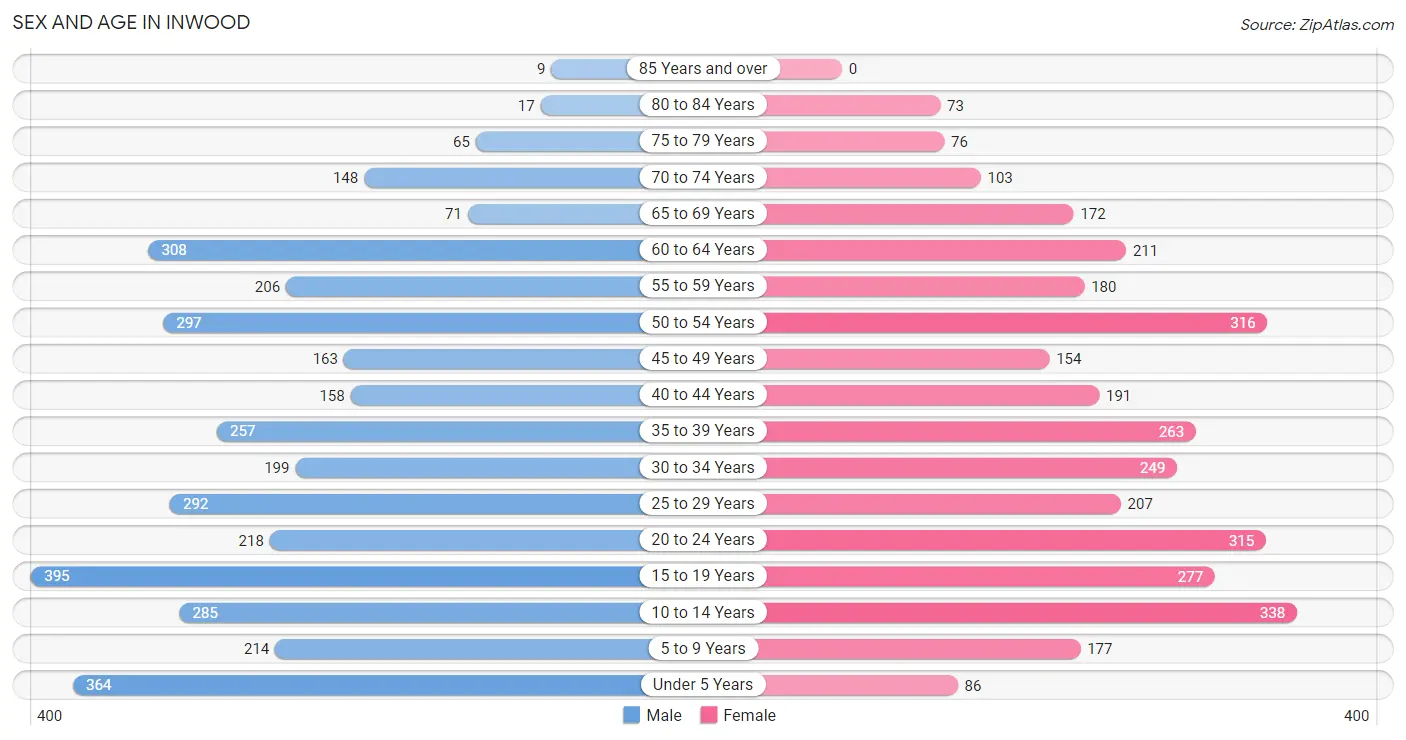
Sex and Age in Inwood
Sex and Age in Inwood
The most populous age groups in Inwood are 15 to 19 Years (395 | 10.8%) for men and 10 to 14 Years (338 | 10.0%) for women.
| Age Bracket | Male | Female |
| Under 5 Years | 364 (9.9%) | 86 (2.5%) |
| 5 to 9 Years | 214 (5.8%) | 177 (5.2%) |
| 10 to 14 Years | 285 (7.8%) | 338 (10.0%) |
| 15 to 19 Years | 395 (10.8%) | 277 (8.2%) |
| 20 to 24 Years | 218 (5.9%) | 315 (9.3%) |
| 25 to 29 Years | 292 (8.0%) | 207 (6.1%) |
| 30 to 34 Years | 199 (5.4%) | 249 (7.3%) |
| 35 to 39 Years | 257 (7.0%) | 263 (7.8%) |
| 40 to 44 Years | 158 (4.3%) | 191 (5.6%) |
| 45 to 49 Years | 163 (4.4%) | 154 (4.5%) |
| 50 to 54 Years | 297 (8.1%) | 316 (9.3%) |
| 55 to 59 Years | 206 (5.6%) | 180 (5.3%) |
| 60 to 64 Years | 308 (8.4%) | 211 (6.2%) |
| 65 to 69 Years | 71 (1.9%) | 172 (5.1%) |
| 70 to 74 Years | 148 (4.0%) | 103 (3.0%) |
| 75 to 79 Years | 65 (1.8%) | 76 (2.2%) |
| 80 to 84 Years | 17 (0.5%) | 73 (2.1%) |
| 85 Years and over | 9 (0.3%) | 0 (0.0%) |
| Total | 3,666 (100.0%) | 3,388 (100.0%) |
Families and Households in Inwood
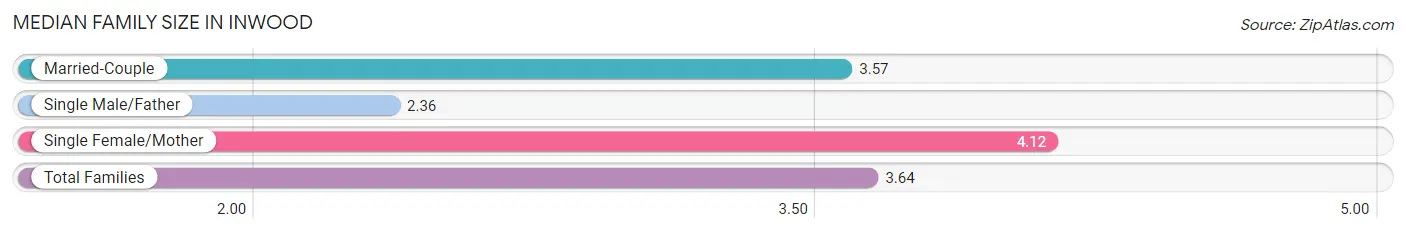
Median Family Size in Inwood
The median family size in Inwood is 3.64 persons per family, with single female/mother families (486 | 30.4%) accounting for the largest median family size of 4.12 persons per family. On the other hand, single male/father families (130 | 8.1%) represent the smallest median family size with 2.36 persons per family.
| Family Type | # Families | Family Size |
| Married-Couple | 981 (61.4%) | 3.57 |
| Single Male/Father | 130 (8.1%) | 2.36 |
| Single Female/Mother | 486 (30.4%) | 4.12 |
| Total Families | 1,597 (100.0%) | 3.64 |
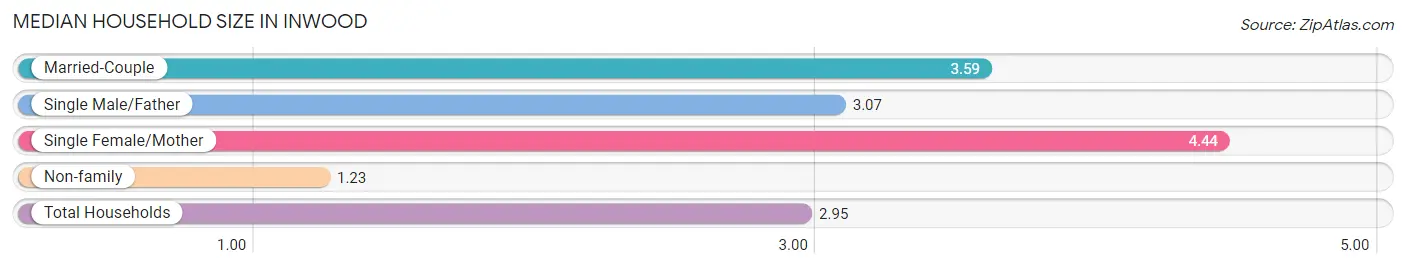
Median Household Size in Inwood
The median household size in Inwood is 2.95 persons per household, with single female/mother households (486 | 20.3%) accounting for the largest median household size of 4.44 persons per household. non-family households (795 | 33.2%) represent the smallest median household size with 1.23 persons per household.
| Household Type | # Households | Household Size |
| Married-Couple | 981 (41.0%) | 3.59 |
| Single Male/Father | 130 (5.4%) | 3.07 |
| Single Female/Mother | 486 (20.3%) | 4.44 |
| Non-family | 795 (33.2%) | 1.23 |
| Total Households | 2,392 (100.0%) | 2.95 |
Household Size by Marriage Status in Inwood
Out of a total of 2,392 households in Inwood, 1,597 (66.8%) are family households, while 795 (33.2%) are nonfamily households. The most numerous type of family households are 2-person households, comprising 618, and the most common type of nonfamily households are 1-person households, comprising 676.
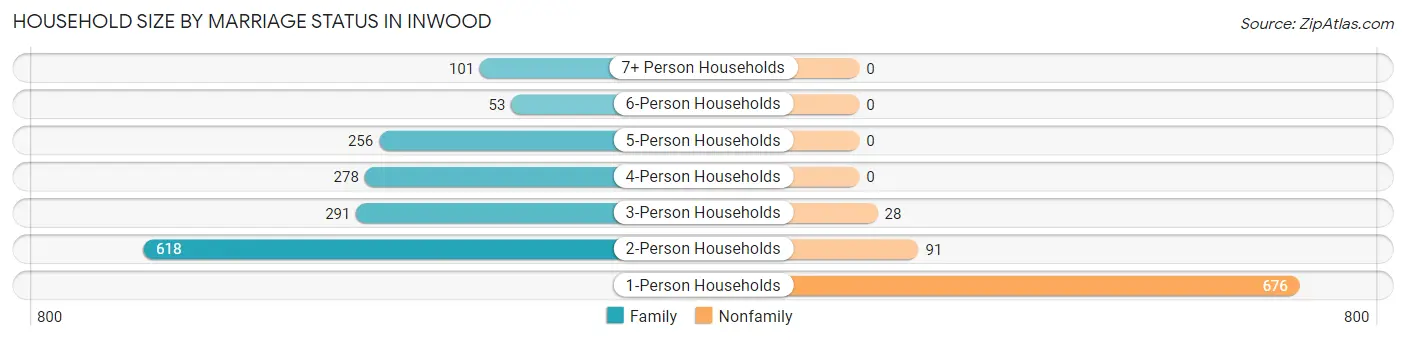
| Household Size | Family Households | Nonfamily Households |
| 1-Person Households | - | 676 (28.3%) |
| 2-Person Households | 618 (25.8%) | 91 (3.8%) |
| 3-Person Households | 291 (12.2%) | 28 (1.2%) |
| 4-Person Households | 278 (11.6%) | 0 (0.0%) |
| 5-Person Households | 256 (10.7%) | 0 (0.0%) |
| 6-Person Households | 53 (2.2%) | 0 (0.0%) |
| 7+ Person Households | 101 (4.2%) | 0 (0.0%) |
| Total | 1,597 (66.8%) | 795 (33.2%) |
Female Fertility in Inwood
Fertility by Age in Inwood
Average fertility rate in Inwood is 43.0 births per 1,000 women. Women in the age bracket of 15 to 19 years have the highest fertility rate with 47.0 births per 1,000 women. Women in the age bracket of 20 to 34 years acount for 43.1% of all women with births.
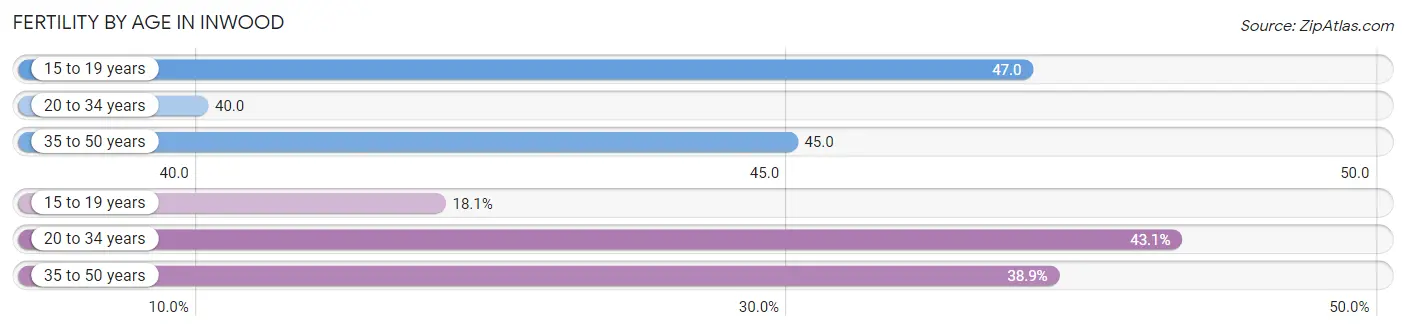
| Age Bracket | Women with Births | Births / 1,000 Women |
| 15 to 19 years | 13 (18.1%) | 47.0 |
| 20 to 34 years | 31 (43.1%) | 40.0 |
| 35 to 50 years | 28 (38.9%) | 45.0 |
| Total | 72 (100.0%) | 43.0 |
Fertility by Age by Marriage Status in Inwood
81.9% of women with births (72) in Inwood are married. The highest percentage of unmarried women with births falls into 15 to 19 years age bracket with 100.0% of them unmarried at the time of birth, while the lowest percentage of unmarried women with births belong to 20 to 34 years age bracket with 0.0% of them unmarried.
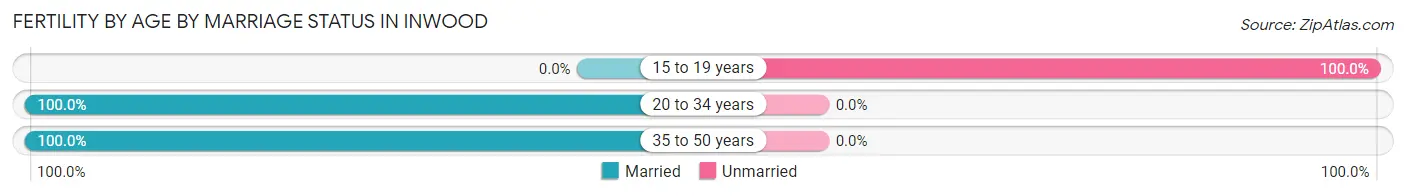
| Age Bracket | Married | Unmarried |
| 15 to 19 years | 0 (0.0%) | 13 (100.0%) |
| 20 to 34 years | 31 (100.0%) | 0 (0.0%) |
| 35 to 50 years | 28 (100.0%) | 0 (0.0%) |
| Total | 59 (81.9%) | 13 (18.1%) |
Fertility by Education in Inwood
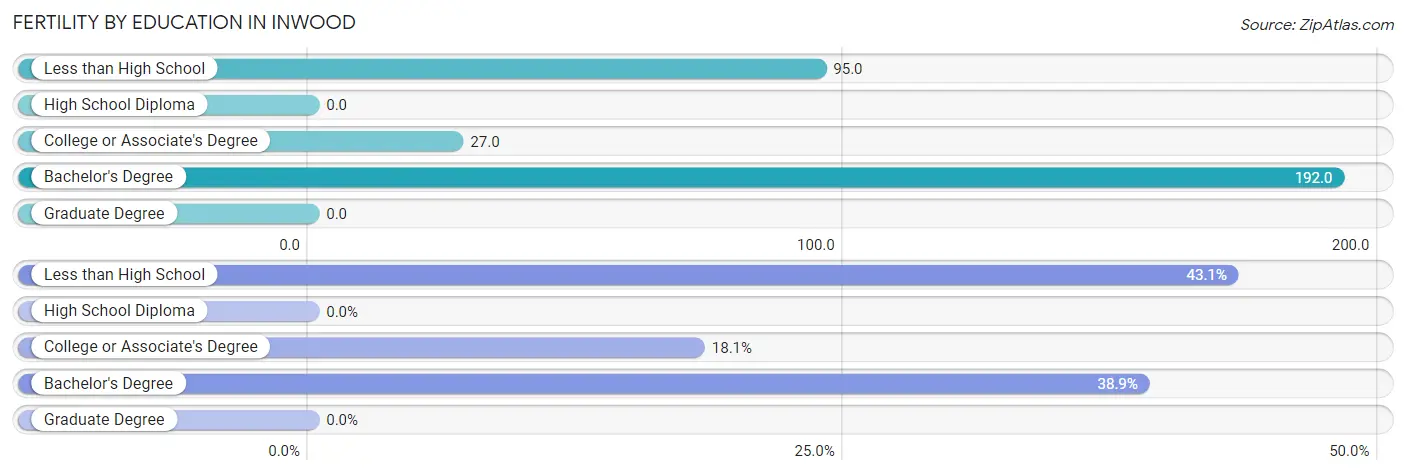
| Educational Attainment | Women with Births | Births / 1,000 Women |
| Less than High School | 31 (43.1%) | 95.0 |
| High School Diploma | 0 (0.0%) | 0.0 |
| College or Associate's Degree | 13 (18.1%) | 27.0 |
| Bachelor's Degree | 28 (38.9%) | 192.0 |
| Graduate Degree | 0 (0.0%) | 0.0 |
| Total | 72 (100.0%) | 43.0 |
Fertility by Education by Marriage Status in Inwood
18.1% of women with births in Inwood are unmarried. Women with the educational attainment of less than high school are most likely to be married with 100.0% of them married at childbirth, while women with the educational attainment of college or associate's degree are least likely to be married with 100.0% of them unmarried at childbirth.
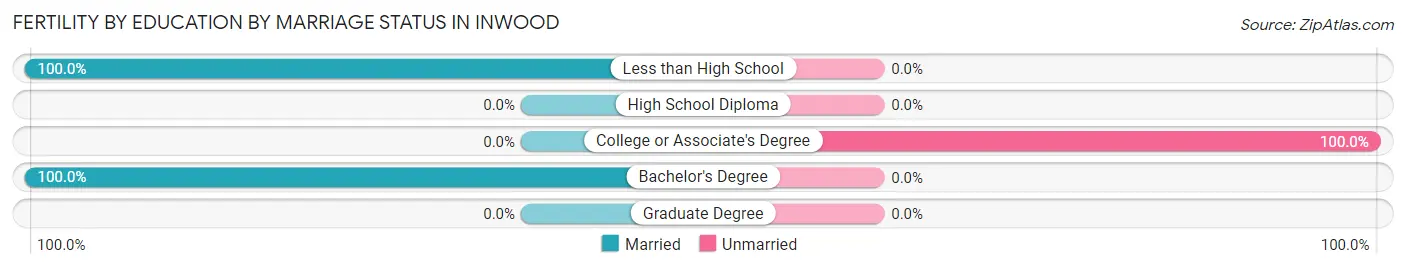
| Educational Attainment | Married | Unmarried |
| Less than High School | 31 (100.0%) | 0 (0.0%) |
| High School Diploma | 0 (0.0%) | 0 (0.0%) |
| College or Associate's Degree | 0 (0.0%) | 13 (100.0%) |
| Bachelor's Degree | 28 (100.0%) | 0 (0.0%) |
| Graduate Degree | 0 (0.0%) | 0 (0.0%) |
| Total | 59 (81.9%) | 13 (18.1%) |
Employment Characteristics in Inwood
Employment by Class of Employer in Inwood
Among the 2,989 employed individuals in Inwood, private company employees (2,396 | 80.2%), local government employees (252 | 8.4%), and self-employed (not incorporated) (165 | 5.5%) make up the most common classes of employment.
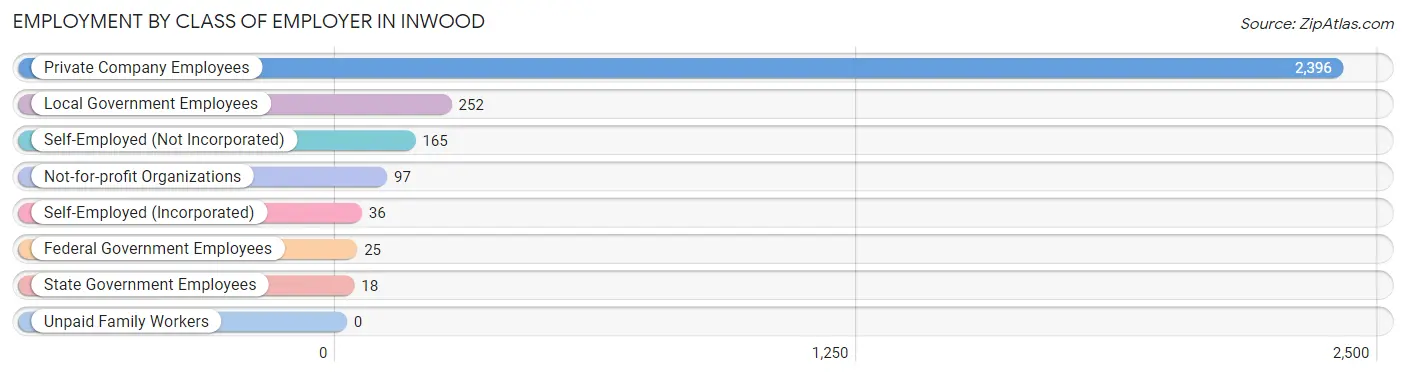
| Employer Class | # Employees | % Employees |
| Private Company Employees | 2,396 | 80.2% |
| Self-Employed (Incorporated) | 36 | 1.2% |
| Self-Employed (Not Incorporated) | 165 | 5.5% |
| Not-for-profit Organizations | 97 | 3.3% |
| Local Government Employees | 252 | 8.4% |
| State Government Employees | 18 | 0.6% |
| Federal Government Employees | 25 | 0.8% |
| Unpaid Family Workers | 0 | 0.0% |
| Total | 2,989 | 100.0% |
Employment Status by Age in Inwood
According to the labor force statistics for Inwood, out of the total population over 16 years of age (5,393), 60.8% or 3,279 individuals are in the labor force, with 7.0% or 230 of them unemployed. The age group with the highest labor force participation rate is 30 to 34 years, with 93.5% or 419 individuals in the labor force. Within the labor force, the 30 to 34 years age range has the highest percentage of unemployed individuals, with 17.9% or 75 of them being unemployed.
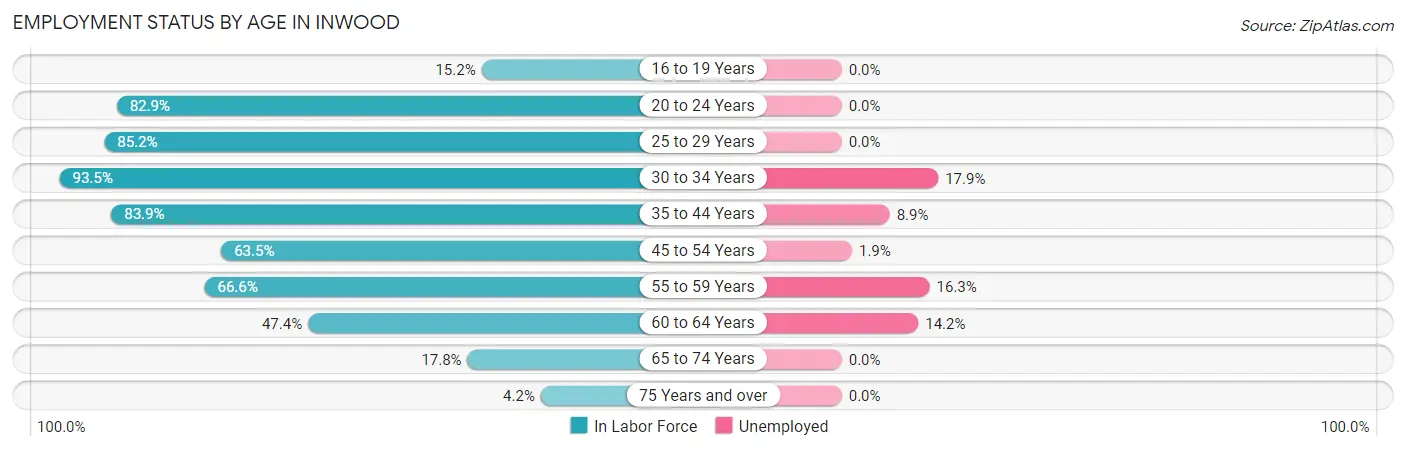
| Age Bracket | In Labor Force | Unemployed |
| 16 to 19 Years | 72 (15.2%) | 0 (0.0%) |
| 20 to 24 Years | 442 (82.9%) | 0 (0.0%) |
| 25 to 29 Years | 425 (85.2%) | 0 (0.0%) |
| 30 to 34 Years | 419 (93.5%) | 75 (17.9%) |
| 35 to 44 Years | 729 (83.9%) | 65 (8.9%) |
| 45 to 54 Years | 591 (63.5%) | 11 (1.9%) |
| 55 to 59 Years | 257 (66.6%) | 42 (16.3%) |
| 60 to 64 Years | 246 (47.4%) | 35 (14.2%) |
| 65 to 74 Years | 88 (17.8%) | 0 (0.0%) |
| 75 Years and over | 10 (4.2%) | 0 (0.0%) |
| Total | 3,279 (60.8%) | 230 (7.0%) |
Employment Status by Educational Attainment in Inwood
According to labor force statistics for Inwood, 73.0% of individuals (2,665) out of the total population between 25 and 64 years of age (3,651) are in the labor force, with 8.5% or 227 of them being unemployed. The group with the highest labor force participation rate are those with the educational attainment of bachelor's degree or higher, with 86.8% or 270 individuals in the labor force. Within the labor force, individuals with less than high school education have the highest percentage of unemployment, with 20.7% or 91 of them being unemployed.
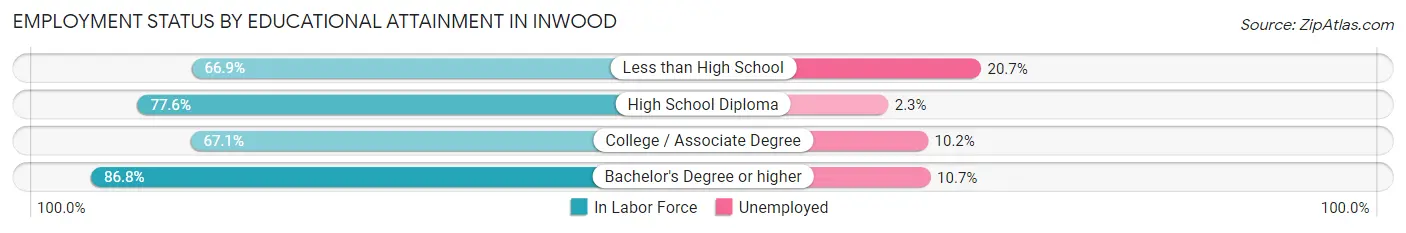
| Educational Attainment | In Labor Force | Unemployed |
| Less than High School | 440 (66.9%) | 136 (20.7%) |
| High School Diploma | 1,159 (77.6%) | 34 (2.3%) |
| College / Associate Degree | 797 (67.1%) | 121 (10.2%) |
| Bachelor's Degree or higher | 270 (86.8%) | 33 (10.7%) |
| Total | 2,665 (73.0%) | 310 (8.5%) |
Employment Occupations by Sex in Inwood
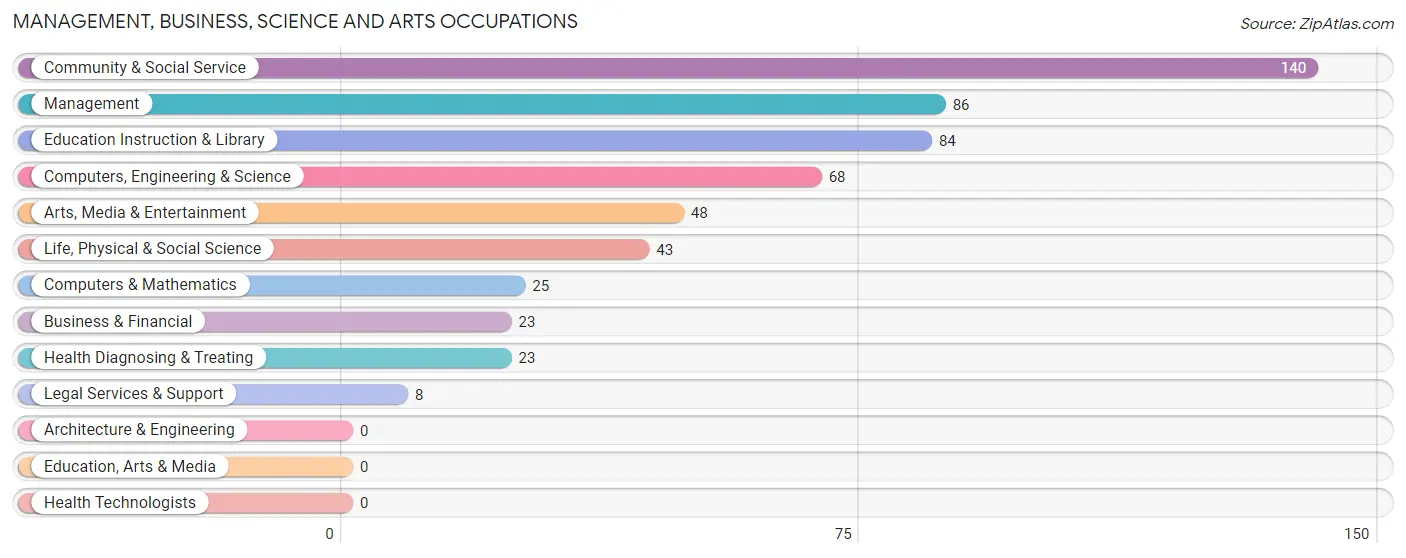
Management, Business, Science and Arts Occupations
The most common Management, Business, Science and Arts occupations in Inwood are Community & Social Service (140 | 4.6%), Management (86 | 2.8%), Education Instruction & Library (84 | 2.8%), Computers, Engineering & Science (68 | 2.2%), and Arts, Media & Entertainment (48 | 1.6%).
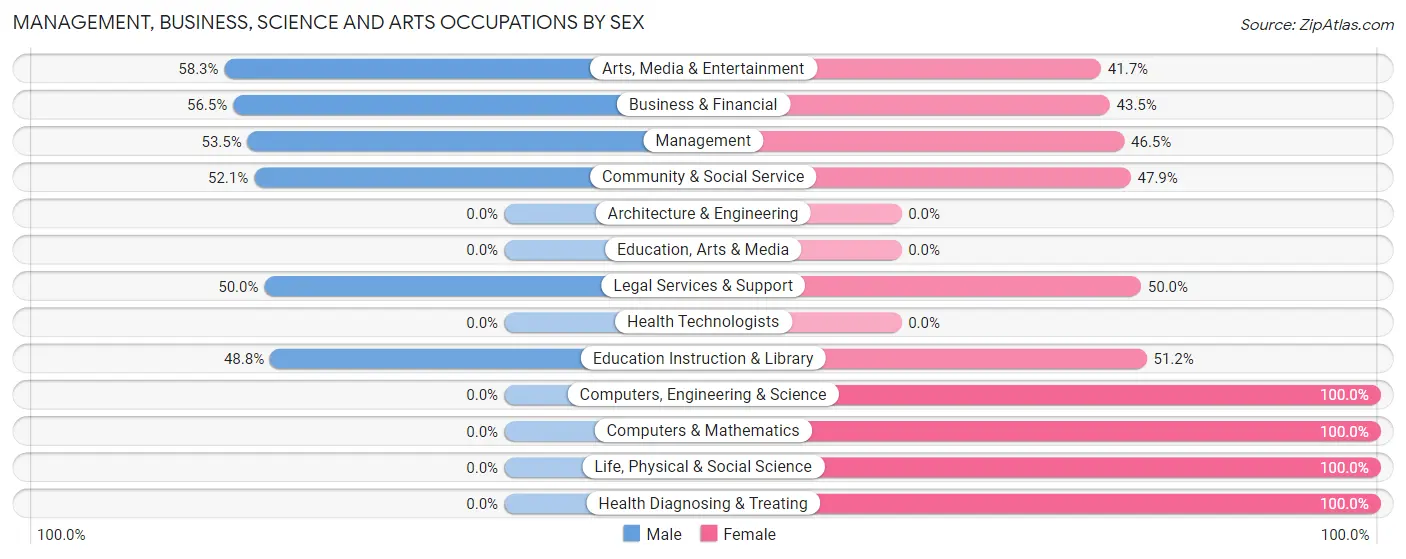
Management, Business, Science and Arts Occupations by Sex
Within the Management, Business, Science and Arts occupations in Inwood, the most male-oriented occupations are Arts, Media & Entertainment (58.3%), Business & Financial (56.5%), and Management (53.5%), while the most female-oriented occupations are Computers, Engineering & Science (100.0%), Computers & Mathematics (100.0%), and Life, Physical & Social Science (100.0%).
| Occupation | Male | Female |
| Management | 46 (53.5%) | 40 (46.5%) |
| Business & Financial | 13 (56.5%) | 10 (43.5%) |
| Computers, Engineering & Science | 0 (0.0%) | 68 (100.0%) |
| Computers & Mathematics | 0 (0.0%) | 25 (100.0%) |
| Architecture & Engineering | 0 (0.0%) | 0 (0.0%) |
| Life, Physical & Social Science | 0 (0.0%) | 43 (100.0%) |
| Community & Social Service | 73 (52.1%) | 67 (47.9%) |
| Education, Arts & Media | 0 (0.0%) | 0 (0.0%) |
| Legal Services & Support | 4 (50.0%) | 4 (50.0%) |
| Education Instruction & Library | 41 (48.8%) | 43 (51.2%) |
| Arts, Media & Entertainment | 28 (58.3%) | 20 (41.7%) |
| Health Diagnosing & Treating | 0 (0.0%) | 23 (100.0%) |
| Health Technologists | 0 (0.0%) | 0 (0.0%) |
| Total (Category) | 132 (38.8%) | 208 (61.2%) |
| Total (Overall) | 1,694 (55.5%) | 1,357 (44.5%) |
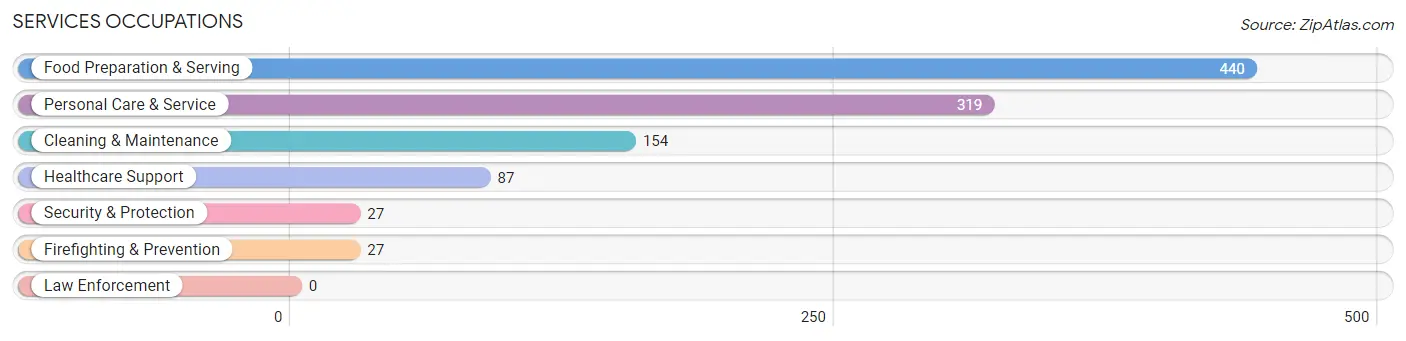
Services Occupations
The most common Services occupations in Inwood are Food Preparation & Serving (440 | 14.4%), Personal Care & Service (319 | 10.5%), Cleaning & Maintenance (154 | 5.1%), Healthcare Support (87 | 2.9%), and Security & Protection (27 | 0.9%).
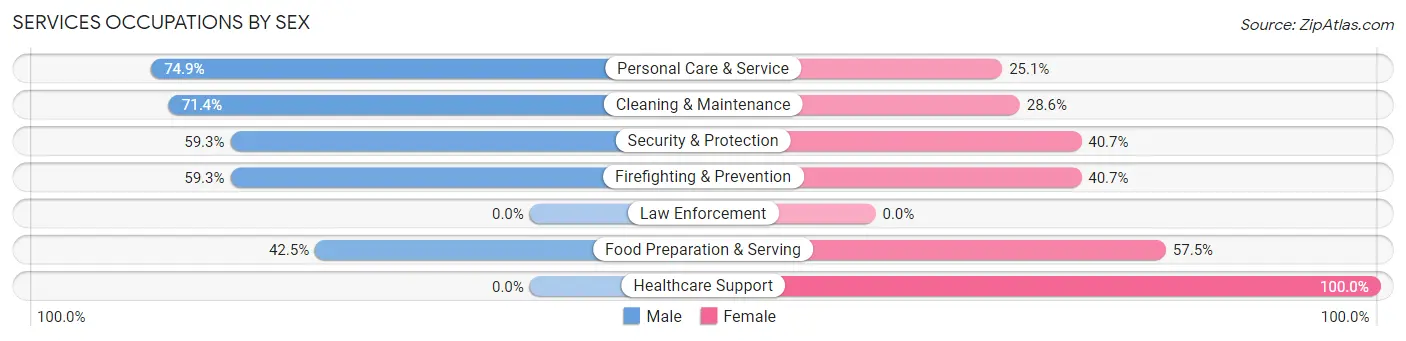
Services Occupations by Sex
Within the Services occupations in Inwood, the most male-oriented occupations are Personal Care & Service (74.9%), Cleaning & Maintenance (71.4%), and Security & Protection (59.3%), while the most female-oriented occupations are Healthcare Support (100.0%), Food Preparation & Serving (57.5%), and Security & Protection (40.7%).
| Occupation | Male | Female |
| Healthcare Support | 0 (0.0%) | 87 (100.0%) |
| Security & Protection | 16 (59.3%) | 11 (40.7%) |
| Firefighting & Prevention | 16 (59.3%) | 11 (40.7%) |
| Law Enforcement | 0 (0.0%) | 0 (0.0%) |
| Food Preparation & Serving | 187 (42.5%) | 253 (57.5%) |
| Cleaning & Maintenance | 110 (71.4%) | 44 (28.6%) |
| Personal Care & Service | 239 (74.9%) | 80 (25.1%) |
| Total (Category) | 552 (53.7%) | 475 (46.3%) |
| Total (Overall) | 1,694 (55.5%) | 1,357 (44.5%) |
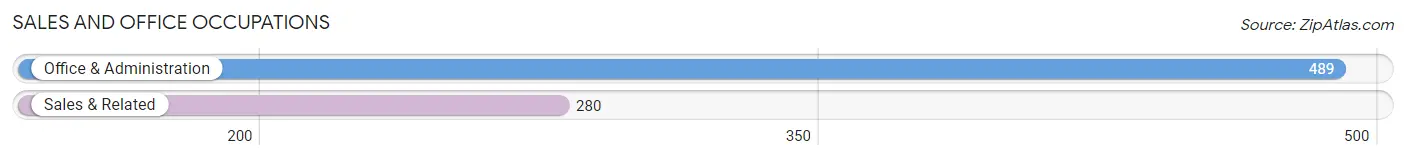
Sales and Office Occupations
The most common Sales and Office occupations in Inwood are Office & Administration (489 | 16.0%), and Sales & Related (280 | 9.2%).
Sales and Office Occupations by Sex
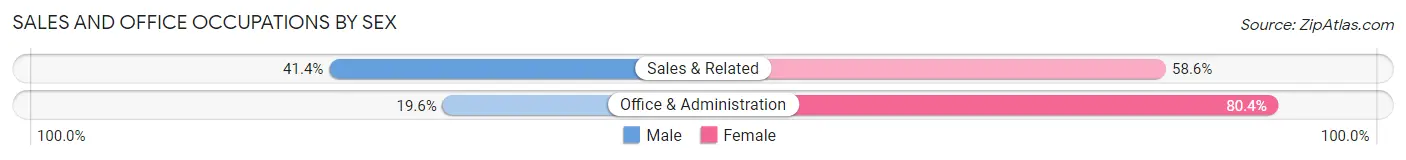
| Occupation | Male | Female |
| Sales & Related | 116 (41.4%) | 164 (58.6%) |
| Office & Administration | 96 (19.6%) | 393 (80.4%) |
| Total (Category) | 212 (27.6%) | 557 (72.4%) |
| Total (Overall) | 1,694 (55.5%) | 1,357 (44.5%) |
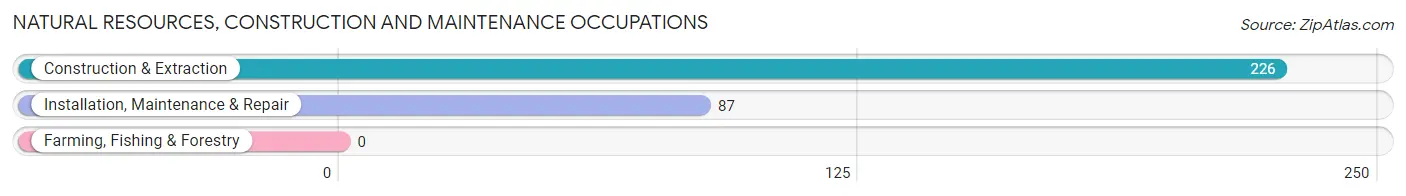
Natural Resources, Construction and Maintenance Occupations
The most common Natural Resources, Construction and Maintenance occupations in Inwood are Construction & Extraction (226 | 7.4%), and Installation, Maintenance & Repair (87 | 2.9%).
Natural Resources, Construction and Maintenance Occupations by Sex
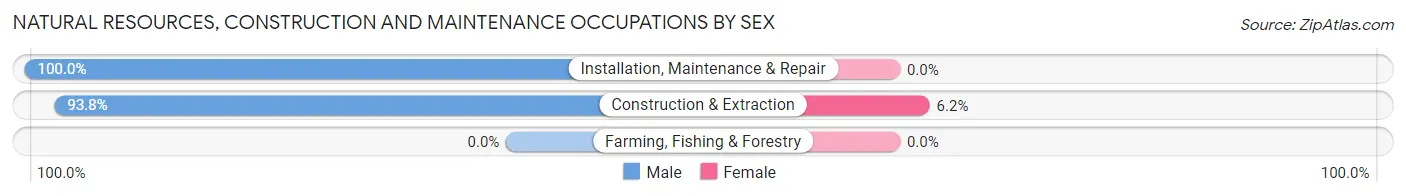
| Occupation | Male | Female |
| Farming, Fishing & Forestry | 0 (0.0%) | 0 (0.0%) |
| Construction & Extraction | 212 (93.8%) | 14 (6.2%) |
| Installation, Maintenance & Repair | 87 (100.0%) | 0 (0.0%) |
| Total (Category) | 299 (95.5%) | 14 (4.5%) |
| Total (Overall) | 1,694 (55.5%) | 1,357 (44.5%) |
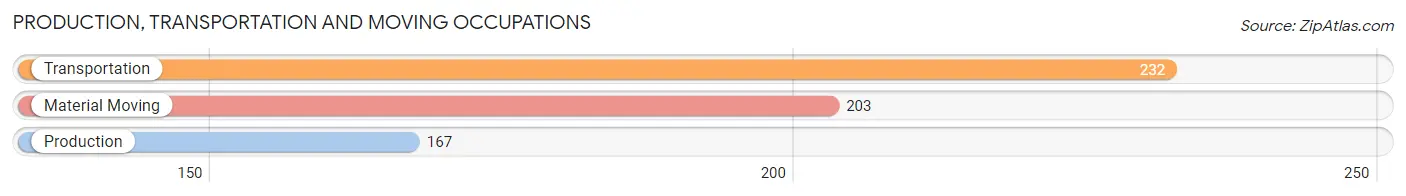
Production, Transportation and Moving Occupations
The most common Production, Transportation and Moving occupations in Inwood are Transportation (232 | 7.6%), Material Moving (203 | 6.7%), and Production (167 | 5.5%).
Production, Transportation and Moving Occupations by Sex
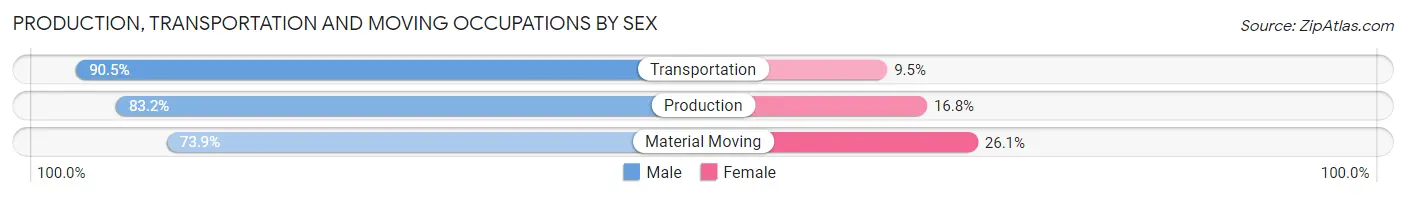
| Occupation | Male | Female |
| Production | 139 (83.2%) | 28 (16.8%) |
| Transportation | 210 (90.5%) | 22 (9.5%) |
| Material Moving | 150 (73.9%) | 53 (26.1%) |
| Total (Category) | 499 (82.9%) | 103 (17.1%) |
| Total (Overall) | 1,694 (55.5%) | 1,357 (44.5%) |
Employment Industries by Sex in Inwood
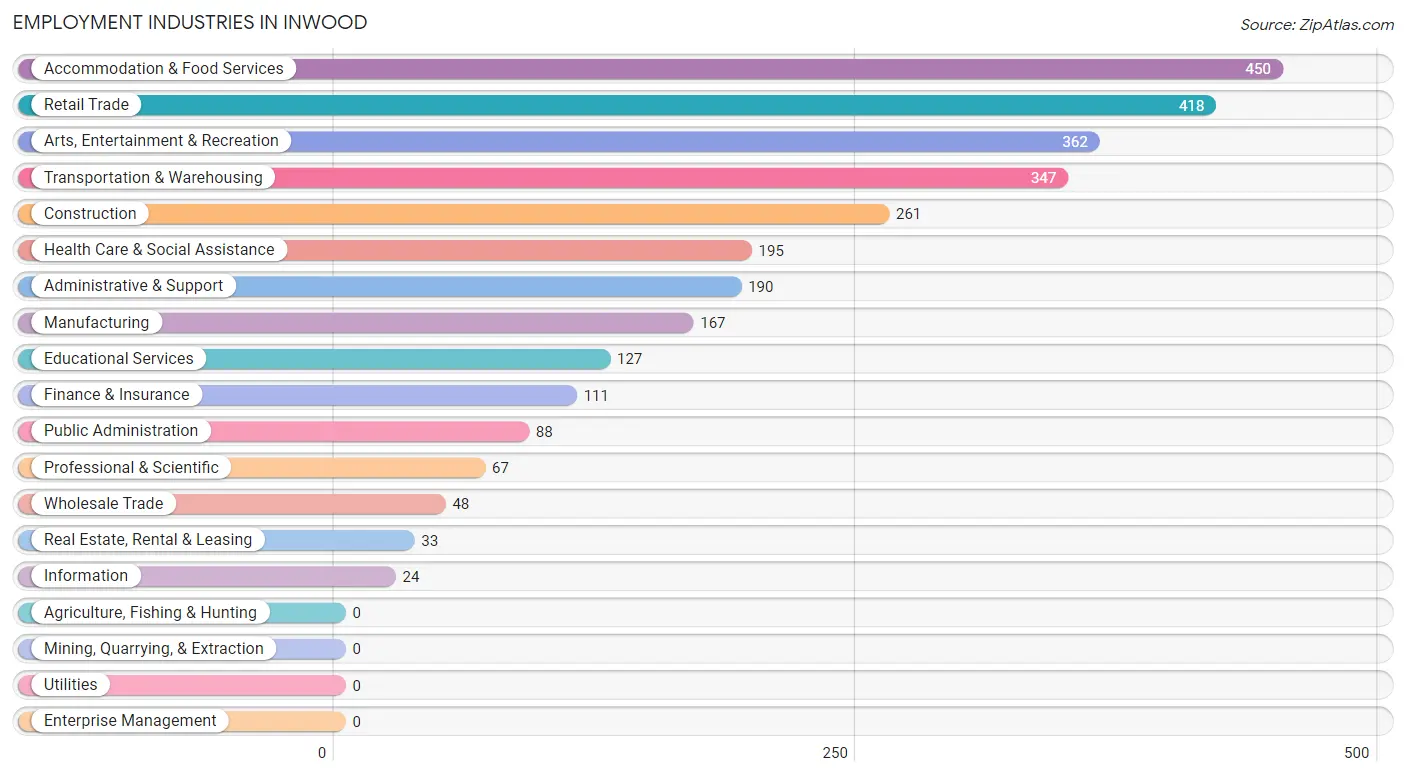
Employment Industries in Inwood
The major employment industries in Inwood include Accommodation & Food Services (450 | 14.7%), Retail Trade (418 | 13.7%), Arts, Entertainment & Recreation (362 | 11.9%), Transportation & Warehousing (347 | 11.4%), and Construction (261 | 8.6%).
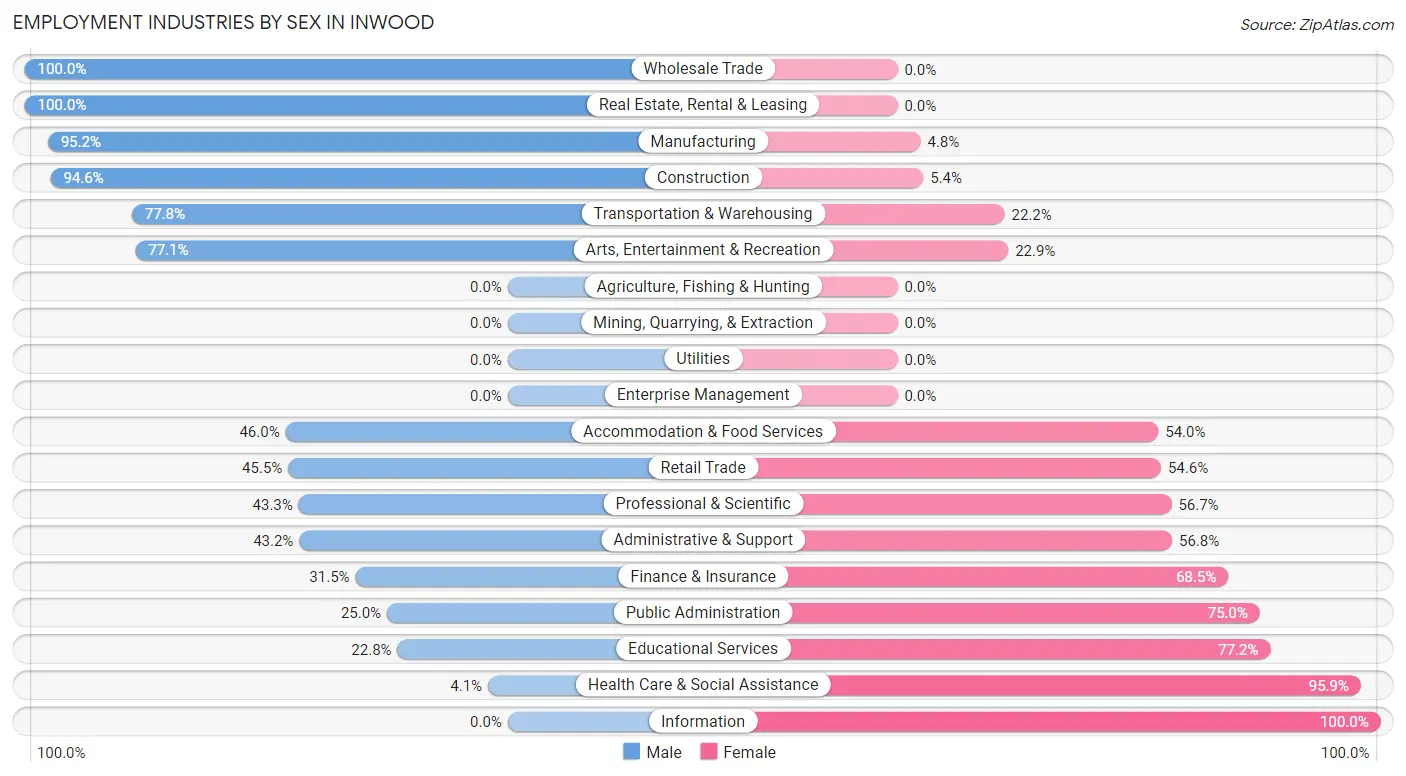
Employment Industries by Sex in Inwood
The Inwood industries that see more men than women are Wholesale Trade (100.0%), Real Estate, Rental & Leasing (100.0%), and Manufacturing (95.2%), whereas the industries that tend to have a higher number of women are Information (100.0%), Health Care & Social Assistance (95.9%), and Educational Services (77.2%).
| Industry | Male | Female |
| Agriculture, Fishing & Hunting | 0 (0.0%) | 0 (0.0%) |
| Mining, Quarrying, & Extraction | 0 (0.0%) | 0 (0.0%) |
| Construction | 247 (94.6%) | 14 (5.4%) |
| Manufacturing | 159 (95.2%) | 8 (4.8%) |
| Wholesale Trade | 48 (100.0%) | 0 (0.0%) |
| Retail Trade | 190 (45.5%) | 228 (54.5%) |
| Transportation & Warehousing | 270 (77.8%) | 77 (22.2%) |
| Utilities | 0 (0.0%) | 0 (0.0%) |
| Information | 0 (0.0%) | 24 (100.0%) |
| Finance & Insurance | 35 (31.5%) | 76 (68.5%) |
| Real Estate, Rental & Leasing | 33 (100.0%) | 0 (0.0%) |
| Professional & Scientific | 29 (43.3%) | 38 (56.7%) |
| Enterprise Management | 0 (0.0%) | 0 (0.0%) |
| Administrative & Support | 82 (43.2%) | 108 (56.8%) |
| Educational Services | 29 (22.8%) | 98 (77.2%) |
| Health Care & Social Assistance | 8 (4.1%) | 187 (95.9%) |
| Arts, Entertainment & Recreation | 279 (77.1%) | 83 (22.9%) |
| Accommodation & Food Services | 207 (46.0%) | 243 (54.0%) |
| Public Administration | 22 (25.0%) | 66 (75.0%) |
| Total | 1,694 (55.5%) | 1,357 (44.5%) |
Education in Inwood
School Enrollment in Inwood
The most common levels of schooling among the 1,912 students in Inwood are high school (565 | 29.5%), middle school (506 | 26.5%), and elementary school (422 | 22.1%).
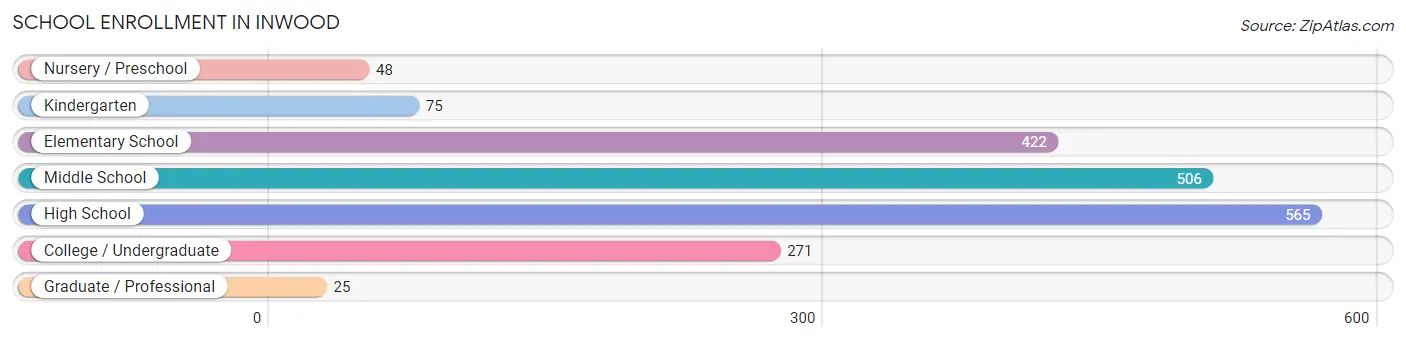
| School Level | # Students | % Students |
| Nursery / Preschool | 48 | 2.5% |
| Kindergarten | 75 | 3.9% |
| Elementary School | 422 | 22.1% |
| Middle School | 506 | 26.5% |
| High School | 565 | 29.5% |
| College / Undergraduate | 271 | 14.2% |
| Graduate / Professional | 25 | 1.3% |
| Total | 1,912 | 100.0% |
School Enrollment by Age by Funding Source in Inwood
Out of a total of 1,912 students who are enrolled in schools in Inwood, 120 (6.3%) attend a private institution, while the remaining 1,792 (93.7%) are enrolled in public schools. The age group of 20 to 24 year olds has the highest likelihood of being enrolled in private schools, with 37 (32.5% in the age bracket) enrolled. Conversely, the age group of 15 to 17 year olds has the lowest likelihood of being enrolled in a private school, with 426 (100.0% in the age bracket) attending a public institution.
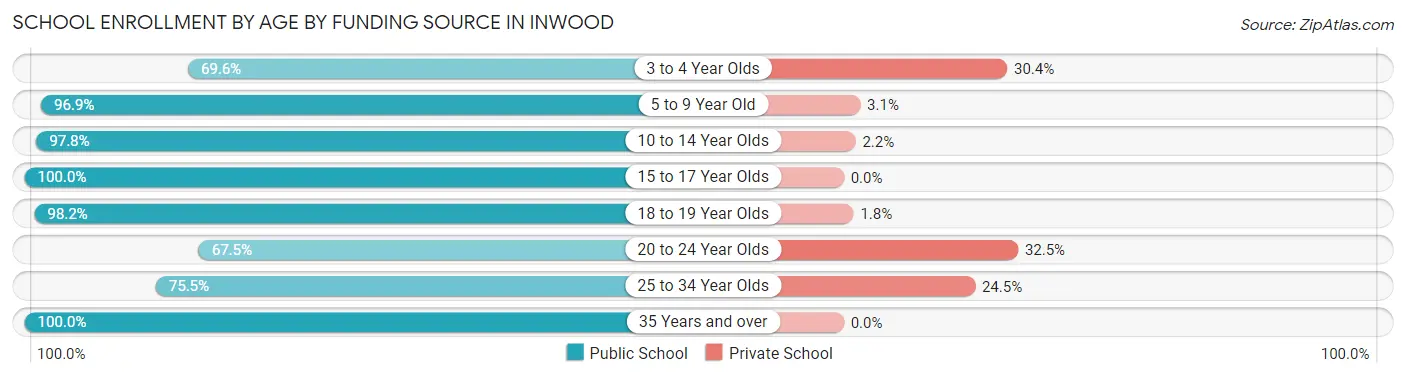
| Age Bracket | Public School | Private School |
| 3 to 4 Year Olds | 48 (69.6%) | 21 (30.4%) |
| 5 to 9 Year Old | 379 (96.9%) | 12 (3.1%) |
| 10 to 14 Year Olds | 578 (97.8%) | 13 (2.2%) |
| 15 to 17 Year Olds | 426 (100.0%) | 0 (0.0%) |
| 18 to 19 Year Olds | 161 (98.2%) | 3 (1.8%) |
| 20 to 24 Year Olds | 77 (67.5%) | 37 (32.5%) |
| 25 to 34 Year Olds | 105 (75.5%) | 34 (24.5%) |
| 35 Years and over | 18 (100.0%) | 0 (0.0%) |
| Total | 1,792 (93.7%) | 120 (6.3%) |
Educational Attainment by Field of Study in Inwood
Business (128 | 32.7%), psychology (81 | 20.7%), arts & humanities (71 | 18.1%), social sciences (62 | 15.8%), and liberal arts & history (26 | 6.6%) are the most common fields of study among 392 individuals in Inwood who have obtained a bachelor's degree or higher.
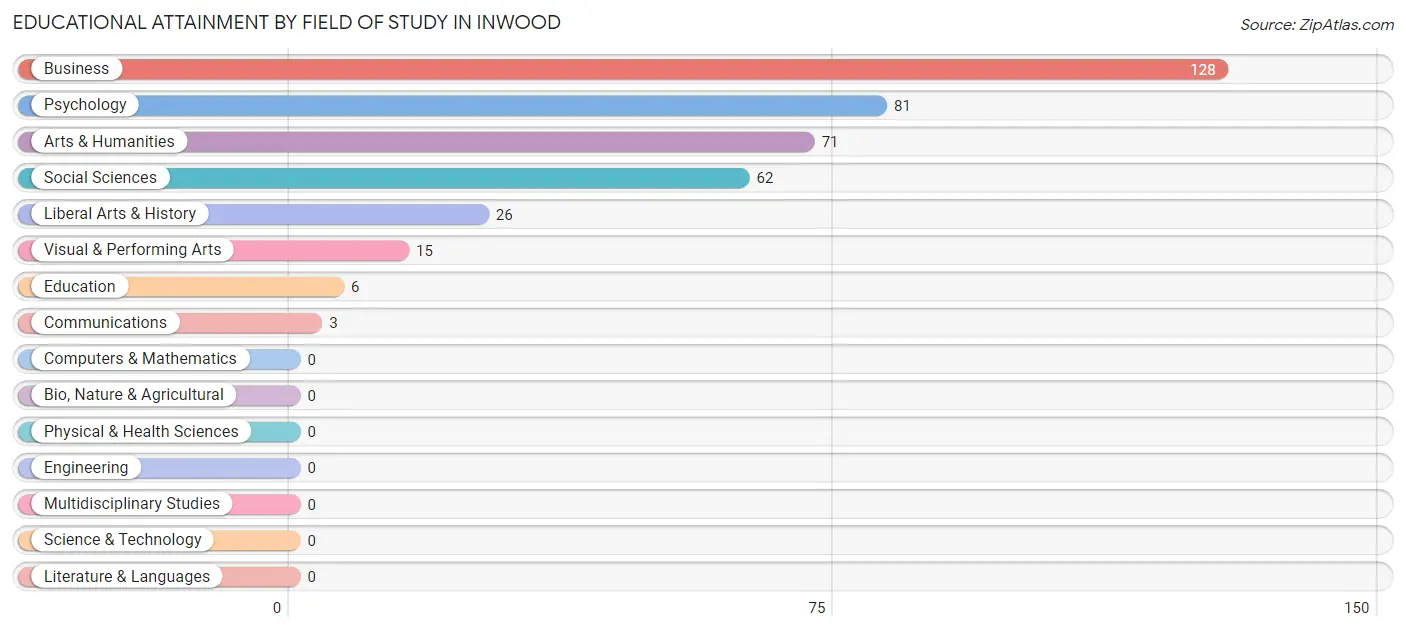
| Field of Study | # Graduates | % Graduates |
| Computers & Mathematics | 0 | 0.0% |
| Bio, Nature & Agricultural | 0 | 0.0% |
| Physical & Health Sciences | 0 | 0.0% |
| Psychology | 81 | 20.7% |
| Social Sciences | 62 | 15.8% |
| Engineering | 0 | 0.0% |
| Multidisciplinary Studies | 0 | 0.0% |
| Science & Technology | 0 | 0.0% |
| Business | 128 | 32.7% |
| Education | 6 | 1.5% |
| Literature & Languages | 0 | 0.0% |
| Liberal Arts & History | 26 | 6.6% |
| Visual & Performing Arts | 15 | 3.8% |
| Communications | 3 | 0.8% |
| Arts & Humanities | 71 | 18.1% |
| Total | 392 | 100.0% |
Transportation & Commute in Inwood
Vehicle Availability by Sex in Inwood
The most prevalent vehicle ownership categories in Inwood are males with 2 vehicles (637, accounting for 37.8%) and females with 2 vehicles (450, making up 48.9%).
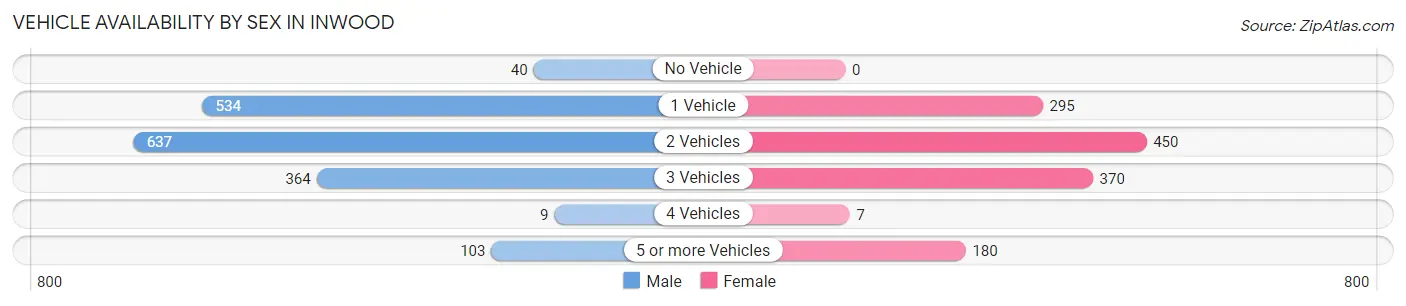
| Vehicles Available | Male | Female |
| No Vehicle | 40 (2.4%) | 0 (0.0%) |
| 1 Vehicle | 534 (31.7%) | 295 (22.7%) |
| 2 Vehicles | 637 (37.8%) | 450 (34.6%) |
| 3 Vehicles | 364 (21.6%) | 370 (28.4%) |
| 4 Vehicles | 9 (0.5%) | 7 (0.5%) |
| 5 or more Vehicles | 103 (6.1%) | 180 (13.8%) |
| Total | 1,687 (100.0%) | 1,302 (100.0%) |
Commute Time in Inwood
The most frequently occuring commute durations in Inwood are 15 to 19 minutes (504 commuters, 18.5%), 10 to 14 minutes (416 commuters, 15.2%), and 20 to 24 minutes (347 commuters, 12.7%).
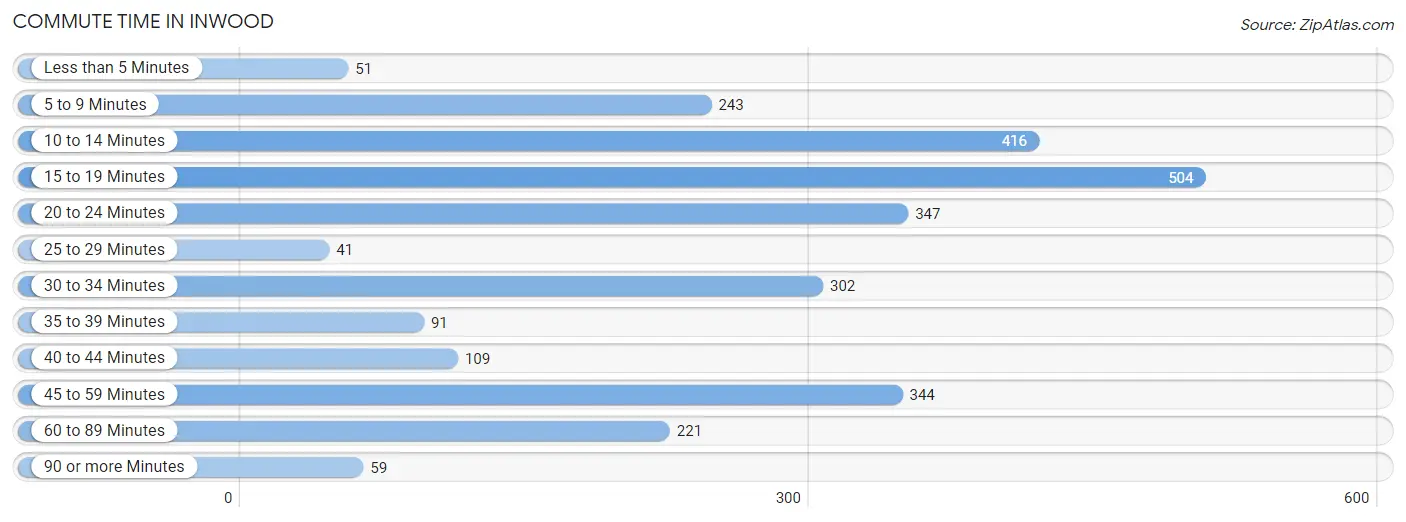
| Commute Time | # Commuters | % Commuters |
| Less than 5 Minutes | 51 | 1.9% |
| 5 to 9 Minutes | 243 | 8.9% |
| 10 to 14 Minutes | 416 | 15.2% |
| 15 to 19 Minutes | 504 | 18.5% |
| 20 to 24 Minutes | 347 | 12.7% |
| 25 to 29 Minutes | 41 | 1.5% |
| 30 to 34 Minutes | 302 | 11.1% |
| 35 to 39 Minutes | 91 | 3.3% |
| 40 to 44 Minutes | 109 | 4.0% |
| 45 to 59 Minutes | 344 | 12.6% |
| 60 to 89 Minutes | 221 | 8.1% |
| 90 or more Minutes | 59 | 2.2% |
Commute Time by Sex in Inwood
The most common commute times in Inwood are 45 to 59 minutes (302 commuters, 18.8%) for males and 15 to 19 minutes (247 commuters, 22.0%) for females.
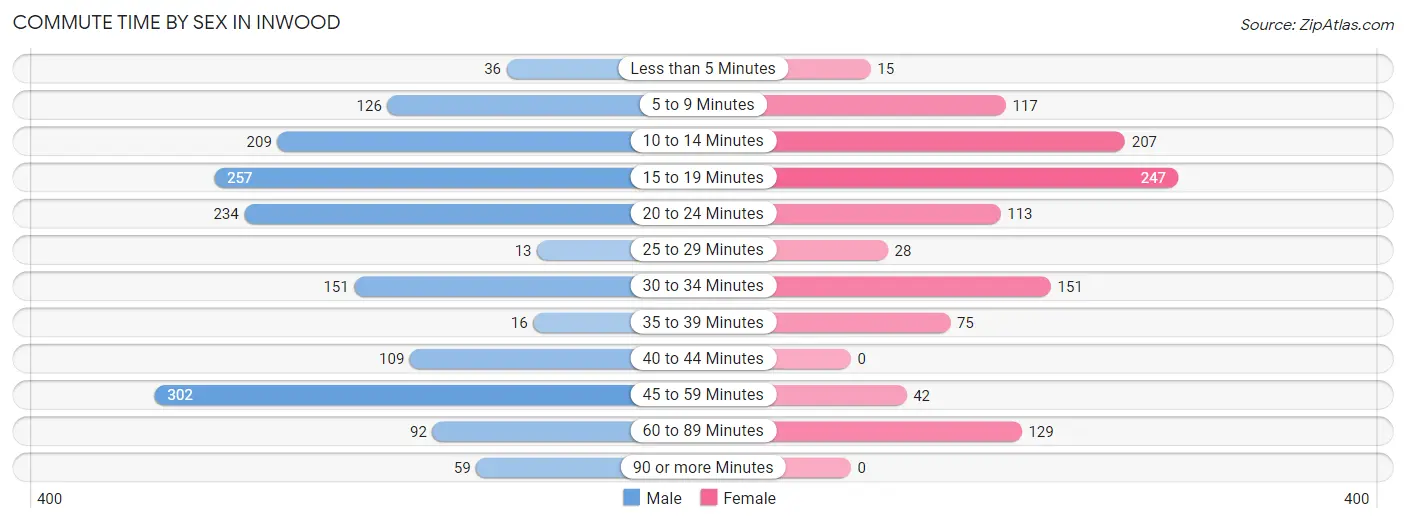
| Commute Time | Male | Female |
| Less than 5 Minutes | 36 (2.2%) | 15 (1.3%) |
| 5 to 9 Minutes | 126 (7.9%) | 117 (10.4%) |
| 10 to 14 Minutes | 209 (13.0%) | 207 (18.4%) |
| 15 to 19 Minutes | 257 (16.0%) | 247 (22.0%) |
| 20 to 24 Minutes | 234 (14.6%) | 113 (10.1%) |
| 25 to 29 Minutes | 13 (0.8%) | 28 (2.5%) |
| 30 to 34 Minutes | 151 (9.4%) | 151 (13.4%) |
| 35 to 39 Minutes | 16 (1.0%) | 75 (6.7%) |
| 40 to 44 Minutes | 109 (6.8%) | 0 (0.0%) |
| 45 to 59 Minutes | 302 (18.8%) | 42 (3.7%) |
| 60 to 89 Minutes | 92 (5.7%) | 129 (11.5%) |
| 90 or more Minutes | 59 (3.7%) | 0 (0.0%) |
Time of Departure to Work by Sex in Inwood
The most frequent times of departure to work in Inwood are 6:00 AM to 6:29 AM (591, 36.8%) for males and 7:30 AM to 7:59 AM (241, 21.4%) for females.
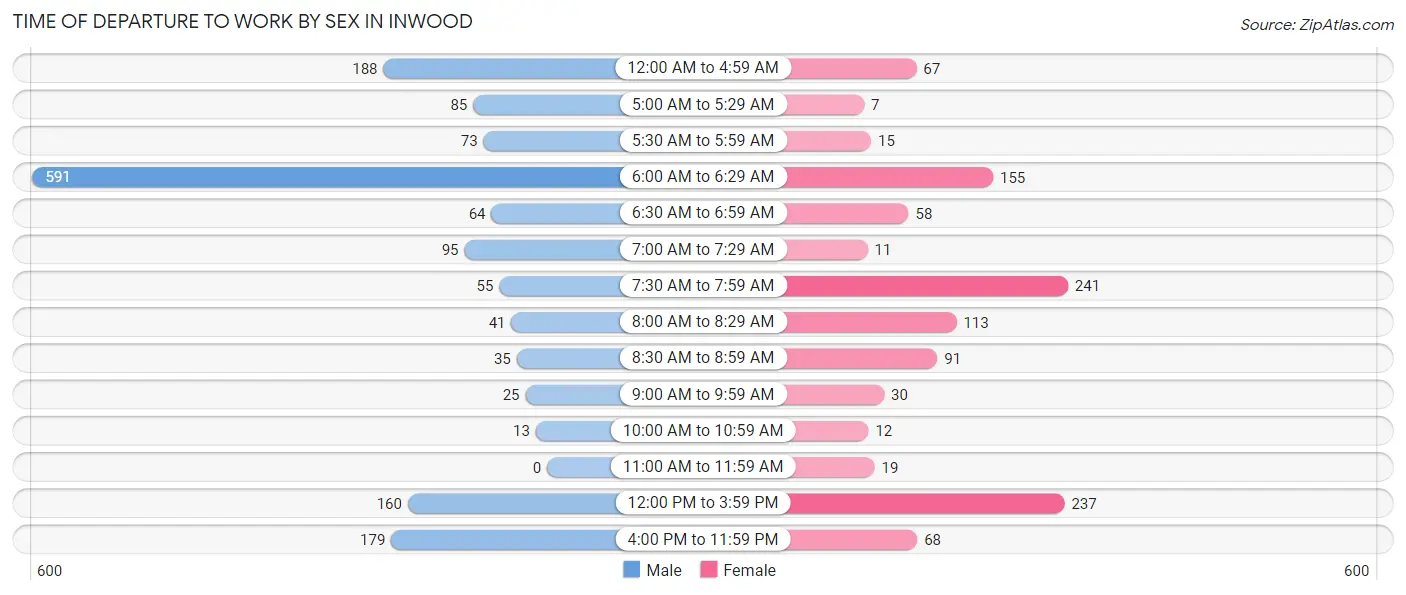
| Time of Departure | Male | Female |
| 12:00 AM to 4:59 AM | 188 (11.7%) | 67 (6.0%) |
| 5:00 AM to 5:29 AM | 85 (5.3%) | 7 (0.6%) |
| 5:30 AM to 5:59 AM | 73 (4.5%) | 15 (1.3%) |
| 6:00 AM to 6:29 AM | 591 (36.8%) | 155 (13.8%) |
| 6:30 AM to 6:59 AM | 64 (4.0%) | 58 (5.2%) |
| 7:00 AM to 7:29 AM | 95 (5.9%) | 11 (1.0%) |
| 7:30 AM to 7:59 AM | 55 (3.4%) | 241 (21.4%) |
| 8:00 AM to 8:29 AM | 41 (2.6%) | 113 (10.1%) |
| 8:30 AM to 8:59 AM | 35 (2.2%) | 91 (8.1%) |
| 9:00 AM to 9:59 AM | 25 (1.6%) | 30 (2.7%) |
| 10:00 AM to 10:59 AM | 13 (0.8%) | 12 (1.1%) |
| 11:00 AM to 11:59 AM | 0 (0.0%) | 19 (1.7%) |
| 12:00 PM to 3:59 PM | 160 (10.0%) | 237 (21.1%) |
| 4:00 PM to 11:59 PM | 179 (11.2%) | 68 (6.0%) |
| Total | 1,604 (100.0%) | 1,124 (100.0%) |
Housing Occupancy in Inwood
Occupancy by Ownership in Inwood
Of the total 2,392 dwellings in Inwood, owner-occupied units account for 1,582 (66.1%), while renter-occupied units make up 810 (33.9%).
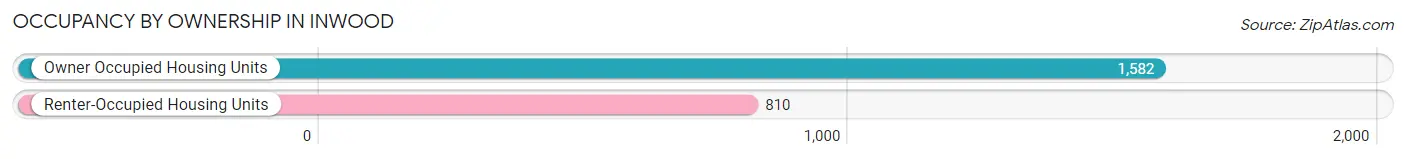
| Occupancy | # Housing Units | % Housing Units |
| Owner Occupied Housing Units | 1,582 | 66.1% |
| Renter-Occupied Housing Units | 810 | 33.9% |
| Total Occupied Housing Units | 2,392 | 100.0% |
Occupancy by Household Size in Inwood
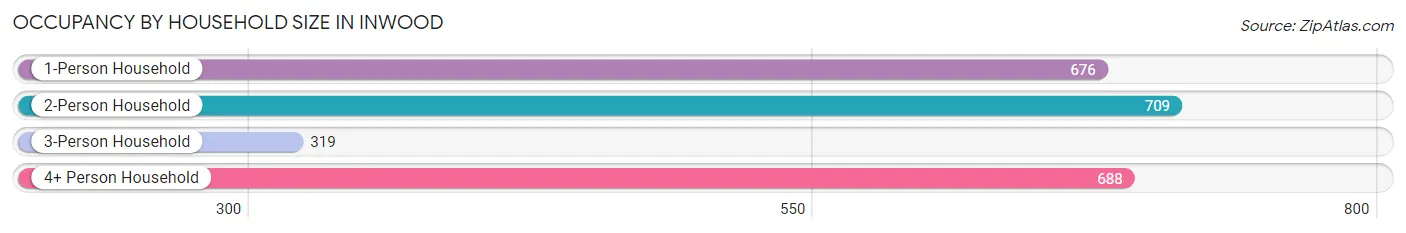
| Household Size | # Housing Units | % Housing Units |
| 1-Person Household | 676 | 28.3% |
| 2-Person Household | 709 | 29.6% |
| 3-Person Household | 319 | 13.3% |
| 4+ Person Household | 688 | 28.8% |
| Total Housing Units | 2,392 | 100.0% |
Occupancy by Ownership by Household Size in Inwood
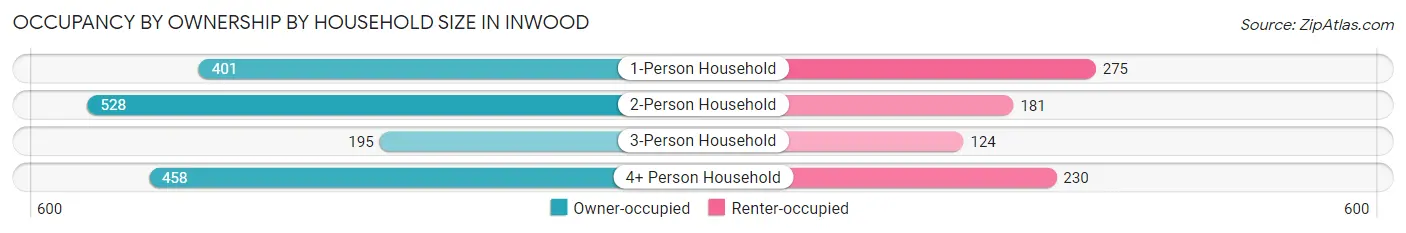
| Household Size | Owner-occupied | Renter-occupied |
| 1-Person Household | 401 (59.3%) | 275 (40.7%) |
| 2-Person Household | 528 (74.5%) | 181 (25.5%) |
| 3-Person Household | 195 (61.1%) | 124 (38.9%) |
| 4+ Person Household | 458 (66.6%) | 230 (33.4%) |
| Total Housing Units | 1,582 (66.1%) | 810 (33.9%) |
Occupancy by Educational Attainment in Inwood
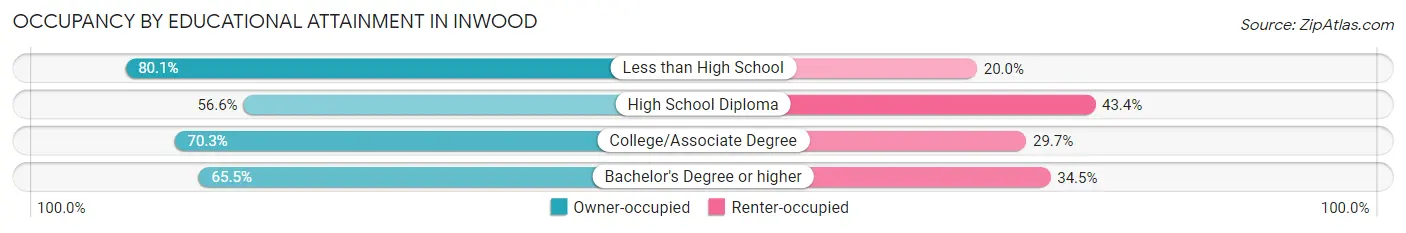
| Household Size | Owner-occupied | Renter-occupied |
| Less than High School | 349 (80.0%) | 87 (20.0%) |
| High School Diploma | 548 (56.6%) | 420 (43.4%) |
| College/Associate Degree | 556 (70.3%) | 235 (29.7%) |
| Bachelor's Degree or higher | 129 (65.5%) | 68 (34.5%) |
Occupancy by Age of Householder in Inwood
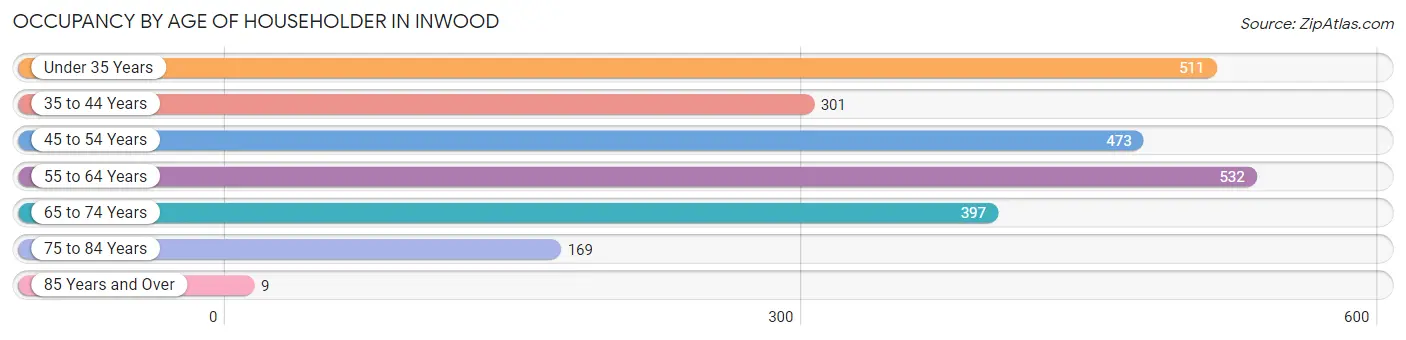
| Age Bracket | # Households | % Households |
| Under 35 Years | 511 | 21.4% |
| 35 to 44 Years | 301 | 12.6% |
| 45 to 54 Years | 473 | 19.8% |
| 55 to 64 Years | 532 | 22.2% |
| 65 to 74 Years | 397 | 16.6% |
| 75 to 84 Years | 169 | 7.1% |
| 85 Years and Over | 9 | 0.4% |
| Total | 2,392 | 100.0% |
Housing Finances in Inwood
Median Income by Occupancy in Inwood
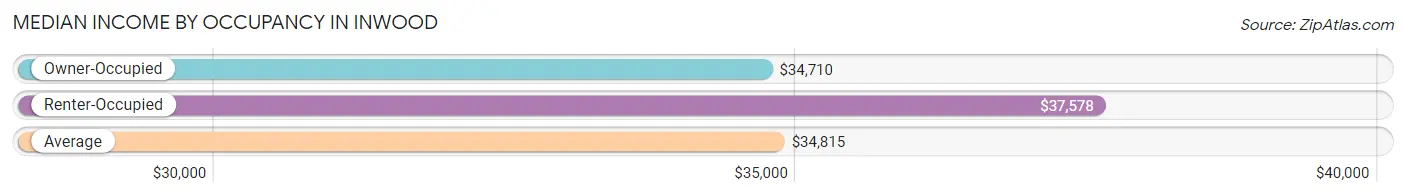
| Occupancy Type | # Households | Median Income |
| Owner-Occupied | 1,582 (66.1%) | $34,710 |
| Renter-Occupied | 810 (33.9%) | $37,578 |
| Average | 2,392 (100.0%) | $34,815 |
Occupancy by Householder Income Bracket in Inwood
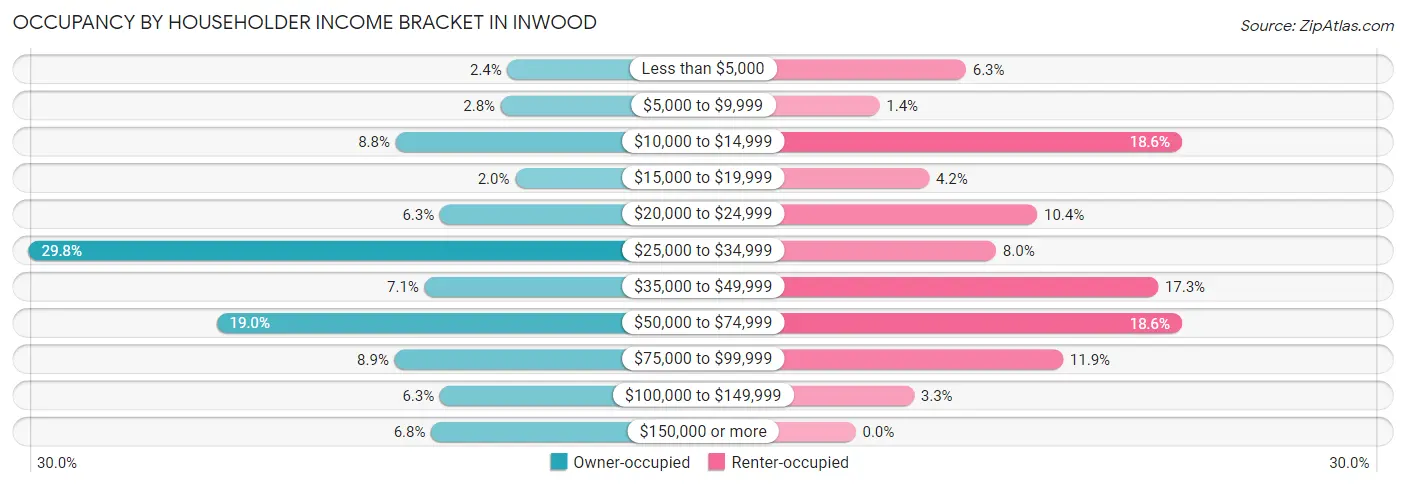
| Income Bracket | Owner-occupied | Renter-occupied |
| Less than $5,000 | 38 (2.4%) | 51 (6.3%) |
| $5,000 to $9,999 | 44 (2.8%) | 11 (1.4%) |
| $10,000 to $14,999 | 139 (8.8%) | 151 (18.6%) |
| $15,000 to $19,999 | 31 (2.0%) | 34 (4.2%) |
| $20,000 to $24,999 | 99 (6.3%) | 84 (10.4%) |
| $25,000 to $34,999 | 471 (29.8%) | 65 (8.0%) |
| $35,000 to $49,999 | 113 (7.1%) | 140 (17.3%) |
| $50,000 to $74,999 | 301 (19.0%) | 151 (18.6%) |
| $75,000 to $99,999 | 140 (8.8%) | 96 (11.8%) |
| $100,000 to $149,999 | 99 (6.3%) | 27 (3.3%) |
| $150,000 or more | 107 (6.8%) | 0 (0.0%) |
| Total | 1,582 (100.0%) | 810 (100.0%) |
Monthly Housing Cost Tiers in Inwood
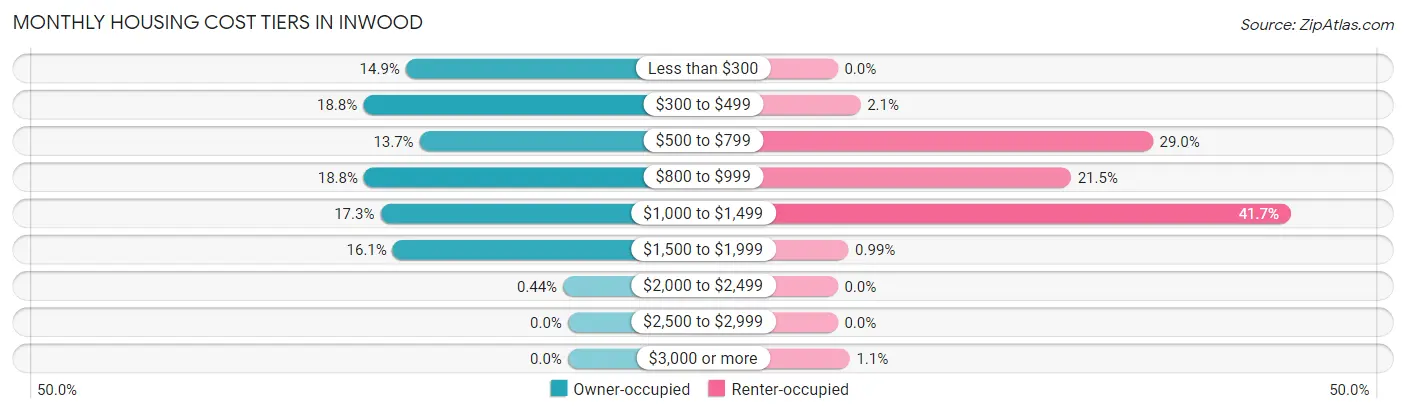
| Monthly Cost | Owner-occupied | Renter-occupied |
| Less than $300 | 236 (14.9%) | 0 (0.0%) |
| $300 to $499 | 298 (18.8%) | 17 (2.1%) |
| $500 to $799 | 216 (13.7%) | 235 (29.0%) |
| $800 to $999 | 297 (18.8%) | 174 (21.5%) |
| $1,000 to $1,499 | 273 (17.3%) | 338 (41.7%) |
| $1,500 to $1,999 | 255 (16.1%) | 8 (1.0%) |
| $2,000 to $2,499 | 7 (0.4%) | 0 (0.0%) |
| $2,500 to $2,999 | 0 (0.0%) | 0 (0.0%) |
| $3,000 or more | 0 (0.0%) | 9 (1.1%) |
| Total | 1,582 (100.0%) | 810 (100.0%) |
Physical Housing Characteristics in Inwood
Housing Structures in Inwood
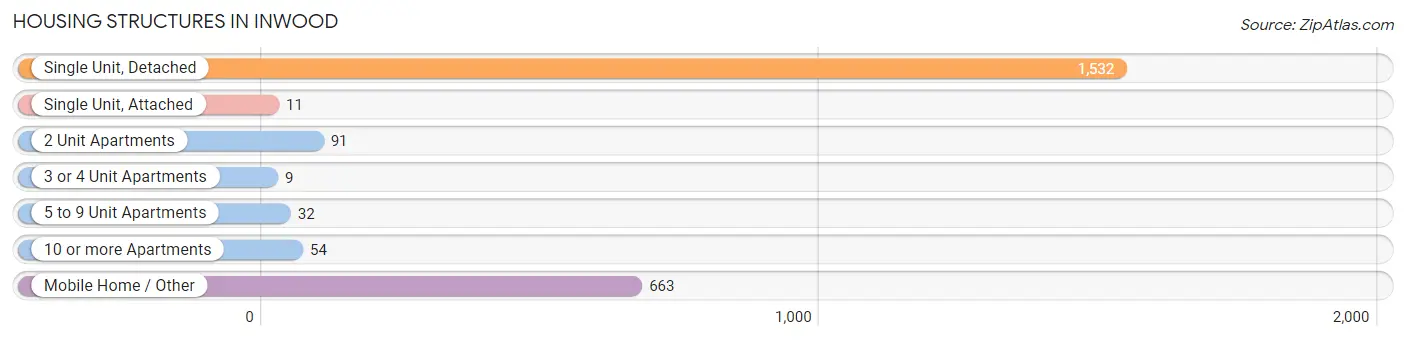
| Structure Type | # Housing Units | % Housing Units |
| Single Unit, Detached | 1,532 | 64.0% |
| Single Unit, Attached | 11 | 0.5% |
| 2 Unit Apartments | 91 | 3.8% |
| 3 or 4 Unit Apartments | 9 | 0.4% |
| 5 to 9 Unit Apartments | 32 | 1.3% |
| 10 or more Apartments | 54 | 2.3% |
| Mobile Home / Other | 663 | 27.7% |
| Total | 2,392 | 100.0% |
Housing Structures by Occupancy in Inwood
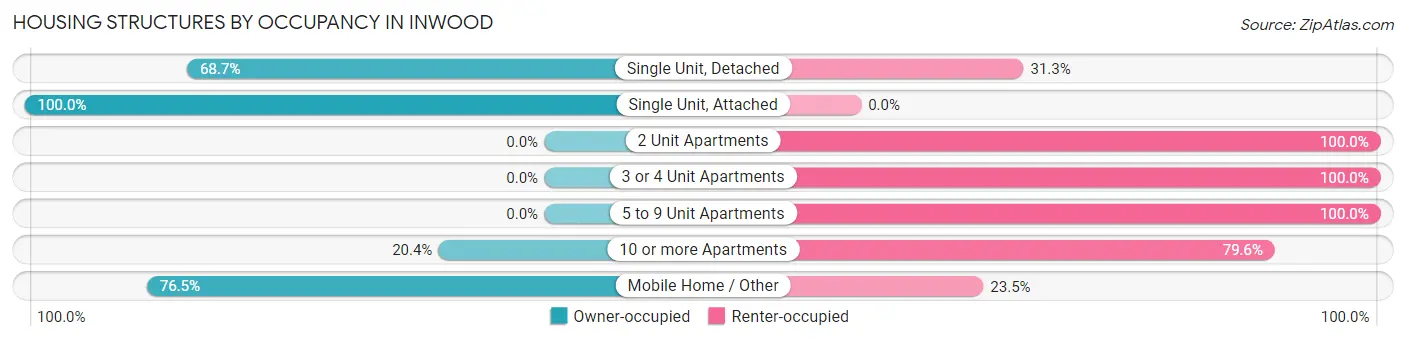
| Structure Type | Owner-occupied | Renter-occupied |
| Single Unit, Detached | 1,053 (68.7%) | 479 (31.3%) |
| Single Unit, Attached | 11 (100.0%) | 0 (0.0%) |
| 2 Unit Apartments | 0 (0.0%) | 91 (100.0%) |
| 3 or 4 Unit Apartments | 0 (0.0%) | 9 (100.0%) |
| 5 to 9 Unit Apartments | 0 (0.0%) | 32 (100.0%) |
| 10 or more Apartments | 11 (20.4%) | 43 (79.6%) |
| Mobile Home / Other | 507 (76.5%) | 156 (23.5%) |
| Total | 1,582 (66.1%) | 810 (33.9%) |
Housing Structures by Number of Rooms in Inwood
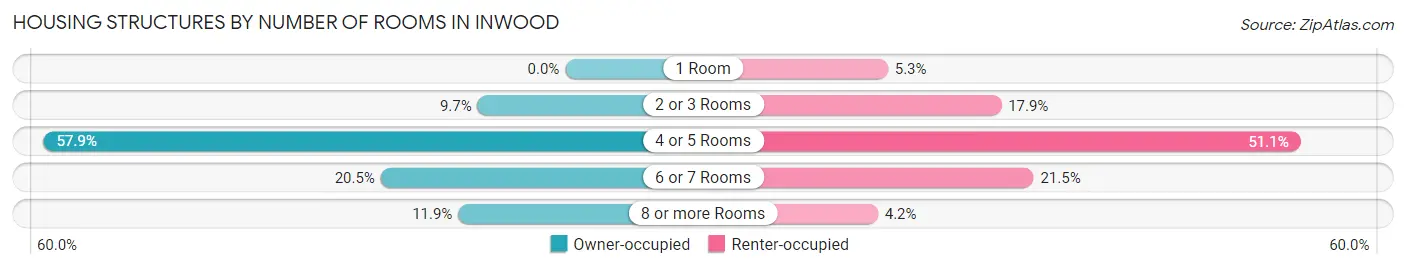
| Number of Rooms | Owner-occupied | Renter-occupied |
| 1 Room | 0 (0.0%) | 43 (5.3%) |
| 2 or 3 Rooms | 154 (9.7%) | 145 (17.9%) |
| 4 or 5 Rooms | 916 (57.9%) | 414 (51.1%) |
| 6 or 7 Rooms | 324 (20.5%) | 174 (21.5%) |
| 8 or more Rooms | 188 (11.9%) | 34 (4.2%) |
| Total | 1,582 (100.0%) | 810 (100.0%) |
Housing Structure by Heating Type in Inwood
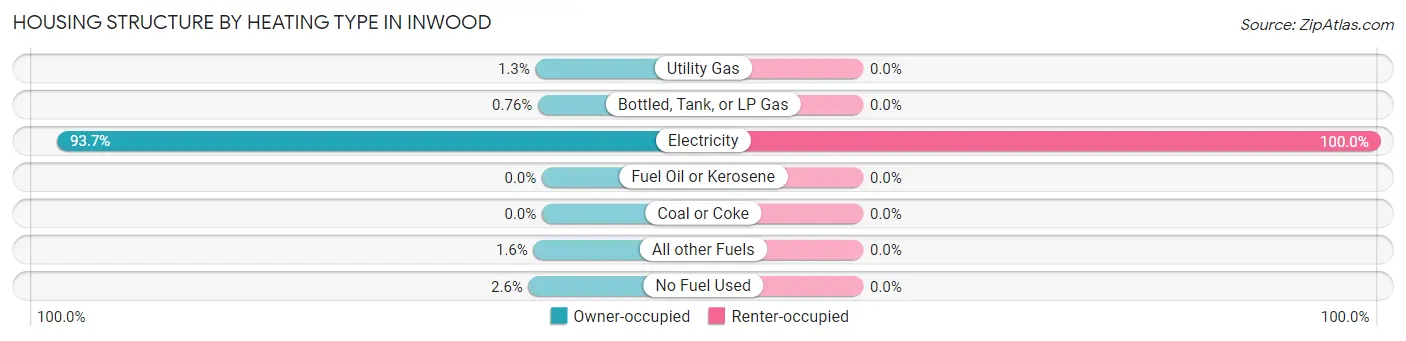
| Heating Type | Owner-occupied | Renter-occupied |
| Utility Gas | 20 (1.3%) | 0 (0.0%) |
| Bottled, Tank, or LP Gas | 12 (0.8%) | 0 (0.0%) |
| Electricity | 1,483 (93.7%) | 810 (100.0%) |
| Fuel Oil or Kerosene | 0 (0.0%) | 0 (0.0%) |
| Coal or Coke | 0 (0.0%) | 0 (0.0%) |
| All other Fuels | 26 (1.6%) | 0 (0.0%) |
| No Fuel Used | 41 (2.6%) | 0 (0.0%) |
| Total | 1,582 (100.0%) | 810 (100.0%) |
Household Vehicle Usage in Inwood
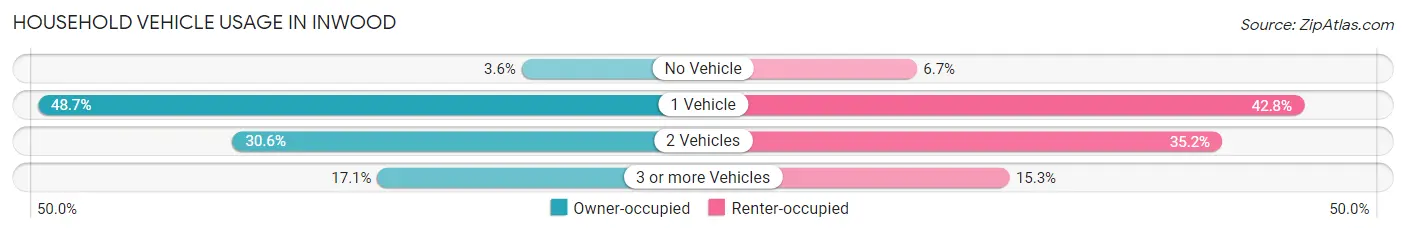
| Vehicles per Household | Owner-occupied | Renter-occupied |
| No Vehicle | 57 (3.6%) | 54 (6.7%) |
| 1 Vehicle | 771 (48.7%) | 347 (42.8%) |
| 2 Vehicles | 484 (30.6%) | 285 (35.2%) |
| 3 or more Vehicles | 270 (17.1%) | 124 (15.3%) |
| Total | 1,582 (100.0%) | 810 (100.0%) |
Real Estate & Mortgages in Inwood
Real Estate and Mortgage Overview in Inwood
| Characteristic | Without Mortgage | With Mortgage |
| Housing Units | 829 | 753 |
| Median Property Value | $107,300 | $115,100 |
| Median Household Income | $29,109 | $62 |
| Monthly Housing Costs | $416 | $0 |
| Real Estate Taxes | $944 | $15 |
Property Value by Mortgage Status in Inwood
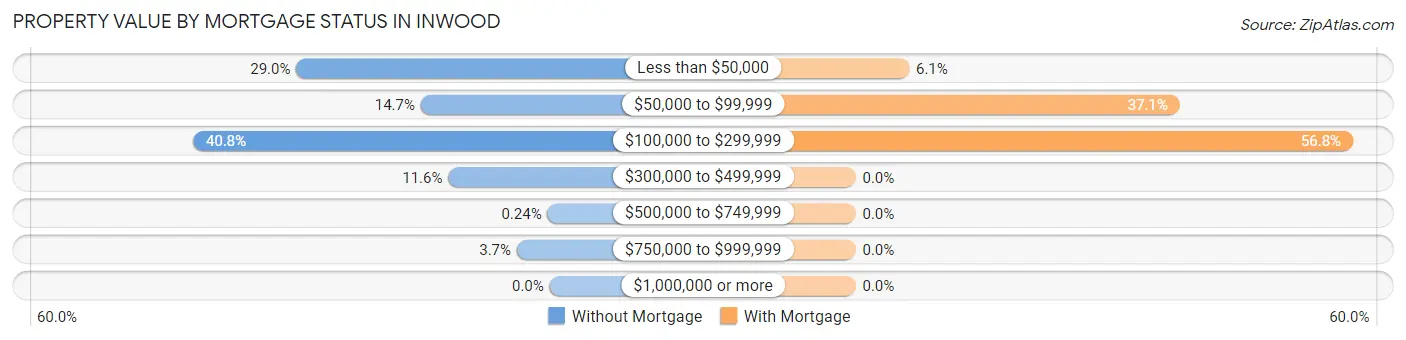
| Property Value | Without Mortgage | With Mortgage |
| Less than $50,000 | 240 (28.9%) | 46 (6.1%) |
| $50,000 to $99,999 | 122 (14.7%) | 279 (37.0%) |
| $100,000 to $299,999 | 338 (40.8%) | 428 (56.8%) |
| $300,000 to $499,999 | 96 (11.6%) | 0 (0.0%) |
| $500,000 to $749,999 | 2 (0.2%) | 0 (0.0%) |
| $750,000 to $999,999 | 31 (3.7%) | 0 (0.0%) |
| $1,000,000 or more | 0 (0.0%) | 0 (0.0%) |
| Total | 829 (100.0%) | 753 (100.0%) |
Household Income by Mortgage Status in Inwood
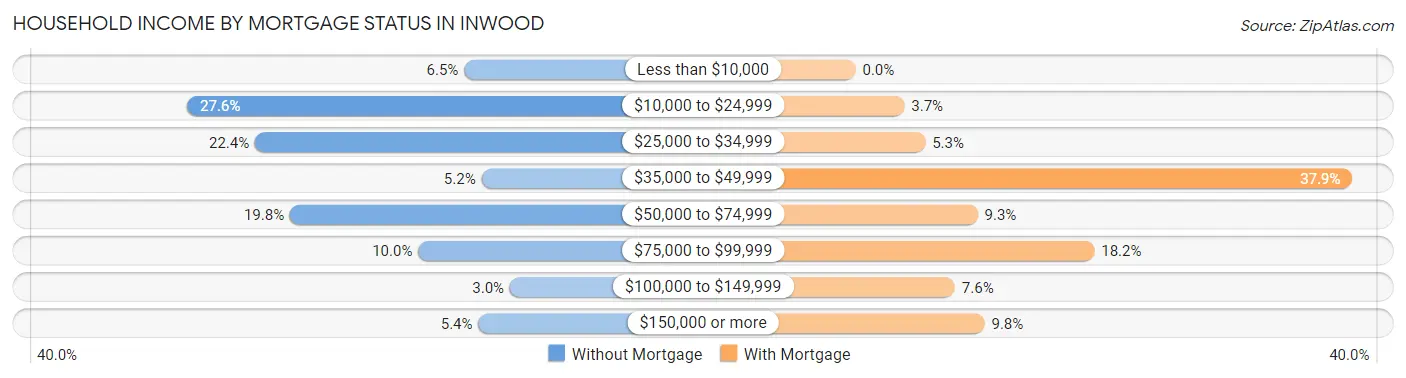
| Household Income | Without Mortgage | With Mortgage |
| Less than $10,000 | 54 (6.5%) | 0 (0.0%) |
| $10,000 to $24,999 | 229 (27.6%) | 28 (3.7%) |
| $25,000 to $34,999 | 186 (22.4%) | 40 (5.3%) |
| $35,000 to $49,999 | 43 (5.2%) | 285 (37.9%) |
| $50,000 to $74,999 | 164 (19.8%) | 70 (9.3%) |
| $75,000 to $99,999 | 83 (10.0%) | 137 (18.2%) |
| $100,000 to $149,999 | 25 (3.0%) | 57 (7.6%) |
| $150,000 or more | 45 (5.4%) | 74 (9.8%) |
| Total | 829 (100.0%) | 753 (100.0%) |
Property Value to Household Income Ratio in Inwood
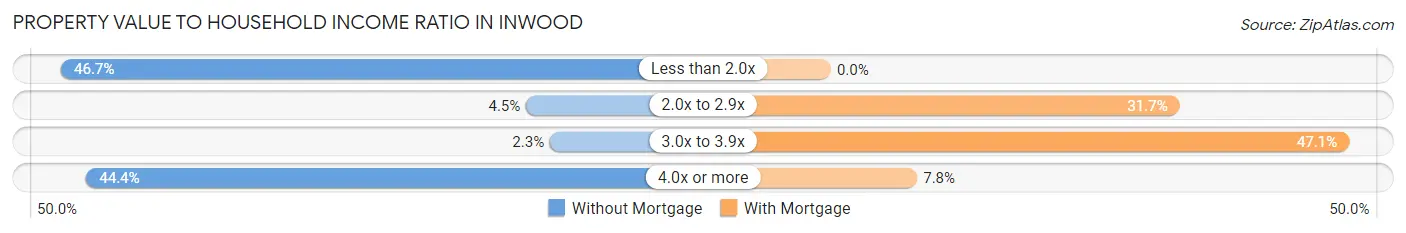
| Value-to-Income Ratio | Without Mortgage | With Mortgage |
| Less than 2.0x | 387 (46.7%) | 0 (0.0%) |
| 2.0x to 2.9x | 37 (4.5%) | 239 (31.7%) |
| 3.0x to 3.9x | 19 (2.3%) | 355 (47.1%) |
| 4.0x or more | 368 (44.4%) | 59 (7.8%) |
| Total | 829 (100.0%) | 753 (100.0%) |
Real Estate Taxes by Mortgage Status in Inwood
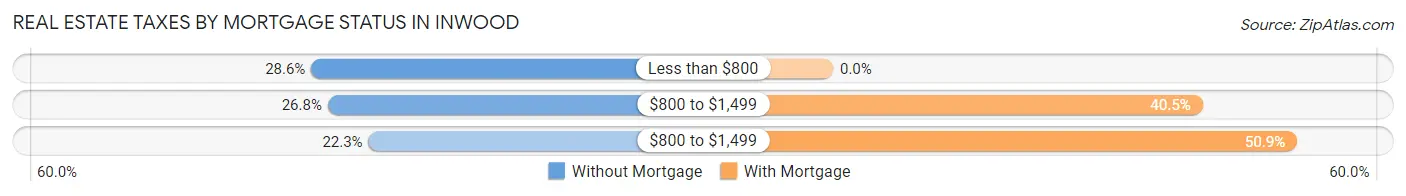
| Property Taxes | Without Mortgage | With Mortgage |
| Less than $800 | 237 (28.6%) | 0 (0.0%) |
| $800 to $1,499 | 222 (26.8%) | 305 (40.5%) |
| $800 to $1,499 | 185 (22.3%) | 383 (50.9%) |
| Total | 829 (100.0%) | 753 (100.0%) |
Health & Disability in Inwood
Health Insurance Coverage by Age in Inwood
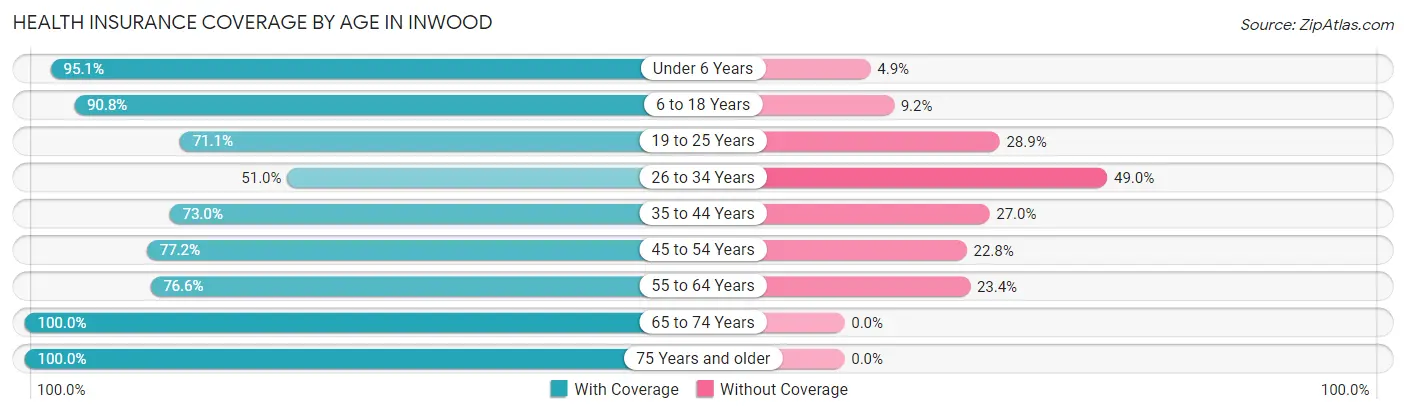
| Age Bracket | With Coverage | Without Coverage |
| Under 6 Years | 509 (95.1%) | 26 (4.9%) |
| 6 to 18 Years | 1,399 (90.8%) | 142 (9.2%) |
| 19 to 25 Years | 491 (71.1%) | 200 (28.9%) |
| 26 to 34 Years | 433 (51.0%) | 416 (49.0%) |
| 35 to 44 Years | 634 (73.0%) | 235 (27.0%) |
| 45 to 54 Years | 718 (77.2%) | 212 (22.8%) |
| 55 to 64 Years | 693 (76.6%) | 212 (23.4%) |
| 65 to 74 Years | 494 (100.0%) | 0 (0.0%) |
| 75 Years and older | 240 (100.0%) | 0 (0.0%) |
| Total | 5,611 (79.5%) | 1,443 (20.5%) |
Health Insurance Coverage by Citizenship Status in Inwood
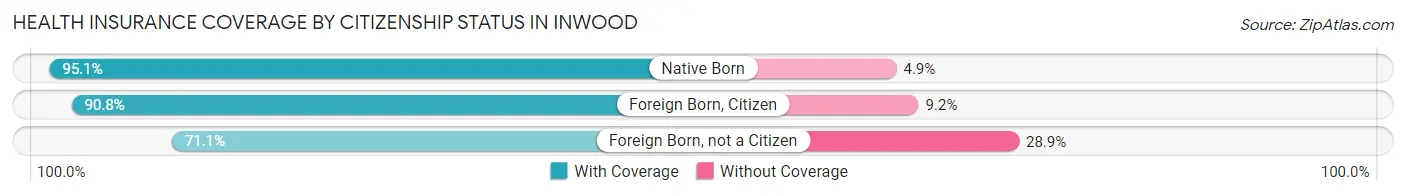
| Citizenship Status | With Coverage | Without Coverage |
| Native Born | 509 (95.1%) | 26 (4.9%) |
| Foreign Born, Citizen | 1,399 (90.8%) | 142 (9.2%) |
| Foreign Born, not a Citizen | 491 (71.1%) | 200 (28.9%) |
Health Insurance Coverage by Household Income in Inwood
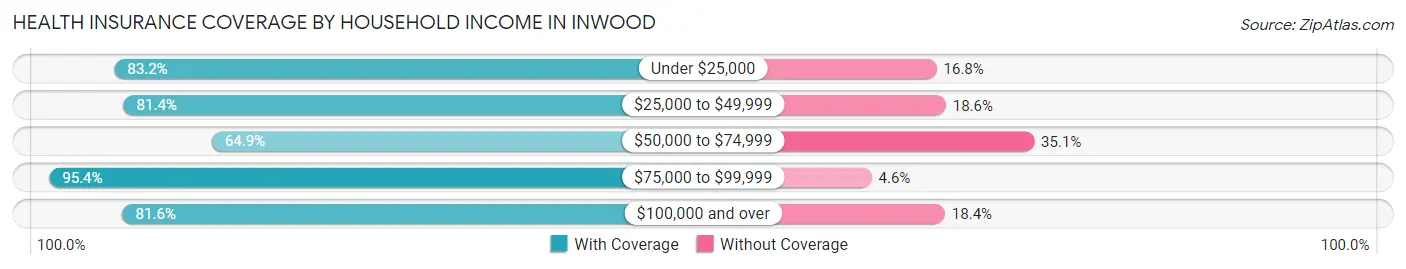
| Household Income | With Coverage | Without Coverage |
| Under $25,000 | 1,186 (83.2%) | 240 (16.8%) |
| $25,000 to $49,999 | 1,711 (81.4%) | 390 (18.6%) |
| $50,000 to $74,999 | 1,030 (64.9%) | 557 (35.1%) |
| $75,000 to $99,999 | 698 (95.4%) | 34 (4.6%) |
| $100,000 and over | 986 (81.6%) | 222 (18.4%) |
Public vs Private Health Insurance Coverage by Age in Inwood
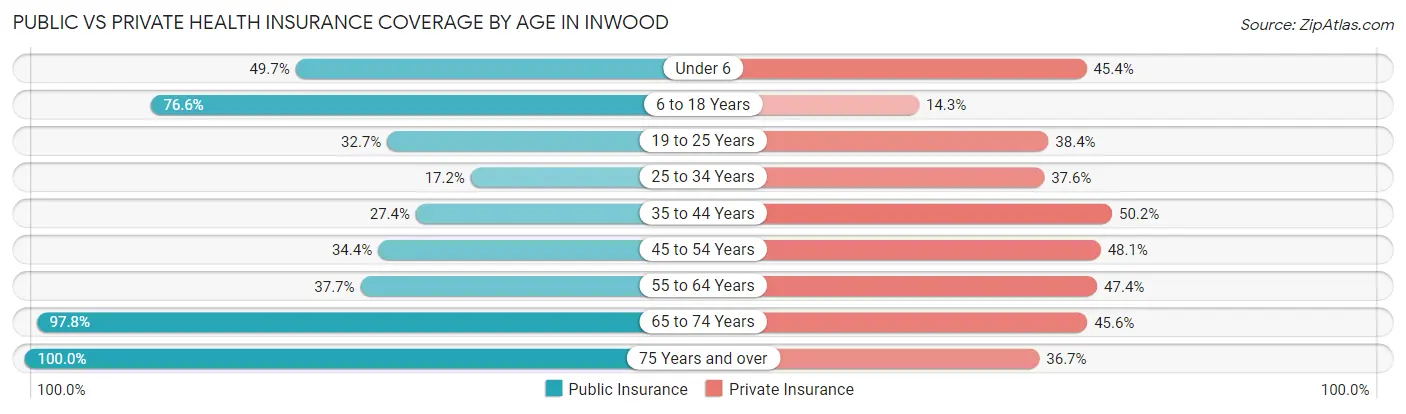
| Age Bracket | Public Insurance | Private Insurance |
| Under 6 | 266 (49.7%) | 243 (45.4%) |
| 6 to 18 Years | 1,181 (76.6%) | 221 (14.3%) |
| 19 to 25 Years | 226 (32.7%) | 265 (38.4%) |
| 25 to 34 Years | 146 (17.2%) | 319 (37.6%) |
| 35 to 44 Years | 238 (27.4%) | 436 (50.2%) |
| 45 to 54 Years | 320 (34.4%) | 447 (48.1%) |
| 55 to 64 Years | 341 (37.7%) | 429 (47.4%) |
| 65 to 74 Years | 483 (97.8%) | 225 (45.6%) |
| 75 Years and over | 240 (100.0%) | 88 (36.7%) |
| Total | 3,441 (48.8%) | 2,673 (37.9%) |
Disability Status by Sex by Age in Inwood

| Age Bracket | Male | Female |
| Under 5 Years | 0 (0.0%) | 0 (0.0%) |
| 5 to 17 Years | 23 (3.4%) | 81 (10.7%) |
| 18 to 34 Years | 56 (6.1%) | 23 (2.8%) |
| 35 to 64 Years | 183 (13.2%) | 132 (10.0%) |
| 65 to 74 Years | 20 (9.1%) | 52 (18.9%) |
| 75 Years and over | 19 (20.9%) | 54 (36.2%) |
Disability Class by Sex by Age in Inwood
Disability Class: Hearing Difficulty
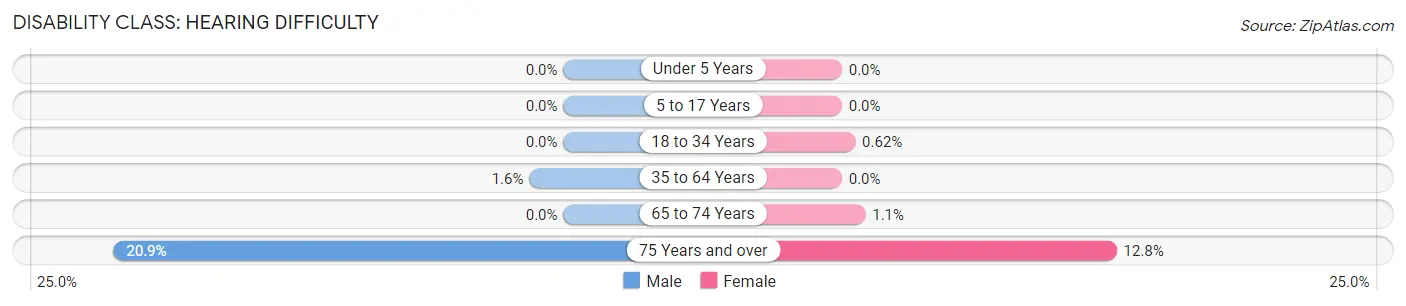
| Age Bracket | Male | Female |
| Under 5 Years | 0 (0.0%) | 0 (0.0%) |
| 5 to 17 Years | 0 (0.0%) | 0 (0.0%) |
| 18 to 34 Years | 0 (0.0%) | 5 (0.6%) |
| 35 to 64 Years | 22 (1.6%) | 0 (0.0%) |
| 65 to 74 Years | 0 (0.0%) | 3 (1.1%) |
| 75 Years and over | 19 (20.9%) | 19 (12.8%) |
Disability Class: Vision Difficulty
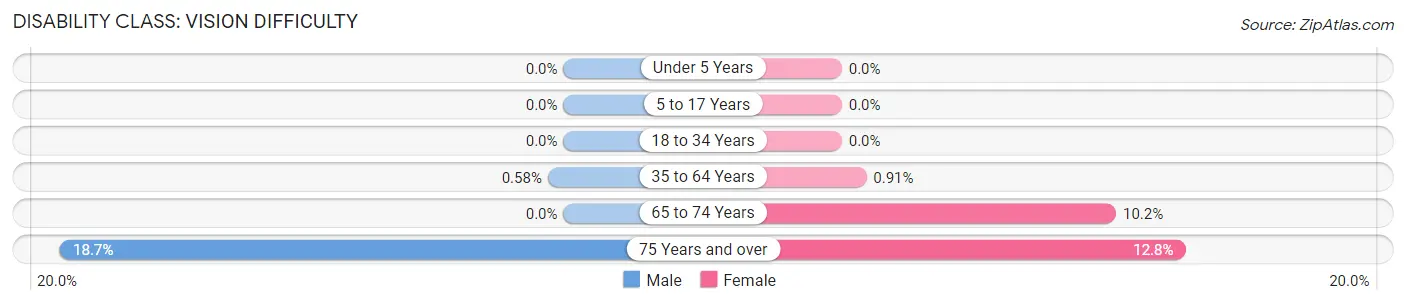
| Age Bracket | Male | Female |
| Under 5 Years | 0 (0.0%) | 0 (0.0%) |
| 5 to 17 Years | 0 (0.0%) | 0 (0.0%) |
| 18 to 34 Years | 0 (0.0%) | 0 (0.0%) |
| 35 to 64 Years | 8 (0.6%) | 12 (0.9%) |
| 65 to 74 Years | 0 (0.0%) | 28 (10.2%) |
| 75 Years and over | 17 (18.7%) | 19 (12.8%) |
Disability Class: Cognitive Difficulty
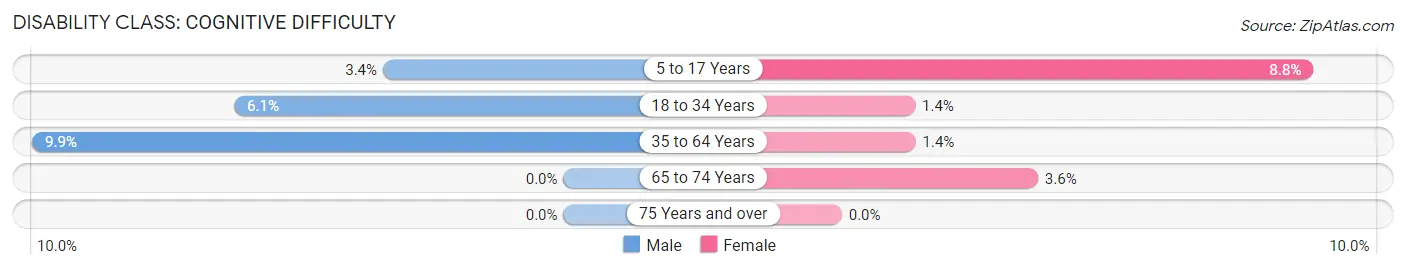
| Age Bracket | Male | Female |
| 5 to 17 Years | 23 (3.4%) | 66 (8.7%) |
| 18 to 34 Years | 56 (6.1%) | 11 (1.4%) |
| 35 to 64 Years | 137 (9.9%) | 18 (1.4%) |
| 65 to 74 Years | 0 (0.0%) | 10 (3.6%) |
| 75 Years and over | 0 (0.0%) | 0 (0.0%) |
Disability Class: Ambulatory Difficulty
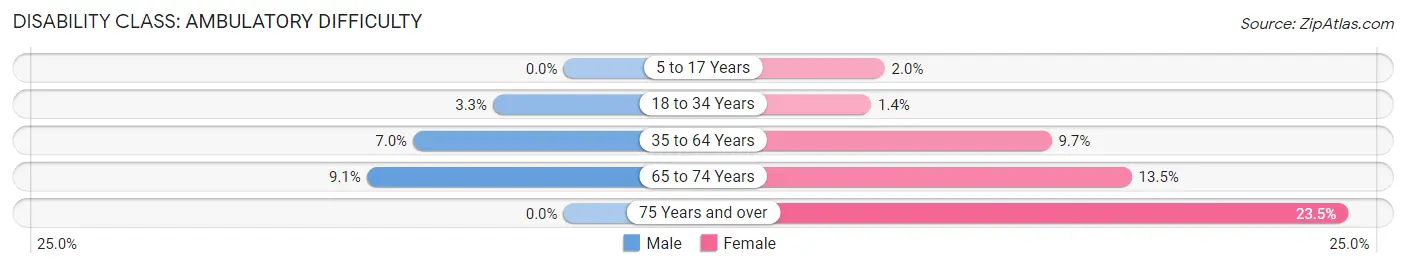
| Age Bracket | Male | Female |
| 5 to 17 Years | 0 (0.0%) | 15 (2.0%) |
| 18 to 34 Years | 30 (3.3%) | 11 (1.4%) |
| 35 to 64 Years | 97 (7.0%) | 128 (9.7%) |
| 65 to 74 Years | 20 (9.1%) | 37 (13.5%) |
| 75 Years and over | 0 (0.0%) | 35 (23.5%) |
Disability Class: Self-Care Difficulty
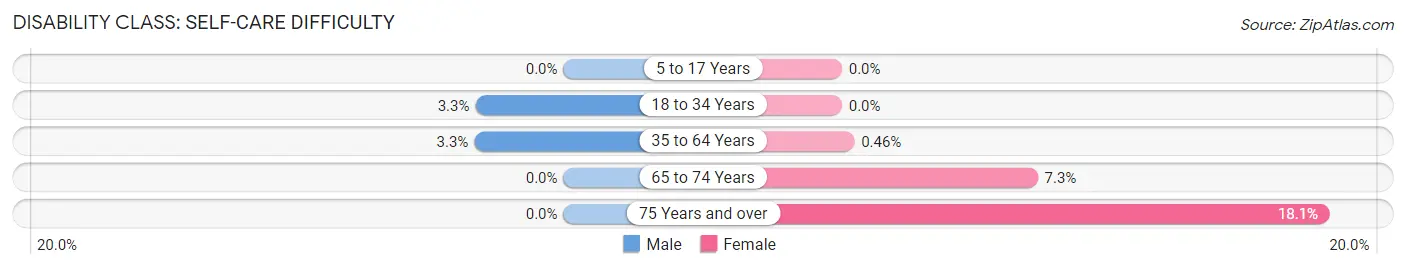
| Age Bracket | Male | Female |
| 5 to 17 Years | 0 (0.0%) | 0 (0.0%) |
| 18 to 34 Years | 30 (3.3%) | 0 (0.0%) |
| 35 to 64 Years | 46 (3.3%) | 6 (0.5%) |
| 65 to 74 Years | 0 (0.0%) | 20 (7.3%) |
| 75 Years and over | 0 (0.0%) | 27 (18.1%) |
Technology Access in Inwood
Computing Device Access in Inwood
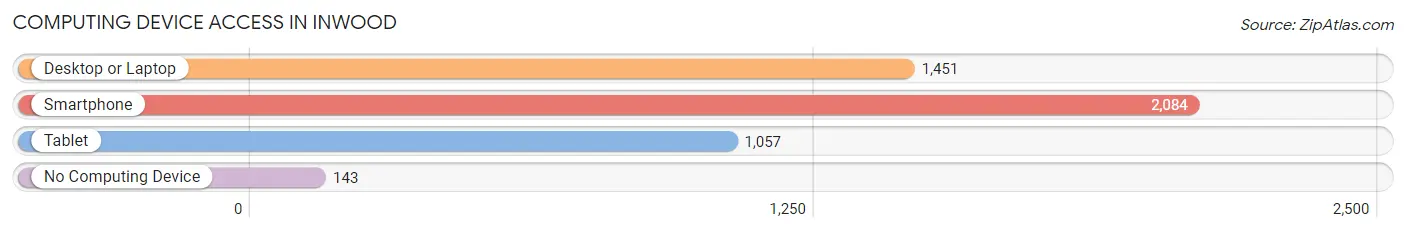
| Device Type | # Households | % Households |
| Desktop or Laptop | 1,451 | 60.7% |
| Smartphone | 2,084 | 87.1% |
| Tablet | 1,057 | 44.2% |
| No Computing Device | 143 | 6.0% |
| Total | 2,392 | 100.0% |
Internet Access in Inwood
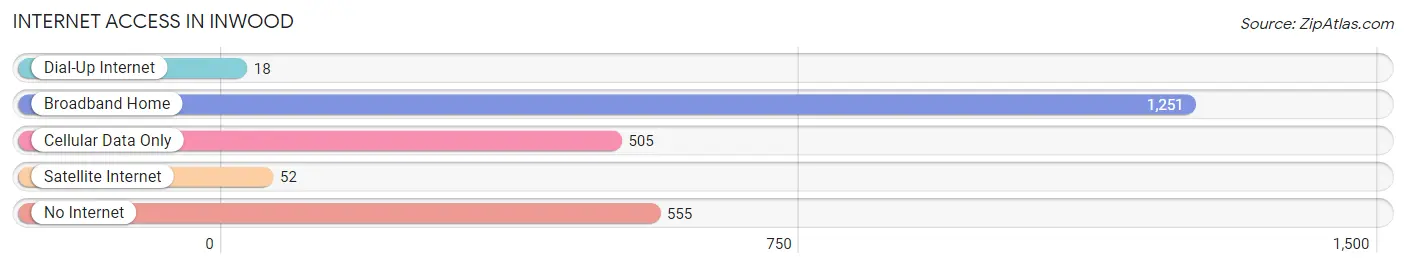
| Internet Type | # Households | % Households |
| Dial-Up Internet | 18 | 0.7% |
| Broadband Home | 1,251 | 52.3% |
| Cellular Data Only | 505 | 21.1% |
| Satellite Internet | 52 | 2.2% |
| No Internet | 555 | 23.2% |
| Total | 2,392 | 100.0% |
Inwood Summary
Inwood is a small unincorporated community located in the western part of Palm Beach County, Florida. It is situated on the south side of the Loxahatchee River, just east of the town of Loxahatchee. The community is bordered by the Loxahatchee National Wildlife Refuge to the north and the Arthur R. Marshall Loxahatchee National Wildlife Refuge to the south.
History
Inwood was first settled in the late 1800s by settlers from the Bahamas. The community was named after the Inwood family, who were among the first settlers. The Inwood family owned a large tract of land in the area, which was used for farming and cattle ranching.
In the early 1900s, the area was developed as a farming community. The Inwood family continued to own and operate the land until the 1950s, when the land was sold to developers. The developers built a number of homes in the area, and the community began to grow.
In the late 1970s, the area was annexed by the City of West Palm Beach. This allowed for the development of the area, and the population began to grow.
Geography
Inwood is located in western Palm Beach County, Florida. It is situated on the south side of the Loxahatchee River, just east of the town of Loxahatchee. The community is bordered by the Loxahatchee National Wildlife Refuge to the north and the Arthur R. Marshall Loxahatchee National Wildlife Refuge to the south.
The area is mostly flat, with some low hills in the area. The soil is sandy and the climate is subtropical. The average temperature is around 75 degrees Fahrenheit, with temperatures ranging from the mid-60s in the winter to the mid-80s in the summer.
Economy
Inwood is primarily a residential community, with most of the residents employed in nearby cities. The area is home to a number of small businesses, including restaurants, convenience stores, and auto repair shops.
The area is also home to a number of farms, which produce a variety of crops, including citrus, vegetables, and hay. The area is also home to a number of nurseries, which produce a variety of plants and flowers.
Demographics
As of the 2010 census, the population of Inwood was 2,845. The population is primarily white (83.3%), with a small percentage of African Americans (7.2%), Hispanics (4.7%), and Asians (2.2%). The median household income is $50,945, and the median home value is $179,000.
The area is served by the Palm Beach County School District, which operates a number of elementary, middle, and high schools in the area. The area is also home to a number of private schools, including the Inwood Christian Academy and the Inwood Academy of Arts and Sciences.
Common Questions
What is Per Capita Income in Inwood?
Per Capita income in Inwood is $19,511.
What is the Median Family Income in Inwood?
Median Family Income in Inwood is $34,916.
What is the Median Household income in Inwood?
Median Household Income in Inwood is $34,815.
What is Income or Wage Gap in Inwood?
Income or Wage Gap in Inwood is 23.1%.
Women in Inwood earn 76.9 cents for every dollar earned by a man.
What is Family Income Deficit in Inwood?
Family Income Deficit in Inwood is $8,952.
Families that are below poverty line in Inwood earn $8,952 less on average than the poverty threshold level.
What is Inequality or Gini Index in Inwood?
Inequality or Gini Index in Inwood is 0.46.
What is the Total Population of Inwood?
Total Population of Inwood is 7,054.
What is the Total Male Population of Inwood?
Total Male Population of Inwood is 3,666.
What is the Total Female Population of Inwood?
Total Female Population of Inwood is 3,388.
What is the Ratio of Males per 100 Females in Inwood?
There are 108.21 Males per 100 Females in Inwood.
What is the Ratio of Females per 100 Males in Inwood?
There are 92.42 Females per 100 Males in Inwood.
What is the Median Population Age in Inwood?
Median Population Age in Inwood is 34.2 Years.
What is the Average Family Size in Inwood
Average Family Size in Inwood is 3.6 People.
What is the Average Household Size in Inwood
Average Household Size in Inwood is 3.0 People.
How Large is the Labor Force in Inwood?
There are 3,279 People in the Labor Forcein in Inwood.
What is the Percentage of People in the Labor Force in Inwood?
60.8% of People are in the Labor Force in Inwood.
What is the Unemployment Rate in Inwood?
Unemployment Rate in Inwood is 7.0%.