South Sumter, SC Map & Demographics
South Sumter Map
South Sumter Overview
$18,433
PER CAPITA INCOME
$58,166
AVG FAMILY INCOME
$40,039
AVG HOUSEHOLD INCOME
32.8%
WAGE / INCOME GAP [ % ]
67.2¢/ $1
WAGE / INCOME GAP [ $ ]
0.35
INEQUALITY / GINI INDEX
1,564
TOTAL POPULATION
673
MALE POPULATION
891
FEMALE POPULATION
75.53
MALES / 100 FEMALES
132.39
FEMALES / 100 MALES
36.0
MEDIAN AGE
3.4
AVG FAMILY SIZE
2.4
AVG HOUSEHOLD SIZE
718
LABOR FORCE [ PEOPLE ]
61.6%
PERCENT IN LABOR FORCE
7.9%
UNEMPLOYMENT RATE
Income in South Sumter
Income Overview in South Sumter
Per Capita Income in South Sumter is $18,433, while median incomes of families and households are $58,166 and $40,039 respectively.
| Characteristic | Number | Measure |
| Per Capita Income | 1,564 | $18,433 |
| Median Family Income | 377 | $58,166 |
| Mean Family Income | 377 | $54,500 |
| Median Household Income | 665 | $40,039 |
| Mean Household Income | 665 | $43,108 |
| Income Deficit | 377 | $0 |
| Wage / Income Gap (%) | 1,564 | 32.83% |
| Wage / Income Gap ($) | 1,564 | 67.17¢ per $1 |
| Gini / Inequality Index | 1,564 | 0.35 |
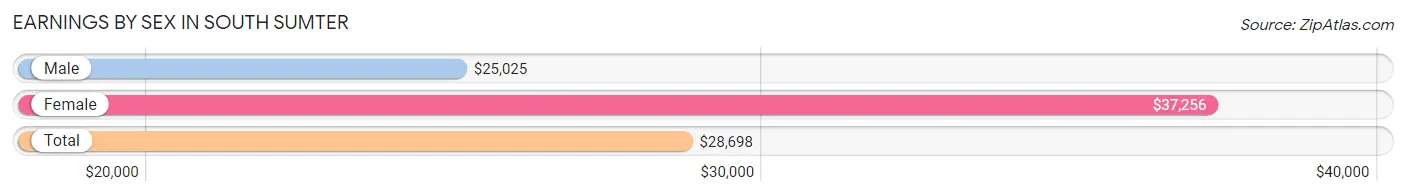
Earnings by Sex in South Sumter
Average Earnings in South Sumter are $28,698, $25,025 for men and $37,256 for women, a difference of 32.8%.
| Sex | Number | Average Earnings |
| Male | 313 (44.9%) | $25,025 |
| Female | 384 (55.1%) | $37,256 |
| Total | 697 (100.0%) | $28,698 |
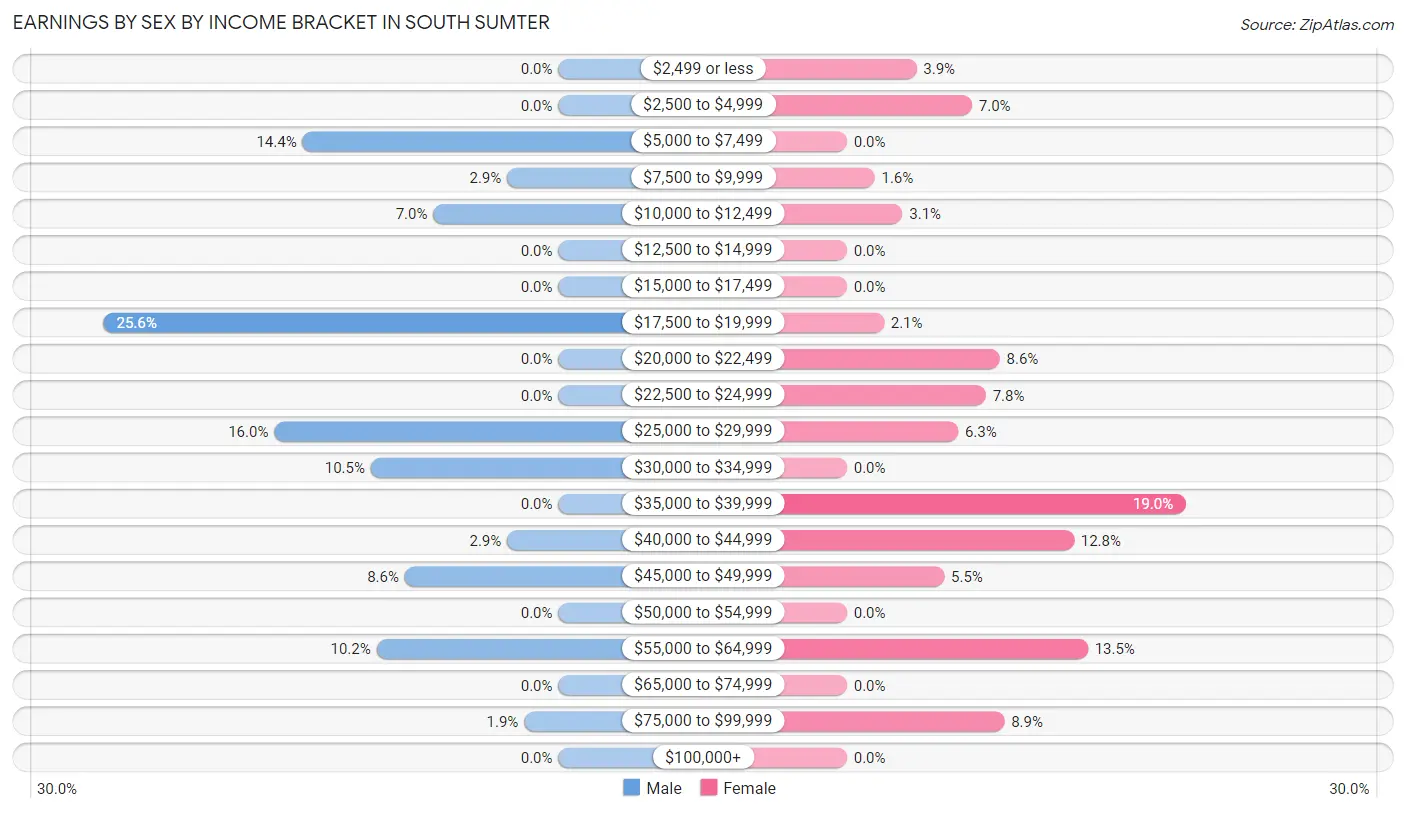
Earnings by Sex by Income Bracket in South Sumter
The most common earnings brackets in South Sumter are $17,500 to $19,999 for men (80 | 25.6%) and $35,000 to $39,999 for women (73 | 19.0%).
| Income | Male | Female |
| $2,499 or less | 0 (0.0%) | 15 (3.9%) |
| $2,500 to $4,999 | 0 (0.0%) | 27 (7.0%) |
| $5,000 to $7,499 | 45 (14.4%) | 0 (0.0%) |
| $7,500 to $9,999 | 9 (2.9%) | 6 (1.6%) |
| $10,000 to $12,499 | 22 (7.0%) | 12 (3.1%) |
| $12,500 to $14,999 | 0 (0.0%) | 0 (0.0%) |
| $15,000 to $17,499 | 0 (0.0%) | 0 (0.0%) |
| $17,500 to $19,999 | 80 (25.6%) | 8 (2.1%) |
| $20,000 to $22,499 | 0 (0.0%) | 33 (8.6%) |
| $22,500 to $24,999 | 0 (0.0%) | 30 (7.8%) |
| $25,000 to $29,999 | 50 (16.0%) | 24 (6.2%) |
| $30,000 to $34,999 | 33 (10.5%) | 0 (0.0%) |
| $35,000 to $39,999 | 0 (0.0%) | 73 (19.0%) |
| $40,000 to $44,999 | 9 (2.9%) | 49 (12.8%) |
| $45,000 to $49,999 | 27 (8.6%) | 21 (5.5%) |
| $50,000 to $54,999 | 0 (0.0%) | 0 (0.0%) |
| $55,000 to $64,999 | 32 (10.2%) | 52 (13.5%) |
| $65,000 to $74,999 | 0 (0.0%) | 0 (0.0%) |
| $75,000 to $99,999 | 6 (1.9%) | 34 (8.8%) |
| $100,000+ | 0 (0.0%) | 0 (0.0%) |
| Total | 313 (100.0%) | 384 (100.0%) |
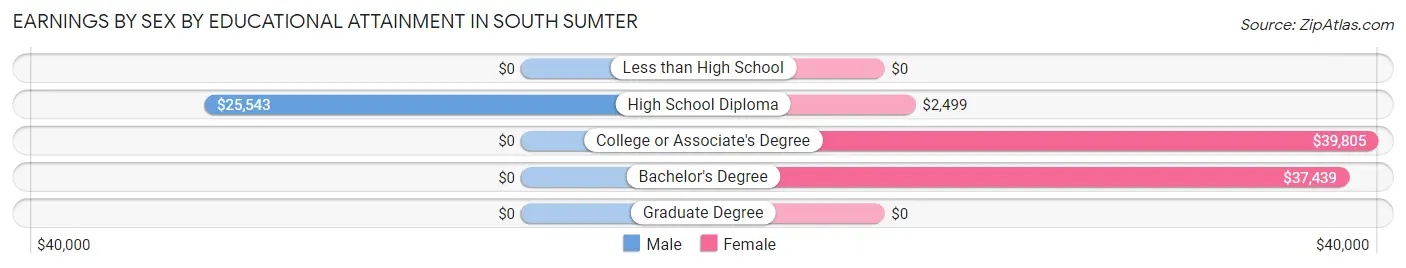
Earnings by Sex by Educational Attainment in South Sumter
Average earnings in South Sumter are $25,025 for men and $40,234 for women, a difference of 37.8%. Men with an educational attainment of high school diploma enjoy the highest average annual earnings of $25,543, while those with high school diploma education earn the least with $25,543. Women with an educational attainment of college or associate's degree earn the most with the average annual earnings of $39,805, while those with high school diploma education have the smallest earnings of $2,499.
| Educational Attainment | Male Income | Female Income |
| Less than High School | - | - |
| High School Diploma | $25,543 | $2,499 |
| College or Associate's Degree | - | - |
| Bachelor's Degree | - | - |
| Graduate Degree | - | - |
| Total | $25,025 | $40,234 |
Family Income in South Sumter
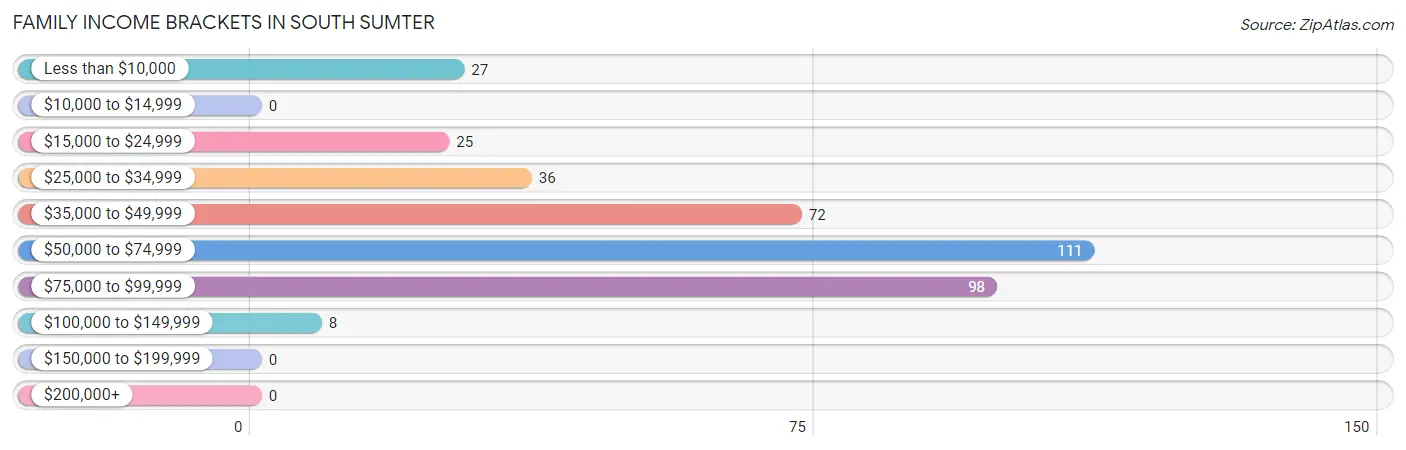
Family Income Brackets in South Sumter
According to the South Sumter family income data, there are 111 families falling into the $50,000 to $74,999 income range, which is the most common income bracket and makes up 29.4% of all families.
| Income Bracket | # Families | % Families |
| Less than $10,000 | 27 | 7.2% |
| $10,000 to $14,999 | 0 | 0.0% |
| $15,000 to $24,999 | 25 | 6.6% |
| $25,000 to $34,999 | 36 | 9.5% |
| $35,000 to $49,999 | 72 | 19.1% |
| $50,000 to $74,999 | 111 | 29.4% |
| $75,000 to $99,999 | 98 | 26.0% |
| $100,000 to $149,999 | 8 | 2.1% |
| $150,000 to $199,999 | 0 | 0.0% |
| $200,000+ | 0 | 0.0% |
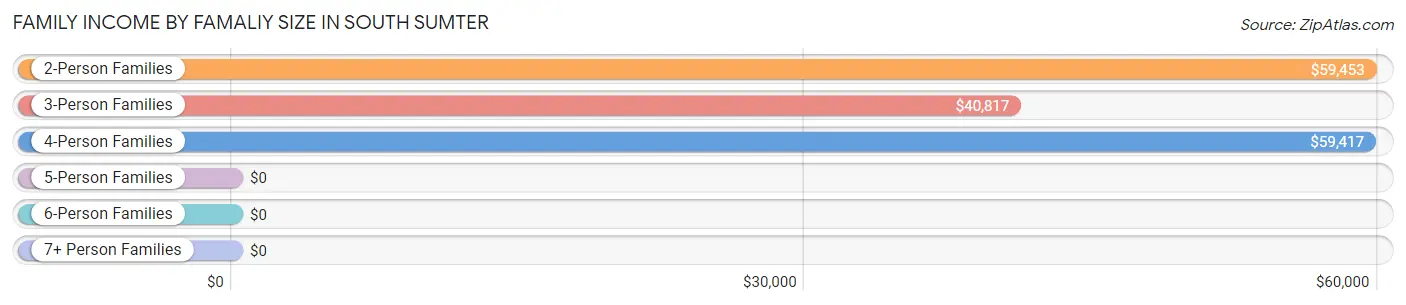
Family Income by Famaliy Size in South Sumter
2-person families (126 | 33.4%) account for the highest median family income in South Sumter with $59,453 per family, while 2-person families (126 | 33.4%) have the highest median income of $29,726 per family member.
| Income Bracket | # Families | Median Income |
| 2-Person Families | 126 (33.4%) | $59,453 |
| 3-Person Families | 121 (32.1%) | $40,817 |
| 4-Person Families | 91 (24.1%) | $59,417 |
| 5-Person Families | 31 (8.2%) | $0 |
| 6-Person Families | 8 (2.1%) | $0 |
| 7+ Person Families | 0 (0.0%) | $0 |
| Total | 377 (100.0%) | $58,166 |
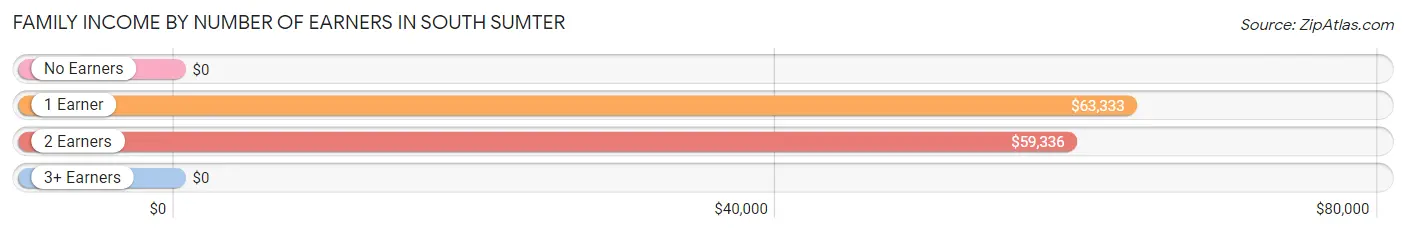
Family Income by Number of Earners in South Sumter
| Number of Earners | # Families | Median Income |
| No Earners | 69 (18.3%) | $0 |
| 1 Earner | 136 (36.1%) | $63,333 |
| 2 Earners | 127 (33.7%) | $59,336 |
| 3+ Earners | 45 (11.9%) | $0 |
| Total | 377 (100.0%) | $58,166 |
Household Income in South Sumter
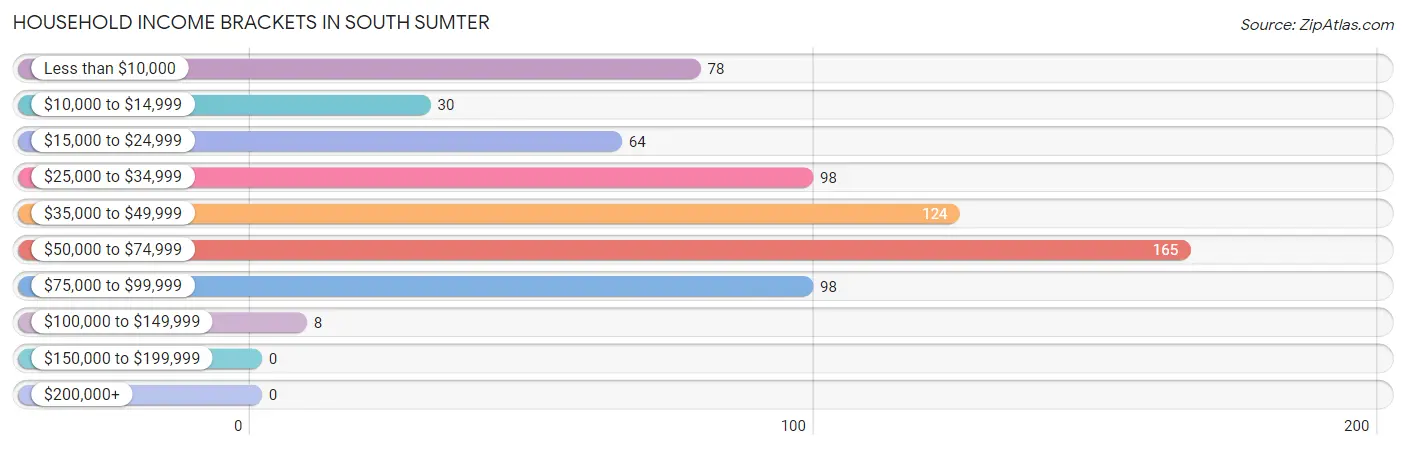
Household Income Brackets in South Sumter
With 165 households falling in the category, the $50,000 to $74,999 income range is the most frequent in South Sumter, accounting for 24.8% of all households.
| Income Bracket | # Households | % Households |
| Less than $10,000 | 78 | 11.7% |
| $10,000 to $14,999 | 30 | 4.5% |
| $15,000 to $24,999 | 64 | 9.6% |
| $25,000 to $34,999 | 98 | 14.7% |
| $35,000 to $49,999 | 124 | 18.6% |
| $50,000 to $74,999 | 165 | 24.8% |
| $75,000 to $99,999 | 98 | 14.7% |
| $100,000 to $149,999 | 8 | 1.2% |
| $150,000 to $199,999 | 0 | 0.0% |
| $200,000+ | 0 | 0.0% |
Household Income by Householder Age in South Sumter
The median household income in South Sumter is $40,039, with the highest median household income of $46,500 found in the 25 to 44 years age bracket for the primary householder. A total of 142 households (21.3%) fall into this category. Meanwhile, the 15 to 24 years age bracket for the primary householder has the lowest median household income of $0, with 24 households (3.6%) in this group.
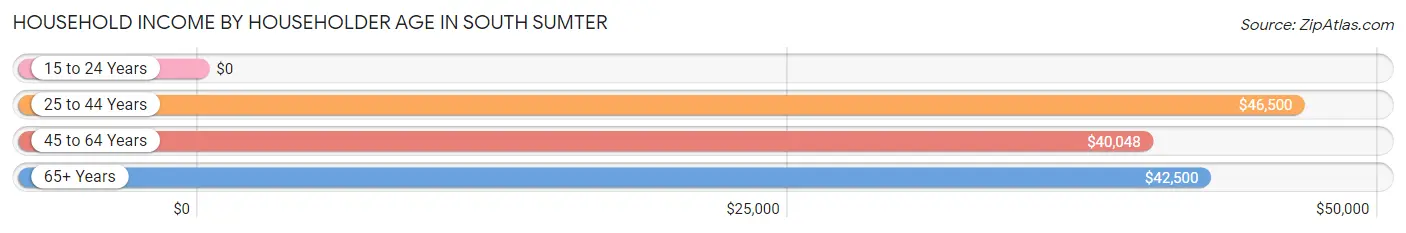
| Income Bracket | # Households | Median Income |
| 15 to 24 Years | 24 (3.6%) | $0 |
| 25 to 44 Years | 142 (21.3%) | $46,500 |
| 45 to 64 Years | 297 (44.7%) | $40,048 |
| 65+ Years | 202 (30.4%) | $42,500 |
| Total | 665 (100.0%) | $40,039 |
Poverty in South Sumter
Income Below Poverty by Sex and Age in South Sumter
With 21.7% poverty level for males and 23.8% for females among the residents of South Sumter, 6 to 11 year old males and under 5 year old females are the most vulnerable to poverty, with 53 males (82.8%) and 50 females (100.0%) in their respective age groups living below the poverty level.
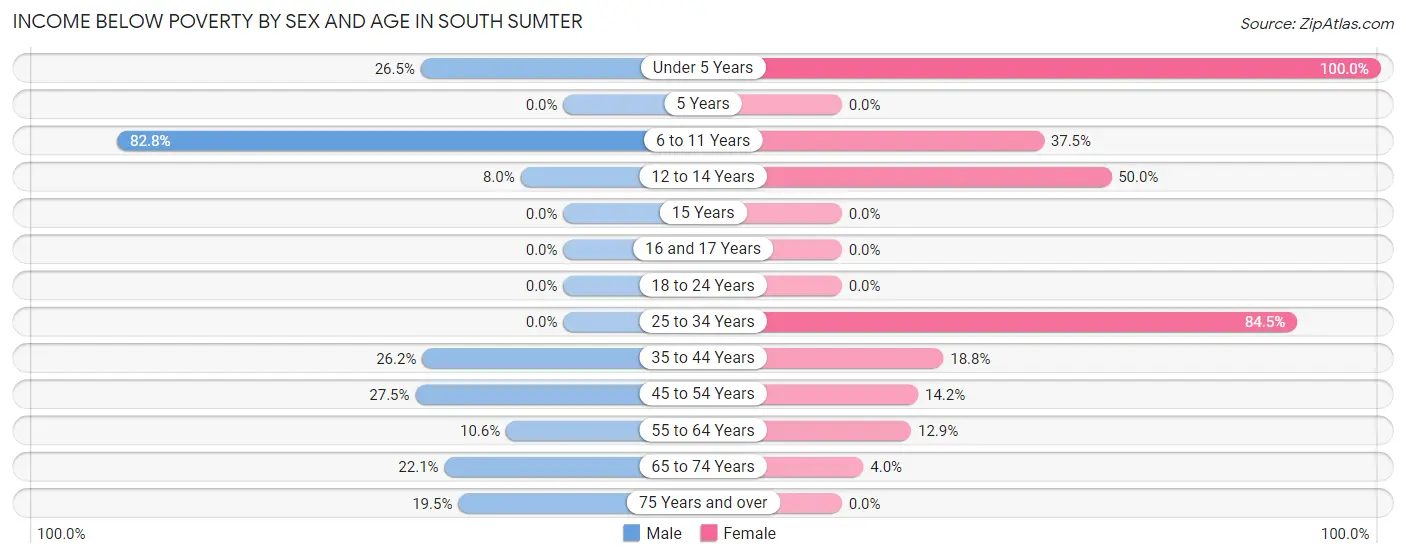
| Age Bracket | Male | Female |
| Under 5 Years | 9 (26.5%) | 50 (100.0%) |
| 5 Years | 0 (0.0%) | 0 (0.0%) |
| 6 to 11 Years | 53 (82.8%) | 30 (37.5%) |
| 12 to 14 Years | 7 (8.0%) | 21 (50.0%) |
| 15 Years | 0 (0.0%) | 0 (0.0%) |
| 16 and 17 Years | 0 (0.0%) | 0 (0.0%) |
| 18 to 24 Years | 0 (0.0%) | 0 (0.0%) |
| 25 to 34 Years | 0 (0.0%) | 60 (84.5%) |
| 35 to 44 Years | 22 (26.2%) | 13 (18.8%) |
| 45 to 54 Years | 25 (27.5%) | 16 (14.2%) |
| 55 to 64 Years | 5 (10.6%) | 18 (12.9%) |
| 65 to 74 Years | 17 (22.1%) | 4 (4.0%) |
| 75 Years and over | 8 (19.5%) | 0 (0.0%) |
| Total | 146 (21.7%) | 212 (23.8%) |
Income Above Poverty by Sex and Age in South Sumter
According to the poverty statistics in South Sumter, males aged 15 years and females aged 16 and 17 years are the age groups that are most secure financially, with 100.0% of males and 100.0% of females in these age groups living above the poverty line.
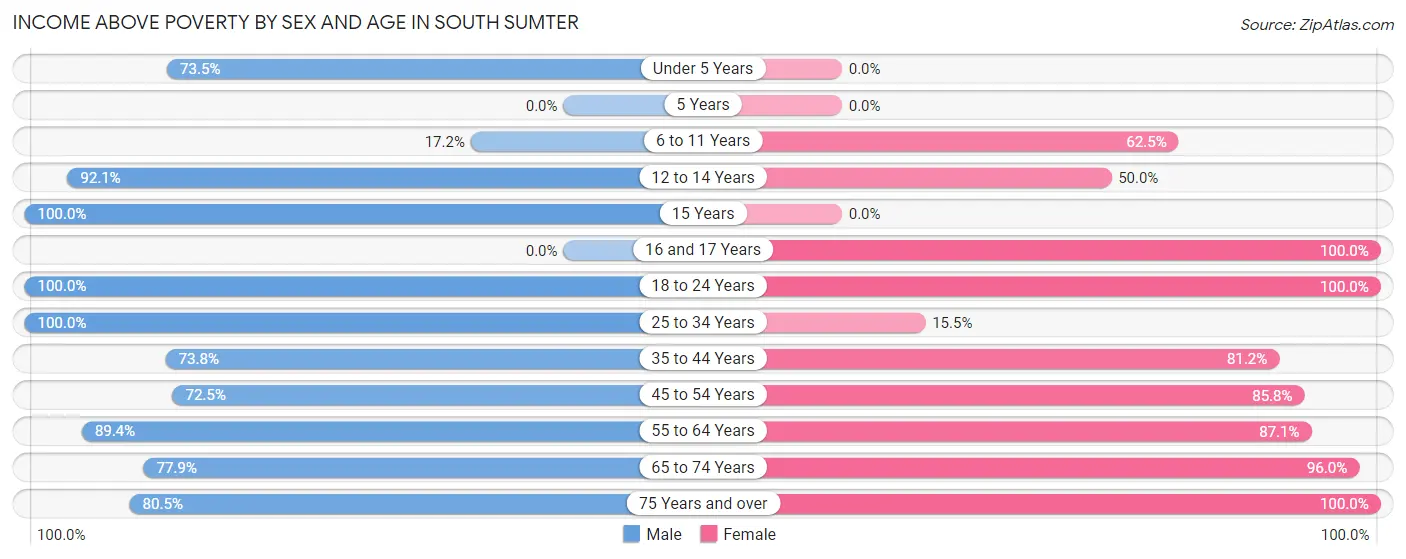
| Age Bracket | Male | Female |
| Under 5 Years | 25 (73.5%) | 0 (0.0%) |
| 5 Years | 0 (0.0%) | 0 (0.0%) |
| 6 to 11 Years | 11 (17.2%) | 50 (62.5%) |
| 12 to 14 Years | 81 (92.0%) | 21 (50.0%) |
| 15 Years | 40 (100.0%) | 0 (0.0%) |
| 16 and 17 Years | 0 (0.0%) | 32 (100.0%) |
| 18 to 24 Years | 40 (100.0%) | 166 (100.0%) |
| 25 to 34 Years | 67 (100.0%) | 11 (15.5%) |
| 35 to 44 Years | 62 (73.8%) | 56 (81.2%) |
| 45 to 54 Years | 66 (72.5%) | 97 (85.8%) |
| 55 to 64 Years | 42 (89.4%) | 122 (87.1%) |
| 65 to 74 Years | 60 (77.9%) | 96 (96.0%) |
| 75 Years and over | 33 (80.5%) | 28 (100.0%) |
| Total | 527 (78.3%) | 679 (76.2%) |
Income Below Poverty Among Married-Couple Families in South Sumter
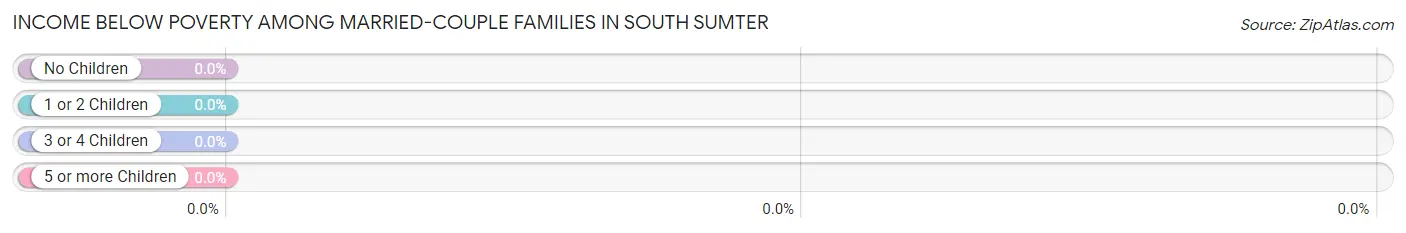
| Children | Above Poverty | Below Poverty |
| No Children | 80 (100.0%) | 0 (0.0%) |
| 1 or 2 Children | 46 (100.0%) | 0 (0.0%) |
| 3 or 4 Children | 0 (0.0%) | 0 (0.0%) |
| 5 or more Children | 0 (0.0%) | 0 (0.0%) |
| Total | 126 (100.0%) | 0 (0.0%) |
Income Below Poverty Among Single-Parent Households in South Sumter
According to the poverty data in South Sumter, 27.8% or 25 single-father households and 22.4% or 36 single-mother households are living below the poverty line. Among single-father households, those with 1 or 2 children have the highest poverty rate, with 25 households (100.0%) experiencing poverty. Likewise, among single-mother households, those with 3 or 4 children have the highest poverty rate, with 31 households (100.0%) falling below the poverty line.
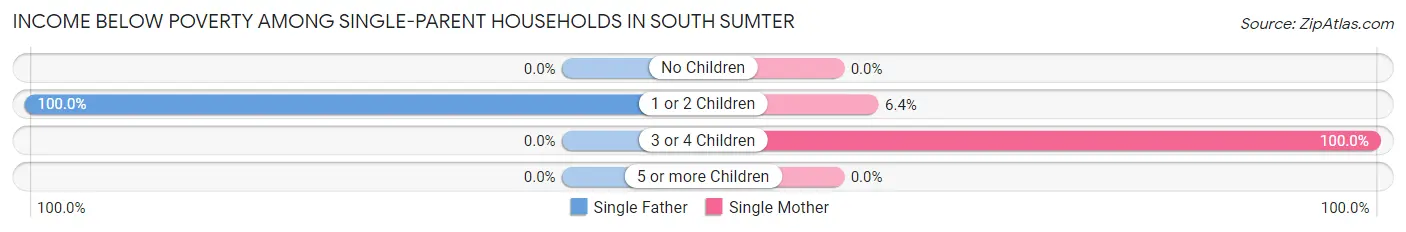
| Children | Single Father | Single Mother |
| No Children | 0 (0.0%) | 0 (0.0%) |
| 1 or 2 Children | 25 (100.0%) | 5 (6.4%) |
| 3 or 4 Children | 0 (0.0%) | 31 (100.0%) |
| 5 or more Children | 0 (0.0%) | 0 (0.0%) |
| Total | 25 (27.8%) | 36 (22.4%) |
Income Below Poverty Among Married-Couple vs Single-Parent Households in South Sumter
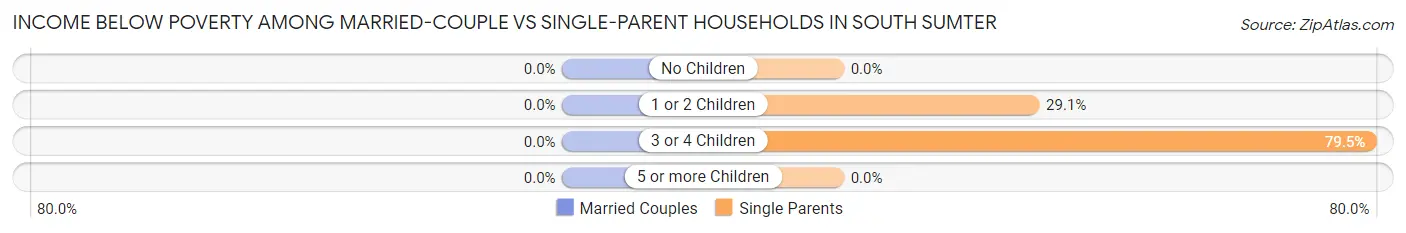
| Children | Married-Couple Families | Single-Parent Households |
| No Children | 0 (0.0%) | 0 (0.0%) |
| 1 or 2 Children | 0 (0.0%) | 30 (29.1%) |
| 3 or 4 Children | 0 (0.0%) | 31 (79.5%) |
| 5 or more Children | 0 (0.0%) | 0 (0.0%) |
| Total | 0 (0.0%) | 61 (24.3%) |
Race in South Sumter
The most populous races in South Sumter are Black / African American (1,452 | 92.8%), White / Caucasian (112 | 7.2%), and Hispanic or Latino (78 | 5.0%).
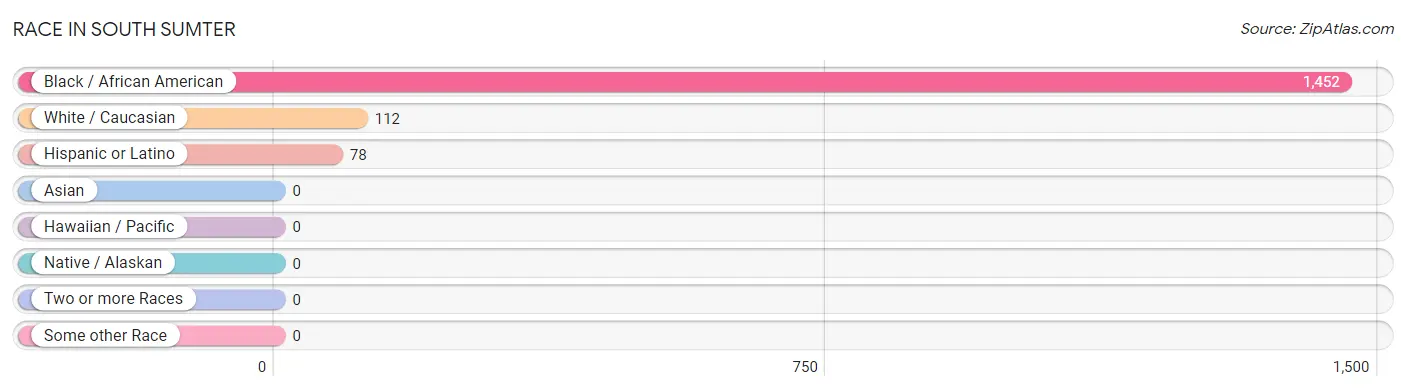
| Race | # Population | % Population |
| Asian | 0 | 0.0% |
| Black / African American | 1,452 | 92.8% |
| Hawaiian / Pacific | 0 | 0.0% |
| Hispanic or Latino | 78 | 5.0% |
| Native / Alaskan | 0 | 0.0% |
| White / Caucasian | 112 | 7.2% |
| Two or more Races | 0 | 0.0% |
| Some other Race | 0 | 0.0% |
| Total | 1,564 | 100.0% |
Ancestry in South Sumter
The most populous ancestries reported in South Sumter are Spanish (78 | 5.0%), American (22 | 1.4%), British West Indian (19 | 1.2%), African (15 | 1.0%), and Subsaharan African (15 | 1.0%), together accounting for 9.5% of all South Sumter residents.
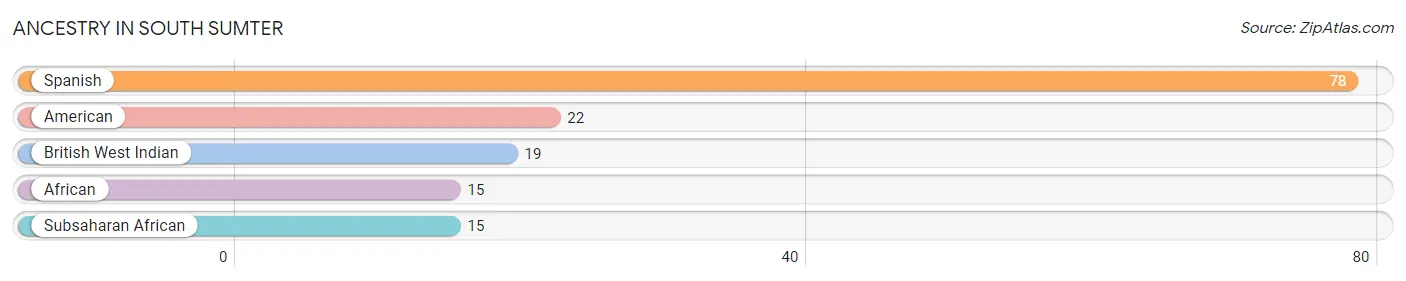
| Ancestry | # Population | % Population |
| African | 15 | 1.0% |
| American | 22 | 1.4% |
| British West Indian | 19 | 1.2% |
| Spanish | 78 | 5.0% |
| Subsaharan African | 15 | 1.0% | View All 5 Rows |
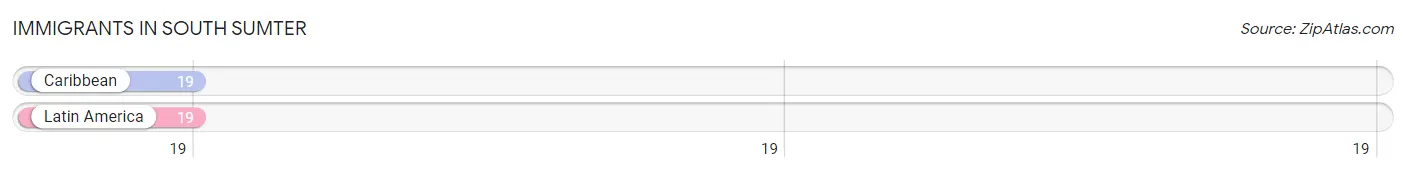
Immigrants in South Sumter
The most numerous immigrant groups reported in South Sumter came from Caribbean (19 | 1.2%), and Latin America (19 | 1.2%), together accounting for 2.4% of all South Sumter residents.
| Immigration Origin | # Population | % Population |
| Caribbean | 19 | 1.2% |
| Latin America | 19 | 1.2% | View All 2 Rows |
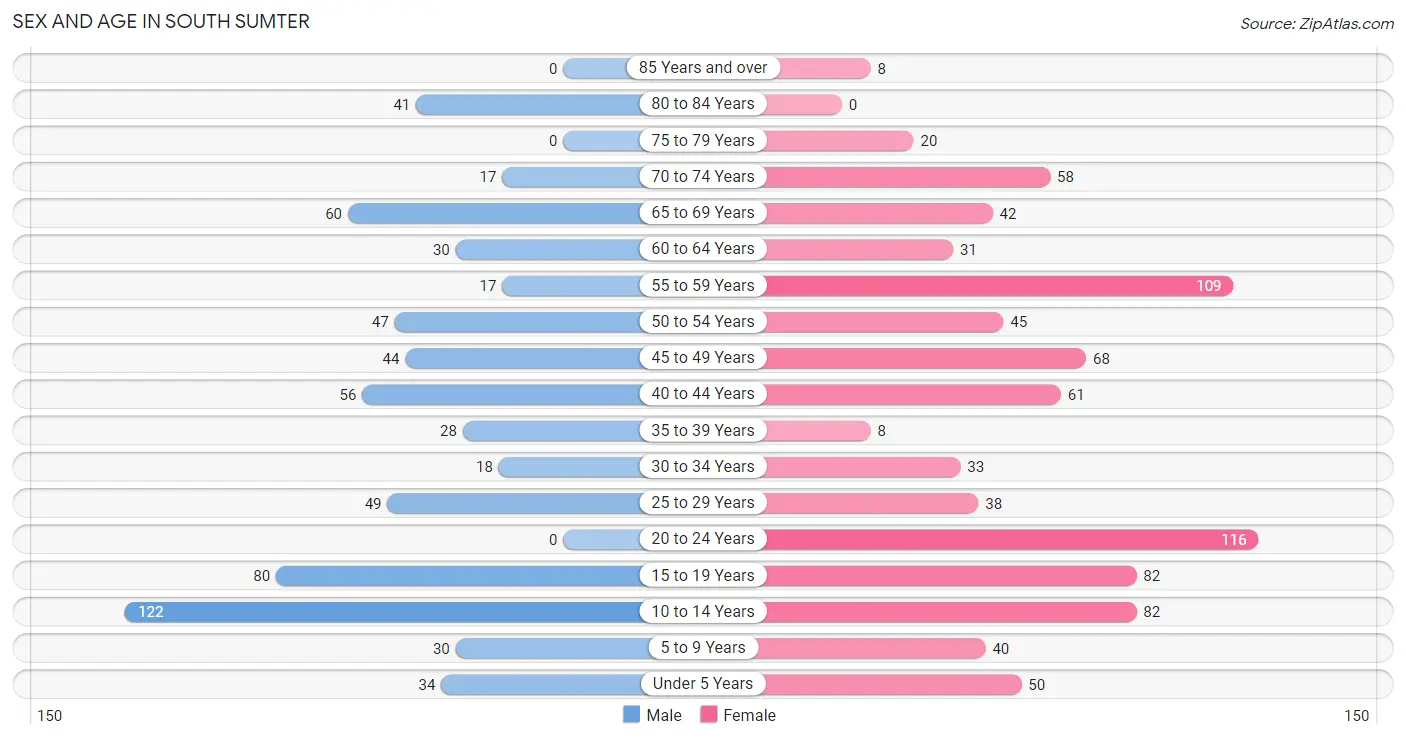
Sex and Age in South Sumter
Sex and Age in South Sumter
The most populous age groups in South Sumter are 10 to 14 Years (122 | 18.1%) for men and 20 to 24 Years (116 | 13.0%) for women.
| Age Bracket | Male | Female |
| Under 5 Years | 34 (5.1%) | 50 (5.6%) |
| 5 to 9 Years | 30 (4.5%) | 40 (4.5%) |
| 10 to 14 Years | 122 (18.1%) | 82 (9.2%) |
| 15 to 19 Years | 80 (11.9%) | 82 (9.2%) |
| 20 to 24 Years | 0 (0.0%) | 116 (13.0%) |
| 25 to 29 Years | 49 (7.3%) | 38 (4.3%) |
| 30 to 34 Years | 18 (2.7%) | 33 (3.7%) |
| 35 to 39 Years | 28 (4.2%) | 8 (0.9%) |
| 40 to 44 Years | 56 (8.3%) | 61 (6.9%) |
| 45 to 49 Years | 44 (6.5%) | 68 (7.6%) |
| 50 to 54 Years | 47 (7.0%) | 45 (5.1%) |
| 55 to 59 Years | 17 (2.5%) | 109 (12.2%) |
| 60 to 64 Years | 30 (4.5%) | 31 (3.5%) |
| 65 to 69 Years | 60 (8.9%) | 42 (4.7%) |
| 70 to 74 Years | 17 (2.5%) | 58 (6.5%) |
| 75 to 79 Years | 0 (0.0%) | 20 (2.2%) |
| 80 to 84 Years | 41 (6.1%) | 0 (0.0%) |
| 85 Years and over | 0 (0.0%) | 8 (0.9%) |
| Total | 673 (100.0%) | 891 (100.0%) |
Families and Households in South Sumter
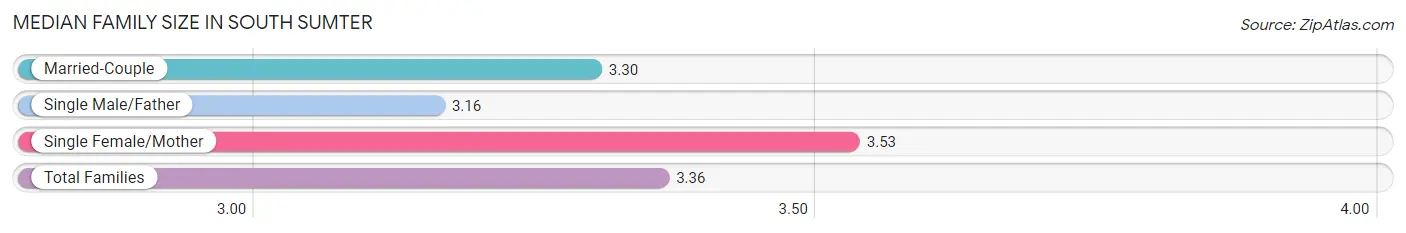
Median Family Size in South Sumter
The median family size in South Sumter is 3.36 persons per family, with single female/mother families (161 | 42.7%) accounting for the largest median family size of 3.53 persons per family. On the other hand, single male/father families (90 | 23.9%) represent the smallest median family size with 3.16 persons per family.
| Family Type | # Families | Family Size |
| Married-Couple | 126 (33.4%) | 3.30 |
| Single Male/Father | 90 (23.9%) | 3.16 |
| Single Female/Mother | 161 (42.7%) | 3.53 |
| Total Families | 377 (100.0%) | 3.36 |
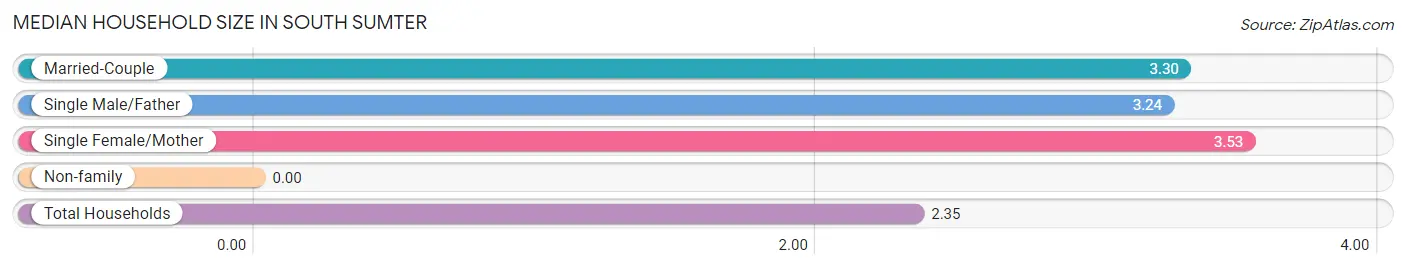
Median Household Size in South Sumter
| Household Type | # Households | Household Size |
| Married-Couple | 126 (19.0%) | 3.30 |
| Single Male/Father | 90 (13.5%) | 3.24 |
| Single Female/Mother | 161 (24.2%) | 3.53 |
| Non-family | 288 (43.3%) | - |
| Total Households | 665 (100.0%) | 2.35 |
Household Size by Marriage Status in South Sumter
Out of a total of 665 households in South Sumter, 377 (56.7%) are family households, while 288 (43.3%) are nonfamily households. The most numerous type of family households are 2-person households, comprising 126, and the most common type of nonfamily households are 1-person households, comprising 288.
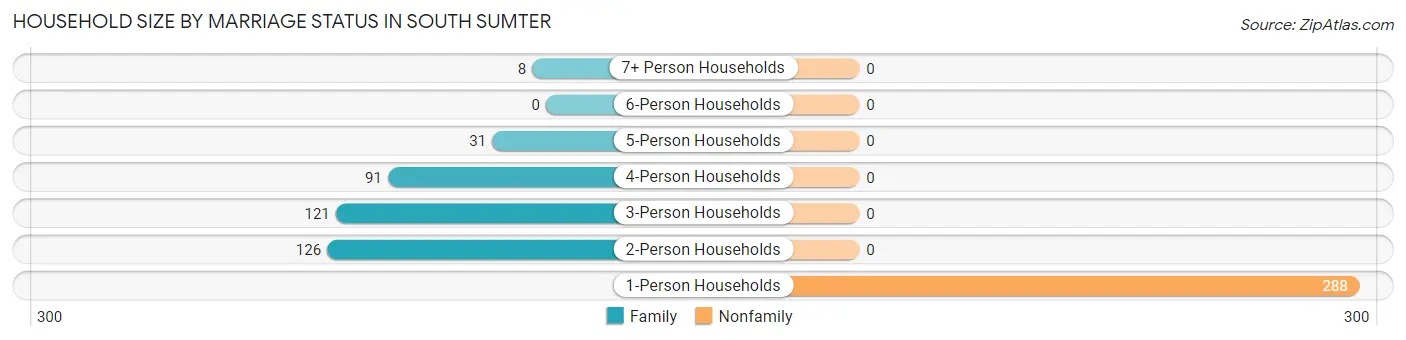
| Household Size | Family Households | Nonfamily Households |
| 1-Person Households | - | 288 (43.3%) |
| 2-Person Households | 126 (19.0%) | 0 (0.0%) |
| 3-Person Households | 121 (18.2%) | 0 (0.0%) |
| 4-Person Households | 91 (13.7%) | 0 (0.0%) |
| 5-Person Households | 31 (4.7%) | 0 (0.0%) |
| 6-Person Households | 0 (0.0%) | 0 (0.0%) |
| 7+ Person Households | 8 (1.2%) | 0 (0.0%) |
| Total | 377 (56.7%) | 288 (43.3%) |
Female Fertility in South Sumter
Fertility by Age in South Sumter
Average fertility rate in South Sumter is 118.0 births per 1,000 women. Women in the age bracket of 20 to 34 years have the highest fertility rate with 257.0 births per 1,000 women. Women in the age bracket of 20 to 34 years acount for 100.0% of all women with births.
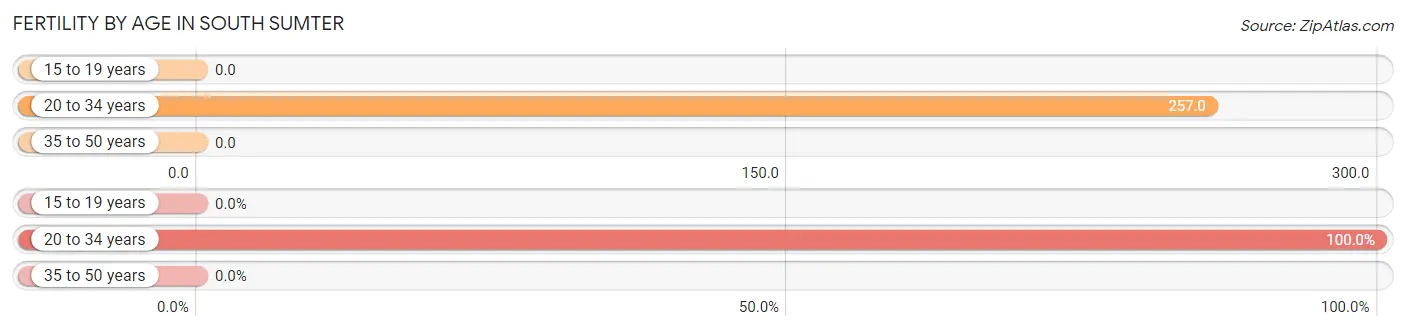
| Age Bracket | Women with Births | Births / 1,000 Women |
| 15 to 19 years | 0 (0.0%) | 0.0 |
| 20 to 34 years | 48 (100.0%) | 257.0 |
| 35 to 50 years | 0 (0.0%) | 0.0 |
| Total | 48 (100.0%) | 118.0 |
Fertility by Age by Marriage Status in South Sumter
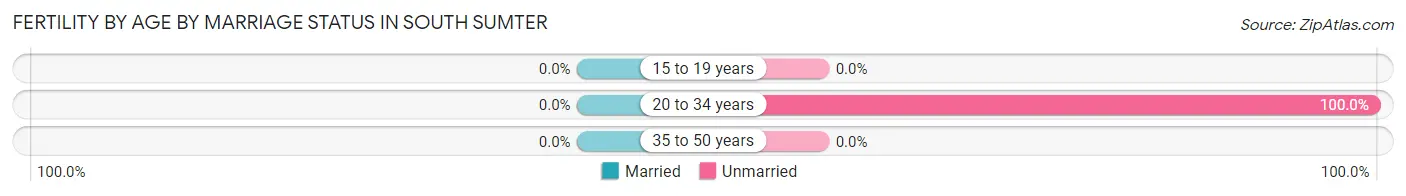
| Age Bracket | Married | Unmarried |
| 15 to 19 years | 0 (0.0%) | 0 (0.0%) |
| 20 to 34 years | 0 (0.0%) | 48 (100.0%) |
| 35 to 50 years | 0 (0.0%) | 0 (0.0%) |
| Total | 0 (0.0%) | 48 (100.0%) |
Fertility by Education in South Sumter
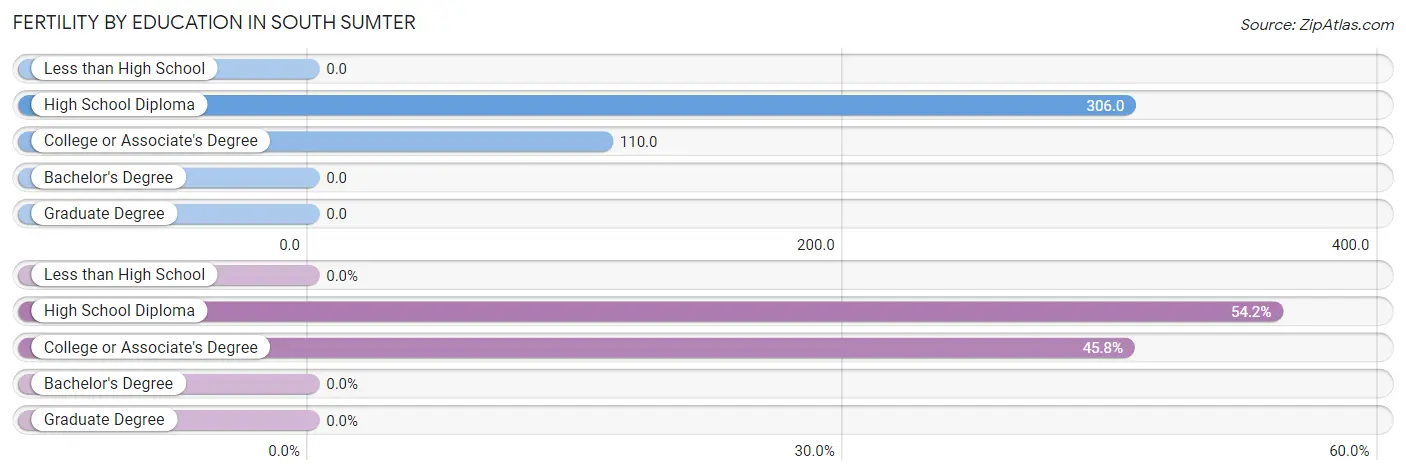
| Educational Attainment | Women with Births | Births / 1,000 Women |
| Less than High School | 0 (0.0%) | 0.0 |
| High School Diploma | 26 (54.2%) | 306.0 |
| College or Associate's Degree | 22 (45.8%) | 110.0 |
| Bachelor's Degree | 0 (0.0%) | 0.0 |
| Graduate Degree | 0 (0.0%) | 0.0 |
| Total | 48 (100.0%) | 118.0 |
Fertility by Education by Marriage Status in South Sumter
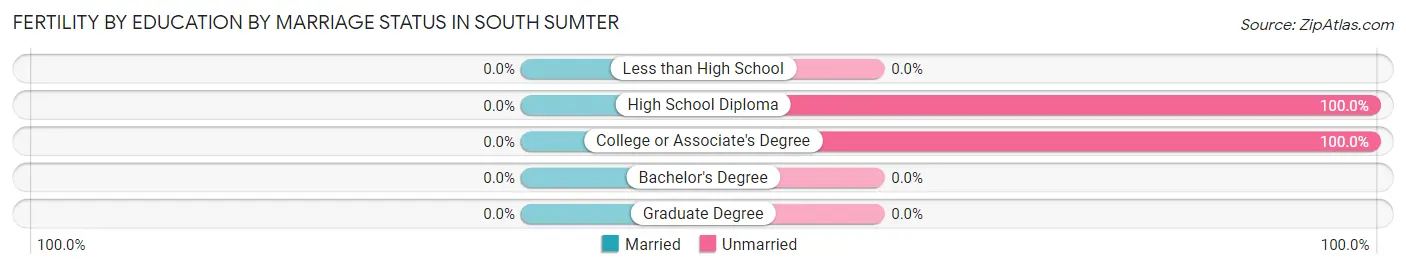
| Educational Attainment | Married | Unmarried |
| Less than High School | 0 (0.0%) | 0 (0.0%) |
| High School Diploma | 0 (0.0%) | 26 (100.0%) |
| College or Associate's Degree | 0 (0.0%) | 22 (100.0%) |
| Bachelor's Degree | 0 (0.0%) | 0 (0.0%) |
| Graduate Degree | 0 (0.0%) | 0 (0.0%) |
| Total | 0 (0.0%) | 48 (100.0%) |
Employment Characteristics in South Sumter
Employment by Class of Employer in South Sumter
Among the 630 employed individuals in South Sumter, private company employees (300 | 47.6%), self-employed (incorporated) (132 | 20.9%), and local government employees (97 | 15.4%) make up the most common classes of employment.
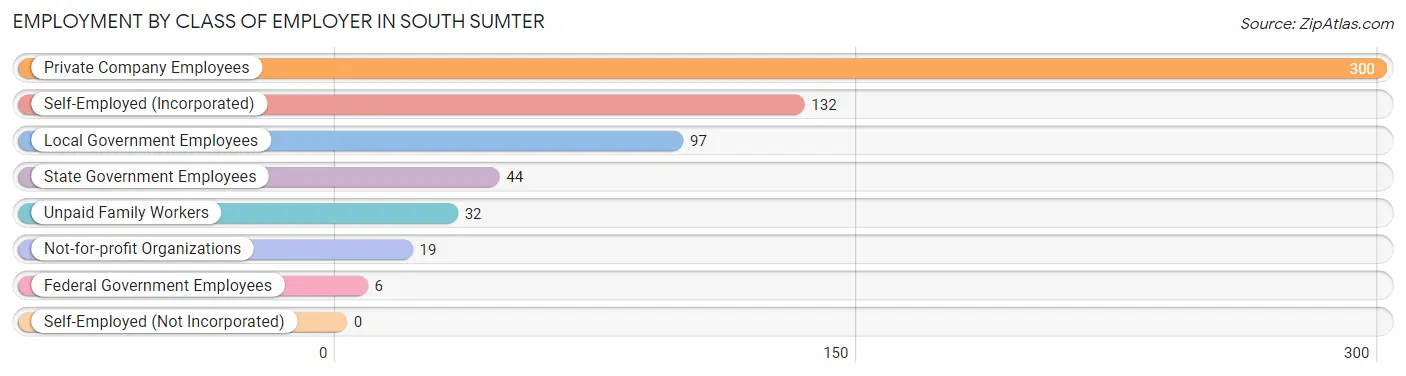
| Employer Class | # Employees | % Employees |
| Private Company Employees | 300 | 47.6% |
| Self-Employed (Incorporated) | 132 | 20.9% |
| Self-Employed (Not Incorporated) | 0 | 0.0% |
| Not-for-profit Organizations | 19 | 3.0% |
| Local Government Employees | 97 | 15.4% |
| State Government Employees | 44 | 7.0% |
| Federal Government Employees | 6 | 0.9% |
| Unpaid Family Workers | 32 | 5.1% |
| Total | 630 | 100.0% |
Employment Status by Age in South Sumter
According to the labor force statistics for South Sumter, out of the total population over 16 years of age (1,166), 61.6% or 718 individuals are in the labor force, with 7.9% or 57 of them unemployed. The age group with the highest labor force participation rate is 55 to 59 years, with 100.0% or 126 individuals in the labor force. Within the labor force, the 16 to 19 years age range has the highest percentage of unemployed individuals, with 100.0% or 21 of them being unemployed.
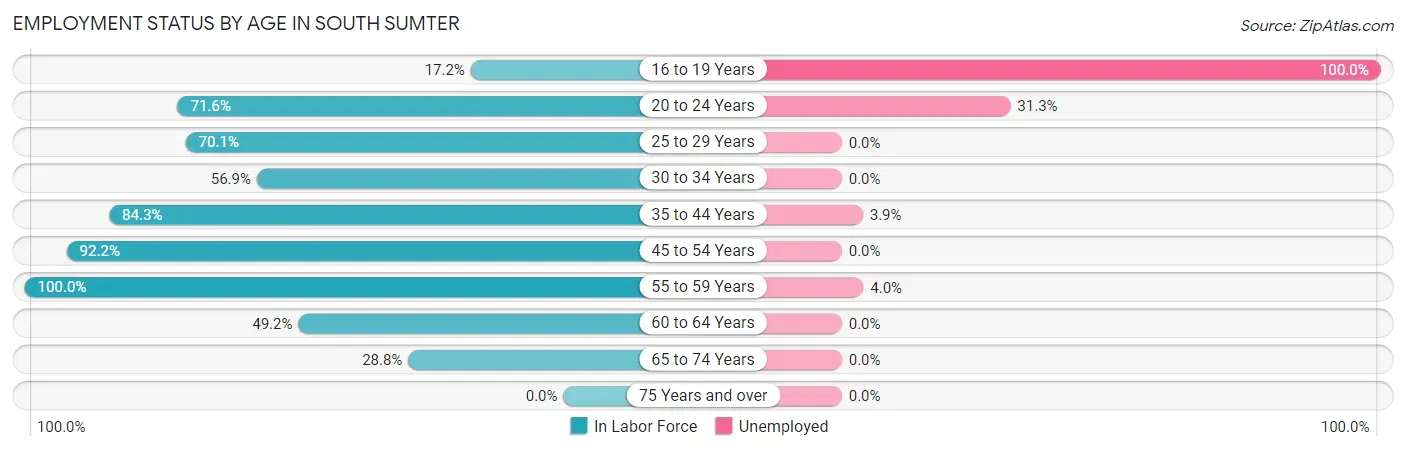
| Age Bracket | In Labor Force | Unemployed |
| 16 to 19 Years | 21 (17.2%) | 21 (100.0%) |
| 20 to 24 Years | 83 (71.6%) | 26 (31.3%) |
| 25 to 29 Years | 61 (70.1%) | 0 (0.0%) |
| 30 to 34 Years | 29 (56.9%) | 0 (0.0%) |
| 35 to 44 Years | 129 (84.3%) | 5 (3.9%) |
| 45 to 54 Years | 188 (92.2%) | 0 (0.0%) |
| 55 to 59 Years | 126 (100.0%) | 5 (4.0%) |
| 60 to 64 Years | 30 (49.2%) | 0 (0.0%) |
| 65 to 74 Years | 51 (28.8%) | 0 (0.0%) |
| 75 Years and over | 0 (0.0%) | 0 (0.0%) |
| Total | 718 (61.6%) | 57 (7.9%) |
Employment Status by Educational Attainment in South Sumter
According to labor force statistics for South Sumter, 82.6% of individuals (563) out of the total population between 25 and 64 years of age (682) are in the labor force, with 1.8% or 10 of them being unemployed. The group with the highest labor force participation rate are those with the educational attainment of bachelor's degree or higher, with 100.0% or 128 individuals in the labor force. Within the labor force, individuals with high school diploma education have the highest percentage of unemployment, with 6.4% or 5 of them being unemployed.
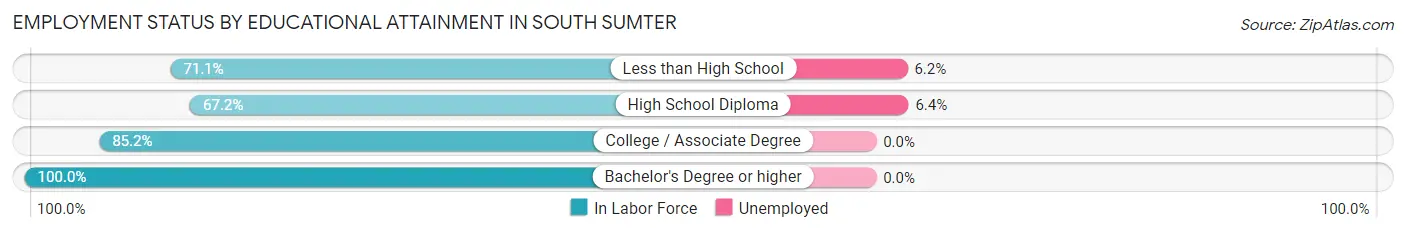
| Educational Attainment | In Labor Force | Unemployed |
| Less than High School | 81 (71.1%) | 7 (6.2%) |
| High School Diploma | 78 (67.2%) | 7 (6.4%) |
| College / Associate Degree | 276 (85.2%) | 0 (0.0%) |
| Bachelor's Degree or higher | 128 (100.0%) | 0 (0.0%) |
| Total | 563 (82.6%) | 12 (1.8%) |
Employment Occupations by Sex in South Sumter
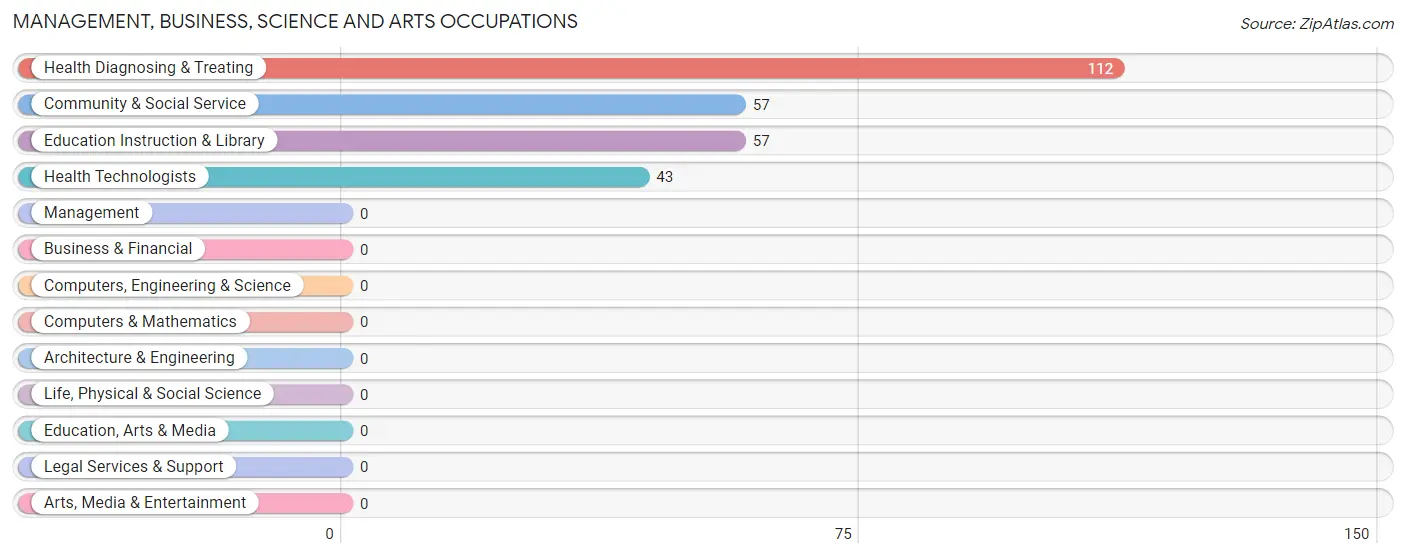
Management, Business, Science and Arts Occupations
The most common Management, Business, Science and Arts occupations in South Sumter are Health Diagnosing & Treating (112 | 16.9%), Community & Social Service (57 | 8.6%), Education Instruction & Library (57 | 8.6%), and Health Technologists (43 | 6.5%).
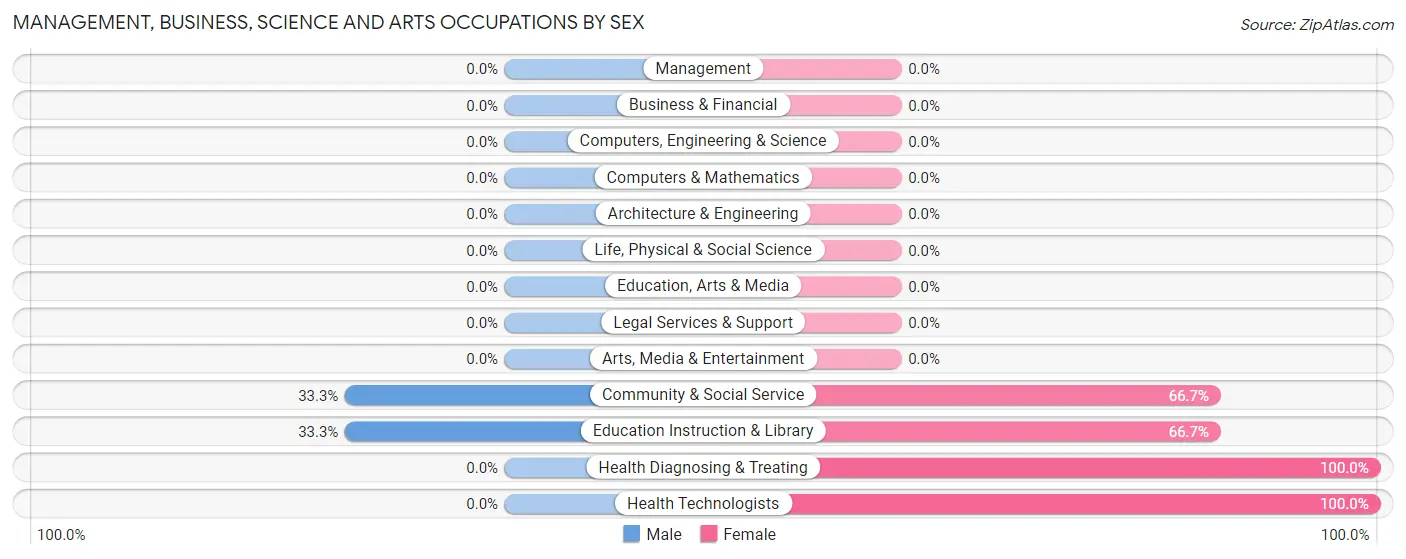
Management, Business, Science and Arts Occupations by Sex
Within the Management, Business, Science and Arts occupations in South Sumter, the most male-oriented occupations are Community & Social Service (33.3%), and Education Instruction & Library (33.3%), while the most female-oriented occupations are Health Diagnosing & Treating (100.0%), Health Technologists (100.0%), and Community & Social Service (66.7%).
| Occupation | Male | Female |
| Management | 0 (0.0%) | 0 (0.0%) |
| Business & Financial | 0 (0.0%) | 0 (0.0%) |
| Computers, Engineering & Science | 0 (0.0%) | 0 (0.0%) |
| Computers & Mathematics | 0 (0.0%) | 0 (0.0%) |
| Architecture & Engineering | 0 (0.0%) | 0 (0.0%) |
| Life, Physical & Social Science | 0 (0.0%) | 0 (0.0%) |
| Community & Social Service | 19 (33.3%) | 38 (66.7%) |
| Education, Arts & Media | 0 (0.0%) | 0 (0.0%) |
| Legal Services & Support | 0 (0.0%) | 0 (0.0%) |
| Education Instruction & Library | 19 (33.3%) | 38 (66.7%) |
| Arts, Media & Entertainment | 0 (0.0%) | 0 (0.0%) |
| Health Diagnosing & Treating | 0 (0.0%) | 112 (100.0%) |
| Health Technologists | 0 (0.0%) | 43 (100.0%) |
| Total (Category) | 19 (11.2%) | 150 (88.8%) |
| Total (Overall) | 313 (47.3%) | 348 (52.6%) |
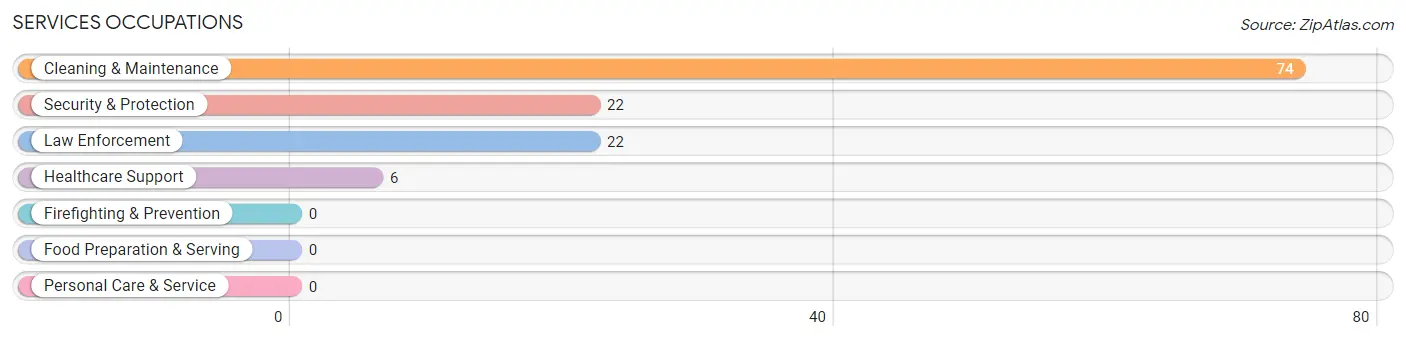
Services Occupations
The most common Services occupations in South Sumter are Cleaning & Maintenance (74 | 11.2%), Security & Protection (22 | 3.3%), Law Enforcement (22 | 3.3%), and Healthcare Support (6 | 0.9%).
Services Occupations by Sex
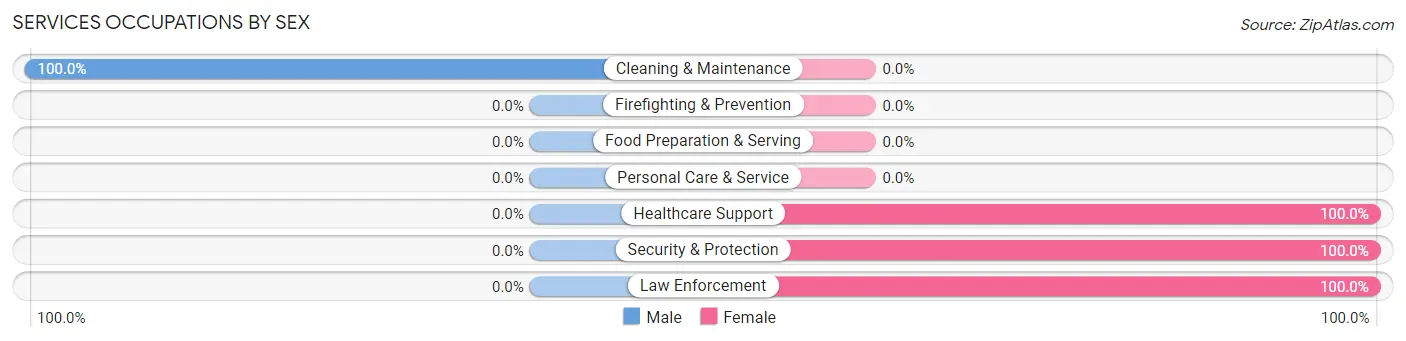
| Occupation | Male | Female |
| Healthcare Support | 0 (0.0%) | 6 (100.0%) |
| Security & Protection | 0 (0.0%) | 22 (100.0%) |
| Firefighting & Prevention | 0 (0.0%) | 0 (0.0%) |
| Law Enforcement | 0 (0.0%) | 22 (100.0%) |
| Food Preparation & Serving | 0 (0.0%) | 0 (0.0%) |
| Cleaning & Maintenance | 74 (100.0%) | 0 (0.0%) |
| Personal Care & Service | 0 (0.0%) | 0 (0.0%) |
| Total (Category) | 74 (72.6%) | 28 (27.5%) |
| Total (Overall) | 313 (47.3%) | 348 (52.6%) |
Sales and Office Occupations
The most common Sales and Office occupations in South Sumter are , and Office & Administration (122 | 18.5%).
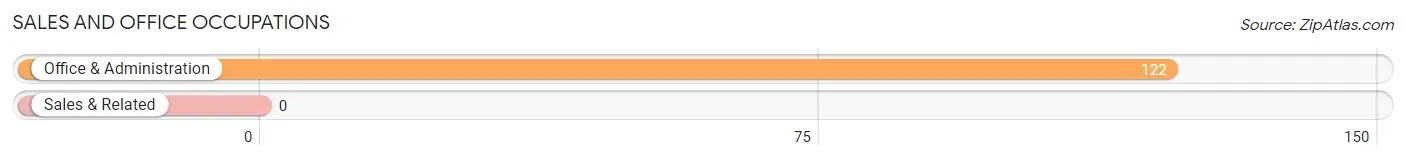
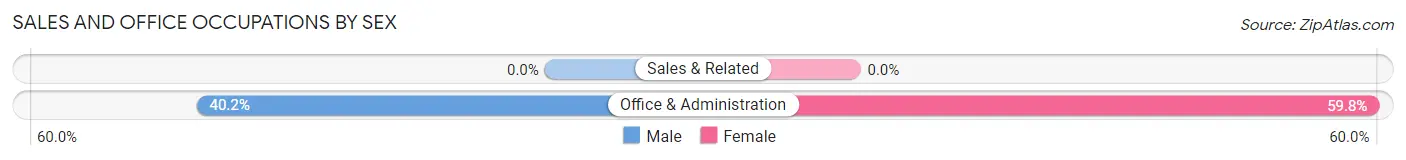
Sales and Office Occupations by Sex
| Occupation | Male | Female |
| Sales & Related | 0 (0.0%) | 0 (0.0%) |
| Office & Administration | 49 (40.2%) | 73 (59.8%) |
| Total (Category) | 49 (40.2%) | 73 (59.8%) |
| Total (Overall) | 313 (47.3%) | 348 (52.6%) |
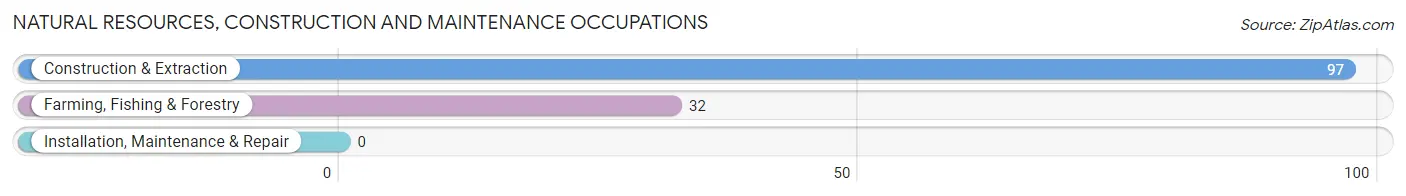
Natural Resources, Construction and Maintenance Occupations
The most common Natural Resources, Construction and Maintenance occupations in South Sumter are Construction & Extraction (97 | 14.7%), and Farming, Fishing & Forestry (32 | 4.8%).
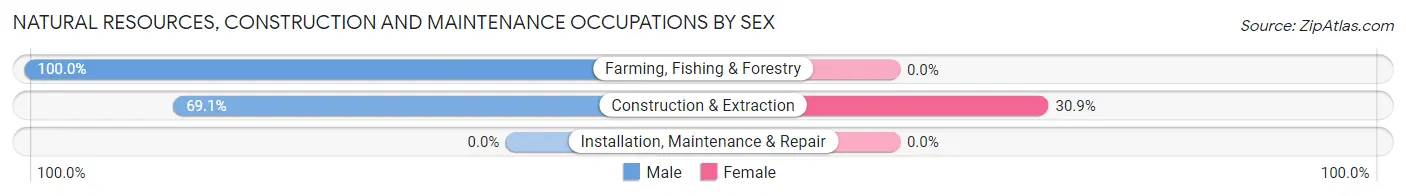
Natural Resources, Construction and Maintenance Occupations by Sex
| Occupation | Male | Female |
| Farming, Fishing & Forestry | 32 (100.0%) | 0 (0.0%) |
| Construction & Extraction | 67 (69.1%) | 30 (30.9%) |
| Installation, Maintenance & Repair | 0 (0.0%) | 0 (0.0%) |
| Total (Category) | 99 (76.7%) | 30 (23.3%) |
| Total (Overall) | 313 (47.3%) | 348 (52.6%) |
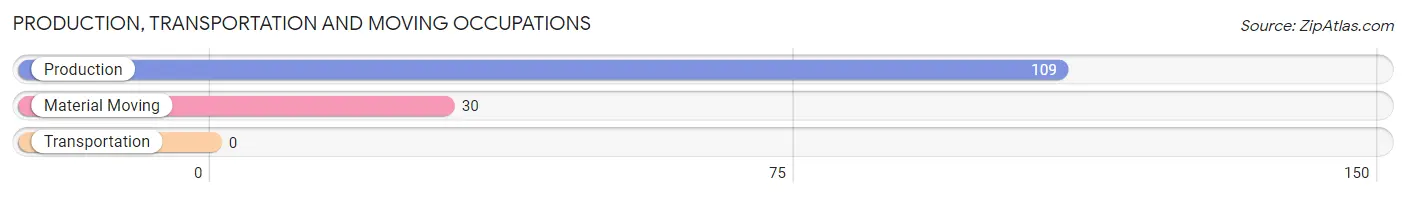
Production, Transportation and Moving Occupations
The most common Production, Transportation and Moving occupations in South Sumter are Production (109 | 16.5%), and Material Moving (30 | 4.5%).
Production, Transportation and Moving Occupations by Sex
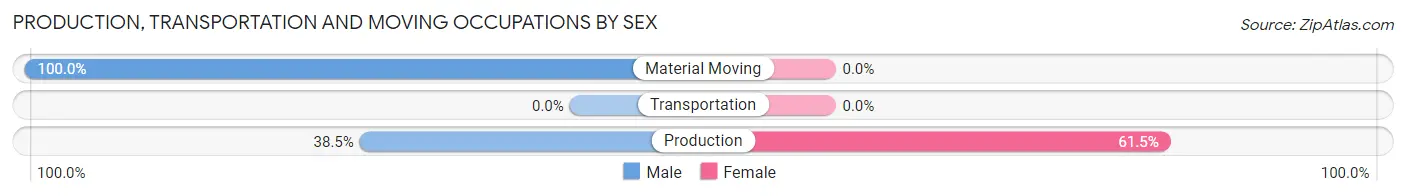
| Occupation | Male | Female |
| Production | 42 (38.5%) | 67 (61.5%) |
| Transportation | 0 (0.0%) | 0 (0.0%) |
| Material Moving | 30 (100.0%) | 0 (0.0%) |
| Total (Category) | 72 (51.8%) | 67 (48.2%) |
| Total (Overall) | 313 (47.3%) | 348 (52.6%) |
Employment Industries by Sex in South Sumter
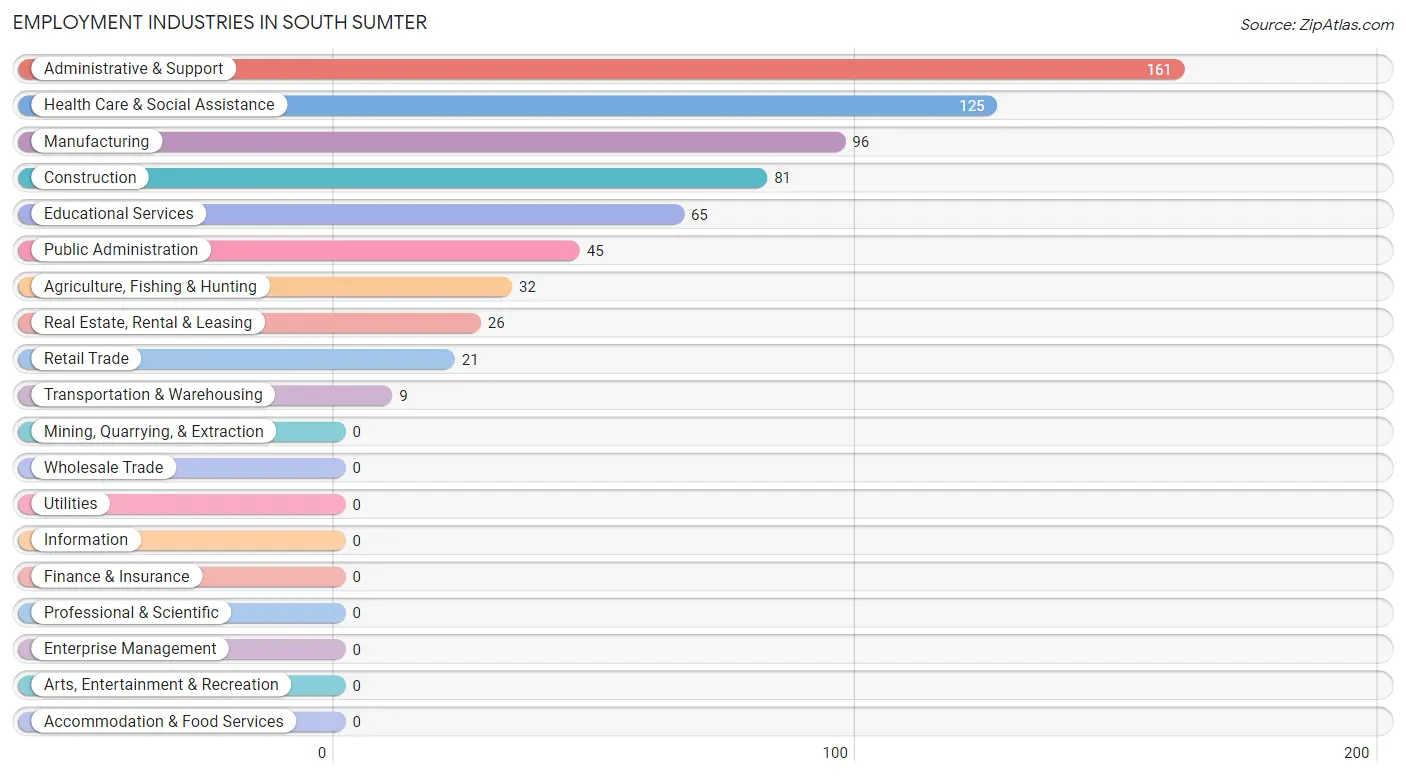
Employment Industries in South Sumter
The major employment industries in South Sumter include Administrative & Support (161 | 24.4%), Health Care & Social Assistance (125 | 18.9%), Manufacturing (96 | 14.5%), Construction (81 | 12.2%), and Educational Services (65 | 9.8%).
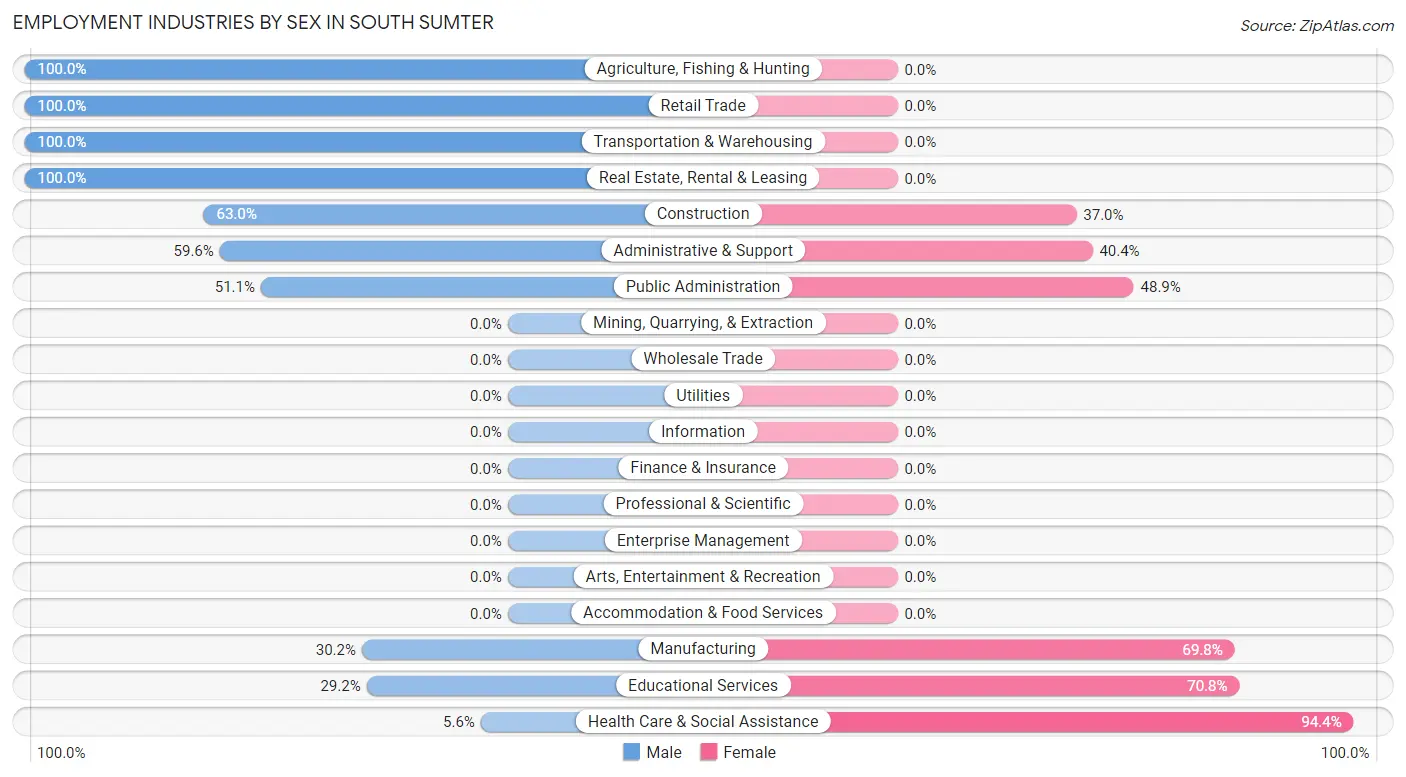
Employment Industries by Sex in South Sumter
The South Sumter industries that see more men than women are Agriculture, Fishing & Hunting (100.0%), Retail Trade (100.0%), and Transportation & Warehousing (100.0%), whereas the industries that tend to have a higher number of women are Health Care & Social Assistance (94.4%), Educational Services (70.8%), and Manufacturing (69.8%).
| Industry | Male | Female |
| Agriculture, Fishing & Hunting | 32 (100.0%) | 0 (0.0%) |
| Mining, Quarrying, & Extraction | 0 (0.0%) | 0 (0.0%) |
| Construction | 51 (63.0%) | 30 (37.0%) |
| Manufacturing | 29 (30.2%) | 67 (69.8%) |
| Wholesale Trade | 0 (0.0%) | 0 (0.0%) |
| Retail Trade | 21 (100.0%) | 0 (0.0%) |
| Transportation & Warehousing | 9 (100.0%) | 0 (0.0%) |
| Utilities | 0 (0.0%) | 0 (0.0%) |
| Information | 0 (0.0%) | 0 (0.0%) |
| Finance & Insurance | 0 (0.0%) | 0 (0.0%) |
| Real Estate, Rental & Leasing | 26 (100.0%) | 0 (0.0%) |
| Professional & Scientific | 0 (0.0%) | 0 (0.0%) |
| Enterprise Management | 0 (0.0%) | 0 (0.0%) |
| Administrative & Support | 96 (59.6%) | 65 (40.4%) |
| Educational Services | 19 (29.2%) | 46 (70.8%) |
| Health Care & Social Assistance | 7 (5.6%) | 118 (94.4%) |
| Arts, Entertainment & Recreation | 0 (0.0%) | 0 (0.0%) |
| Accommodation & Food Services | 0 (0.0%) | 0 (0.0%) |
| Public Administration | 23 (51.1%) | 22 (48.9%) |
| Total | 313 (47.3%) | 348 (52.6%) |
Education in South Sumter
School Enrollment in South Sumter
The most common levels of schooling among the 465 students in South Sumter are middle school (162 | 34.8%), high school (148 | 31.8%), and elementary school (79 | 17.0%).
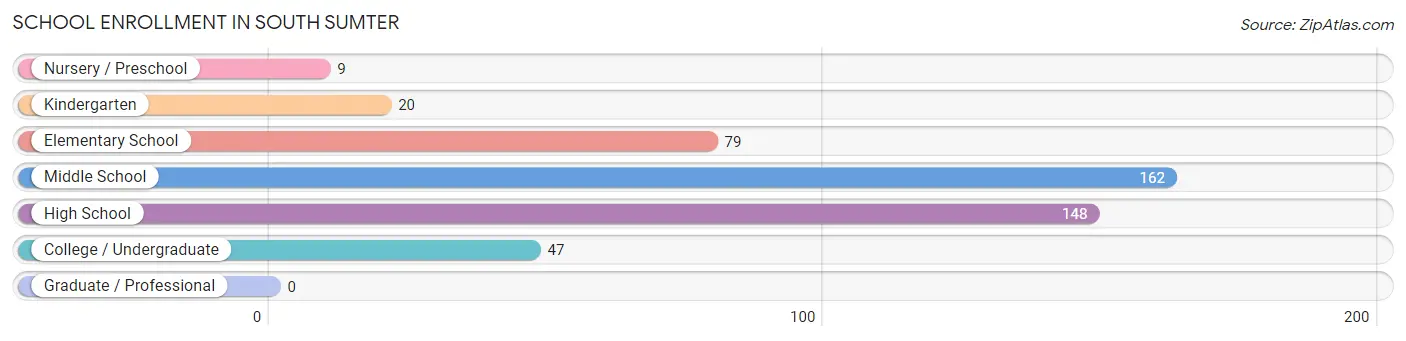
| School Level | # Students | % Students |
| Nursery / Preschool | 9 | 1.9% |
| Kindergarten | 20 | 4.3% |
| Elementary School | 79 | 17.0% |
| Middle School | 162 | 34.8% |
| High School | 148 | 31.8% |
| College / Undergraduate | 47 | 10.1% |
| Graduate / Professional | 0 | 0.0% |
| Total | 465 | 100.0% |
School Enrollment by Age by Funding Source in South Sumter
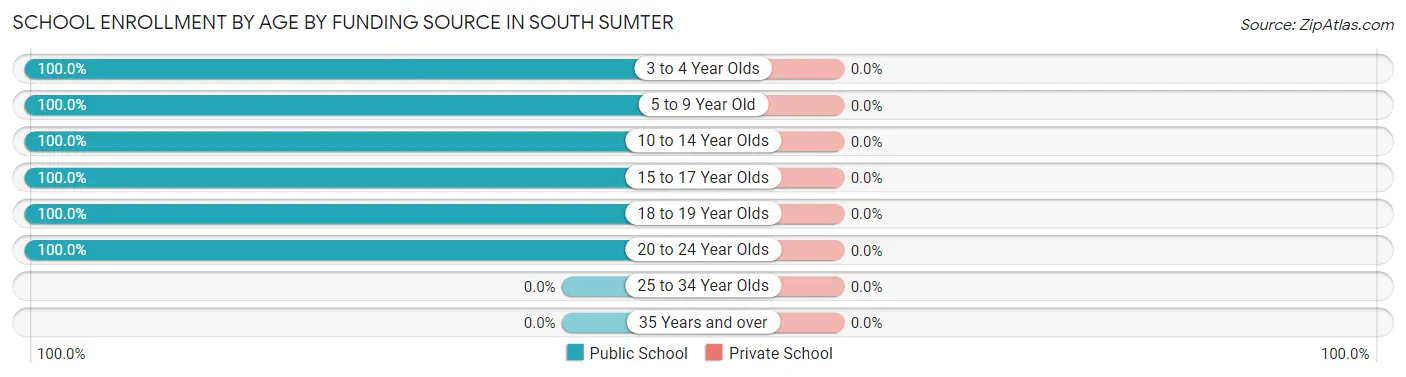
| Age Bracket | Public School | Private School |
| 3 to 4 Year Olds | 17 (100.0%) | 0 (0.0%) |
| 5 to 9 Year Old | 70 (100.0%) | 0 (0.0%) |
| 10 to 14 Year Olds | 204 (100.0%) | 0 (0.0%) |
| 15 to 17 Year Olds | 72 (100.0%) | 0 (0.0%) |
| 18 to 19 Year Olds | 69 (100.0%) | 0 (0.0%) |
| 20 to 24 Year Olds | 33 (100.0%) | 0 (0.0%) |
| 25 to 34 Year Olds | 0 (0.0%) | 0 (0.0%) |
| 35 Years and over | 0 (0.0%) | 0 (0.0%) |
| Total | 465 (100.0%) | 0 (0.0%) |
Educational Attainment by Field of Study in South Sumter
Computers & mathematics (48 | 29.1%), business (36 | 21.8%), education (30 | 18.2%), literature & languages (22 | 13.3%), and liberal arts & history (13 | 7.9%) are the most common fields of study among 165 individuals in South Sumter who have obtained a bachelor's degree or higher.
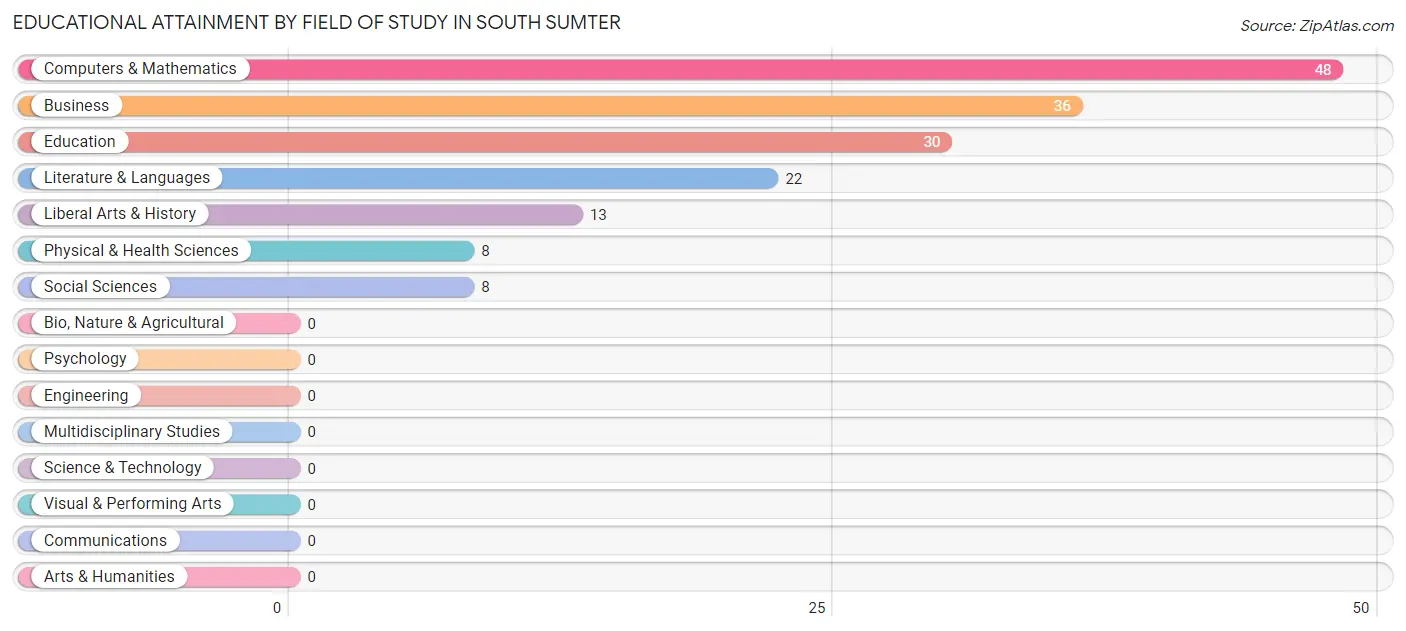
| Field of Study | # Graduates | % Graduates |
| Computers & Mathematics | 48 | 29.1% |
| Bio, Nature & Agricultural | 0 | 0.0% |
| Physical & Health Sciences | 8 | 4.9% |
| Psychology | 0 | 0.0% |
| Social Sciences | 8 | 4.9% |
| Engineering | 0 | 0.0% |
| Multidisciplinary Studies | 0 | 0.0% |
| Science & Technology | 0 | 0.0% |
| Business | 36 | 21.8% |
| Education | 30 | 18.2% |
| Literature & Languages | 22 | 13.3% |
| Liberal Arts & History | 13 | 7.9% |
| Visual & Performing Arts | 0 | 0.0% |
| Communications | 0 | 0.0% |
| Arts & Humanities | 0 | 0.0% |
| Total | 165 | 100.0% |
Transportation & Commute in South Sumter
Vehicle Availability by Sex in South Sumter
The most prevalent vehicle ownership categories in South Sumter are males with 1 vehicle (78, accounting for 24.9%) and females with 1 vehicle (100, making up 24.6%).
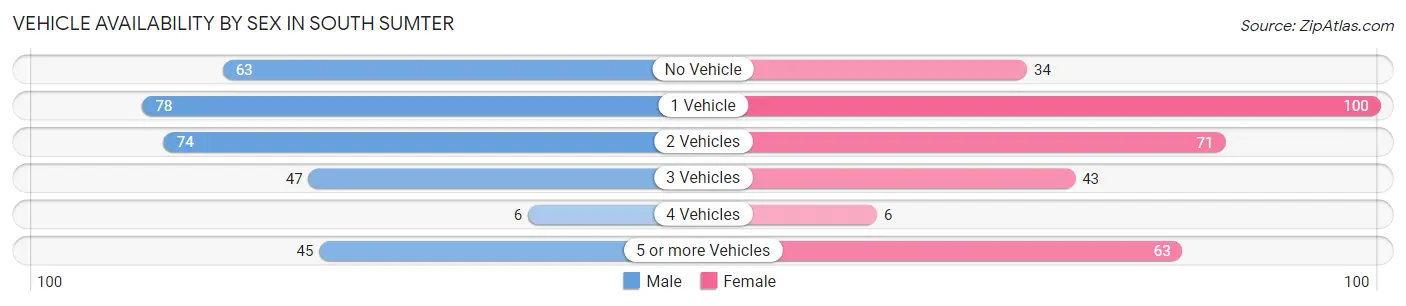
| Vehicles Available | Male | Female |
| No Vehicle | 63 (20.1%) | 34 (10.7%) |
| 1 Vehicle | 78 (24.9%) | 100 (31.6%) |
| 2 Vehicles | 74 (23.6%) | 71 (22.4%) |
| 3 Vehicles | 47 (15.0%) | 43 (13.6%) |
| 4 Vehicles | 6 (1.9%) | 6 (1.9%) |
| 5 or more Vehicles | 45 (14.4%) | 63 (19.9%) |
| Total | 313 (100.0%) | 317 (100.0%) |
Commute Time in South Sumter
The most frequently occuring commute durations in South Sumter are 20 to 24 minutes (149 commuters, 28.5%), 10 to 14 minutes (126 commuters, 24.1%), and 15 to 19 minutes (75 commuters, 14.3%).
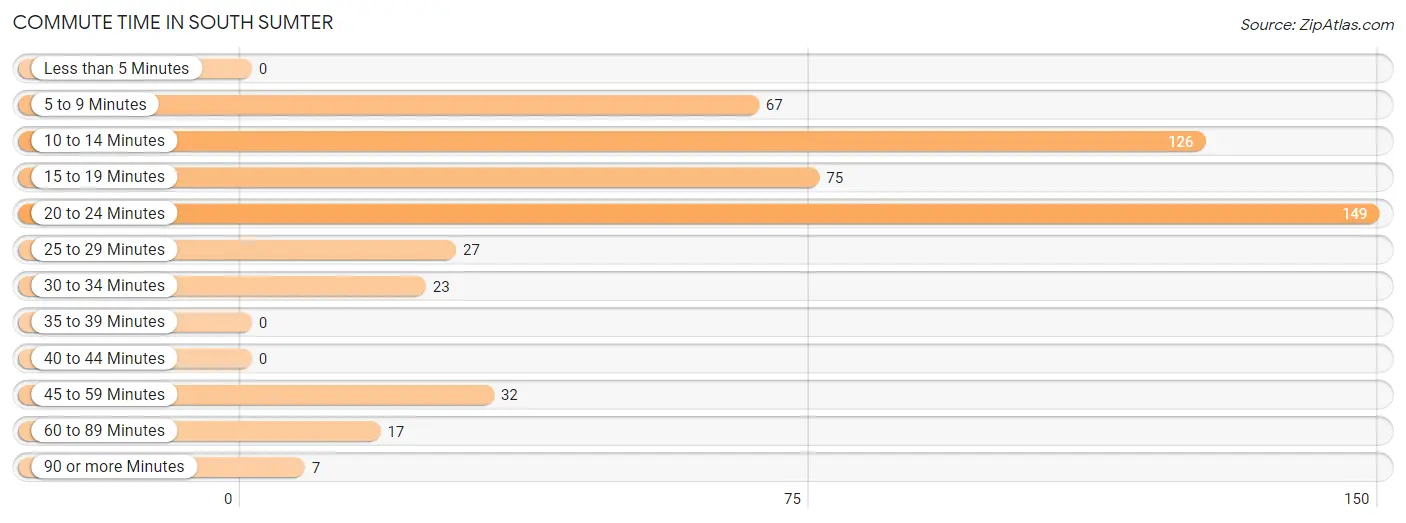
| Commute Time | # Commuters | % Commuters |
| Less than 5 Minutes | 0 | 0.0% |
| 5 to 9 Minutes | 67 | 12.8% |
| 10 to 14 Minutes | 126 | 24.1% |
| 15 to 19 Minutes | 75 | 14.3% |
| 20 to 24 Minutes | 149 | 28.5% |
| 25 to 29 Minutes | 27 | 5.2% |
| 30 to 34 Minutes | 23 | 4.4% |
| 35 to 39 Minutes | 0 | 0.0% |
| 40 to 44 Minutes | 0 | 0.0% |
| 45 to 59 Minutes | 32 | 6.1% |
| 60 to 89 Minutes | 17 | 3.3% |
| 90 or more Minutes | 7 | 1.3% |
Commute Time by Sex in South Sumter
The most common commute times in South Sumter are 20 to 24 minutes (83 commuters, 33.9%) for males and 20 to 24 minutes (66 commuters, 23.7%) for females.
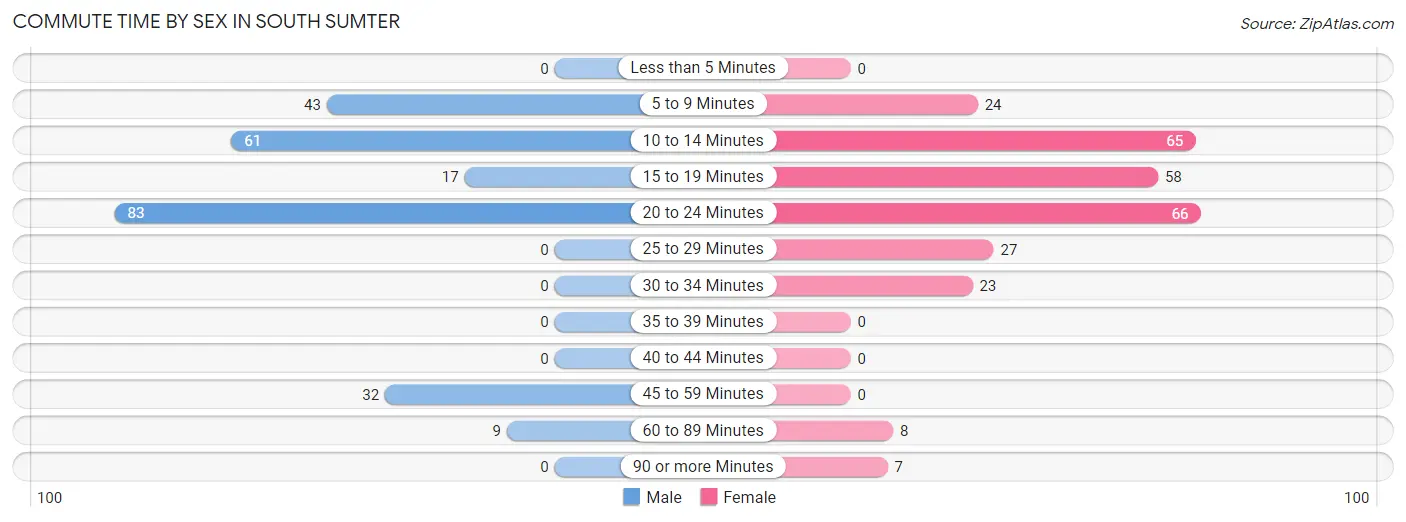
| Commute Time | Male | Female |
| Less than 5 Minutes | 0 (0.0%) | 0 (0.0%) |
| 5 to 9 Minutes | 43 (17.5%) | 24 (8.6%) |
| 10 to 14 Minutes | 61 (24.9%) | 65 (23.4%) |
| 15 to 19 Minutes | 17 (6.9%) | 58 (20.9%) |
| 20 to 24 Minutes | 83 (33.9%) | 66 (23.7%) |
| 25 to 29 Minutes | 0 (0.0%) | 27 (9.7%) |
| 30 to 34 Minutes | 0 (0.0%) | 23 (8.3%) |
| 35 to 39 Minutes | 0 (0.0%) | 0 (0.0%) |
| 40 to 44 Minutes | 0 (0.0%) | 0 (0.0%) |
| 45 to 59 Minutes | 32 (13.1%) | 0 (0.0%) |
| 60 to 89 Minutes | 9 (3.7%) | 8 (2.9%) |
| 90 or more Minutes | 0 (0.0%) | 7 (2.5%) |
Time of Departure to Work by Sex in South Sumter
The most frequent times of departure to work in South Sumter are 8:00 AM to 8:29 AM (77, 31.4%) for males and 7:30 AM to 7:59 AM (91, 32.7%) for females.
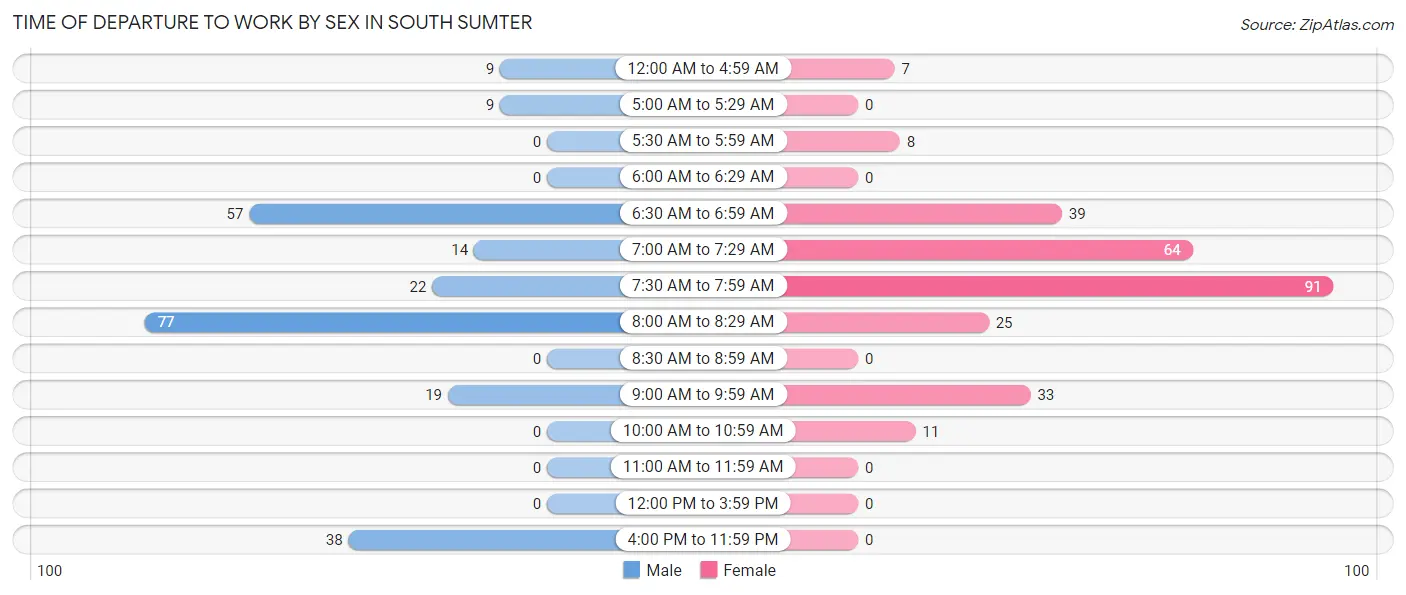
| Time of Departure | Male | Female |
| 12:00 AM to 4:59 AM | 9 (3.7%) | 7 (2.5%) |
| 5:00 AM to 5:29 AM | 9 (3.7%) | 0 (0.0%) |
| 5:30 AM to 5:59 AM | 0 (0.0%) | 8 (2.9%) |
| 6:00 AM to 6:29 AM | 0 (0.0%) | 0 (0.0%) |
| 6:30 AM to 6:59 AM | 57 (23.3%) | 39 (14.0%) |
| 7:00 AM to 7:29 AM | 14 (5.7%) | 64 (23.0%) |
| 7:30 AM to 7:59 AM | 22 (9.0%) | 91 (32.7%) |
| 8:00 AM to 8:29 AM | 77 (31.4%) | 25 (9.0%) |
| 8:30 AM to 8:59 AM | 0 (0.0%) | 0 (0.0%) |
| 9:00 AM to 9:59 AM | 19 (7.8%) | 33 (11.9%) |
| 10:00 AM to 10:59 AM | 0 (0.0%) | 11 (4.0%) |
| 11:00 AM to 11:59 AM | 0 (0.0%) | 0 (0.0%) |
| 12:00 PM to 3:59 PM | 0 (0.0%) | 0 (0.0%) |
| 4:00 PM to 11:59 PM | 38 (15.5%) | 0 (0.0%) |
| Total | 245 (100.0%) | 278 (100.0%) |
Housing Occupancy in South Sumter
Occupancy by Ownership in South Sumter
Of the total 665 dwellings in South Sumter, owner-occupied units account for 351 (52.8%), while renter-occupied units make up 314 (47.2%).
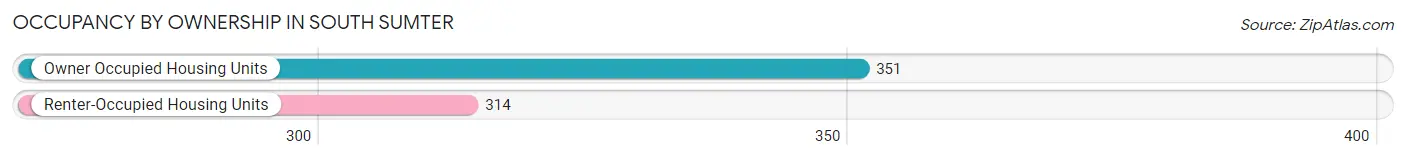
| Occupancy | # Housing Units | % Housing Units |
| Owner Occupied Housing Units | 351 | 52.8% |
| Renter-Occupied Housing Units | 314 | 47.2% |
| Total Occupied Housing Units | 665 | 100.0% |
Occupancy by Household Size in South Sumter
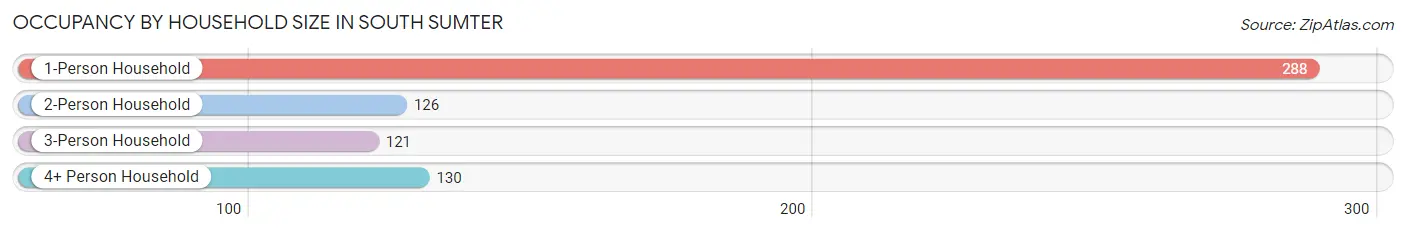
| Household Size | # Housing Units | % Housing Units |
| 1-Person Household | 288 | 43.3% |
| 2-Person Household | 126 | 19.0% |
| 3-Person Household | 121 | 18.2% |
| 4+ Person Household | 130 | 19.6% |
| Total Housing Units | 665 | 100.0% |
Occupancy by Ownership by Household Size in South Sumter
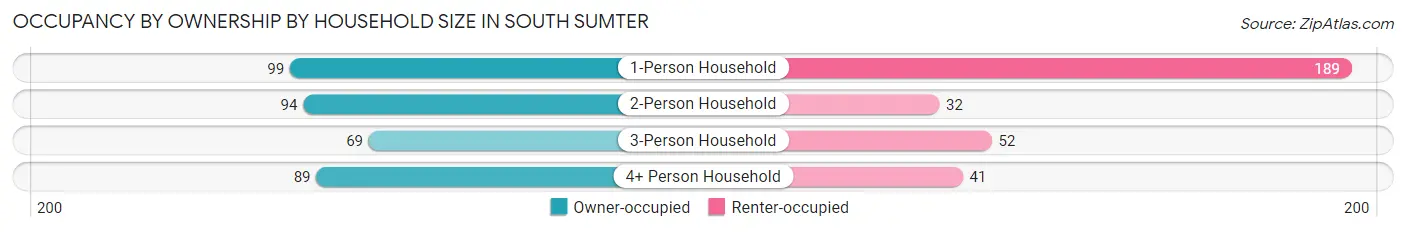
| Household Size | Owner-occupied | Renter-occupied |
| 1-Person Household | 99 (34.4%) | 189 (65.6%) |
| 2-Person Household | 94 (74.6%) | 32 (25.4%) |
| 3-Person Household | 69 (57.0%) | 52 (43.0%) |
| 4+ Person Household | 89 (68.5%) | 41 (31.5%) |
| Total Housing Units | 351 (52.8%) | 314 (47.2%) |
Occupancy by Educational Attainment in South Sumter
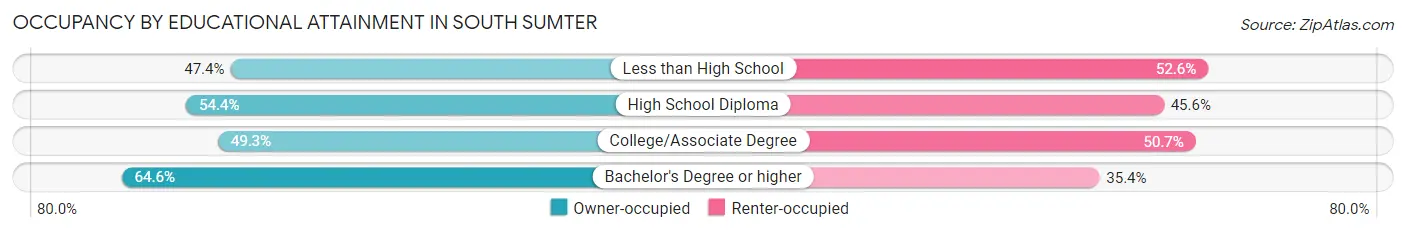
| Household Size | Owner-occupied | Renter-occupied |
| Less than High School | 72 (47.4%) | 80 (52.6%) |
| High School Diploma | 93 (54.4%) | 78 (45.6%) |
| College/Associate Degree | 113 (49.3%) | 116 (50.7%) |
| Bachelor's Degree or higher | 73 (64.6%) | 40 (35.4%) |
Occupancy by Age of Householder in South Sumter
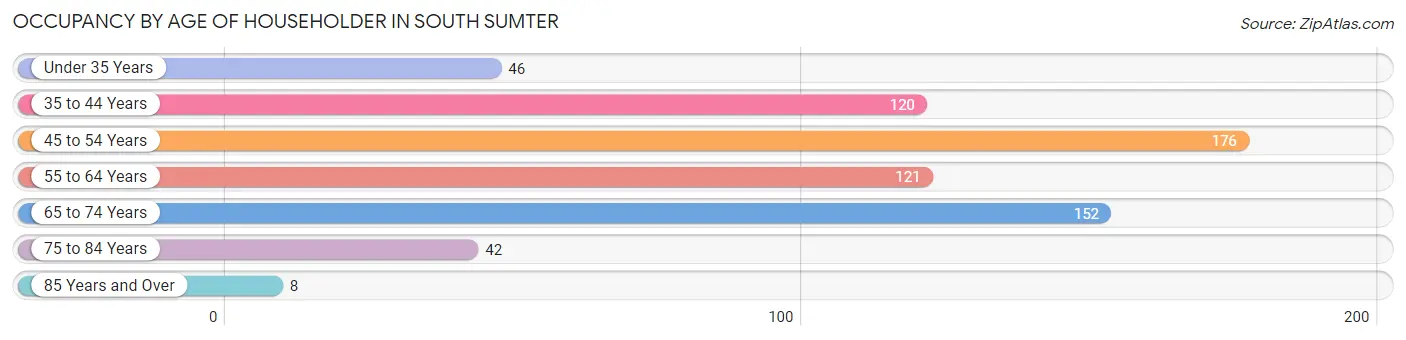
| Age Bracket | # Households | % Households |
| Under 35 Years | 46 | 6.9% |
| 35 to 44 Years | 120 | 18.0% |
| 45 to 54 Years | 176 | 26.5% |
| 55 to 64 Years | 121 | 18.2% |
| 65 to 74 Years | 152 | 22.9% |
| 75 to 84 Years | 42 | 6.3% |
| 85 Years and Over | 8 | 1.2% |
| Total | 665 | 100.0% |
Housing Finances in South Sumter
Median Income by Occupancy in South Sumter
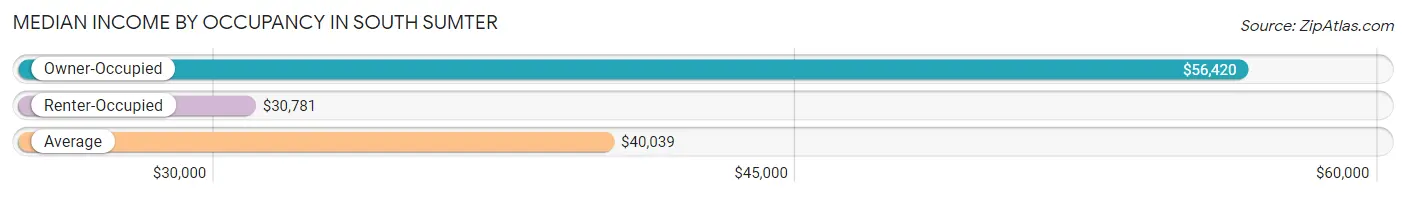
| Occupancy Type | # Households | Median Income |
| Owner-Occupied | 351 (52.8%) | $56,420 |
| Renter-Occupied | 314 (47.2%) | $30,781 |
| Average | 665 (100.0%) | $40,039 |
Occupancy by Householder Income Bracket in South Sumter
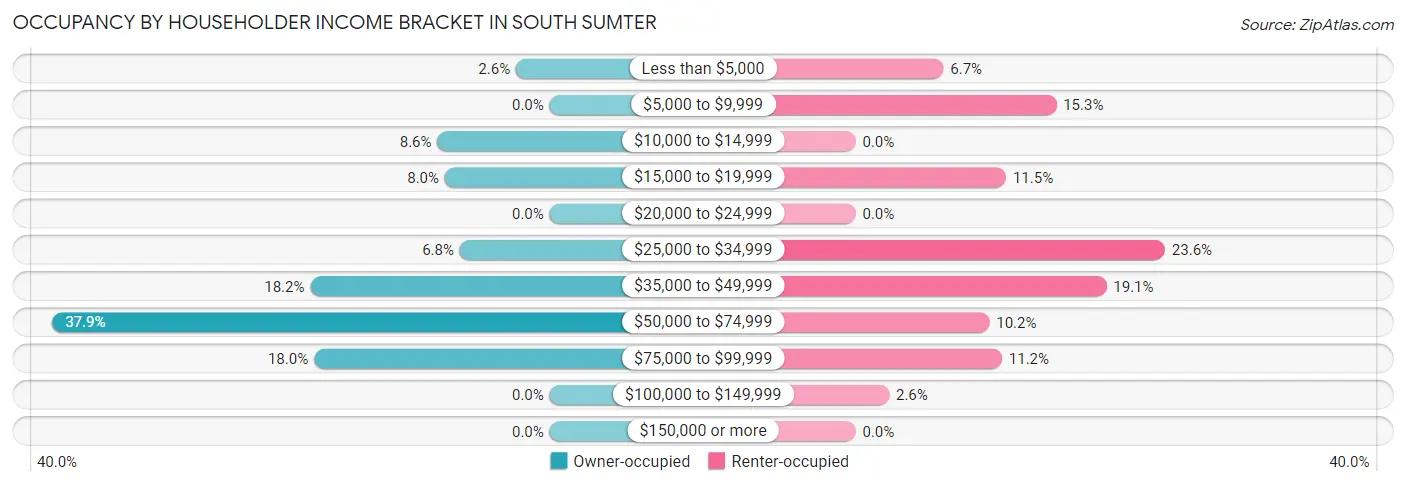
| Income Bracket | Owner-occupied | Renter-occupied |
| Less than $5,000 | 9 (2.6%) | 21 (6.7%) |
| $5,000 to $9,999 | 0 (0.0%) | 48 (15.3%) |
| $10,000 to $14,999 | 30 (8.6%) | 0 (0.0%) |
| $15,000 to $19,999 | 28 (8.0%) | 36 (11.5%) |
| $20,000 to $24,999 | 0 (0.0%) | 0 (0.0%) |
| $25,000 to $34,999 | 24 (6.8%) | 74 (23.6%) |
| $35,000 to $49,999 | 64 (18.2%) | 60 (19.1%) |
| $50,000 to $74,999 | 133 (37.9%) | 32 (10.2%) |
| $75,000 to $99,999 | 63 (17.9%) | 35 (11.2%) |
| $100,000 to $149,999 | 0 (0.0%) | 8 (2.5%) |
| $150,000 or more | 0 (0.0%) | 0 (0.0%) |
| Total | 351 (100.0%) | 314 (100.0%) |
Monthly Housing Cost Tiers in South Sumter
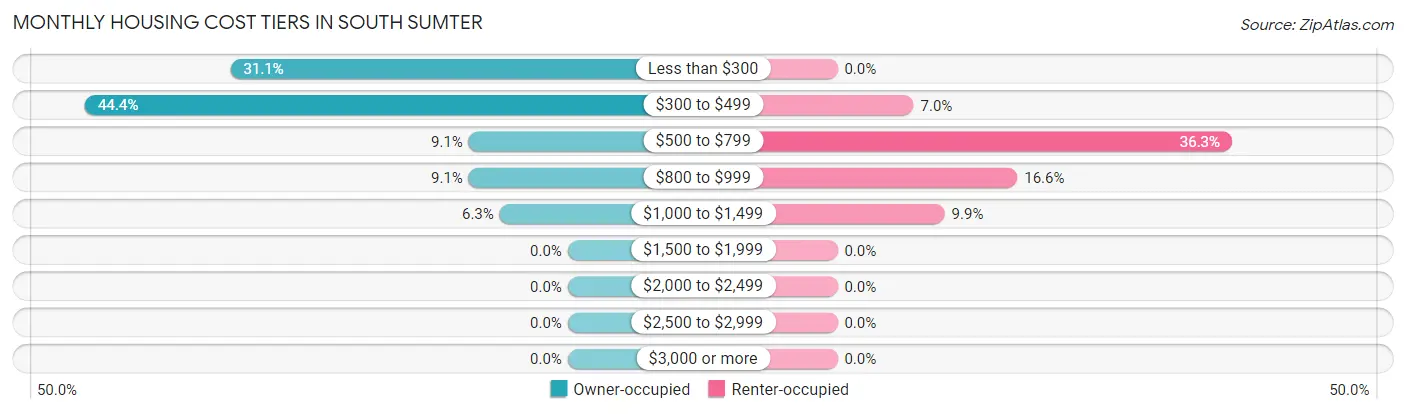
| Monthly Cost | Owner-occupied | Renter-occupied |
| Less than $300 | 109 (31.0%) | 0 (0.0%) |
| $300 to $499 | 156 (44.4%) | 22 (7.0%) |
| $500 to $799 | 32 (9.1%) | 114 (36.3%) |
| $800 to $999 | 32 (9.1%) | 52 (16.6%) |
| $1,000 to $1,499 | 22 (6.3%) | 31 (9.9%) |
| $1,500 to $1,999 | 0 (0.0%) | 0 (0.0%) |
| $2,000 to $2,499 | 0 (0.0%) | 0 (0.0%) |
| $2,500 to $2,999 | 0 (0.0%) | 0 (0.0%) |
| $3,000 or more | 0 (0.0%) | 0 (0.0%) |
| Total | 351 (100.0%) | 314 (100.0%) |
Physical Housing Characteristics in South Sumter
Housing Structures in South Sumter
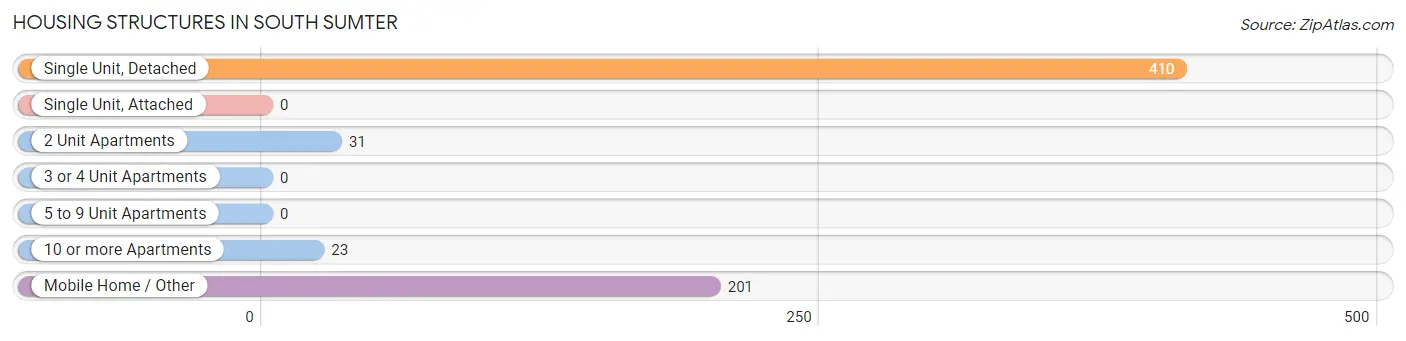
| Structure Type | # Housing Units | % Housing Units |
| Single Unit, Detached | 410 | 61.7% |
| Single Unit, Attached | 0 | 0.0% |
| 2 Unit Apartments | 31 | 4.7% |
| 3 or 4 Unit Apartments | 0 | 0.0% |
| 5 to 9 Unit Apartments | 0 | 0.0% |
| 10 or more Apartments | 23 | 3.5% |
| Mobile Home / Other | 201 | 30.2% |
| Total | 665 | 100.0% |
Housing Structures by Occupancy in South Sumter
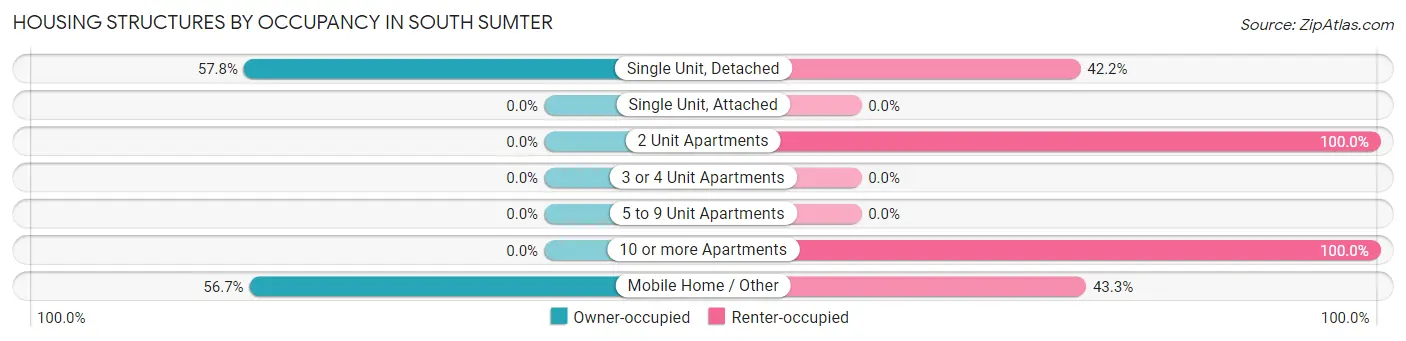
| Structure Type | Owner-occupied | Renter-occupied |
| Single Unit, Detached | 237 (57.8%) | 173 (42.2%) |
| Single Unit, Attached | 0 (0.0%) | 0 (0.0%) |
| 2 Unit Apartments | 0 (0.0%) | 31 (100.0%) |
| 3 or 4 Unit Apartments | 0 (0.0%) | 0 (0.0%) |
| 5 to 9 Unit Apartments | 0 (0.0%) | 0 (0.0%) |
| 10 or more Apartments | 0 (0.0%) | 23 (100.0%) |
| Mobile Home / Other | 114 (56.7%) | 87 (43.3%) |
| Total | 351 (52.8%) | 314 (47.2%) |
Housing Structures by Number of Rooms in South Sumter
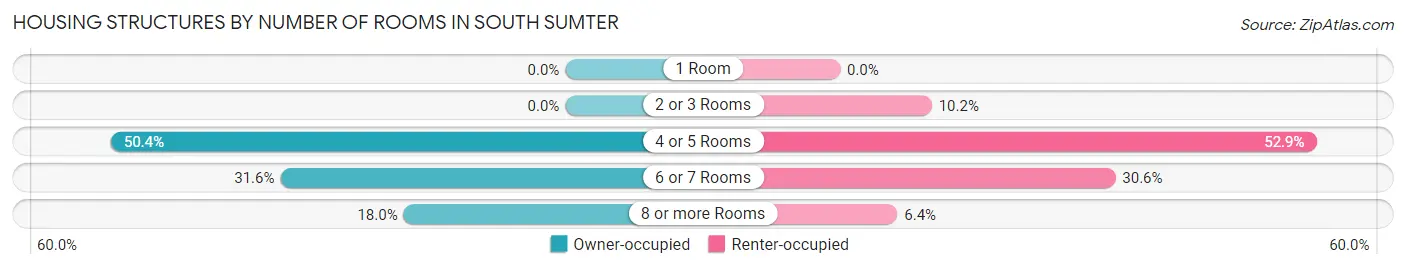
| Number of Rooms | Owner-occupied | Renter-occupied |
| 1 Room | 0 (0.0%) | 0 (0.0%) |
| 2 or 3 Rooms | 0 (0.0%) | 32 (10.2%) |
| 4 or 5 Rooms | 177 (50.4%) | 166 (52.9%) |
| 6 or 7 Rooms | 111 (31.6%) | 96 (30.6%) |
| 8 or more Rooms | 63 (17.9%) | 20 (6.4%) |
| Total | 351 (100.0%) | 314 (100.0%) |
Housing Structure by Heating Type in South Sumter
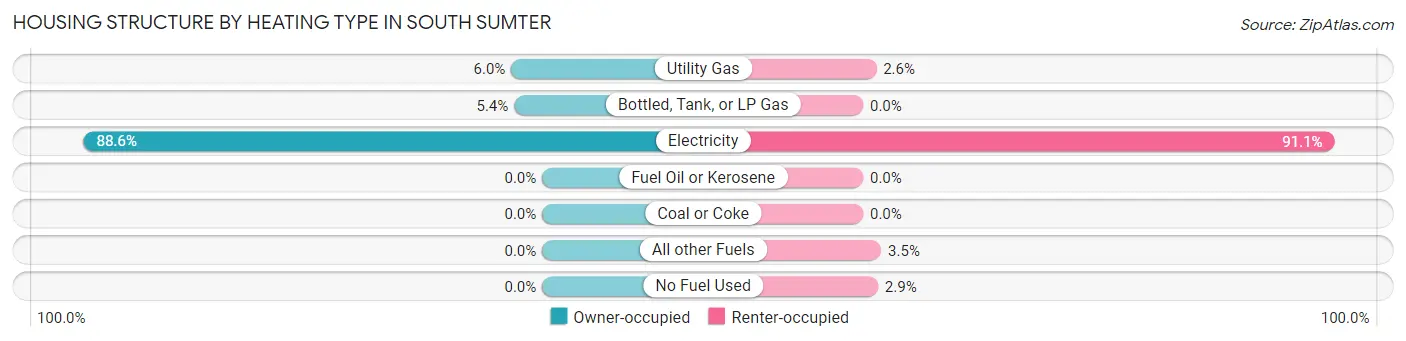
| Heating Type | Owner-occupied | Renter-occupied |
| Utility Gas | 21 (6.0%) | 8 (2.5%) |
| Bottled, Tank, or LP Gas | 19 (5.4%) | 0 (0.0%) |
| Electricity | 311 (88.6%) | 286 (91.1%) |
| Fuel Oil or Kerosene | 0 (0.0%) | 0 (0.0%) |
| Coal or Coke | 0 (0.0%) | 0 (0.0%) |
| All other Fuels | 0 (0.0%) | 11 (3.5%) |
| No Fuel Used | 0 (0.0%) | 9 (2.9%) |
| Total | 351 (100.0%) | 314 (100.0%) |
Household Vehicle Usage in South Sumter
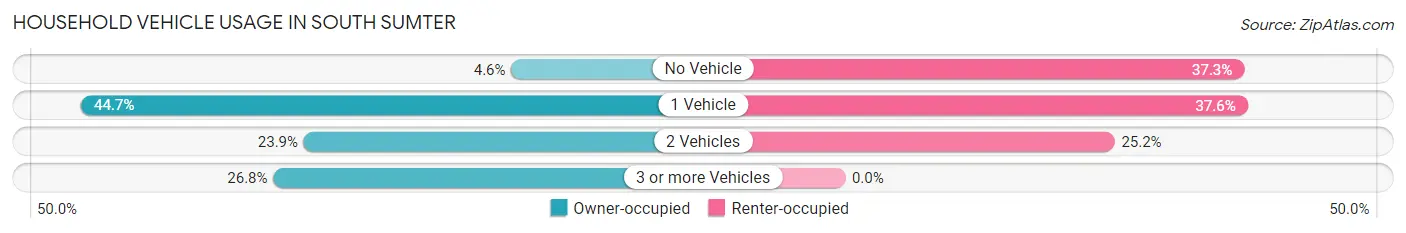
| Vehicles per Household | Owner-occupied | Renter-occupied |
| No Vehicle | 16 (4.6%) | 117 (37.3%) |
| 1 Vehicle | 157 (44.7%) | 118 (37.6%) |
| 2 Vehicles | 84 (23.9%) | 79 (25.2%) |
| 3 or more Vehicles | 94 (26.8%) | 0 (0.0%) |
| Total | 351 (100.0%) | 314 (100.0%) |
Real Estate & Mortgages in South Sumter
Real Estate and Mortgage Overview in South Sumter
| Characteristic | Without Mortgage | With Mortgage |
| Housing Units | 288 | 63 |
| Median Property Value | $83,600 | $55,200 |
| Median Household Income | $51,250 | $0 |
| Monthly Housing Costs | $370 | $0 |
| Real Estate Taxes | $509 | $15 |
Property Value by Mortgage Status in South Sumter
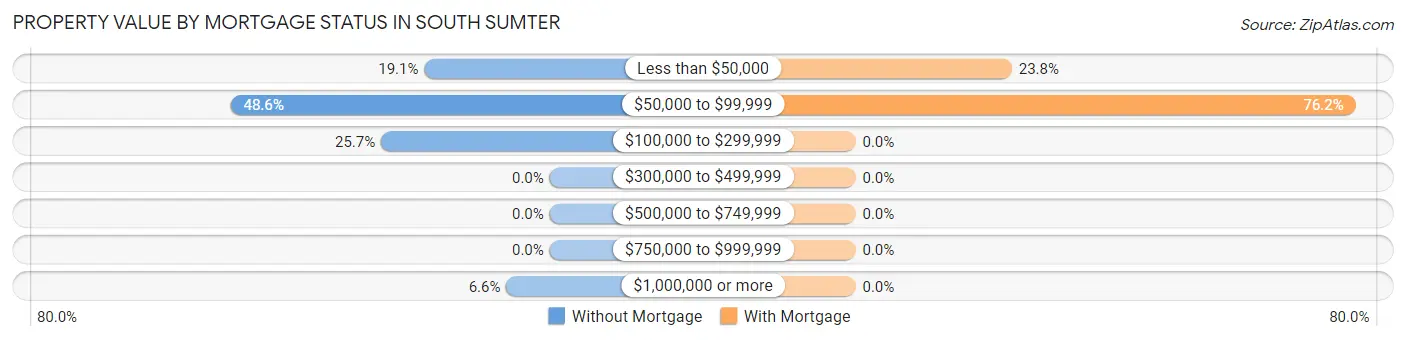
| Property Value | Without Mortgage | With Mortgage |
| Less than $50,000 | 55 (19.1%) | 15 (23.8%) |
| $50,000 to $99,999 | 140 (48.6%) | 48 (76.2%) |
| $100,000 to $299,999 | 74 (25.7%) | 0 (0.0%) |
| $300,000 to $499,999 | 0 (0.0%) | 0 (0.0%) |
| $500,000 to $749,999 | 0 (0.0%) | 0 (0.0%) |
| $750,000 to $999,999 | 0 (0.0%) | 0 (0.0%) |
| $1,000,000 or more | 19 (6.6%) | 0 (0.0%) |
| Total | 288 (100.0%) | 63 (100.0%) |
Household Income by Mortgage Status in South Sumter
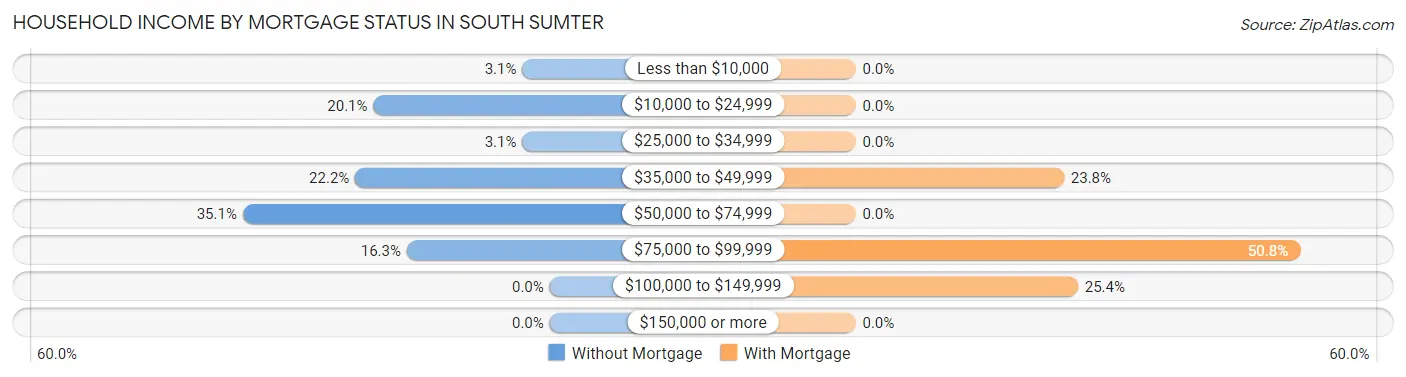
| Household Income | Without Mortgage | With Mortgage |
| Less than $10,000 | 9 (3.1%) | 0 (0.0%) |
| $10,000 to $24,999 | 58 (20.1%) | 0 (0.0%) |
| $25,000 to $34,999 | 9 (3.1%) | 0 (0.0%) |
| $35,000 to $49,999 | 64 (22.2%) | 15 (23.8%) |
| $50,000 to $74,999 | 101 (35.1%) | 0 (0.0%) |
| $75,000 to $99,999 | 47 (16.3%) | 32 (50.8%) |
| $100,000 to $149,999 | 0 (0.0%) | 16 (25.4%) |
| $150,000 or more | 0 (0.0%) | 0 (0.0%) |
| Total | 288 (100.0%) | 63 (100.0%) |
Property Value to Household Income Ratio in South Sumter
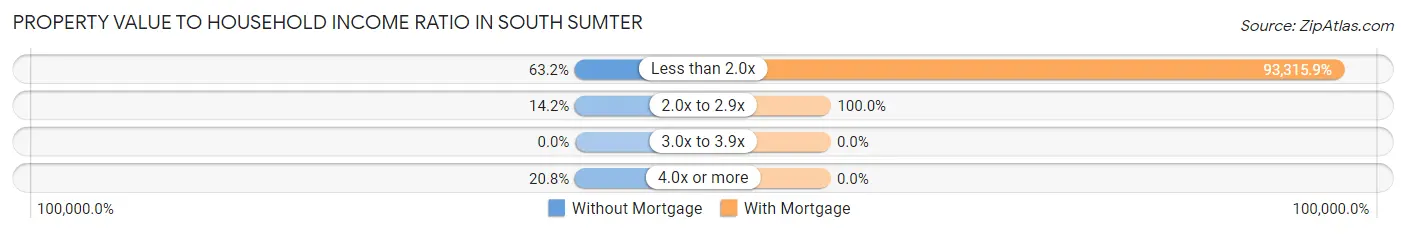
| Value-to-Income Ratio | Without Mortgage | With Mortgage |
| Less than 2.0x | 182 (63.2%) | 58,789 (93,315.9%) |
| 2.0x to 2.9x | 41 (14.2%) | 63 (100.0%) |
| 3.0x to 3.9x | 0 (0.0%) | 0 (0.0%) |
| 4.0x or more | 60 (20.8%) | 0 (0.0%) |
| Total | 288 (100.0%) | 63 (100.0%) |
Real Estate Taxes by Mortgage Status in South Sumter
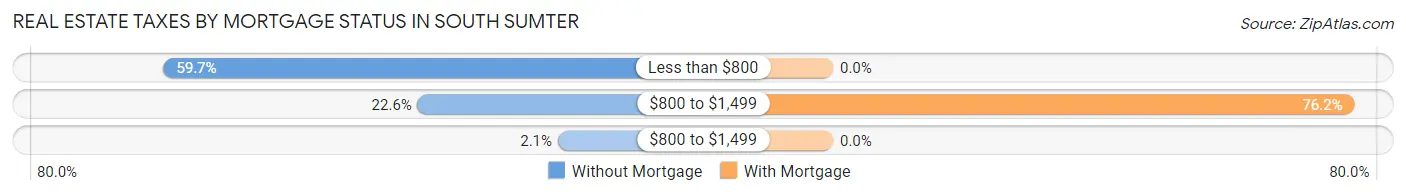
| Property Taxes | Without Mortgage | With Mortgage |
| Less than $800 | 172 (59.7%) | 0 (0.0%) |
| $800 to $1,499 | 65 (22.6%) | 48 (76.2%) |
| $800 to $1,499 | 6 (2.1%) | 0 (0.0%) |
| Total | 288 (100.0%) | 63 (100.0%) |
Health & Disability in South Sumter
Health Insurance Coverage by Age in South Sumter
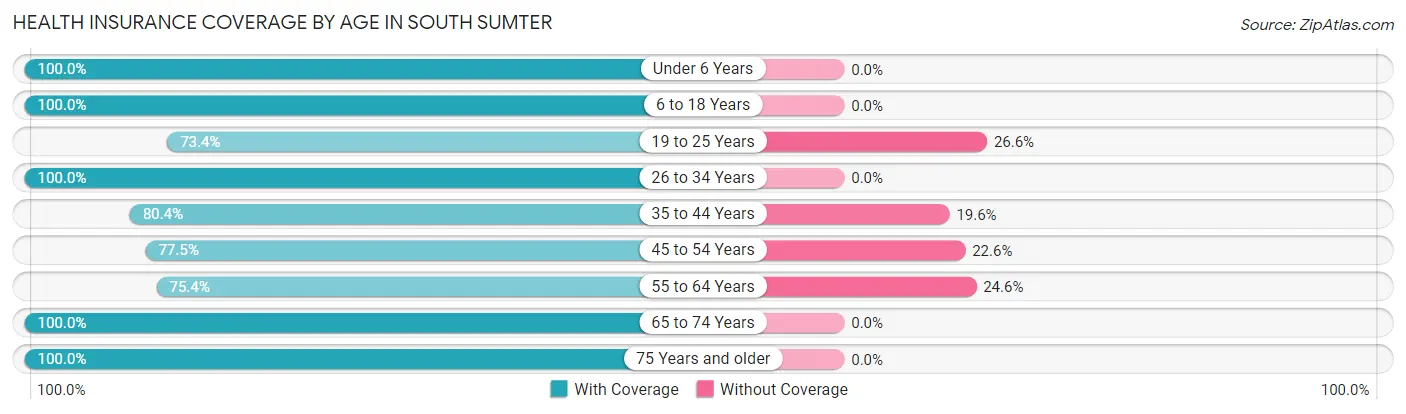
| Age Bracket | With Coverage | Without Coverage |
| Under 6 Years | 84 (100.0%) | 0 (0.0%) |
| 6 to 18 Years | 375 (100.0%) | 0 (0.0%) |
| 19 to 25 Years | 149 (73.4%) | 54 (26.6%) |
| 26 to 34 Years | 112 (100.0%) | 0 (0.0%) |
| 35 to 44 Years | 123 (80.4%) | 30 (19.6%) |
| 45 to 54 Years | 158 (77.4%) | 46 (22.6%) |
| 55 to 64 Years | 141 (75.4%) | 46 (24.6%) |
| 65 to 74 Years | 177 (100.0%) | 0 (0.0%) |
| 75 Years and older | 69 (100.0%) | 0 (0.0%) |
| Total | 1,388 (88.7%) | 176 (11.3%) |
Health Insurance Coverage by Citizenship Status in South Sumter
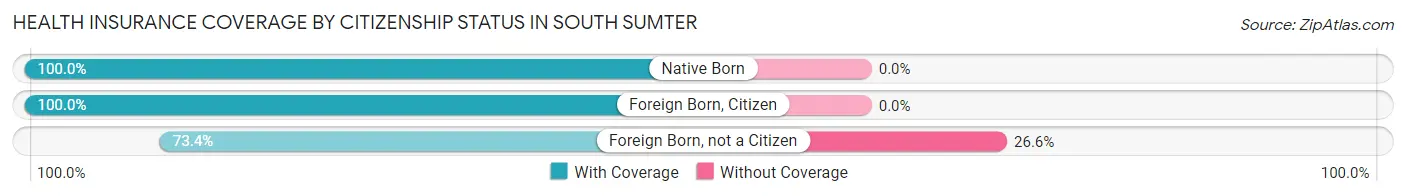
| Citizenship Status | With Coverage | Without Coverage |
| Native Born | 84 (100.0%) | 0 (0.0%) |
| Foreign Born, Citizen | 375 (100.0%) | 0 (0.0%) |
| Foreign Born, not a Citizen | 149 (73.4%) | 54 (26.6%) |
Health Insurance Coverage by Household Income in South Sumter
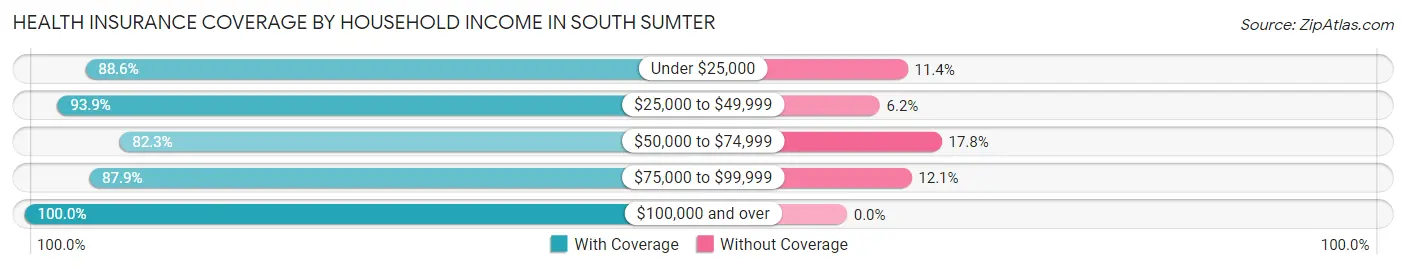
| Household Income | With Coverage | Without Coverage |
| Under $25,000 | 296 (88.6%) | 38 (11.4%) |
| $25,000 to $49,999 | 458 (93.9%) | 30 (6.1%) |
| $50,000 to $74,999 | 292 (82.3%) | 63 (17.7%) |
| $75,000 to $99,999 | 327 (87.9%) | 45 (12.1%) |
| $100,000 and over | 15 (100.0%) | 0 (0.0%) |
Public vs Private Health Insurance Coverage by Age in South Sumter
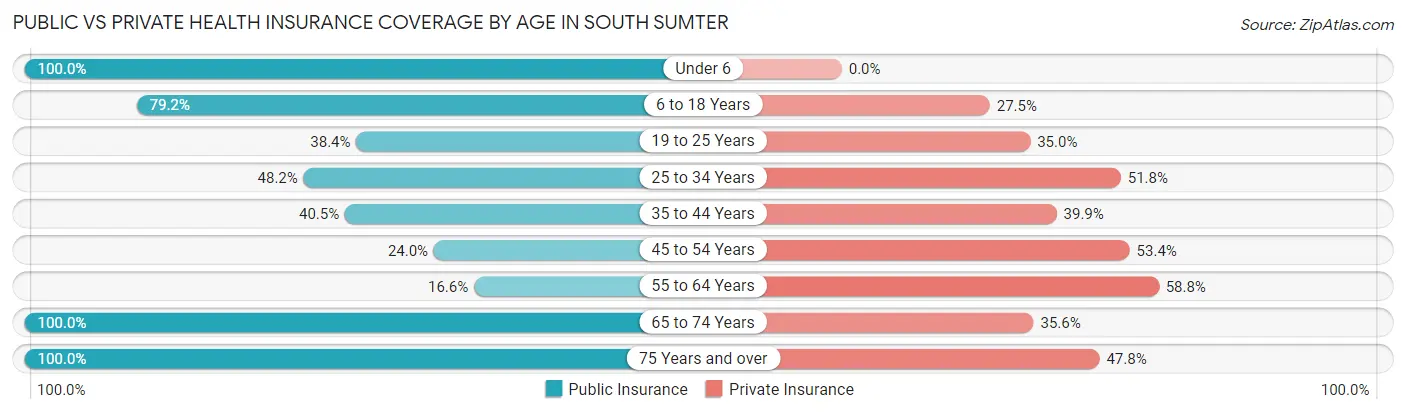
| Age Bracket | Public Insurance | Private Insurance |
| Under 6 | 84 (100.0%) | 0 (0.0%) |
| 6 to 18 Years | 297 (79.2%) | 103 (27.5%) |
| 19 to 25 Years | 78 (38.4%) | 71 (35.0%) |
| 25 to 34 Years | 54 (48.2%) | 58 (51.8%) |
| 35 to 44 Years | 62 (40.5%) | 61 (39.9%) |
| 45 to 54 Years | 49 (24.0%) | 109 (53.4%) |
| 55 to 64 Years | 31 (16.6%) | 110 (58.8%) |
| 65 to 74 Years | 177 (100.0%) | 63 (35.6%) |
| 75 Years and over | 69 (100.0%) | 33 (47.8%) |
| Total | 901 (57.6%) | 608 (38.9%) |
Disability Status by Sex by Age in South Sumter
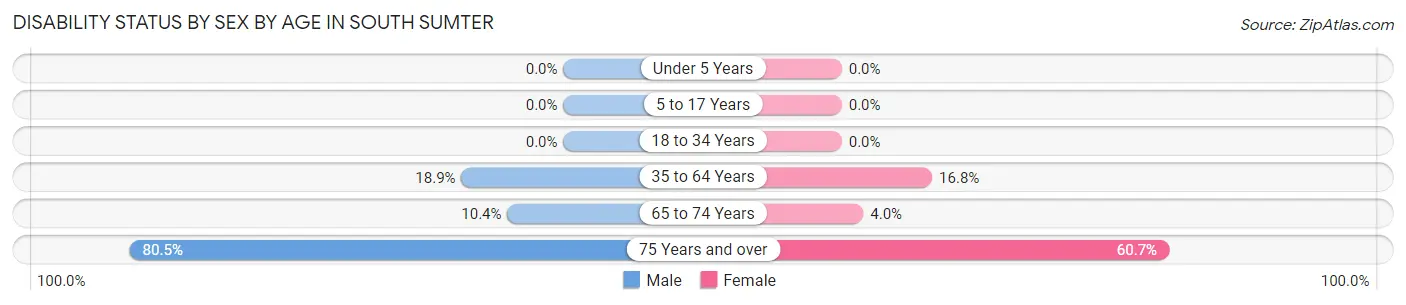
| Age Bracket | Male | Female |
| Under 5 Years | 0 (0.0%) | 0 (0.0%) |
| 5 to 17 Years | 0 (0.0%) | 0 (0.0%) |
| 18 to 34 Years | 0 (0.0%) | 0 (0.0%) |
| 35 to 64 Years | 42 (18.9%) | 54 (16.8%) |
| 65 to 74 Years | 8 (10.4%) | 4 (4.0%) |
| 75 Years and over | 33 (80.5%) | 17 (60.7%) |
Disability Class by Sex by Age in South Sumter
Disability Class: Hearing Difficulty
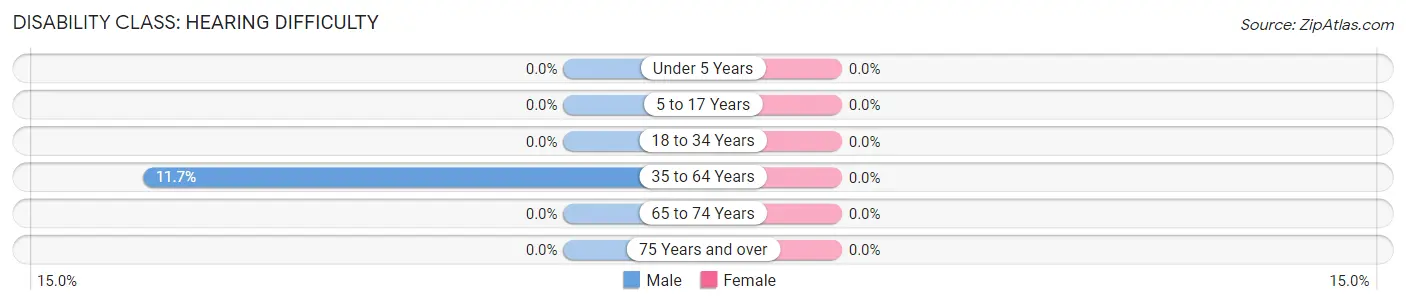
| Age Bracket | Male | Female |
| Under 5 Years | 0 (0.0%) | 0 (0.0%) |
| 5 to 17 Years | 0 (0.0%) | 0 (0.0%) |
| 18 to 34 Years | 0 (0.0%) | 0 (0.0%) |
| 35 to 64 Years | 26 (11.7%) | 0 (0.0%) |
| 65 to 74 Years | 0 (0.0%) | 0 (0.0%) |
| 75 Years and over | 0 (0.0%) | 0 (0.0%) |
Disability Class: Vision Difficulty
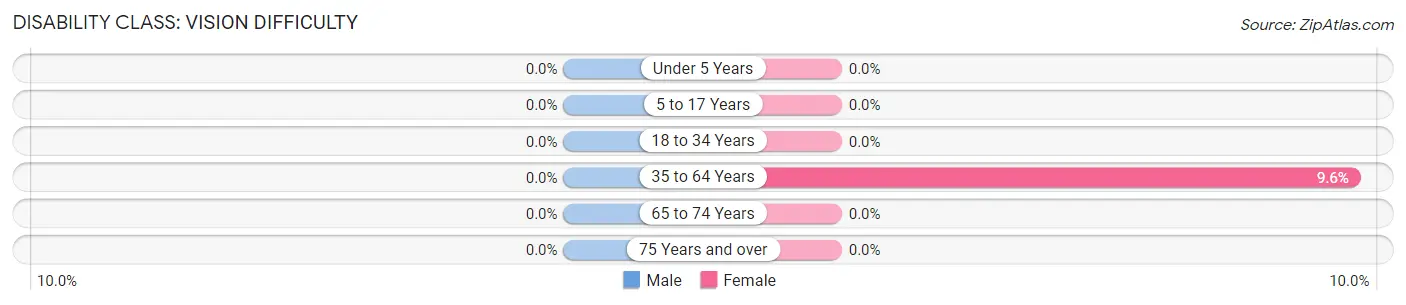
| Age Bracket | Male | Female |
| Under 5 Years | 0 (0.0%) | 0 (0.0%) |
| 5 to 17 Years | 0 (0.0%) | 0 (0.0%) |
| 18 to 34 Years | 0 (0.0%) | 0 (0.0%) |
| 35 to 64 Years | 0 (0.0%) | 31 (9.6%) |
| 65 to 74 Years | 0 (0.0%) | 0 (0.0%) |
| 75 Years and over | 0 (0.0%) | 0 (0.0%) |
Disability Class: Cognitive Difficulty
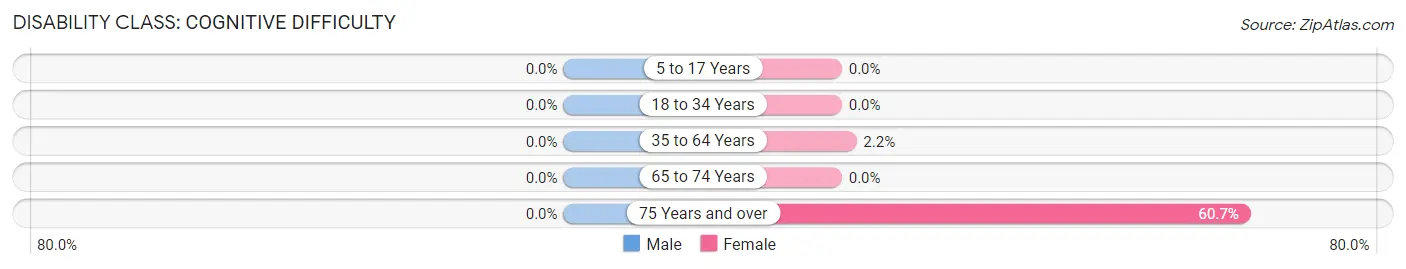
| Age Bracket | Male | Female |
| 5 to 17 Years | 0 (0.0%) | 0 (0.0%) |
| 18 to 34 Years | 0 (0.0%) | 0 (0.0%) |
| 35 to 64 Years | 0 (0.0%) | 7 (2.2%) |
| 65 to 74 Years | 0 (0.0%) | 0 (0.0%) |
| 75 Years and over | 0 (0.0%) | 17 (60.7%) |
Disability Class: Ambulatory Difficulty
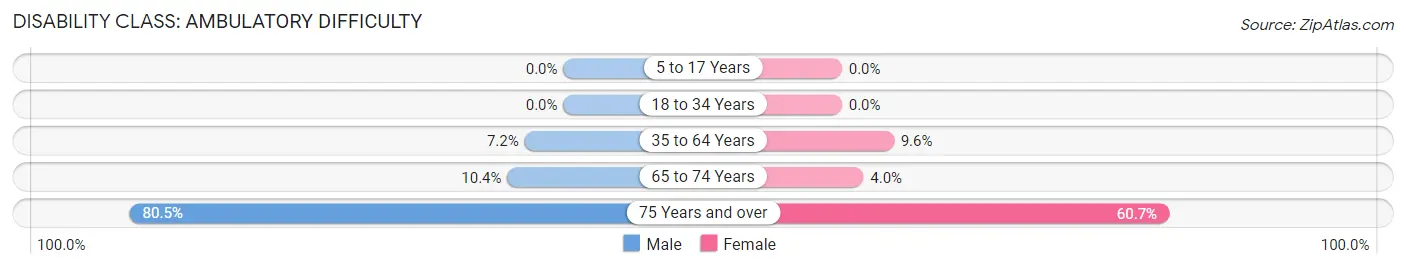
| Age Bracket | Male | Female |
| 5 to 17 Years | 0 (0.0%) | 0 (0.0%) |
| 18 to 34 Years | 0 (0.0%) | 0 (0.0%) |
| 35 to 64 Years | 16 (7.2%) | 31 (9.6%) |
| 65 to 74 Years | 8 (10.4%) | 4 (4.0%) |
| 75 Years and over | 33 (80.5%) | 17 (60.7%) |
Disability Class: Self-Care Difficulty
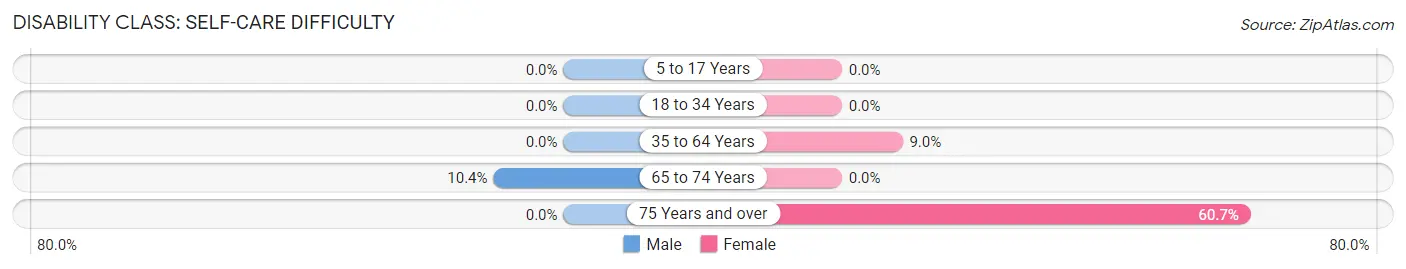
| Age Bracket | Male | Female |
| 5 to 17 Years | 0 (0.0%) | 0 (0.0%) |
| 18 to 34 Years | 0 (0.0%) | 0 (0.0%) |
| 35 to 64 Years | 0 (0.0%) | 29 (9.0%) |
| 65 to 74 Years | 8 (10.4%) | 0 (0.0%) |
| 75 Years and over | 0 (0.0%) | 17 (60.7%) |
Technology Access in South Sumter
Computing Device Access in South Sumter
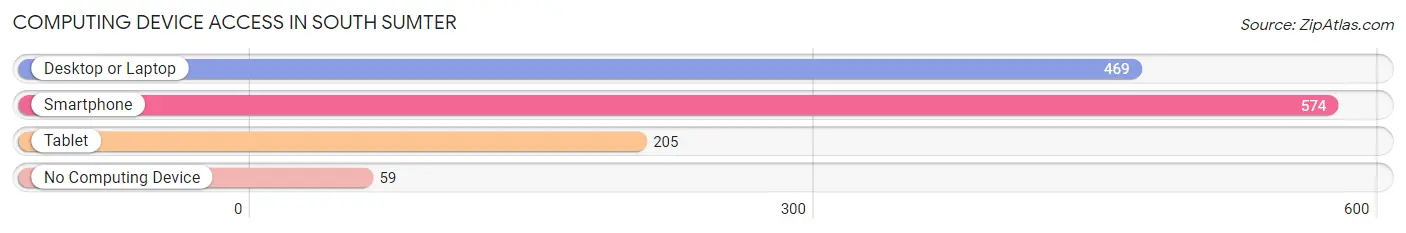
| Device Type | # Households | % Households |
| Desktop or Laptop | 469 | 70.5% |
| Smartphone | 574 | 86.3% |
| Tablet | 205 | 30.8% |
| No Computing Device | 59 | 8.9% |
| Total | 665 | 100.0% |
Internet Access in South Sumter
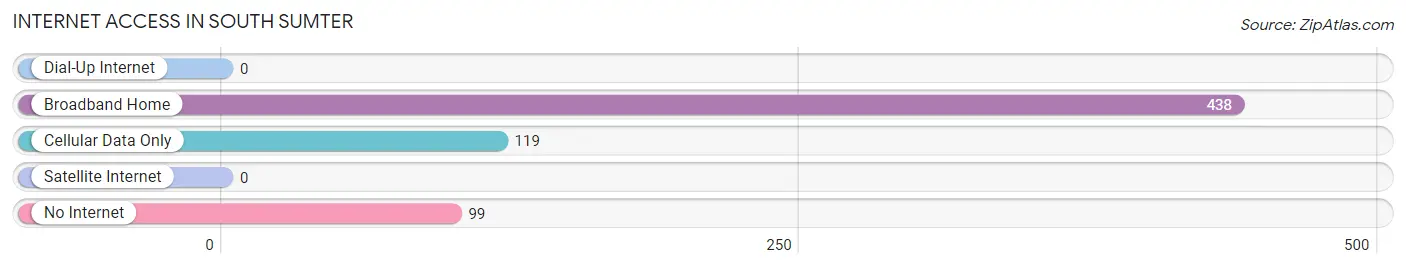
| Internet Type | # Households | % Households |
| Dial-Up Internet | 0 | 0.0% |
| Broadband Home | 438 | 65.9% |
| Cellular Data Only | 119 | 17.9% |
| Satellite Internet | 0 | 0.0% |
| No Internet | 99 | 14.9% |
| Total | 665 | 100.0% |
South Sumter Summary
Sumter, South Carolina is a city located in Sumter County, South Carolina, United States. It is the county seat of Sumter County and the principal city of the Sumter Metropolitan Statistical Area. The population of Sumter was 39,643 at the 2010 census.
History
The area that is now Sumter was originally inhabited by the Wateree Indians, a branch of the Catawba tribe. The first European settlers arrived in the area in 1740, and the town of Sumter was established in 1798. The town was named after General Thomas Sumter, a Revolutionary War hero.
Sumter was an important trading center during the antebellum period, and the town was the site of several battles during the Civil War. After the war, the town experienced a period of growth and prosperity, and by the early 20th century, Sumter had become an important industrial center.
Geography
Sumter is located in central South Carolina, approximately 40 miles east of Columbia. The city is situated in the Coastal Plain region of the state, and the terrain is generally flat. The city is located at the intersection of U.S. Routes 15 and 76.
Sumter has a humid subtropical climate, with hot, humid summers and mild winters. The average annual temperature is 64°F, and the average annual precipitation is 48 inches.
Economy
Sumter's economy is largely based on manufacturing and agriculture. The city is home to several large manufacturing plants, including a Michelin tire plant, a Continental Tire plant, and a Shaw Industries carpet plant. The city is also home to several agricultural operations, including poultry farms, cotton farms, and soybean farms.
Sumter is also home to Shaw Air Force Base, which is the largest employer in the city. The base is home to the 20th Fighter Wing, which is part of the Air Combat Command.
Demographics
As of the 2010 census, Sumter had a population of 39,643. The racial makeup of the city was 57.3% African American, 37.2% White, 0.7% Asian, 0.3% Native American, 0.1% Pacific Islander, and 4.4% from other races. The median household income was $33,945, and the median family income was $41,945.
Sumter is served by the Sumter School District, which includes seven elementary schools, three middle schools, and two high schools. The city is also home to several private schools, including Sumter Academy and Pinewood Preparatory School.
Common Questions
What is Per Capita Income in South Sumter?
Per Capita income in South Sumter is $18,433.
What is the Median Family Income in South Sumter?
Median Family Income in South Sumter is $58,166.
What is the Median Household income in South Sumter?
Median Household Income in South Sumter is $40,039.
What is Income or Wage Gap in South Sumter?
Income or Wage Gap in South Sumter is 32.8%.
Women in South Sumter earn 67.2 cents for every dollar earned by a man.
What is Inequality or Gini Index in South Sumter?
Inequality or Gini Index in South Sumter is 0.35.
What is the Total Population of South Sumter?
Total Population of South Sumter is 1,564.
What is the Total Male Population of South Sumter?
Total Male Population of South Sumter is 673.
What is the Total Female Population of South Sumter?
Total Female Population of South Sumter is 891.
What is the Ratio of Males per 100 Females in South Sumter?
There are 75.53 Males per 100 Females in South Sumter.
What is the Ratio of Females per 100 Males in South Sumter?
There are 132.39 Females per 100 Males in South Sumter.
What is the Median Population Age in South Sumter?
Median Population Age in South Sumter is 36.0 Years.
What is the Average Family Size in South Sumter
Average Family Size in South Sumter is 3.4 People.
What is the Average Household Size in South Sumter
Average Household Size in South Sumter is 2.4 People.
How Large is the Labor Force in South Sumter?
There are 718 People in the Labor Forcein in South Sumter.
What is the Percentage of People in the Labor Force in South Sumter?
61.6% of People are in the Labor Force in South Sumter.
What is the Unemployment Rate in South Sumter?
Unemployment Rate in South Sumter is 7.9%.