Kyle, SD Map & Demographics
Kyle Map
Kyle Overview
$10,538
PER CAPITA INCOME
0.44
INEQUALITY / GINI INDEX
1,504
TOTAL POPULATION
705
MALE POPULATION
799
FEMALE POPULATION
88.24
MALES / 100 FEMALES
113.33
FEMALES / 100 MALES
23.4
MEDIAN AGE
5.2
AVG FAMILY SIZE
4.7
AVG HOUSEHOLD SIZE
509
LABOR FORCE [ PEOPLE ]
53.0%
PERCENT IN LABOR FORCE
8.4%
UNEMPLOYMENT RATE
Kyle Zip Codes
Kyle Area Codes
Income in Kyle
Income Overview in Kyle
| Characteristic | Number | Measure |
| Per Capita Income | 1,504 | $10,538 |
| Median Family Income | 236 | $0 |
| Mean Family Income | 236 | $38,130 |
| Median Household Income | 314 | $0 |
| Mean Household Income | 314 | $44,312 |
| Income Deficit | 236 | $0 |
| Wage / Income Gap (%) | 1,504 | 0.00% |
| Wage / Income Gap ($) | 1,504 | 100.00¢ per $1 |
| Gini / Inequality Index | 1,504 | 0.44 |
Earnings by Sex in Kyle
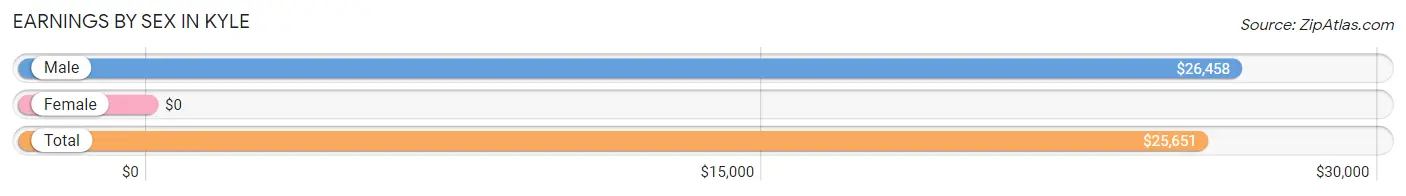
| Sex | Number | Average Earnings |
| Male | 142 (28.1%) | $26,458 |
| Female | 363 (71.9%) | $0 |
| Total | 505 (100.0%) | $25,651 |
Earnings by Sex by Income Bracket in Kyle
The most common earnings brackets in Kyle are $25,000 to $29,999 for men (48 | 33.8%) and $45,000 to $49,999 for women (97 | 26.7%).
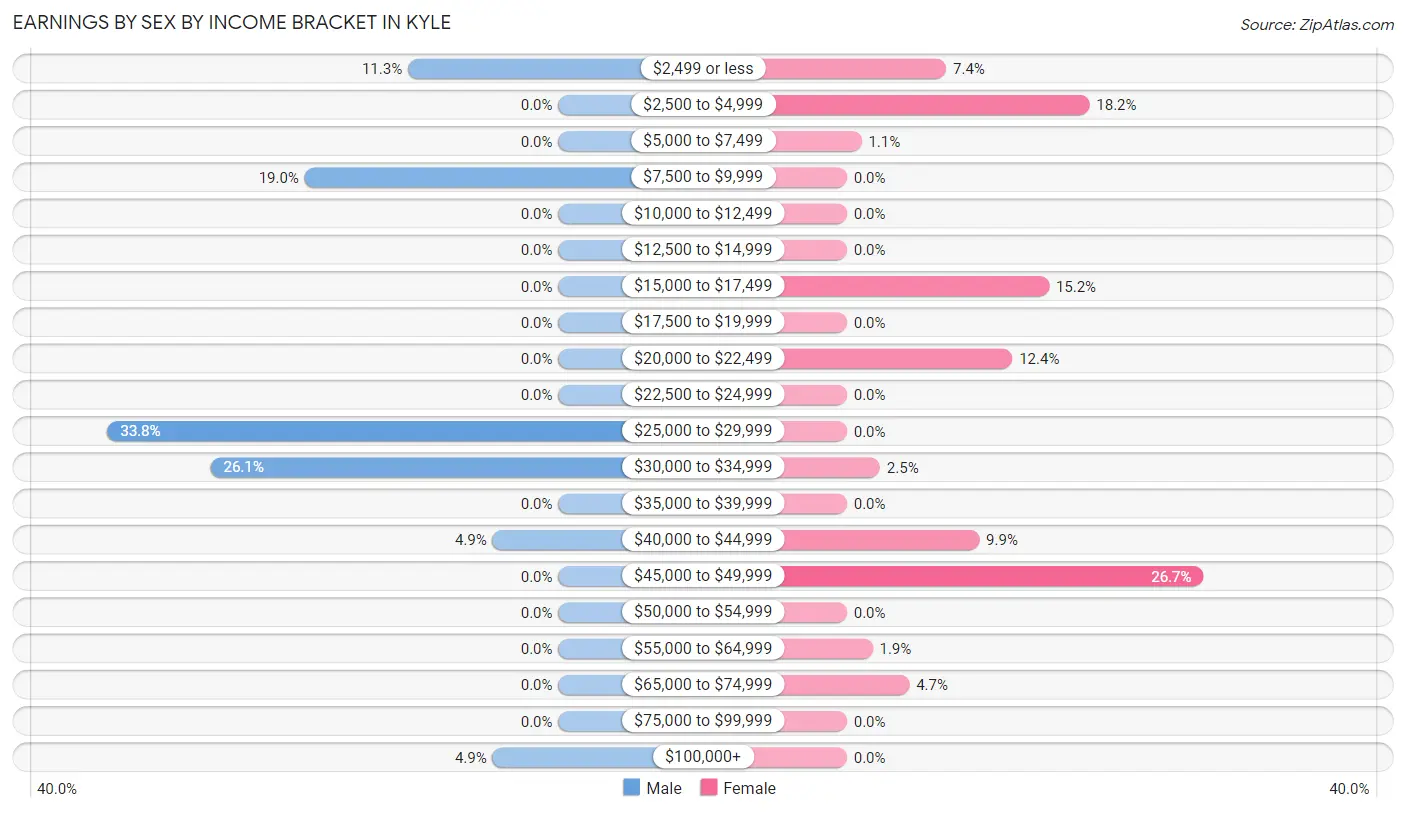
| Income | Male | Female |
| $2,499 or less | 16 (11.3%) | 27 (7.4%) |
| $2,500 to $4,999 | 0 (0.0%) | 66 (18.2%) |
| $5,000 to $7,499 | 0 (0.0%) | 4 (1.1%) |
| $7,500 to $9,999 | 27 (19.0%) | 0 (0.0%) |
| $10,000 to $12,499 | 0 (0.0%) | 0 (0.0%) |
| $12,500 to $14,999 | 0 (0.0%) | 0 (0.0%) |
| $15,000 to $17,499 | 0 (0.0%) | 55 (15.1%) |
| $17,500 to $19,999 | 0 (0.0%) | 0 (0.0%) |
| $20,000 to $22,499 | 0 (0.0%) | 45 (12.4%) |
| $22,500 to $24,999 | 0 (0.0%) | 0 (0.0%) |
| $25,000 to $29,999 | 48 (33.8%) | 0 (0.0%) |
| $30,000 to $34,999 | 37 (26.1%) | 9 (2.5%) |
| $35,000 to $39,999 | 0 (0.0%) | 0 (0.0%) |
| $40,000 to $44,999 | 7 (4.9%) | 36 (9.9%) |
| $45,000 to $49,999 | 0 (0.0%) | 97 (26.7%) |
| $50,000 to $54,999 | 0 (0.0%) | 0 (0.0%) |
| $55,000 to $64,999 | 0 (0.0%) | 7 (1.9%) |
| $65,000 to $74,999 | 0 (0.0%) | 17 (4.7%) |
| $75,000 to $99,999 | 0 (0.0%) | 0 (0.0%) |
| $100,000+ | 7 (4.9%) | 0 (0.0%) |
| Total | 142 (100.0%) | 363 (100.0%) |
Earnings by Sex by Educational Attainment in Kyle
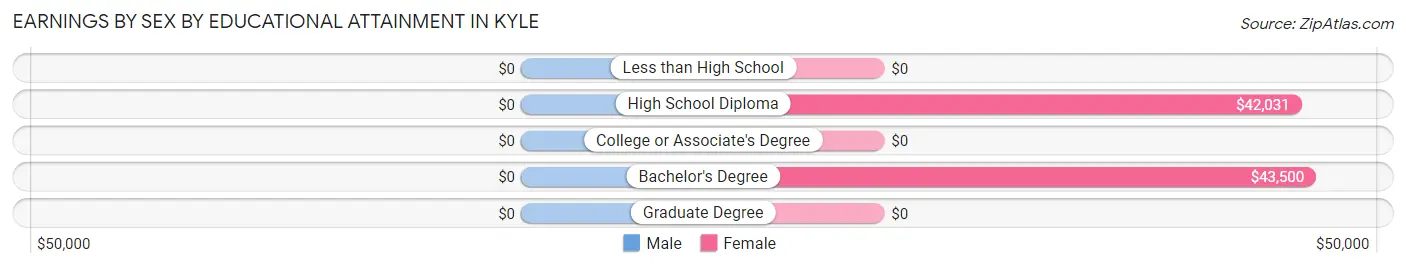
| Educational Attainment | Male Income | Female Income |
| Less than High School | - | - |
| High School Diploma | - | - |
| College or Associate's Degree | - | - |
| Bachelor's Degree | - | - |
| Graduate Degree | - | - |
| Total | - | - |
Family Income in Kyle
Family Income Brackets in Kyle
According to the Kyle family income data, there are 94 families falling into the less than $10,000 income range, which is the most common income bracket and makes up 39.8% of all families.
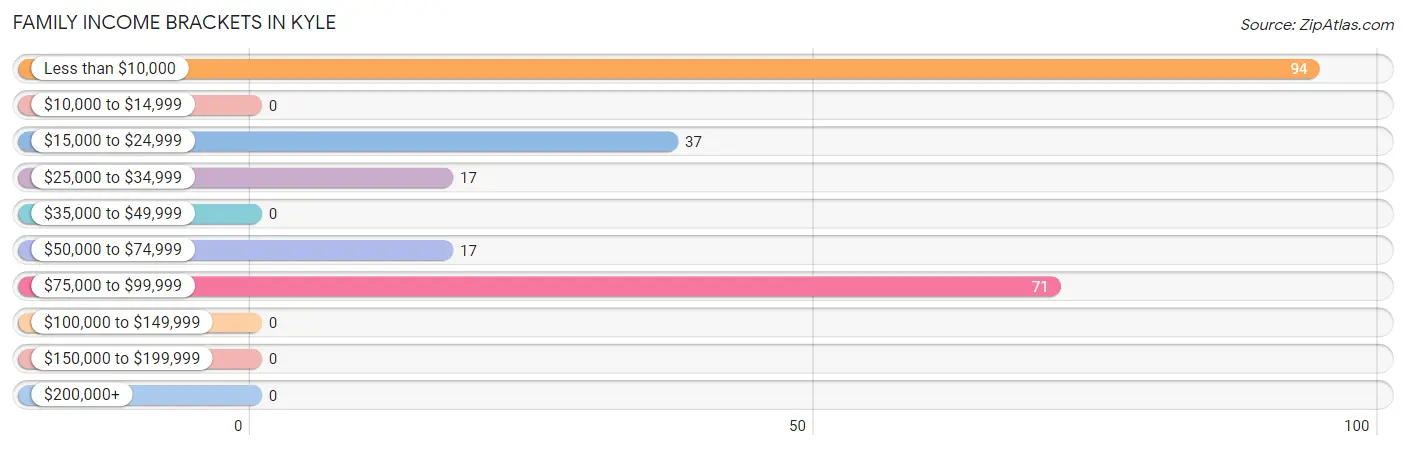
| Income Bracket | # Families | % Families |
| Less than $10,000 | 94 | 39.8% |
| $10,000 to $14,999 | 0 | 0.0% |
| $15,000 to $24,999 | 37 | 15.7% |
| $25,000 to $34,999 | 17 | 7.2% |
| $35,000 to $49,999 | 0 | 0.0% |
| $50,000 to $74,999 | 17 | 7.2% |
| $75,000 to $99,999 | 71 | 30.1% |
| $100,000 to $149,999 | 0 | 0.0% |
| $150,000 to $199,999 | 0 | 0.0% |
| $200,000+ | 0 | 0.0% |
Family Income by Famaliy Size in Kyle
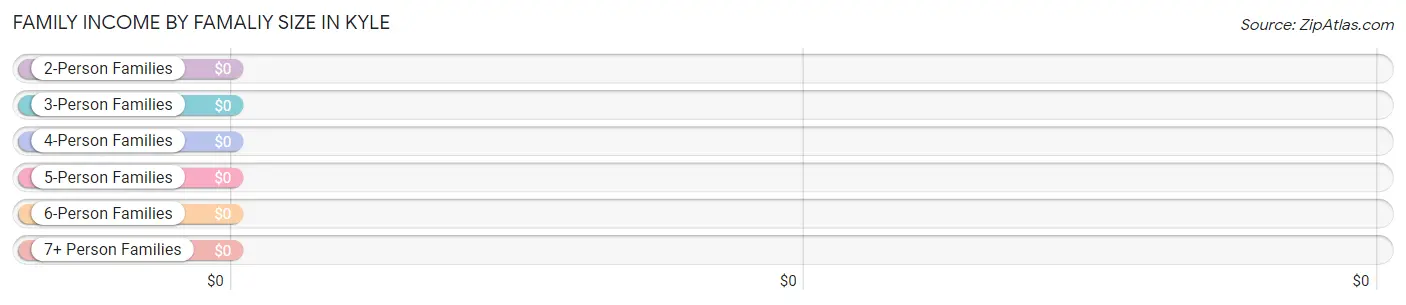
| Income Bracket | # Families | Median Income |
| 2-Person Families | 10 (4.2%) | $0 |
| 3-Person Families | 79 (33.5%) | $0 |
| 4-Person Families | 66 (28.0%) | $0 |
| 5-Person Families | 0 (0.0%) | $0 |
| 6-Person Families | 47 (19.9%) | $0 |
| 7+ Person Families | 34 (14.4%) | $0 |
| Total | 236 (100.0%) | $0 |
Family Income by Number of Earners in Kyle
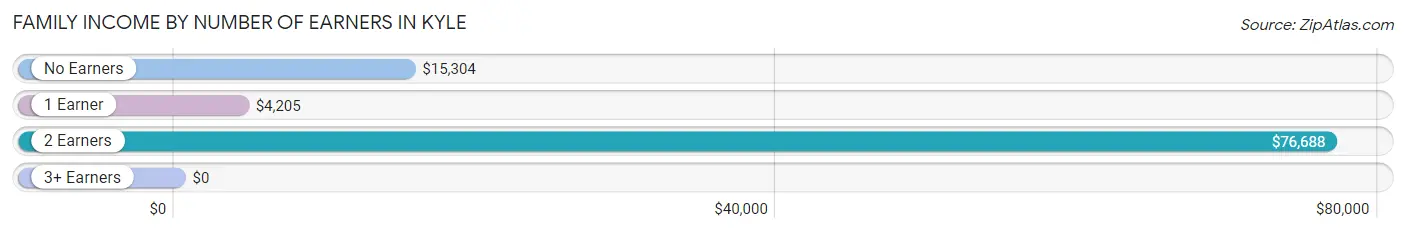
| Number of Earners | # Families | Median Income |
| No Earners | 65 (27.5%) | $15,304 |
| 1 Earner | 90 (38.1%) | $4,205 |
| 2 Earners | 47 (19.9%) | $76,688 |
| 3+ Earners | 34 (14.4%) | $0 |
| Total | 236 (100.0%) | $0 |
Household Income in Kyle
Household Income Brackets in Kyle
With 94 households falling in the category, the less than $10,000 income range is the most frequent in Kyle, accounting for 29.9% of all households.
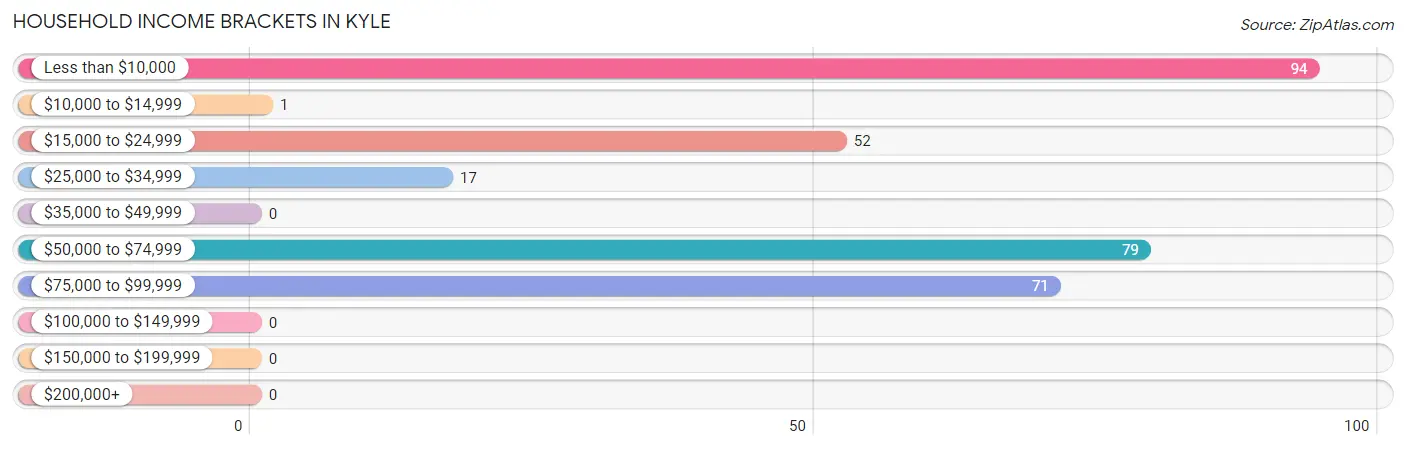
| Income Bracket | # Households | % Households |
| Less than $10,000 | 94 | 29.9% |
| $10,000 to $14,999 | 1 | 0.3% |
| $15,000 to $24,999 | 52 | 16.6% |
| $25,000 to $34,999 | 17 | 5.4% |
| $35,000 to $49,999 | 0 | 0.0% |
| $50,000 to $74,999 | 79 | 25.2% |
| $75,000 to $99,999 | 71 | 22.6% |
| $100,000 to $149,999 | 0 | 0.0% |
| $150,000 to $199,999 | 0 | 0.0% |
| $200,000+ | 0 | 0.0% |
Household Income by Householder Age in Kyle
| Income Bracket | # Households | Median Income |
| 15 to 24 Years | 62 (19.8%) | $0 |
| 25 to 44 Years | 86 (27.4%) | $0 |
| 45 to 64 Years | 138 (44.0%) | $0 |
| 65+ Years | 28 (8.9%) | $0 |
| Total | 314 (100.0%) | $0 |
Poverty in Kyle
Income Below Poverty by Sex and Age in Kyle
With 58.1% poverty level for males and 49.7% for females among the residents of Kyle, 12 to 14 year old males and 65 to 74 year old females are the most vulnerable to poverty, with 22 males (100.0%) and 56 females (100.0%) in their respective age groups living below the poverty level.
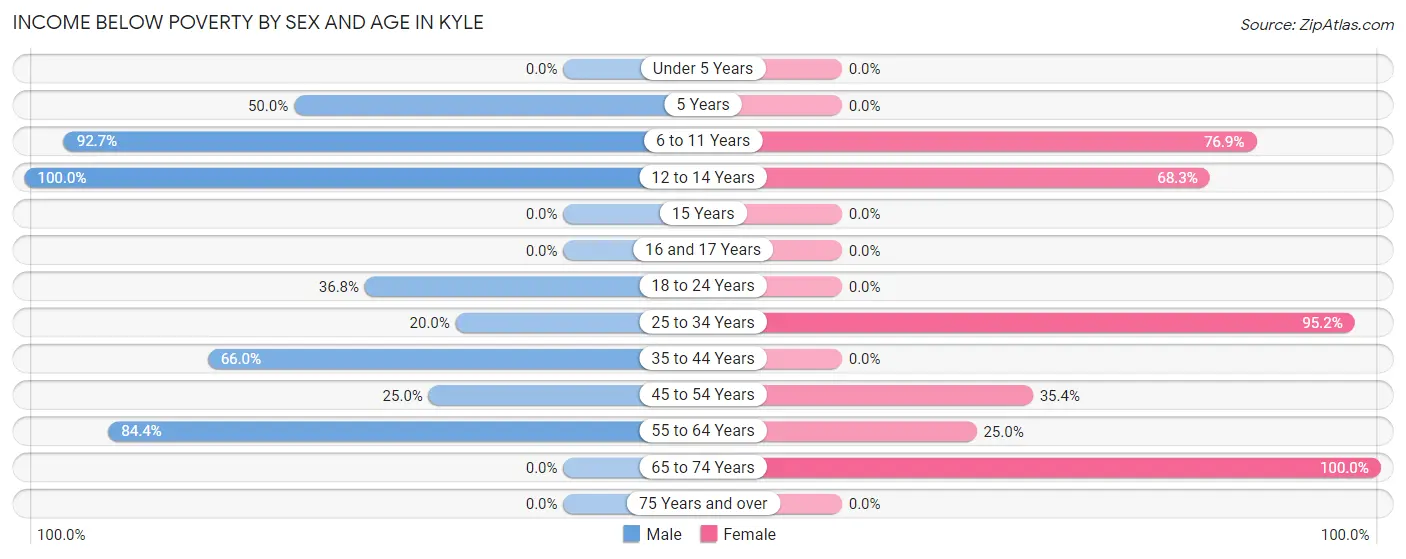
| Age Bracket | Male | Female |
| Under 5 Years | 0 (0.0%) | 0 (0.0%) |
| 5 Years | 22 (50.0%) | 0 (0.0%) |
| 6 to 11 Years | 178 (92.7%) | 90 (76.9%) |
| 12 to 14 Years | 22 (100.0%) | 86 (68.2%) |
| 15 Years | 0 (0.0%) | 0 (0.0%) |
| 16 and 17 Years | 0 (0.0%) | 0 (0.0%) |
| 18 to 24 Years | 28 (36.8%) | 0 (0.0%) |
| 25 to 34 Years | 16 (20.0%) | 118 (95.2%) |
| 35 to 44 Years | 66 (66.0%) | 0 (0.0%) |
| 45 to 54 Years | 10 (25.0%) | 28 (35.4%) |
| 55 to 64 Years | 38 (84.4%) | 17 (25.0%) |
| 65 to 74 Years | 0 (0.0%) | 56 (100.0%) |
| 75 Years and over | 0 (0.0%) | 0 (0.0%) |
| Total | 380 (58.1%) | 395 (49.7%) |
Income Above Poverty by Sex and Age in Kyle
According to the poverty statistics in Kyle, males aged under 5 years and females aged 16 and 17 years are the age groups that are most secure financially, with 100.0% of males and 100.0% of females in these age groups living above the poverty line.
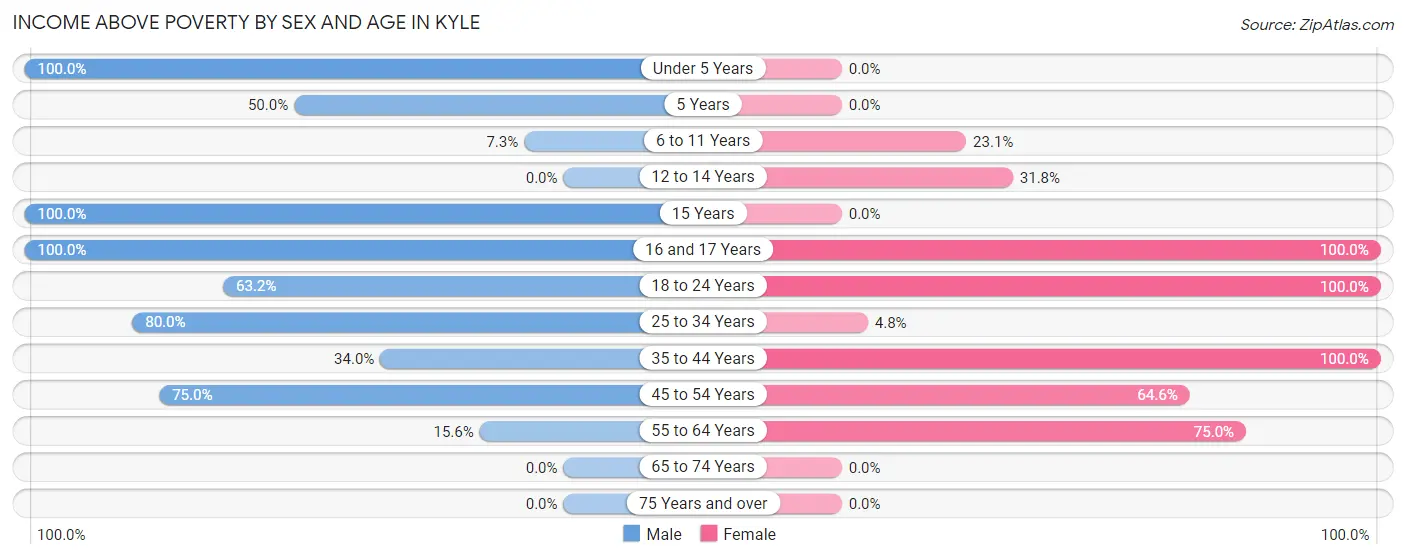
| Age Bracket | Male | Female |
| Under 5 Years | 8 (100.0%) | 0 (0.0%) |
| 5 Years | 22 (50.0%) | 0 (0.0%) |
| 6 to 11 Years | 14 (7.3%) | 27 (23.1%) |
| 12 to 14 Years | 0 (0.0%) | 40 (31.8%) |
| 15 Years | 14 (100.0%) | 0 (0.0%) |
| 16 and 17 Years | 33 (100.0%) | 42 (100.0%) |
| 18 to 24 Years | 48 (63.2%) | 135 (100.0%) |
| 25 to 34 Years | 64 (80.0%) | 6 (4.8%) |
| 35 to 44 Years | 34 (34.0%) | 48 (100.0%) |
| 45 to 54 Years | 30 (75.0%) | 51 (64.6%) |
| 55 to 64 Years | 7 (15.6%) | 51 (75.0%) |
| 65 to 74 Years | 0 (0.0%) | 0 (0.0%) |
| 75 Years and over | 0 (0.0%) | 0 (0.0%) |
| Total | 274 (41.9%) | 400 (50.3%) |
Income Below Poverty Among Married-Couple Families in Kyle
The poverty statistics for married-couple families in Kyle show that 38.6% or 17 of the total 44 families live below the poverty line. Families with 5 or more children have the highest poverty rate of 100.0%, comprising of 17 families. On the other hand, families with 1 or 2 children have the lowest poverty rate of 0.0%, which includes 0 families.
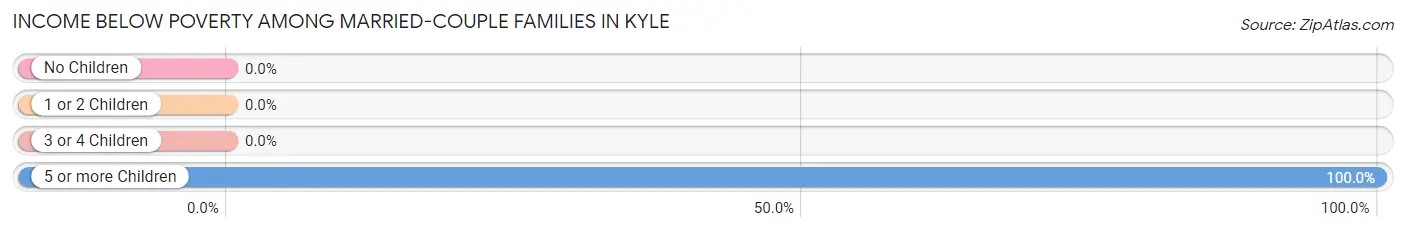
| Children | Above Poverty | Below Poverty |
| No Children | 0 (0.0%) | 0 (0.0%) |
| 1 or 2 Children | 7 (100.0%) | 0 (0.0%) |
| 3 or 4 Children | 20 (100.0%) | 0 (0.0%) |
| 5 or more Children | 0 (0.0%) | 17 (100.0%) |
| Total | 27 (61.4%) | 17 (38.6%) |
Income Below Poverty Among Single-Parent Households in Kyle
According to the poverty data in Kyle, 100.0% or 10 single-father households and 66.5% or 121 single-mother households are living below the poverty line. Among single-father households, those with no children have the highest poverty rate, with 10 households (100.0%) experiencing poverty. Likewise, among single-mother households, those with no children have the highest poverty rate, with 28 households (100.0%) falling below the poverty line.
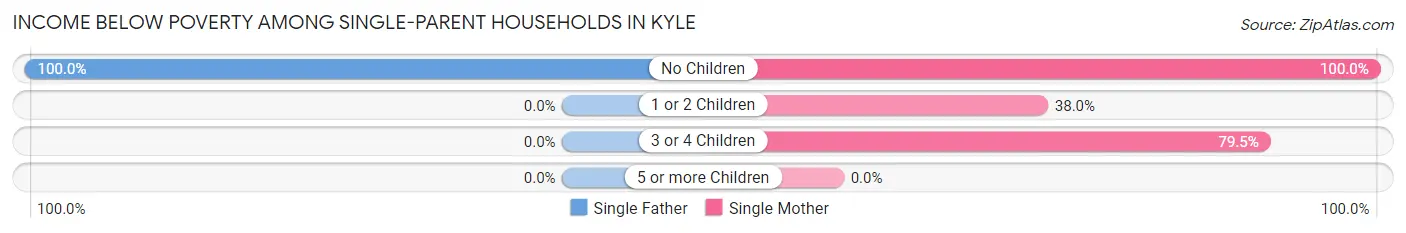
| Children | Single Father | Single Mother |
| No Children | 10 (100.0%) | 28 (100.0%) |
| 1 or 2 Children | 0 (0.0%) | 27 (38.0%) |
| 3 or 4 Children | 0 (0.0%) | 66 (79.5%) |
| 5 or more Children | 0 (0.0%) | 0 (0.0%) |
| Total | 10 (100.0%) | 121 (66.5%) |
Income Below Poverty Among Married-Couple vs Single-Parent Households in Kyle
The poverty data for Kyle shows that 17 of the married-couple family households (38.6%) and 131 of the single-parent households (68.2%) are living below the poverty level. Within the married-couple family households, those with 5 or more children have the highest poverty rate, with 17 households (100.0%) falling below the poverty line. Among the single-parent households, those with no children have the highest poverty rate, with 38 household (100.0%) living below poverty.
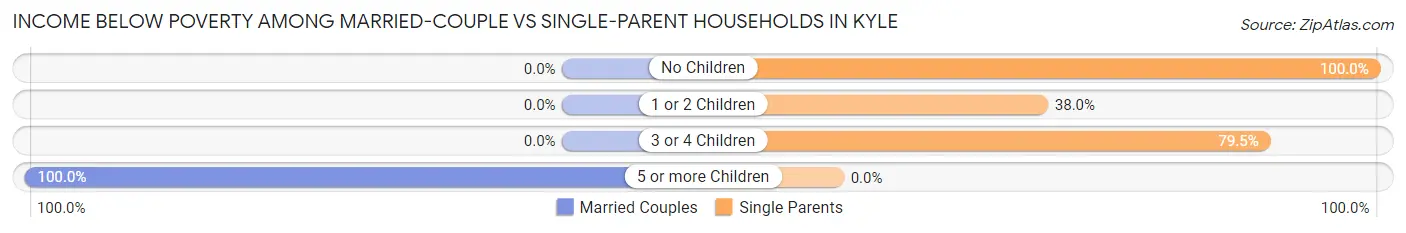
| Children | Married-Couple Families | Single-Parent Households |
| No Children | 0 (0.0%) | 38 (100.0%) |
| 1 or 2 Children | 0 (0.0%) | 27 (38.0%) |
| 3 or 4 Children | 0 (0.0%) | 66 (79.5%) |
| 5 or more Children | 17 (100.0%) | 0 (0.0%) |
| Total | 17 (38.6%) | 131 (68.2%) |
Race in Kyle
The most populous races in Kyle are Native / Alaskan (1,360 | 90.4%), Hispanic or Latino (70 | 4.6%), and Some other Race (70 | 4.6%).
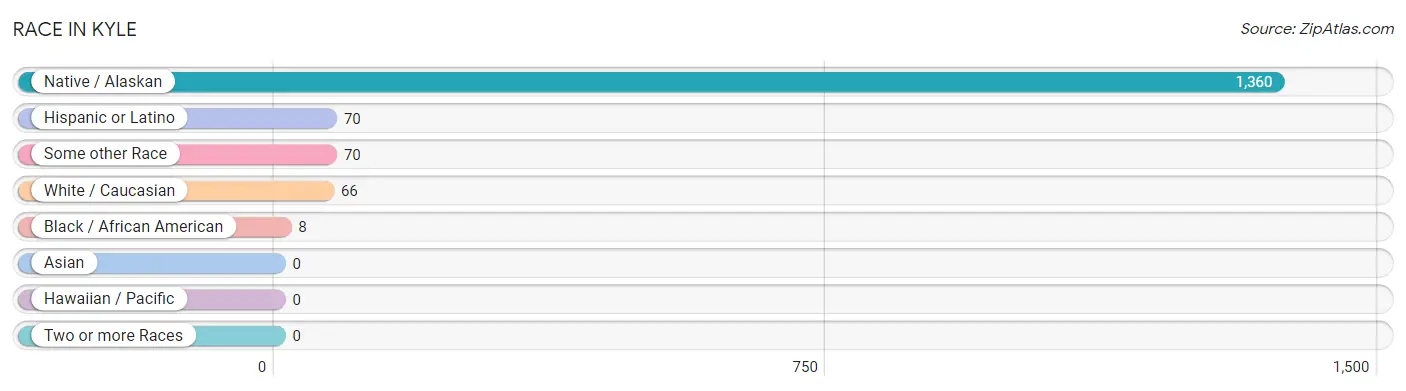
| Race | # Population | % Population |
| Asian | 0 | 0.0% |
| Black / African American | 8 | 0.5% |
| Hawaiian / Pacific | 0 | 0.0% |
| Hispanic or Latino | 70 | 4.6% |
| Native / Alaskan | 1,360 | 90.4% |
| White / Caucasian | 66 | 4.4% |
| Two or more Races | 0 | 0.0% |
| Some other Race | 70 | 4.6% |
| Total | 1,504 | 100.0% |
Ancestry in Kyle
The most populous ancestries reported in Kyle are Sioux (812 | 54.0%), Mexican (70 | 4.6%), Brazilian (62 | 4.1%), Irish (14 | 0.9%), and German (7 | 0.5%), together accounting for 64.2% of all Kyle residents.
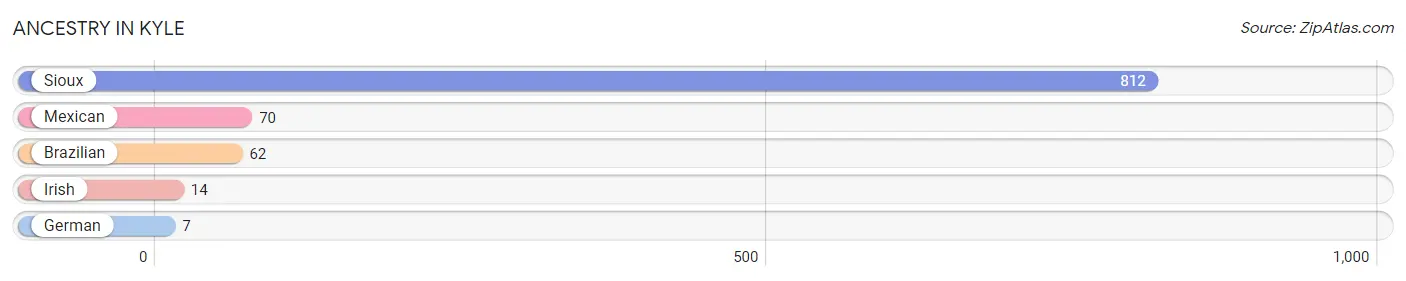
| Ancestry | # Population | % Population |
| Brazilian | 62 | 4.1% |
| German | 7 | 0.5% |
| Irish | 14 | 0.9% |
| Mexican | 70 | 4.6% |
| Sioux | 812 | 54.0% | View All 5 Rows |
Immigrants in Kyle

| Immigration Origin | # Population | % Population | View All 0 Rows |
Sex and Age in Kyle
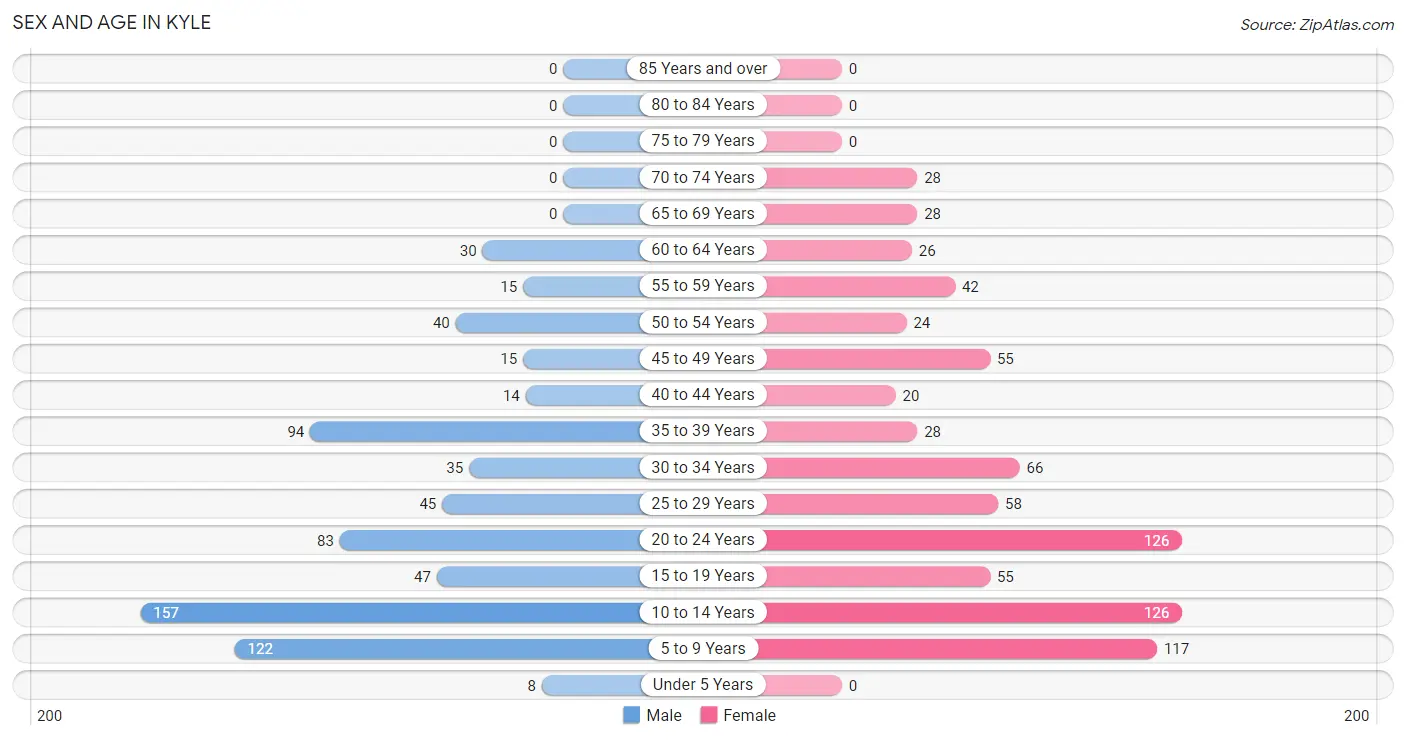
Sex and Age in Kyle
The most populous age groups in Kyle are 10 to 14 Years (157 | 22.3%) for men and 10 to 14 Years (126 | 15.8%) for women.
| Age Bracket | Male | Female |
| Under 5 Years | 8 (1.1%) | 0 (0.0%) |
| 5 to 9 Years | 122 (17.3%) | 117 (14.6%) |
| 10 to 14 Years | 157 (22.3%) | 126 (15.8%) |
| 15 to 19 Years | 47 (6.7%) | 55 (6.9%) |
| 20 to 24 Years | 83 (11.8%) | 126 (15.8%) |
| 25 to 29 Years | 45 (6.4%) | 58 (7.3%) |
| 30 to 34 Years | 35 (5.0%) | 66 (8.3%) |
| 35 to 39 Years | 94 (13.3%) | 28 (3.5%) |
| 40 to 44 Years | 14 (2.0%) | 20 (2.5%) |
| 45 to 49 Years | 15 (2.1%) | 55 (6.9%) |
| 50 to 54 Years | 40 (5.7%) | 24 (3.0%) |
| 55 to 59 Years | 15 (2.1%) | 42 (5.3%) |
| 60 to 64 Years | 30 (4.3%) | 26 (3.3%) |
| 65 to 69 Years | 0 (0.0%) | 28 (3.5%) |
| 70 to 74 Years | 0 (0.0%) | 28 (3.5%) |
| 75 to 79 Years | 0 (0.0%) | 0 (0.0%) |
| 80 to 84 Years | 0 (0.0%) | 0 (0.0%) |
| 85 Years and over | 0 (0.0%) | 0 (0.0%) |
| Total | 705 (100.0%) | 799 (100.0%) |
Families and Households in Kyle
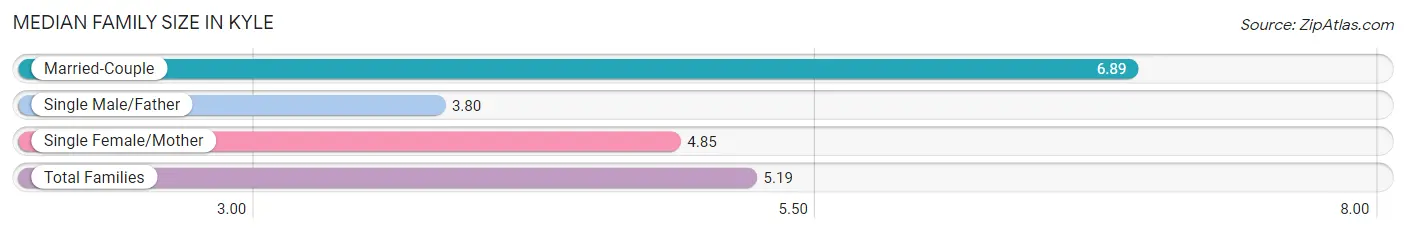
Median Family Size in Kyle
The median family size in Kyle is 5.19 persons per family, with married-couple families (44 | 18.6%) accounting for the largest median family size of 6.89 persons per family. On the other hand, single male/father families (10 | 4.2%) represent the smallest median family size with 3.80 persons per family.
| Family Type | # Families | Family Size |
| Married-Couple | 44 (18.6%) | 6.89 |
| Single Male/Father | 10 (4.2%) | 3.80 |
| Single Female/Mother | 182 (77.1%) | 4.85 |
| Total Families | 236 (100.0%) | 5.19 |
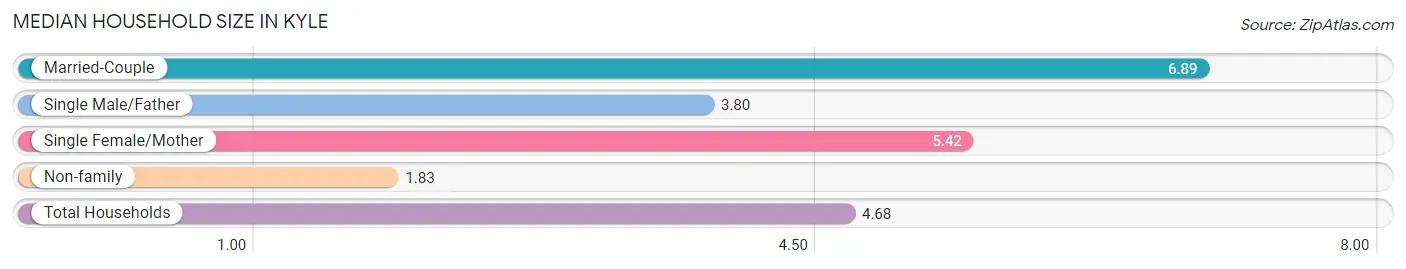
Median Household Size in Kyle
The median household size in Kyle is 4.68 persons per household, with married-couple households (44 | 14.0%) accounting for the largest median household size of 6.89 persons per household. non-family households (78 | 24.8%) represent the smallest median household size with 1.83 persons per household.
| Household Type | # Households | Household Size |
| Married-Couple | 44 (14.0%) | 6.89 |
| Single Male/Father | 10 (3.2%) | 3.80 |
| Single Female/Mother | 182 (58.0%) | 5.42 |
| Non-family | 78 (24.8%) | 1.83 |
| Total Households | 314 (100.0%) | 4.68 |
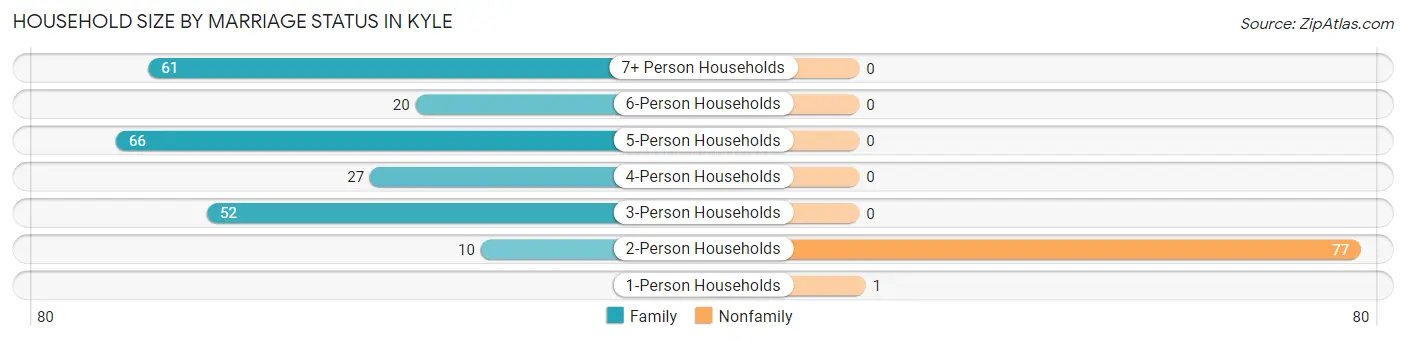
Household Size by Marriage Status in Kyle
Out of a total of 314 households in Kyle, 236 (75.2%) are family households, while 78 (24.8%) are nonfamily households. The most numerous type of family households are 5-person households, comprising 66, and the most common type of nonfamily households are 2-person households, comprising 77.
| Household Size | Family Households | Nonfamily Households |
| 1-Person Households | - | 1 (0.3%) |
| 2-Person Households | 10 (3.2%) | 77 (24.5%) |
| 3-Person Households | 52 (16.6%) | 0 (0.0%) |
| 4-Person Households | 27 (8.6%) | 0 (0.0%) |
| 5-Person Households | 66 (21.0%) | 0 (0.0%) |
| 6-Person Households | 20 (6.4%) | 0 (0.0%) |
| 7+ Person Households | 61 (19.4%) | 0 (0.0%) |
| Total | 236 (75.2%) | 78 (24.8%) |
Female Fertility in Kyle
Fertility by Age in Kyle
| Age Bracket | Women with Births | Births / 1,000 Women |
| 15 to 19 years | 0 (0.0%) | 0.0 |
| 20 to 34 years | 0 (0.0%) | 0.0 |
| 35 to 50 years | 0 (0.0%) | 0.0 |
| Total | 0 (0.0%) | 0.0 |
Fertility by Age by Marriage Status in Kyle
| Age Bracket | Married | Unmarried |
| 15 to 19 years | 0 (0.0%) | 0 (0.0%) |
| 20 to 34 years | 0 (0.0%) | 0 (0.0%) |
| 35 to 50 years | 0 (0.0%) | 0 (0.0%) |
| Total | 0 (0.0%) | 0 (0.0%) |
Fertility by Education in Kyle
| Educational Attainment | Women with Births | Births / 1,000 Women |
| Less than High School | 0 (0.0%) | 0.0 |
| High School Diploma | 0 (0.0%) | 0.0 |
| College or Associate's Degree | 0 (0.0%) | 0.0 |
| Bachelor's Degree | 0 (0.0%) | 0.0 |
| Graduate Degree | 0 (0.0%) | 0.0 |
| Total | 0 (0.0%) | 0.0 |
Fertility by Education by Marriage Status in Kyle
| Educational Attainment | Married | Unmarried |
| Less than High School | 0 (0.0%) | 0 (0.0%) |
| High School Diploma | 0 (0.0%) | 0 (0.0%) |
| College or Associate's Degree | 0 (0.0%) | 0 (0.0%) |
| Bachelor's Degree | 0 (0.0%) | 0 (0.0%) |
| Graduate Degree | 0 (0.0%) | 0 (0.0%) |
| Total | 0 (0.0%) | 0 (0.0%) |
Employment Characteristics in Kyle
Employment by Class of Employer in Kyle
Among the 466 employed individuals in Kyle, local government employees (245 | 52.6%), private company employees (143 | 30.7%), and not-for-profit organizations (47 | 10.1%) make up the most common classes of employment.
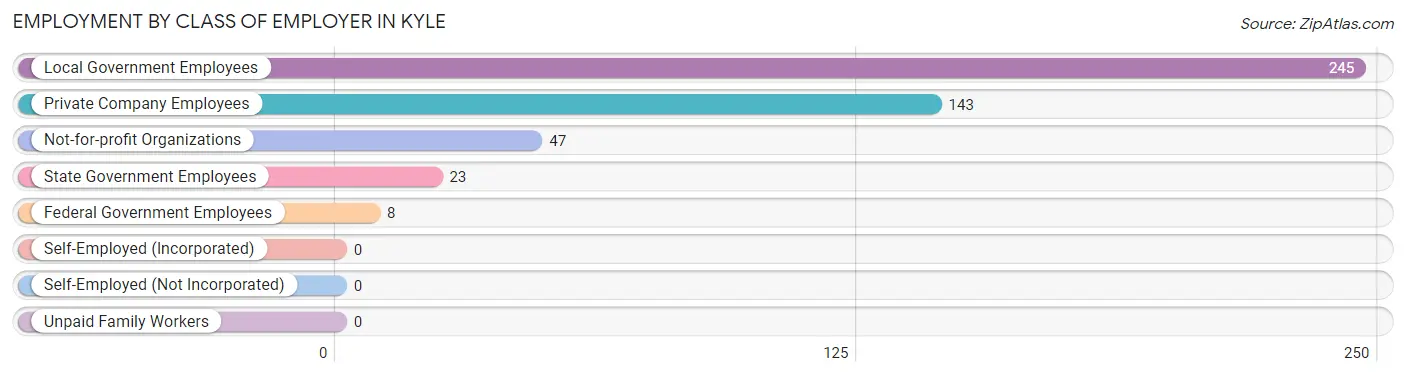
| Employer Class | # Employees | % Employees |
| Private Company Employees | 143 | 30.7% |
| Self-Employed (Incorporated) | 0 | 0.0% |
| Self-Employed (Not Incorporated) | 0 | 0.0% |
| Not-for-profit Organizations | 47 | 10.1% |
| Local Government Employees | 245 | 52.6% |
| State Government Employees | 23 | 4.9% |
| Federal Government Employees | 8 | 1.7% |
| Unpaid Family Workers | 0 | 0.0% |
| Total | 466 | 100.0% |
Employment Status by Age in Kyle
According to the labor force statistics for Kyle, out of the total population over 16 years of age (960), 53.0% or 509 individuals are in the labor force, with 8.4% or 43 of them unemployed. The age group with the highest labor force participation rate is 30 to 34 years, with 92.1% or 93 individuals in the labor force. Within the labor force, the 16 to 19 years age range has the highest percentage of unemployed individuals, with 100.0% or 13 of them being unemployed.
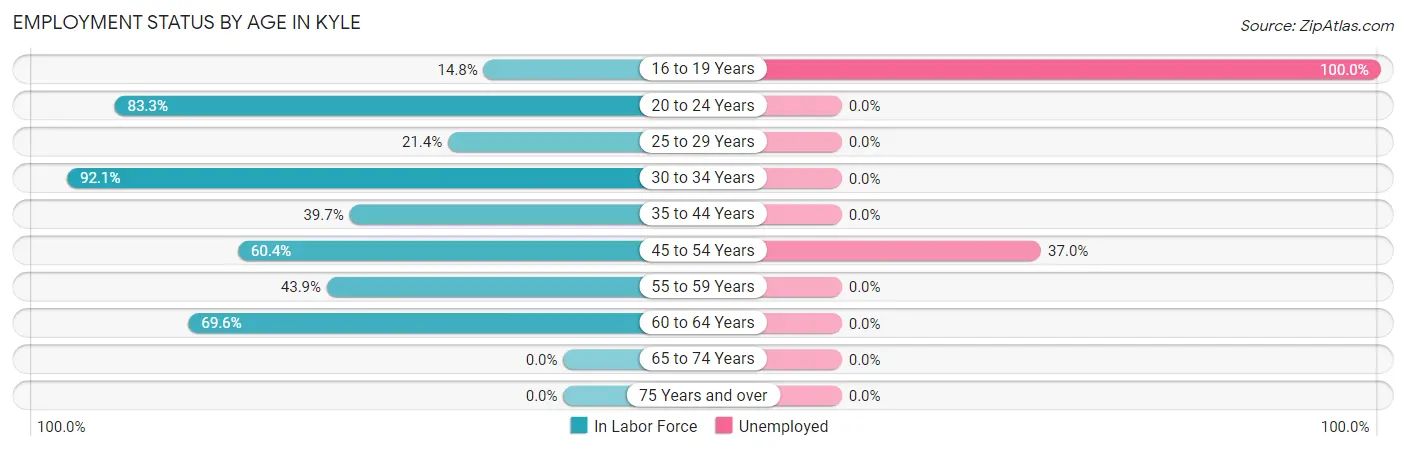
| Age Bracket | In Labor Force | Unemployed |
| 16 to 19 Years | 13 (14.8%) | 13 (100.0%) |
| 20 to 24 Years | 174 (83.3%) | 0 (0.0%) |
| 25 to 29 Years | 22 (21.4%) | 0 (0.0%) |
| 30 to 34 Years | 93 (92.1%) | 0 (0.0%) |
| 35 to 44 Years | 62 (39.7%) | 0 (0.0%) |
| 45 to 54 Years | 81 (60.4%) | 30 (37.0%) |
| 55 to 59 Years | 25 (43.9%) | 0 (0.0%) |
| 60 to 64 Years | 39 (69.6%) | 0 (0.0%) |
| 65 to 74 Years | 0 (0.0%) | 0 (0.0%) |
| 75 Years and over | 0 (0.0%) | 0 (0.0%) |
| Total | 509 (53.0%) | 43 (8.4%) |
Employment Status by Educational Attainment in Kyle
According to labor force statistics for Kyle, 53.0% of individuals (322) out of the total population between 25 and 64 years of age (607) are in the labor force, with 9.3% or 30 of them being unemployed. The group with the highest labor force participation rate are those with the educational attainment of bachelor's degree or higher, with 100.0% or 72 individuals in the labor force. Within the labor force, individuals with college / associate degree education have the highest percentage of unemployment, with 44.8% or 30 of them being unemployed.
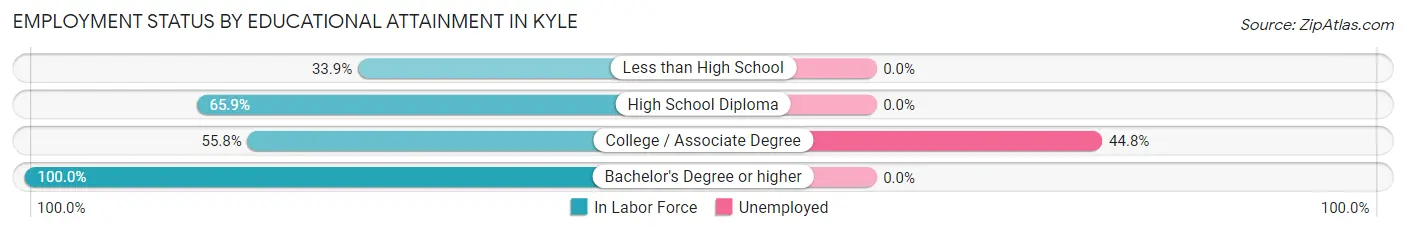
| Educational Attainment | In Labor Force | Unemployed |
| Less than High School | 96 (33.9%) | 0 (0.0%) |
| High School Diploma | 87 (65.9%) | 0 (0.0%) |
| College / Associate Degree | 67 (55.8%) | 54 (44.8%) |
| Bachelor's Degree or higher | 72 (100.0%) | 0 (0.0%) |
| Total | 322 (53.0%) | 56 (9.3%) |
Employment Occupations by Sex in Kyle
Management, Business, Science and Arts Occupations
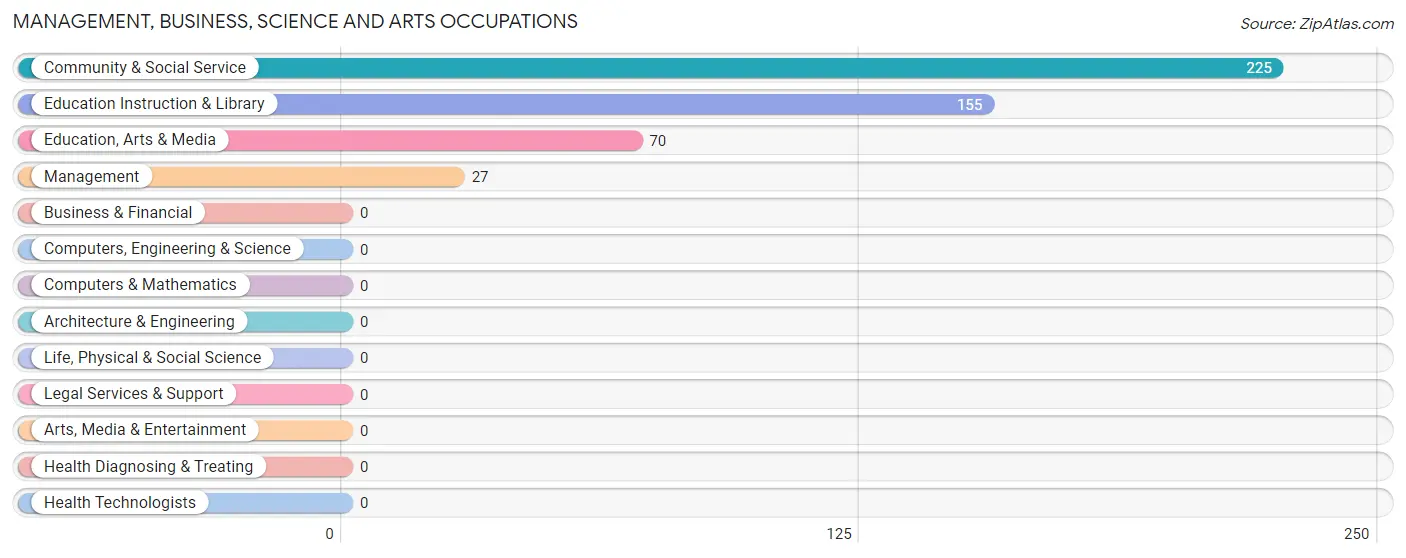
The most common Management, Business, Science and Arts occupations in Kyle are Community & Social Service (225 | 48.3%), Education Instruction & Library (155 | 33.3%), Education, Arts & Media (70 | 15.0%), and Management (27 | 5.8%).
Management, Business, Science and Arts Occupations by Sex
Within the Management, Business, Science and Arts occupations in Kyle, the most male-oriented occupations are Education Instruction & Library (31.0%), and Community & Social Service (21.3%), while the most female-oriented occupations are Management (100.0%), Education, Arts & Media (100.0%), and Community & Social Service (78.7%).
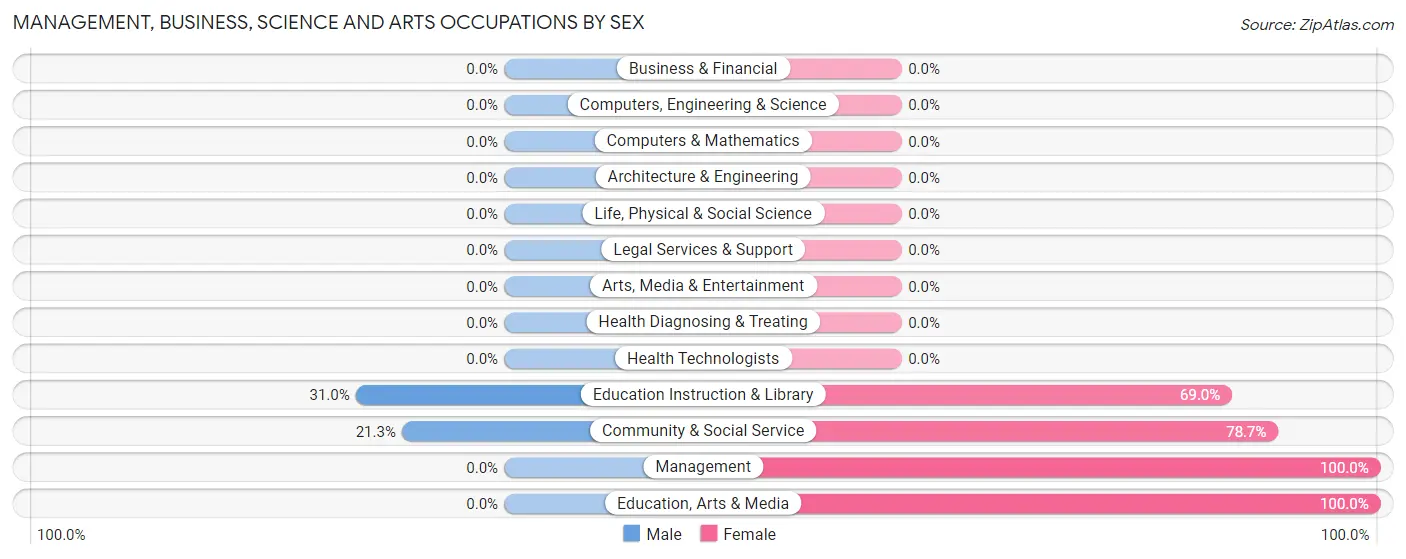
| Occupation | Male | Female |
| Management | 0 (0.0%) | 27 (100.0%) |
| Business & Financial | 0 (0.0%) | 0 (0.0%) |
| Computers, Engineering & Science | 0 (0.0%) | 0 (0.0%) |
| Computers & Mathematics | 0 (0.0%) | 0 (0.0%) |
| Architecture & Engineering | 0 (0.0%) | 0 (0.0%) |
| Life, Physical & Social Science | 0 (0.0%) | 0 (0.0%) |
| Community & Social Service | 48 (21.3%) | 177 (78.7%) |
| Education, Arts & Media | 0 (0.0%) | 70 (100.0%) |
| Legal Services & Support | 0 (0.0%) | 0 (0.0%) |
| Education Instruction & Library | 48 (31.0%) | 107 (69.0%) |
| Arts, Media & Entertainment | 0 (0.0%) | 0 (0.0%) |
| Health Diagnosing & Treating | 0 (0.0%) | 0 (0.0%) |
| Health Technologists | 0 (0.0%) | 0 (0.0%) |
| Total (Category) | 48 (19.1%) | 204 (80.9%) |
| Total (Overall) | 128 (27.5%) | 338 (72.5%) |
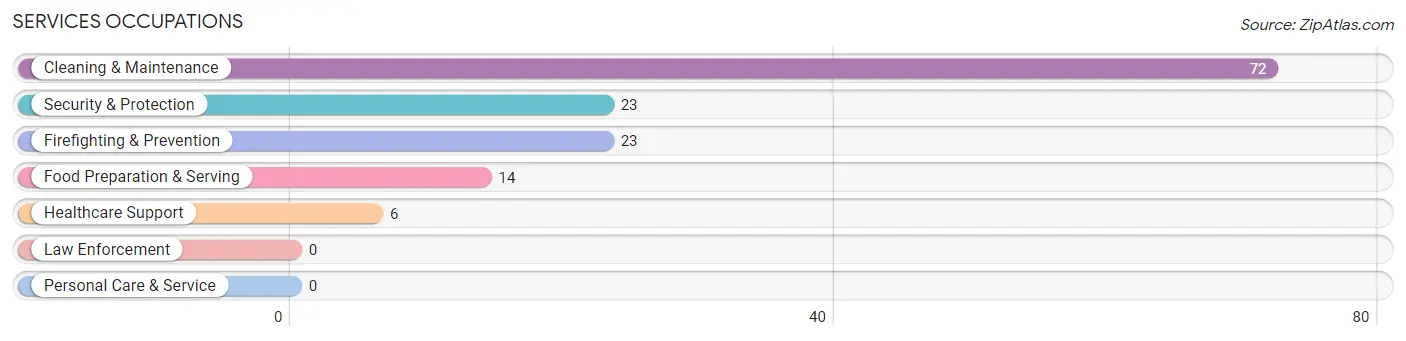
Services Occupations
The most common Services occupations in Kyle are Cleaning & Maintenance (72 | 15.4%), Security & Protection (23 | 4.9%), Firefighting & Prevention (23 | 4.9%), Food Preparation & Serving (14 | 3.0%), and Healthcare Support (6 | 1.3%).
Services Occupations by Sex
Within the Services occupations in Kyle, the most male-oriented occupations are Security & Protection (100.0%), Firefighting & Prevention (100.0%), and Food Preparation & Serving (100.0%), while the most female-oriented occupations are Healthcare Support (100.0%), and Cleaning & Maintenance (62.5%).
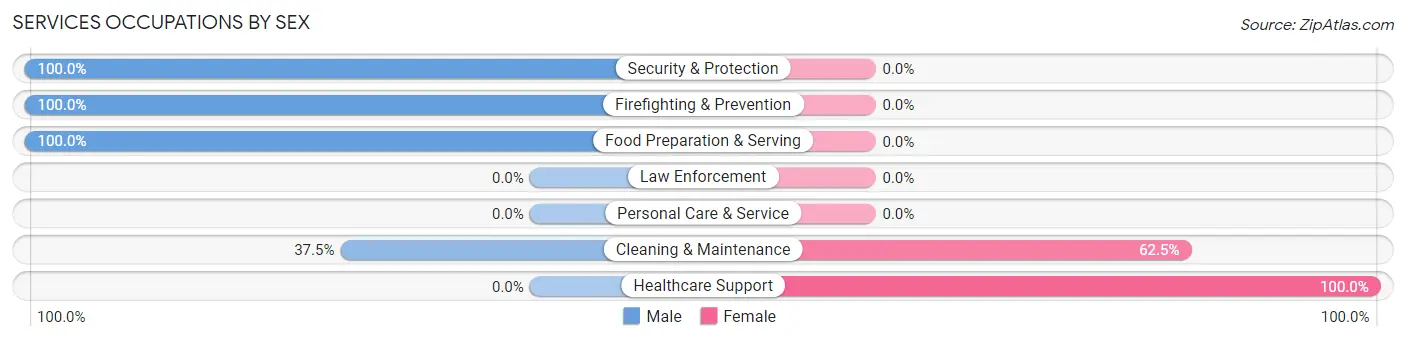
| Occupation | Male | Female |
| Healthcare Support | 0 (0.0%) | 6 (100.0%) |
| Security & Protection | 23 (100.0%) | 0 (0.0%) |
| Firefighting & Prevention | 23 (100.0%) | 0 (0.0%) |
| Law Enforcement | 0 (0.0%) | 0 (0.0%) |
| Food Preparation & Serving | 14 (100.0%) | 0 (0.0%) |
| Cleaning & Maintenance | 27 (37.5%) | 45 (62.5%) |
| Personal Care & Service | 0 (0.0%) | 0 (0.0%) |
| Total (Category) | 64 (55.6%) | 51 (44.4%) |
| Total (Overall) | 128 (27.5%) | 338 (72.5%) |
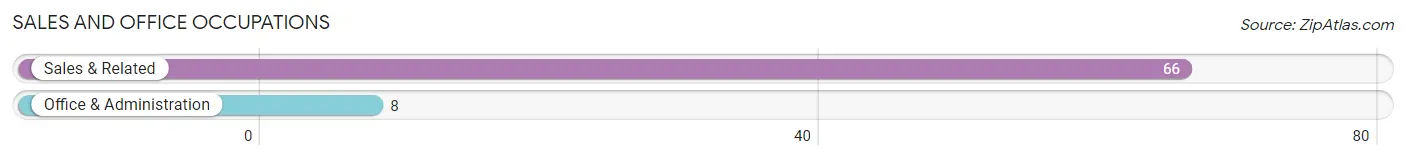
Sales and Office Occupations
The most common Sales and Office occupations in Kyle are Sales & Related (66 | 14.2%), and Office & Administration (8 | 1.7%).
Sales and Office Occupations by Sex
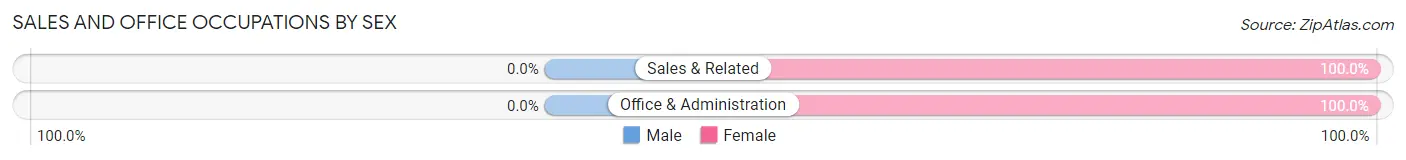
| Occupation | Male | Female |
| Sales & Related | 0 (0.0%) | 66 (100.0%) |
| Office & Administration | 0 (0.0%) | 8 (100.0%) |
| Total (Category) | 0 (0.0%) | 74 (100.0%) |
| Total (Overall) | 128 (27.5%) | 338 (72.5%) |
Natural Resources, Construction and Maintenance Occupations
The most common Natural Resources, Construction and Maintenance occupations in Kyle are , and Farming, Fishing & Forestry (9 | 1.9%).
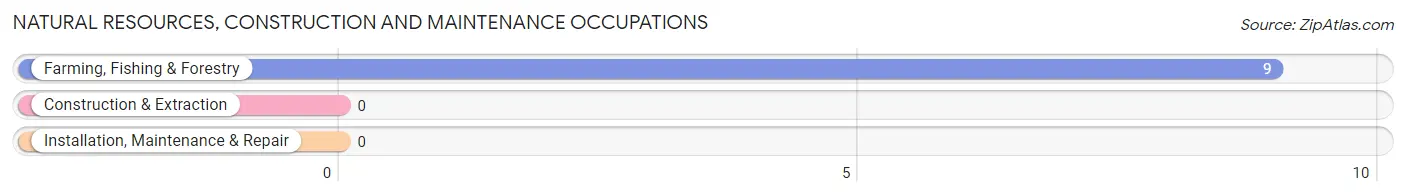
Natural Resources, Construction and Maintenance Occupations by Sex
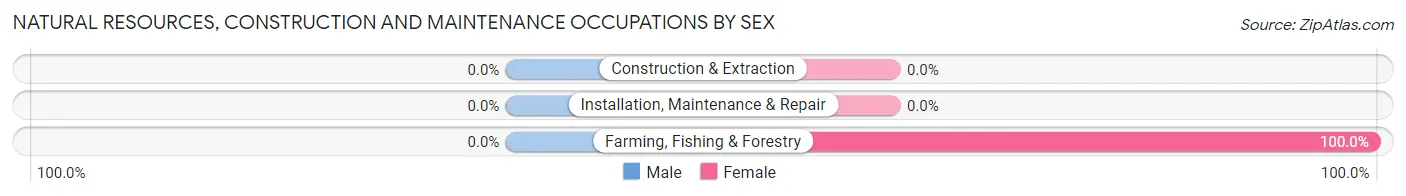
| Occupation | Male | Female |
| Farming, Fishing & Forestry | 0 (0.0%) | 9 (100.0%) |
| Construction & Extraction | 0 (0.0%) | 0 (0.0%) |
| Installation, Maintenance & Repair | 0 (0.0%) | 0 (0.0%) |
| Total (Category) | 0 (0.0%) | 9 (100.0%) |
| Total (Overall) | 128 (27.5%) | 338 (72.5%) |
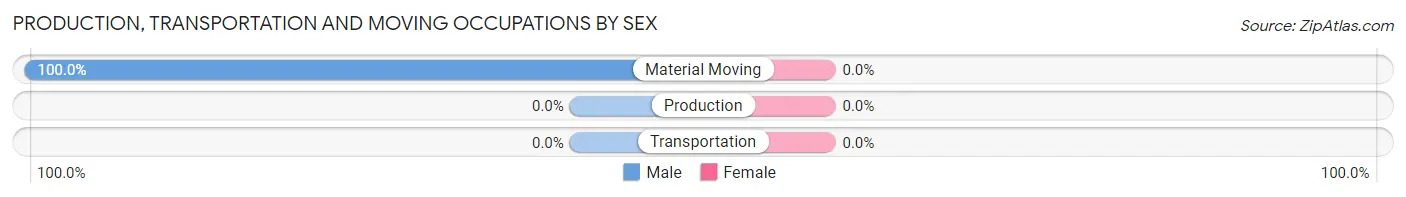
Production, Transportation and Moving Occupations
The most common Production, Transportation and Moving occupations in Kyle are , and Material Moving (16 | 3.4%).
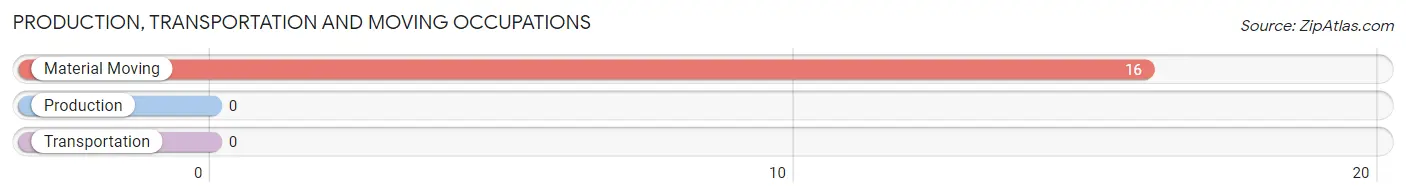
Production, Transportation and Moving Occupations by Sex
| Occupation | Male | Female |
| Production | 0 (0.0%) | 0 (0.0%) |
| Transportation | 0 (0.0%) | 0 (0.0%) |
| Material Moving | 16 (100.0%) | 0 (0.0%) |
| Total (Category) | 16 (100.0%) | 0 (0.0%) |
| Total (Overall) | 128 (27.5%) | 338 (72.5%) |
Employment Industries by Sex in Kyle
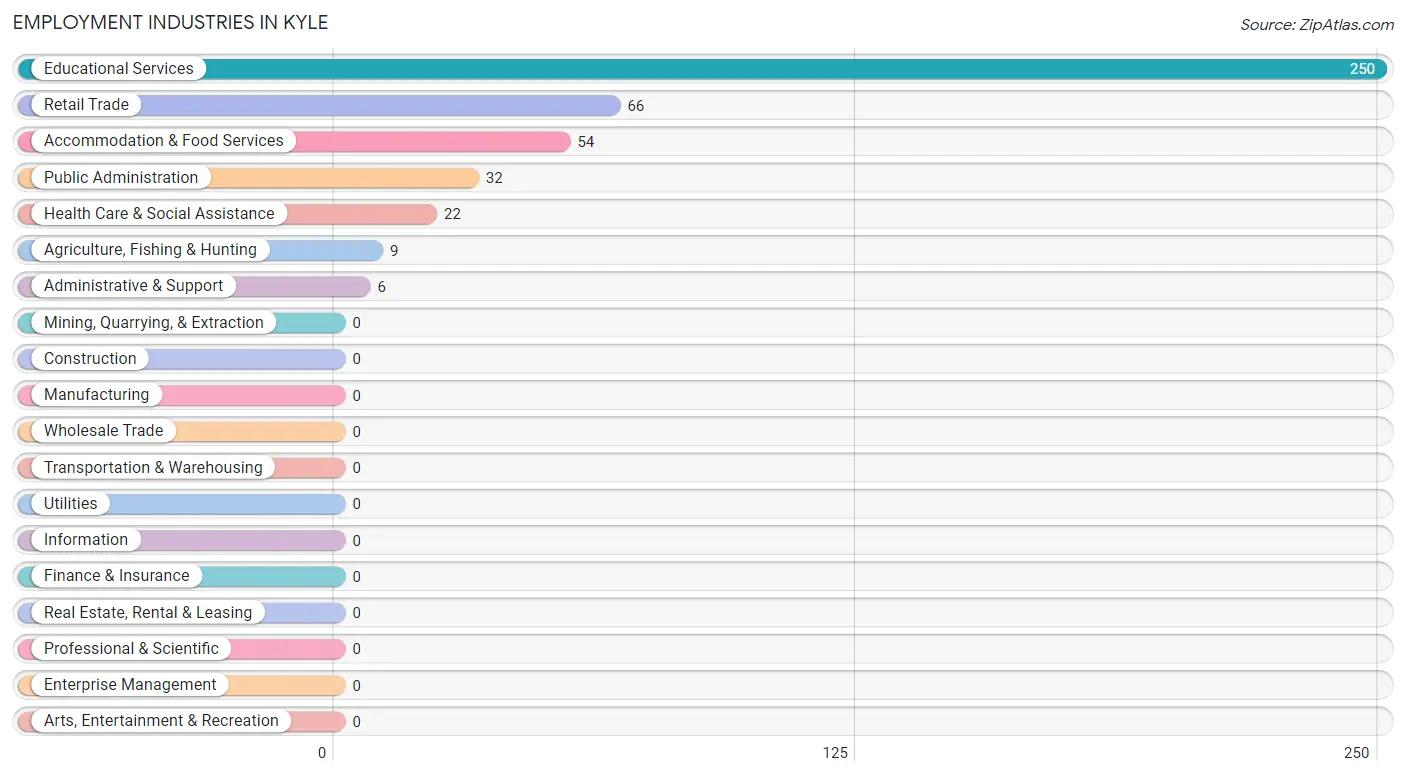
Employment Industries in Kyle
The major employment industries in Kyle include Educational Services (250 | 53.6%), Retail Trade (66 | 14.2%), Accommodation & Food Services (54 | 11.6%), Public Administration (32 | 6.9%), and Health Care & Social Assistance (22 | 4.7%).
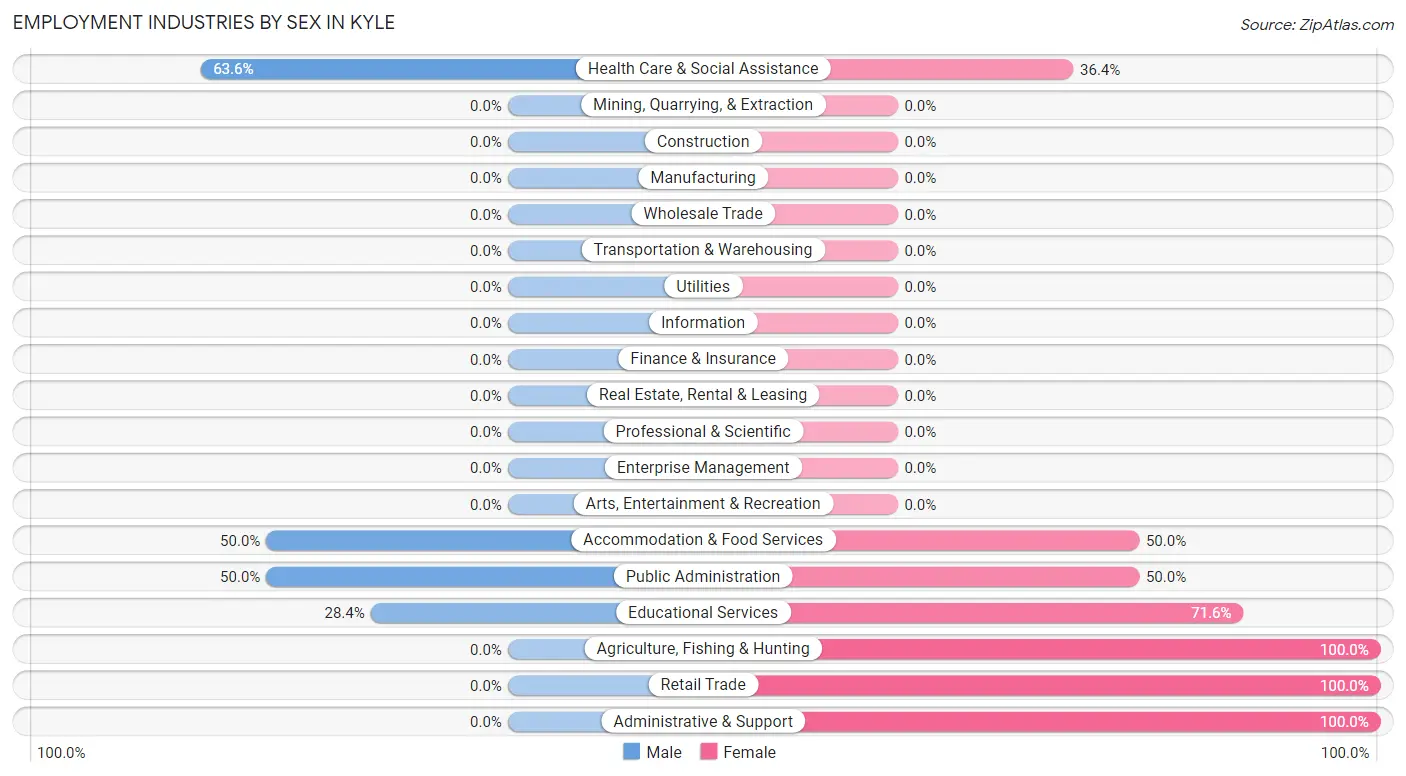
Employment Industries by Sex in Kyle
The Kyle industries that see more men than women are Health Care & Social Assistance (63.6%), Accommodation & Food Services (50.0%), and Public Administration (50.0%), whereas the industries that tend to have a higher number of women are Agriculture, Fishing & Hunting (100.0%), Retail Trade (100.0%), and Administrative & Support (100.0%).
| Industry | Male | Female |
| Agriculture, Fishing & Hunting | 0 (0.0%) | 9 (100.0%) |
| Mining, Quarrying, & Extraction | 0 (0.0%) | 0 (0.0%) |
| Construction | 0 (0.0%) | 0 (0.0%) |
| Manufacturing | 0 (0.0%) | 0 (0.0%) |
| Wholesale Trade | 0 (0.0%) | 0 (0.0%) |
| Retail Trade | 0 (0.0%) | 66 (100.0%) |
| Transportation & Warehousing | 0 (0.0%) | 0 (0.0%) |
| Utilities | 0 (0.0%) | 0 (0.0%) |
| Information | 0 (0.0%) | 0 (0.0%) |
| Finance & Insurance | 0 (0.0%) | 0 (0.0%) |
| Real Estate, Rental & Leasing | 0 (0.0%) | 0 (0.0%) |
| Professional & Scientific | 0 (0.0%) | 0 (0.0%) |
| Enterprise Management | 0 (0.0%) | 0 (0.0%) |
| Administrative & Support | 0 (0.0%) | 6 (100.0%) |
| Educational Services | 71 (28.4%) | 179 (71.6%) |
| Health Care & Social Assistance | 14 (63.6%) | 8 (36.4%) |
| Arts, Entertainment & Recreation | 0 (0.0%) | 0 (0.0%) |
| Accommodation & Food Services | 27 (50.0%) | 27 (50.0%) |
| Public Administration | 16 (50.0%) | 16 (50.0%) |
| Total | 128 (27.5%) | 338 (72.5%) |
Education in Kyle
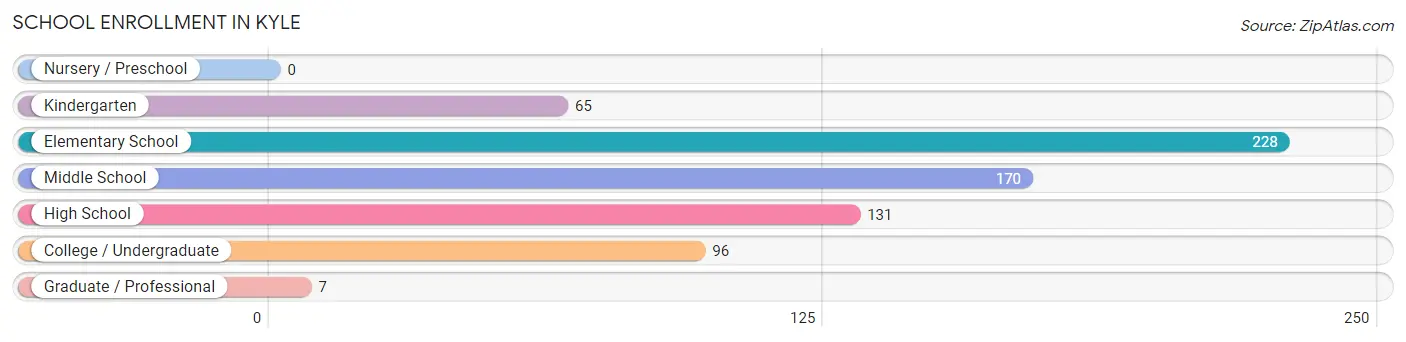
School Enrollment in Kyle
The most common levels of schooling among the 697 students in Kyle are elementary school (228 | 32.7%), middle school (170 | 24.4%), and high school (131 | 18.8%).
| School Level | # Students | % Students |
| Nursery / Preschool | 0 | 0.0% |
| Kindergarten | 65 | 9.3% |
| Elementary School | 228 | 32.7% |
| Middle School | 170 | 24.4% |
| High School | 131 | 18.8% |
| College / Undergraduate | 96 | 13.8% |
| Graduate / Professional | 7 | 1.0% |
| Total | 697 | 100.0% |
School Enrollment by Age by Funding Source in Kyle
Out of a total of 697 students who are enrolled in schools in Kyle, 67 (9.6%) attend a private institution, while the remaining 630 (90.4%) are enrolled in public schools. The age group of 20 to 24 year olds has the highest likelihood of being enrolled in private schools, with 28 (30.4% in the age bracket) enrolled. Conversely, the age group of 10 to 14 year olds has the lowest likelihood of being enrolled in a private school, with 283 (100.0% in the age bracket) attending a public institution.
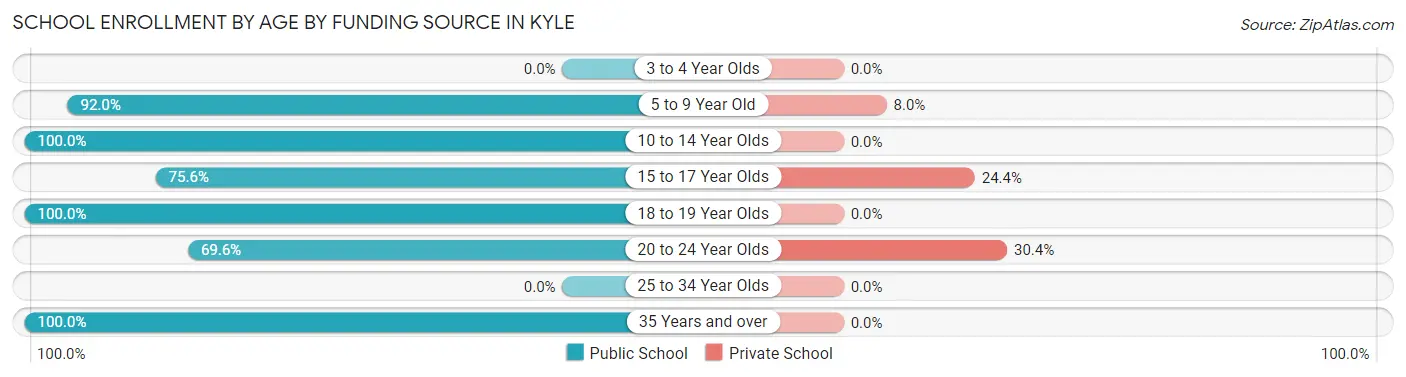
| Age Bracket | Public School | Private School |
| 3 to 4 Year Olds | 0 (0.0%) | 0 (0.0%) |
| 5 to 9 Year Old | 207 (92.0%) | 18 (8.0%) |
| 10 to 14 Year Olds | 283 (100.0%) | 0 (0.0%) |
| 15 to 17 Year Olds | 65 (75.6%) | 21 (24.4%) |
| 18 to 19 Year Olds | 4 (100.0%) | 0 (0.0%) |
| 20 to 24 Year Olds | 64 (69.6%) | 28 (30.4%) |
| 25 to 34 Year Olds | 0 (0.0%) | 0 (0.0%) |
| 35 Years and over | 7 (100.0%) | 0 (0.0%) |
| Total | 630 (90.4%) | 67 (9.6%) |
Educational Attainment by Field of Study in Kyle
Business (28 | 38.9%), education (24 | 33.3%), and arts & humanities (20 | 27.8%) are the most common fields of study among 72 individuals in Kyle who have obtained a bachelor's degree or higher.
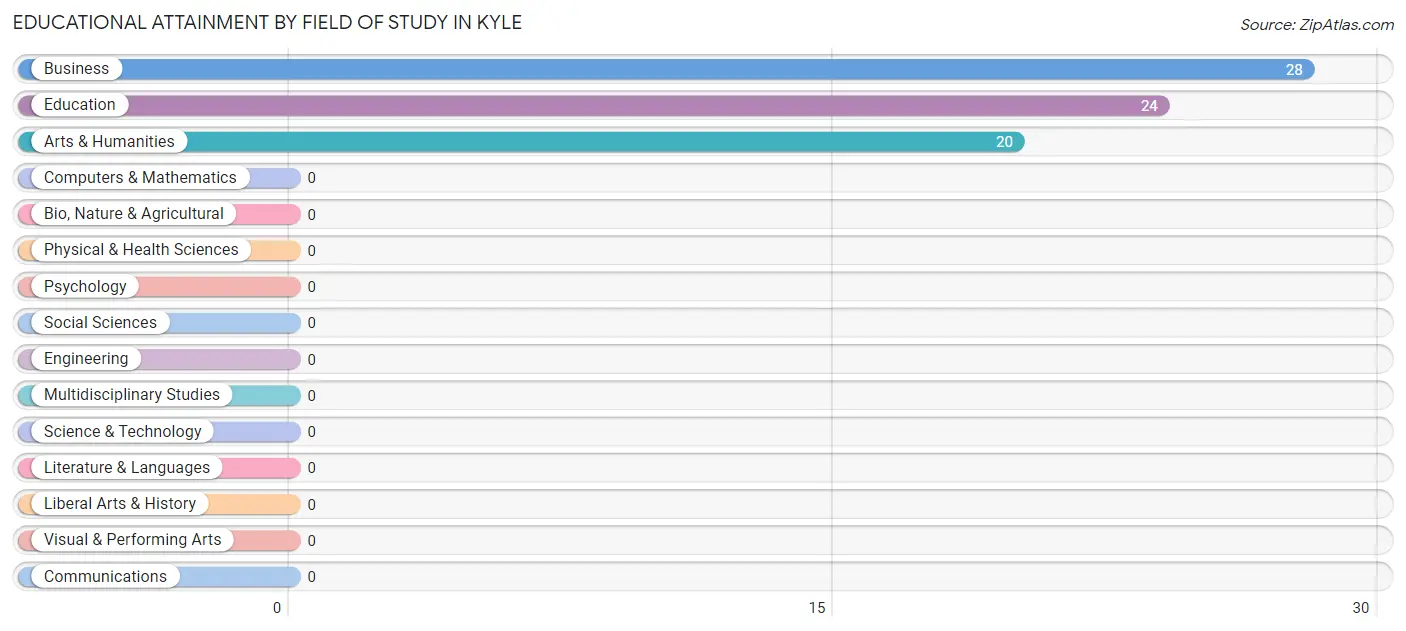
| Field of Study | # Graduates | % Graduates |
| Computers & Mathematics | 0 | 0.0% |
| Bio, Nature & Agricultural | 0 | 0.0% |
| Physical & Health Sciences | 0 | 0.0% |
| Psychology | 0 | 0.0% |
| Social Sciences | 0 | 0.0% |
| Engineering | 0 | 0.0% |
| Multidisciplinary Studies | 0 | 0.0% |
| Science & Technology | 0 | 0.0% |
| Business | 28 | 38.9% |
| Education | 24 | 33.3% |
| Literature & Languages | 0 | 0.0% |
| Liberal Arts & History | 0 | 0.0% |
| Visual & Performing Arts | 0 | 0.0% |
| Communications | 0 | 0.0% |
| Arts & Humanities | 20 | 27.8% |
| Total | 72 | 100.0% |
Transportation & Commute in Kyle
Vehicle Availability by Sex in Kyle
The most prevalent vehicle ownership categories in Kyle are males with 2 vehicles (105, accounting for 82.0%) and females with 2 vehicles (181, making up 31.1%).
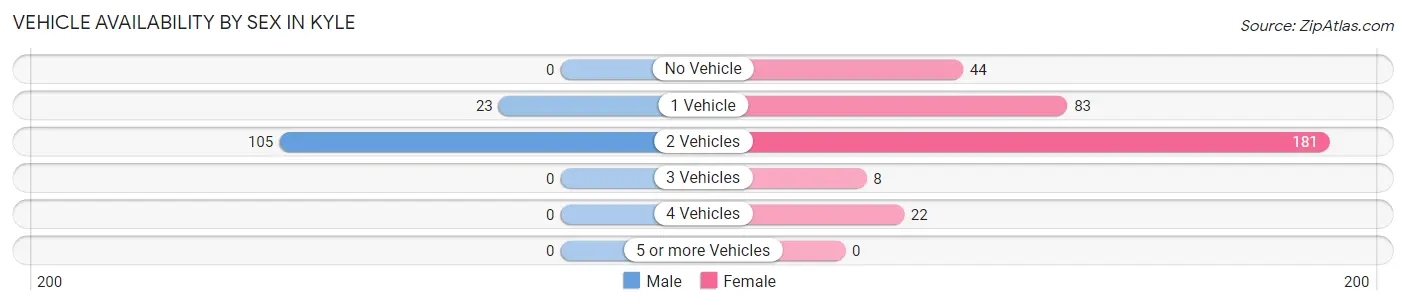
| Vehicles Available | Male | Female |
| No Vehicle | 0 (0.0%) | 44 (13.0%) |
| 1 Vehicle | 23 (18.0%) | 83 (24.6%) |
| 2 Vehicles | 105 (82.0%) | 181 (53.5%) |
| 3 Vehicles | 0 (0.0%) | 8 (2.4%) |
| 4 Vehicles | 0 (0.0%) | 22 (6.5%) |
| 5 or more Vehicles | 0 (0.0%) | 0 (0.0%) |
| Total | 128 (100.0%) | 338 (100.0%) |
Commute Time in Kyle
The most frequently occuring commute durations in Kyle are less than 5 minutes (110 commuters, 24.0%), 5 to 9 minutes (107 commuters, 23.3%), and 10 to 14 minutes (82 commuters, 17.9%).
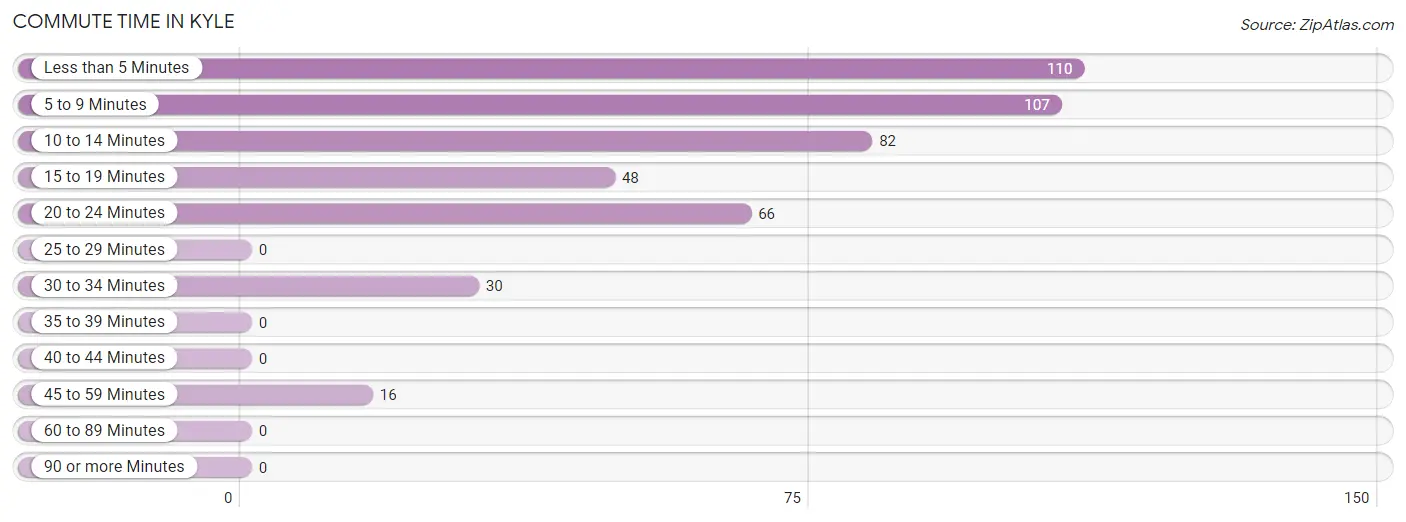
| Commute Time | # Commuters | % Commuters |
| Less than 5 Minutes | 110 | 24.0% |
| 5 to 9 Minutes | 107 | 23.3% |
| 10 to 14 Minutes | 82 | 17.9% |
| 15 to 19 Minutes | 48 | 10.5% |
| 20 to 24 Minutes | 66 | 14.4% |
| 25 to 29 Minutes | 0 | 0.0% |
| 30 to 34 Minutes | 30 | 6.5% |
| 35 to 39 Minutes | 0 | 0.0% |
| 40 to 44 Minutes | 0 | 0.0% |
| 45 to 59 Minutes | 16 | 3.5% |
| 60 to 89 Minutes | 0 | 0.0% |
| 90 or more Minutes | 0 | 0.0% |
Commute Time by Sex in Kyle
The most common commute times in Kyle are less than 5 minutes (48 commuters, 37.5%) for males and 5 to 9 minutes (84 commuters, 25.4%) for females.
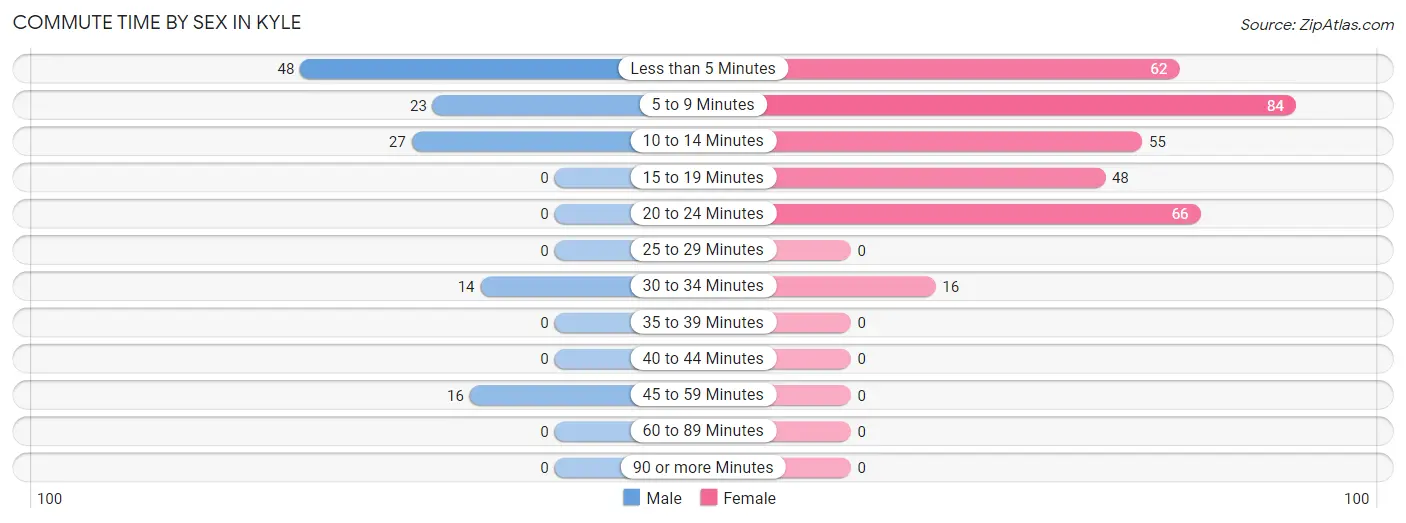
| Commute Time | Male | Female |
| Less than 5 Minutes | 48 (37.5%) | 62 (18.7%) |
| 5 to 9 Minutes | 23 (18.0%) | 84 (25.4%) |
| 10 to 14 Minutes | 27 (21.1%) | 55 (16.6%) |
| 15 to 19 Minutes | 0 (0.0%) | 48 (14.5%) |
| 20 to 24 Minutes | 0 (0.0%) | 66 (19.9%) |
| 25 to 29 Minutes | 0 (0.0%) | 0 (0.0%) |
| 30 to 34 Minutes | 14 (10.9%) | 16 (4.8%) |
| 35 to 39 Minutes | 0 (0.0%) | 0 (0.0%) |
| 40 to 44 Minutes | 0 (0.0%) | 0 (0.0%) |
| 45 to 59 Minutes | 16 (12.5%) | 0 (0.0%) |
| 60 to 89 Minutes | 0 (0.0%) | 0 (0.0%) |
| 90 or more Minutes | 0 (0.0%) | 0 (0.0%) |
Time of Departure to Work by Sex in Kyle
The most frequent times of departure to work in Kyle are 7:30 AM to 7:59 AM (62, 48.4%) for males and 12:00 PM to 3:59 PM (121, 36.6%) for females.
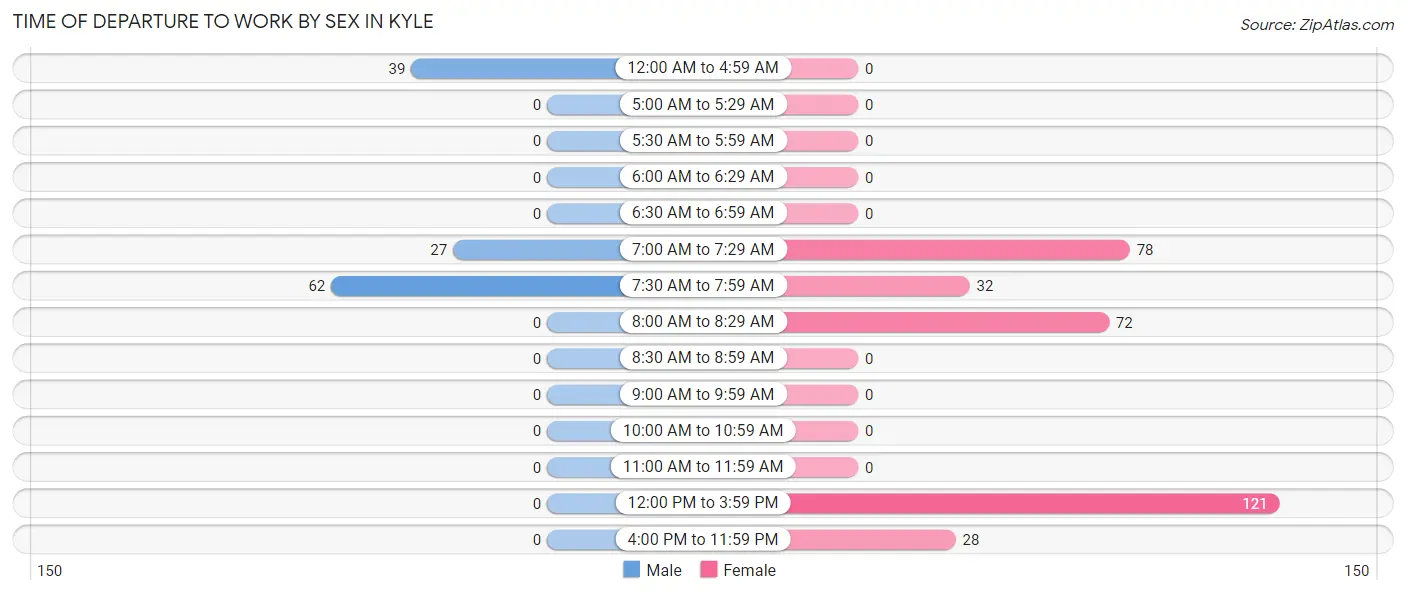
| Time of Departure | Male | Female |
| 12:00 AM to 4:59 AM | 39 (30.5%) | 0 (0.0%) |
| 5:00 AM to 5:29 AM | 0 (0.0%) | 0 (0.0%) |
| 5:30 AM to 5:59 AM | 0 (0.0%) | 0 (0.0%) |
| 6:00 AM to 6:29 AM | 0 (0.0%) | 0 (0.0%) |
| 6:30 AM to 6:59 AM | 0 (0.0%) | 0 (0.0%) |
| 7:00 AM to 7:29 AM | 27 (21.1%) | 78 (23.6%) |
| 7:30 AM to 7:59 AM | 62 (48.4%) | 32 (9.7%) |
| 8:00 AM to 8:29 AM | 0 (0.0%) | 72 (21.7%) |
| 8:30 AM to 8:59 AM | 0 (0.0%) | 0 (0.0%) |
| 9:00 AM to 9:59 AM | 0 (0.0%) | 0 (0.0%) |
| 10:00 AM to 10:59 AM | 0 (0.0%) | 0 (0.0%) |
| 11:00 AM to 11:59 AM | 0 (0.0%) | 0 (0.0%) |
| 12:00 PM to 3:59 PM | 0 (0.0%) | 121 (36.6%) |
| 4:00 PM to 11:59 PM | 0 (0.0%) | 28 (8.5%) |
| Total | 128 (100.0%) | 331 (100.0%) |
Housing Occupancy in Kyle
Occupancy by Ownership in Kyle
Of the total 314 dwellings in Kyle, owner-occupied units account for 69 (22.0%), while renter-occupied units make up 245 (78.0%).
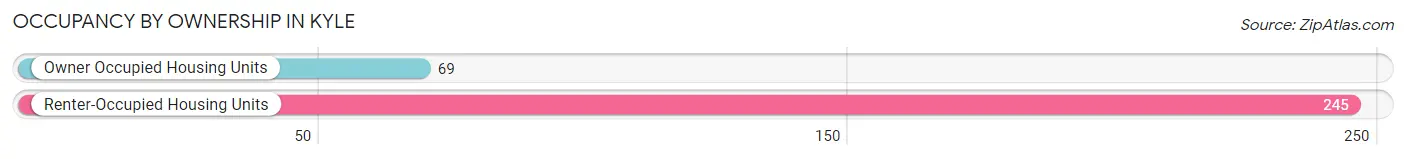
| Occupancy | # Housing Units | % Housing Units |
| Owner Occupied Housing Units | 69 | 22.0% |
| Renter-Occupied Housing Units | 245 | 78.0% |
| Total Occupied Housing Units | 314 | 100.0% |
Occupancy by Household Size in Kyle
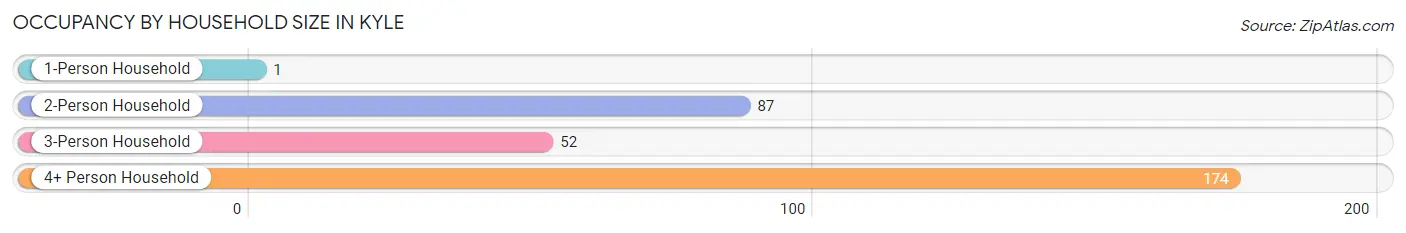
| Household Size | # Housing Units | % Housing Units |
| 1-Person Household | 1 | 0.3% |
| 2-Person Household | 87 | 27.7% |
| 3-Person Household | 52 | 16.6% |
| 4+ Person Household | 174 | 55.4% |
| Total Housing Units | 314 | 100.0% |
Occupancy by Ownership by Household Size in Kyle
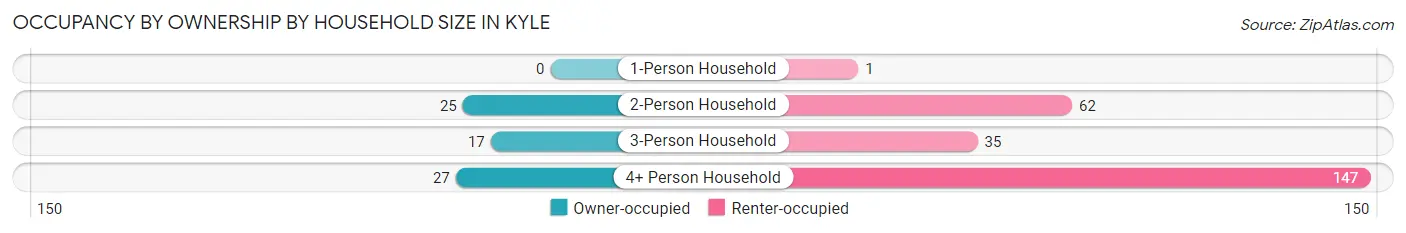
| Household Size | Owner-occupied | Renter-occupied |
| 1-Person Household | 0 (0.0%) | 1 (100.0%) |
| 2-Person Household | 25 (28.7%) | 62 (71.3%) |
| 3-Person Household | 17 (32.7%) | 35 (67.3%) |
| 4+ Person Household | 27 (15.5%) | 147 (84.5%) |
| Total Housing Units | 69 (22.0%) | 245 (78.0%) |
Occupancy by Educational Attainment in Kyle
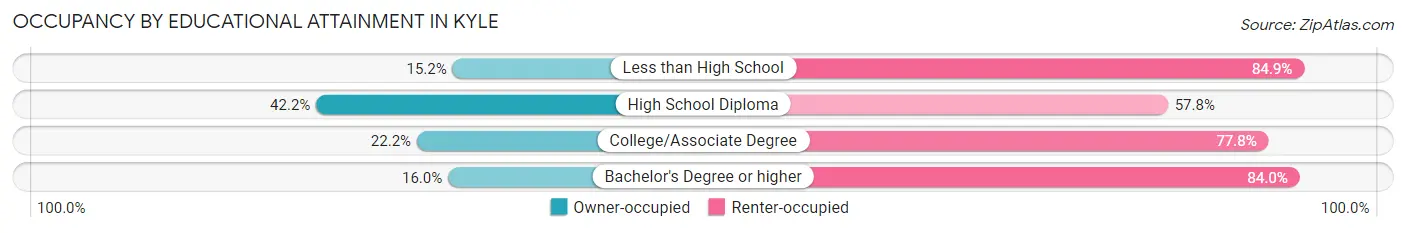
| Household Size | Owner-occupied | Renter-occupied |
| Less than High School | 15 (15.1%) | 84 (84.9%) |
| High School Diploma | 27 (42.2%) | 37 (57.8%) |
| College/Associate Degree | 10 (22.2%) | 35 (77.8%) |
| Bachelor's Degree or higher | 17 (16.0%) | 89 (84.0%) |
Occupancy by Age of Householder in Kyle
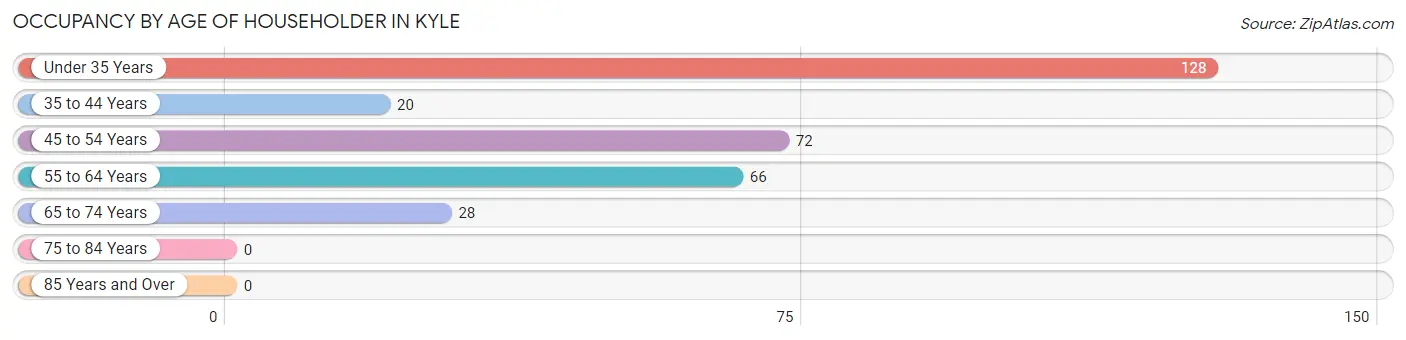
| Age Bracket | # Households | % Households |
| Under 35 Years | 128 | 40.8% |
| 35 to 44 Years | 20 | 6.4% |
| 45 to 54 Years | 72 | 22.9% |
| 55 to 64 Years | 66 | 21.0% |
| 65 to 74 Years | 28 | 8.9% |
| 75 to 84 Years | 0 | 0.0% |
| 85 Years and Over | 0 | 0.0% |
| Total | 314 | 100.0% |
Housing Finances in Kyle
Median Income by Occupancy in Kyle
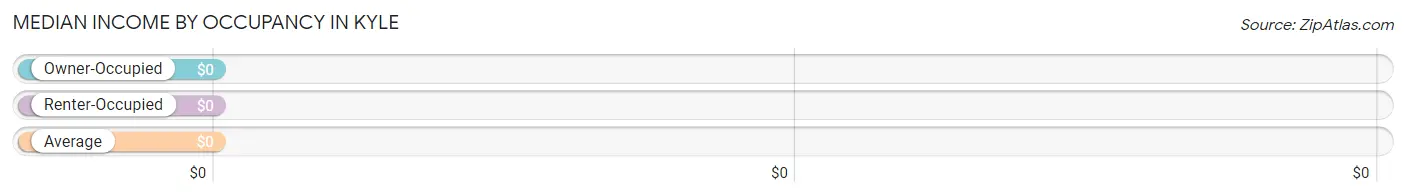
| Occupancy Type | # Households | Median Income |
| Owner-Occupied | 69 (22.0%) | $0 |
| Renter-Occupied | 245 (78.0%) | $0 |
| Average | 314 (100.0%) | $0 |
Occupancy by Householder Income Bracket in Kyle
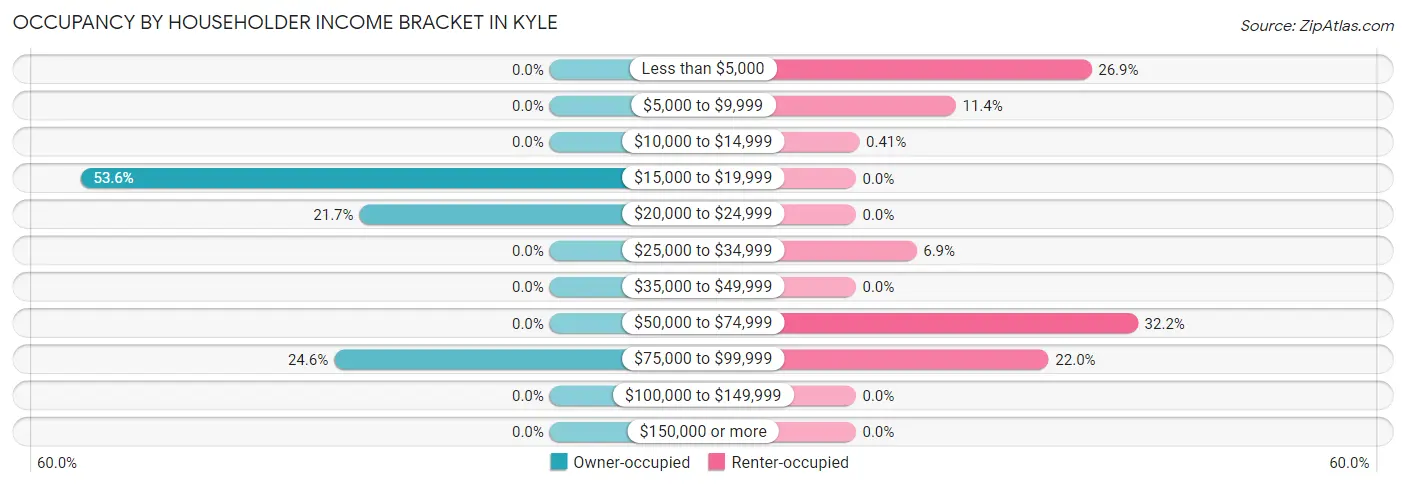
| Income Bracket | Owner-occupied | Renter-occupied |
| Less than $5,000 | 0 (0.0%) | 66 (26.9%) |
| $5,000 to $9,999 | 0 (0.0%) | 28 (11.4%) |
| $10,000 to $14,999 | 0 (0.0%) | 1 (0.4%) |
| $15,000 to $19,999 | 37 (53.6%) | 0 (0.0%) |
| $20,000 to $24,999 | 15 (21.7%) | 0 (0.0%) |
| $25,000 to $34,999 | 0 (0.0%) | 17 (6.9%) |
| $35,000 to $49,999 | 0 (0.0%) | 0 (0.0%) |
| $50,000 to $74,999 | 0 (0.0%) | 79 (32.2%) |
| $75,000 to $99,999 | 17 (24.6%) | 54 (22.0%) |
| $100,000 to $149,999 | 0 (0.0%) | 0 (0.0%) |
| $150,000 or more | 0 (0.0%) | 0 (0.0%) |
| Total | 69 (100.0%) | 245 (100.0%) |
Monthly Housing Cost Tiers in Kyle
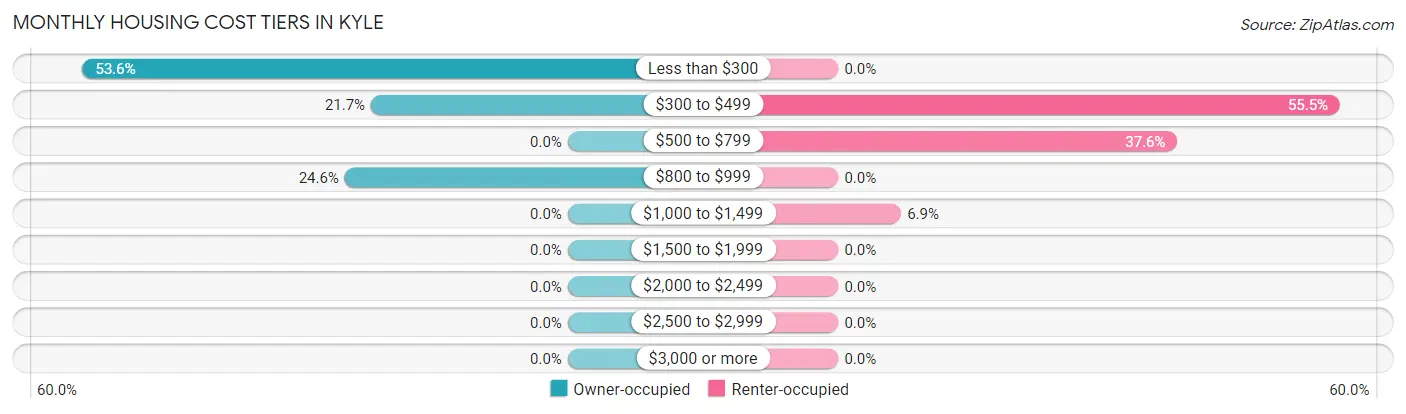
| Monthly Cost | Owner-occupied | Renter-occupied |
| Less than $300 | 37 (53.6%) | 0 (0.0%) |
| $300 to $499 | 15 (21.7%) | 136 (55.5%) |
| $500 to $799 | 0 (0.0%) | 92 (37.6%) |
| $800 to $999 | 17 (24.6%) | 0 (0.0%) |
| $1,000 to $1,499 | 0 (0.0%) | 17 (6.9%) |
| $1,500 to $1,999 | 0 (0.0%) | 0 (0.0%) |
| $2,000 to $2,499 | 0 (0.0%) | 0 (0.0%) |
| $2,500 to $2,999 | 0 (0.0%) | 0 (0.0%) |
| $3,000 or more | 0 (0.0%) | 0 (0.0%) |
| Total | 69 (100.0%) | 245 (100.0%) |
Physical Housing Characteristics in Kyle
Housing Structures in Kyle
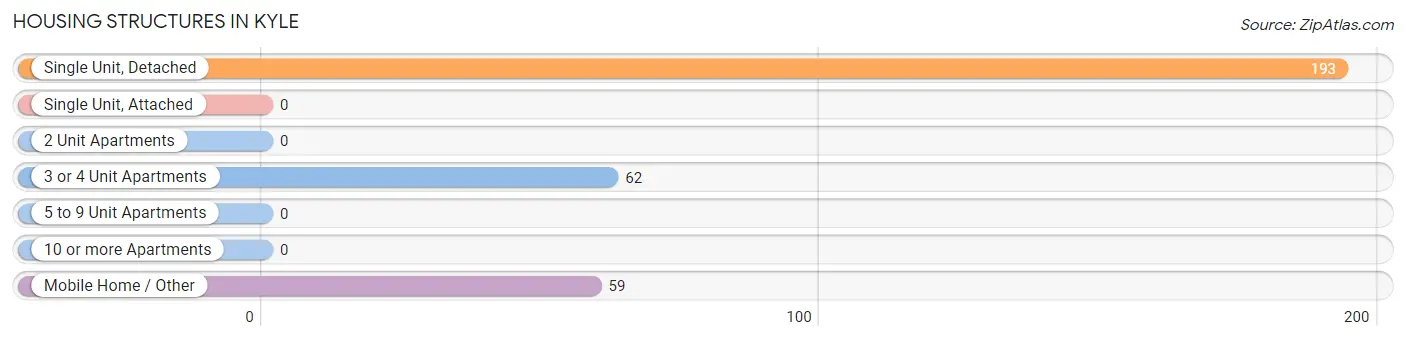
| Structure Type | # Housing Units | % Housing Units |
| Single Unit, Detached | 193 | 61.5% |
| Single Unit, Attached | 0 | 0.0% |
| 2 Unit Apartments | 0 | 0.0% |
| 3 or 4 Unit Apartments | 62 | 19.8% |
| 5 to 9 Unit Apartments | 0 | 0.0% |
| 10 or more Apartments | 0 | 0.0% |
| Mobile Home / Other | 59 | 18.8% |
| Total | 314 | 100.0% |
Housing Structures by Occupancy in Kyle
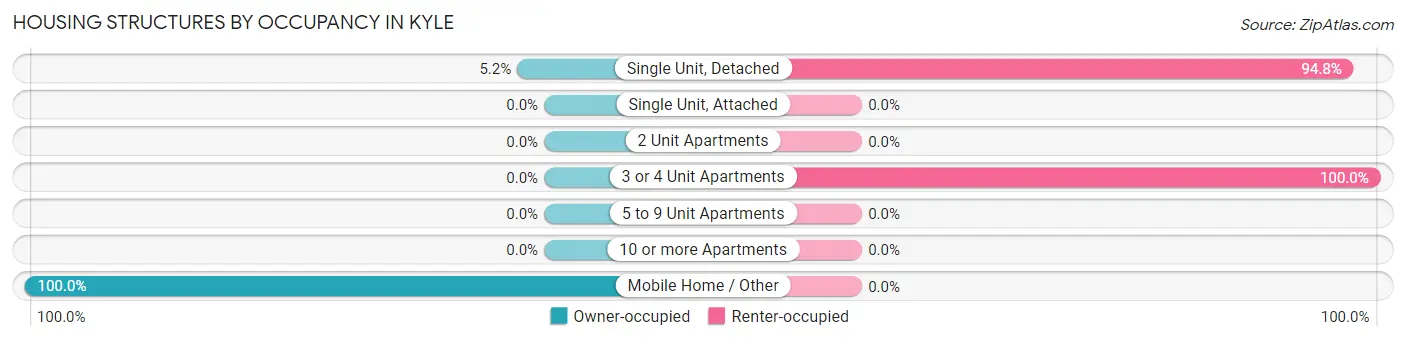
| Structure Type | Owner-occupied | Renter-occupied |
| Single Unit, Detached | 10 (5.2%) | 183 (94.8%) |
| Single Unit, Attached | 0 (0.0%) | 0 (0.0%) |
| 2 Unit Apartments | 0 (0.0%) | 0 (0.0%) |
| 3 or 4 Unit Apartments | 0 (0.0%) | 62 (100.0%) |
| 5 to 9 Unit Apartments | 0 (0.0%) | 0 (0.0%) |
| 10 or more Apartments | 0 (0.0%) | 0 (0.0%) |
| Mobile Home / Other | 59 (100.0%) | 0 (0.0%) |
| Total | 69 (22.0%) | 245 (78.0%) |
Housing Structures by Number of Rooms in Kyle
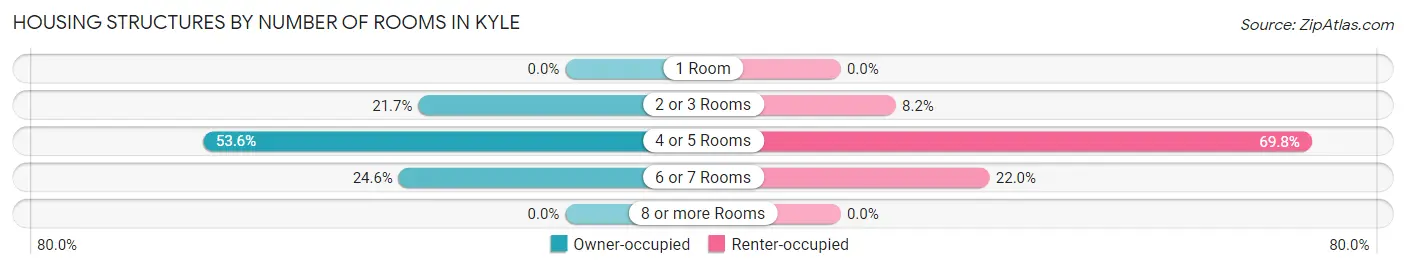
| Number of Rooms | Owner-occupied | Renter-occupied |
| 1 Room | 0 (0.0%) | 0 (0.0%) |
| 2 or 3 Rooms | 15 (21.7%) | 20 (8.2%) |
| 4 or 5 Rooms | 37 (53.6%) | 171 (69.8%) |
| 6 or 7 Rooms | 17 (24.6%) | 54 (22.0%) |
| 8 or more Rooms | 0 (0.0%) | 0 (0.0%) |
| Total | 69 (100.0%) | 245 (100.0%) |
Housing Structure by Heating Type in Kyle
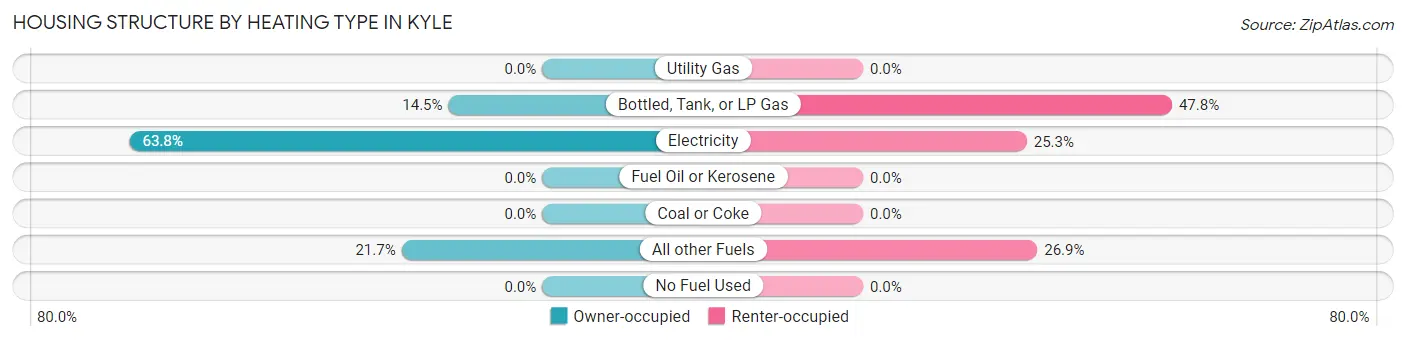
| Heating Type | Owner-occupied | Renter-occupied |
| Utility Gas | 0 (0.0%) | 0 (0.0%) |
| Bottled, Tank, or LP Gas | 10 (14.5%) | 117 (47.8%) |
| Electricity | 44 (63.8%) | 62 (25.3%) |
| Fuel Oil or Kerosene | 0 (0.0%) | 0 (0.0%) |
| Coal or Coke | 0 (0.0%) | 0 (0.0%) |
| All other Fuels | 15 (21.7%) | 66 (26.9%) |
| No Fuel Used | 0 (0.0%) | 0 (0.0%) |
| Total | 69 (100.0%) | 245 (100.0%) |
Household Vehicle Usage in Kyle
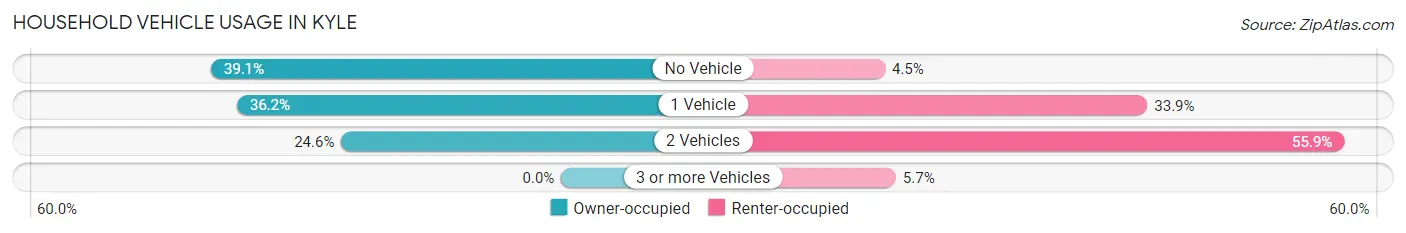
| Vehicles per Household | Owner-occupied | Renter-occupied |
| No Vehicle | 27 (39.1%) | 11 (4.5%) |
| 1 Vehicle | 25 (36.2%) | 83 (33.9%) |
| 2 Vehicles | 17 (24.6%) | 137 (55.9%) |
| 3 or more Vehicles | 0 (0.0%) | 14 (5.7%) |
| Total | 69 (100.0%) | 245 (100.0%) |
Real Estate & Mortgages in Kyle
Real Estate and Mortgage Overview in Kyle
| Characteristic | Without Mortgage | With Mortgage |
| Housing Units | 69 | 0 |
| Median Property Value | $9,999 | $0 |
| Median Household Income | - | - |
| Monthly Housing Costs | - | - |
| Real Estate Taxes | - | - |
Property Value by Mortgage Status in Kyle
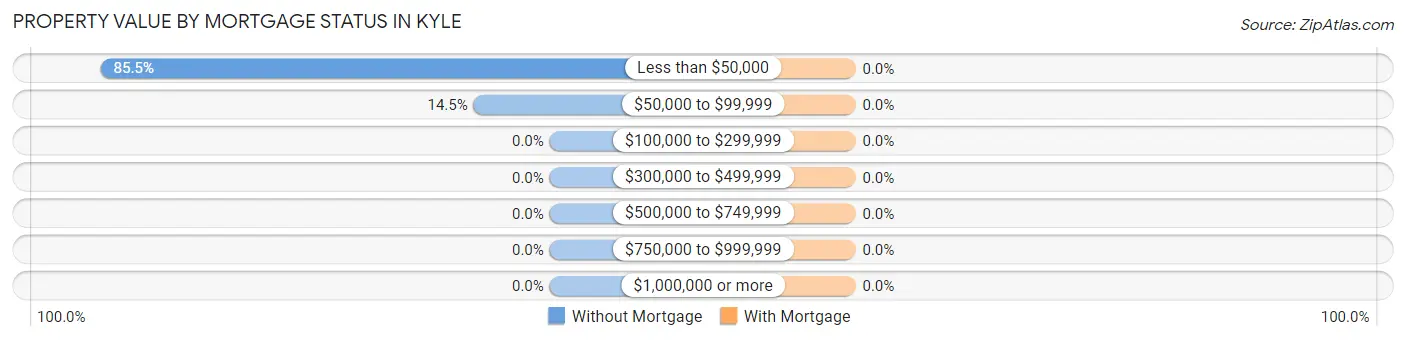
| Property Value | Without Mortgage | With Mortgage |
| Less than $50,000 | 59 (85.5%) | 0 (0.0%) |
| $50,000 to $99,999 | 10 (14.5%) | 0 (0.0%) |
| $100,000 to $299,999 | 0 (0.0%) | 0 (0.0%) |
| $300,000 to $499,999 | 0 (0.0%) | 0 (0.0%) |
| $500,000 to $749,999 | 0 (0.0%) | 0 (0.0%) |
| $750,000 to $999,999 | 0 (0.0%) | 0 (0.0%) |
| $1,000,000 or more | 0 (0.0%) | 0 (0.0%) |
| Total | 69 (100.0%) | 0 (0.0%) |
Household Income by Mortgage Status in Kyle
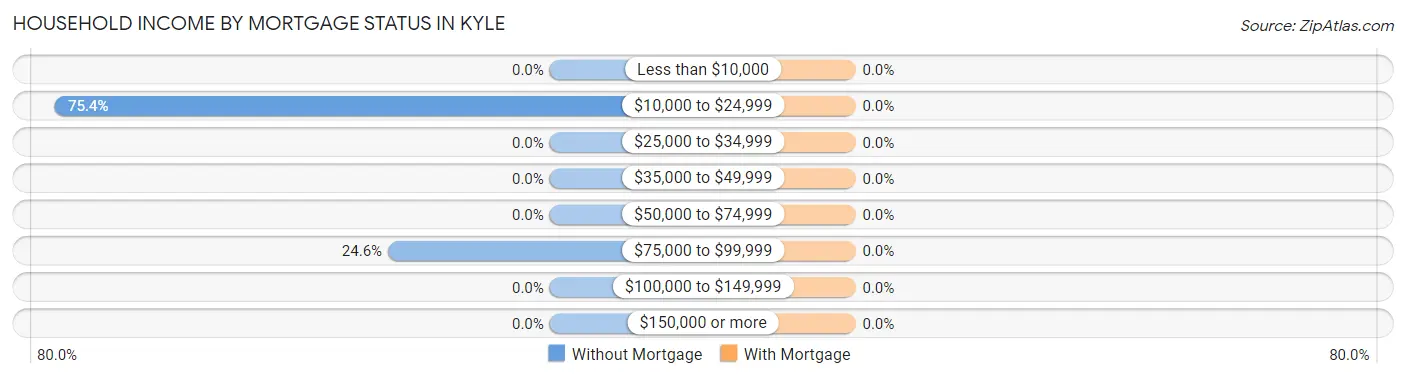
| Household Income | Without Mortgage | With Mortgage |
| Less than $10,000 | 0 (0.0%) | 0 (0.0%) |
| $10,000 to $24,999 | 52 (75.4%) | 0 (0.0%) |
| $25,000 to $34,999 | 0 (0.0%) | 0 (0.0%) |
| $35,000 to $49,999 | 0 (0.0%) | 0 (0.0%) |
| $50,000 to $74,999 | 0 (0.0%) | 0 (0.0%) |
| $75,000 to $99,999 | 17 (24.6%) | 0 (0.0%) |
| $100,000 to $149,999 | 0 (0.0%) | 0 (0.0%) |
| $150,000 or more | 0 (0.0%) | 0 (0.0%) |
| Total | 69 (100.0%) | 0 (0.0%) |
Property Value to Household Income Ratio in Kyle
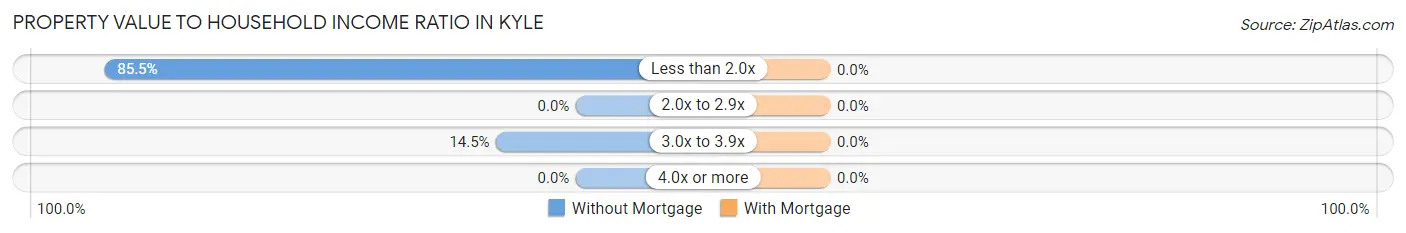
| Value-to-Income Ratio | Without Mortgage | With Mortgage |
| Less than 2.0x | 59 (85.5%) | 0 (0.0%) |
| 2.0x to 2.9x | 0 (0.0%) | 0 (0.0%) |
| 3.0x to 3.9x | 10 (14.5%) | 0 (0.0%) |
| 4.0x or more | 0 (0.0%) | 0 (0.0%) |
| Total | 69 (100.0%) | 0 (0.0%) |
Real Estate Taxes by Mortgage Status in Kyle
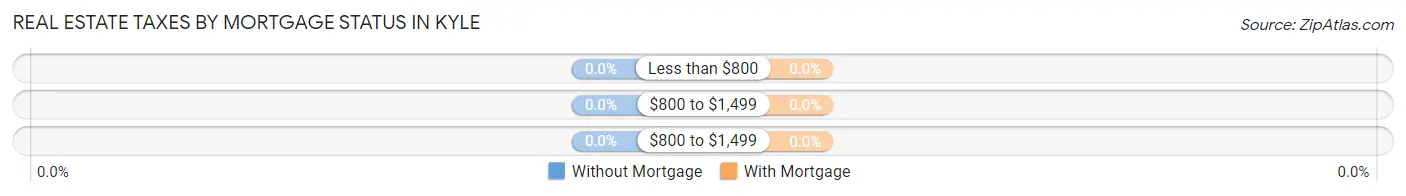
| Property Taxes | Without Mortgage | With Mortgage |
| Less than $800 | 0 (0.0%) | 0 (0.0%) |
| $800 to $1,499 | 0 (0.0%) | 0 (0.0%) |
| $800 to $1,499 | 0 (0.0%) | 0 (0.0%) |
| Total | 69 (100.0%) | 0 (0.0%) |
Health & Disability in Kyle
Health Insurance Coverage by Age in Kyle
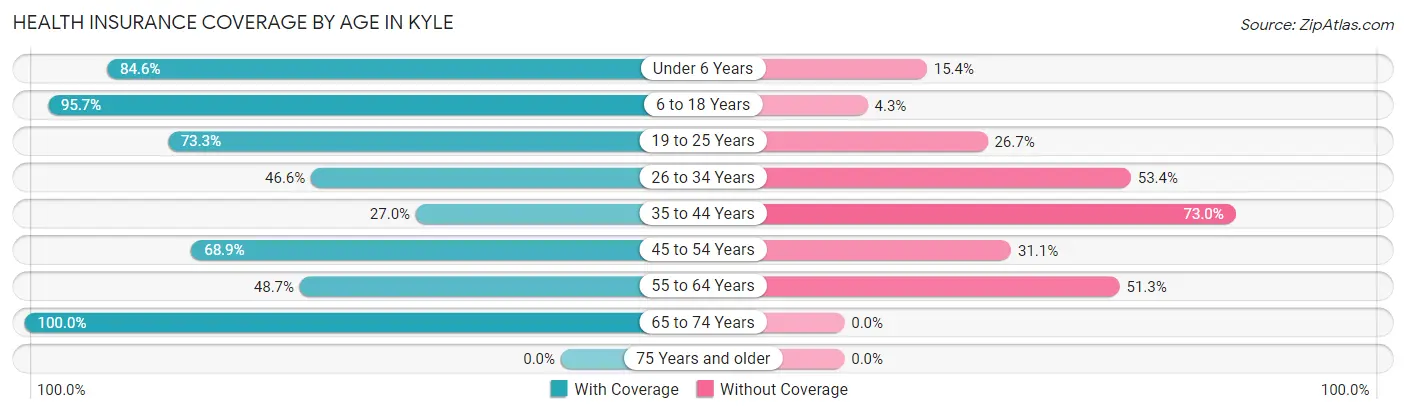
| Age Bracket | With Coverage | Without Coverage |
| Under 6 Years | 44 (84.6%) | 8 (15.4%) |
| 6 to 18 Years | 551 (95.7%) | 25 (4.3%) |
| 19 to 25 Years | 151 (73.3%) | 55 (26.7%) |
| 26 to 34 Years | 95 (46.6%) | 109 (53.4%) |
| 35 to 44 Years | 40 (27.0%) | 108 (73.0%) |
| 45 to 54 Years | 82 (68.9%) | 37 (31.1%) |
| 55 to 64 Years | 55 (48.7%) | 58 (51.3%) |
| 65 to 74 Years | 56 (100.0%) | 0 (0.0%) |
| 75 Years and older | 0 (0.0%) | 0 (0.0%) |
| Total | 1,074 (72.9%) | 400 (27.1%) |
Health Insurance Coverage by Citizenship Status in Kyle
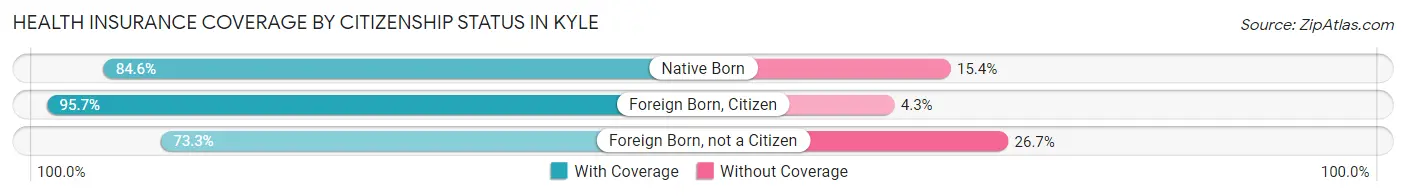
| Citizenship Status | With Coverage | Without Coverage |
| Native Born | 44 (84.6%) | 8 (15.4%) |
| Foreign Born, Citizen | 551 (95.7%) | 25 (4.3%) |
| Foreign Born, not a Citizen | 151 (73.3%) | 55 (26.7%) |
Health Insurance Coverage by Household Income in Kyle
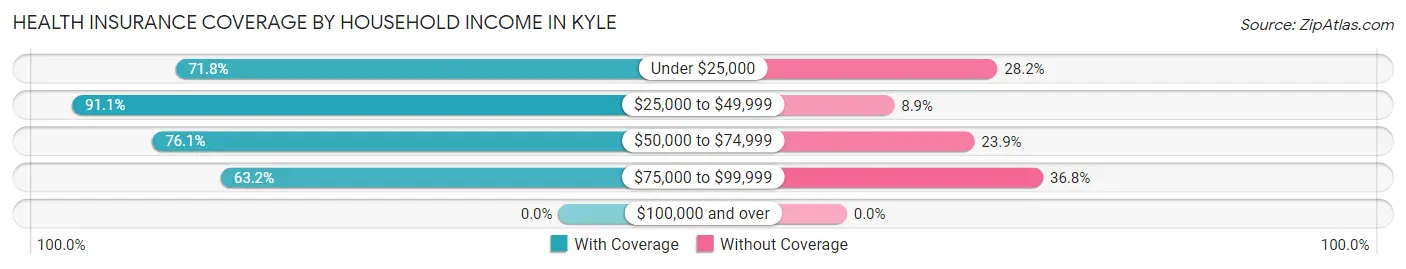
| Household Income | With Coverage | Without Coverage |
| Under $25,000 | 435 (71.8%) | 171 (28.2%) |
| $25,000 to $49,999 | 174 (91.1%) | 17 (8.9%) |
| $50,000 to $74,999 | 210 (76.1%) | 66 (23.9%) |
| $75,000 to $99,999 | 251 (63.2%) | 146 (36.8%) |
| $100,000 and over | 0 (0.0%) | 0 (0.0%) |
Public vs Private Health Insurance Coverage by Age in Kyle
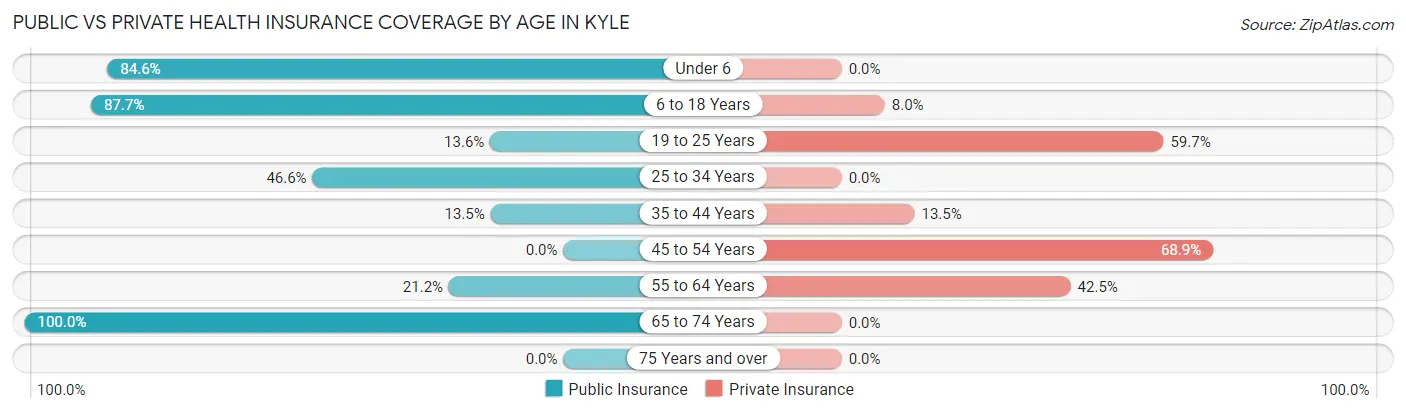
| Age Bracket | Public Insurance | Private Insurance |
| Under 6 | 44 (84.6%) | 0 (0.0%) |
| 6 to 18 Years | 505 (87.7%) | 46 (8.0%) |
| 19 to 25 Years | 28 (13.6%) | 123 (59.7%) |
| 25 to 34 Years | 95 (46.6%) | 0 (0.0%) |
| 35 to 44 Years | 20 (13.5%) | 20 (13.5%) |
| 45 to 54 Years | 0 (0.0%) | 82 (68.9%) |
| 55 to 64 Years | 24 (21.2%) | 48 (42.5%) |
| 65 to 74 Years | 56 (100.0%) | 0 (0.0%) |
| 75 Years and over | 0 (0.0%) | 0 (0.0%) |
| Total | 772 (52.4%) | 319 (21.6%) |
Disability Status by Sex by Age in Kyle
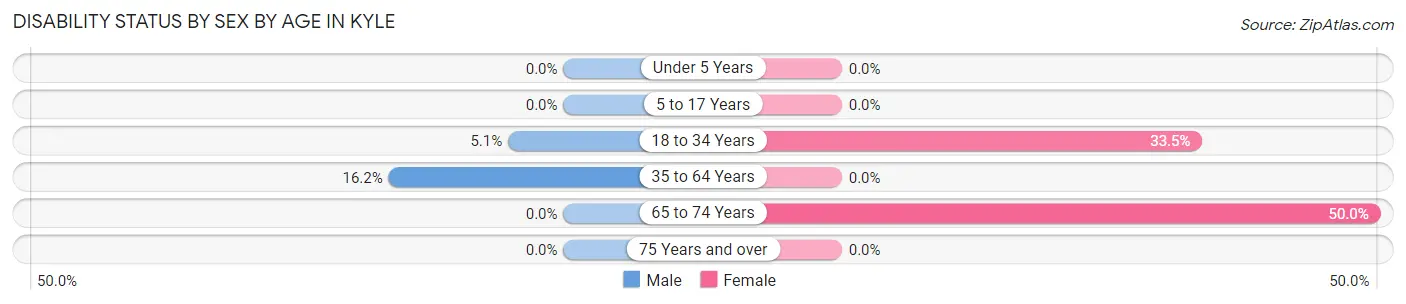
| Age Bracket | Male | Female |
| Under 5 Years | 0 (0.0%) | 0 (0.0%) |
| 5 to 17 Years | 0 (0.0%) | 0 (0.0%) |
| 18 to 34 Years | 8 (5.1%) | 88 (33.5%) |
| 35 to 64 Years | 30 (16.2%) | 0 (0.0%) |
| 65 to 74 Years | 0 (0.0%) | 28 (50.0%) |
| 75 Years and over | 0 (0.0%) | 0 (0.0%) |
Disability Class by Sex by Age in Kyle
Disability Class: Hearing Difficulty
| Age Bracket | Male | Female |
| Under 5 Years | 0 (0.0%) | 0 (0.0%) |
| 5 to 17 Years | 0 (0.0%) | 0 (0.0%) |
| 18 to 34 Years | 0 (0.0%) | 0 (0.0%) |
| 35 to 64 Years | 0 (0.0%) | 0 (0.0%) |
| 65 to 74 Years | 0 (0.0%) | 0 (0.0%) |
| 75 Years and over | 0 (0.0%) | 0 (0.0%) |
Disability Class: Vision Difficulty
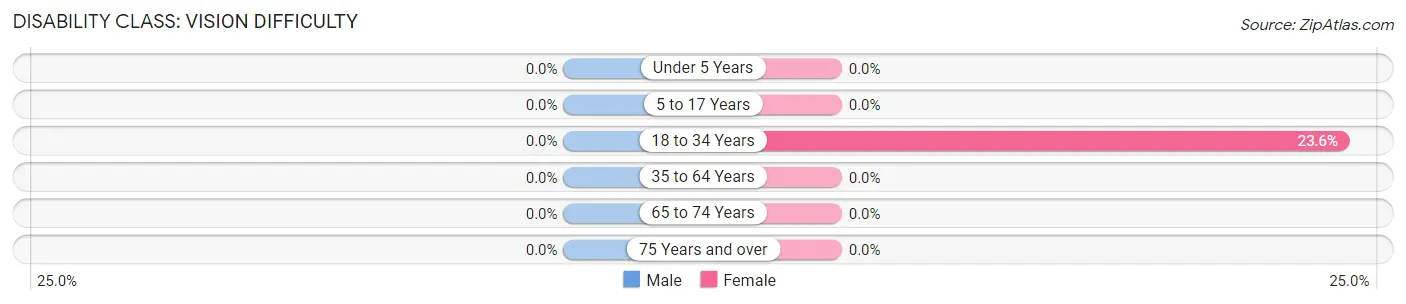
| Age Bracket | Male | Female |
| Under 5 Years | 0 (0.0%) | 0 (0.0%) |
| 5 to 17 Years | 0 (0.0%) | 0 (0.0%) |
| 18 to 34 Years | 0 (0.0%) | 62 (23.6%) |
| 35 to 64 Years | 0 (0.0%) | 0 (0.0%) |
| 65 to 74 Years | 0 (0.0%) | 0 (0.0%) |
| 75 Years and over | 0 (0.0%) | 0 (0.0%) |
Disability Class: Cognitive Difficulty
| Age Bracket | Male | Female |
| 5 to 17 Years | 0 (0.0%) | 0 (0.0%) |
| 18 to 34 Years | 0 (0.0%) | 0 (0.0%) |
| 35 to 64 Years | 0 (0.0%) | 0 (0.0%) |
| 65 to 74 Years | 0 (0.0%) | 0 (0.0%) |
| 75 Years and over | 0 (0.0%) | 0 (0.0%) |
Disability Class: Ambulatory Difficulty
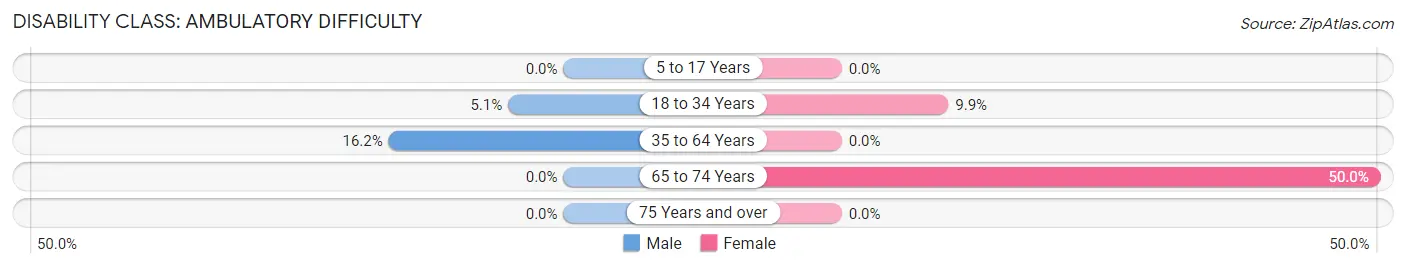
| Age Bracket | Male | Female |
| 5 to 17 Years | 0 (0.0%) | 0 (0.0%) |
| 18 to 34 Years | 8 (5.1%) | 26 (9.9%) |
| 35 to 64 Years | 30 (16.2%) | 0 (0.0%) |
| 65 to 74 Years | 0 (0.0%) | 28 (50.0%) |
| 75 Years and over | 0 (0.0%) | 0 (0.0%) |
Disability Class: Self-Care Difficulty
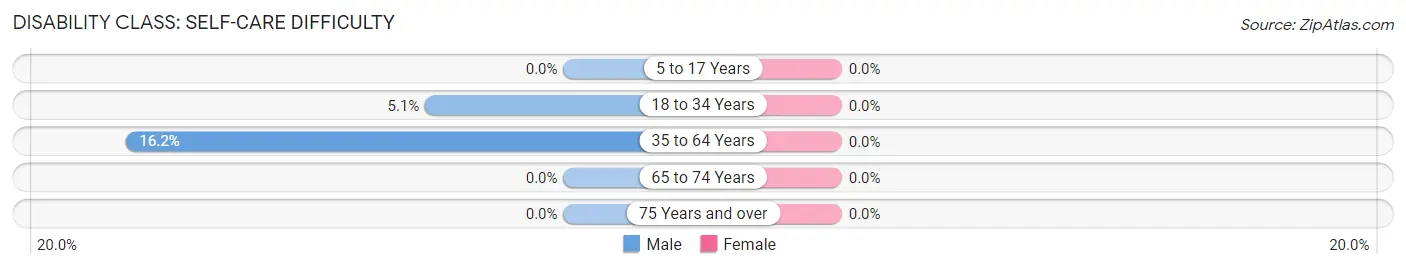
| Age Bracket | Male | Female |
| 5 to 17 Years | 0 (0.0%) | 0 (0.0%) |
| 18 to 34 Years | 8 (5.1%) | 0 (0.0%) |
| 35 to 64 Years | 30 (16.2%) | 0 (0.0%) |
| 65 to 74 Years | 0 (0.0%) | 0 (0.0%) |
| 75 Years and over | 0 (0.0%) | 0 (0.0%) |
Technology Access in Kyle
Computing Device Access in Kyle
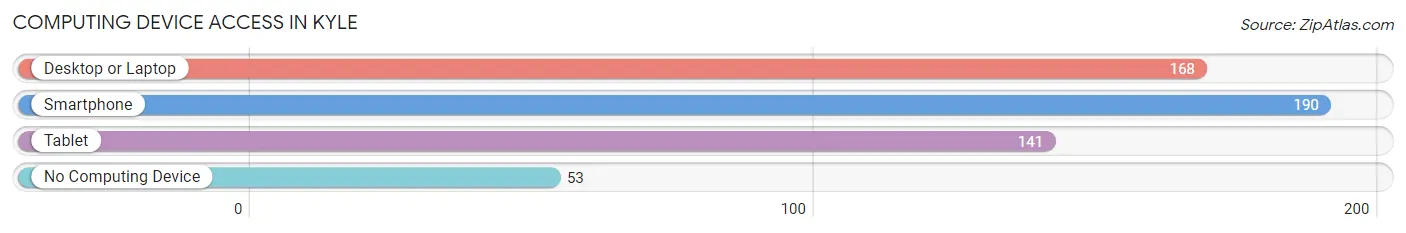
| Device Type | # Households | % Households |
| Desktop or Laptop | 168 | 53.5% |
| Smartphone | 190 | 60.5% |
| Tablet | 141 | 44.9% |
| No Computing Device | 53 | 16.9% |
| Total | 314 | 100.0% |
Internet Access in Kyle
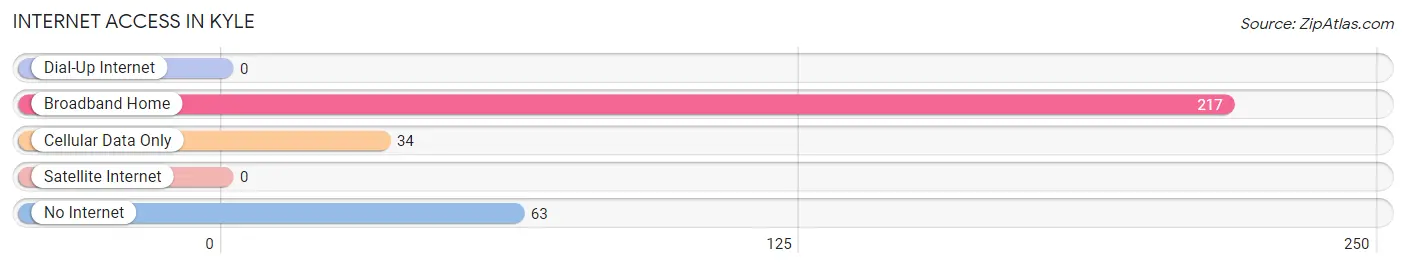
| Internet Type | # Households | % Households |
| Dial-Up Internet | 0 | 0.0% |
| Broadband Home | 217 | 69.1% |
| Cellular Data Only | 34 | 10.8% |
| Satellite Internet | 0 | 0.0% |
| No Internet | 63 | 20.1% |
| Total | 314 | 100.0% |
Kyle Summary
SD History
South Dakota is a state located in the Midwestern region of the United States. It is bordered by North Dakota to the north, Minnesota to the east, Iowa to the southeast, Nebraska to the south, Wyoming to the west, and Montana to the northwest. South Dakota was admitted to the Union on November 2, 1889, becoming the 40th state.
The history of South Dakota is closely tied to the history of the Great Plains region of the United States. The area was first inhabited by Native American tribes, including the Sioux, Cheyenne, and Arapaho. The first Europeans to explore the area were French fur traders, who arrived in the late 17th century. The area was part of the Louisiana Purchase in 1803, and was later organized as part of the Dakota Territory in 1861.
The Dakota Territory was divided into North and South Dakota in 1889, and South Dakota was admitted to the Union as a state. During the late 19th and early 20th centuries, the state experienced a period of rapid growth and development, as settlers moved into the area to take advantage of the fertile soil and abundant natural resources.
Geography
South Dakota is located in the Midwestern region of the United States. It is bordered by North Dakota to the north, Minnesota to the east, Iowa to the southeast, Nebraska to the south, Wyoming to the west, and Montana to the northwest.
The state is divided into two distinct geographic regions: the Great Plains and the Black Hills. The Great Plains region is located in the eastern part of the state and is characterized by rolling hills and prairies. The Black Hills region is located in the western part of the state and is home to the Black Hills National Forest, which is home to Mount Rushmore and other popular tourist attractions.
The Missouri River forms the eastern border of the state, and the Big Sioux River forms the western border. The state is home to several large lakes, including Lake Oahe, Lake Sharpe, and Lake Francis Case.
Economy
The economy of South Dakota is largely based on agriculture, tourism, and manufacturing. The state is a major producer of corn, soybeans, wheat, and other grains. It is also a major producer of beef, pork, and dairy products.
Tourism is a major industry in South Dakota, with the state’s many attractions drawing millions of visitors each year. The state is home to several national parks, including Badlands National Park, Wind Cave National Park, and Jewel Cave National Monument. The state is also home to Mount Rushmore, Crazy Horse Memorial, and the Black Hills National Forest.
Manufacturing is also an important part of the state’s economy. The state is home to several large companies, including John Deere, 3M, and Cargill.
Demographics
As of the 2010 census, South Dakota had a population of 814,180. The state is predominantly white, with 84.3% of the population identifying as white. The state also has a significant Native American population, with 8.9% of the population identifying as Native American.
The state’s largest city is Sioux Falls, with a population of 153,888. Other major cities include Rapid City, with a population of 67,956, and Aberdeen, with a population of 26,091.
The median household income in South Dakota is $51,939, and the median home value is $164,400. The state’s unemployment rate is 3.2%.
Common Questions
What is Per Capita Income in Kyle?
Per Capita income in Kyle is $10,538.
What is Inequality or Gini Index in Kyle?
Inequality or Gini Index in Kyle is 0.44.
What is the Total Population of Kyle?
Total Population of Kyle is 1,504.
What is the Total Male Population of Kyle?
Total Male Population of Kyle is 705.
What is the Total Female Population of Kyle?
Total Female Population of Kyle is 799.
What is the Ratio of Males per 100 Females in Kyle?
There are 88.24 Males per 100 Females in Kyle.
What is the Ratio of Females per 100 Males in Kyle?
There are 113.33 Females per 100 Males in Kyle.
What is the Median Population Age in Kyle?
Median Population Age in Kyle is 23.4 Years.
What is the Average Family Size in Kyle
Average Family Size in Kyle is 5.2 People.
What is the Average Household Size in Kyle
Average Household Size in Kyle is 4.7 People.
How Large is the Labor Force in Kyle?
There are 509 People in the Labor Forcein in Kyle.
What is the Percentage of People in the Labor Force in Kyle?
53.0% of People are in the Labor Force in Kyle.
What is the Unemployment Rate in Kyle?
Unemployment Rate in Kyle is 8.4%.